17
Review of the concept, test data and derivation procedures of vibration proposal 1

Review of the concept, test data and derivation procedures of vibration
proposal
1

Contents
① Information of tested vehicles
② Test layout, Sensor installation and measurement
③ Introduction to test roads and methods
④ Test data and derivation procedures
⑤ Vibration test conditions
2

3
Information of tested vehiclesM1 N1 group:2 mini cars,3 cargo vans,11 passenger cars, including EV, PHEV and HEV.Wheelbase from 1765mm to 3850mm
Type Wheelbase(mm) pack locationmini car EV 1765 bottommini car EV 2150 bottom
passenger car EV 2490 bottompassenger car EV 2500 bottompassenger car EV 2650 bottompassenger car EV 2650 bottompassenger car PHEV 2670 bottompassenger car EV 2670 bottompassenger car EV 2700 bottompassenger car HEV 2700 Trunk
cargo van EV 2700 bottompassenger car EV 2720 bottompassenger car HEV 2775 Trunkpassenger car PHEV 2850 Trunk
cargo van EV 3050 bottomcargo van EV 3850 bottom

4
Information of tested vehicles
Type Length(mm) Pack location
bus EV 12000 bottom & back
bus EV 12000 top
bus PHEV 10500 top
bus PHEV 8545 Engine compartment
bus EV 8010 bottom
bus EV 10480 bottom
bus FCEV 12000 bottom
Bus group:7 buses, including EV, PHEV and FCEV.

5
Test layout, Sensor installation and measurement
N.O. Position Vehicle Direction
Sensor direction Channels
2601 Right rearX X AI-0Y Z AI-1Z Y AI-2
2602 Left rearX X AI-3Y Z AI-4Z Y AI-5
2603 Right forward
X X AI-6Y Y AI-7Z Z AI-8
2604 Left forwardX X AI-9Y Y AI-10Z Z AI-11
3
2
1
4
Ø Sensor layout principle: focus on the installation of fixed parts fixed positionØ At least 4 sensors are fixed distributed at different installation points
3
2
1
4

6
Introduction to test roads and methods
n Test specificationØTongxian test ground car product stereotypes reliability driving test specification
(2000 edition) Ø It is based on the characteristics of China's road conditions, and widely
recognized and used in vehicle type test in ChinaØThe test route, speed, tire pressure, weight and other conditions were set
according to the test specification

7
Introduction to test roads and methodsn Rough roads and test procedure
Seq. Rough roads length(m) %
Vehicle speed(km/h)
Test times
1 Twisting road B 85 2.02% 10
3
2 Belgian road C 300 7.14% 40
3 Belgian road B 989 23.53% 50
4 Belgian road B 989 23.53% 50
5 Cobble-stone road B
335 7.97% 50
6 Gravel road 815 19.39% 40
7 Washboard Road C
300 7.14% 50
8 Belgian road C 300 7.14% 50
9 Long wave road 90 2.14% 50
H:130mm
1 Distortion road B
2 Belgian road C
4 Belgian road B5 Cobble-stone road B6 Gravel road
7 Washboard road C
8 Belgian road C
9 Long wave road
3 Belgian road BFor passenger car

Test data and derivation procedures
8
Vehicle speed
Effective pavement
● Analytical conditions・Frequency resolution 1Hz・Window function Hanning・Average processing Arithmetic mean・Frequency Range 5-200Hz
Only the data on the rough roads were extracted.
p Time domain data transform into frequency domain data

Test data and derivation procedures
9
Circle Sensor No. X energy (g)
S1
7# 0.1588# 0.3919# 0.259
10# 0.405
Circle Sensor No. Y energy (g)
S1
7# 0.270 8# 0.320 9# 0.232
10# 0.208
Circle Sensor No. Z energy (g)
S1
7# 0.3118# 0.2759# 0.406
10# 0.488
p Because each vehicle is equipped with multiple sensors, for each kind of road, we choose the data of the sensor with the maximum RMS as the data of the road.

Test data and derivation procedures
10
p Each vehicle has been tested three times in the whole test site, that is to say, each road has been tested three times. We take the average value of three times of tests for each road as the vibration data of the road.

11
Test data and derivation procedures
One loop (passenger car) Extended to required distance
① ② ③=①/②/1000
Seq. Rough roads length(m)
Vehicle speed(km/h)
Driving time(h)
1 Twisted road B 85 10 0.0085
2 Belgian road C 300 40 0.0075
3 Belgian road B 989 50 0.024725
4 Belgian road B 989 50 0.024725
5 Cobble-stone road B 335 50 0.0067
6 Gravel road 815 40 0.020375
7 Washboard Road C 300 50 0.006
8 Belgian road C 300 50 0.0075
9 Long wave road 90 50 0.0018
①*X ③*X
total distance total time
60690 6.069214200 5.355706146 17.65365706146 17.65365
239190 4.7838
581910 14.54775214200 4.284214200 5.35564260 1.2852
3000.942km 76.98705h
Passenger car X=714;Minicar X=476Cargo Van X=1274Bus X=882
Total rough road driving
p According to the test specifications, different vehicles need to be tested many times on the test road, we need to conduct 714 loops for passenger cars.

12
Test data and derivation procedures
Refer to ISO DIS 19453-3
p To accelerate the test time to 12h

13
Test data and derivation procedures
● The relationship between RMS and PSD is as follow:
Frequency(Hz)
PSD(g)2/Hz
5 0.60221
6 0.71665
7 0.82560
8 1.01077
・・・
・・・
198 0.0016
199 0.0017
200 0.0016
● miner’ law(①→②、③→④)
p To accelerate the test time to 12h
12
14
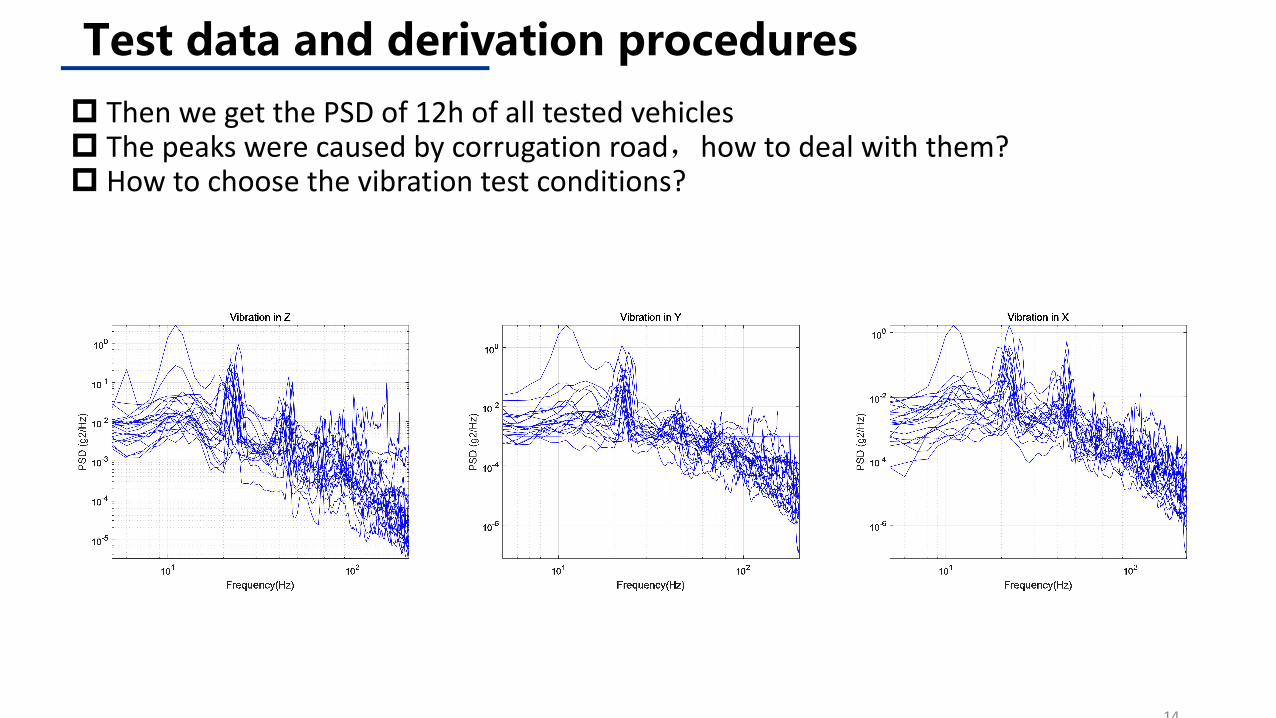
Test data and derivation proceduresp Then we get the PSD of 12h of all tested vehiclesp The peaks were caused by corrugation road,how to deal with them?p How to choose the vibration test conditions?

15
Test data and derivation proceduresp The peaks were caused by corrugation road

16
Vibration test conditions
Direction MAX AVG CN proposal Median ISO 6469-1 MIN
Z 1.3468 0.6364 0.6364 0.4821 0.2647 0.2060
Y 0.8922 0.4378 0.4378 0.3539 0.2520 0.1486
X 1.1094 0.4910 0.4910 0.3568 0.2343 0.1253
p The results and recommended vibration test conditions
CN CN CN

17


