158
REVIEW OF THE IRISH PENSION SYSTEM Preliminary version 22 April 2013

REVIEW OF THE IRISH PENSION SYSTEM
Preliminary version 22 April 2013

REVIEW OF THE IRISH PENSION SYSTEM
Preliminary version 22 April 2013

FOREWORD – 3
REVIEW OF THE IRISH PENSION SYSTEM © OECD 2013
Foreword
This special report provides an international perspective on Ireland’s retirement-income provision, the result of a request from Ms. Joan Burton, the Minister for Social Protection, for a focused review on the viability and long-term impact of proposed changes in pension policy, taking into account the impact of the economic downturn. It covers all components of the pension system: state, private personal and occupational plans and schemes for public-sector employees.
Four significant objectives are examined, as outlined in the terms of reference for the review set by the Minister. First, the sustainability of the pension system in the context of the challenges of demographic change and financial-market risk. Secondly, the adequacy of future retirement incomes and, in particular, the impact of private pensions. Thirdly, the modernity of pension provision to ensure that it reflects social and economic changes, especially the support it can provide for flexibility in the labour market and extending working lives. Finally, equity within the pension system between different groups: women and men, low and high earners and workers in different sectors of the economy.
The report was prepared by a team of pension analysts from the OECD's Employment, Labour and Social Affairs Directorate and the Directorate for Financial Affairs: Pablo Antolin, Maria Chiara Cavalleri, Anna Cristina D’Addio, Stéphanie Payet, Monika Queisser, Andrew Reilly, Marek Suchomel, Edward Whitehouse, and Juan Yermo, and overseen by the Director for Employment, Labour and Social Affairs of the OECD, John Martin. Elma Lopes and Laura Quintin provided helpful assistance.
The OECD is very grateful to the numerous public officials in Ireland for their invaluable help, not only the Department of Social Protection, but also the Department of the Taoiseach, Department of Finance, the Office of the Revenue Commissioners, the Department of Public Expenditure and Reform, the Department of Jobs, Enterprise and Innovation and the Pensions Board. The report also benefited from consultations with a wide range of stakeholders in July 2012: the Irish Congress of Trade Unions (ICTU) and the Services, Industrial, Professional and Technical Union (SIPTU); the Irish Business and Employers’ Confederation (IBEC); Age Action Ireland, the ICTU Retired-Workers Committee, the Irish Association of Older People, the Irish Senior-Citizens Parliament, the National Federation of Pensioners’ Associations and Older and Bolder; the Irish Association of Pension Fund, the Society of Actuaries in Ireland, the Professional Insurers Brokers Association, the Irish Brokers’ Association and the Irish Insurance Federation; Alan Barrett (ESRI) and Sanna Nivakoski (Trinity College of Dublin) for providing very useful TILDA data; Tim Callan from ESRI; as well as for valuable comments and feedback from Donal De Buitleir, Anne Maher and Don Thornhill from Public Policy.ie; Sue Jones and David Harris from TOR Financial Consulting Limited; and Nick Sherry from Sherry Associates International.
The assessment and evaluation of the Irish pension system was presented at Farmleigh in September 2012 to a larger group of key stakeholders. The OECD would also like to thank the many organisations that provided written input in addition to their presence at the targeted consultation meetings.

4 – FOREWORD
REVIEW OF THE IRISH PENSION SYSTEM © OECD 2013
This report represents the views of the authors. It is published on the responsibility of the Secretary-General of the OECD. It commits neither the OECD as a whole, nor any of its member governments, including that of Ireland.

TABLE OF CONTENTS – 5
REVIEW OF THE IRISH PENSION SYSTEM © OECD 2013
Table of Contents
Executive summary ........................................................................................................... 9
Chapter 1. Introduction and overview ........................................................................... 15
1.1. Introduction ................................................................................................................ 15 1.2. The OECD vision for pensions ................................................................................... 18 1.3. The European Commission’s White Paper on Pensions ............................................. 19 1.4. Ireland’s pension system in international comparison ................................................ 20
Chapter 2. The Irish pension system: overview and assessment ................................. 25
2.1. Structure of the public pension system ....................................................................... 25 2.2. Financing of public pensions ...................................................................................... 28 2.3. Private pension arrangements ..................................................................................... 29 2.4. Pensions for public sector workers ............................................................................. 40 2.5. How has the Irish pension system been performing? ................................................. 43
Chapter 3. Future challenges for the Irish pension system: adequacy, sustainability, modernity and equity.............................................................................. 59
3.1. Introduction ................................................................................................................ 59 3.2. Concept of pension adequacy ..................................................................................... 59 3.3. Assessment of the adequacy of pension benefits in Ireland ....................................... 60 3.4. Concept of financial sustainability of pensions .......................................................... 66 3.5.Assessment of financial sustainability of the Irish pension system ............................. 66 3.6. The concept of modernity ........................................................................................... 75 3.7. The assessment of modernity: delivering longer working lives ................................. 76 3.8. The concept of equity ................................................................................................. 85 3.9. Assessment of equity in the Irish public and occupational pension systems .............. 86
Chapter 4. The way forward: options for pension reform in Ireland An international perspective ........................................................................................... 93
4.1. Critical elements for pension reforms in Ireland ........................................................ 93 4.2. Options for parametric reforms of the Irish pension system ...................................... 94 4.3. Indexation and valorisation ...................................................................................... 106 4.4. Options for structural reform of the Irish pension system ........................................ 108 4.5. Public service pensions ............................................................................................. 113 4.6. Should there be separate pension schemes for public and private sector workers? .. 116 4.7. What remains to be done in Ireland? ........................................................................ 117
Main findings and policy recommendations ............................................................... 150
References ....................................................................................................................... 154
6 – TABLE OF CONTENTS
REVIEW OF THE IRISH PENSION SYSTEM © OECD 2013
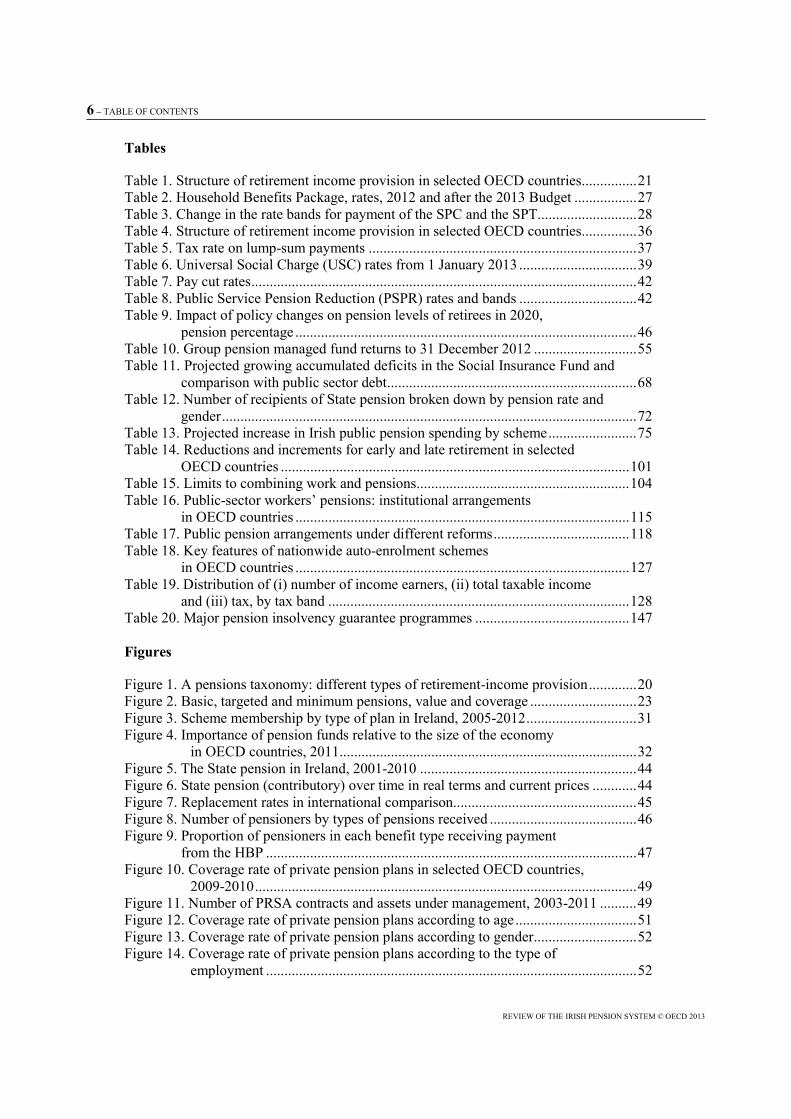
Tables
Table 1. Structure of retirement income provision in selected OECD countries ............... 21 Table 2. Household Benefits Package, rates, 2012 and after the 2013 Budget ................. 27 Table 3. Change in the rate bands for payment of the SPC and the SPT........................... 28 Table 4. Structure of retirement income provision in selected OECD countries ............... 36 Table 5. Tax rate on lump-sum payments ......................................................................... 37 Table 6. Universal Social Charge (USC) rates from 1 January 2013 ................................ 39 Table 7. Pay cut rates ......................................................................................................... 42 Table 8. Public Service Pension Reduction (PSPR) rates and bands ................................ 42 Table 9. Impact of policy changes on pension levels of retirees in 2020,
pension percentage ............................................................................................. 46 Table 10. Group pension managed fund returns to 31 December 2012 ............................ 55 Table 11. Projected growing accumulated deficits in the Social Insurance Fund and
comparison with public sector debt .................................................................... 68 Table 12. Number of recipients of State pension broken down by pension rate and
gender ................................................................................................................. 72 Table 13. Projected increase in Irish public pension spending by scheme ........................ 75 Table 14. Reductions and increments for early and late retirement in selected
OECD countries ............................................................................................... 101 Table 15. Limits to combining work and pensions .......................................................... 104 Table 16. Public-sector workers’ pensions: institutional arrangements
in OECD countries ........................................................................................... 115 Table 17. Public pension arrangements under different reforms ..................................... 118 Table 18. Key features of nationwide auto-enrolment schemes
in OECD countries ........................................................................................... 127 Table 19. Distribution of (i) number of income earners, (ii) total taxable income
and (iii) tax, by tax band .................................................................................. 128 Table 20. Major pension insolvency guarantee programmes .......................................... 147 Figures
Figure 1. A pensions taxonomy: different types of retirement-income provision ............. 20 Figure 2. Basic, targeted and minimum pensions, value and coverage ............................. 23 Figure 3. Scheme membership by type of plan in Ireland, 2005-2012 .............................. 31 Figure 4. Importance of pension funds relative to the size of the economy
in OECD countries, 2011 ................................................................................. 32 Figure 5. The State pension in Ireland, 2001-2010 ........................................................... 44 Figure 6. State pension (contributory) over time in real terms and current prices ............ 44 Figure 7. Replacement rates in international comparison.................................................. 45 Figure 8. Number of pensioners by types of pensions received ........................................ 46 Figure 9. Proportion of pensioners in each benefit type receiving payment
from the HBP ..................................................................................................... 47 Figure 10. Coverage rate of private pension plans in selected OECD countries,
2009-2010 ........................................................................................................ 49 Figure 11. Number of PRSA contracts and assets under management, 2003-2011 .......... 49 Figure 12. Coverage rate of private pension plans according to age ................................. 51 Figure 13. Coverage rate of private pension plans according to gender ............................ 52 Figure 14. Coverage rate of private pension plans according to the type of
employment ..................................................................................................... 52

TABLE OF CONTENTS – 7
REVIEW OF THE IRISH PENSION SYSTEM © OECD 2013
Figure 15. Total value of Irish occupational pension schemes, 2002-2011 ....................... 55 Figure 16. Pension fund asset allocation for selected investment categories
in selected OECD countries, 2011 ................................................................... 56 Figure 17. Asset allocation of Irish occupational pension schemes, 2002-2011 ............... 57 Figure 18. Trends in old-age poverty in Ireland ................................................................ 61 Figure 19. Old-age income poverty rates, late 2000s ........................................................ 62 Figure 20. The retirement-savings gap .............................................................................. 64 Figure 21. Gross replacement rates from combined PAYG, mandatory
and voluntary funded systems ......................................................................... 65 Figure 22. Projections of expenditures and revenues of the Social Insurance Fund
for 2010/11, made in 2002, 2007 and 2012 ..................................................... 67 Figure 23. Long-term projections of expenditures and revenues of the Social
Insurance Fund for 2010 to 2060 ..................................................................... 68 Figure 24. Equilibrium contribution rates to balance the Fund, 10-year
and 20-year periods ......................................................................................... 69 Figure 25. Value and composition of NPRF, 2001-2011 .................................................. 71 Figure 26. Current and projected number of recipients of State pension, different
rates .................................................................................................................. 72 Figure 27. Public pension spending in 2010 and projected level in 2060
for 28 countries (% of GDP) ............................................................................ 74 Figure 28. Employment rates by age cohorts, 2011 .......................................................... 77 Figure 29. Labour force participation rates by gender among people aged 50
to 64 years, 2011 .............................................................................................. 78 Figure 30. Employment rates by age, 2011 ....................................................................... 78 Figure 31. Trends in pensionable age, 1949-2050 ............................................................. 80 Figure 32. Average age of labour market exit, men and women ....................................... 81 Figure 33. Trends in average effective age of labour market exit,
OECD average ................................................................................................. 82 Figure 34. Pathways out of labour market, age 55-64, 2010 ............................................. 83 Figure 35. Pension amounts by components, public and private sector retirees,
and deciles ....................................................................................................... 87 Figure 36. Pension amounts by components, public and private sector retirees ............... 88 Figure 37. Are pension age increases sufficient to compensate
for projected increases in life expectancy? ...................................................... 96 Figure 38. Italy: Coverage rate of private pension funds before and after auto-
enrolment? ..................................................................................................... 125 Figure 39. New Zealand: Coverage rate of KiwiSaver pension plans,
2007-2011 ...................................................................................................... 126 Figure 40. Alternative forms of incentives from tax deductions, tax credits
and matching contributions by income .......................................................... 131 Figure 41. Incentives by income of adding matching contributions
to tax deductions ............................................................................................ 132 Figure 42. Germany: Coverage rate of Riester pension plans, 2001-2011 ...................... 134 Figure 43. Germany: Coverage rate of private pension plans according
to the income of the household and the type of plan, December 2008 .......... 134 Figure 44. Germany: Contribution rates in Riester pensions according
to the income of the household, December 2008 .......................................... 135 Figure 45. Australia (voluntary component): Coverage and contribution rates
according to income ....................................................................................... 136 Figure 46. Revaluation rate applied between 2000 and 2012 ......................................... 148

8 – TABLE OF CONTENTS
REVIEW OF THE IRISH PENSION SYSTEM © OECD 2013
Boxes
Box 1.Terms of reference for the OECD review of Ireland's retirement-income provision ............................................................................................................... 16
Box 2. Developments in pension policy in Ireland from 2007 onward ............................. 17 Box 3. Calculation of the pension for public servants ....................................................... 41 Box 4. Examples of entitlements to the State pension (contributory) ............................... 90 Box 5. The concept of actuarial-neutrality ........................................................................ 99 Box 6. Financing the cost of moving from a DB to a DC scheme .................................. 120

EXECUTIVE SUMMARY – 9
REVIEW OF THE IRISH PENSION SYSTEM © OECD 2013
Executive summary
This review was commissioned to the OECD by Ms. Joan Burton, the Minister for Social Protection, in March 2012. The terms of reference for the review called for a comprehensive analysis, covering all parts of Ireland’s retirement-income provision (the state scheme and other public benefits, personal and occupational plans and schemes for public-sector workers). The review aims to take account of the considerable body of work undertaken in Ireland on the analysis of the pension system and the different proposals for reform put forward in recent years. Furthermore, the OECD received comments (both in meetings and in written form) from a number of interested organisations in Ireland during the consultation process in the period April 2012 to January 2013.
The OECD has been mandated by its member governments to undertake regular monitoring of pension policies and analyse in detail the options and arguments for the direction of retirement-income reform. This reflects a consensus that there are valuable lessons – both positive and negative – to be learned from other countries’ experiences. This review compares the set-up and performance of retirement income arrangements in Ireland to those in OECD countries with comparable systems, and draws on international experiences and examples in making recommendations for reform.
The review makes recommendations for changes in the key parameters of the Irish state, occupational and private pension schemes and outlines options for more profound structural reforms of the retirement income system. In considering these alternatives, it should be kept in mind that each of the national schemes and reforms discussed in this review was adopted in a specific national economic, social and political setting. There is no blueprint for reform which Ireland could take off-the-shelf and implement directly. Any solution has to fit the Irish situation. In addition, any structural reform would have to be carefully costed for both the short and the longer term. Detailed cost projections of reform proposals were outside the scope of this review and would require extensive analysis of administrative data which would have to be undertaken jointly with the Irish authorities.
In the following, the main findings of the review, as well as the main recommendations for reform of pensions in Ireland, are summarised.
10 – EXECUTIVE SUMMARY
REVIEW OF THE IRISH PENSION SYSTEM © OECD 2013
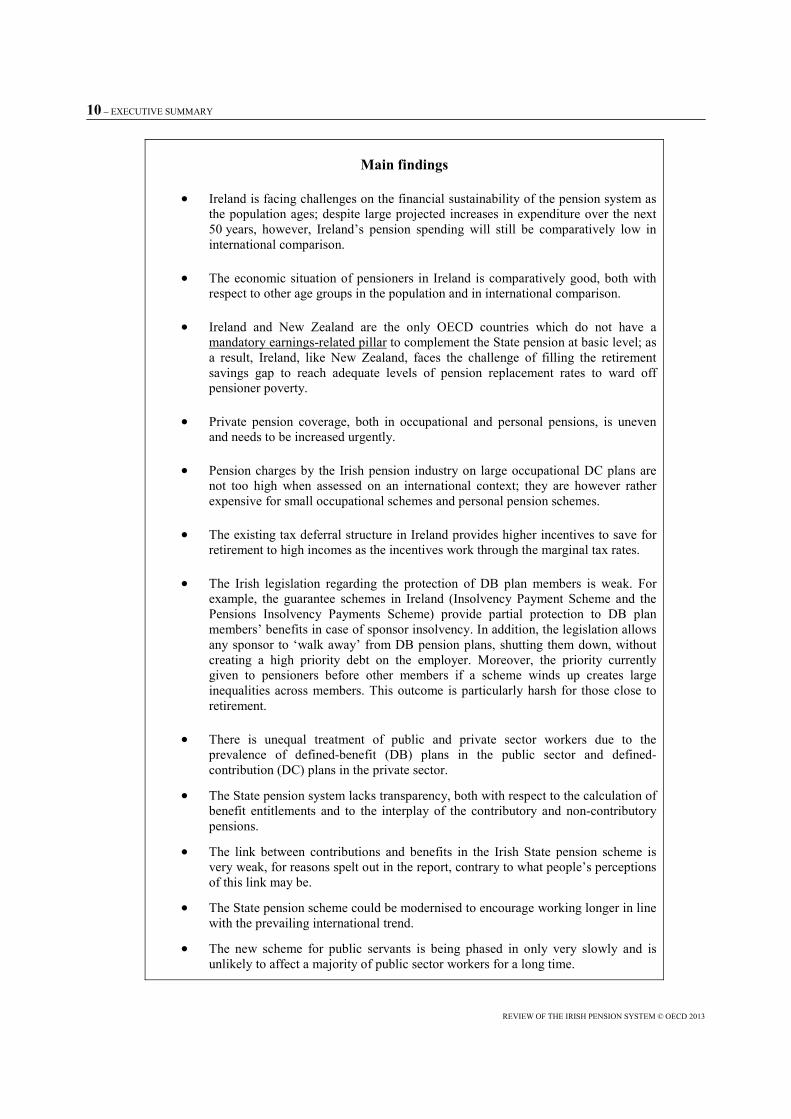
Main findings
• Ireland is facing challenges on the financial sustainability of the pension system as the population ages; despite large projected increases in expenditure over the next 50 years, however, Ireland’s pension spending will still be comparatively low in international comparison.
• The economic situation of pensioners in Ireland is comparatively good, both with respect to other age groups in the population and in international comparison.
• Ireland and New Zealand are the only OECD countries which do not have a mandatory earnings-related pillar to complement the State pension at basic level; as a result, Ireland, like New Zealand, faces the challenge of filling the retirement savings gap to reach adequate levels of pension replacement rates to ward off pensioner poverty.
• Private pension coverage, both in occupational and personal pensions, is uneven and needs to be increased urgently.
• Pension charges by the Irish pension industry on large occupational DC plans are not too high when assessed on an international context; they are however rather expensive for small occupational schemes and personal pension schemes.
• The existing tax deferral structure in Ireland provides higher incentives to save for retirement to high incomes as the incentives work through the marginal tax rates.
• The Irish legislation regarding the protection of DB plan members is weak. For example, the guarantee schemes in Ireland (Insolvency Payment Scheme and the Pensions Insolvency Payments Scheme) provide partial protection to DB plan members’ benefits in case of sponsor insolvency. In addition, the legislation allows any sponsor to ‘walk away’ from DB pension plans, shutting them down, without creating a high priority debt on the employer. Moreover, the priority currently given to pensioners before other members if a scheme winds up creates large inequalities across members. This outcome is particularly harsh for those close to retirement.
• There is unequal treatment of public and private sector workers due to the prevalence of defined-benefit (DB) plans in the public sector and defined-contribution (DC) plans in the private sector.
• The State pension system lacks transparency, both with respect to the calculation of benefit entitlements and to the interplay of the contributory and non-contributory pensions.
• The link between contributions and benefits in the Irish State pension scheme is very weak, for reasons spelt out in the report, contrary to what people’s perceptions of this link may be.
• The State pension scheme could be modernised to encourage working longer in line with the prevailing international trend.
• The new scheme for public servants is being phased in only very slowly and is unlikely to affect a majority of public sector workers for a long time.
EXECUTIVE SUMMARY – 11
REVIEW OF THE IRISH PENSION SYSTEM © OECD 2013
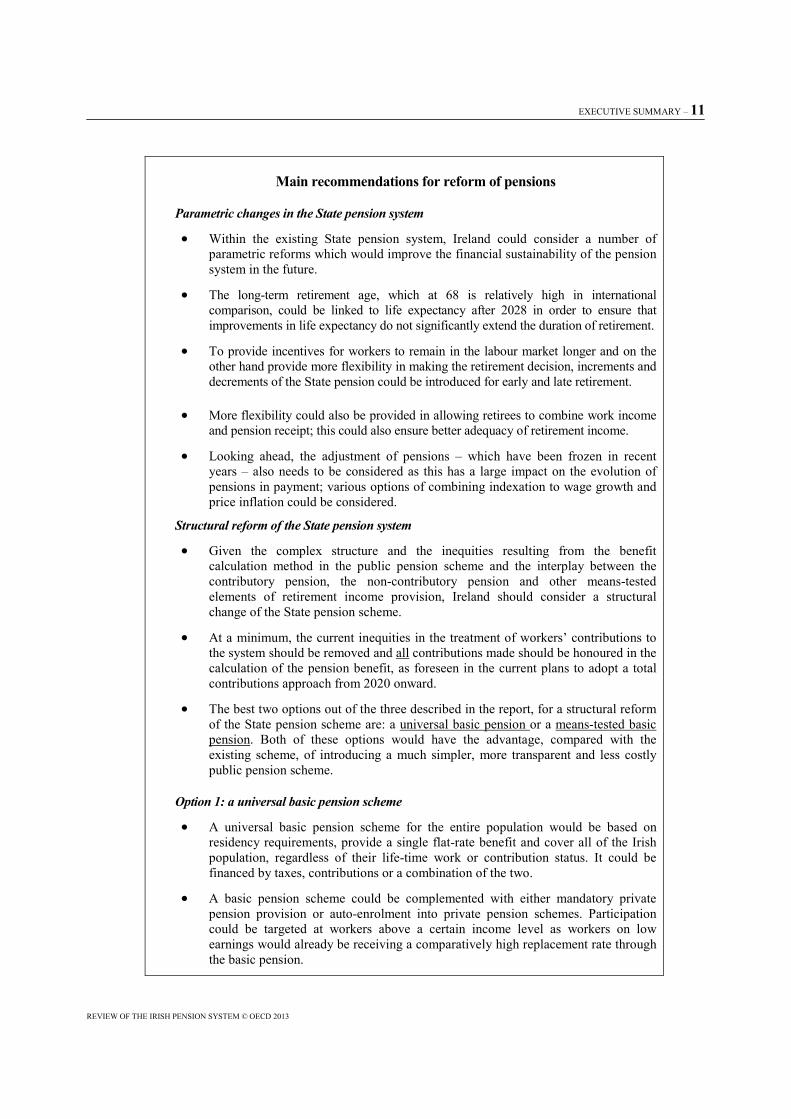
Main recommendations for reform of pensions
Parametric changes in the State pension system
• Within the existing State pension system, Ireland could consider a number of parametric reforms which would improve the financial sustainability of the pension system in the future.
• The long-term retirement age, which at 68 is relatively high in international comparison, could be linked to life expectancy after 2028 in order to ensure that improvements in life expectancy do not significantly extend the duration of retirement.
• To provide incentives for workers to remain in the labour market longer and on the other hand provide more flexibility in making the retirement decision, increments and decrements of the State pension could be introduced for early and late retirement.
• More flexibility could also be provided in allowing retirees to combine work income and pension receipt; this could also ensure better adequacy of retirement income.
• Looking ahead, the adjustment of pensions – which have been frozen in recent years – also needs to be considered as this has a large impact on the evolution of pensions in payment; various options of combining indexation to wage growth and price inflation could be considered.
Structural reform of the State pension system
• Given the complex structure and the inequities resulting from the benefit calculation method in the public pension scheme and the interplay between the contributory pension, the non-contributory pension and other means-tested elements of retirement income provision, Ireland should consider a structural change of the State pension scheme.
• At a minimum, the current inequities in the treatment of workers’ contributions to the system should be removed and all contributions made should be honoured in the calculation of the pension benefit, as foreseen in the current plans to adopt a total contributions approach from 2020 onward.
• The best two options out of the three described in the report, for a structural reform of the State pension scheme are: a universal basic pension or a means-tested basic pension. Both of these options would have the advantage, compared with the existing scheme, of introducing a much simpler, more transparent and less costly public pension scheme.
Option 1: a universal basic pension scheme
• A universal basic pension scheme for the entire population would be based on residency requirements, provide a single flat-rate benefit and cover all of the Irish population, regardless of their life-time work or contribution status. It could be financed by taxes, contributions or a combination of the two.
• A basic pension scheme could be complemented with either mandatory private pension provision or auto-enrolment into private pension schemes. Participation could be targeted at workers above a certain income level as workers on low earnings would already be receiving a comparatively high replacement rate through the basic pension.

12 – EXECUTIVE SUMMARY
REVIEW OF THE IRISH PENSION SYSTEM © OECD 2013
• The household benefits package and free travel scheme could either be transformed into a cash supplement and merged with the basic pension or it could be awarded to pensioners who need the extra benefit as a means-tested cash supplement.
• Setting the level of such a basic pension for all citizens in order to meet the twin goals of social adequacy and financial sustainability would require more detailed analysis, including the costing of alternative revenue scenarios.
Option 2: a single means-tested pension
• An alternative would be a single means-tested pension financed out of general revenue. The household benefits package, the free travel scheme, and other means-tested “advantages” would be included in the pension amount.
• The main design issues to be addressed under such a scheme would again be the appropriate level of the means-tested benefit, at what schedule the benefit should be withdrawn for higher earnings, what type of administrative arrangements would be needed and how much this scheme would cost under alternative scenarios.
• Combining the public and the private pension pillars, a means-tested scheme would function best in combination with mandatory participation in private pension plans. In a voluntary scheme, even with an auto-enrolment mechanism, there would be disincentives to contribute to a private pension, unless a certain amount of pension savings were exempted from the means-test for lower-earning groups.
Reform of the public service pension scheme
• At a minimum, a faster phase-in of the new rules of the occupational scheme for public servants should be considered; this would entail including existing public servants in the new scheme based either on a certain cut-off age or on length of service.
• Any new private pension scheme for private sector workers should also be extended to public servants, at a minimum for new entrants but ideally also for some of the existing public servants.
Policy options to expand private pensions coverage and retirement savings
• To increase adequacy of pensions in Ireland, there is a need to increase coverage in funded pensions. Increasing coverage can be achieved through 1) compulsion, 2) soft-compulsion, automatic enrolment, and/or 3) improving the existing financial incentives.
• Compulsion, according to international experience, is the less costly and most effective approach to increase coverage of private pensions (OECD Pensions Outlook, 2012, Chapter 4).
• Automatic enrolment is a second-best. Its success in increasing coverage depends on how it is designed and on its interaction with incentives in the system.
• The cost of establishing and managing auto-enrolment may be higher. Auto-enrolment requires monitoring, accurate record-keeping, fiscal incentives and careful design. Implementing a centralised institution to manage the system and provide default investment options would add to the costs.
• There is a misalignment to correct between the existing tax deferral structure in Ireland that provides higher incentives to high-income earners and the policy goal of increasing coverage, especially for middle to low-income people.

EXECUTIVE SUMMARY – 13
REVIEW OF THE IRISH PENSION SYSTEM © OECD 2013
• International evidence (Germany, Australia, and New Zealand) suggests that flat subsidies and matching contributions increase incentives to save for retirement for middle to low incomes.
• Existing private schemes need to be subjected to the same rules as the new schemes under auto-enrolment or compulsion.
Improve the design of DC arrangements
• The design and institutional set-up of DC pension plans need to improve in line with the OECD Roadmap for the Good Design of DC Pension Plans.
• Establish appropriate default investment strategies, while also providing choice between investment options.
• Establish default life-cycle investment strategies as a default option to protect those close to retirement against extreme negative outcomes.
• Encourage annuitisation as a protection against longevity risk. For example, a combination of programmed withdrawals with a deferred life annuity (e.g. starting payments at age 85) could be an appropriate default.
• While still keeping the principle of pension savings being “locked away”, the Irish Government could consider allowing withdrawals strictly only in the event of significant financial hardship.
• Specialised private institutions (e.g. pension funds, asset managers) should manage the assets. The establishment of an autonomous public option could be envisaged to provide competition, lower costs, and a default pension fund for those unable or unwilling to make investment or fund choices.
Enhancing benefit security in DB schemes
• Strengthen the Irish legislation regarding the protection of DB plan members when plans wind up. For example, healthy plan sponsors should not be allowed to “walk away” from DB plans unless assets cover 90% of pension liabilities. This funding requirement would introduce some type of guarantees for members and it would allow at the same time some degree of risk sharing. The funding ratio should be calculated following prudent standard actuarial valuations. Moreover, the priority currently given to pensioners before other members if a scheme closes because of sponsor bankruptcy should be eliminated.
• Further legal reforms may be needed to introduce more flexible DB plans that for instance allow for accrued benefits to be cut in case of underfunding (e.g. the Netherlands) and, more generally, for risks to be shared between plan members and pensioners, as well as plan sponsors.
• Establish a clear framework to facilitate domestic investment in infrastructure projects, but a general subsidy to all infrastructure projects should be avoided as it would distort capital allocation. It is clearly desirable that pension funds should help support economic growth in Ireland, but the objective should not be used as an excuse to impose low returns on pension fund members.
• Revise the new funding standards as they may create new risks for pensioners by offering strong incentive for pension funds to invest in government bonds, in particular sovereign annuities.


CHAPTER 1. INTRODUCTION AND OVERVIEW – 15
REVIEW OF THE IRISH PENSION SYSTEM © OECD 2013
Chapter 1
Introduction and overview
1.1. Introduction
This review was commissioned by Ms. Joan Burton TD, the Minister for Social Protection, in March 2012. The objective was for a comprehensive analysis, covering all parts of Ireland’s retirement-income provision (the state scheme and other public benefits, personal and occupational plans and schemes for public-sector workers). The detailed terms of reference for the review are reproduced in Box 1.
There has been a lively debate on pension policy in Ireland in recent years (see Box 2). This OECD review forms therefore part of a broader analysis of pension policy in Ireland. First, the Department of Social Protection has also commissioned a review of the regulatory infrastructure: the Pensions Ombudsman and the Pensions Board. Secondly, a detailed study of administrative charges for pensions was published in October 2012.1 This report, commissioned by the Department of Social Protection, provides evidence on charges for different types of instrument within the Irish pension landscape and carefully sets out how the charges’ impact varies both across scheme types and between different contribution periods. Thirdly, Mercer undertook a review of the wind-up priority provision in Section 48 of the 1990 Pensions Act for the Department of Social Protection. This work has explored alternatives to the current priority of existing pensioners.2 Fourthly, the discussion of pensions taxation has been lively, both within and outside Government. There were two substantial publications in 2012. The first, Milliman (2012), was commissioned by the Taxation Policy (Pensions) Group, which comprises representatives of the pensions and financial-services industries along with the relevant professions. Deloitte (2012) produced the second report for the Society of Actuaries in Ireland and the Irish Fiscal Policy Research Centre. Both publications look at possible changes to the pensions' taxation regime, including both the distributional and fiscal impacts.
1. See Department of Social and Family Affairs (2012b). 2. See Mercer (2012).

16 – CHAPTER 1. INTRODUCTION AND OVERVIEW
REVIEW OF THE IRISH PENSION SYSTEM © OECD 2013
Box 1. Terms of reference for the OECD review of Ireland's retirement-income provision
The Minister for Social Protection requests the OECD to conduct a short and focused review on the viability and long-term impact of the proposed changes in pensions policy in Ireland, taking into account the impact of the economic downturn. The Review should encompass the totality of pension provision in Ireland – state, private, occupational and public sector.
The review will take account of Programme for Government commitments in the pensions area and will be informed by developments at EU level in relation to both pensions (such as the recently published European Commission White Paper, “An Agenda for Adequate, Safe and Sustainable Pensions”, and the initiatives set out therein) as well as in relation to increasing the labour market participation of older workers (for example in the context of the Europe 2020 strategy).
Particular aspects for examination include the long-term impact of the planned changes in pensions on achieving the required objectives in the areas of:
• the sustainability of the pension system in the light of demographic and investment challenges;
• the adequacy and coverage levels, in order to ensure adequate income in retirement with a particular focus on lower- and middle-income groups;
• the modernity of pension systems to ensure flexibility in the labour market and supporting mechanisms for longer working;
• equity within the pension system;
• the role and contributions being made by employers, employees, the self-employed and the state;
• the structure, role and interaction of occupational and private pension provision, including the introduction of an auto-enrolment system;
• the taxpayer subsidies for pension savings including the distribution among workers of different income levels, different ages and different sectors;
• an assessment of opportunities to encourage and facilitate Irish pension schemes to increase the extent to which they invest their funds in Ireland;
• any means by which public understanding and confidence in the pension system could be maximised.
The review should also take account of the views of relevant stakeholders by way of a targeted consultation process.
Finally, there has been a debate about allowing early (before retirement) access to some of the funds that individuals have accumulated in their pension pots. In late 2011 an ad-hoc group was asked to consider early access by the Economic Management Council. They concluded that the principle of pensions being locked away should be maintained. The Keane Group on Mortgage arrears also examined the issue of early access to pensions and did not disagree with their conclusion.3 The Irish Business and Employers’ Confederation (IBEC, 2012) proposed early release of “non-core” pensions (from additional voluntary contributions, AVCs, or in personal plans) as an economic-stimulus measure. In the Finance Bill 2013 access was permitted to 30% AVC’s at the marginal rate of tax.
3. See Keane Report of 2011 (Minister of Finance, 2011).

CHAPTER 1. INTRODUCTION AND OVERVIEW – 17
REVIEW OF THE IRISH PENSION SYSTEM © OECD 2013
This review has taken account of this considerable body of work. Furthermore, comments have been received (both in meetings and in written form) from a number of interested organisations during the consultation process in the period April 2012 to January 2013.
Box 2. Developments in pension policy in Ireland from 2007 onward
The Government published a detailed, 250-page Green Paper in 2007.4 An extensive consultation process followed, the results of which were published in 2008.5 On the basis of the Green Paper and responses to it, a National Pension Framework was set out in 2010 and this, too, was followed up with both a consultation process on implementation and a stock-taking on progress.6
The Framework covers four main areas:
• State pensions: maintain the value of the State pension at 35% of economy-wide average earnings, increase the pension age in stages to 68, simplify the qualifying conditions and allow people to defer their pension claim to make up gaps in individual contribution histories.
• Private pensions: automatic enrolment (with an opt out) of individuals into pension funds; shift from tax reliefs to a state contribution equivalent to 33% relief for all; extending access to approved retirement funds to all private-pension plans; a new defined-benefit model for occupational schemes and keeping the funding standard under review.
• Public-sector schemes: a single new pension scheme for all new entrants.
• A tracing service to help former employees and private-pension fund trustees ensure that pension rights are paid out.
The Programme for Government agreed by the coalition parties7 in 2011 contained two commitments related to pensions:
• “cap taxpayers’ subsidies for all future pension schemes for…everybody that deliver income in retirement of more than EUR 60,000”; and
• “reform the pension system to progressively achieve universal coverage, with particular focus on lower-paid workers, to achieve better risk sharing, and to provide for greater flexibility for those who wish to retire on a phased basis”.
Many elements of the National Pension Framework have already been put in place. The phased increase in the pensionable age will begin in 2014 with the abolition of the State pension (transition), effectively increasing the State pension age to 66. Public-sector pensions have been changed for new entrants. Furthermore, a pension-related deduction from public-sector salaries and a reduction for public-sector pensioners were introduced. And there have been many changes to the tax treatment of private pensions, including the limit of EUR 60,000 (beginning 2014) for tax relief on pension contributions. Other taxation measures adopted so far include:
4. Department of Social and Family Affairs (2007).
5. Department of Social and Family Affairs (2008).
6. Department of Social and Family Affairs (2010a,b,c).
7. Fine Gael and Labour, Programme for Government for National Recovery 2011-2016.

18 – CHAPTER 1. INTRODUCTION AND OVERVIEW
REVIEW OF THE IRISH PENSION SYSTEM © OECD 2013
• a reduction in the standard fund threshold (the lifetime cap on pensions);
• a ceiling on lump sums from private pensions;
• taxation of imputed income from approved retirement funds;
• the pension levy on the value of pension funds.
As outlined in the terms of reference, this OECD review of Ireland’s retirement-income provision takes account of these commitments, and both policy actions and detailed analysis that have already been undertaken.
1.2. The OECD vision for pensions
The OECD has been mandated by its member governments with regular monitoring of pension policies and analysing in detail the options and arguments for the direction of retirement-income reform. This reflects a consensus that there are valuable lessons – both positive and negative – to be learned from other countries’ experiences. The results of this analysis have, in recent years, been published in the biennial OECD publications Pensions at a Glance and Pensions Outlook.8
The 2011 edition of Pensions at a Glance set out a strategy for pension policy in its editorial, “Three solutions to the pensions paradox”. This argued that pension policy has always involved balancing the adequacy of benefits with their affordability. But this balancing act has got harder as a result of the recent economic and financial crisis that affected all OECD countries, although to varying degrees. The crisis has added to the existing – much greater challenge – to pension systems arising from population ageing.
There is an obvious trade-off between adequacy and sustainability: higher public pensions deliver larger incomes in old age but cost more. However, if public pensions are at risk of being inadequate, there will be pressure for ad-hoc increases in retirement benefits to prevent old-age poverty. Similarly, pension benefits can be too high, rendering the system financially unsustainable. If governments delay reforms, then the scale of adjustment to benefits needed in the medium or long term will be more sudden and likely more painful. Greece, Italy and Spain, for example, have all had to undertake difficult reforms in recent years. Such sudden changes make it very difficult for individuals to change their work, retirement and savings decisions to reflect the new financial realities.
The key question, then, is: “How can governments maintain retirement-income adequacy without endangering financial sustainability?” Pensions at a Glance proposed a three-pronged strategy to improve the terms of the trade-off between these two objectives as a route out of this dilemma.
The first is longer working lives. Only four OECD countries are not changing pension ages, planning to do so or already have a pensionable age of 67, according to the OECD Pensions Outlook (OECD, 2012). However, these hard-fought increases look less impressive in an historical perspective. Only in 2030 for men and 2020 for women will the average pension age in OECD countries be at the same level as many years ago, back in 1949. Moreover, in all but six OECD countries for men and ten for women, projected gains in life expectancy over the next four decades will outstrip prospective increases in
8. OECD (2005, 2007, 2009, 2011) and OECD (2012), respectively.

CHAPTER 1. INTRODUCTION AND OVERVIEW – 19
REVIEW OF THE IRISH PENSION SYSTEM © OECD 2013
pension ages. Thus, financial sustainability is not guaranteed unless pension ages are increased beyond current plans in most OECD countries, including Ireland.
Countries have also dismantled many of the incentives to retire early provided by their pension systems. But we still need to recognise that older workers face a range of barriers in finding and retaining jobs. Pension reforms need to be bolstered by action from government and employers on age discrimination, training opportunities for older workers and working conditions. The on-going jobs crisis should not be used as an excuse to revert to failed past policies of pushing older workers off the unemployment rolls and into de-facto early retirement, especially through long-term sickness or disability benefits. Keeping older workers in the labour force does not reduce job opportunities for the young.
The second way of achieving both adequacy and sustainability is through targeting the efforts of public retirement-income provision on the most vulnerable. Some countries, such as Canada and the Netherlands, combine among the lowest rates of income poverty in OECD countries with among the lowest public pension expenditure. Their spending is well below the OECD average and, indeed, that in Ireland. The key to explaining this is greater redistribution within public provision of retirement incomes.
The third solution is to encourage people to save for their own retirement to make up for reductions in public benefits that are already in the pipeline or are likely to be required through increased coverage of, and contributions to, private pensions. This review discusses in detail some successful policies in this area, including the automatic-enrolment scheme, KiwiSaver, in New Zealand and matching state contributions to private pensions in Germany, known as Riester plans.
1.3. The European Commission’s White Paper on Pensions
The terms of reference asked the OECD to take into account the conclusions of the European Commission’s White Paper on Pensions, published in 2012.9 The Commission echoes most of the OECD’s analysis, saying that “the financial and economic crisis has made the demographic changes harder to cope with, as well as highlighting further weaknesses in some pension systems”. The White Paper also argues for longer working lives and greater private-pension saving to fill the pension gap left by reductions in public schemes.
• “There is much scope for further development of complementary pension savings opportunities in many Member States”;
• “[The Commission’s] recommendations…focus strongly on the need to keep older workers longer on the labour market, notably by raising the pensionable age and linking it to gains in life expectancy”. The White Paper also stresses wider policies, not just on pensions, to support longer working lives.
The Europe 2020 Strategy of the Commission takes a similar stance, supporting reduction in public debt, increasing employment (especially of older workers) and public pension reform.
9. European Commission (2012a). The White Paper followed an earlier, consultative Green Paper –
European Commission (2010) – on which extensive comments were made.

20 – CHAPTER 1. INTRODUCTION AND OVERVIEW
REVIEW OF THE IRISH PENSION SYSTEM © OECD 2013
1.4. Ireland’s pension system in international comparison
Before embarking on the detailed analysis, it is useful to look at the architecture of Ireland’s pension provision and compare it with that of other OECD countries. The description is based on the taxonomy of pension systems that is outlined in Figure 1. The framework is based on the role and objective of each part of the retirement-income system. The redistributive, first tier comprises of programmes designed to ensure pensioners achieve some absolute, minimum standard of living. The second-tier savings components are designed to achieve some target standard of living in retirement compared with that when working. The third tier comprises voluntary, private pension savings. Within these tiers, schemes are classified further by provider (public or private) and the way that benefits are determined.
Figure 1. A pensions taxonomy: different types of retirement-income provision
Source: OECD (2011); see also Chapter 1 of OECD (2005), and OECD (2004).
A detailed analysis of all 34 OECD member countries is provided in Pensions at a Glance (OECD, 2011). Table 1 is limited to the architecture of pension systems in Ireland and 12 comparator countries, although mention will be made of the full membership of the OECD.
Because they share broadly similar retirement-income set-ups, this comparative group includes the other mainly English-speaking members of the OECD: Australia, Canada, New Zealand, the United Kingdom and the United States. Iceland, the Netherlands, Poland and Sweden share with Ireland an already important and/or growing role for private pensions in providing incomes in old age, while Switzerland has both mandatory private pensions and a unique set-up of its highly redistributive public pillar. For contrast, the comparison includes two further European countries: France and Germany. In France, the state has the largest role in providing old-age incomes of all OECD countries: 85% of retirement income is made up of public transfers compared with an OECD average of
CHAPTER 1. INTRODUCTION AND OVERVIEW – 21
REVIEW OF THE IRISH PENSION SYSTEM © OECD 2013
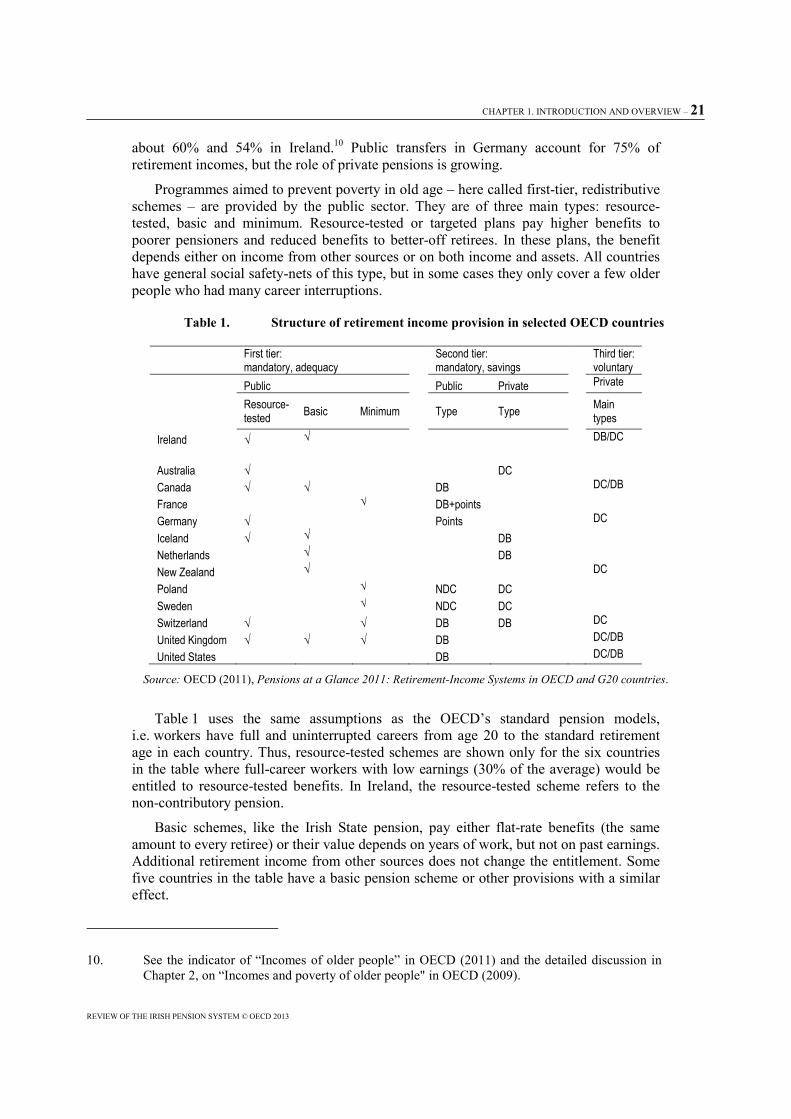
about 60% and 54% in Ireland.10 Public transfers in Germany account for 75% of retirement incomes, but the role of private pensions is growing.
Programmes aimed to prevent poverty in old age – here called first-tier, redistributive schemes – are provided by the public sector. They are of three main types: resource-tested, basic and minimum. Resource-tested or targeted plans pay higher benefits to poorer pensioners and reduced benefits to better-off retirees. In these plans, the benefit depends either on income from other sources or on both income and assets. All countries have general social safety-nets of this type, but in some cases they only cover a few older people who had many career interruptions.
Table 1. Structure of retirement income provision in selected OECD countries
First tier: mandatory, adequacy
Second tier:mandatory, savings
Third tier: voluntary
Public Public Private Private
Resource-tested Basic Minimum Type Type
Main types
Ireland √ √ DB/DC Australia √ DC Canada √ √ DB DC/DB France √ DB+points Germany √ Points DC Iceland √ √ DB Netherlands √ DB New Zealand √ DC Poland √ NDC DC Sweden √ NDC DC Switzerland √ √ DB DB DC United Kingdom √ √ √ DB DC/DB United States DB DC/DB
Source: OECD (2011), Pensions at a Glance 2011: Retirement-Income Systems in OECD and G20 countries.
Table 1 uses the same assumptions as the OECD’s standard pension models, i.e. workers have full and uninterrupted careers from age 20 to the standard retirement age in each country. Thus, resource-tested schemes are shown only for the six countries in the table where full-career workers with low earnings (30% of the average) would be entitled to resource-tested benefits. In Ireland, the resource-tested scheme refers to the non-contributory pension.
Basic schemes, like the Irish State pension, pay either flat-rate benefits (the same amount to every retiree) or their value depends on years of work, but not on past earnings. Additional retirement income from other sources does not change the entitlement. Some five countries in the table have a basic pension scheme or other provisions with a similar effect.
10. See the indicator of “Incomes of older people” in OECD (2011) and the detailed discussion in
Chapter 2, on “Incomes and poverty of older people" in OECD (2009).
22 – CHAPTER 1. INTRODUCTION AND OVERVIEW
REVIEW OF THE IRISH PENSION SYSTEM © OECD 2013
Minimum pensions share many features with resource-tested plans and are found in five of the countries shown. They are linked to contributions to the system and often pro-rated for less-than-complete contribution careers. The value of entitlements takes account only of pension income: unlike resource-tested schemes, it is not affected by income from savings, etc. Minimum credits in earnings-related schemes have a similar effect: benefits for workers with very low earnings are calculated as if the worker had earned at a higher level.
The analysis of benefit values provided by these schemes is complicated by the existence of multiple programmes in many countries. In some cases, benefits from these schemes are additive. In others, there is a degree of substitution between them. Benefit values are therefore summarised in the left-hand chart of Figure 2 for two cases. The dark bars show the overall value of non-contributory benefits. This can be seen as the absolute minimum, safety-net income. The lighter bars show minimum contributory benefits. The entitlements shown are the maximum for a worker contributing for each year from age 20 until the standard national pension age. These can be seen as the minimum income of a low-earning, full-career worker. The left-hand part of the chart shows the value of benefits provided under these different types of scheme. Values are presented in relative terms – as a percentage of economy-wide average earnings – to facilitate comparisons between countries.
In some 20 OECD countries, only non-contributory benefits are relevant. This group includes cases where basic pensions are residency-tested, such as the Netherlands and New Zealand. In Canada, Denmark and Iceland, entitlements are a mix of basic and resource-tested benefits. Finally, in countries including Germany and the United States, this refers only to resource-tested schemes, including social assistance.
In 11 OECD countries, the picture is more complex: there is a safety-net income at a lower level and a contributory minimum at a higher level. In Ireland, for example, contributory basic pensions are worth more than resource-tested schemes. In Sweden, contributory minimum pensions are set at a significantly higher level than the safety-net income.
Safety-net retirement benefits are worth 21.6% of economy-wide mean earnings on average. Eleven countries provide a minimum pension above this safety-net level. For full-career workers, the average retirement income – including these contributory minimum pensions – is 24.4% of economy-wide average earnings.
About a third of older people receive some support from basic, targeted or minimum pensions on average. Data on coverage are presented just for non-contributory safety-net benefits and contributory minimum pensions in the right-hand side of Figure 2. The importance of these benefits varies greatly across countries. Nearly 80% of Australians receive at least some payment from the resource-tested scheme while this percentage is only 28% in Ireland. In France and Sweden, it is minimum contributory benefits that are the most significant, covering 35-55% of retirees. At the other end of the spectrum, 2% or fewer of pensioners receive safety-net benefits in Germany.

CHAPTER 1. INTRODUCTION AND OVERVIEW – 23
REVIEW OF THE IRISH PENSION SYSTEM © OECD 2013
Figure 2. Basic, targeted and minimum pensions, value and coverage
Source: OECD (2011), Pensions at a Glance 2011: Retirement-Income Systems in OECD and G20 countries.
Ireland and New Zealand are the only ones among the 34 OECD countries which do not have mandatory, second-tier pension provision for all workers. In the other countries, there are four kinds of such schemes: defined-benefit, points, defined-contribution and notional accounts.
Defined-benefit (DB) plans are provided by the public sector in Canada, France, the United Kingdom and the United States, as well as in 14 other OECD countries. Private (occupational) DB schemes are mandatory or quasi-mandatory in three OECD countries (Iceland, the Netherlands and Switzerland).11 In these schemes, retirement income depends on the number of years of contributions and individual earnings.
There are points schemes in four OECD countries: French occupational plans (operated by the public sector) and the Estonian, German and Slovak public schemes. Workers earn pension points based on their earnings each year. At retirement, the sum of pension points is multiplied by a pension-point value to convert them into a regular pension payment.
11. The private pension schemes in Iceland and Switzerland are de-facto hybrid schemes between
defined-contributions and defined-benefits but are here classified as defined-benefit. For more information, see OECD (2011).
Value of basic, targeted and minimum pensions(% of economy-wide average earnings)
Coverage of targeted and minimum pensions(% of over 65s)
0 5 10 15 20 25 30 35 40
United States
Germany
Poland
France
Australia
Switzerland
United Kingdom
Sweden
Ireland
Netherlands
Iceland
Canada
New Zealand
Non-contributory Contributory minimum
Benefit value (% of economy-wide average earnings)
0 10 20 30 40 50 60 70 80 90 100
Germany
United States
Switzerland
Poland
United Kingdom
Ireland
Canada
France
Sweden
Australia
Safety-net Minimum contributory
Recipients of targeted and contributory minimum pensions (% of populations aged 65 and over)
24 – CHAPTER 1. INTRODUCTION AND OVERVIEW
REVIEW OF THE IRISH PENSION SYSTEM © OECD 2013
Defined-contribution (DC) plans are compulsory in Australia, Poland, Sweden, and in eight more OECD countries. In these schemes, contributions flow into an individual account. The accumulation of contributions and investment returns is usually converted into a pension-income stream at retirement.
In Denmark and Sweden, there are occupational DC schemes in addition to smaller compulsory plans. While these plans are technically voluntary, negotiations between the social partners extend coverage to the vast majority of workers, which is why they are called quasi-mandatory here.
There are notional-accounts schemes in Poland and Sweden, as well as in Italy and in Norway. These record contributions in an individual account and apply a rate of return to the balances. The accounts are “notional” in that the balances exist only on the books of the managing institution since the system continues to be financed on a pay-as-you-go basis. At retirement, the accumulated notional capital is converted into a stream of pension payments using a formula based on life expectancy. Since this is designed to mimic DC schemes, they are often called notional defined-contribution plans (NDC).
This brief comparison shows that the Irish system is somewhat of an outlier in the OECD pension landscape, consisting only of a basic public pension system, complemented by the resource-tested non-contributory pension, but no earnings-related pillar nor any mandatory or quasi-mandatory occupational or personal pension arrangements. As mentioned, the only other OECD country which has a similar set-up is New Zealand. The level of the basic pension in New Zealand, however, is higher than in Ireland. It corresponds to almost 40% of the average wage compared to 29% in Ireland on the average definition used by the OECD.12
12. However average earnings have declined and the figure for 2012 now represents 37%.
CHAPTER 2. THE IRISH PENSION SYSTEM: OVERVIEW AND ASSESSMENT – 25
REVIEW OF THE IRISH PENSION SYSTEM © OECD 2013
Chapter 2
The Irish pension system: overview and assessment
2.1. Structure of the public pension system
The public pension system in Ireland is a basic scheme which is mandatory for all private-sector workers.13 It can be complemented by voluntary private pension arrangements. The public system delivers two sorts of flat-rate benefits: 1) a basic flat-rate benefit to all retirees that meet the contribution conditions, the State pension (contributory) or SPC and the State pension (transition) or SPT; and 2) a means-tested benefit to those that have not contributed or have not contributed enough, the State pension (non-contributory) or SPNC.14 The State pension (contributory) is payable from age 66. Currently, workers with a full contribution record can still retire at age 65. They then receive a transition pension which is paid for one year and requires that the pensioner stops working. At age 66, they receive the State pension (contributory). Those in receipt of the State pension (contributory) can continue in employment. The State pension (transition) will be abolished in 2014. The pension age is scheduled to increase further to 67 years in 2021 and to 68 in 2028.
The maximum personal rate of both the contributory and the transition pension is EUR 230.30 per week for a single person (paid for 52 weeks per year) for 2012, corresponding to 33.1% of average earnings (on the CSO Earnings and Labour Costs measure of average earnings15). There is a supplement for an eligible dependant adult living with the pensioner, as well as a number of allowances payable in certain circumstances.
13. Post-1995 public sector workers who pay full rate PRSI are eligible in the same way as private
sector workers. In contrast, those below 38 euro and the self employed are excluded.
14. The bands according to which the State pension (non-contributory) is paid depend on the weekly means assessed.
15. The increase in the State pension resulted from different policy initiatives implemented since the late 1990s. In May 1998, the report of the National Pensions Policy Initiative recommended an increase of the State pension from 28.5% of average industrial earnings to 34% of national average industrial earnings. In October 2005, the target of 34% was mentioned again in the National Pensions Review. Adopting a similar approach, the 2010 National Pensions Framework says that “The State Pension will continue to be the fundamental basis for the pension system. The Government will seek to ensure that the level of the State Pension is maintained at 35% of average weekly earnings (as calculated by the CSO in the Earnings, Hours and Employment Costs Survey (EHECS)” (p. 14). The AW (average wage) measure in the OECD definition (for
26 – CHAPTER 2. THE IRISH PENSION SYSTEM: OVERVIEW AND ASSESSMENT
REVIEW OF THE IRISH PENSION SYSTEM © OECD 2013
The State pension (non-contributory) or SPNC is currently payable from age 66. The eligibility age will increase in line with the State pension (contributory) age. The SPNC is paid at a slightly lower rate than the State pension (contributory); in 2012 the maximum rate of the SPNC was EUR 219 per week for a single person under the age of 80, i.e. 31.5% of average earnings (OECD definition). There are again supplements for dependant adults.
All recipients of pension benefits and certain other groups are entitled to the “household benefits package” comprising an electricity/gas and telephone allowance as well as a free television licence.16 Some components of this package are means-tested for people aged 65-69; from age 70 all people are entitled to the package, regardless of income.
For those aged 65-69, the household benefits package is paid if their weekly household income is less than the maximum rate of State pension (contributory) plus EUR 100 plus any additional allowances for particular circumstances e.g. qualified adult, dependent child(ren) or living-alone allowance.
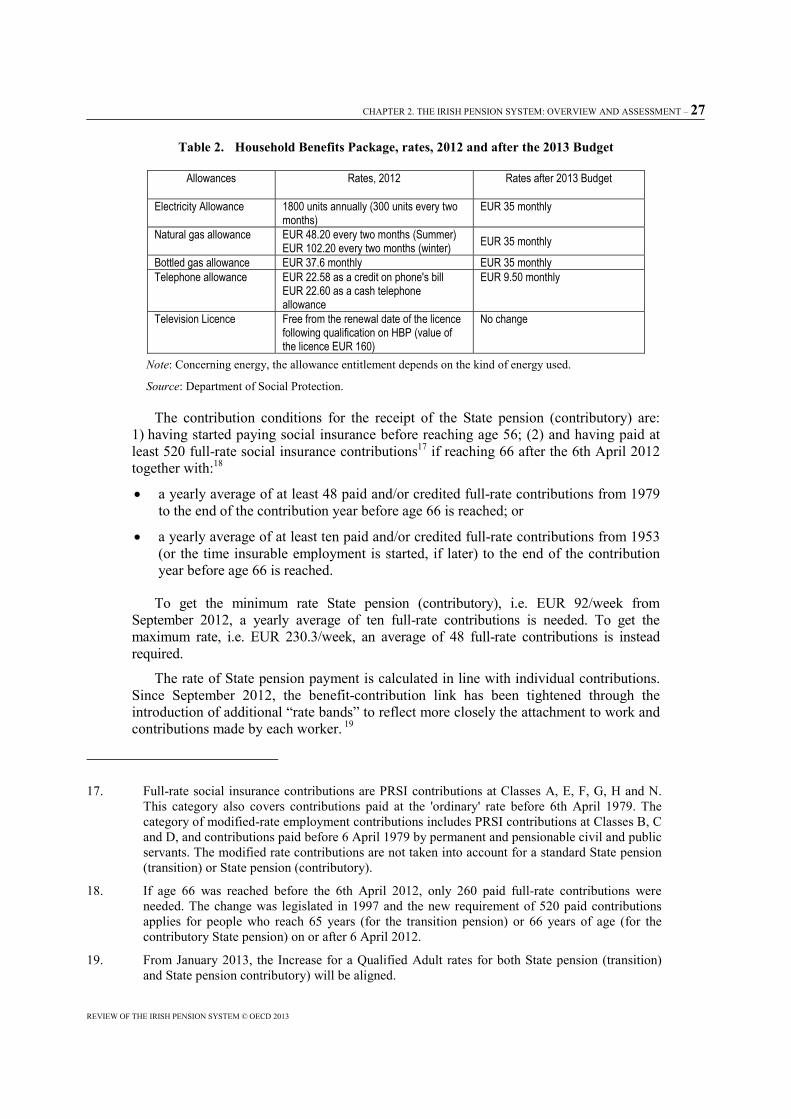
In the 2013 Budget, the household benefits package was reduced substantially. According to estimates contained in the Expenditure Report 2013 cuts in the telephone allowance scheme and in the electricity allowance will help to achieve global savings of EUR 81 million in 2013. Table 2 shows the rates applied in 2012 and the new rates after the 2013 Budget.
the year 2012) is EUR 32,732.49. The average earnings measure published by the CSO is around EUR 36,000. The AW definition of the OECD includes manual and non-manual workers, supervisory workers as well as managerial workers in the private sector. The private sector is defined as Sectors B-N inclusive (ISIC Revision 4) or previously as Sectors C-K inclusive (ISIC Revision 3), with reference to the International Standard Industrial Classification of All Economic Activities. In contrast, the CSO definition covers earnings of both public and private sector workers.
16. The Household Benefits Package (HBP) was originally introduced in the late 1960s to cover the cost of electricity for pensioners living alone. The scope of the scheme has increased substantially over time. The Free Travel Scheme was introduced at the same time as the HBP to provide transport services to those aged over 70 who were living alone and in receipt of a social welfare pension. Currently, all persons living in Ireland who are aged 66 and over as well as people below that age who are in receipt of certain Social Protection payments benefit of the scheme – i.e. more than 20% of the national population may benefit from the Free Travel Scheme.
CHAPTER 2. THE IRISH PENSION SYSTEM: OVERVIEW AND ASSESSMENT – 27
REVIEW OF THE IRISH PENSION SYSTEM © OECD 2013
Table 2. Household Benefits Package, rates, 2012 and after the 2013 Budget
Allowances
Rates, 2012 Rates after 2013 Budget
Electricity Allowance 1800 units annually (300 units every two months)
EUR 35 monthly
Natural gas allowance EUR 48.20 every two months (Summer)EUR 102.20 every two months (winter) EUR 35 monthly
Bottled gas allowance EUR 37.6 monthly EUR 35 monthlyTelephone allowance EUR 22.58 as a credit on phone's bill
EUR 22.60 as a cash telephone allowance
EUR 9.50 monthly
Television Licence Free from the renewal date of the licence following qualification on HBP (value of the licence EUR 160)
No change
Note: Concerning energy, the allowance entitlement depends on the kind of energy used.
Source: Department of Social Protection.
The contribution conditions for the receipt of the State pension (contributory) are: 1) having started paying social insurance before reaching age 56; (2) and having paid at least 520 full-rate social insurance contributions17 if reaching 66 after the 6th April 2012 together with:18
• a yearly average of at least 48 paid and/or credited full-rate contributions from 1979 to the end of the contribution year before age 66 is reached; or
• a yearly average of at least ten paid and/or credited full-rate contributions from 1953 (or the time insurable employment is started, if later) to the end of the contribution year before age 66 is reached.
To get the minimum rate State pension (contributory), i.e. EUR 92/week from September 2012, a yearly average of ten full-rate contributions is needed. To get the maximum rate, i.e. EUR 230.3/week, an average of 48 full-rate contributions is instead required.
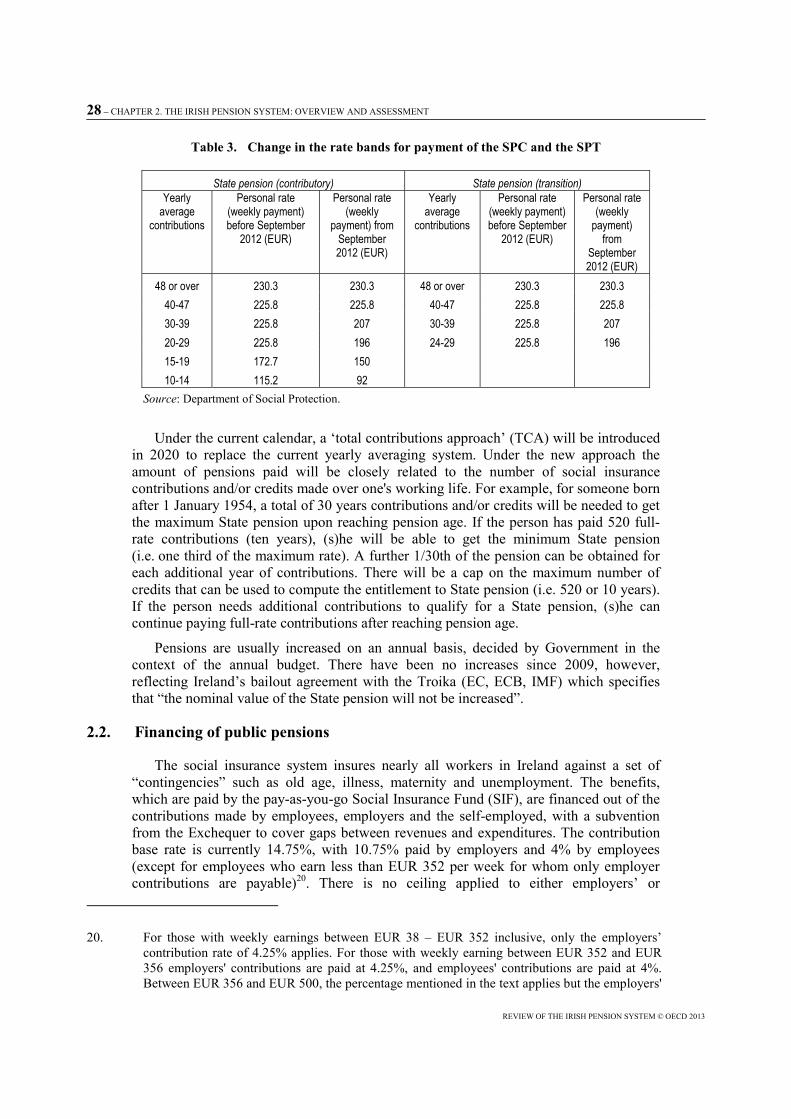
The rate of State pension payment is calculated in line with individual contributions. Since September 2012, the benefit-contribution link has been tightened through the introduction of additional “rate bands” to reflect more closely the attachment to work and contributions made by each worker. 19
17. Full-rate social insurance contributions are PRSI contributions at Classes A, E, F, G, H and N.
This category also covers contributions paid at the 'ordinary' rate before 6th April 1979. The category of modified-rate employment contributions includes PRSI contributions at Classes B, C and D, and contributions paid before 6 April 1979 by permanent and pensionable civil and public servants. The modified rate contributions are not taken into account for a standard State pension (transition) or State pension (contributory).
18. If age 66 was reached before the 6th April 2012, only 260 paid full-rate contributions were needed. The change was legislated in 1997 and the new requirement of 520 paid contributions applies for people who reach 65 years (for the transition pension) or 66 years of age (for the contributory State pension) on or after 6 April 2012.
19. From January 2013, the Increase for a Qualified Adult rates for both State pension (transition) and State pension contributory) will be aligned.
28 – CHAPTER 2. THE IRISH PENSION SYSTEM: OVERVIEW AND ASSESSMENT
REVIEW OF THE IRISH PENSION SYSTEM © OECD 2013
Table 3. Change in the rate bands for payment of the SPC and the SPT
State pension (contributory) State pension (transition) Yearly
average contributions
Personal rate (weekly payment) before September
2012 (EUR)
Personal rate (weekly
payment) from September 2012 (EUR)
Yearly average
contributions
Personal rate (weekly payment) before September
2012 (EUR)
Personal rate (weekly
payment) from
September 2012 (EUR)
48 or over 230.3 230.3 48 or over 230.3 230.3 40-47 225.8 225.8 40-47 225.8 225.8 30-39 225.8 207 30-39 225.8 207 20-29 225.8 196 24-29 225.8 196 15-19 172.7 150 10-14 115.2 92
Source: Department of Social Protection.
Under the current calendar, a ‘total contributions approach’ (TCA) will be introduced in 2020 to replace the current yearly averaging system. Under the new approach the amount of pensions paid will be closely related to the number of social insurance contributions and/or credits made over one's working life. For example, for someone born after 1 January 1954, a total of 30 years contributions and/or credits will be needed to get the maximum State pension upon reaching pension age. If the person has paid 520 full-rate contributions (ten years), (s)he will be able to get the minimum State pension (i.e. one third of the maximum rate). A further 1/30th of the pension can be obtained for each additional year of contributions. There will be a cap on the maximum number of credits that can be used to compute the entitlement to State pension (i.e. 520 or 10 years). If the person needs additional contributions to qualify for a State pension, (s)he can continue paying full-rate contributions after reaching pension age.
Pensions are usually increased on an annual basis, decided by Government in the context of the annual budget. There have been no increases since 2009, however, reflecting Ireland’s bailout agreement with the Troika (EC, ECB, IMF) which specifies that “the nominal value of the State pension will not be increased”.
2.2. Financing of public pensions
The social insurance system insures nearly all workers in Ireland against a set of “contingencies” such as old age, illness, maternity and unemployment. The benefits, which are paid by the pay-as-you-go Social Insurance Fund (SIF), are financed out of the contributions made by employees, employers and the self-employed, with a subvention from the Exchequer to cover gaps between revenues and expenditures. The contribution base rate is currently 14.75%, with 10.75% paid by employers and 4% by employees (except for employees who earn less than EUR 352 per week for whom only employer contributions are payable)20. There is no ceiling applied to either employers’ or
20. For those with weekly earnings between EUR 38 – EUR 352 inclusive, only the employers’
contribution rate of 4.25% applies. For those with weekly earning between EUR 352 and EUR 356 employers' contributions are paid at 4.25%, and employees' contributions are paid at 4%. Between EUR 356 and EUR 500, the percentage mentioned in the text applies but the employers'
CHAPTER 2. THE IRISH PENSION SYSTEM: OVERVIEW AND ASSESSMENT – 29
REVIEW OF THE IRISH PENSION SYSTEM © OECD 2013
employees’ contributions. The largest part of the Fund’s spending is on pensions: these accounted for approximately 60% in 2012 and are expected to increase to 64% in 2013.
The State pension (non-contributory) is financed through general taxation and is paid according to need (see Department of Social and Family Affairs, 2007). For workers who have made contributions to the State pension (contributory) scheme but end up receiving the non-contributory State pension a transfer of the amount corresponding to their contributions is made from the SIF to the Exchequer.
In 2001, the Government decided to establish a National Pensions Reserve Fund (NPRF) to meet as much as possible of the costs of Ireland's social welfare and public service pensions from 2025 onwards; the aim was to help insulate the financing of the system from population ageing. The Fund is controlled and managed by the National Pensions Reserve Fund Commission. The Commission performs its functions through the National Treasury Management Agency, which is the Manager of the Fund.
In 2009, legislation was passed that requires the Commission to make investments in credit institutions, as directed by the Minister for Finance “in order to remedy a serious disturbance in the economy of the State; or to prevent potential serious damage to the financial system in the State and ensure the continued stability of the system”. This has resulted in a large share of the pension reserve fund being used for the recapitalisation of Irish banks.
2.3. Private pension arrangements
There are three main types of private pension arrangements in Ireland: i) occupational pension schemes; ii) Personal Retirement Savings Accounts (PRSAs); and iii) Retirement Annuity Contracts (RACs). Those enrolled in an occupational pension plan cannot take out an RAC or a PRSA, unless the PRSA is funded by additional voluntary contributions (AVC) or the person has a separate source of earnings, e.g. a separate job or income.
2.3.1. Occupational pension schemes Occupational schemes are set up by employers. They can be established as
DB schemes, where the employer makes a promise to pay employees a certain percentage of previous earnings when they retire, or as DC schemes, where employees will receive a benefit in line with the contributions made by themselves and/or their employer on their behalf plus any interest and capital gains earned from investing those contributions. All benefits paid from a company plan are subject to maximum limits set by the tax authority (Revenue Commissioners).
Occupational pension schemes provided by employers in the private sector are funded (mainly via the establishment of pension funds) and regulated by the Pensions Board. This contrasts with the situation of pension schemes for public sector employees which are generally not funded, except for the schemes of commercial state-owned organisations, such as the Electricity Supply Board. This part of the report considers only
contribution on the first EUR 127 is paid at 10.75%). The Budget 2013 removed the disregard of EUR 127 for the purpose of employers' contributions. This results in an annual increase in PRSI of 260 EUR a year. In addition, PRSI will now be charged on unearned income, such as rent, share and dividend income.
30 – CHAPTER 2. THE IRISH PENSION SYSTEM: OVERVIEW AND ASSESSMENT
REVIEW OF THE IRISH PENSION SYSTEM © OECD 2013
funded pension plans; issues about public sector employees’ unfunded schemes are dealt with in Section 2.4.
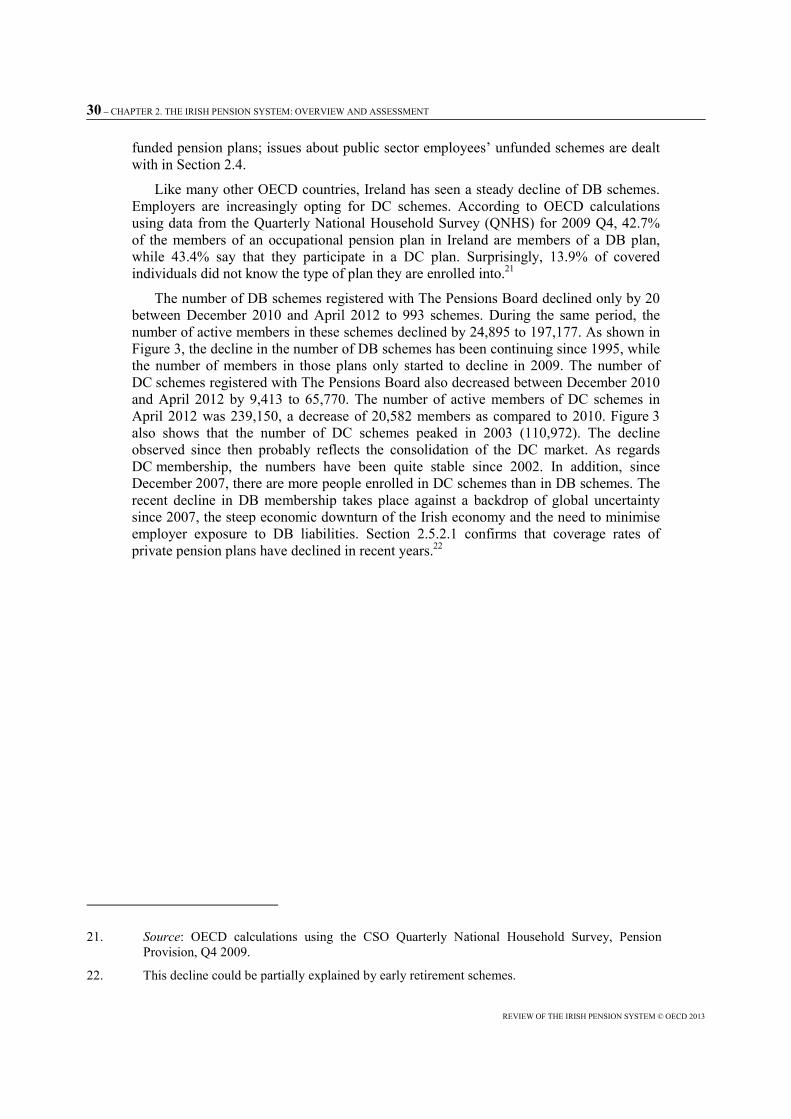
Like many other OECD countries, Ireland has seen a steady decline of DB schemes. Employers are increasingly opting for DC schemes. According to OECD calculations using data from the Quarterly National Household Survey (QNHS) for 2009 Q4, 42.7% of the members of an occupational pension plan in Ireland are members of a DB plan, while 43.4% say that they participate in a DC plan. Surprisingly, 13.9% of covered individuals did not know the type of plan they are enrolled into.21
The number of DB schemes registered with The Pensions Board declined only by 20 between December 2010 and April 2012 to 993 schemes. During the same period, the number of active members in these schemes declined by 24,895 to 197,177. As shown in Figure 3, the decline in the number of DB schemes has been continuing since 1995, while the number of members in those plans only started to decline in 2009. The number of DC schemes registered with The Pensions Board also decreased between December 2010 and April 2012 by 9,413 to 65,770. The number of active members of DC schemes in April 2012 was 239,150, a decrease of 20,582 members as compared to 2010. Figure 3 also shows that the number of DC schemes peaked in 2003 (110,972). The decline observed since then probably reflects the consolidation of the DC market. As regards DC membership, the numbers have been quite stable since 2002. In addition, since December 2007, there are more people enrolled in DC schemes than in DB schemes. The recent decline in DB membership takes place against a backdrop of global uncertainty since 2007, the steep economic downturn of the Irish economy and the need to minimise employer exposure to DB liabilities. Section 2.5.2.1 confirms that coverage rates of private pension plans have declined in recent years.22
21. Source: OECD calculations using the CSO Quarterly National Household Survey, Pension
Provision, Q4 2009.
22. This decline could be partially explained by early retirement schemes.
CHAPTER 2. THE IRISH PENSION SYSTEM: OVERVIEW AND ASSESSMENT – 31
REVIEW OF THE IRISH PENSION SYSTEM © OECD 2013
Figure 3. Number of schemes and scheme membership by type of plan in Ireland, 1991-2012
Source: The Pensions Board.
At the end of 2011, Irish occupational pension funds managed EUR 72.3 billion of assets, representing 46.2% of GDP. Of the EUR 72.3 billion, EUR 45.8 billion (63.3%) of assets were managed by DB schemes. The remaining EUR 26.5 billion (36.7%) was managed by DC schemes, including Additional Voluntary Contribution schemes.23 As shown in Figure 4, the importance of Irish pension funds relative to the size of the economy24 was below the OECD average at 72.2% (weighted average), and comparable with the size of pension funds’ assets in Israel and Denmark.25
23. Source: Irish Association of Pension Funds, Pension Investment Survey 2011.
24. The asset-to-GDP ratio measures the importance of pension funds relative to the size of the economy. It is a useful indicator to compare the size of pension funds’ markets across countries.
25. Source: OECD Global Pension Statistics. Data shown in Figure 4 only refer to autonomous pension funds. In the case of Denmark for instance, it does not include pension plans managed by insurance companies, which managed assets representing 114.9% of GDP at the end of 2011.
Number of schemes
Scheme membership
0
500
1 000
1 500
2 000
2 500
3 000
0
20 000
40 000
60 000
80 000
100 000
120 000
Num
ber o
f D
B sc
hem
es
Num
ber o
f D
C sc
hem
esDC scemes DB schemes
0
50 000
100 000
150 000
200 000
250 000
300 000
DC members DB members

32 – CHAPTER 2. THE IRISH PENSION SYSTEM: OVERVIEW AND ASSESSMENT
REVIEW OF THE IRISH PENSION SYSTEM © OECD 2013
Figure 4. Importance of pension funds relative to the size of the economy in OECD countries, 2011
As a % of GDP
Notes: 1. Preliminary estimate; 2. Data refer to the end of June 2011; 3. Source: IAPF Pension Investment Survey; 4. Source: Bank of Japan.
* The statistical data for Israel were supplied by and under the responsibility of the relevant Israeli authorities. The use of such data by the OECD is without prejudice to the status of the Golan Heights, East Jerusalem and Israeli settlements in the West Bank under the terms of international law.
Source: OECD Global Pensions Statistics.
A typical occupational DB pension plan in Ireland would be tied to the pensionable salary and may have an accrual rate of 1/60th for each year of service, thus reaching a maximum of 2/3 of pensionable salary after a 40-year career. As most DB schemes are integrated with the State pension, the pensionable salary is usually the individual’s final salary less 1.5 times the State pension. Employees are generally required to contribute to DB plans.
Average contribution rates to DC plans are usually between 5% and 10% of earnings, with employers and employees contributing half each. Additional voluntary employee contributions (AVC) can only be made if the rules of the plan permit this. If they do not, then a member has the right to pay AVCs to a PRSA.
A typical plan provides for a retirement age of 65 for both men and women (82% of DB and 64% of DC plans) in line with the State pension age. In DB plans, members may
4.9
15.8
0.00.31.9
2.93.84.24.5
4.9
5.56.5
7.77.8
25.1
46.2
63.770.6
88.2
2.2
5.3
7.4
8.49.2
12.915.0
33.2
49.449.7
58.5
72.275.0
92.8110.8
128.7138.2
0 20 40 60 80 100 120 140 160
GreeceFrance
LuxembourgTurkey
SloveniaHungaryBelgium
KoreaItaly
AustriaEstonia
GermanyCzech Republic
NorwayPortugal
SpainSlovak Republic
SwedenMexicoPoland
New ZealandJapan (4)
Simple averageIreland (3)
IsraelDenmark
ChileCanada
United StatesWeighted average
FinlandUnited Kingdom (1)
Australia (2)Switzerland (1)
IcelandNetherlands
Mandatory / Quasi-mandatory Voluntary Auto-enrolment

CHAPTER 2. THE IRISH PENSION SYSTEM: OVERVIEW AND ASSESSMENT – 33
REVIEW OF THE IRISH PENSION SYSTEM © OECD 2013
be able to take an actuarially reduced early retirement pension from age 50. Early retirement due to ill-health is allowed at any age. Deferred retirement is usually possible and increments are paid. With the planned increases in the State pension age to 66 in 2014, to 67 in 2021 to reach 68 in 2028, one may expect that the typical age of retirement in private pension plans will increase as well.
Several options are available to occupational pension scheme members at retirement. These options include:
• Taking a tax-free lump sum, subject to limits set by legislation and by Revenue Commissioners,
• Receiving a pension,
• Transferring some or all of the retirement savings to an Approved Retirement Fund (ARF) or Approved Minimum Retirement Fund (AMRF). This option is only available for DC schemes or the AVC portion of DB benefits.
The majority of funded schemes provide the option of converting part of the retirement income into a tax-free lump sum. The amount that can be taken at normal retirement age with 20 or more years’ service is limited to 3/80th of final earnings for each year of service up to a maximum of 40 years (i.e. maximum of 1.5 times the final earnings). Lower amounts are payable in case of early retirement or less service. The tax-free portion of a retirement lump sum has a life-time cap of EUR 200,000 per person from all of their pension plans collectively.
If people chose to receive a pension at retirement, the amount of the pension depends on the amount of the retirement fund left after taking any retirement lump sum and the cost of buying the pension, in the case of a DC plan. In the case of a DB plan, the amount of the pension is typically based on the years of service and final earnings and is usually reduced by the pension equivalent of any lump sum received.
In addition, there is a specific financial product available for certain people at the point of retirement. People can invest pension savings upon retirement in an Approved Retirement Fund (ARF). Depending on the level of guaranteed pension income available for life and the size of the pension fund, individuals may only have access to a specific type of ARF, called an Approved Minimum Retirement Fund (AMRF). Since 2011, ARFs and AMRFs are available to members of DC occupational plans.26
An ARF is an investment contract in which the money is invested with a “Qualifying Fund Manager” (which includes banks, building societies and insurance companies). The individual can decide how to invest the money which accumulates tax-free. Income tax is payable on any money withdrawn from the fund. To invest in an ARF, the individual must have a guaranteed pension income in payment for life from other sources of at least EUR 18,000 annually.27 Where the minimum specified income test is not met and the
26. ARF and AMRF are also available to holders of PRSAs, RACs, members of Retirement Annuity
Trust schemes, proprietary directors, and individuals entitled to rights arising from AVCs paid to a scheme (either DB or DC).
27. The Finance Bill 2013 includes provision to return to previous limits of EUR 12,700 for the minimum guaranteed pension income for life (instead of EUR 18,000) and of EUR 63,500 for the maximum set aside amount for AMRF funds (instead of EUR 119,800) from the date of passing the Finance Act 2013. The intention is that the lower limits will apply for a period of

34 – CHAPTER 2. THE IRISH PENSION SYSTEM: OVERVIEW AND ASSESSMENT
REVIEW OF THE IRISH PENSION SYSTEM © OECD 2013
individual does not wish to purchase an annuity, the legislation requires that the first EUR 120,000 of the pension fund (after taking the retirement lump sum), or the entire remaining fund, if this is less than that amount, must be invested in an AMRF.25 The individual may use the AMRF funds at any time to purchase an annuity. When an individual attains the age of 75 or starts receiving a guaranteed pension income for life from other sources of EUR 18,000 a year, the AMRF automatically becomes an ARF. An AMRF is like an ARF except that the individual cannot withdraw the original capital investment. Only the investment income can be withdrawn in the meantime. As explained below, there are incentives for people to withdraw 5% of their ARF fund each year.
2.3.2. Personal pension savings Personal Retirement Savings Accounts (PRSAs) and Retirement Annuity Contracts
(RACs) are personal pension savings plans. Contributions to those pension savings plans are generally from individuals, although the employer can also contribute.
PRSAs were introduced in 2002 in order to increase private pension coverage, targeting people consistently left uncovered by existing pension arrangements, whether by choice or by exclusion. These plans are offered by financial service providers such as insurance companies and banks.
Any individual under the age of 75 can take out a PRSA, irrespective of whether s/he has taxable earnings (e.g. employees, self-employed, homemakers, carers, or unemployed). This includes employees who are excluded from joining a company pension plan. The PRSA contract may stipulate a minimum age. Benefits can usually be taken from age 60.
The number of PRSA contracts grew during 2011 by 10,924 to 198,038 with total assets of EUR 3.03 billion (representing 1.9% of GDP), an increase of EUR 290 million since 2010.28 Both in terms of assets under management and members, PRSAs are dwarfed in size by occupational pension funds.
There are two types of PRSA, standard and non-standard. One of the main differences between the two is that under a standard PRSA charges cannot exceed 5% of contributions and 1% of the assets accumulated in the PRSA. In addition, non-standard PRSAs may offer the holder a more discretionary investment and a more ‘bespoke’ option. There are also some restrictions on the kind of assets that a standard PRSA can invest in. Standard PRSAs are only permitted to invest, apart from temporary cash holdings, in pooled funds, i.e. a collective investment scheme or an internal linked fund the benefit of which is made available by means of a contract of insurance.
Employers must offer access to at least one standard PRSA to any employee who is not eligible to join an occupational pension scheme within six months of joining the firm and must offer a PRSA for additional voluntary contribution (AVC) purposes if there is no facility for AVCs within the occupational scheme. In the case of “excluded employees” (i.e. those not eligible to join an existing occupational pension scheme), the employee makes contributions to a PRSA via the employer’s payroll.
three years, whereupon the higher limits implemented in 2011 will be reapplied by Finance Act 2016.
28. Source: The Pensions Board, Annual Report and Accounts 2011.

CHAPTER 2. THE IRISH PENSION SYSTEM: OVERVIEW AND ASSESSMENT – 35
REVIEW OF THE IRISH PENSION SYSTEM © OECD 2013
Benefits normally become available between the ages of 60 and 75 or at any time in the event of serious ill health. In the case of employees, benefits can be taken upon early retirement from employment from age 50. 25% of the PRSA accrued benefits can be paid as a tax-free lump sum and retained in the PRSA (non-AVC PRSAs only). The balance of the fund can be used to purchase a lifetime annuity, taken as a taxable lump sum, retained in the PRSA (which is known as a vested PRSA) or transferred into an ARF or an AMRF. The taxable lump sum, vested PRSA and ARF options are subject to guaranteed pension income condition being met or alternatively the AMRF requirement being filled.
Finally, anyone with earnings can contribute to a Retirement Annuity Contract (RAC) except those who are enrolled in a company pension plan. The minimum contribution level for the insured person is specified in the RAC policy. Employers may choose to contribute to the RAC. The total number of RACs is approximately 200,000.29, 30
Benefits are payable at any time after age 60 but before age 75. Retirement is not a prerequisite. On maturity of the contract, 25% of the funds can be paid as a tax-free lump sum, with the remaining funds used to purchase an annuity, taken out as a taxable lump sum or transferred into an ARF (subject to the guaranteed pension income condition/AMRF requirement).
2.3.3. Pension tax system The Irish tax system exempts pension contributions and earned income of the pension
fund investment from taxation but taxes withdrawals and pension benefits as income. This is the standard “Exempt, Exempt, Taxed” (EET) approach.
Pension contributions Contributions made by employees are deductible for income tax purposes and tax
relief is applied at the individual’s marginal income tax rate.31 The amount of employee contributions that can be tax-relieved is limited to an age-related percentage amount of the employee’s remuneration as set out in Table 4. Since 2011, tax-relievable contributions are subject to an annual earnings cap of EUR 115,000 (EUR 150,000 in 2010 and previously EUR 250,000). These rules apply to aggregate employee contributions including AVCs (see Table 4).
29. Source: The Pensions Board, National Pension Awareness Campaign 2008.
30. Revenue Commissioners statistical report for 2010 (Income tax section) shows a cost to the exchequer of tax relief of EUR 237.2 million for 101,300 contracts. These are only the contracts in which cash had been invested in 2010.
31. There are only two income brackets in Ireland, taxed at 20% and 41% respectively.
36 – CHAPTER 2. THE IRISH PENSION SYSTEM: OVERVIEW AND ASSESSMENT
REVIEW OF THE IRISH PENSION SYSTEM © OECD 2013
Table 4. Tax relief on pension contributions (2011)
Employer contributions are deductible in computing the income for tax purposes of the employer’s business.
From the employee’s point of view, employer contributions to occupational pension plans on their behalf are not treated as taxable income in the hands of the employee. The annual earnings cap and age-related percentage limits do not apply to employer contributions into those plans. In contrast, employer contributions on behalf of the employee to a PRSA or a RAC are treated as a taxable benefit-in-kind for the employee. They are also included within the age-related percentage limits and within the overall EUR 115,000 earnings cap for the purpose of tax relief. However, the employee can claim income tax relief on these contributions as if he or she had paid them. If combined employer and employee contributions exceed the limits, an unrelieved benefit-in-kind charge applies to the excess.
Since 1 January 2011, employees’ pension contributions no longer receive relief from Pay-Related Social Insurance (PRSI) and the health levy/Universal Social Charge. In addition, since 2012, employers do not receive any PRSI relief on employee pension contributions. Employer contributions are not liable to the Universal Social Charge (except when the employer makes a contribution on behalf of the employee to a PRSA or to a RAC).
Investment returns Pension fund investments are generally exempt from tax on their capital gains and
income. However, there is still some external tax leakage for pension fund investors as a result of dividend withholding taxes that are applied in some jurisdictions.
The principle of tax exemption during the accumulation phase has been undermined in recent years by the temporary pension levy that taxes the entire accumulated fund. A stamp duty levy of 0.6% is applied to the market value of assets under management in pension funds and pension plans approved under Irish tax legislation (occupational pension schemes, RACs and PRSAs). This pension levy has been introduced to fund various measures set out in the Job Initiative. The levy is for a temporary period only (four years from 2011 to 2014) and pension funds are being asked to make a contribution to encourage economic growth in that period. According to the IAPF, the levy amounted to EUR 477 million in 2012 and about EUR 2 billion should have been paid from pension assets by the time the levy ceases in 2014.32 When introducing the levy, the Government
32. See the article by Jerry Moriarty, CEO of the Irish Association of Pensions Funds (IAPF), in IPE
Magazine (www.ipe.com/magazine/ireland-clear-intentions_49703.php).
Age Limit Actual Allowed Contribution LimitLess than 30 years 15% EUR 17,250 Between 30 and 39 20% EUR 23,000 Between 40 and 49 25% EUR 28,750 Between 50 and 54 30% EUR 34,500 Between 55 and 59 35% EUR 40,250 Over 60 40% EUR 46,000
CHAPTER 2. THE IRISH PENSION SYSTEM: OVERVIEW AND ASSESSMENT – 37
REVIEW OF THE IRISH PENSION SYSTEM © OECD 2013
suggested that the payment might be absorbed, in whole or part, by the pension industry cutting its costs and its fees. No data are yet available however to check whether this has happened. The legislation also allowed trustees to make corresponding reductions to the benefits provided, including for DB schemes.33
According to the Irish Government in its National Recovery Plan 2011-2014, the total gross tax cost of pension tax relief is just over EUR 2.5 billion per annum. There are three significant elements in the estimates of the cost of tax reliefs for private pension provision. These are:
• the estimated costs of tax relief on employee/self-employed/individual contributions to pension savings (over EUR 1 billion);
• the estimated cost of the tax exemption for employer contributions as a benefit-in-kind in the hands of employees (about EUR 500 million), and
• the estimated cost of exempting from tax the accrued income and capital gains growth of pension funds (about EUR 1 billion).
Pension benefits Most of the benefits are taxed under the Pay As You Earn (PAYE) system, and
subject to the Universal Social Charge. Pension income benefits on retirement are taxable as income at the individual’s marginal income tax rate. However, individuals can take tax-free lump sums. To qualify for a beneficial tax treatment, a scheme must be approved by the Revenue Commissioners and comply with the maximum benefits rules and requirements.
Tax-free lump sum
Since 1 January 2011 the maximum sum that can be taken from a pension scheme at retirement tax-free is capped at EUR 200,000. Lump-sum payments above that limit will be taxed at the rates shown in Table 5.
Table 5. Tax rate on lump-sum payments
Amount of lump sum Income tax rate
Up to EUR 200,000 0%
EUR 200,001 – EUR 575,000 20%
Over EUR 575,000 Taxpayer's marginal rate and USC
Standard Fund Threshold
The Budget and Finance Act 2006 introduced a maximum allowable pension fund on retirement for tax purposes known as the Standard Fund Threshold (SFT). The SFT limit of EUR 5 million was placed on the total capital value of pension benefits that an
33. The payment of the levy is treated as a necessary expense of a pension scheme and the trustees
or insurer, as appropriate, are entitled, where they decide to do so, to adjust current or prospective benefits payable under a scheme to take account of the levy.
38 – CHAPTER 2. THE IRISH PENSION SYSTEM: OVERVIEW AND ASSESSMENT
REVIEW OF THE IRISH PENSION SYSTEM © OECD 2013
individual can draw upon in their lifetime from tax-relieved pension arrangements. Finance Act 2006 also introduced indexation for the SFT from 2007 onwards in line with an earnings factor to be designated by the Minister for Finance each December. As a result, the value of the SFT over the period to 2008 was increased to over EUR 5.4 million. No indexation of the SFT was undertaken for 2009, 2010 or 2011.
On each occasion that an individual becomes entitled to receive a benefit under a pension arrangement, that individual uses up part of their SFT. Where the capital value of the aggregate of such benefits exceeds the SFT, a “chargeable excess” arises equal to the amount by which the threshold is exceeded which is subject to an upfront income tax charge at 41%. This charge is without prejudice to any other income tax charge that might arise on the balance of the chargeable excess as and when benefits are actually taken under the scheme. The effective tax rate (leaving aside other charges) that might therefore apply to a chargeable excess could potentially amount to over 65%.34
The Budget and Finance Act 2011 reduced the SFT to EUR 2.3 million with effect from 7 December 2010, a reduction in line with the scale of the reduction applied since 2009 to the annual earnings limit for pension contributions purposes.35
Individuals whose fund already exceeded EUR 2.3 million had until June 2011 to apply to Revenue for a Personal Fund Threshold (PFT). The PFT is the total of the individual’s pre-retirement pension fund and any pension benefits taken since 7 December 2005, subject to the old cap of EUR 5,418,085. Benefits taken before 7 December 2005 are ignored for SFT/PFT purposes. Anyone who already had a PFT in excess of the old cap, as a result of having a pension fund worth more than EUR 5 million in 2005, kept their existing PFT.
The fund value in a DC scheme is quite clear being the market value of the investment in the pension fund. In a DB scheme, a standard multiplier of 20 is currently applied to the annual rate of pension benefit payable under the scheme (plus any separate lump sum payable) to calculate the capital value with a view to determining whether the fund is over the SFT/PFT limit or not.
Notional distribution from ARFs
Any money withdrawn from an ARF is taxed at the individual’s marginal rate. The Budget and Finance Act 2006 introduced an imputed or notional distribution of 3% of the value of the assets of an ARF on 31 December each year, where the notional amount is taxed at the ARF owner’s marginal income tax rate. The notional distribution measure was introduced to encourage drawdowns from AFRs so that they are used, as intended, to fund a stream of income at retirement. It does not apply to AMRFs. The level of the imputed distribution was increased from 3% to 5% in the Budget and Finance Act 2011, and from 5% to 6% for ARFs with asset values in excess of EUR 2 million in the Budget and Finance Act 2012. The amount of the annual notional distribution is reduced by the amount of actual distributions taken from an ARF and from an associated ARF. In
34. Source: Department of Finance, 2010 Tax Strategy Group Papers n°23, Pension Taxation Issues.
35. According to the Department of Finance, the reduction of the SFT from EUR 5.4 million to EUR 2.3 gave rise to a situation where about 1,200 individuals with pension funds of values between EUR 2.3 million and EUR 5.4 million applied for a PFT.
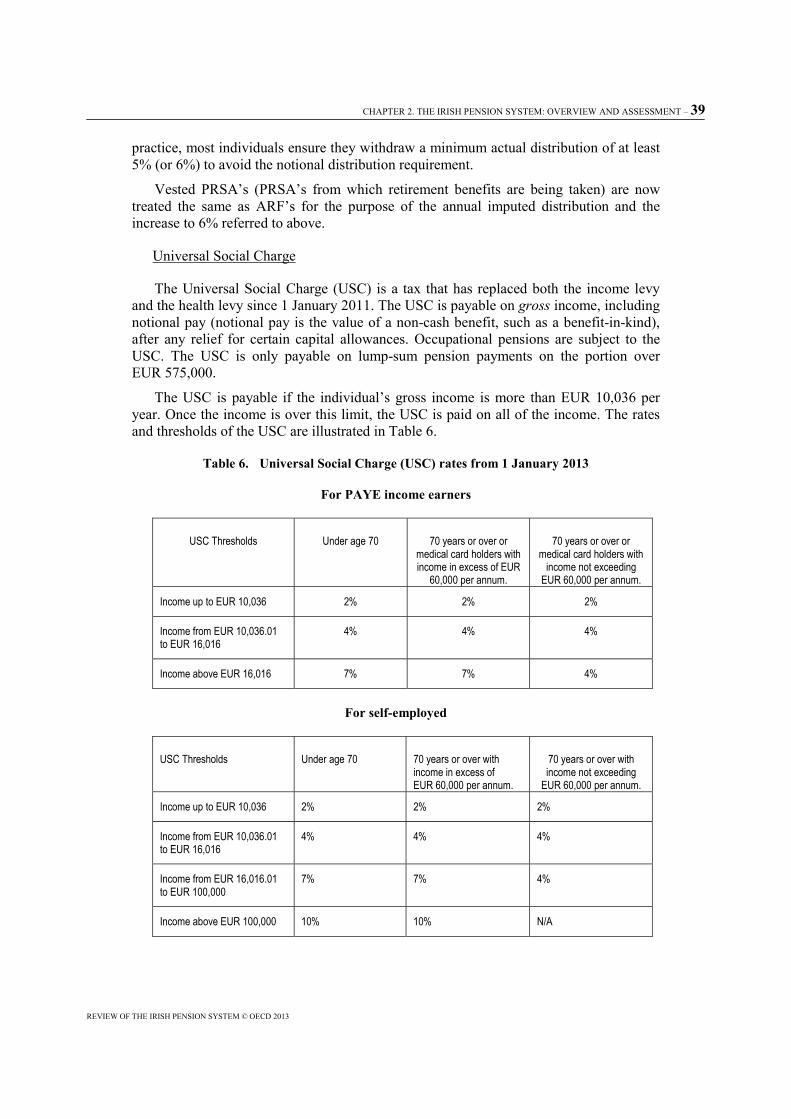
CHAPTER 2. THE IRISH PENSION SYSTEM: OVERVIEW AND ASSESSMENT – 39
REVIEW OF THE IRISH PENSION SYSTEM © OECD 2013
practice, most individuals ensure they withdraw a minimum actual distribution of at least 5% (or 6%) to avoid the notional distribution requirement.
Vested PRSA’s (PRSA’s from which retirement benefits are being taken) are now treated the same as ARF’s for the purpose of the annual imputed distribution and the increase to 6% referred to above.
Universal Social Charge
The Universal Social Charge (USC) is a tax that has replaced both the income levy and the health levy since 1 January 2011. The USC is payable on gross income, including notional pay (notional pay is the value of a non-cash benefit, such as a benefit-in-kind), after any relief for certain capital allowances. Occupational pensions are subject to the USC. The USC is only payable on lump-sum pension payments on the portion over EUR 575,000.
The USC is payable if the individual’s gross income is more than EUR 10,036 per year. Once the income is over this limit, the USC is paid on all of the income. The rates and thresholds of the USC are illustrated in Table 6.
Table 6. Universal Social Charge (USC) rates from 1 January 2013
For PAYE income earners
USC Thresholds Under age 70 70 years or over or medical card holders with income in excess of EUR
60,000 per annum.
70 years or over or medical card holders with
income not exceeding EUR 60,000 per annum.
Income up to EUR 10,036 2% 2% 2%
Income from EUR 10,036.01 to EUR 16,016
4% 4% 4%
Income above EUR 16,016 7% 7% 4%
For self-employed
USC Thresholds Under age 70 70 years or over with income in excess of EUR 60,000 per annum.
70 years or over with income not exceeding
EUR 60,000 per annum.
Income up to EUR 10,036 2% 2% 2%
Income from EUR 10,036.01 to EUR 16,016
4% 4% 4%
Income from EUR 16,016.01 to EUR 100,000
7% 7% 4%
Income above EUR 100,000 10% 10% N/A

40 – CHAPTER 2. THE IRISH PENSION SYSTEM: OVERVIEW AND ASSESSMENT
REVIEW OF THE IRISH PENSION SYSTEM © OECD 2013
Key pension changes in the 2013 Budget
The government announced a number of proposed changes to pensions in the recent budget. The Budget and Finance Act 2013 confirmed that the current SFT would remain at EUR 2.3 million for 2013. However, it noted that changes would be implemented in 2014 that will cap taxpayer subsidies for pension schemes which deliver pension income of more than EUR 60,000 per annum (which would be equivalent to an SFT of EUR 2 million using the current conversion factor of 20).36 According to the IAPF, this cap would save the state over EUR 400 million per year and would affect around 27,000 pension savers, typically employees earning in excess of EUR 125,000 per annum.37
Pension holders will be allowed a once-off opportunity to access up to 30% of their AVCs. This option will be available for three years from the passing of Finance Bill 2013. Any withdrawals will be subject to the individual’s marginal rate of tax.
The reduced rates of USC (for people aged 70 years and over and medical card holders under 70) will only apply to people earning EUR 60,000 or less.
2.4. Pensions for public sector workers
There are three main groups of public sector pension schemes: 1) Pensions which are funded directly by the Exchequer; 2) Local Authority Pensions funded through the Local Government Fund; and 3) Commercial State Companies which tend to have their own specific pension funds. Almost all of the schemes in the first two groups are PAYG, while virtually all of those in the third group are funded. For staff hired before 2013 there is no single pension scheme for workers in group 1, however, each area within the group (e.g. the civil service, the health service, judiciary and security services) has their own schemes.
Public service pension schemes are set in specific legislation and major changes to the schemes require legislation passed by the Oireachtas. The Department of Public Expenditure and Reform has overall responsibility for the policy and financing of public service pensions.
The schemes for public sector workers are typically of the DB type. For each year of pensionable service, public servants in Ireland accrue a retirement pension of 1/80th of pensionable remuneration (or of net remuneration for public servants in the full Pay- Related Social Insurance class) and a retirement lump-sum of 3/80ths of pensionable remuneration.
Retirement ages differ between the different groups of public servants. Similarly, different categories of public servants pay different social insurance contributions. A declining minority pay a lower rate of PRSI than applies to (public and private) employees in general and as such, do not qualify for a range of social insurance benefits. Public servants generally pay a personal pension contribution of around 5% net.
36. The structure for calculating any SFT linked to the new EUR 60,000 pension limit still needs to
be examined. The conversion factor may therefore not stay at its current level of 20.
37. See the IAPF press release of 22 October 2012 (www.iapf.ie/newspress/iapfpressreleases/2012/default.aspx?iid=457).

CHAPTER 2. THE IRISH PENSION SYSTEM: OVERVIEW AND ASSESSMENT – 41
REVIEW OF THE IRISH PENSION SYSTEM © OECD 2013
Since 1995, all new-entrant public servants are subject to full PRSI, thus giving them an entitlement to State pensions.38 This means that the State pension and the occupational pension entitlements are integrated, so that the occupational pension is reduced by the amount of the State pension. Accordingly, these public servants pay a lower contribution to the occupational pension scheme and receive a lower level of occupational benefit in return (see Box 3).
Box 3. Calculation of the pension for public servants
The Annual Pension is calculated differently for staff appointed after the 6th April 1995 (called the “co-ordinated staff”) and for a majority of those appointed before that date (called the “non-coordinated staff”). For the co-ordinated staff, the pension is computed in the following way:
Annual Pension = Pensionable Service x 1/80 x (Pensionable remuneration – (3. 333333 x annual rate of maximum SPC) + Pensionable Service x 1/200 x (3. 333333 x annual rate of maximum SPC)
For the uncoordinated staff, the annual pension is instead computed as follows:
Annual Pension= 1/80 x Pensionable pay x Pensionable Service.
In order to illustrate the difference, take the example of someone retiring at age 65. Let us assume that this person has a yearly pensionable remuneration of EUR 50,000 and a pensionable service of 40 years. We calculate the pensions in two situations: a) in the first case, the person was appointed before the 6 April 1995 and; b) in the second case the person was appointed after the 6 April 1995 and hence his pension is integrated.
In the first case, the pension will amount to EUR 25,000 yearly – computed as 50,000 x 40x 1/80.
In the second case, the pension will still be EUR 25,000. But it will consist of two parts, the first is the State pension (contributory) which might amount to EUR 12,017.05 based on the Class A PRSI paid contributions. The second component is the occupational pension, which amounts to EUR 12,983.(1)
---------------------------------
1. Computed as 40 x 1/200 x (12017 x 3.333) + 40 x 1/80 x (50,000-(12,017 x 3.3333) = 12,983 EUR. See also www.cspensions.gov.ie/Post95EstablishedCalculator.asp.
2.4.1. Recent reforms of public service pensions in Ireland
In recent years, there have been a number of important changes to public service pensions in Ireland, which have already introduced several elements of integration and harmonisation between pension provision for public and private sector workers.
Since 1995, as explained above, all newly recruited established civil and public servants are subject to full PRSI which gives entitlements to the State pensions.
In 2004, the pension age for new entrants to the public service was increased from 60 to 65 years. A cost-neutral early retirement scheme with actuarially reduced benefits was also introduced.
In 2009, a pay cut was applied to the remuneration of public servants, a significant measure to reduce expenditures which is reviewable annually. This deduction applies to
38. Their benefits are thus “co-ordinated” with Social Welfare entitlements.

42 – CHAPTER 2. THE IRISH PENSION SYSTEM: OVERVIEW AND ASSESSMENT
REVIEW OF THE IRISH PENSION SYSTEM © OECD 2013
remunerations accruing from 1 March 2009 at the rates decided by the Government (see Table 7). The deduction is applicable on all income, pensionable and otherwise (overtime, allowances or any other like payment). It is additional to any other pension contribution but the Act specifically states that no pension entitlements derive from it. The cuts, which reduce the pay of serving public servants by some 7% on average, does not apply to a pension or pension lump-sum. Moreover following its implementation, public servants are contributing 10 to 15% of salary, which is higher relative to average private sector contribution.
Table 7. Pay cut rates
Public servants with basic salary not over EUR 125,000 Amount of remuneration Rate of deductionUp to EUR 30,000 5%> EUR 30, 000 and < EUR 75,000 7.5%> EUR 75,000 and < EUR 125,000 10% Public servants with basic salary over EUR 125,000 ≥ EUR 125,000 and < EUR 165,000 8%≥ EUR 165,000 and < EUR 200,000 12%≥ EUR 200,000 15%
Source: Financial Emergency Measures in the Public Interest (No.2) Act 2009, Number 41 of 2009.
The Financial Emergency Measures in the Public Interest Act 2010 contained again several emergency financial measures, including a reduction of public service pension costs. In January 2011, a pension reduction was introduced across all areas of the public service. A once-off cut was applied to the gross annual pension of pensioners and to the pensions of those retiring until the end of the grace period.
At present, the Act provides for an average Public Service Pension Reduction (PSPR) of about 4% of pension, calculated in line with the following rates and bands (Table 8):
Table 8. Public Service Pension Reduction (PSPR) rates and bands
Annual public service pension Reduction rateBelow EUR 12,000 Exempt
> EUR 12 ,00 and up to EUR 24,000 6%> EUR 24,000 and up to EUR 60,000 9%
> EUR 60,000 and up to EUR 100, 000 12%Above EUR 100,000 20%
Source: Financial Emergency Measures in the Public Interest (Amendment) Act 2011.
Pensions coming into payment, after the grace period ended in February 2012, were on average 7% lower due to the pay reduction for public servants (see above).
In November 2011, a series of measures were taken to reduce the pension expenditures for top-level appointments in the public service (such as the pension deduction of 20% for pensions above EUR 100,000), including provisions to prevent pension payments before the minimum pension age.
Since January 2013, a new Single Public Service Pension Scheme (the “Single Scheme”) for new public servants (e.g. civil and public servants, the President, members of Parliament, Judiciary, Defence Forces, police, etc.) is in place for new entrants to the
CHAPTER 2. THE IRISH PENSION SYSTEM: OVERVIEW AND ASSESSMENT – 43
REVIEW OF THE IRISH PENSION SYSTEM © OECD 2013
public service. This reform is part of the programme of measures agreed with the Troika. Main features of the new scheme include:
• Benefits will be based on career-average earnings rather than final salary; valorisation of accrued pension rights will be based on the CPI;
• New pension age of 66 (linked to State pension age, so rising progressively to 67 and 68);
• Maximum retirement age of 70;
• Post-retirement increases for existing pensioners and serving staff may be linked to the CPI rather than to average earnings; the Public Service (Croke Park) Agreement provides that this will be considered as part of the general discussions on pay and other issues.39
Estimates provided by the Department for Public Expenditure and Reform show that the average annual pension cost for new entrants under the single scheme will be reduced by around 35%. New entrants to the scheme who currently benefit from fast accrual40, groups who are routinely awarded notional added years and highly paid public servants who are promoted late-career will be more affected by the changes than lower paid public servants.41
These changes are expected to save EUR 1.8 billion annually (in 2010 terms) – or 35% of expenditures, with about EUR 1 billion (55% of savings) coming from career averaging, EUR 300 million (17%) from increases in the pension age and EUR 500 million (28%) from changes to the indexation system.
As all currently serving public servants are excluded from the new rules, the effect on expenditures will not be felt until new entrants retire. Given the considerable economic uncertainty facing the Irish economy at the moment, it is difficult to provide estimates of likely public pension expenditure evolution in the future.
2.5. How has the Irish pension system been performing?
One aim of any pension system is to provide adequate retirement income to the elderly. How successful has the Irish pension system been in meeting this objective?
39. In the old scheme, pension indexation was linked to the pay scale of current officers (parity pay),
meaning that increases in the salaries of a particular categories were reflected in same rate pension increases.
40. For certain public servants, including the President, qualifying and designated officeholders, the Judiciary, Oireachtas Members and those who must retire earlier than other public servants, such as Gardaí, Permanent Defence Force members, prison officers and fire-fighters, higher accrual rates and contributions apply.
41. The uniformed services (police, military, prison service and full-time fire-fighters) retain their early retirement arrangements, with adjustments that provide for even accrual throughout their careers. In addition, there will be a reduction in ‘fast accrual’ terms for judges and parliamentary members, but the new scheme provides for a doubled rate of accrual together with a doubled rate of contribution (13%) for all new entrants to these offices.

44 – CHAPTER 2. THE IRISH PENSION SYSTEM: OVERVIEW AND ASSESSMENT
REVIEW OF THE IRISH PENSION SYSTEM © OECD 2013
2.5.1. Evolution of State pension provision Pensions are usually increased on an annual basis, decided by Government in the
context of the annual budget.
Both average claim values of the State pension (contributory) and State pension (transition) have been increasing over the past decade as Figure 5 illustrates for the period 2001-2012.
Figure 5. The State pension in Ireland, 2001-2010
Source: Based on data provided by Department of Social Protection (2013).
The value of the State pension has not only been increasing in nominal terms but also in real terms, and relative to average earnings (see Figure 6).
Figure 6. State pension (contributory) over time in real terms and current prices
Using the OECD average wage measure, the value of the full-rate contributory State pension rose from 30.5% of average earnings in 2002 to 37.7% by 2009. In nominal terms the benefit increased by around EUR 138, i.e. around 1.5 times over the period between 1995 and 2011. It has remained frozen at EUR 230.3 since 2009, equivalent to 36.5% of AW in 2011.
An important indicator, which provides information about the degree to which retirees see their pre-retirement living standards preserved through the pension system, is the pension replacement rate, i.e. the ratio of the pension benefit to previous earnings. This indicator is illustrated in Figure 7 for Ireland and some other OECD countries that have similar basic components in their pension systems. The chart suggests that the replacement rate delivered by the Irish basic pension scheme compares favourably with those of basic schemes in the other countries. Only New Zealand had a higher
€
€50
€100
€150
€200
€250
2001 2002 2003 2004 2005 2006 2007 2008 2009 2010 2011 2012
SPC, average claim value
€
€50
€100
€150
€200
€250
2001 2002 2003 2004 2005 2006 2007 2008 2009 2010 2011 2012
SPT, Average Claim Value
0
50
100
150
200
250
Current prices 1995 Prices

CHAPTER 2. THE IRISH PENSION SYSTEM: OVERVIEW AND ASSESSMENT – 45
REVIEW OF THE IRISH PENSION SYSTEM © OECD 2013
replacement rate in 2010. But among all OECD countries with a basic pension component, only Ireland and New Zealand do not have additional mandatory or quasi-mandatory pension arrangements (which explains the overall higher replacement rates in most of the other countries).
Figure 7. Replacement rates in international comparison
Note: The Pension Replacement rates illustrated in the figure are gross pension replacement rates for average wage earners. They are prospective in the sense that they refer to individuals who entered the labour market in 2010 (when they were 20) and remain there until they reach the normal retirement age in the country. All the changes in pension systems legislated that will affect future cohorts are fully taken into account in the estimation.
Source: OECD Pension Models 2010.
The vast majority of Irish pensioners are now receiving the contributory component with the number receiving the non-contributory component remaining very constant over time (Figure 8). In 2001, 34.4% of pensioners received the contributory component, and an additional 29.1% received the transition pension. By 2010, this had changed to 71.2% receiving the contributory and only 2.6% receiving the transition pension.42 There is a substantial gender difference in the receipt of public retirement benefits: while 64% of men under 70 receive a State pension (contributory), 58% of women in the same age range receive a non-contributory pension.
A number of modifications of the State pensions have been enacted and some of these are fully operational since April and September 2012 as outlined above. The Actuarial Review estimates the impact of these changes for individuals retiring in 2020 and finds that these will reduce both the number of pensioners getting the full value and the amount they receive.
42. These changes are linked to structural modifications of the pension system and procedures.
Retirement pension (RT) was paid for life prior to 2006. However, there was a change in procedures in 2006 with customers being moved onto appropriate payments. Therefore, those who became eligible for State pension contributory (SPC) were moved onto this scheme from RT at age 66, hence the percentage increase for SPC since 2006. State pension transition (SPT) was paid to those who were eligible and who retired from work at age 65. These individuals were also moved on to SPC at age 66.

46 – CHAPTER 2. THE IRISH PENSION SYSTEM: OVERVIEW AND ASSESSMENT
REVIEW OF THE IRISH PENSION SYSTEM © OECD 2013
Figure 8. Number of pensioners by types of pensions received
Source: Based on data from the Department of Social Protection (2012b).
The impacts on personal pension rate level and on the number of pensions are illustrated in Table 9 below. The data reported in the table refer “to the expected pension rate levels for a sample of circa 50,000 people all retiring in 2020 under the different policy changes considered” (see KPMG, 2012, p.99). The Actuarial Review estimates that the share of retirees with nearly complete pensions will decline over time. For example, only between 58 and 60% of individuals retiring in 2020 will receive a pension paid at a rate between 80 and 100% when the policy changes considered will be fully operational (see third and fourth columns of Table 9 labelled “(i)+(ii)+(iii)+(iv)”. For the sample considered in the review, this leads to a reduction of 20 percentage points in the share of pensions paid at a rate between 80 and 100% (column iii in Table 9 below, i.e. 50+30).
Table 9. Impact of policy changes on pension levels of retirees in 2020, pension percentage
Note: The policy changes are : i) the increase in the number of weeks from 260 to 520 of paid contributions required to qualify for a State pension (contributory) or State pension (transition); ii) The increase in the number of rate-bands for State pension (Contributory) and State pension (Transition) from September 2012 (see table below); iii) the abolition of the State pension (Transition) in 2014; iv) the move in 2020 from the current yearly averaging system to a total contributions approach; and v) Credit cap: a cap on the credited period of contributions.
Source: Based on data from the 2010 Actuarial Review, KPMG (2012), Table 11.6.
Projections based on the same source suggest also that these measures will have a larger impact on women's pensions in 2020 compared to men.
0
50,000
100,000
150,000
200,000
250,000
300,000
350,000
400,000
450,000
2001 2002 2003 2004 2005 2006 2007 2008 2009 2010 2011
State Pension (Contributory) State Pension (Transition)State Pension (Non-Contributory) Pre-Retirement AllowanceTotal
Personal pension rate level (iii) (i)+(ii) (iii) (i)+(ii)+(iii) +(iv) (i)+(ii)+(iii) +(iv) + (v)
(1) (2) (3) (4)100 50 48 50 4690-99 30 21 5 680-89 0 7 5 670-79 3 0 5 760-69 0 2 5 650-59 3 0 4 433-49 0 1 5 50 8 14 14 14no full contributions 6 6 6 6average 84 77 71 70
Policy changes (see note to the table)
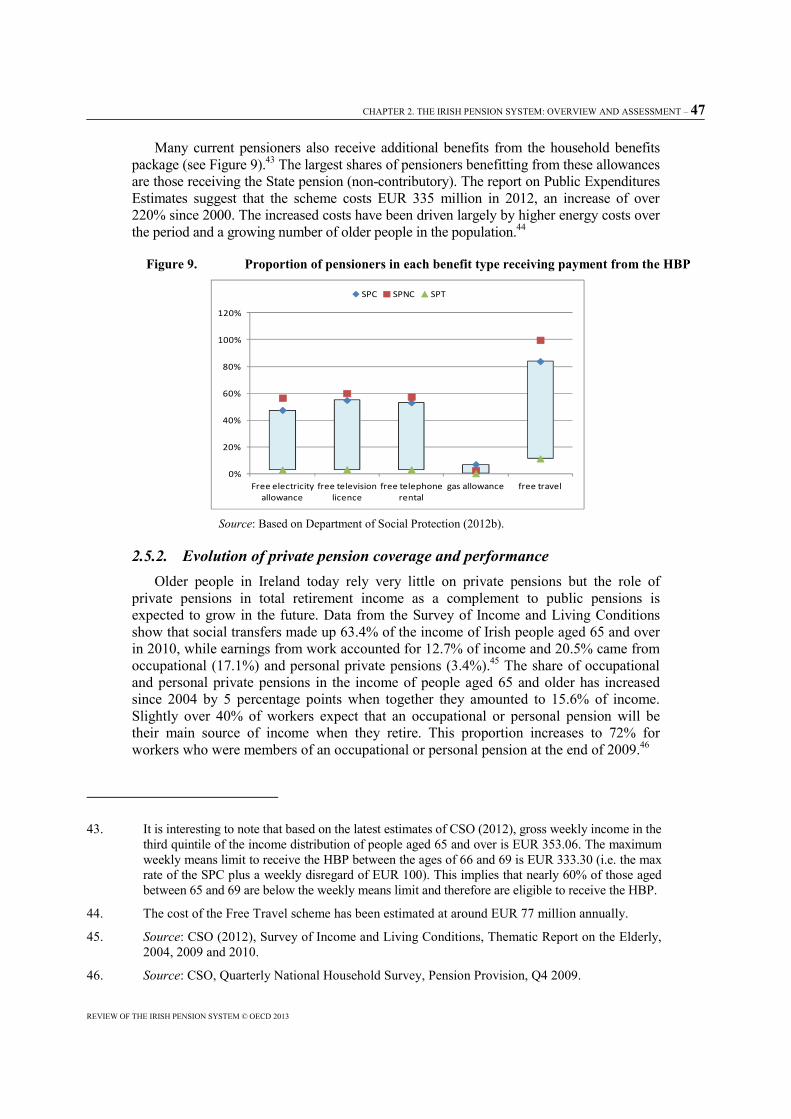
CHAPTER 2. THE IRISH PENSION SYSTEM: OVERVIEW AND ASSESSMENT – 47
REVIEW OF THE IRISH PENSION SYSTEM © OECD 2013
Many current pensioners also receive additional benefits from the household benefits package (see Figure 9).43 The largest shares of pensioners benefitting from these allowances are those receiving the State pension (non-contributory). The report on Public Expenditures Estimates suggest that the scheme costs EUR 335 million in 2012, an increase of over 220% since 2000. The increased costs have been driven largely by higher energy costs over the period and a growing number of older people in the population.44
Figure 9. Proportion of pensioners in each benefit type receiving payment from the HBP
Source: Based on Department of Social Protection (2012b).
2.5.2. Evolution of private pension coverage and performance Older people in Ireland today rely very little on private pensions but the role of
private pensions in total retirement income as a complement to public pensions is expected to grow in the future. Data from the Survey of Income and Living Conditions show that social transfers made up 63.4% of the income of Irish people aged 65 and over in 2010, while earnings from work accounted for 12.7% of income and 20.5% came from occupational (17.1%) and personal private pensions (3.4%).45 The share of occupational and personal private pensions in the income of people aged 65 and older has increased since 2004 by 5 percentage points when together they amounted to 15.6% of income. Slightly over 40% of workers expect that an occupational or personal pension will be their main source of income when they retire. This proportion increases to 72% for workers who were members of an occupational or personal pension at the end of 2009.46
43. It is interesting to note that based on the latest estimates of CSO (2012), gross weekly income in the
third quintile of the income distribution of people aged 65 and over is EUR 353.06. The maximum weekly means limit to receive the HBP between the ages of 66 and 69 is EUR 333.30 (i.e. the max rate of the SPC plus a weekly disregard of EUR 100). This implies that nearly 60% of those aged between 65 and 69 are below the weekly means limit and therefore are eligible to receive the HBP.
44. The cost of the Free Travel scheme has been estimated at around EUR 77 million annually.
45. Source: CSO (2012), Survey of Income and Living Conditions, Thematic Report on the Elderly, 2004, 2009 and 2010.
46. Source: CSO, Quarterly National Household Survey, Pension Provision, Q4 2009.
0%
20%
40%
60%
80%
100%
120%
Free electricity allowance
free television licence
free telephone rental
gas allowance free travel
SPC SPNC SPT
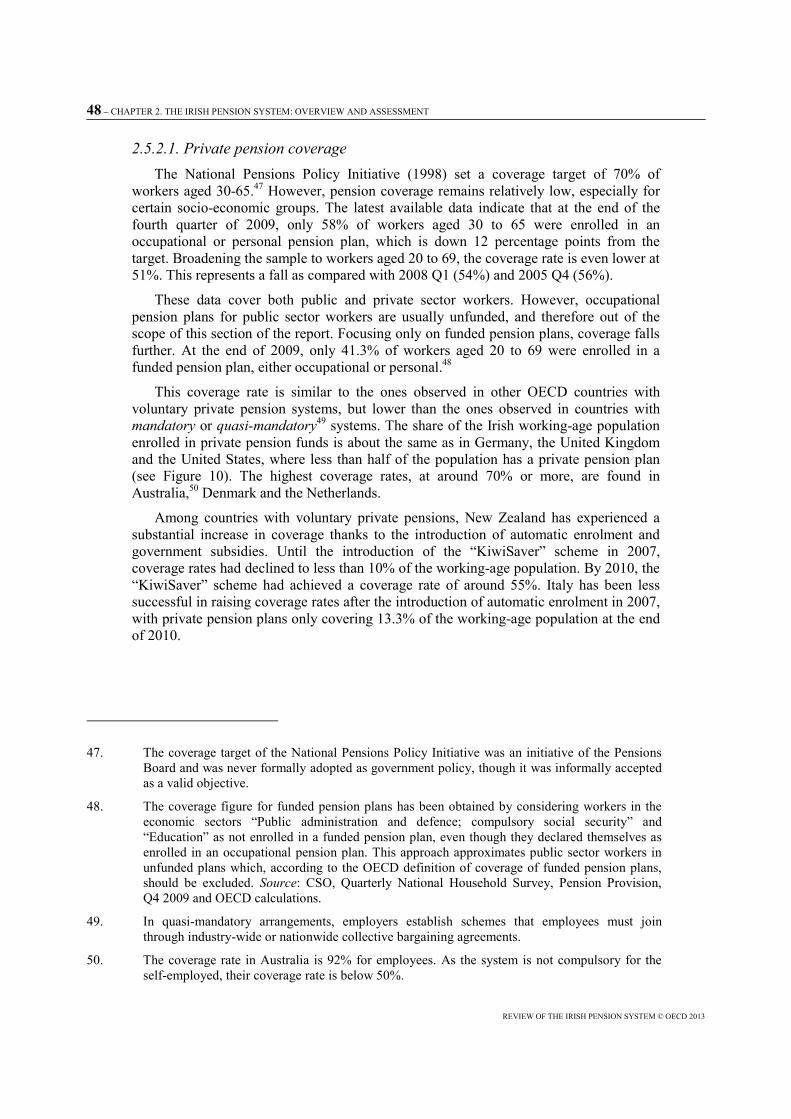
48 – CHAPTER 2. THE IRISH PENSION SYSTEM: OVERVIEW AND ASSESSMENT
REVIEW OF THE IRISH PENSION SYSTEM © OECD 2013
2.5.2.1. Private pension coverage The National Pensions Policy Initiative (1998) set a coverage target of 70% of
workers aged 30-65.47 However, pension coverage remains relatively low, especially for certain socio-economic groups. The latest available data indicate that at the end of the fourth quarter of 2009, only 58% of workers aged 30 to 65 were enrolled in an occupational or personal pension plan, which is down 12 percentage points from the target. Broadening the sample to workers aged 20 to 69, the coverage rate is even lower at 51%. This represents a fall as compared with 2008 Q1 (54%) and 2005 Q4 (56%).
These data cover both public and private sector workers. However, occupational pension plans for public sector workers are usually unfunded, and therefore out of the scope of this section of the report. Focusing only on funded pension plans, coverage falls further. At the end of 2009, only 41.3% of workers aged 20 to 69 were enrolled in a funded pension plan, either occupational or personal.48
This coverage rate is similar to the ones observed in other OECD countries with voluntary private pension systems, but lower than the ones observed in countries with mandatory or quasi-mandatory49 systems. The share of the Irish working-age population enrolled in private pension funds is about the same as in Germany, the United Kingdom and the United States, where less than half of the population has a private pension plan (see Figure 10). The highest coverage rates, at around 70% or more, are found in Australia,50 Denmark and the Netherlands.
Among countries with voluntary private pensions, New Zealand has experienced a substantial increase in coverage thanks to the introduction of automatic enrolment and government subsidies. Until the introduction of the “KiwiSaver” scheme in 2007, coverage rates had declined to less than 10% of the working-age population. By 2010, the “KiwiSaver” scheme had achieved a coverage rate of around 55%. Italy has been less successful in raising coverage rates after the introduction of automatic enrolment in 2007, with private pension plans only covering 13.3% of the working-age population at the end of 2010.
47. The coverage target of the National Pensions Policy Initiative was an initiative of the Pensions
Board and was never formally adopted as government policy, though it was informally accepted as a valid objective.
48. The coverage figure for funded pension plans has been obtained by considering workers in the economic sectors “Public administration and defence; compulsory social security” and “Education” as not enrolled in a funded pension plan, even though they declared themselves as enrolled in an occupational pension plan. This approach approximates public sector workers in unfunded plans which, according to the OECD definition of coverage of funded pension plans, should be excluded. Source: CSO, Quarterly National Household Survey, Pension Provision, Q4 2009 and OECD calculations.
49. In quasi-mandatory arrangements, employers establish schemes that employees must join through industry-wide or nationwide collective bargaining agreements.
50. The coverage rate in Australia is 92% for employees. As the system is not compulsory for the self-employed, their coverage rate is below 50%.
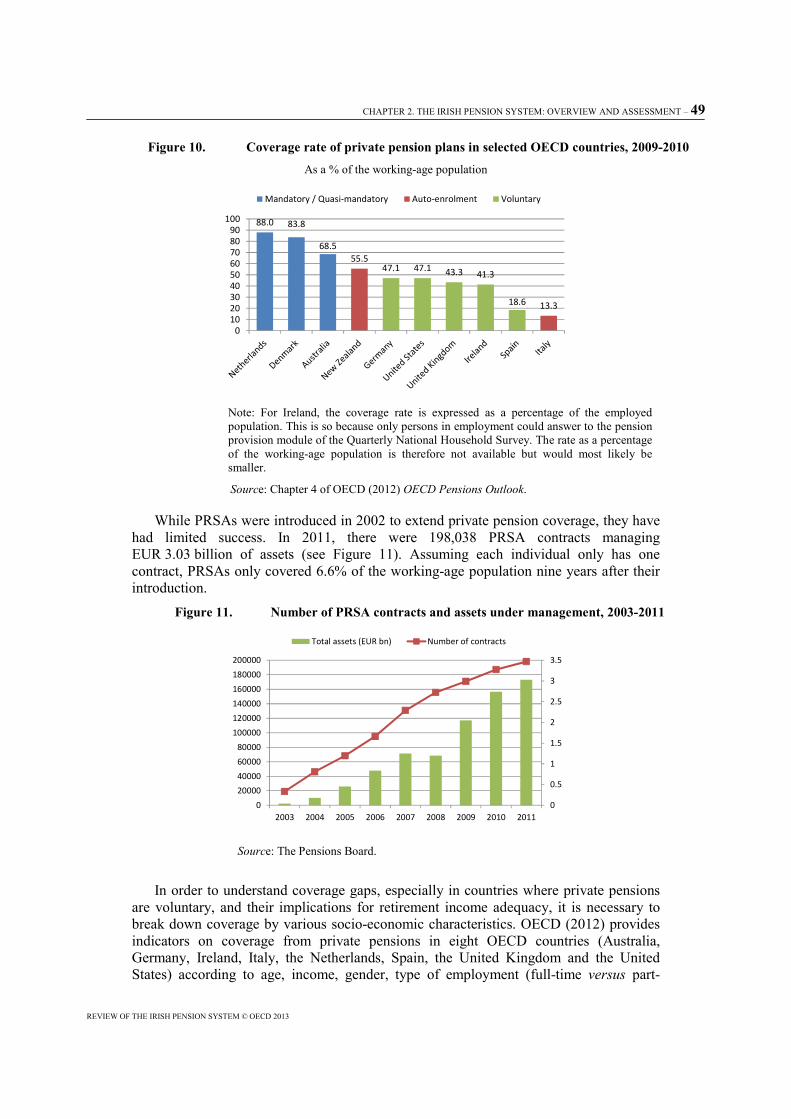
CHAPTER 2. THE IRISH PENSION SYSTEM: OVERVIEW AND ASSESSMENT – 49
REVIEW OF THE IRISH PENSION SYSTEM © OECD 2013
Figure 10. Coverage rate of private pension plans in selected OECD countries, 2009-2010 As a % of the working-age population
Note: For Ireland, the coverage rate is expressed as a percentage of the employed population. This is so because only persons in employment could answer to the pension provision module of the Quarterly National Household Survey. The rate as a percentage of the working-age population is therefore not available but would most likely be smaller.
Source: Chapter 4 of OECD (2012) OECD Pensions Outlook.
While PRSAs were introduced in 2002 to extend private pension coverage, they have had limited success. In 2011, there were 198,038 PRSA contracts managing EUR 3.03 billion of assets (see Figure 11). Assuming each individual only has one contract, PRSAs only covered 6.6% of the working-age population nine years after their introduction.
Figure 11. Number of PRSA contracts and assets under management, 2003-2011
Source: The Pensions Board.
In order to understand coverage gaps, especially in countries where private pensions are voluntary, and their implications for retirement income adequacy, it is necessary to break down coverage by various socio-economic characteristics. OECD (2012) provides indicators on coverage from private pensions in eight OECD countries (Australia, Germany, Ireland, Italy, the Netherlands, Spain, the United Kingdom and the United States) according to age, income, gender, type of employment (full-time versus part-
88.0 83.8
68.555.5
13.3
47.1 47.1 43.3 41.3
18.6
0102030405060708090
100
Mandatory / Quasi-mandatory Auto-enrolment Voluntary
0
0.5
1
1.5
2
2.5
3
3.5
0
20000
40000
60000
80000
100000
120000
140000
160000
180000
200000
2003 2004 2005 2006 2007 2008 2009 2010 2011
Total assets (EUR bn) Number of contracts
50 – CHAPTER 2. THE IRISH PENSION SYSTEM: OVERVIEW AND ASSESSMENT
REVIEW OF THE IRISH PENSION SYSTEM © OECD 2013
time), and type of contract (permanent versus temporary) using household survey data. It shows that coverage is uneven, in particular in voluntary private pension systems, with some population groups having very low enrolment rates in private pension arrangements.51
The analysis shows that younger individuals tend to be less often enrolled in privately managed funded pensions, especially in voluntary systems. In Ireland, as in other OECD countries where voluntary private pensions are prominent, coverage increases with age. In contrast, coverage is relatively constant across age groups in mandatory or quasi-mandatory private pension plans, as illustrated for Australia and the Netherlands (see Figure 12).
Coverage also increases with income, especially in voluntary systems.52 The coverage rate in voluntary private pensions generally increases with income, reaching a plateau after the 7th or 8th income deciles. In Australia and the Netherlands, when focusing on the mandatory or quasi-mandatory part of the system, the plateau is reached much earlier, after the 2nd or 3rd deciles and the coverage rate among the poorest income groups is above 65%. In voluntary systems however, the coverage among the poorest income groups is quite low, at around 15%, except in the United States where it reaches 29%.
The Irish private pension system exhibits a gap in coverage by gender, but not all countries analysed show such a gap. The largest gap is observed in the Netherlands (where the coverage rate of voluntary personal pension plans for men exceeds that for women by 16.4 percentage points), followed by Ireland (10.3 percentage points), Italy (5.4 p.p.), and Spain (3.0 p.p.). In Germany, the United Kingdom and the United States, the difference in coverage between men and women is negligible (see Figure 13).
The gender difference in Ireland may be explained by the large gap in coverage between full-time and part-time workers. Figure 14 shows that full-time workers in Ireland are more often enrolled in private pension plans than part-time workers (25.4 p.p. difference). In addition, data from the QNHS show that women tend to be more often in part-time jobs (in 37.1% of the cases) than men (11.5%). The difference in coverage between part-time workers and full-time workers is also large in the United Kingdom and Australia.
Finally, the coverage rate is lower for workers having a temporary contract than for workers having a permanent contract in all the countries for which this information is available.53 The difference is particularly important in Germany, the Netherlands, and Spain where the coverage rate of workers having a permanent contract is at least 17 percentage points higher than the one of workers having a temporary contract. The lower coverage rate of workers with temporary contracts can also partially explain why younger individuals tend to be less often covered than their elders as, in all the countries analysed, the proportion of workers having temporary contracts decreases with age.
51. This section draws on Antolin, Payet and Yermo (2012) and on the Chapter 4 of OECD (2012).
See also Antolin and Whitehouse (2009) and OECD (2009).
52. The breakdown of coverage by income is not available for Ireland, but 2004 data using the EU-SILC survey also show an increase of coverage with income (Source: The Pensions Board, 2006, Special Savings for Retirement, Table 4.2.1).
53. The breakdown of coverage by type of contract is not available for Ireland.

CHAPTER 2. THE IRISH PENSION SYSTEM: OVERVIEW AND ASSESSMENT – 51
REVIEW OF THE IRISH PENSION SYSTEM © OECD 2013
Figure 12. Coverage rate of private pension plans according to age As a % of total labour force
Note: Coverage rates are provided with respect to the total labour force for all countries except Ireland for which coverage rates are provided with respect to total employment. This is so because only persons in employment could answer to the pension provision module of the Irish Quarterly National Household Survey.
Source: Chapter 4 of OECD (2012).
23.4
52.7
63.555.3
31.6
0.0
10.0
20.0
30.0
40.0
50.0
60.0
70.0
80.0
90.0
100.0
20-24 25-34 35-44 45-54 55-64
Germany
11.9
42.2
56.8 62.1 55.3
0.0
10.0
20.0
30.0
40.0
50.0
60.0
70.0
80.0
90.0
100.0
16-24 25-34 35-44 45-54 55-64
United Kingdom
13.1
38.847.7 46.6 43.7
0.0
10.0
20.0
30.0
40.0
50.0
60.0
70.0
80.0
90.0
100.0
20-24 25-34 35-44 45-54 55-69
Ireland
15.5
51.862.7
69.773.8
0.0
10.0
20.0
30.0
40.0
50.0
60.0
70.0
80.0
90.0
100.0
16-24 25-34 35-44 45-54 55-64
United States
67.9
82.8 80.7 82.5
70.9
4.914.4
26.7
41.2 43.1
0.010.020.030.040.050.060.070.080.090.0
100.0
15-24 25-34 35-44 45-54 55-64
Australia
Mandatory Voluntary
7.6
16.021.8
26.1 26.4
0.0
10.0
20.0
30.0
40.0
50.0
60.0
70.0
80.0
90.0
100.0
15-24 25-34 35-44 45-54 55-64
Italy
59.5
93.7 94.4 92.2 95.2
14.8 21.8
38.7 38.7
0.010.020.030.040.050.060.070.080.090.0
100.0
15-24 25-34 35-44 45-54 55-64
Netherlands
Quasi-mandatory Voluntary
0.58.4
26.0
37.0 42.5
0.0
10.0
20.0
30.0
40.0
50.0
60.0
70.0
80.0
90.0
100.0
16-24 25-34 35-44 45-54 55-64
Spain

52 – CHAPTER 2. THE IRISH PENSION SYSTEM: OVERVIEW AND ASSESSMENT
REVIEW OF THE IRISH PENSION SYSTEM © OECD 2013
Figure 13. Coverage rate of private pension plans according to gender As a % of total labour force
Notes: Coverage rates are provided with respect to the total labour force for all countries except Ireland for which coverage rates are provided with respect to total employment. This is so because only persons in employment could answer to the pension provision module of the Irish Quarterly National Household Survey. M means “Mandatory”, QM means “Quasi-mandatory” and V means “Voluntary”.
Source: Chapter 4 of OECD (2012).
Figure 14. Coverage rate of private pension plans according to the type of employment As a % of total labour force
Note: Coverage rates are provided with respect to the total labour force for all countries except Ireland for which coverage rates are provided with respect to total employment. This is so because only persons in employment could answer to the pension provision module of the Irish Quarterly National Household Survey. M means “Mandatory” and V means “Voluntary”.
Source: Chapter 4 of OECD (2012).
The analysis of average contribution levels of people enrolled in private pension plans for Ireland and the other countries surveyed shows that contributions are higher in
75.9
25.5
51.7 46.0
23.3
94.7
37.6
23.9
48.056.2
80.2
23.8
51.6
35.7
17.9
90.5
21.2 20.9
48.557.2
0.010.020.030.040.050.060.070.080.090.0
100.0
Men Women
86.4
29.3
57.8
47.2
22.5
55.9
71.0
17.8
53.4
21.8 17.824.3
0.0
10.0
20.0
30.0
40.0
50.0
60.0
70.0
80.0
90.0
100.0
Australia (M)
Australia (V) Germany Ireland Spain United Kingdom
Full-time Part-time
CHAPTER 2. THE IRISH PENSION SYSTEM: OVERVIEW AND ASSESSMENT – 53
REVIEW OF THE IRISH PENSION SYSTEM © OECD 2013
occupational plans than in personal plans, most likely due to employers usually contributing to occupational pension plans, but not to personal pension plans. In addition, average contribution levels increase with age and income, and are higher for men and full-time workers than for women and part-time workers. While being enrolled in a private pension plan, relatively low contribution levels may therefore lead some groups of individuals not to accumulate enough to reach an adequate pension at retirement.
2.5.2.2. Underfunding and the gradual demise of DB plans The funding situation of DB plans has worsened since the financial crisis. According
to the Pensions Board, as many as 80% of DB schemes are in deficit.54 In comparison, in 2007, nearly 73% of DB plans satisfied the funding standard at the most recent actuarial funding certificate. LCP in its latest report estimates the funding level as of December 2011 at 86% and an aggregate pension deficit of EUR 10 billion at 30 September 2012 for the schemes analysed in its sample.55
In 2011, over three quarters (76%) of the Irish companies surveyed had already closed their DB schemes to new members and another 8% were considering it likely according to the IAPF DB survey.56 In addition, according to the Pensions Board, as at April 2012, of the 993 registered DB schemes, 115 were frozen and 20 were in wind-up.57
2.5.2.3. Charges in DC plans The Department of Social Protection commissioned a study in 2012 with the aim of
gathering information on the level of pension charges levied on pension arrangements in Ireland and to compare them with international benchmarks.58 The report shows that there is a wide range of possible pension charges among Irish pension arrangements (e.g. annual asset management charges, contribution charges, policy fees or exit penalties). In order to assess the impact of these charges on the pension value of members and compare them across products, the report uses a reduction-in-yield approach. The reduction in yield is a single percentage figure used to express the impact of all charges on a pension policy over a period of time. It sets out the reduction in the yield (or return) that would otherwise have been provided if the policy carried no charge at all. Results presented below focus on the reduction in yield to maturity, which calculates the cumulative impact of pension charges assuming that an individual saver continues to make contributions through to retirement age.59
Findings suggest that occupational pension schemes in Ireland compare favourably to international benchmarks. The average Irish occupational scheme reduction in yields (in relation to disclosed costs only) ranges from 0.52% to 0.91% (DC insured schemes of
54. Statement made by the Chief Executive of the Pensions Board at the occasion of the launch of
the Pensions Board’s Annual Report and Accounts 2011 (22 June 2012).
55. Source: LCP Ireland, Pensions Accounting Briefing 2012.
56. The IAPF survey is on a small sample of schemes which may not be representative.
57. Source: The Pensions Board Annual Report and Accounts 2011 (Table 3, p.12).
58. Department of Social Protection, Report on Pension Charges in Ireland 2012.
59. It should be noted that although reduction-in-yield calculations provide a good basis for comparison between products, they will vary depending upon the assumptions used. This may include an assumed age profile and contribution level/frequency.

54 – CHAPTER 2. THE IRISH PENSION SYSTEM: OVERVIEW AND ASSESSMENT
REVIEW OF THE IRISH PENSION SYSTEM © OECD 2013
various sizes) and from 0.30% to 0.58% (DC non‐insured schemes of various sizes). They compare favourably to the equivalent reduction in yields calculated for UK Stakeholder pensions (1% and 1.63%) and the typical charging structure for standard PRSAs (1.27% to 1.57%). Irish DC occupational pension schemes identified higher costs than the new UK NEST pension scheme from an individual members’ perspective. The UK NEST scheme is set up specifically to provide a low-cost pension scheme to members and has an equivalent reduction in yield of 0.42% per annum.
The research indicates that smaller occupational pension schemes can incur a higher level of costs than that experienced by larger schemes. This is likely to arise because of efficiencies of scale and the negotiating power of trustees with larger contributions and asset values. The nature of employment could also partially explain higher costs for smaller occupational schemes. Usually individuals working for smaller employers tend to be lower paid, work more often on casual or part-time grounds and have lower levels of financial literacy. This leads to higher base costs of operation for a lower average account balance.
Finally, individual pension arrangements are generally expensive. Where maximum commission arrangements apply, the associated reduction in yields for Retirement Annuity Contracts and Executive Pension Plans are high relative to external benchmarks. The average reduction in yield for a Retirement Annuity Contract or an Executive Pension Plan on maximum commission is 1.97%.
The conclusion on pension charges in Ireland is two-fold: i) the Irish pension industry charges are not too costly compared with other countries’ benchmarks for large DC occupational schemes; but ii) they are rather expensive for small occupational schemes and personal pension schemes.
2.5.2.4. Derisking and investment performance The current financial and economic crisis has highlighted the importance of
investment risk for pension systems. At the end of 2011, pension fund assets in most OECD countries had climbed back above the level managed at the end of 2007. Some countries, however, have not recovered completely from the 2008 losses, including Ireland. Thus, Irish pension fund assets at the end of 2011 only represented 83% of the level managed at the end of 2007 (see Figure 15). Considering that the ISEQ (the Irish Stock Exchange index) gained 17% in 2012, it is expected that the drop in pension fund assets will have been further reduced in 2012.

CHAPTER 2. THE IRISH PENSION SYSTEM: OVERVIEW AND ASSESSMENT – 55
REVIEW OF THE IRISH PENSION SYSTEM © OECD 2013
Figure 15. Total value of Irish occupational pension schemes, 2002-2011 In EUR billion
Source: IAPF investment surveys.
Irish pension managed funds delivered positive returns during 2012, at 14.4% on average (Table 10). The average managed fund return has been a healthy 7.1% per annum over the past three years. However, half of the five-year returns are negative, with an average return of -0.5% per annum over this period, led by an average decline of 34.8% during 2008. Irish pension managed-fund returns over the past ten years have been 4.9% per annum on average, compared with the Irish inflation rate of 1.8% per annum over the same time horizon.
Table 10. Group pension managed fund returns to 31 December 2012
Source: Finfacts.ie.
As shown in Figure 16, within the OECD, Irish plans displayed the greatest exposure to equities in 2011, at 52.7%. Other OECD countries with large allocations to equities include Australia (49.7%), the United States (48.1%) and Finland (41.3%). In all these countries, equities outweigh bonds in pension fund portfolios.
44.8
55.562.3
77.9
87.7 86.6
63.5
72.275.5
72.3
0.0
10.0
20.0
30.0
40.0
50.0
60.0
70.0
80.0
90.0
100.0
2002 2003 2004 2005 2006 2007 2008 2009 2010 2011
EUR
billi
on
1 year%
3 years % p.a.
5 years % p.a.
10 years % p.a.
Aviva Investors 13.0 5.6 -2.8 3.8Canada Life/Setenta 14.2 7.9 1.7 5.7Friends First/F&C 13.1 6.6 -1.7 4.4Irish Life Investment Managers 13.1 5.4 -1.6 4.8Kleinworth Benson Investors 13.5 7.4 -1.7 3.8Merrion Investment Managers 16.0 6.4 0.5 5.5New Ireland 16.1 7.2 0.0 4.1Prescient Investment Managers 14.5 7.7 -1.8 4.8Standard Life Investments 17.5 9.6 1.6 6.2Zurish Life 12.9 7.0 0.8 6.3Average 14.4 7.1 -0.5 4.9

56 – CHAPTER 2. THE IRISH PENSION SYSTEM: OVERVIEW AND ASSESSMENT
REVIEW OF THE IRISH PENSION SYSTEM © OECD 2013
Figure 16. Pension fund asset allocation for selected investment categories in selected OECD countries, 2011
As a % of total investment
Notes: (1) The “Other category includes loans, land and buildings, unallocated insurance contracts, hedge funds, private equity funds, structured products, other mutual funds (i.e. not invested in cash, bills and bonds, shares or land and buildings) and other investments. (2) Source: IAPF Pension Investment Survey. (3) Source: Australian Bureau of Statistics. The high value for the “Other” category is driven mainly by net equity of pension life office reserves (15% of total investment). (4) The high value for the “Other” category is driven mainly by other mutual funds (14% of total investment). (5) The high value for the “Other” category is driven mainly by unallocated insurance contracts (22% of total investment). (6) Source: Bank of Japan. The high value for the “Other” category is driven mainly by accounts payable and receivable (25% of total investment) and outward investments in securities (20% of total investment). (7) The high value for the “Other” category is driven mainly by other mutual funds (18% of total investment). (8) The high value for the “Other” category is driven mainly by unallocated insurance contracts (31% of total investment).
* The statistical data for Israel were supplied by and under the responsibility of the relevant Israeli authorities. The use of such data by the OECD is without prejudice to the status of the Golan Heights, East Jerusalem and Israeli settlements in the West Bank under the terms of international law.
Source: OECD Global Pension Statistics.
0% 10% 20% 30% 40% 50% 60% 70% 80% 90% 100%
Ireland (2)Australia (3)
United StatesFinland
ChileBelgium
NetherlandsCanada (4)
PolandNorway
SwitzerlandAustria
PortugalIcelandMexicoItaly (5)
LuxembourgDenmark
TurkeySpain
HungaryJapan (6)
EstoniaIsrael
Germany (7)Slovenia
Slovak RepublicGreece
Czech RepublicKorea (8)
Shares Bills and bonds Cash and deposit Other (1)

CHAPTER 2. THE IRISH PENSION SYSTEM: OVERVIEW AND ASSESSMENT – 57
REVIEW OF THE IRISH PENSION SYSTEM © OECD 2013
Available data do not give a clear picture of the trends in asset allocation of Irish pension funds. While data from IAPF and LCP show a decline in equity allocations over the past years, data from the Pensions Board show a fairly flat allocation to equities. The IAPF collects every year investment data from a sample of financial institutions involved in pension fund asset management and the largest Irish pension funds.60 Their data show that, over the period 2007 to 2011, allocations in equities have declined from 66.3% to 52.7% (see Figure 17). At the end of 2011, equities accounted for about the same share of assets under management for DB (52.3%) and DC schemes (53.3%). For DB schemes, this represented a significant decline compared with 64.3% in 2009. The decline was less important for DC plans, for which equities accounted for 58.7% of assets in 2009. A recent report by LCP estimates that equity allocations declined for the largest DB pension schemes in Ireland as well.61 Asset allocations for pension funds analysed in previous LCP surveys remained virtually unchanged from 2008 to 2010, while in 2011 there was a significant reduction in exposure to equities (from 58% in 2010 to 52% in 2011). These results are however not in line with data from the Pensions Board. They collect data from all Irish DB schemes. Their data show flat equity holdings between 2008 and 2011 (52% in 2008, 54% in 2009 and 51% in 2011). Unfortunately, these data are not publicly available to be vetted.
Figure 17. Asset allocation of Irish occupational pension schemes, 2002-2011
Source: IAPF investment surveys.
60. The IAPF surveys are from a small sample of schemes which may not be representative.
61. Source: LCP Ireland, Pensions Accounting Briefing 2012.
58.0 63.0 63.1 65.0 63.4 66.352.3
62.5 58.9 52.7
27.023.5 23.5 21.5 19.7 18.5
26.1
24.1 27.030.3
10.1 8.7 7.4 8.0 9.0 9.18.4
4.2 4.4 4.2
4.4 3.8 4.7 4.5 5.5 3.810.9 6.9 7.2 8.9
0.5 1.0 1.2 0.8 2.4 2.3 2.4 2.3 2.5 4.0
0.0
10.0
20.0
30.0
40.0
50.0
60.0
70.0
80.0
90.0
100.0
2002 2003 2004 2005 2006 2007 2008 2009 2010 2011
Equities Bonds Property Cash Other

CHAPTER 3. FUTURE CHALLENGES FOR THE IRISH PENSION SYSTEM: ADEQUACY, SUSTAINABILITY, MODERNITY AND EQUITY – 59
REVIEW OF THE IRISH PENSION SYSTEM © OECD 2013
Chapter 3
Future challenges for the Irish pension system: adequacy, sustainability, modernity and equity
3.1. Introduction
Like virtually all other OECD countries, Ireland is facing the twin challenge of ensuring both the adequacy and financial sustainability of its pension system. Pension arrangements also need to comply with the requirements of modernity, which means they need to be able to adapt flexibly to demographic and labour market changes.
Pension policy has always involved balancing the adequacy of benefits with their affordability, both now and in the future. In the first instance, there is an obvious trade-off between adequacy and sustainability: higher public pensions deliver larger incomes in old age but cost more. However, if public pensions are at risk of being inadequate, there will be pressure for ad hoc increases in pensions or supplementary retirement benefits to prevent old-age poverty.
If governments delay reforms aimed at ensuring financial sustainability of pension systems, the scale of the later adjustment needed will be more sudden and painful. Such sudden changes – although sometimes inevitable under the circumstances such as in 2008-2011 – make it very difficult for individuals, especially those in mid and late careers, to change their work, retirement and savings decisions to reflect changing financial realities. Secondly, however, reductions in public pensions might leave large numbers of retirees in poverty or with inadequate income.
However, defining what exactly adequate pensions are and what is sustainable in terms of the pension system’s finances is not an easy task.
3.2. Concept of pension adequacy
Starting with the concept of “adequacy”, there is no single agreed definition of what constitutes an adequate benefit provided by a pension system. In attempting to provide a framework, it is useful to distinguish between the concepts of “broad adequacy” and “narrow adequacy”.62
Broad adequacy commonly uses the measure of pension replacement rates, i.e. the share of either life-time earnings or final earnings that the pension benefit replaces when a worker retires. Depending on the denominator, the replacement rate can show adequacy
62. See Whitehouse, D'Addio and Reilly (2011).

60 – CHAPTER 3. FUTURE CHALLENGES FOR THE IRISH PENSION SYSTEM: ADEQUACY, SUSTAINABILITY, MODERNITY AND EQUITY
REVIEW OF THE IRISH PENSION SYSTEM © OECD 2013
from a personal perspective (if related to individual earnings when working) or from a societal perspective (if related to average economy-wide earnings).
Narrow adequacy is based on the concept of income-poverty. It looks at all income in retirement and not just at pensions alone. Its drawback is that it is backward looking: today’s retirement incomes are a function of past pension parameters and rules and of the performance of the economy over the past decades.
Both definitions have close corollaries in income-distribution data: narrow adequacy with the income-poverty rate and broad adequacy with the average incomes of older people relative to those of the population as a whole. Using income-poverty to measure adequacy is relative in two ways. First, the yardstick depends on median household incomes. Secondly, the poverty thresholds are country-specific and poverty is measured against prevailing norms for living standards in a particular country at a particular time. This means that a person classified as poor in a prosperous country will have a higher income than many of the non-poor in other countries that are less prosperous overall. The general approach of measuring poverty relative to a proportion of median income, adopted by the OECD for its cross-country analysis, is widely used elsewhere: for example, in measuring the rates of poverty risk in the framework of the European Union’s social reporting system.
The link between the measures of broad and narrow adequacy can be made when focussing specifically on the situation of low-income earners. One-in-ten people, on average in EU countries, earned less than 48% of mean earnings, with one-in-four earning less than 60% of the mean and half earning less than 80% of the mean. Based on this information, one can use the replacement rates for low earners as an indicator of narrow adequacy by comparing them with risk-of-poverty thresholds.
Another way of assessing adequacy is to examine the value of the safety-net benefits provided in different countries, such as basic, targeted and minimum pensions, and compare them with a series of benchmarks: gross earnings, net earnings and risk-of-poverty thresholds. This type of investigation must be part of the toolkit when thinking about adequacy, especially narrow adequacy. Pension reforms have often resulted in substantial reductions in benefits for people starting work today compared with their parents’ and grandparents’ pensions. Moreover, inequality in earnings has been increasing over time in most OECD countries over the past two or three decades. Both developments imply that more people will be reliant on safety-net benefits in the future.
3.3. Assessment of the adequacy of pension benefits in Ireland
Older people in Ireland today rely heavily on public transfers as their main source of income. CSO (2012) reports that public transfers make up 63.4% of the household disposable income of Irish people aged 65 and over (up from 56.8% in 2004), compared with an OECD average of 59%. Public transfers include all types of cash benefits paid to older people, i.e. pensions and allowances (including the HBP). Earnings from work accounted for less than 13% of the incomes of Irish older people, on average, while nearly 6% came from private pensions, investment income and property income and 17% from occupational pensions (CSO, 2012).
The future composition of older people’s incomes in Ireland will depend not only on the evolution of State pension levels but to a great extent on how fast economic recovery will take hold, how well current workers are covered by supplementary pension
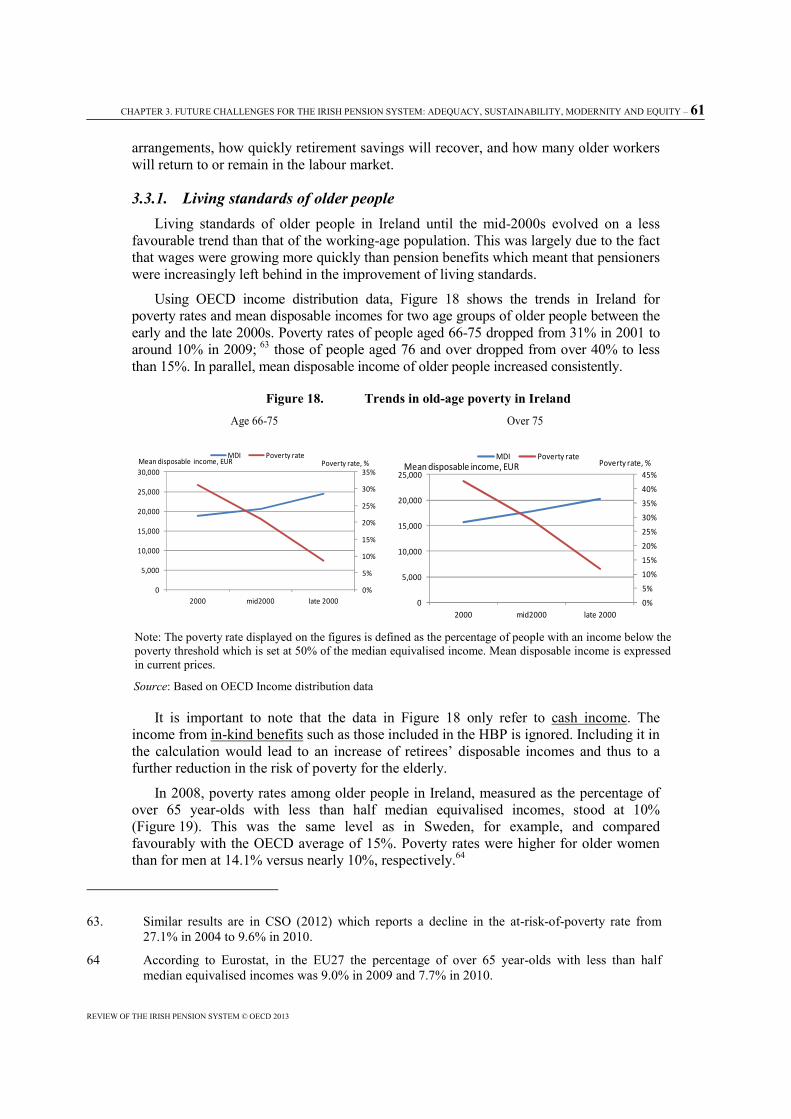
CHAPTER 3. FUTURE CHALLENGES FOR THE IRISH PENSION SYSTEM: ADEQUACY, SUSTAINABILITY, MODERNITY AND EQUITY – 61
REVIEW OF THE IRISH PENSION SYSTEM © OECD 2013
arrangements, how quickly retirement savings will recover, and how many older workers will return to or remain in the labour market.
3.3.1. Living standards of older people Living standards of older people in Ireland until the mid-2000s evolved on a less
favourable trend than that of the working-age population. This was largely due to the fact that wages were growing more quickly than pension benefits which meant that pensioners were increasingly left behind in the improvement of living standards.
Using OECD income distribution data, Figure 18 shows the trends in Ireland for poverty rates and mean disposable incomes for two age groups of older people between the early and the late 2000s. Poverty rates of people aged 66-75 dropped from 31% in 2001 to around 10% in 2009; 63 those of people aged 76 and over dropped from over 40% to less than 15%. In parallel, mean disposable income of older people increased consistently.
Figure 18. Trends in old-age poverty in Ireland
Note: The poverty rate displayed on the figures is defined as the percentage of people with an income below the poverty threshold which is set at 50% of the median equivalised income. Mean disposable income is expressed in current prices.
Source: Based on OECD Income distribution data
It is important to note that the data in Figure 18 only refer to cash income. The income from in-kind benefits such as those included in the HBP is ignored. Including it in the calculation would lead to an increase of retirees’ disposable incomes and thus to a further reduction in the risk of poverty for the elderly.
In 2008, poverty rates among older people in Ireland, measured as the percentage of over 65 year-olds with less than half median equivalised incomes, stood at 10% (Figure 19). This was the same level as in Sweden, for example, and compared favourably with the OECD average of 15%. Poverty rates were higher for older women than for men at 14.1% versus nearly 10%, respectively.64
63. Similar results are in CSO (2012) which reports a decline in the at-risk-of-poverty rate from
27.1% in 2004 to 9.6% in 2010.
64 According to Eurostat, in the EU27 the percentage of over 65 year-olds with less than half median equivalised incomes was 9.0% in 2009 and 7.7% in 2010.
Age 66-75 Over 75
0%
5%
10%
15%
20%
25%
30%
35%
0
5,000
10,000
15,000
20,000
25,000
30,000
2000 mid2000 late 2000
MDI Poverty rateMean disposable income, EUR Poverty rate, %
0%
5%
10%
15%
20%
25%
30%
35%
40%
45%
0
5,000
10,000
15,000
20,000
25,000
2000 mid2000 late 2000
MDI Poverty rateMean disposable income, EUR Poverty rate, %

62 – CHAPTER 3. FUTURE CHALLENGES FOR THE IRISH PENSION SYSTEM: ADEQUACY, SUSTAINABILITY, MODERNITY AND EQUITY
REVIEW OF THE IRISH PENSION SYSTEM © OECD 2013
Figure 19. Old-age income poverty rates, late 2000s Percentage of over 65s with incomes of less than half median equivalised population incomes
Source: OECD income distribution database.
An additional measure relates to the depth of poverty, i.e. how far the median income of the poor population is below the poverty threshold. This measure presents a less favourable picture of old-age income poverty in Ireland. For people aged 65 and over, this poverty gap index is 24.7% in Ireland compared with an OECD average of 20% and a EU-27 average of 15.7% in 2010.
Complementing the measures of income poverty are assessments of material deprivation which capture non-monetary aspects of poverty. People might have insufficient income for special needs, such as sickness and disability, which puts them at higher risks of poverty while others with low incomes may receive in-kind support from the state or their relatives; some older people may have a stock of assets that they can draw down to support their living standards in old age.
Ireland performs relatively well on the measure of deprivation for older people compiled by Eurostat using the EU-SILC database: in 2010, the Irish rate of 9.6% for people aged 65 and over is below the average for both the EU27 and the 24 OECD countries for which comparable data are available. The contrast between the older age group and people aged 18-64, however, is striking: the rates of deprivation for the Irish working-age population are higher than both the EU and OECD averages. There is also a large gender gap in material deprivation among the elderly: in 2010 deprivation rates of Irish men are 11.8%, while those of women are 6.9%.
To account for both dimensions of poverty, income and material deprivation, Ireland has developed an indicator which is termed “consistent poverty”. People with an income below 60% of the median equivalised income and lacking any two out of an 11-item inventory of basic necessities are considered as “consistent-poor” (see e.g. Callan and Nolan, 1991). In 2010, the share of people aged 65 and over who were found to be consistent poor on this definition was only 0.9%, down from 5.3% in 2003.
Moreover, in Ireland home ownership rates (without mortgage) among older people are relatively high. Estimates of disposable income which take into account the imputed income generated from home ownership are higher and result in lower poverty rates. For
0%
5%
10%
15%
20%
25%
30%
35%
40%
45%
50%
NLD LU
XCZ
EH
UN
FRA ISL
CAN
NO
RSV
KSW
EIR
LPO
LD
EUG
BRA
UT
BEL
ITA
DN
KPR
TFI
NTU
RG
RCSV
NES
PJP
NES
TIS
RU
SA CHL
NZL
CHE
MEX
AU
SKO
R
OECD average: 15%
Old age poverty rate, people aged over 65
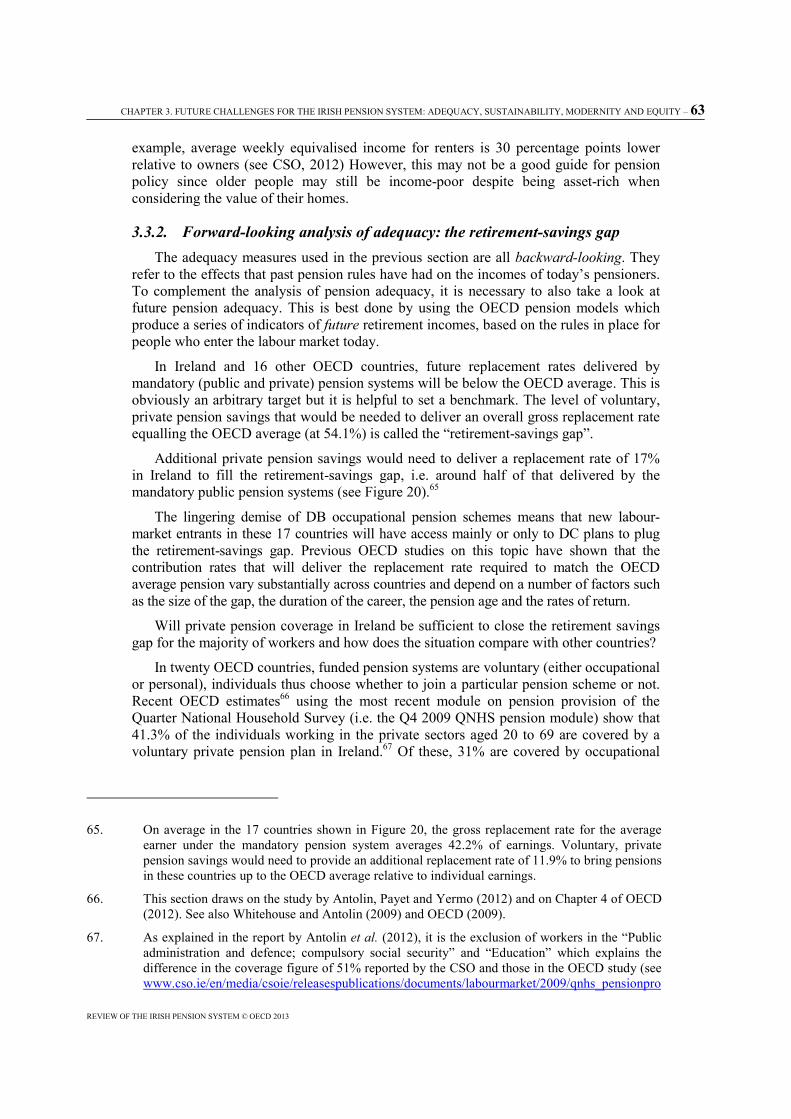
CHAPTER 3. FUTURE CHALLENGES FOR THE IRISH PENSION SYSTEM: ADEQUACY, SUSTAINABILITY, MODERNITY AND EQUITY – 63
REVIEW OF THE IRISH PENSION SYSTEM © OECD 2013
example, average weekly equivalised income for renters is 30 percentage points lower relative to owners (see CSO, 2012) However, this may not be a good guide for pension policy since older people may still be income-poor despite being asset-rich when considering the value of their homes.
3.3.2. Forward-looking analysis of adequacy: the retirement-savings gap The adequacy measures used in the previous section are all backward-looking. They
refer to the effects that past pension rules have had on the incomes of today’s pensioners. To complement the analysis of pension adequacy, it is necessary to also take a look at future pension adequacy. This is best done by using the OECD pension models which produce a series of indicators of future retirement incomes, based on the rules in place for people who enter the labour market today.
In Ireland and 16 other OECD countries, future replacement rates delivered by mandatory (public and private) pension systems will be below the OECD average. This is obviously an arbitrary target but it is helpful to set a benchmark. The level of voluntary, private pension savings that would be needed to deliver an overall gross replacement rate equalling the OECD average (at 54.1%) is called the “retirement-savings gap”.
Additional private pension savings would need to deliver a replacement rate of 17% in Ireland to fill the retirement-savings gap, i.e. around half of that delivered by the mandatory public pension systems (see Figure 20).65
The lingering demise of DB occupational pension schemes means that new labour-market entrants in these 17 countries will have access mainly or only to DC plans to plug the retirement-savings gap. Previous OECD studies on this topic have shown that the contribution rates that will deliver the replacement rate required to match the OECD average pension vary substantially across countries and depend on a number of factors such as the size of the gap, the duration of the career, the pension age and the rates of return.
Will private pension coverage in Ireland be sufficient to close the retirement savings gap for the majority of workers and how does the situation compare with other countries?
In twenty OECD countries, funded pension systems are voluntary (either occupational or personal), individuals thus choose whether to join a particular pension scheme or not. Recent OECD estimates66 using the most recent module on pension provision of the Quarter National Household Survey (i.e. the Q4 2009 QNHS pension module) show that 41.3% of the individuals working in the private sectors aged 20 to 69 are covered by a voluntary private pension plan in Ireland.67 Of these, 31% are covered by occupational
65. On average in the 17 countries shown in Figure 20, the gross replacement rate for the average
earner under the mandatory pension system averages 42.2% of earnings. Voluntary, private pension savings would need to provide an additional replacement rate of 11.9% to bring pensions in these countries up to the OECD average relative to individual earnings.
66. This section draws on the study by Antolin, Payet and Yermo (2012) and on Chapter 4 of OECD (2012). See also Whitehouse and Antolin (2009) and OECD (2009).
67. As explained in the report by Antolin et al. (2012), it is the exclusion of workers in the “Public administration and defence; compulsory social security” and “Education” which explains the difference in the coverage figure of 51% reported by the CSO and those in the OECD study (see www.cso.ie/en/media/csoie/releasespublications/documents/labourmarket/2009/qnhs_pensionpro

64 – CHAPTER 3. FUTURE CHALLENGES FOR THE IRISH PENSION SYSTEM: ADEQUACY, SUSTAINABILITY, MODERNITY AND EQUITY
REVIEW OF THE IRISH PENSION SYSTEM © OECD 2013
private pension plans, while 12% are covered by personal pension plans.68 Similar rates of coverage for occupational pension plans are reported in Canada and the United Kingdom.
Figure 20. The retirement-savings gap Gross replacement rate for an average earner from mandatory pension schemes and estimated pension gap
Note: The Pension Replacement rates illustrated in the figure are gross pension replacement rates for average wage earners. They are prospective in the sense that they refer to individuals who entered the labour market in 2010 (when they were 20) and remain there until they reach the normal retirement age in the country. All the changes in pension systems legislated that will affect future cohorts are fully taken into account in the estimation. The estimated pension gap is defined as the difference between the gross replacement rate for an average earner from mandatory pension schemes in a given country and the OECD average replacement rate.
Source: OECD Pension Models 2010.
Estimates of gross and net replacement rates broken down by the different components (i.e. voluntary mandatory, public and private) depicted in Figure 21, take into account voluntary private pensions, resulting in substantially higher gross replacement rates.69 In Ireland, using the standard OECD pension modelling assumptions,70 the
visionQ409.pdf). This approach approximates public sector workers in unfunded plans which, according to the OECD definition of coverage of funded pension plans, should be excluded.
68. The sum of the coverage rates by type of plan does not equal the coverage rate for the total as individuals may have both occupational and personal plans simultaneously.
69. The gross pension replacement rate is defined as gross pension entitlement divided by gross pre-retirement earnings. Often, the replacement rate is expressed as the ratio of the pension to final earnings (just before retirement). Here, however, pension benefits are shown as a share of individual lifetime average earnings (revalued in line with economy-wide earnings growth). Under the baseline assumptions, workers earn the same percentage of economy-wide average earnings throughout their career. In this case, lifetime average revalued earnings and individual final earnings are identical. If people move up the earnings distribution as they get older, then their earnings just before retirement will be higher than they were on average over their lifetime and replacement rates calculated on individual final earnings would be lower. The net replacement rate is defined as the individual net pension entitlement divided by net preretirement earnings, taking account of personal income taxes and social security contributions paid by workers and pensioners.
0% 10% 20% 30% 40% 50%
NorwayCzech Republic
FranceAustraliaHungaryCanada
ChilePoland
GermanyKorea
BelgiumNew ZealandUnited States
IrelandJapan
United KingdomMexico
GRR from mandatory pensions pension gap OECD avg: 54.1%
CHAPTER 3. FUTURE CHALLENGES FOR THE IRISH PENSION SYSTEM: ADEQUACY, SUSTAINABILITY, MODERNITY AND EQUITY – 65
REVIEW OF THE IRISH PENSION SYSTEM © OECD 2013
inclusion of voluntary private pensions would more than double the gross replacement rates delivered by the public pension system. This is more than in other OECD countries with a retirement savings gap. Estimates for Belgium, Canada, Germany, New Zealand, the United Kingdom and the United States, calculated under the same assumptions, suggest that private pension systems would contribute between one-fourth and one-half of the pension entitlements of future retirees. It is important to note, however, that these are calculations for purely illustrative purposes on how big retirement gaps for individual workers are in different OECD countries under the standard OECD modelling assumptions and that they do not indicate guaranteed future results of pension outcomes in Ireland or elsewhere.
However, data on coverage suggest that Ireland faces a challenge if the objective is to close the gap to the OECD average replacement rate through private pension arrangements.
Figure 21. Gross replacement rates from combined PAYG, mandatory and voluntary funded systems
Note: The Pension Replacement rates illustrated in the figure are gross pension replacement rates for average wage earners. They are prospective in the sense that they refer to individuals who entered the labour market in 2010 (when they were 20) and remain there until they reach the normal retirement age in the country. All the changes in pension systems legislated that will affect future cohorts are fully taken into account in the estimation.
* The statistical data for Israel were supplied by and under the responsibility of the relevant Israeli authorities. The use of such data by the OECD is without prejudice to the status of the Golan Heights, East Jerusalem and Israeli settlements in the West Bank under the terms of international law.
Source: OECD Pension Models
70. Standard OECD Pension Models assume the worker enters the labour market in 2010 when (s)he
is 20 and remains there until (s)he reaches the national retirement age. These results are forward-looking so they are for future retirees. For private pensions modelling, it is assumed for Ireland that workers contribute 10% to an additional voluntary pension throughout the entire working life. The pension plan is assumed to be defined-contribution, and the net real rate of return is assumed to be 3.5%.
0%
20%
40%
60%
80%
100%
120%
Mex
ico
Japa
n
Kore
a
Pola
nd
Chile
Hung
ary
Aust
ralia
Fran
ce
Esto
nia
New
Zea
land
Swed
en
Finl
and
Port
ugal
Slov
ak R
epub
lic
Gree
ce
Belg
ium
Switz
erla
nd
Germ
any
OEC
D
Slov
enia
Norw
ay
Luxe
mbo
urg
Turk
ey
Czec
h Re
publ
ic
Unite
d Ki
ngdo
m
Cana
da
Israe
l
Icel
and
Spai
n
Unite
d St
ates
Aust
ria
Denm
ark
Irela
nd
Neth
erla
nds
Italy
GRR Public GRR Mandatory and Quasi-Mandatory Private GRR Voluntary Private nrr

66 – CHAPTER 3. FUTURE CHALLENGES FOR THE IRISH PENSION SYSTEM: ADEQUACY, SUSTAINABILITY, MODERNITY AND EQUITY
REVIEW OF THE IRISH PENSION SYSTEM © OECD 2013
3.4. Concept of financial sustainability of pensions
Financial sustainability of pension systems is even more controversial as a measure than adequacy. Various proposals have been put forward to assess and achieve sustainability, using for example the internal rate of return of pay-as-you-go financed pension systems (which in ageing societies become negative and could therefore be interpreted as unsustainable) or setting absolute limits to pension spending or limiting the size of employer and employee contributions going to pension systems to a “sustainable” level and adjusting spending accordingly. There is no agreed international benchmark, however, beyond which pension spending becomes unsustainable.
What is usually targeted when discussing financial sustainability in the context of pension policy is the total cost of pensions, now and in the future. Whether taxpayers and contributors are willing and able to pay this cost is a matter of public choice. The same fiscal cost of pensions may be seen by voters as unsustainably large in some countries but acceptable in others. The financial crisis and its aftermath have added a consideration regarding the sustainability of pension systems which is particularly pertinent in the case of Ireland: the view of the international financial markets in assessing countries’ capacity to service their debt. Not surprisingly, pension reforms are part of many austerity programmes and seen as a key element in reassuring markets that future commitments to pay back explicit and implicit public debt are credible.
Financial sustainability is an obvious challenge in cases where benefits are financed on a pay-as-you-go (PAYG) basis. But it also applies to earnings-related schemes that are financed on a funded basis or are partially pre-funded. This group of schemes includes private DB schemes and public programmes with reserves. By contrast, with pure DC schemes – where benefits depend solely on the value of contributions and on the investment returns earned – financial sustainability is not an issue. At any point in time, the value of future pension liabilities is exactly the same as the value of the assets in the funds.
The most logical approach to defining financial sustainability involves some form of long-term actuarial equilibrium. This means that the pension system is in balance over time: the stream of contributions and other revenues over a suitably long horizon (50-75 years) is enough to pay for projected benefits over that period. The majority of the approaches considered impose the condition that benefits should be financed by contributions on wages. While this has conventionally been the case, there is no reason why it should be so. It makes sense to consider the two flows separately. First, what is the profile of public expenditure on pensions over time? Secondly, should this be financed by contributions or general revenues? For example, there may be concerns that pension contributions levied on payrolls – effectively a tax on wages – may have negative effects on work incentives. It might make sense instead to finance benefits out of some other revenue source: consumption taxes, for example. Pensions are de facto a matter of tax and transfer policy: taxes, paid by all age groups, and transfers, paid to older people.
3.5. Assessment of financial sustainability of the Irish pension system
Pensions involve long-term financial commitments: there are 60 years or more between the time at which people make their first pension contribution and when they draw their last pension benefit. The capacity to meet these promises is one of the most important issues in the design of retirement-income systems.
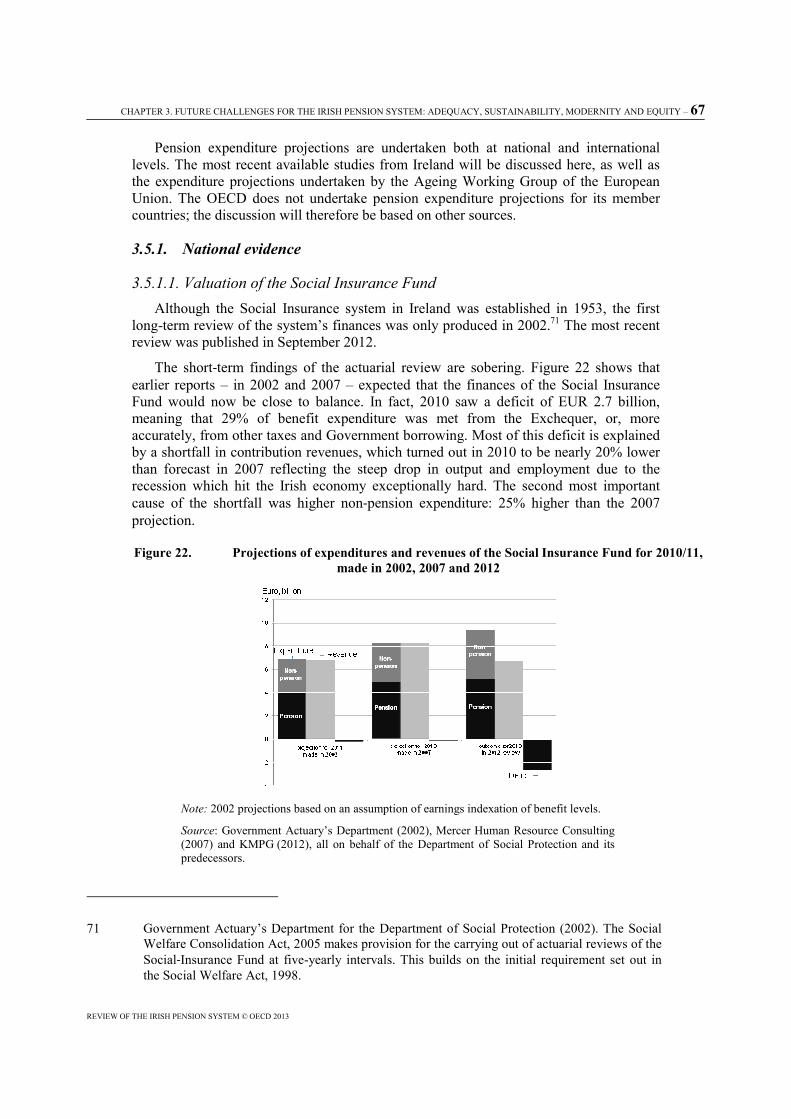
CHAPTER 3. FUTURE CHALLENGES FOR THE IRISH PENSION SYSTEM: ADEQUACY, SUSTAINABILITY, MODERNITY AND EQUITY – 67
REVIEW OF THE IRISH PENSION SYSTEM © OECD 2013
Pension expenditure projections are undertaken both at national and international levels. The most recent available studies from Ireland will be discussed here, as well as the expenditure projections undertaken by the Ageing Working Group of the European Union. The OECD does not undertake pension expenditure projections for its member countries; the discussion will therefore be based on other sources.
3.5.1. National evidence
3.5.1.1. Valuation of the Social Insurance Fund Although the Social Insurance system in Ireland was established in 1953, the first
long-term review of the system’s finances was only produced in 2002.71 The most recent review was published in September 2012.
The short-term findings of the actuarial review are sobering. Figure 22 shows that earlier reports – in 2002 and 2007 – expected that the finances of the Social Insurance Fund would now be close to balance. In fact, 2010 saw a deficit of EUR 2.7 billion, meaning that 29% of benefit expenditure was met from the Exchequer, or, more accurately, from other taxes and Government borrowing. Most of this deficit is explained by a shortfall in contribution revenues, which turned out in 2010 to be nearly 20% lower than forecast in 2007 reflecting the steep drop in output and employment due to the recession which hit the Irish economy exceptionally hard. The second most important cause of the shortfall was higher non-pension expenditure: 25% higher than the 2007 projection.
Figure 22. Projections of expenditures and revenues of the Social Insurance Fund for 2010/11, made in 2002, 2007 and 2012
Note: 2002 projections based on an assumption of earnings indexation of benefit levels.
Source: Government Actuary’s Department (2002), Mercer Human Resource Consulting (2007) and KMPG (2012), all on behalf of the Department of Social Protection and its predecessors.
71 Government Actuary’s Department for the Department of Social Protection (2002). The Social
Welfare Consolidation Act, 2005 makes provision for the carrying out of actuarial reviews of the Social-Insurance Fund at five-yearly intervals. This builds on the initial requirement set out in the Social Welfare Act, 1998.
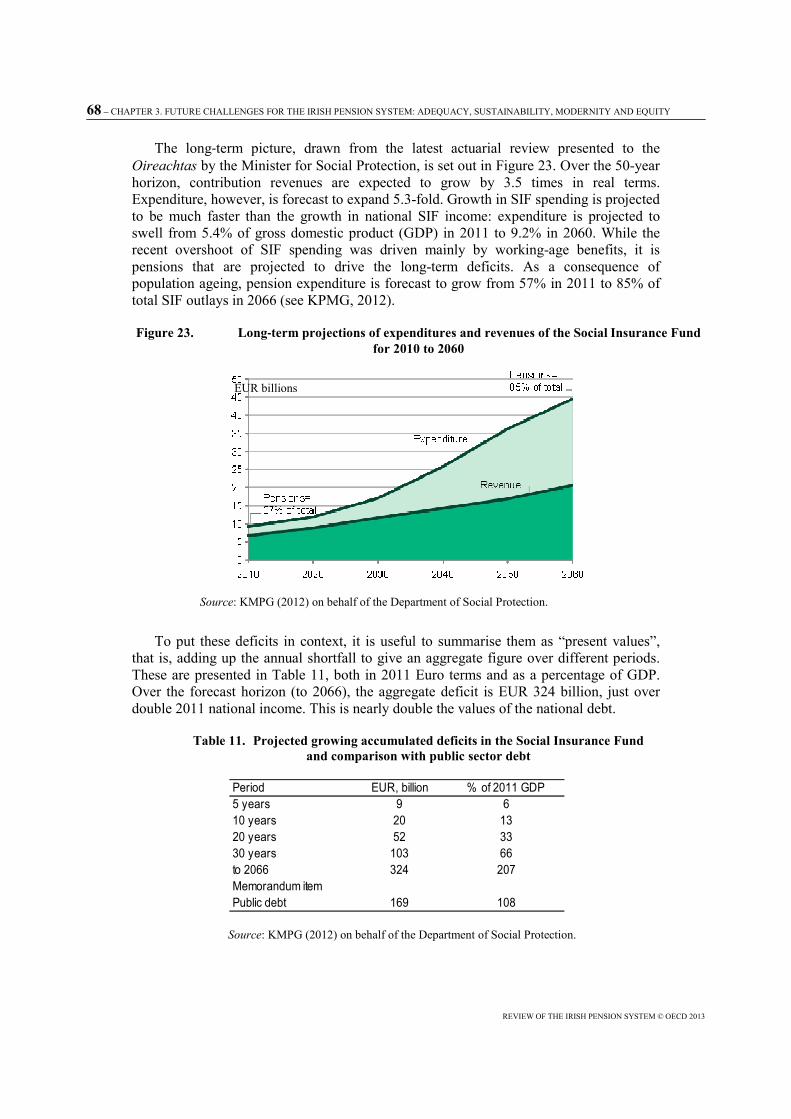
68 – CHAPTER 3. FUTURE CHALLENGES FOR THE IRISH PENSION SYSTEM: ADEQUACY, SUSTAINABILITY, MODERNITY AND EQUITY
REVIEW OF THE IRISH PENSION SYSTEM © OECD 2013
The long-term picture, drawn from the latest actuarial review presented to the Oireachtas by the Minister for Social Protection, is set out in Figure 23. Over the 50-year horizon, contribution revenues are expected to grow by 3.5 times in real terms. Expenditure, however, is forecast to expand 5.3-fold. Growth in SIF spending is projected to be much faster than the growth in national SIF income: expenditure is projected to swell from 5.4% of gross domestic product (GDP) in 2011 to 9.2% in 2060. While the recent overshoot of SIF spending was driven mainly by working-age benefits, it is pensions that are projected to drive the long-term deficits. As a consequence of population ageing, pension expenditure is forecast to grow from 57% in 2011 to 85% of total SIF outlays in 2066 (see KPMG, 2012).
Figure 23. Long-term projections of expenditures and revenues of the Social Insurance Fund for 2010 to 2060
Source: KMPG (2012) on behalf of the Department of Social Protection.
To put these deficits in context, it is useful to summarise them as “present values”, that is, adding up the annual shortfall to give an aggregate figure over different periods. These are presented in Table 11, both in 2011 Euro terms and as a percentage of GDP. Over the forecast horizon (to 2066), the aggregate deficit is EUR 324 billion, just over double 2011 national income. This is nearly double the values of the national debt.
Table 11. Projected growing accumulated deficits in the Social Insurance Fund and comparison with public sector debt
Source: KMPG (2012) on behalf of the Department of Social Protection.
Period EUR, billion % of 2011 GDP5 years 9 610 years 20 1320 years 52 3330 years 103 66to 2066 324 207Memorandum itemPublic debt 169 108
EUR billions
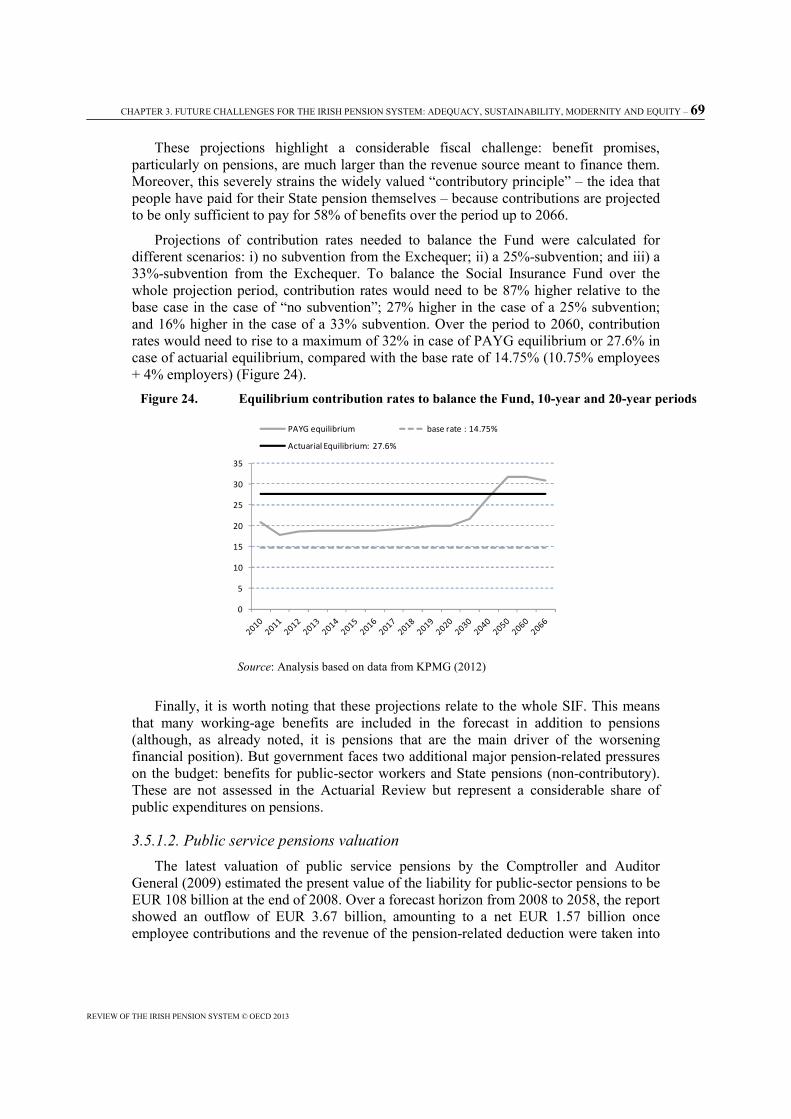
CHAPTER 3. FUTURE CHALLENGES FOR THE IRISH PENSION SYSTEM: ADEQUACY, SUSTAINABILITY, MODERNITY AND EQUITY – 69
REVIEW OF THE IRISH PENSION SYSTEM © OECD 2013
These projections highlight a considerable fiscal challenge: benefit promises, particularly on pensions, are much larger than the revenue source meant to finance them. Moreover, this severely strains the widely valued “contributory principle” – the idea that people have paid for their State pension themselves – because contributions are projected to be only sufficient to pay for 58% of benefits over the period up to 2066.
Projections of contribution rates needed to balance the Fund were calculated for different scenarios: i) no subvention from the Exchequer; ii) a 25%-subvention; and iii) a 33%-subvention from the Exchequer. To balance the Social Insurance Fund over the whole projection period, contribution rates would need to be 87% higher relative to the base case in the case of “no subvention”; 27% higher in the case of a 25% subvention; and 16% higher in the case of a 33% subvention. Over the period to 2060, contribution rates would need to rise to a maximum of 32% in case of PAYG equilibrium or 27.6% in case of actuarial equilibrium, compared with the base rate of 14.75% (10.75% employees + 4% employers) (Figure 24).
Figure 24. Equilibrium contribution rates to balance the Fund, 10-year and 20-year periods
Source: Analysis based on data from KPMG (2012)
Finally, it is worth noting that these projections relate to the whole SIF. This means that many working-age benefits are included in the forecast in addition to pensions (although, as already noted, it is pensions that are the main driver of the worsening financial position). But government faces two additional major pension-related pressures on the budget: benefits for public-sector workers and State pensions (non-contributory). These are not assessed in the Actuarial Review but represent a considerable share of public expenditures on pensions.
3.5.1.2. Public service pensions valuation The latest valuation of public service pensions by the Comptroller and Auditor
General (2009) estimated the present value of the liability for public-sector pensions to be EUR 108 billion at the end of 2008. Over a forecast horizon from 2008 to 2058, the report showed an outflow of EUR 3.67 billion, amounting to a net EUR 1.57 billion once employee contributions and the revenue of the pension-related deduction were taken into
0
5
10
15
20
25
30
35
PAYG equilibrium base rate : 14.75%
Actuarial Equilibrium: 27.6%

70 – CHAPTER 3. FUTURE CHALLENGES FOR THE IRISH PENSION SYSTEM: ADEQUACY, SUSTAINABILITY, MODERNITY AND EQUITY
REVIEW OF THE IRISH PENSION SYSTEM © OECD 2013
account.72 Roughly speaking, this amounts to half of the projected SIF deficit in to 2066, although it does not include the impact of the most recent changes for new entrants into the relevant scheme.
Recent estimates suggest that the outflow for public-sector pensioners was around EUR 3.18 billion at the end of 2012 and this is projected to decrease by 5.3% in 2013. In net terms the outflow was around EUR 2.66 billion at the end 2012, also projected to decrease by 5.6% in 2013.
Public service pay and pensions account for approximately 36% of overall Government expenditure, and accordingly further interventions will be required both in 2013 and over the medium term. As part of package of measures associated with “Croke Park 2” (which is the extension of the original Croke Park Agreement), the Government has proposed a further cut, ranging from 2% to 5% in pension rates for public service pensions valued over EUR 32,500.
The Irish National Pension Reserve Fund, established to set aside and invest money annually until at least 2055, had a value of EUR 16.1 billion at the end of 2008. The Exchequer’s annual contribution to the Fund, in accordance with the Act, is 1% of Gross National Product. The NPRF holds two types of investments: 1) Discretionary investments which are supervised and managed by the Fund commission; and 2) directed investments for which the Minister of Finance may direct the Commission to invest in credit institutions or to underwrite share issues in those institutions. The Minister may also direct the Commission with regard to the management and disposal of any such investments.
At the end of 2010, the value of the discretionary portfolio was EUR 15.06 billion. The Minister directed the Fund to hold EUR 10 billion in cash or debt instruments which were subsequently invested in Allied Irish Banks plc (AIB) and Bank of Ireland to enable their recapitalisation. At the end of 2011, the Fund’s discretionary portfolio stood at EUR 5.45 billion. The Discretionary Portfolio (excluding the investments in Allied Irish Banks and Bank of Ireland) was valued at EUR 6.0 billion at 30 September 2012. The Directed Portfolio, public policy investments in Allied Irish Banks and Bank of Ireland, stood at EUR 8.1 billion at 30 September 2012. At the end of 2011, the NPRF held 41% of its assets in its discretionary portfolio which amounted to 42.6% of its assets at the end of September 2012.73
The evolution of the holdings of the NPRF is shown in Figure 25 below. Note however that the National Pensions Reserve Fund (NPRF) was valued at EUR 13.4 billion at the end of 2011, which represents a 41% reduction relative to the assessment done in 2010.
72. All of these figures are in 2008 prices.
73. While the Government's intent is to return AIB and BoI to private ownership (see for example the debate in the Joint Committee on Finance, Public Expenditure and Reform of 14 September 2011), it is unlikely that such sales will offset the NPRF's investment in the banks. For example, in 2012 the NPRF has received a total of EUR 2.0 billion in cash from its BoI investments – comprising preference share dividends, the repurchase of warrants by the Bank and the sale of ordinary shares to a consortium of private investors. The net proceeds from the sale of BoI ordinary shares were remitted to the Exchequer as directed by the Minister of Finance.

CHAPTER 3. FUTURE CHALLENGES FOR THE IRISH PENSION SYSTEM: ADEQUACY, SUSTAINABILITY, MODERNITY AND EQUITY – 71
REVIEW OF THE IRISH PENSION SYSTEM © OECD 2013
The possibilities of the Fund to buffer the financial consequences of population ageing are very limited today given its diminished size and the outflow of funds for the recapitalisation of Irish banks.
Figure 25. Value and composition of NPRF, 2001-2011
Source: Comptroller and the Auditor General report (2012).
3.5.2. Spending on non-contributory pensions The second significant omission in the projections is expenditure on non-contributory
pensions. In 2011, this amounted to nearly a sixth of total spending on State pensions.74 Some 19% of pension recipients were on the non-contributory pension. Both figures have declined slightly over the past decade: expenditure from 19% to 16% of the total, and recipiency from 23% to 19%.
At the time of the actuarial review using 2010 as a base, fully 91% of men and 69% of women were expected to achieve a full or 98% pension in the longer term (beyond 2035). This would put them outside of entitlement to the non-contributory pension. But only 52% of new retirees as early as 2020 are now projected to receive a State pension of 90% or more of the full value (Table 12).75
74. The total comprises non- and contributory pensions, the State pension (transition), survivors’
benefits (widows’, widowers’ and civil partners), death benefits and bereavement grants. Source: Department of Social Protection (2011).
75. These figures are drawn from Mercer (2007) and KPMG (2012), both for the Department of Social Protection.

72 – CHAPTER 3. FUTURE CHALLENGES FOR THE IRISH PENSION SYSTEM: ADEQUACY, SUSTAINABILITY, MODERNITY AND EQUITY
REVIEW OF THE IRISH PENSION SYSTEM © OECD 2013
Table 12. Number of recipients of State pension broken down by pension rate and gender
Source: KPMG (2012).
The trends after 2020 should however improve, with the changes bringing a potential increase in the number of people on contributory pensions and a reduction in the number of people on non-contributory pensions. The improvement is expected to result mainly from the increase in both the number of people (males and females) and shares of retirees receiving the full-rate State pension (contributory) (Figure 26 top panel). The data, however, also suggest that an increasing share of retirees will receive pensions paid at a lower rate (Figure 26, bottom panel).
Figure 26. Current and projected number of recipients of State pension, different rates
Men Women
Note: CP: contributory pensions; NCP: non-contributory pensions; WCP: widows contributory pension. Source: Based on data provided by the Department of Social Protection
Until the introduction of the planned “total contributions approach” in 2020 (with a 10-year cap on credits), eligibility for full-rate and reduced contributory pensions as well as non-contributory pensions is very hard to predict. Additional uncertainty comes from the
0
50
100
150
200
250
300
350
400
Males - 100% CP Males - 98% CP Males - 75% CP Males - 50% CP Males - NCP
2010 2050thousands, recipients
0
50
100
150
200
250
300
350
400
Females - 100% CP
Females - 98% CP
Females - 75% CP
Females - 50% CP
Females - WCP Females - NCP
2010 2050
0%
10%
20%
30%
40%
50%
60%
Males - 100% CP Males - 98% CP Males - 75% CP Males - 50% CP Males - NCP
2010 2050%
0%
10%
20%
30%
40%
50%
60%
Females -100% CP
Females -98% CP
Females -75% CP
Females -50% CP
Females -WCP
Females -NCP
2010 2050
CHAPTER 3. FUTURE CHALLENGES FOR THE IRISH PENSION SYSTEM: ADEQUACY, SUSTAINABILITY, MODERNITY AND EQUITY – 73
REVIEW OF THE IRISH PENSION SYSTEM © OECD 2013
pace of economic and labour market recovery of Ireland which will affect the degree to which workers can build up a contribution record over the coming years. Nevertheless, spending on non-contributory pensions needs to be included in any projections of future pension expenditures in Ireland.
3.5.3. Irish pension spending in international comparison The main source of international comparative analysis and projections of pension
expenditures is the EU Economic Policy Committee’s Working Group on Ageing Populations and Sustainability (AWG).76
Figure 27 below shows public pension spending in 2010 (the blue bars) and projections for 2060 (the arrows) as published in the latest report of the AWG. On average in the countries of the EU27, public pension spending is projected to increase from 11.3% to 12.9% of GDP. In Ireland, public pension expenditure is projected to increase from 7.5% of GDP to 11.7% over the period 2010-2060, reaching a peak in 2058. Despite this above-average increase in spending, Ireland will still be among the ten countries with the lowest public pension expenditures in the EU27 and rank significantly below the EU27 average in 2060.
What are the main factors responsible for the future evolution of pension expenditures in Ireland?
First and foremost, population ageing: the population share of people aged 65 and over is expected to grow from 11.5% in 2010 to about 22% by 2060, while the share of the working-age population will increase less. Thus, the old-age dependency ratio is projected to more than double from around 19 in 2010 to 41 by 2060.
In addition, the share of pension recipients in the population aged 65 and over (the coverage ratio) is set to decline as a result of the increasing pension age and higher participation of older workers in the labour market, resulting in a higher effective retirement age.
76. This group was constituted to contribute to improving the quantitative assessment of the long-
term sustainability of public finances and economic consequences of ageing populations of the EU Member States, so as to assist policy formation. EU Member States, the European Commission services and the European Central Bank are represented in this group, which also co-operates with Eurostat, in particular on population projections, as well as with National Statistical Institutes, and liaises with other relevant institutions (e.g. the International Monetary Fund, World Bank, OECD), other Committees (mainly the Social Protection Committee) and their related working groups and research institutions that develop methodologies and prepare projections in this area.

74 – CHAPTER 3. FUTURE CHALLENGES FOR THE IRISH PENSION SYSTEM: ADEQUACY, SUSTAINABILITY, MODERNITY AND EQUITY
REVIEW OF THE IRISH PENSION SYSTEM © OECD 2013
Figure 27. Public pension spending in 2010 and projected level in 2060 for 28 countries (% of GDP
Notes:
1. Footnote by Turkey: The information in this document with reference to “Cyprus” relates to the southern part of the Island. There is no single authority representing both Turkish and Greek Cypriot people on the Island. Turkey recognises the Turkish Republic of Northern Cyprus (TRNC). Until a lasting and equitable solution is found within the context of United Nations, Turkey shall preserve its position concerning the “Cyprus issue”.
2. Footnote by all the European Union Member States of the OECD and the European Union: The Republic of Cyprus is recognised by all members of the United Nations with the exception of Turkey. The information in this document relates to the area under the effective control of the Government of the Republic of Cyprus.
Source: OECD analysis of European Commission (2012b).
A closer look at the pension expenditure projections of the AWG reveals the large weight of old-age and early pensions accounting for more than half of total public pension spending; however, the share of public service pensions in total pension spending is estimated to increase from 24% in 2010 to 28% in 2060. Another point worth noting is that spending on disability pensions is set to increase in Ireland while the vast majority of EU countries are expecting lower spending in this category (Table 13).
0 5 10 15 20
NLDIRL
CYPGBRSVKLITESTCZELUXNORSWELAT
ROMBULDNKESP
MALDEUBELSVN
EU27POL
HUNFIN
PORGRCAUTFRAITA 2010
2060
1,2

CHAPTER 3. FUTURE CHALLENGES FOR THE IRISH PENSION SYSTEM: ADEQUACY, SUSTAINABILITY, MODERNITY AND EQUITY – 75
REVIEW OF THE IRISH PENSION SYSTEM © OECD 2013
Table 13. Projected increase in Irish public pension spending by scheme
(as a share of GDP) 2010 2020 2030 2040 2050 2060
Total public pensions 7.5 9.0 9.0 10.0 11.4 11.7 of which
Old age and early pensions 3.9 4.5 4.6 5.4 6.5 6.3 Disability pensions 1.3 1.4 1.5 1.6 1.6 1.6 Others (survivors, etc) 0.6 0.5 0.4 0.4 0.4 0.4 Public service pensions 1.8 2.5 2.4 2.5 2.9 3.3
Source: Based on European Commission (2012b).
How do the EU AWG expenditure projections compare with the results of the national actuarial review undertaken by KPMG discussed above? Unfortunately, the two exercises are not immediately comparable as the actuarial review takes account only of pension expenditures which are financed out of social insurance contributions, i.e. spending on the State pension (contributory) and State pension (transition); it excludes the non-contributory pension spending and public-service pensions which together amounted to around 2.5%% of GDP in 2010. The EU projections cover a larger range of benefits; they include not only contributory pensions but also non-contributory pensions, invalidity and disability pensions, pre-retirement allowances and occupational pensions for public sector employees which are financed out of general revenues.
Taking this wider view on pension spending, Ireland fares relatively well in European comparison, but the AWG results do confirm the findings of the KPMG actuarial review that Ireland faces a significant challenge of funding additional pension spending as a result of population ageing. The number of public pension recipients is set to almost double to 2060 while the number of contributors per public pension beneficiary will decline steadily over the same period despite an expected increase of labour supply of 25% in Ireland between 2020 and 2060 (compared with a decline of more than 11% on average for the EU27).
3.6. The concept of modernity
Another important challenge is the modernity of pension provision to ensure that it reflects social and economic changes, especially with respect to accommodating more flexible labour markets and extending working lives. In the light of increasing life expectancy and improved health conditions, extending working lives and increasing effective retirement ages are important elements of any strategy to ensure the financial sustainability of pension systems and retirement-income adequacy. Creating opportunities for working longer while ensuring that those who are unable to do so are not left behind is therefore an essential objective.
According to the White Paper on Pensions (European Commission, 2012a), supporting working lives includes “the adaptation of work places and work organisation, the promotion of lifelong learning, cost-effective policies aiming at reconciling work, private and family life, measures to support healthy ageing and combating gender inequalities and age discrimination.”
In the absence of these measures there is the risk that people will either rely on other types of benefits – such as unemployment and disability benefits – or will receive low pension benefits if they do not work up to the normal retirement age.
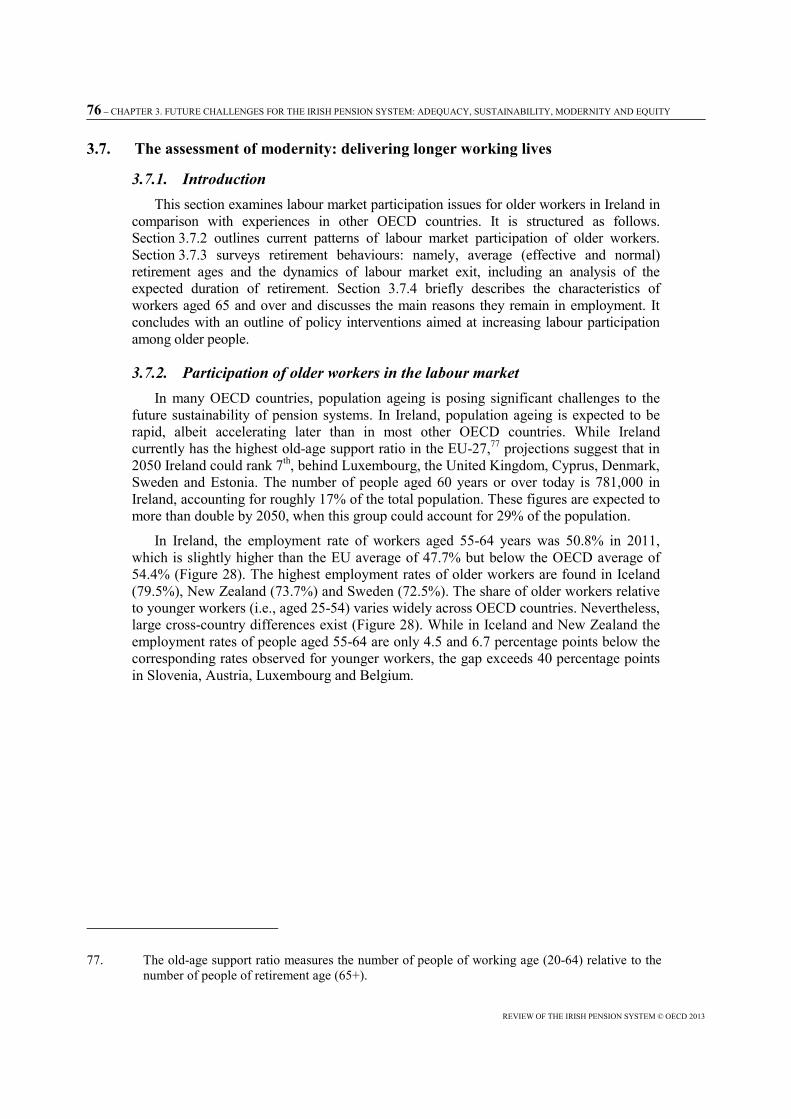
76 – CHAPTER 3. FUTURE CHALLENGES FOR THE IRISH PENSION SYSTEM: ADEQUACY, SUSTAINABILITY, MODERNITY AND EQUITY
REVIEW OF THE IRISH PENSION SYSTEM © OECD 2013
3.7. The assessment of modernity: delivering longer working lives
3.7.1. Introduction This section examines labour market participation issues for older workers in Ireland in
comparison with experiences in other OECD countries. It is structured as follows. Section 3.7.2 outlines current patterns of labour market participation of older workers. Section 3.7.3 surveys retirement behaviours: namely, average (effective and normal) retirement ages and the dynamics of labour market exit, including an analysis of the expected duration of retirement. Section 3.7.4 briefly describes the characteristics of workers aged 65 and over and discusses the main reasons they remain in employment. It concludes with an outline of policy interventions aimed at increasing labour participation among older people.
3.7.2. Participation of older workers in the labour market In many OECD countries, population ageing is posing significant challenges to the
future sustainability of pension systems. In Ireland, population ageing is expected to be rapid, albeit accelerating later than in most other OECD countries. While Ireland currently has the highest old-age support ratio in the EU-27,77 projections suggest that in 2050 Ireland could rank 7th, behind Luxembourg, the United Kingdom, Cyprus, Denmark, Sweden and Estonia. The number of people aged 60 years or over today is 781,000 in Ireland, accounting for roughly 17% of the total population. These figures are expected to more than double by 2050, when this group could account for 29% of the population.
In Ireland, the employment rate of workers aged 55-64 years was 50.8% in 2011, which is slightly higher than the EU average of 47.7% but below the OECD average of 54.4% (Figure 28). The highest employment rates of older workers are found in Iceland (79.5%), New Zealand (73.7%) and Sweden (72.5%). The share of older workers relative to younger workers (i.e., aged 25-54) varies widely across OECD countries. Nevertheless, large cross-country differences exist (Figure 28). While in Iceland and New Zealand the employment rates of people aged 55-64 are only 4.5 and 6.7 percentage points below the corresponding rates observed for younger workers, the gap exceeds 40 percentage points in Slovenia, Austria, Luxembourg and Belgium.
77. The old-age support ratio measures the number of people of working age (20-64) relative to the
number of people of retirement age (65+).

CHAPTER 3. FUTURE CHALLENGES FOR THE IRISH PENSION SYSTEM: ADEQUACY, SUSTAINABILITY, MODERNITY AND EQUITY – 77
REVIEW OF THE IRISH PENSION SYSTEM © OECD 2013
Figure 28. Employment rates by age cohorts, 2011
Source: OECD Labour Market Indicators.
In many cases, labour participation rates of older workers declined during the early part of the period 1970-2011 – mainly between the early 1970s and 1980s and continuing in some countries until the mid-80s –largely due to favourable early retirement opportunities in public pension schemes. This trend has been reversed and today employment of older persons is generally higher than in the 1970s. During the past decade, participation rates of older workers increased by about 8 percentage points among OECD countries, from an average of 44.9% in 2001 to around 53% currently. The largest increases occurred in Germany, Iceland, the Netherlands and New Zealand.
In Ireland, labour force participation rates of older workers grew between 2001 and 2011 from 46.4% to 55.9% (+9.5%), though there was a small decline from 52% to 50.8% in 2009, when they stabilised. In contrast, declines of employment rates for all other age groups were much larger.
The main reason for increased labour participation of the elderly during past decades was higher labour-force participation of women. Between 1995 and 2011, the participation rate for women aged 50-64 in OECD countries increased by around 12 percentage points on average, compared with just 2 points of increase for men (Figure 29).
0 10 20 30 40 50 60 70 80 90
SVNTUR
HUNPOLITABELLUXGRCSVKFRAAUTESPCZEPRTIRL
MEXOECD
NLDGBRFINEST
CANDNKCHLDEUUSAAUS
ISRKORJPNCHE
NORSWENZLISL
55-64 25-54
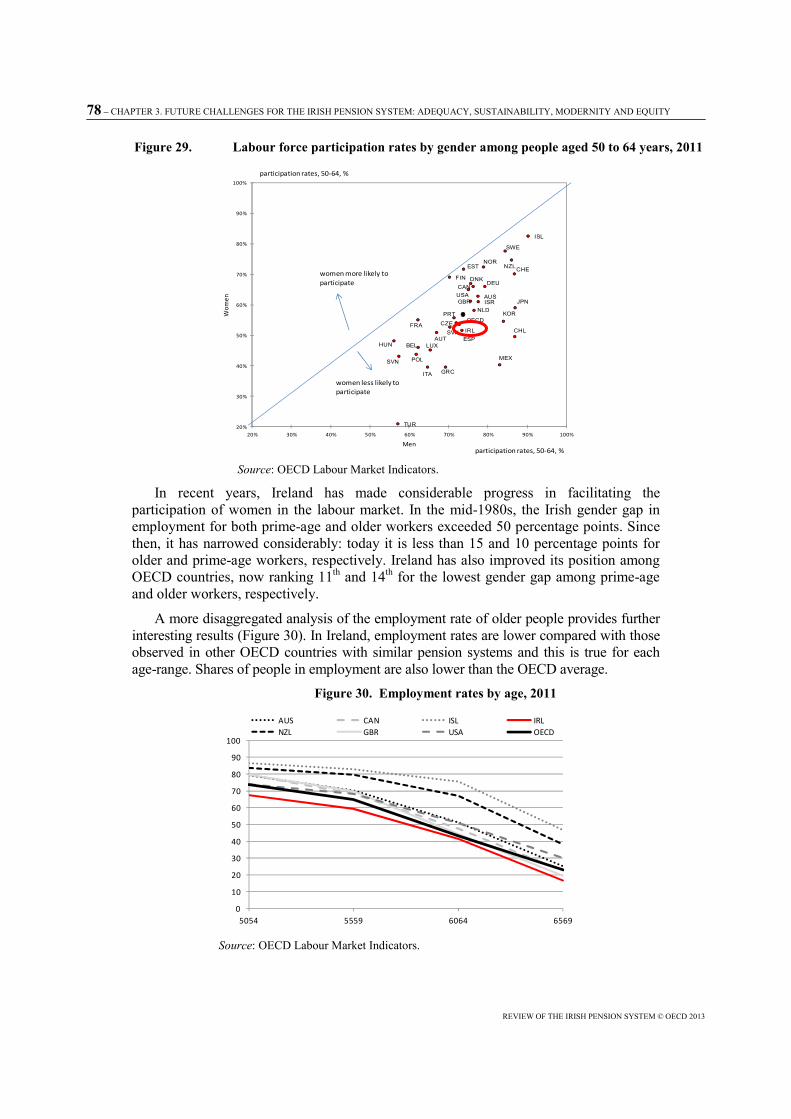
78 – CHAPTER 3. FUTURE CHALLENGES FOR THE IRISH PENSION SYSTEM: ADEQUACY, SUSTAINABILITY, MODERNITY AND EQUITY
REVIEW OF THE IRISH PENSION SYSTEM © OECD 2013
Figure 29. Labour force participation rates by gender among people aged 50 to 64 years, 2011
Source: OECD Labour Market Indicators.
In recent years, Ireland has made considerable progress in facilitating the participation of women in the labour market. In the mid-1980s, the Irish gender gap in employment for both prime-age and older workers exceeded 50 percentage points. Since then, it has narrowed considerably: today it is less than 15 and 10 percentage points for older and prime-age workers, respectively. Ireland has also improved its position among OECD countries, now ranking 11th and 14th for the lowest gender gap among prime-age and older workers, respectively.
A more disaggregated analysis of the employment rate of older people provides further interesting results (Figure 30). In Ireland, employment rates are lower compared with those observed in other OECD countries with similar pension systems and this is true for each age-range. Shares of people in employment are also lower than the OECD average.
Figure 30. Employment rates by age, 2011
Source: OECD Labour Market Indicators.
AUS
AUTBEL
CAN
CHE
CHLCZE
DEUDNK
ESP
EST
FIN
FRA
GBR
GRC
HUN
IRL
ISL
ISR
ITA
JPN
KOR
LUX
MEX
NLD
NORNZL
OECD
POL
PRT
SVK
SVN
SWE
TUR
USA
20%
30%
40%
50%
60%
70%
80%
90%
100%
20% 30% 40% 50% 60% 70% 80% 90% 100%
Wom
en
Men
women more likely to participate
women less likely to participate
participation rates, 50-64, %
participation rates, 50-64, %
0
10
20
30
40
50
60
70
80
90
100
5054 5559 6064 6569
AUS CAN ISL IRLNZL GBR USA OECD

CHAPTER 3. FUTURE CHALLENGES FOR THE IRISH PENSION SYSTEM: ADEQUACY, SUSTAINABILITY, MODERNITY AND EQUITY – 79
REVIEW OF THE IRISH PENSION SYSTEM © OECD 2013
3.7.3. Normal and effective retirement age
One of the most important factors affecting the retirement decision is the “normal” retirement age, i.e. the age at which unreduced public pension benefits become available. Even though the effective retirement age, i.e. the age at which workers leave the labour market permanently, is lower than the normal retirement age in the vast majority of countries, the normal age still influences people’s retirement decisions.78
Figure 31 shows the changes in pensionable age over the period 1949 to 2050 for the OECD average and Ireland. Current legislation will push the average pension age for men to 65.6 in 2050 and 65.0 for women. However, these increases look less impressive if observed in an historical perspective. Only in 2030 for men and 2020 for women will the average pension age in OECD countries be at the same level as it was in 1949.
The pension age in Ireland was set to 70 years up to 1973, after which it was gradually reduced to age 66 by 1977. With the removal of the Transition pension, pension ages will increase to 67 in 2021 and 68 in 2028.
78. A number of studies have tried to assess the impact of changes in the Normal Retirement
Age (NRA) on labour supply of older workers, and more particularly on their retirement behaviour. There is no single conclusion from these studies because the impact depends in practice on the institutional and economic contexts. However changes in the NRA seem to matter in a number of countries. For example, Mastrobuoni (2009) has evaluated the impact of the reform that increased the retirement age and tightened the conditions to access early retirement in the United States and found a sizeable impact on labour supply of older workers: a 2-month increase in the statutory retirement age may effectively increase the effective retirement age by around 1 month. D'Addio and Meslin (2012) have shown that the pension reform implemented in Germany in 1992 substantially increased labour supply of older men and women of the most recent cohorts. For example, at age 63, around 75% of the men belonging to the cohorts born in 1929 and 1930 are still active, whereas this share amounts to 90% of the cohorts born in 1935 and 1936. Aubert (2012), evaluating the impact of the French pension reform of 2010 which increased the retirement age, report that effects are diverse according to the duration-to-retirement effect (i.e. the effect horizon). The author takes into account both the effects of career length (distance from the entry point) and the missing years to the full rate pension (distance to retirement). The results show that a longer distance to retirement is associated with a lower probability of permanently exiting employment for men aged between 57 and 59. Coefficients are however not statistically significant for women. The length of the distance to retirement may affect significantly the impact on labour supply of the reform; rather than resulting in a higher employment rate of older workers, the increase in the retirement age may lead to a higher unemployment rate of older people. A similar result is also reported by Staubli and Zweimüller (2011) who have analysed the impact of the Austrian pension reforms of 2000 and 2003 that increased early retirement ages. They show, for example, that the ultimate effect of such measures was an increase in the demand for unemployment disability benefits by older people.
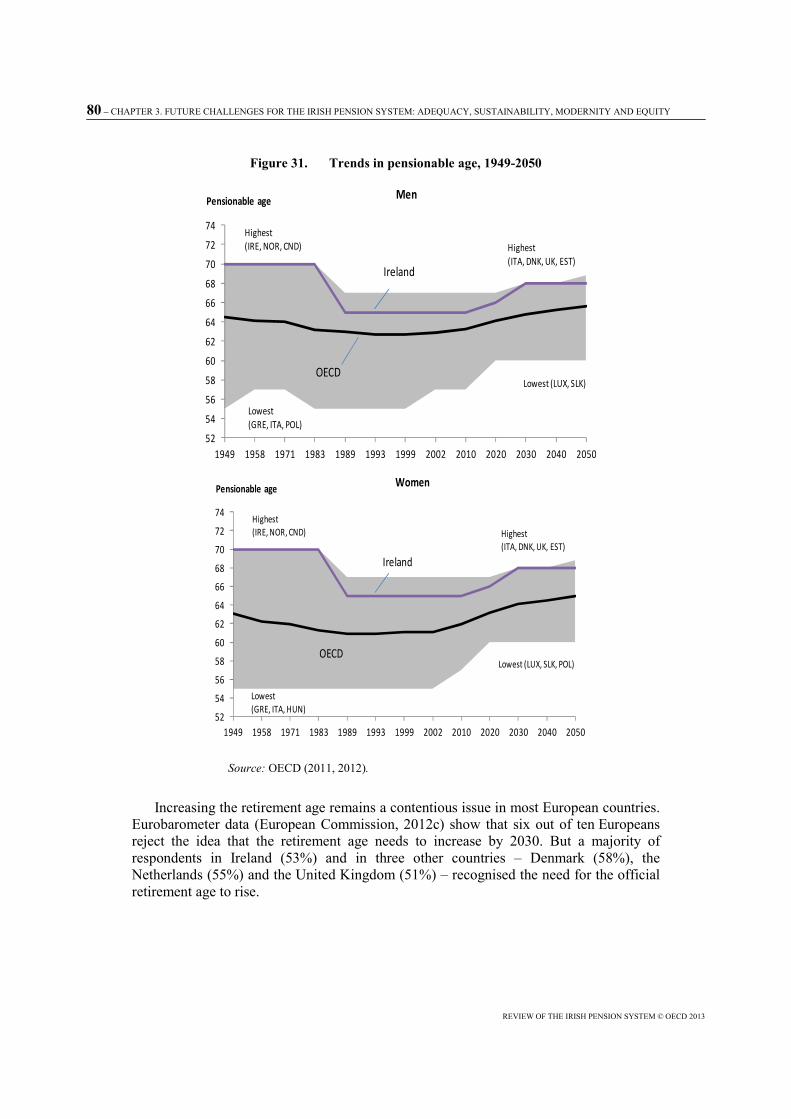
80 – CHAPTER 3. FUTURE CHALLENGES FOR THE IRISH PENSION SYSTEM: ADEQUACY, SUSTAINABILITY, MODERNITY AND EQUITY
REVIEW OF THE IRISH PENSION SYSTEM © OECD 2013
Figure 31. Trends in pensionable age, 1949-2050
Source: OECD (2011, 2012).
Increasing the retirement age remains a contentious issue in most European countries. Eurobarometer data (European Commission, 2012c) show that six out of ten Europeans reject the idea that the retirement age needs to increase by 2030. But a majority of respondents in Ireland (53%) and in three other countries – Denmark (58%), the Netherlands (55%) and the United Kingdom (51%) – recognised the need for the official retirement age to rise.
52
54
56
58
60
62
64
66
68
70
72
74
1949 1958 1971 1983 1989 1993 1999 2002 2010 2020 2030 2040 2050
Ireland
OECD
Lowest(GRE, ITA, POL)
Highest(IRE, NOR, CND)
Lowest (LUX, SLK)
Highest(ITA, DNK, UK, EST)
MenPensionable age
52
54
56
58
60
62
64
66
68
70
72
74
1949 1958 1971 1983 1989 1993 1999 2002 2010 2020 2030 2040 2050
Ireland
OECD
Lowest(GRE, ITA, HUN)
Highest(IRE, NOR, CND)
Lowest (LUX, SLK, POL)
Highest(ITA, DNK, UK, EST)
WomenPensionable age
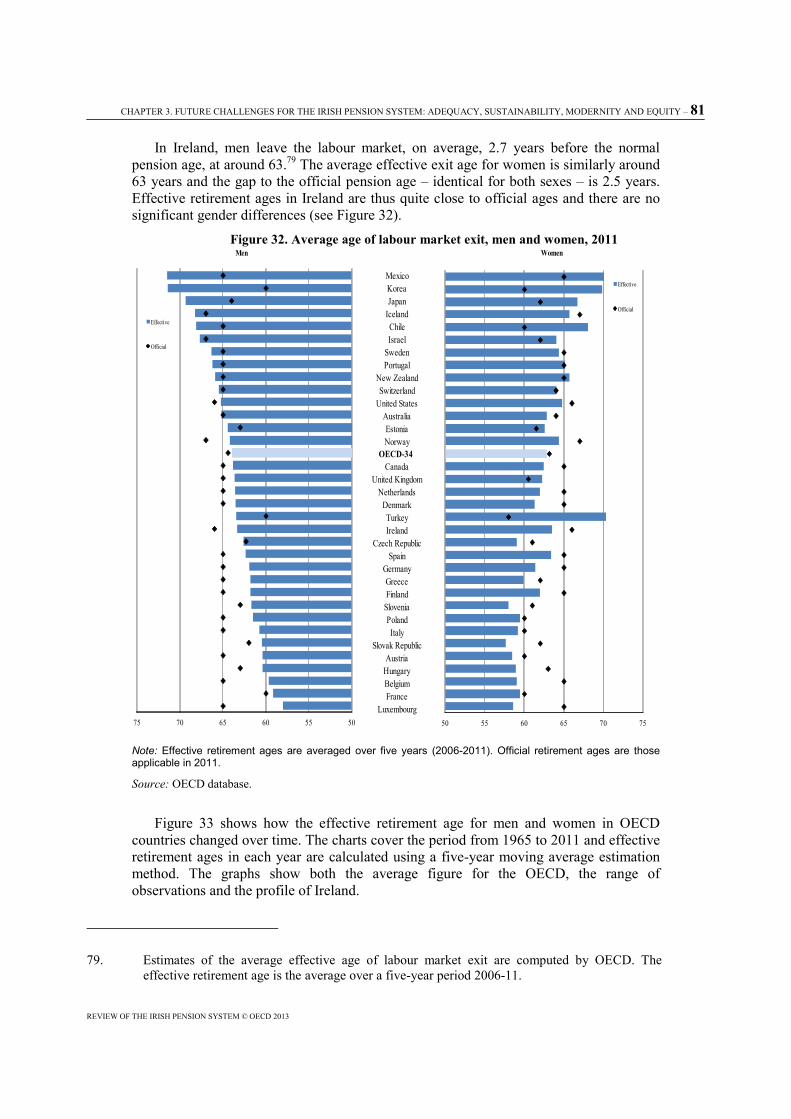
CHAPTER 3. FUTURE CHALLENGES FOR THE IRISH PENSION SYSTEM: ADEQUACY, SUSTAINABILITY, MODERNITY AND EQUITY – 81
REVIEW OF THE IRISH PENSION SYSTEM © OECD 2013
In Ireland, men leave the labour market, on average, 2.7 years before the normal pension age, at around 63.79 The average effective exit age for women is similarly around 63 years and the gap to the official pension age – identical for both sexes – is 2.5 years. Effective retirement ages in Ireland are thus quite close to official ages and there are no significant gender differences (see Figure 32).
Figure 32. Average age of labour market exit, men and women, 2011
Note: Effective retirement ages are averaged over five years (2006-2011). Official retirement ages are those applicable in 2011.
Source: OECD database.
Figure 33 shows how the effective retirement age for men and women in OECD countries changed over time. The charts cover the period from 1965 to 2011 and effective retirement ages in each year are calculated using a five-year moving average estimation method. The graphs show both the average figure for the OECD, the range of observations and the profile of Ireland.
79. Estimates of the average effective age of labour market exit are computed by OECD. The
effective retirement age is the average over a five-year period 2006-11.
Luxembourg
Men Women
MexicoKoreaJapan
IcelandChileIsrael
SwedenPortugal
New ZealandSwitzerland
United StatesAustraliaEstoniaNorway
OECD-34 Canada
United KingdomNetherlands
DenmarkTurkeyIreland
Czech RepublicSpain
GermanyGreeceFinland
SloveniaPolandItaly
Slovak RepublicAustria
HungaryBelgiumFrance
50 55 60 65 70 75
Effective
Official
505560657075
Effective
Official
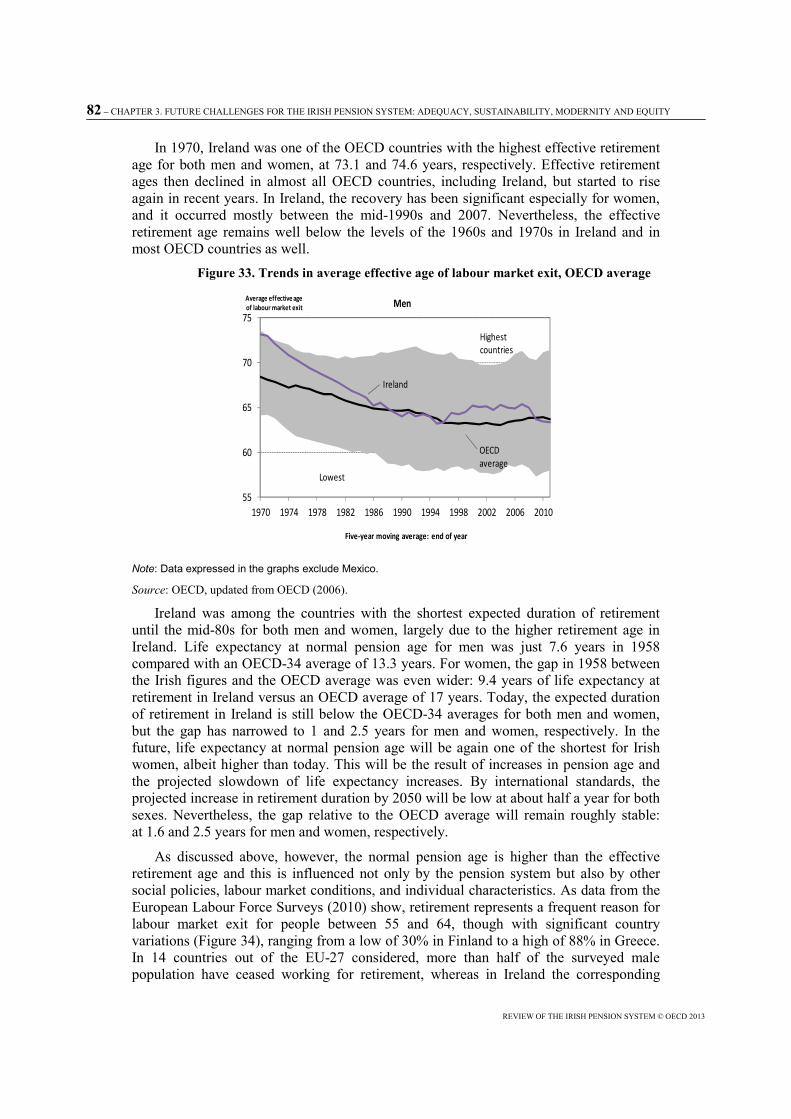
82 – CHAPTER 3. FUTURE CHALLENGES FOR THE IRISH PENSION SYSTEM: ADEQUACY, SUSTAINABILITY, MODERNITY AND EQUITY
REVIEW OF THE IRISH PENSION SYSTEM © OECD 2013
In 1970, Ireland was one of the OECD countries with the highest effective retirement age for both men and women, at 73.1 and 74.6 years, respectively. Effective retirement ages then declined in almost all OECD countries, including Ireland, but started to rise again in recent years. In Ireland, the recovery has been significant especially for women, and it occurred mostly between the mid-1990s and 2007. Nevertheless, the effective retirement age remains well below the levels of the 1960s and 1970s in Ireland and in most OECD countries as well.
Figure 33. Trends in average effective age of labour market exit, OECD average
Note: Data expressed in the graphs exclude Mexico.
Source: OECD, updated from OECD (2006).
Ireland was among the countries with the shortest expected duration of retirement until the mid-80s for both men and women, largely due to the higher retirement age in Ireland. Life expectancy at normal pension age for men was just 7.6 years in 1958 compared with an OECD-34 average of 13.3 years. For women, the gap in 1958 between the Irish figures and the OECD average was even wider: 9.4 years of life expectancy at retirement in Ireland versus an OECD average of 17 years. Today, the expected duration of retirement in Ireland is still below the OECD-34 averages for both men and women, but the gap has narrowed to 1 and 2.5 years for men and women, respectively. In the future, life expectancy at normal pension age will be again one of the shortest for Irish women, albeit higher than today. This will be the result of increases in pension age and the projected slowdown of life expectancy increases. By international standards, the projected increase in retirement duration by 2050 will be low at about half a year for both sexes. Nevertheless, the gap relative to the OECD average will remain roughly stable: at 1.6 and 2.5 years for men and women, respectively.
As discussed above, however, the normal pension age is higher than the effective retirement age and this is influenced not only by the pension system but also by other social policies, labour market conditions, and individual characteristics. As data from the European Labour Force Surveys (2010) show, retirement represents a frequent reason for labour market exit for people between 55 and 64, though with significant country variations (Figure 34), ranging from a low of 30% in Finland to a high of 88% in Greece. In 14 countries out of the EU-27 considered, more than half of the surveyed male population have ceased working for retirement, whereas in Ireland the corresponding
55
60
65
70
75
1970 1974 1978 1982 1986 1990 1994 1998 2002 2006 2010
Average effective age of labour market exit
Five-year moving average: end of year
Men
OECD average
Highest countries
Lowest
Ireland
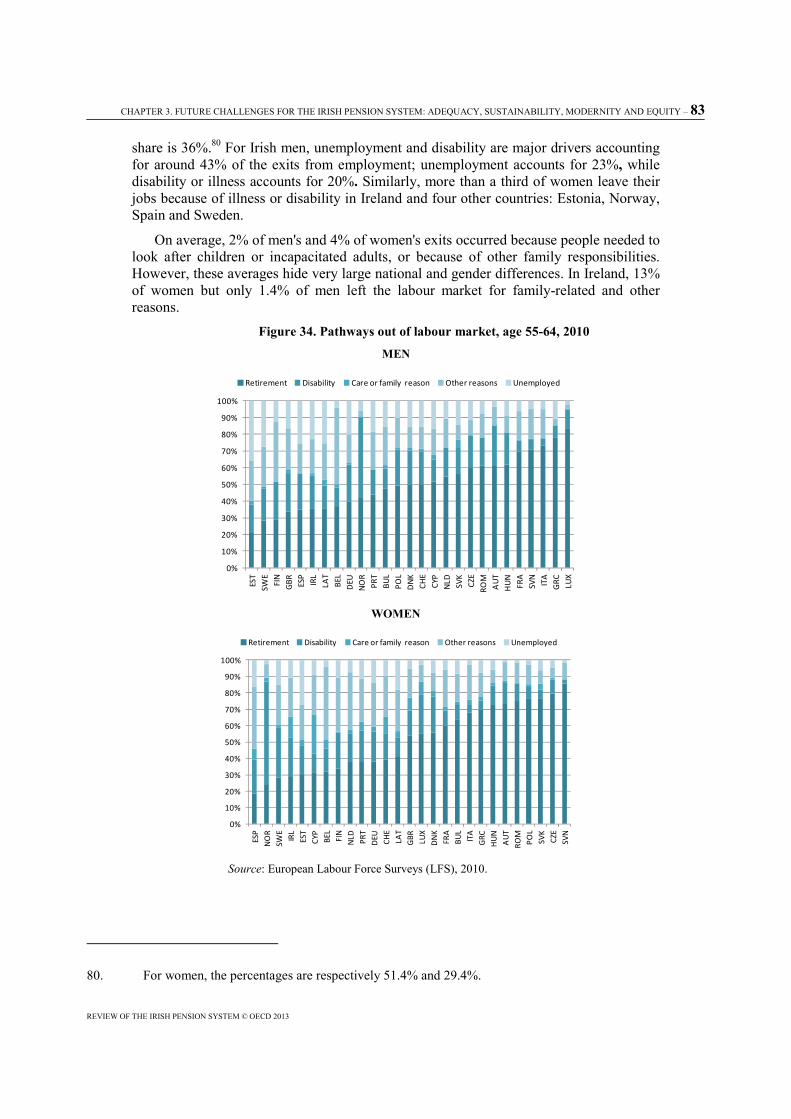
CHAPTER 3. FUTURE CHALLENGES FOR THE IRISH PENSION SYSTEM: ADEQUACY, SUSTAINABILITY, MODERNITY AND EQUITY – 83
REVIEW OF THE IRISH PENSION SYSTEM © OECD 2013
share is 36%.80 For Irish men, unemployment and disability are major drivers accounting for around 43% of the exits from employment; unemployment accounts for 23%, while disability or illness accounts for 20%. Similarly, more than a third of women leave their jobs because of illness or disability in Ireland and four other countries: Estonia, Norway, Spain and Sweden.
On average, 2% of men's and 4% of women's exits occurred because people needed to look after children or incapacitated adults, or because of other family responsibilities. However, these averages hide very large national and gender differences. In Ireland, 13% of women but only 1.4% of men left the labour market for family-related and other reasons.
Figure 34. Pathways out of labour market, age 55-64, 2010
MEN
WOMEN
Source: European Labour Force Surveys (LFS), 2010.
80. For women, the percentages are respectively 51.4% and 29.4%.
0%
10%
20%
30%
40%
50%
60%
70%
80%
90%
100%
EST
SWE
FIN
GBR ES
PIR
LLA
TBE
LD
EUN
OR
PRT
BUL
POL
DN
KCH
ECY
PN
LD SVK
CZE
ROM
AU
TH
UN
FRA
SVN
ITA
GRC LU
X
Retirement Disability Care or family reason Other reasons Unemployed
0%
10%
20%
30%
40%
50%
60%
70%
80%
90%
100%
ESP
NO
RSW
EIR
LES
TCY
PBE
LFI
NN
LD PRT
DEU CH
ELA
TG
BR LUX
DN
KFR
ABU
LIT
AG
RCH
UN
AU
TRO
MPO
LSV
KCZ
ESV
N
Retirement Disability Care or family reason Other reasons Unemployed

84 – CHAPTER 3. FUTURE CHALLENGES FOR THE IRISH PENSION SYSTEM: ADEQUACY, SUSTAINABILITY, MODERNITY AND EQUITY
REVIEW OF THE IRISH PENSION SYSTEM © OECD 2013
3.7.3.1. Summary and conclusions The long-term trend to earlier retirement came to an end for men in the mid-1990s
and for women, slightly later. The average age of labour-market exit was broadly constant for a few years, but there has been a noticeable trend to later retirement in recent years. Older workers have fared relatively well during the economic downturn experienced in most OECD countries after the global financial crisis. On average in the OECD, the proportion of 55-64 year-olds in employment increased by 1.0 percentage point between 2007 and 2011, compared with a decline of 1.6 percentage points in the share of 25-54 year-olds with jobs and 4.0 points for 20-24 year-olds. The proportion of 65-69 year-olds in employment also increased from 20.9% in 2007 to 22.8% in 2011 (OECD Labour Market Indicators).
Between 2007 and 2011, Ireland experienced a decline in the share of people employed at all age groups mentioned. The declines were the largest observed among OECD countries for people aged 20-24 and 25-54, attaining 23 percentage points and 9 percentage points, respectively. For people aged 55-64, a larger decline in the share of employed people was only observed in Iceland.
Parallel to this trend in employment, unemployment rates of people aged 55-64 increased on average in the OECD by 1.8 percentage points. In Ireland, the increase in unemployment rates was much larger at around 7 percentage points. Larger increases in unemployment rates of people aged 55-64 were only reported for Estonia (+8.1 percentage points) and Spain (+9.1 percentage points).
Governments’ long-term projections for public expenditure on pensions are heavily reliant on the assumption that people will retire later in the future. But it is important to bear in mind the scale of the challenge. The average age of labour-market exit for men in OECD countries is 63.9 on the latest estimates and for women, it is 62.8. If life expectancy continues to increase, as most projections assume, then significant increases in the effective retirement age are required to maintain control of the cost of pensions.
3.7.4. Working beyond the retirement age Working beyond the normal retirement age is becoming more common, but there is
still wide cross-country variation in the employment rates of people aged 65 and over. In the EU27, the employment rate of 65- to 69-year-olds increased from an average 8.8% in 2005 to 10.5% in 2011, despite the economic crisis; for OECD countries, the rates rose from 16.5% to 18.5%, on average.
Ireland, with an employment rate of 15.1% in 2005, was among the top performers in the EU. By 2011, employment rates in this age group had increased 1 percentage point further which places Ireland in the top half of the European ranking. Larger increases were achieved in Finland, the United Kingdom and Lithuania.
One way of working beyond the normal retirement age is to become self-employed, which is the route taken by about half of the people aged 65 and over in the EU-27 (LFS, 2011). Ireland, with 59.7%, has one of the highest rates of self-employment among people aged 65 and over, a rate that is only topped by Southern-European countries, such as Portugal, Italy and Greece (see Eurofound, 2012). In comparison to other age groups, people aged 65 and over are also more likely to remain involved in agricultural activities, generally for personal consumption. Self-employment can be particularly well suited to the preferences of older workers as it allows for a more personalised organisation of working time and effort and can be adapted more easily to work capabilities.
CHAPTER 3. FUTURE CHALLENGES FOR THE IRISH PENSION SYSTEM: ADEQUACY, SUSTAINABILITY, MODERNITY AND EQUITY – 85
REVIEW OF THE IRISH PENSION SYSTEM © OECD 2013
The latest Eurobarometer Survey also asked the question whether people should be allowed to work beyond the official retirement age – which was answered in the affirmative by almost two thirds of Europeans. In Ireland, 74% of the respondents agree with this proposition and 78% think that combining part-time work and a partial pension is more appealing than full retirement. However, only 46% of respondents would really like to continue working beyond retirement. Answers differ across occupational categories, with 68% of self-employed and 43% of manual workers saying they would like to continue working beyond pension age.
Wanting to remain in work is primarily motivated by the need to earn additional income. For example, in the LFS ad-hoc module on transitions from work to retirement dated 2006, 66.5% of Irish people aged 65 and over responded that increased household income was the main reason for them to stay at work, while for 15% the primary goal was to increase retirement pension entitlement. While in principle the desire for additional income can be a motivation to work longer, it may also be an indicator of inadequate pension provisions.
3.8. The concept of equity
Another very important aspect to consider is the equity of the pension system. This concept when applied to pension systems can be interpreted in different ways.
Equity can involve people belonging to different generations, i.e. intergenerational equity or individuals belonging to the same generation, i.e. intra-generational equity. Intergenerational equity (or fairness) of pension systems may refer, for example, to the fair redistribution of the costs and benefits of a pension arrangements across generations. In pay-as-you-go financed pension systems this usually relates to balancing pension payments for retirees with contribution requirements for active workers. Another issue relates to differences in treatment of new retirees versus those who have been retired for longer. Determining what exactly represents equal treatment, however, is not straightforward.
The definition and assessment of intra-generational equity is also complex. Within one generation, a number of factors may be source of inequities. Examples are differences in life expectancy between occupational groups, differences of treatment between the private and public sectors, differences stemming from gender, as well as differences in entitlements resulting from the way benefits are calculated.
In Ireland, as in many other OECD countries, there is an on-going debate about equity and fair treatment of workers in the private compared to the public sector. In many countries, public sector workers were traditionally entitled to more favourable conditions in pension arrangements, for example, benefit calculations based on final salaries rather than career averages. They were also often able to retire earlier and were thus often perceived as getting a much better deal than private sector workers, bearing in mind that employment contracts in the public sector are often more stable. On the other hand, many public sector workers justify their pension arrangements by pointing out that wages are lower, career advancement opportunities are more limited and thus earnings potential is less than in the private sector. Therefore, having better pensions should be seen as a fair compensation for opting to work in the public sector.
The unfairness in the conditions for pensioners may be perceived or real. Assessing the differences in the two groups is complex. Are more stable careers in the private sector and thus higher pension entitlements an unfair advantage? How can the group of public
86 – CHAPTER 3. FUTURE CHALLENGES FOR THE IRISH PENSION SYSTEM: ADEQUACY, SUSTAINABILITY, MODERNITY AND EQUITY
REVIEW OF THE IRISH PENSION SYSTEM © OECD 2013
servants who often have higher average educational attainment be compared to the population employed in the private sector? How can precise comparisons be made between pensioners in the public and the private sector whose work conditions may have been rather different?
An important point of debate relates to the fact that private-sector occupational pension schemes are increasingly moving from the DB to the DC type. This means that workers themselves are carrying the risk of their future pensions, which will depend only on the contributions made and the return earned on them. By contrast, in many countries public sector workers continue to be covered by DB occupational schemes for which the government is the guarantor carrying the risk. This difference is perceived as a disadvantage for private sector workers, especially in times of low returns on savings and high uncertainty in economic and financial sector developments.
3.9. Assessment of equity in the Irish public and occupational pension systems
3.9.1. Equity of pension provision on the public and private sector For a better understanding of differences in pension levels of private and public sector
workers, a look at the pensions paid out to men and women in both groups is useful. The data are based on the first wave of the Irish household survey TILDA (elaborated by S. Nivakoski on the basis of Barrett and Nivakoski, 2012) and show that differences in the amounts paid to private and public-sector pensioners are large, but not always in the direction expected.81
Coverage of occupational pensions is higher in the public sector and thus, a larger share of public sector workers receive an occupational pension compared to private sector workers. The report by Barrett and Nivakoski (2012) also shows that having worked in the public sector has a large impact on the likelihood of being in receipt of a supplementary pension. Former public sector employees (both men and women) are about 30 percentage points more likely to have such pensions. More broadly, the report found that “individuals with third-level education, home-owners, Dublin residents, employees of large firms or the public sector and white-collar workers are more likely to have supplementary pension arrangements.”
However, a larger proportion of retired private sector workers receive State pension (contributory) and State pension (non-contributory); this is obviously largely due to the fact that public servants have only been mandatorily insured in the State pension scheme since 1995.
The analysis of the total pension amounts paid to retirees in each quartile of the income distribution suggests that differences between public and private sectors are relatively small; for example, both private and public sector male retirees in the first quartile receive on average EUR 168 per week while in the top quartile the difference is EUR 18 in favour of public sector workers. However, there are large differences in the amount paid out in each of the different pension system components. A larger difference is observed between female retirees in the 1st quartile: in the private sector they receive
81. TILDA is a large-scale study of over 8 500 people aged 50 and over and living in Ireland.
Participants were interviewed between late 2009 and early 2011.
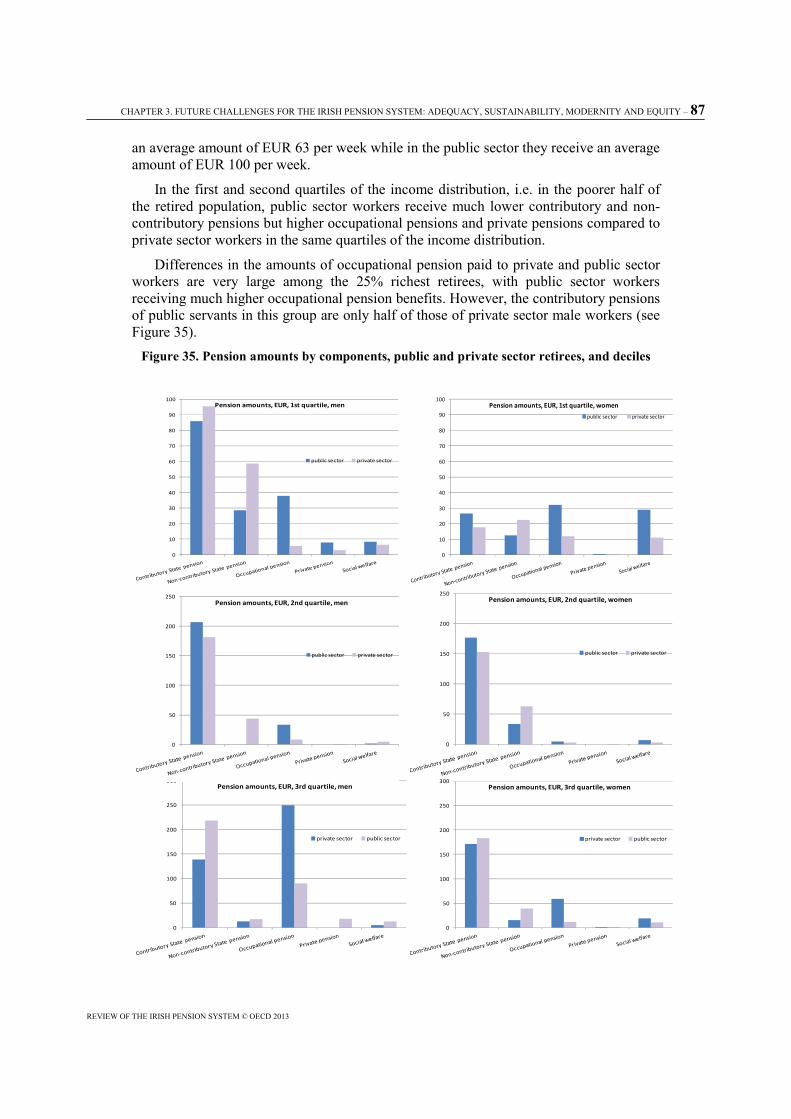
CHAPTER 3. FUTURE CHALLENGES FOR THE IRISH PENSION SYSTEM: ADEQUACY, SUSTAINABILITY, MODERNITY AND EQUITY – 87
REVIEW OF THE IRISH PENSION SYSTEM © OECD 2013
an average amount of EUR 63 per week while in the public sector they receive an average amount of EUR 100 per week.
In the first and second quartiles of the income distribution, i.e. in the poorer half of the retired population, public sector workers receive much lower contributory and non-contributory pensions but higher occupational pensions and private pensions compared to private sector workers in the same quartiles of the income distribution.
Differences in the amounts of occupational pension paid to private and public sector workers are very large among the 25% richest retirees, with public sector workers receiving much higher occupational pension benefits. However, the contributory pensions of public servants in this group are only half of those of private sector male workers (see Figure 35).
Figure 35. Pension amounts by components, public and private sector retirees, and deciles
0
10
20
30
40
50
60
70
80
90
100Pension amounts, EUR, 1st quartile, men
public sector private sector
0
10
20
30
40
50
60
70
80
90
100Pension amounts, EUR, 1st quartile, women
public sector private sector
0
50
100
150
200
250Pension amounts, EUR, 2nd quartile, women
public sector private sector
0
50
100
150
200
250
300Pension amounts, EUR, 3rd quartile, men
private sector public sector
0
50
100
150
200
250
300Pension amounts, EUR, 3rd quartile, women
private sector public sector
0
50
100
150
200
250Pension amounts, EUR, 2nd quartile, men
public sector private sector

88 – CHAPTER 3. FUTURE CHALLENGES FOR THE IRISH PENSION SYSTEM: ADEQUACY, SUSTAINABILITY, MODERNITY AND EQUITY
REVIEW OF THE IRISH PENSION SYSTEM © OECD 2013
Figure 35. Pension amounts by components, public and private sector retirees, and deciles (cont.)
Source: Elaborated by S. Nivakoski based on the 1st wave of TILDA. See Barrett and Nivakoski (2012).
Over the whole income distribution the amounts paid to retired male public sector workers show that the State pensions (contributory) are 28% lower, non-contributory pensions are 75% lower and private pensions are 55% lower compared to those of male private sector retirees. However, occupational pensions paid to male public sector retirees are three times higher than for their private sector peers.
Taking the whole average weekly income, male public sector retirees’ incomes are 38% higher than those of male private sector retirees. Female public sector retirees have an average weekly income that is 42% higher relative to women who had been working in the private sector. In both cases, it is occupational pensions that make the difference (Figure 36).
Figure 36. Pension amounts by components, public and private sector retirees
Source: Data from TILDA, provided by S. Nivakoski. See Barrett and Nivakoski (2012).
0 100 200 300 400 500 600
Pension amounts, EUR, overall, men
Contributory State pension Mean Non-contributory State pension Mean
Occupational pension Mean Private pension Mean
Social welfare Mean
0 100 200 300 400 500 600
Pension amounts, EUR, overall, women
Contributory State pension Mean Non-contributory State pension Mean
Occupational pension Mean Private pension Mean
Social welfare Mean
0
100
200
300
400
500
600
700
800Pension amounts, EUR, 4th quartile, women
public sector private sector
0
100
200
300
400
500
600
700
800Pension amounts, EUR, 4th quartile, men
public sector private sector

CHAPTER 3. FUTURE CHALLENGES FOR THE IRISH PENSION SYSTEM: ADEQUACY, SUSTAINABILITY, MODERNITY AND EQUITY – 89
REVIEW OF THE IRISH PENSION SYSTEM © OECD 2013
The findings about pension levels reported in Figure 36 above have to be interpreted carefully. Under the rules for current retirees, someone who receives a high supplementary pension has had a high final salary. But a higher salary may be linked to a range of different factors such as job tenure, education, occupational levels and sectors of employment.
3.9.2. Equity of pension entitlements in the State pension scheme: the contribution-benefit link
The State pension (contributory) scheme in Ireland currently has a very complex and non-transparent way of linking pension benefits to the contributions workers make to the SIF over their working lives. Even though the State pension (contributory) appears to be perceived by many as a scheme which rewards contributions by awarding a higher benefit to people who have paid contributions, compared to those who either have not paid at all or paid only very little, in reality the link between contributions and pensions is extremely weak. There is currently a plan to change to a “total contributions approach” which would remedy some of the problems of unequal treatment identified in this review. It is nevertheless useful to point out the inequities and inconsistencies in the contribution-benefit link in the State pension system which would need to be addressed by any reform, especially if the old system were to co-exist for some time into the future with a new system of calculating entitlements.
First, the current system of calculating entitlements leads to inequitable treatment of people who have contributed for the same amount of time. While this is also the case in other countries, for example, in the Netherlands where the flat-rate universal pension is financed through wage-related contributions but entitlement is determined by residency, the calculation method applied in Ireland, which uses average annual contribution duration, weakens the link further. In Ireland, a full-rate pension is paid on the condition of a minimum yearly average of contributions made throughout the working life. The averaging period starts with the first contribution and goes until retirement age. This means that a person who has started to contribute early but has not paid in continuously over their working life might have a lower pension than someone who started late but contributed continuously during the last ten years before retirement, despite the fact that the first person may have made more contributions in total (see Box 4 for a detailed explanation of differential treatment of workers). Other countries with similar systems use a minimum duration of contributions as a condition for the award of a full-rate basic pension and pro-rate the benefit for shorter contribution periods. This is the case, for example, in the United Kingdom where 30 years of contributions are required for a full benefit and in Luxembourg where 40 years are needed for the full basic pension. The total contributions approach which Ireland plans to adopt in 2020 would change the system into this direction but many details still remain to be defined. The way periods without contributions for childcare or unemployment reasons will be treated, for example, also needs to be considered, as this would lead to further weakening of the link between contributions and pension benefits which reduces the justification for having a contributory and parallel non-contributory pension scheme.
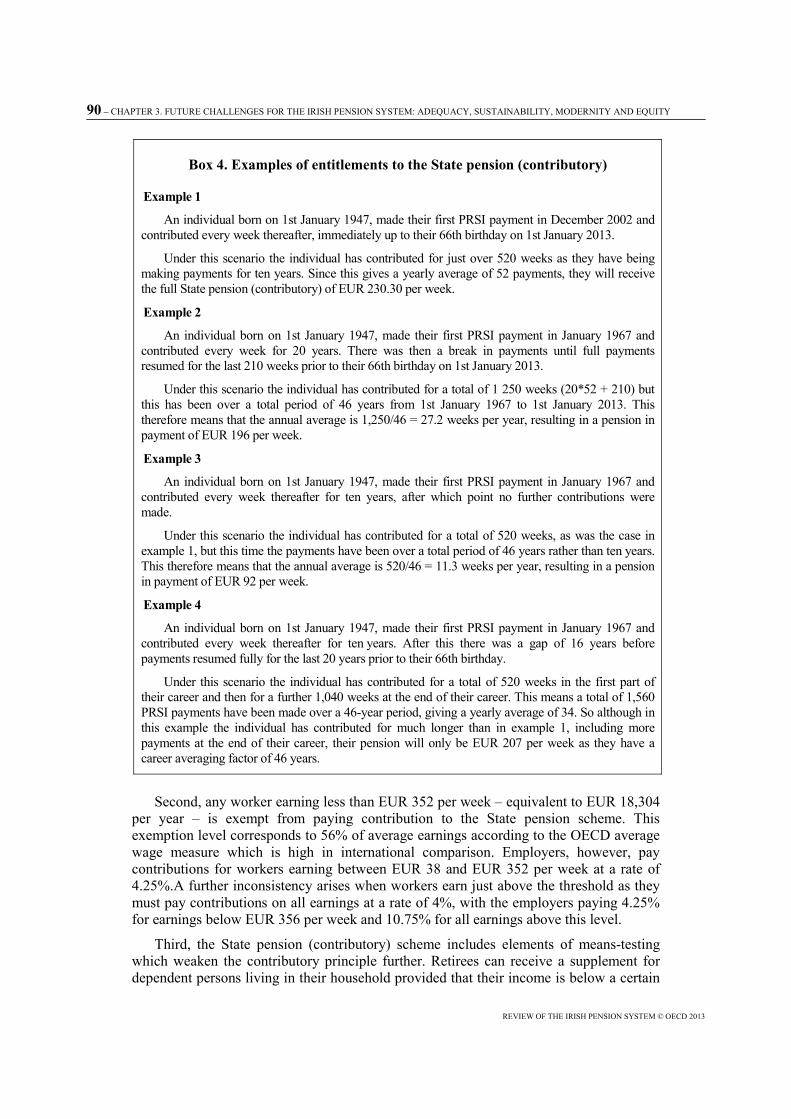
90 – CHAPTER 3. FUTURE CHALLENGES FOR THE IRISH PENSION SYSTEM: ADEQUACY, SUSTAINABILITY, MODERNITY AND EQUITY
REVIEW OF THE IRISH PENSION SYSTEM © OECD 2013
Box 4. Examples of entitlements to the State pension (contributory)
Example 1
An individual born on 1st January 1947, made their first PRSI payment in December 2002 and contributed every week thereafter, immediately up to their 66th birthday on 1st January 2013.
Under this scenario the individual has contributed for just over 520 weeks as they have being making payments for ten years. Since this gives a yearly average of 52 payments, they will receive the full State pension (contributory) of EUR 230.30 per week.
Example 2
An individual born on 1st January 1947, made their first PRSI payment in January 1967 and contributed every week for 20 years. There was then a break in payments until full payments resumed for the last 210 weeks prior to their 66th birthday on 1st January 2013.
Under this scenario the individual has contributed for a total of 1 250 weeks (20*52 + 210) but this has been over a total period of 46 years from 1st January 1967 to 1st January 2013. This therefore means that the annual average is 1,250/46 = 27.2 weeks per year, resulting in a pension in payment of EUR 196 per week.
Example 3
An individual born on 1st January 1947, made their first PRSI payment in January 1967 and contributed every week thereafter for ten years, after which point no further contributions were made.
Under this scenario the individual has contributed for a total of 520 weeks, as was the case in example 1, but this time the payments have been over a total period of 46 years rather than ten years. This therefore means that the annual average is 520/46 = 11.3 weeks per year, resulting in a pension in payment of EUR 92 per week.
Example 4
An individual born on 1st January 1947, made their first PRSI payment in January 1967 and contributed every week thereafter for ten years. After this there was a gap of 16 years before payments resumed fully for the last 20 years prior to their 66th birthday.
Under this scenario the individual has contributed for a total of 520 weeks in the first part of their career and then for a further 1,040 weeks at the end of their career. This means a total of 1,560 PRSI payments have been made over a 46-year period, giving a yearly average of 34. So although in this example the individual has contributed for much longer than in example 1, including more payments at the end of their career, their pension will only be EUR 207 per week as they have a career averaging factor of 46 years.
Second, any worker earning less than EUR 352 per week – equivalent to EUR 18,304 per year – is exempt from paying contribution to the State pension scheme. This exemption level corresponds to 56% of average earnings according to the OECD average wage measure which is high in international comparison. Employers, however, pay contributions for workers earning between EUR 38 and EUR 352 per week at a rate of 4.25%.A further inconsistency arises when workers earn just above the threshold as they must pay contributions on all earnings at a rate of 4%, with the employers paying 4.25% for earnings below EUR 356 per week and 10.75% for all earnings above this level.
Third, the State pension (contributory) scheme includes elements of means-testing which weaken the contributory principle further. Retirees can receive a supplement for dependent persons living in their household provided that their income is below a certain

CHAPTER 3. FUTURE CHALLENGES FOR THE IRISH PENSION SYSTEM: ADEQUACY, SUSTAINABILITY, MODERNITY AND EQUITY – 91
REVIEW OF THE IRISH PENSION SYSTEM © OECD 2013
level. The HBP which adds benefits in cash and in-kind to the State pension (contributory) and State pension (non-contributory) is also means-tested for pensioners below the age of 70 and awarded to all pensioners who can prove residency for the past two years after age 70.
Fourth, there is currently no ceiling applied to the income on which contributions are made. This leads to a strongly redistributive effect of the State pension and results in a weak link between what people pay into the scheme and what they receive in retirement.
Fifth, there is only a very small difference between the full-rate State pension (contributory) and the State pension (non-contributory). There is thus no large incentive for people to contribute to the State pension scheme.
This brief discussion shows that, contrary to public impression, the link between contributions and benefits in the current State pension scheme is very weak and that there are already numerous elements of redistribution in the system which have a more universal character. When the total contributions approach is adopted in 2020, some of these problems will be remedied. On the other hand, paying a full-rate pension on condition of 30 years of contributions will raise further questions on the contribution-benefit link. The treatment of non-contributory periods, such as time out of work for reasons of childcare or unemployment, will be crucial. If, as planned, up to ten years will be credited for such periods, workers will receive the same benefit whether they pay contributions for 20 or 30 years. The system would then take more and more of the characteristics of a flat-rate universal pension system. At that point, there would appear to be a strong case for changing the logic of the scheme in a more transparent way by moving either to a universal or a means-tested pension system which is no longer based on contribution requirements.


CHAPTER 4. THE WAY FORWARD: OPTIONS FOR PENSION REFORM IN IRELAND – AN INTERNATIONAL PERSPECTIVE – 93
REVIEW OF THE IRISH PENSION SYSTEM © OECD 2013
Chapter 4 The way forward: options for pension reform in Ireland
An international perspective
4.1. Critical elements for pension reforms in Ireland
As detailed above, Ireland has already undertaken many pension reforms in the past five years. Many elements of the National Pension Framework have already been put in place. The phased increase in the pensionable age will begin in 2014 with the abolition of the State pension (transition), effectively increasing the State pension age to 66. Public-sector pensions have been changed for new entrants. Furthermore, a pension-related deduction from public-sector salaries was introduced. There have also been many changes to the tax treatment of private pensions.
As outlined in the terms of reference, this OECD review of Ireland’s retirement-income provision takes account of these commitments, and both policy actions and detailed analysis that have already been undertaken.
The analysis in this report has shown that Ireland is today in a relatively favourable position compared with most OECD countries, both with regard to pension spending and the adequacy of retirement income provision. But like other countries, Ireland too will need to cope with the twin challenges of pension adequacy and financial sustainability of the pension system as the Irish population ages and public spending on pensions will increase substantially. Ireland will thus need to continue to adapt and fine-tune its pension system so that it can provide affordable and adequate benefits to Irish retirees in the long term.
Compared with other most OECD countries, however, Ireland also faces a considerable short-term challenge due to the continuing impact of the financial and economic crisis and the imperative need for fiscal consolidation in the context of the country’s agreements with the Troika. These constraints have prompted a series of recent pension reform measures and will likely continue to dominate the decisions that the Government will take during the coming years.
In adjusting the pension system to meet both the short-term and the long-term challenges, Ireland has a wide choice of measures, ranging from changes to key pension parameters in the existing system, such as the retirement age, the calculation of the State pension benefit and the indexation of pensions in payment, to more fundamental reforms which would change the architecture of the Irish pension system, such as a redefinition and rebalancing of the existing tiers of pension provision, and changes to the eligibility rules which could go in the direction of making State pensions universal or – taking the opposite direction – introduce more elements of targeting. The experience with pension reforms in other OECD countries can inform the Irish pension debate, even though any
94– CHAPTER 4. THE WAY FORWARD: OPTIONS FOR PENSION REFORM IN IRELAND – AN INTERNATIONAL PERSPECTIVE
REVIEW OF THE IRISH PENSION SYSTEM © OECD 2013
option chosen will have to be adapted to the national social and economic context and characteristics of Ireland.
This chapter will discuss options for the reform of individual parameters and components of the pension system, such as the retirement age, incentives to work longer, indexation and supplementary benefits. Section 4.2 will discuss options for structural reform of the Irish pension system. Section 4.3 focuses on proposals for public sector pensions, while the final part will focus on private pension reforms.
4.2. Options for parametric reforms of the Irish pension system
This section first discusses the options for reform within the existing pension system in Ireland. In particular, it addresses the thorny issue of what might be the “right” retirement age in the context of increasing life expectancy at older ages in Ireland. It also discusses what type of incentives for working longer and retiring later could be introduced in the Irish pension system. Other issues include how to address the balance between the treatment of active workers, new retirees and people who have already spent some time in retirement through indexation of the pension levels, as well as how the household benefits package (HBP), which today plays an important role especially for poorer pensioners, might be integrated with the pension benefit in the future.
In the following discussion of reform options, reference will be made to the country examples mentioned in Table 1 of Chapter 1 above; a full description of their pension systems can be found in OECD (2011) and on www.oecd.org/els/social/pensions/PAG.
The discussion of reform options takes account of the current state of the pension reform discussions in Ireland highlighting solutions for some of the issues most hotly debated at the moment. But it also goes further by looking at possibilities for a longer-term restructuring of the Irish pension system as was requested by the Irish Government when they commissioned this review. Such structural reform options will be addressed in the third section of this chapter.
As Ireland has a basic public pension system with only one tier of pension provision, the number of parameters and thus the options for reform within the existing structure are somewhat limited. There is more space for design and thus change in the occupational and personal pension landscape; the options for reform in this area will be dealt with in Sections 4.5.4, 4.5.5 and 4.5.6.
The key parameters in the Irish public pension system are: 1) the official retirement age; 2) the effective retirement age (which is much harder to influence than the official age as it also depends on factors outside of the pension system); 3) the level at which the State pension (contributory) and the State pension (non-contributory) are set; 4) the calculation of the benefit for the individual retiree, including any reductions or increases for early and later retirement, respectively; and 5), the way in which pension benefits in payment are adjusted over time, i.e. benefit indexation; Outside of the pension system, but with great importance for retirees, is the HBP which is available to all persons over 70 regardless of income. This component of retirement income provision will also be discussed.

CHAPTER 4. THE WAY FORWARD: OPTIONS FOR PENSION REFORM IN IRELAND – AN INTERNATIONAL PERSPECTIVE – 95
REVIEW OF THE IRISH PENSION SYSTEM © OECD 2013
4.2.1. Retirement age
The normal retirement age, i.e. the age at which unreduced pension benefits become available, is the most visible parameter of any pension system. As such, it sends a clear signal for people in choosing when to stop working. Increases in pension age have often proved to be among the more contentious elements of pension reforms, compared to other, less visible or more difficult to assess changes to retirement income provision. On the other hand, the logic of raising the retirement age may be easier to communicate to the general public as life expectancy at retirement keeps increasing and governments may want to keep either the average period spent in retirement stable in absolute terms or decide to keep the ratio between the time spent in work and the time spent in retirement constant.
4.2.1.1. Retirement ages in OECD countries
Most OECD countries have begun to increase pensionable ages or plan to do so in the near future. Under current legislation, 65 is the modal long-term age at which people normally draw their pensions, accounting for 17, or half, of OECD countries for men and 14 countries for women. But 67 – or higher – is becoming the new norm. Some 14 countries (13 for women) are either increasing pension ages to this level or, in the cases of Iceland and Norway, are already there.
Ireland is in the group of the more advanced countries when it comes to increasing the pensionable age: it is increasing to 66 by 2014, to 67 by 2021 and to 68 by 2028. The Czech Republic, which is increasing pensionable age by two months each year indefinitely, is moving towards 68. The United Kingdom is increasing pensionable age from 65 to 68 starting in 2020. Italy, which links the pension age to life expectancy from 2013 and Denmark, which plans to link pension age to life expectancy from the mid-2020s, are forecast to nearly reach age 69 in 2050.
These increases in pension ages will succeed in stabilising or reducing the expected duration of retirement (i.e. life expectancy at normal retirement age) in a few countries only as Figure 37 illustrates. In Ireland, the scheduled increase in pensionable age is rapid enough to compensate for projected increases in life expectancy and thus to keep the time spent in retirement relatively stable. The expected duration of retirement – which is currently 17.4 (20.6) years for men (women) in Ireland, compared with an OECD average of 18.4 years for men and 23.1 for women – will decline until about 2030 and then reach current levels by around 2040. Thereafter, growing life expectancy is projected to outpace the increase of the retirement age and the expected duration in retirement grows again for both Irish men and women. In contrast, where retirement ages are increasing in line with life expectancy – such as for example in Greece and in Italy – the duration of retirement in 2050 could be much lower than currently.
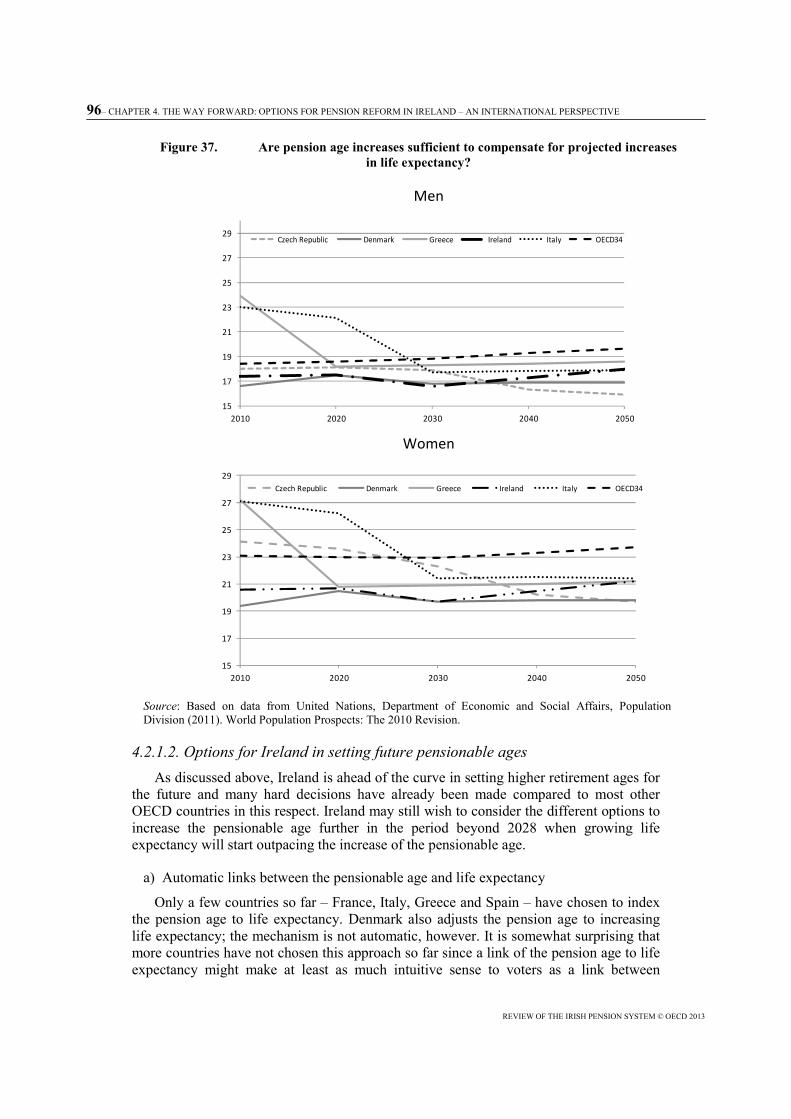
96– CHAPTER 4. THE WAY FORWARD: OPTIONS FOR PENSION REFORM IN IRELAND – AN INTERNATIONAL PERSPECTIVE
REVIEW OF THE IRISH PENSION SYSTEM © OECD 2013
Figure 37. Are pension age increases sufficient to compensate for projected increases in life expectancy?
Men
Women
Source: Based on data from United Nations, Department of Economic and Social Affairs, Population Division (2011). World Population Prospects: The 2010 Revision.
4.2.1.2. Options for Ireland in setting future pensionable ages As discussed above, Ireland is ahead of the curve in setting higher retirement ages for
the future and many hard decisions have already been made compared to most other OECD countries in this respect. Ireland may still wish to consider the different options to increase the pensionable age further in the period beyond 2028 when growing life expectancy will start outpacing the increase of the pensionable age.
a) Automatic links between the pensionable age and life expectancy
Only a few countries so far – France, Italy, Greece and Spain – have chosen to index the pension age to life expectancy. Denmark also adjusts the pension age to increasing life expectancy; the mechanism is not automatic, however. It is somewhat surprising that more countries have not chosen this approach so far since a link of the pension age to life expectancy might make at least as much intuitive sense to voters as a link between
15
17
19
21
23
25
27
29
2010 2020 2030 2040 2050
Czech Republic Denmark Greece Ireland Italy OECD34
15
17
19
21
23
25
27
29
2010 2020 2030 2040 2050
Czech Republic Denmark Greece Ireland Italy OECD34
CHAPTER 4. THE WAY FORWARD: OPTIONS FOR PENSION REFORM IN IRELAND – AN INTERNATIONAL PERSPECTIVE – 97
REVIEW OF THE IRISH PENSION SYSTEM © OECD 2013
pension levels and life expectancy, which is the more common way. A link between life expectancy and pension ages is also better suited to countries with redistributive public pension programmes, such as Ireland.
Making adjustments of pension system parameters automatic means, in theory, that pension financing is, to some extent, immunised against demographic, political and economic shocks. It provides a logical and neat framework for changes that may be politically difficult to introduce on a piecemeal basis. Like other pre-commitment mechanisms in economic policymaking – in monetary and fiscal policy, for example – it is designed to enhance credibility and provide assurance that public pension schemes will not place an unexpected burden on the public finances in the future.
An age-indexation mechanism, however, needs to be carefully designed. It requires choices, for example, of the cohorts that will be affected – and thereby the duration of the transition to the new rules – and of the demographic projections to be used as a base for the indexation (for example, whether to use the life expectancy of a specific birth cohort or the life expectancy at a specific age). Another important decision relates to the way in which additional years of life expectancy are distributed between the working career and the retirement period. The increase in life expectancy can go entirely to extending the working career, if the aim is to keep the retirement period constant in absolute terms, or it can be allocated proportionally to retirement and working periods. Increases allocated to the working period can also be given a floor or maximum cap.
In Italy, for example, life expectancy for men and women will be updated in 2013, in 2016, in 2019 and then thereafter every two years. If life expectancy increases over time, the retirement age will increase by the same amount. The main consequence for individuals is, however, that they are uncertain about the age at which they will be able to retire. In France, where the adjustment to life expectancy is (semi)-automatic, legislation stipulates that the ratio between the working life, accounting for two thirds of the total, and the retirement period, accounting for one third, should be constant and that the length of the contribution period needed to receive a full-rate pension benefit should be increased accordingly.
Indexing pensions to life expectancy is, however, not a guarantee that adequacy and sustainability of pension systems will be achieved, since even automatic mechanisms can be suspended discretionally. This has happened, for example, in Germany and Sweden. Some individuals may also decide to retire at the earliest possible moment rather than be exposed to uncertainty regarding their retirement planning. What constitutes best or good practice is less clear cut. There is a trade-off: greater certainty over the retirement age and/or benefits versus greater certainty over the amount of contributions or taxes paid when working.
Projections of pension expenditures by the European Commission suggest that in most EU countries the cost-containing effect of these adjustment mechanisms will require a significant lengthening of working lives and an increase in employment rates (see European Commission, 2012b). Measures that promote longer working lives are therefore crucial for the long-term sustainability of these innovative pension reforms.
98– CHAPTER 4. THE WAY FORWARD: OPTIONS FOR PENSION REFORM IN IRELAND – AN INTERNATIONAL PERSPECTIVE
REVIEW OF THE IRISH PENSION SYSTEM © OECD 2013
b) Continuous gradual increase of the pension age
A different option is to set by law gradual continuous increases of the pension age independent of the evolution of life expectancy. Only one OECD country has so far chosen this method: the Czech Republic. Pension ages of women in the Czech Republic will increase initially by four months and then by six months per year to align with those for men to reach 66 years and 8 months. After this point, the pension age will increase by 2 months a year without limit for both men and women.
This approach may be problematic in that there is no link with life expectancy and the continuous increase of the pension age may therefore be difficult to justify to voters. Moreover, the legislated rate of increase may be too rapid or too slow given the uncertainty regarding the pace of future life expectancy increases.
c) Semi-automatic link of the pension age to life expectancy
In Denmark, a compromise solution between the two methods discussed above was adopted, resulting in a semi-automatic adjustment mechanism. The Danish pension age will be linked to life expectancy at age 60 with a five-year lag between the time of the change in life expectancy and the adjustment of the pension age.
The reason for delaying the introduction of the link to life expectancy is to allow for some catch-up in the pension age for past life-expectancy gains. By 2027, when the pension age will reach 67, life expectancy at age 60 is projected to be 20.8 years for men and 24.2 years for women. By 2040, life expectancy at age 60 is projected to have increased by another 1.3 years. Thus, allowing for the five-year lag, the pension age will reach 68.3 years in 2045.
Any future increases of the pension age are subject, however, to previous approval of the Danish Parliament (or another instance) which means that only the calculation of the increase is defined; the increase as such is not automatic and thus exposed to political risk.
4.2.1.3. Actuarial reductions/increases for early/late retirement There is a large body of empirical evidence showing that the financial incentives
embedded in pension systems influence people’s retirement behaviour (see OECD 2011). Many OECD countries have therefore undertaken reforms in recent years to make early retirement less attractive and to encourage working longer by offering higher pensions to people who retire later.
It is not easy to get these incentives right, so that early retirement is not overly penalised and late retirement is not over-compensated. In earnings-related pension systems, it is, however, possible to devise a mechanism which is broadly “actuarially neutral”, so that the extra costs caused by early retirement and the savings incurred through late retirement are reflected in the level of pension payable at different retirement ages. Setting increments or decrements close to their actuarially-neutral value means that pension wealth (the discounted stream of all future pension payments a retiree will receive) from already accrued rights at a set pivot age is the same if retirement is deferred or anticipated. The only difference is then the additional benefit entitlement earned during the year. (See Box 5 for a detailed explanation).
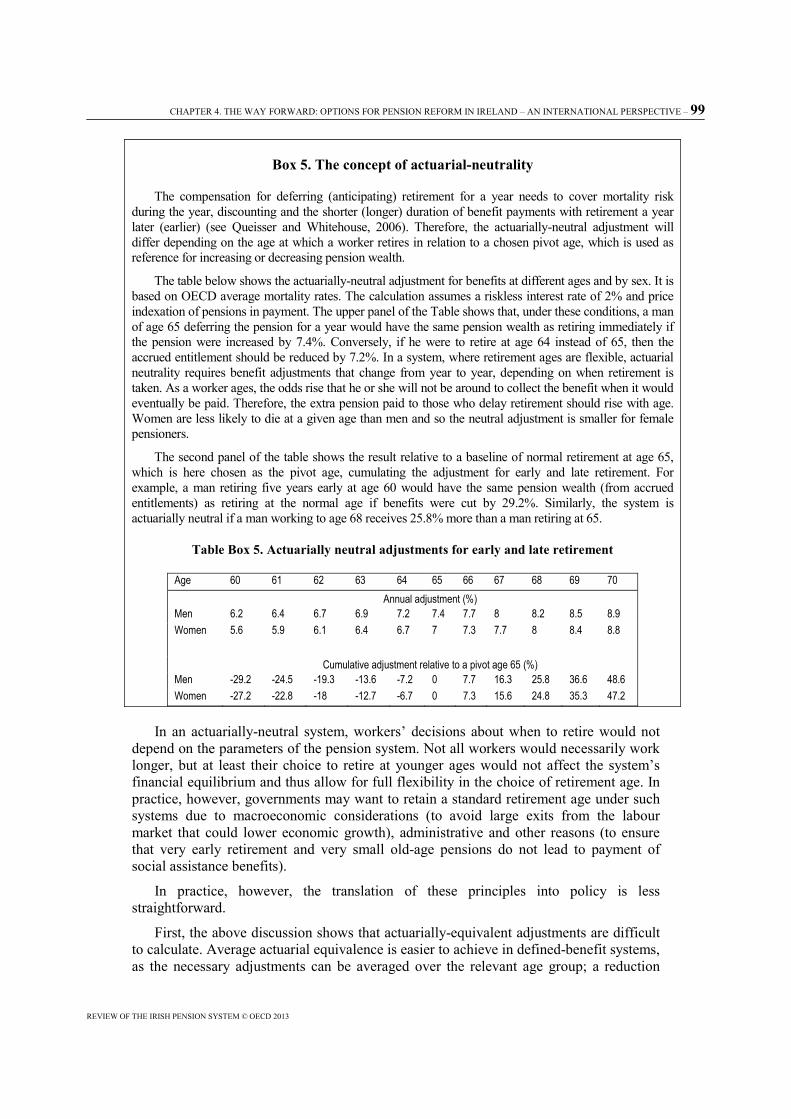
CHAPTER 4. THE WAY FORWARD: OPTIONS FOR PENSION REFORM IN IRELAND – AN INTERNATIONAL PERSPECTIVE – 99
REVIEW OF THE IRISH PENSION SYSTEM © OECD 2013
Box 5. The concept of actuarial-neutrality
The compensation for deferring (anticipating) retirement for a year needs to cover mortality risk during the year, discounting and the shorter (longer) duration of benefit payments with retirement a year later (earlier) (see Queisser and Whitehouse, 2006). Therefore, the actuarially-neutral adjustment will differ depending on the age at which a worker retires in relation to a chosen pivot age, which is used as reference for increasing or decreasing pension wealth.
The table below shows the actuarially-neutral adjustment for benefits at different ages and by sex. It is based on OECD average mortality rates. The calculation assumes a riskless interest rate of 2% and price indexation of pensions in payment. The upper panel of the Table shows that, under these conditions, a man of age 65 deferring the pension for a year would have the same pension wealth as retiring immediately if the pension were increased by 7.4%. Conversely, if he were to retire at age 64 instead of 65, then the accrued entitlement should be reduced by 7.2%. In a system, where retirement ages are flexible, actuarial neutrality requires benefit adjustments that change from year to year, depending on when retirement is taken. As a worker ages, the odds rise that he or she will not be around to collect the benefit when it would eventually be paid. Therefore, the extra pension paid to those who delay retirement should rise with age. Women are less likely to die at a given age than men and so the neutral adjustment is smaller for female pensioners.
The second panel of the table shows the result relative to a baseline of normal retirement at age 65, which is here chosen as the pivot age, cumulating the adjustment for early and late retirement. For example, a man retiring five years early at age 60 would have the same pension wealth (from accrued entitlements) as retiring at the normal age if benefits were cut by 29.2%. Similarly, the system is actuarially neutral if a man working to age 68 receives 25.8% more than a man retiring at 65.
Table Box 5. Actuarially neutral adjustments for early and late retirement
Age 60 61 62 63 64 65 66 67 68 69 70 Annual adjustment (%) Men 6.2 6.4 6.7 6.9 7.2 7.4 7.7 8 8.2 8.5 8.9 Women 5.6 5.9 6.1 6.4 6.7 7 7.3 7.7 8 8.4 8.8 Cumulative adjustment relative to a pivot age 65 (%) Men -29.2 -24.5 -19.3 -13.6 -7.2 0 7.7 16.3 25.8 36.6 48.6 Women -27.2 -22.8 -18 -12.7 -6.7 0 7.3 15.6 24.8 35.3 47.2
In an actuarially-neutral system, workers’ decisions about when to retire would not depend on the parameters of the pension system. Not all workers would necessarily work longer, but at least their choice to retire at younger ages would not affect the system’s financial equilibrium and thus allow for full flexibility in the choice of retirement age. In practice, however, governments may want to retain a standard retirement age under such systems due to macroeconomic considerations (to avoid large exits from the labour market that could lower economic growth), administrative and other reasons (to ensure that very early retirement and very small old-age pensions do not lead to payment of social assistance benefits).
In practice, however, the translation of these principles into policy is less straightforward.
First, the above discussion shows that actuarially-equivalent adjustments are difficult to calculate. Average actuarial equivalence is easier to achieve in defined-benefit systems, as the necessary adjustments can be averaged over the relevant age group; a reduction

100– CHAPTER 4. THE WAY FORWARD: OPTIONS FOR PENSION REFORM IN IRELAND – AN INTERNATIONAL PERSPECTIVE
REVIEW OF THE IRISH PENSION SYSTEM © OECD 2013
of 6 to 9% per year of early retirement (depending on age and country-specific mortality rates) would ensure that the pension benefit is the same regardless of the timing of retirement.
Second, actuarially-equivalent benefits are calculated on the basis of average life expectancy for the entire population. In reality, life expectancy varies substantially among different socio-economic groups. Low-income workers, who generally have a shorter life expectancy, are disadvantaged in such a system: they often cannot afford to retire earlier; and even, if they work longer, they will receive a pension that is lower than an actuarially-neutral benefit that takes into account their shorter remaining lifespan.
Third, strict actuarial equivalence would require lower pension benefits for women than for men because of women’s higher life expectancy. In practice, most countries willingly subsidise women’s pensions by applying single-sex life-tables, often to compensate them for the time spent in unpaid work caring for children and elderly relatives, including their retired husbands. Also, many OECD countries explicitly exclude gender discrimination in their pension systems.
Fourth, it is especially difficult to introduce actuarial equivalence into those pension systems that offer a minimum pension guarantee or any other safety-net provision directed to low-income retirees. Actuarially-equivalent benefit reductions for such workers would simply push them under the threshold of income poverty, and transfer public expenditure to means-tested programmes. In other words, actuarial neutrality will always reach its limits once pension benefits come close to the poverty line where safety nets kick in.
Despite these difficulties, several OECD countries have introduced reforms aimed at improving the incentives in their pension systems. Most countries with defined-benefit or pension-point plans reduce or increase benefits for early and late retirement, respectively. Only a few of those with targeted or basic schemes use such adjustments. Table 14 illustrates early and late adjustments for countries that have pension systems with features comparable to those of Ireland.

CHAPTER 4. THE WAY FORWARD: OPTIONS FOR PENSION REFORM IN IRELAND – AN INTERNATIONAL PERSPECTIVE – 101
REVIEW OF THE IRISH PENSION SYSTEM © OECD 2013
Table 14. Reductions and increments for early and late retirement in selected OECD countries
Country
Scheme Early age Reduction Normal age Increase (p.a.)
Australia T n.a. 67 0.6-3.6%
Denmark Basic/T n.a. 67 5.6%1
Finland T 62 4.80% 65 7.20% France DB 56-622 0/5.0% 65 5.00% Switzer-
land DB 63M/62F 4.5%3 65M/64F 5.2-6.5%
Japan Basic/DB 60 6% 65 8.40%
United Kingdom
Basic/ n.a. 68 10.4%4
Notes: DB = Defined benefit; DC = Defined contribution; n.a. = Early retirement or deferral of pension is not available; T = Targeted. Where pension ages for men and women differ they are shown as M/F.
1. The adjustment is based on the reciprocal of life expectancy at the age at which the pension is drawn. Projected life expectancy at age 68 for 2040 is 17.9 years.
2. Full pension will require a minimum contributory period (increasing from 41 to 41.5 years). Retirement from age 60 (increasing to 62) without benefit reduction is subject to this contribution condition. Retirement without reduction for long careers is allowed in the public pension scheme, for people with longer contributory periods than the full contributory record, under specific conditions. For the 1951 generation, either at 56 for people who have entered the labour force before 16 and have validated at least 42¾ years (among them at least 42¾ years with effective contribution); or at 58 for people who have entered the labour force before 16 and have validated at least 42¾ years (among them at least 41¾ years with effective contribution); or at 59 for people who have entered the labour force before 17 and have validated at least 42¾ years (among them at least 40¾ years with effective contribution). For the 1954 generation, either at 56 for people who have entered the labour force before 16 and have validated at least 43¼ years (among them at least 43¼ years with effective contribution); or at 58 for people who have entered the labour force before 16 and have validated at least 43¼ years (among them at least 42¼ years with effective contribution); or at 59 for people who have entered the labour force before 18 and have validated at least 43¼ years (among them at least 41¼ years with effective contribution).
3. A full pension requires 44 years’ contributions for men and 43 years’ for women. For a full-career worker, approximately 2.3 percentage points of the 6.8% reduction for early retirement reflects a missing contribution year; the actuarial adjustment is the residual.
4. A lump-sum payment of deferred pension plus interest can now also be claimed instead of a pension increment.
The reductions and increments can be flat-rate over a particular period or may change over time. The rationale of staggered reductions/decrements is to make the perspective of late (early) retirement more (less) attractive.
Some countries offer workers the possibility of deferring the claim or their pension while continuing to work. In defined-benefit schemes, there are two unambiguously positive effects from deferring the pension payment. First, the benefit will be paid for a shorter period and so the cost over the individual’s lifetime is lower. Secondly, people working longer will pay more in contributions. Offsetting this, the extra pension component of social contributions will mean that people will usually have a larger benefit entitlement. The degree of offset depends on the implicit return on those contributions. If a system pays a high return, the cost of the extra benefits will outweigh the extra pension contribution revenues over time. (There are other taxes and contributions that still benefit the public purse, but the focus here is just on the pension system.)
102– CHAPTER 4. THE WAY FORWARD: OPTIONS FOR PENSION REFORM IN IRELAND – AN INTERNATIONAL PERSPECTIVE
REVIEW OF THE IRISH PENSION SYSTEM © OECD 2013
Deferral of resource-tested and basic pension schemes is possible in most OECD countries. In most cases, deferral will result in a larger pension entitlement if people continue working. In some countries, however, deferral is either not possible (such as in Ireland, Luxembourg and the Netherlands) or only until a certain age, for example in Austria, Greece for people aged 68 and over, in Italy and Portugal for people aged 70 and over, in Lithuania for a maximum of five years after normal retirement age, in Malta for people up to 65 years of age, in Finland between 63 and 68 because of the higher accrual rates in that age-band.
Particularly interesting examples for Ireland could be the rules for deferred pensions in Australia, Denmark and the United Kingdom.
In Australia, the means-tested public age pension is not available before age 65 for men and before age 63 ½ for women (pension age will be equalised by 2014); mandatory private pensions, however, can be drawn much earlier. Postponing the claim of the public age pension after age 65 is possible for up to five years if people continue to work at least 960 paid hours per year, for which a bonus is paid when the age pension is claimed. As the public pension is means-tested, the bonus depends on the benefit rate a pensioner is eligible for. The bonus increases exponentially with the number of years the pension claim is deferred.
In Denmark, in line with the semi-automatic adjustment of the pension age described above, workers can defer receipt of the public basic pension for up to ten years. The pension is then increased by the ratio of the period of deferral to average life expectancy at the time the pension is claimed. For example, the projected life expectancy for a 68 year-old will be 17.1 years; the increase of the pension for postponing the claim from 67 to 68 would be 1: 1.7, i.e. 5.8%.
In the United Kingdom, late claim of the State pension increases the retirement income at a rate of 1% for every five weeks of delay, resulting in a 10.4% extra for a complete year of deferral. If the claim is postponed for at least 12 consecutive months, it is possible to take a taxable lump sum, calculated as the State pension foregone during the deferral period, plus interest which is guaranteed to be at least two percentage points above the base rate of the Bank of England. However, this last option will be abolished when the changes recently announced to the State pension will enter into force in 2017.
4.2.1.4. Retirement window with lower and upper age limits Several OECD countries have chosen to set up a retirement window or corridor,
which allows for individual choice of the retirement age within set limits. This system is currently implemented in a number of OECD countries, such as Austria, Italy, Norway and Sweden.
In practice, a retirement window is very similar to a set retirement age around which early and late retirement is allowed with corresponding increases or reductions of the pension benefit. The advantage of this system is the flexibility it allows to take account of personal circumstances of pensioners, both in terms of work capabilities and retirement preferences, even if in a basic pension scheme the same caveats regarding poverty risks for early retirees and limitations of using such possibilities for poorer pensioners apply.
In Austria, pensions are either increased or decreased by 4.2% per year around the normal retirement age of 65. For Italy, the retirement window goes from 62 to 70 whilst in Norway the upper age is 75.

CHAPTER 4. THE WAY FORWARD: OPTIONS FOR PENSION REFORM IN IRELAND – AN INTERNATIONAL PERSPECTIVE – 103
REVIEW OF THE IRISH PENSION SYSTEM © OECD 2013
Irish public servants already have a retirement window with actuarially-neutral adjustments for early retirement. Options could be explored how to apply a more flexible retirement path in the future for all Irish workers. For workers who cannot continue working until age 68, more flexible retirement options can enable an earlier exit from the labour market. If health conditions are at the root of the early retirement decision, a medical test could confirm eligibility to a disability supplement which would complement the reduced State pension entitlement.
4.2.1.5. Combining work and pension receipt The timing of people’s exit from the workforce depends not only on pension rules but
also on personal preferences for working hours and flexibility in the work schedule. Older workers in good health, for example, may prefer a smooth transition into retirement rather than stopping work from one day to the next. The opportunities to do so will depend to a large extent on factors such as the willingness of employers and the adaptability of the work place. Governments can also play a role in facilitating and possibly encouraging a flexible transition to retirement, especially in terms of applying it within the public sector.
A key issue in this context is the degree to which fiscal arrangements permit and/or reward part-time working during a period in between a full-time career job and full retirement. If taxes and social contributions on incomes earned on top of pensions are high, the incentives to continue working may be low. While in Luxembourg, for example, combining work and pensions is not permitted, social contributions are refunded to those working beyond retirement age. In the United Kingdom, those working beyond the statutory pension age are exempt from paying national insurance contributions.
A number of countries have progressive retirement measures, mainly in the form of insurance-based subsidies to people reducing their working hours. Their take-up is however still limited, mainly because they do not produce a sufficiently different income compared to full retirement to make them worthwhile, once due allowance is made for the value of leisure and any costs of working. Particularly for people who have not reached the standard pension age, higher penalties for taking a full pension early will make a partial pension combined with part-time work more attractive.
A recent report about part-time pensions in Finland has shown, for example, that those retiring with a part-time pension have net incomes which are only about 10% lower than those of their working peers. This is partly due to the fact that part-time pensioners are often those who had continuous careers and, above all, had higher earnings than others of the same age.82
Pension systems obviously also influence the extent to which work and pensions are combined. In some cases, it is simply not possible to work and draw pensions at the same time. People working part-time at the end of their career may also be penalised in terms of their pension entitlements. In final-salary schemes, lower-paid jobs towards the end of their career can substantially reduce the pension. One way of avoiding this is to base pensions on lifetime average earnings rather than final salary – which is an option adopted by a majority of OECD countries, including the Public Service Pension Scheme in Ireland. Table 15 based on Eurofound (2012) gives an overview of the situation for combining work and pensions in many EU countries.
82. See Salonen and Takala (2011).

104– CHAPTER 4. THE WAY FORWARD: OPTIONS FOR PENSION REFORM IN IRELAND – AN INTERNATIONAL PERSPECTIVE
REVIEW OF THE IRISH PENSION SYSTEM © OECD 2013
A key factor in this context appears to be information, communication and awareness building. In Denmark, lack of awareness was found to be one of the reasons for the low-take up of work and pension combinations (Larsen and Ellerbæk 2012). The Netherlands offer a good practice in this area with the website www.65pluswerkt.info that informs both employees who are considering working after their retirement, and employers who considering hiring retirees.
Table 15. Limits to combining work and pensions
Country Rule Country Rule Country Rule
Austria
<65: above EUR 349.01/month the
pension is fully withdrawn; > 65: no
limit
Greece
Possible after age 55. Limited if monthly pension income is > EUR 733, the
pension in this case is reduced by 70% for every
extra euro.
Portugal
No limit, but working in the same company as before
retirement is not allowed for three years after pension
Belgium
If above EUR 21,436.5 (single) the pension is reduced by the amount
beyond the limit. If earnings are 15%
above the threshold, the pension is fully
withdrawn
Hungary Limit: 18 times the min wage ( EUR 6,027) Romania
It is only allowed to combine work and pension if pension
< than the gross average wage ( EUR 463/year)
Bulgaria No limits Ireland
Limit: EUR 38/week under the State pension
(transition) payable between age 65 and 66. There is no
limit for the SPC
Slovak rep. No limits
Cyprus No limits. Italy
No limits. However other social benefits (i.e. disability)
or survivors' pensions are cut progressively if annual
income is > EUR 23,826.40 or > EUR 18,229.77
respectively
Slovenia Limits below normal retirement age
Czech rep
No limits. Additional annual 0.4% receiving full pension. There are
restriction for early retirement
Latvia
No limits. The pension contribution rate is lower
when combining work and pensions rather than for
pension deferral
Spain <65: pension reduced
according to the length of the working day
Denmark Partial means test of supplementary pension Lithuania No limits Sweden No limit
Estonia No limits Luxembourg No limits. Contributions paid when working are refunded
at the end of the year
United Kingdom
Pension credit is reduced by full income receipt as long as income is below
EUR 168.77/week
Finland No limits Malta No limits. Contributions rate: 10% of wage until 65 (then
contributions stop
France
No limits for the over-65s and for those aged
between 60 and 65 who have contributed for at least 40 years
Netherlands No limits
Germany
Means-tested benefit for the over 64 if > EUR 180/month: reduced by 30% of income earned and fully withdrawn if income > of the full
means-tested (i.e. EUR 180).
Poland Limits below normal retirement age
For those aged <65 on early statutory
retirement: amounts exceeding EUR 400 /month are deducted
from pensions
Source: Eurofound (2012), Income from work after retirement.

CHAPTER 4. THE WAY FORWARD: OPTIONS FOR PENSION REFORM IN IRELAND – AN INTERNATIONAL PERSPECTIVE – 105
REVIEW OF THE IRISH PENSION SYSTEM © OECD 2013
4.2.1.6. Encouraging longer working lives in Ireland As mentioned above, Ireland is among the group of OECD countries with the highest
legislated pensionable age; therefore, legislating further increases at this stage does not appear to be the most urgent priority. At some point, increasing pension ages further is likely to reach a limit where it is unreasonable to expect most people to be able to continue working ¬ although views on where that limit lies may differ significantly (see Whitehouse and Zaidi, 2008; and D’Addio and Queisser, 2011). Moreover, increases in pension ages alone may be insufficient to ensure that people work longer if there are other barriers (on the demand side, for example) to older workers finding and retaining jobs (OECD, 2011).83
The more immediate concern for Irish policy-makers should thus be to increase the effective retirement age by encouraging working longer and to address the situation of those workers who, for health reasons or related to the specific physical requirements of their occupations, may not be able to continue working up to age 68.
The decision to retire or to stay in employment at a given age depends on a number of individual and contextual factors. In particular, some features of the welfare system can be significant determinants of retirement decisions: the tax treatment of incomes, pension wealth and the possibility to access other social benefits.
On the one hand, actions have to be taken on the demand side to improve the participation rates of older workers, both in terms of encouraging retention into work of older people and of improving the opportunities for recruiting senior workers. Labour market exits for reasons other than reaching the age for pension entitlement – such as illness/disability – are frequently linked to job losses or other job-related problems; as shown above, reasons other than retirement account for 64% (71%) of permanent labour market exits of men (women) in Ireland.
Widespread stigma in the labour market against older workers has been shutting older people out of recruitment opportunities for a long time. There are three main reasons for the reluctance of employers to hire or retain older workers: i) negative perceptions about the adaptability and productivity of older workers; ii) labour costs that rise steeply with seniority or age; and iii) strict employment protection rules OECD (2006).
However, these do not look like insurmountable barriers for Ireland since, as noted above, older-worker employment rates have been rising over the past decade.
Most employment protection legislation in Ireland no longer discriminates on the grounds of age. But the Older Worker Recruiting & Retention Survey, Global Results by Manpower found that, in 2006, just 9% of Irish employers had strategies to recruit older workers and barely a quarter had put in place plans to retain older staff members after retirement age (see Manpower, 2007). Encouraging employers to understand the benefits of an age-diversified labour force should therefore be a central goal of any Irish policy initiative to encourage working longer.
Training and up-skilling are important factors to ensure the employability of older workers, especially if undertaken during the crucial mid-career period. The rigidity of the workplace can also be an important determinant in encouraging early retirement and
83. Multiple rules are still in place for public sector workers (see Section 2.4).

106– CHAPTER 4. THE WAY FORWARD: OPTIONS FOR PENSION REFORM IN IRELAND – AN INTERNATIONAL PERSPECTIVE
REVIEW OF THE IRISH PENSION SYSTEM © OECD 2013
preventing retirees from coming back into the workforce, given that older workers generally have a preference for more flexible working hours.
In 2006, the OECD made tailored recommendations to Ireland on suitable actions for improving the labour market prospects for older people. The agenda for reform consisted of three broad areas where policy action was seen as necessary to encourage work at an older age: i) strengthening financial incentives to carry on working; ii) tackling employment barriers on the side of employers; and iii) improving the employability of older workers.
Seven years later, efforts have been made to improve overall skills and job training among older workers, and especially for mid-career workers. By contrast, not enough attention has been given so far to the set-up of more flexible work arrangements, the abolition of remaining early retirement schemes (still possible for civil servants) and the issue of mandatory retirement ages.84
A 2011 study of flexible working arrangements in Ireland based on the National Workplace Survey 2009 showed that in that year 30% of employees worked flexible hours and 25% worked part-time (see Russell and McGinnity, 2011). Some 12% regularly worked from home during normal working hours, and 9% were job-sharing. This represents a marked increase in flexible working arrangements since the last such survey in 2003. Part-time work and working from home was more common in the private sector, while flexitime working was equally common in the public and private sectors. Having more flexible working arrangements available in an organisation was associated with higher job satisfaction and increased output innovation. An important role in seeking to achieve this objective was played by the National Framework Committee for Work/Life Balance that was, however, dismantled in 2010 due to budgetary constraints.
4.3. Indexation and valorisation
Two major parameters of pension systems which have an important bearing on adequacy and sustainability of pension provision are indexation, i.e. the way pensions in payment are adjusted to compensate for price and/or wage increases over time, and valorisation, i.e. the way past earnings are up-rated in the calculation of the pension benefit. For Ireland, indexation is the relevant parameter given that the State pension is not related to the individual’s earnings and only depends on the duration of contributions; valorisation thus does not apply. However, as the defined-benefit Public Service Pension Scheme is no longer based on final salaries but on career-average earnings, valorisation is relevant for public service pensions. The valorisation rule for new entrants to the Irish public service scheme is to up-rate past earnings in line with consumer prices.
The State pension in Ireland is set at a target level of about 35% of average earnings. As the stated policy is to maintain the benefit at this level, this approach is akin to an indexation to average wage growth. During recent years, however, applying this principle would have led to decreases in nominal pension levels. Therefore, the indexation was suspended and the pension level was frozen, remaining today at its 2009 level. Public service pensions for new entrants or Single Scheme members are now linked to price inflation.
84. It is worth noting that the Pre-Retirement Allowance (PRETA) – which was for people aged 55
and over who have left the labour force – has been discontinued since 4 July 2007.
CHAPTER 4. THE WAY FORWARD: OPTIONS FOR PENSION REFORM IN IRELAND – AN INTERNATIONAL PERSPECTIVE – 107
REVIEW OF THE IRISH PENSION SYSTEM © OECD 2013
While adjustments were necessary in the crisis situation, Ireland could consider alternative options for indexation of pension benefits in the future. Indexation is a key parameter for pension adequacy because of its effects over the long term, as even relatively low levels of inflation can have a significant effect on pensioners’ living standards. With average life expectancy at pension age of nearly 19 years for men and 23 years for women, an annual 2.5% increase in prices would reduce the real value of pensions by 38% for men and 44% for women over the retirement period. As pensioners are not able to adjust to such volatility by changing work and savings strategies, most countries have devised pension indexation mechanisms.
There is, however, no clear indexation policy that applies to the majority of OECD countries, even if price indexation is slightly more common than wage indexation. Within price indexation there is also a variety of approaches. For example, in Portugal, there is a higher indexation for lower pensions and, prior to the 2011 reform, Italy had a three-tier system, of 100%, 90% and 75% indexation depending on the pension level.
Many countries have chosen a combination of price and wage indexation, with a 50/50 split being the most common. This method is in place in Estonia, Hungary, the Slovak Republic and Switzerland while the Czech Republic has adopted a 33% wages, 67% prices combination and Finland has a 20% wages and 80% prices mechanism. In the United Kingdom, the basic pension is indexed to the greater of price or wage inflation but with a caveat that the increase is at least 2.5%.
Some countries have introduced additional constraints to the indexation mechanism, whether it is by prices or wages. In Canada, for example, pensions are indexed to prices but the adjustment is conditional on financial sustainability. This is also the case for Germany, the Netherlands and Sweden where other factors that matter for sustainability are considered in addition to wage indexation.
The adoption of automatic indexation does not however mean that the adjustment of retiree’s benefits is no longer a policy issue. Firstly, assuming that prices rise less than wages in the long term, indexing pensions to prices will lead to falling living standards of pensioners relative to the working-age population, which may make discretionary increases necessary. On the other hand, pensions are not immune from the increasing financial pressures due to a deteriorating economic situation. In the context of the crisis, both Spain and Greece, respectively, have decided to freeze or even reduce social benefits, including pensions.
Finally, valorisation will matter for new entrants to the Public Service Pension Scheme. Under standard OECD economic assumptions (with positive real wage growth) and for a full career, valorisation in line with prices produces a pension level equivalent to 65% of that with wage valorisation. The most common valorisation practice amongst OECD countries is to revalue earlier years’ pay with the growth of average earnings. However, in Belgium, France and Spain previous earnings are revalued in line with price inflation. Some countries have chosen a combination of the two methods, with Finland using 80% wages and 20% prices and Portugal having 25% wages and 75% prices.
For the long term, Ireland would benefit from a change in the valorisation process to follow on from the career averaging that has already been adopted in many cases. Introducing a split 50/50 valorisation between prices and wages would both ensure that pensions would remain adequate and more financially sustainable. The issue for Ireland is how to get to this stage and this depends on how future policies relate to the civil service scheme, which is the main financial burden to the State in relation to DB pensions. If the

108– CHAPTER 4. THE WAY FORWARD: OPTIONS FOR PENSION REFORM IN IRELAND – AN INTERNATIONAL PERSPECTIVE
REVIEW OF THE IRISH PENSION SYSTEM © OECD 2013
scheme is changed to a DC pension, the issue of valorisation will no longer be an issue; however, if it remains unchanged, the cost to the State will continue to increase, placing even greater financial constraints on the budget. In this latter case the speed of change to a mixed valorisation approach needs to be fully costed and evaluated before any decision is taken.
4.4. Options for structural reform of the Irish pension system
In the following section, a series of structural reform options for the Irish system are outlined. These options are based on OECD country experiences and existing models. Each option is explained briefly; much more information on the various models is available on www.oecd.org/els/social/pensions/PAG.
The options for reform discussed in this section can be combined in different ways; their detailed design will also depend on which route Ireland wishes to choose to achieve the stated goal of increasing coverage of private pensions, for example, whether the new private pension system should be mandatory, voluntary or based on auto-enrolment. In putting the different elements of the system together, it is crucial to take a comprehensive and forward-looking view of pension provision in Ireland. Given the on-going economic uncertainty, it may not be possible to implement any further major reforms in the short term. Although increases have been made to retirement age, along with career averaging for the State pension (contributory) further structural reform decisions need to be taken. A definitive choice should be made today regarding the structure of private pensions and its interaction with the State pension, with a view to implementation in the future. Given the many years that pension reform has already been discussed in Ireland without some fundamental choices being made about the way ahead, the time is ripe now to take some fundamental decisions on the future of Irish pensions.
4.4.1. Reform of the State pension scheme If Ireland were to consider a structural reform of the State pension scheme, which
today consists of a contributory and a non-contributory pension, there would be essentially three different options to choose from:
1. A universal basic pension scheme for the entire population; such a scheme would be based on residency requirements, provide a single flat-rate benefit and cover all of the Irish population, regardless of their life-time work or contribution status. Basic universal pension schemes exist in a number of OECD countries, for example in New Zealand, Denmark and the Netherlands. There are various ways in which such a basic pension could be financed: by taxes, by contributions or by a combination of the two.
2. A single means-tested pension which is financed out of taxes. Australia’s age pension is an example of such a scheme.
3. A basic earnings-related pension scheme with redistributive features, such as the Swiss public pension scheme.
In considering these alternative structural reform models, it should be kept in mind that each of the national schemes discussed in this section was adopted in a specific national economic, social and political setting. There is no blueprint for reform which Ireland could take off the shelf and implement. Any solution has to fit the Irish situation.

CHAPTER 4. THE WAY FORWARD: OPTIONS FOR PENSION REFORM IN IRELAND – AN INTERNATIONAL PERSPECTIVE – 109
REVIEW OF THE IRISH PENSION SYSTEM © OECD 2013
In addition, any structural reform would have to be carefully costed for both the short and the longer term.
4.4.1.1. Universal basic pension scheme Currently, the Irish system has a State pension (contributory) and a means-tested State
pension (non-contributory) with little difference between the levels of the two benefits.
As noted above, recent reforms have introduced a closer link between contribution periods and State pension entitlements through modification of the rate bands; Irish projections show that this will substantially lower the percentage of State pensions (contributory) paid at the full-rate.
A commonly heard counter-argument against a universal basic pension scheme in Ireland is that the link between contributions and pensions is well-established in Ireland and that this provides incentives for workers to contribute to the Social Insurance Fund. However, as discussed in Section 3.9.2, the contribution-benefit link in the Irish system is in reality already very weak. Under the planned total contributions approach, a full-rate pension benefit will be awarded to anyone who has paid 30 years of contributions and there will likely also be credit for non-contributory periods spent caring for children or in unemployment, which will weaken the link further.
From a financing perspective, Irish workers pay contributions to the Social Insurance Fund to receive insurance coverage for a range of contingencies; the link between individual contributions and pension benefits is therefore not very transparent for contributors. In addition, the Irish pension system already has one universal element which provides substantial resources, particularly to poorer pensioners: the household benefits package (HBP). The HBP, albeit sharply reduced in the 2012 Budget, is means-tested for retirees under the age of 70.85
There is thus already a substantial overlap between contributory and non-contributory benefits for retirees and an only partial link between contributions and future benefits for active workers. This raises the question whether maintaining two parallel benefit schemes is the most efficient way to go for Ireland.
An alternative arrangement would be to introduce a basic flat-rate benefit for all Irish retirees. New Zealand, most of the Nordic countries and the Netherlands have such residency-based basic pension schemes. In Denmark, Finland, Sweden, Iceland and Norway, the basic pension is based on 40 years residency from age 16. Often there is an element of means-testing as the basic pension is reduced when there is pension income from other sources (such as from earnings-related or occupational schemes). Entitlement is based on a minimum qualifying period of three years and pensions are pro-rated.
In the Netherlands, people are insured between the ages of 15 and 65. If a person has lived in the Netherlands during this time, he/she will have been insured for that entire period, regardless of whether he/she has paid contributions or not. There is no minimum qualifying period as in the Nordic countries. However, every insured person who receives
85. Even before age 70, about 60% of retirees are potentially eligible for this benefit because their
gross income is below the maximum weekly means limit. In fact, people aged between 66 and70, who satisfy a means test and live alone, are eligible to the HBP.
110– CHAPTER 4. THE WAY FORWARD: OPTIONS FOR PENSION REFORM IN IRELAND – AN INTERNATIONAL PERSPECTIVE
REVIEW OF THE IRISH PENSION SYSTEM © OECD 2013
an income must pay contributions. The contribution is levied at the same time as taxes.86 Dutch citizens need to be registered in the population register. Non-Dutch citizens need to provide a residence permit.
In New Zealand, the basic pension is neither income- nor asset-tested and is paid to all people aged 65 and over who meet the residence requirement. To fulfil the residency test, a person must be either a New Zealand citizen or permanent resident, or have been resident and present in New Zealand for not less than ten years since the age of 20, of which five years or more must be since the age of 50. New Zealand citizens are not obliged to hold a residency permit so other proof of residence may be used.
In Ireland, a basic pension could be set at a modest level and complemented by a means-tested supplement for pensioners who have no other income sources such as occupational or private pensions or other assets. This supplement could either be paid in addition to the HBP or replace it by adding the cash value of the package onto the basic pension or award benefits in-kind as under the current system.
The means-test would also enable taking into account the impact of different living arrangements of pensioners, such as the higher poverty risk of older people living alone. Pensioners living in couples and receiving two full basic benefits could receive a couple-rate. The benefit could continue to be integrated with occupational pension provision, as is already the practice.
Financing of such a universal basic pension could be through general revenue as in New Zealand or through contributions as in the Netherlands. In the Netherlands, pension contributions are, however, levied only on the first tranche of the income tax schedule and neither the duration nor the level of contributions affects the pension level. In 2010, the Dutch contribution rate was 17.9% up to an annual income of EUR 32,738. The pension is reduced, however, for missing periods (for example because of living abroad), but this difference is covered through the means-tested social assistance scheme which offers the same level. In this respect, the Dutch basic pension scheme is very similar to the Irish dual contributory/non-contributory pension arrangements, albeit at the same level.
One argument that is often put forward against a residency-based universal pension in Ireland is the absence of a residency register for people living and working in Ireland. However, there is already a limited residency requirement for receipt of the HBP and it should be possible to devise a scheme under which other proof of residence can be provided at least for five to ten years before reaching the normal pension age.
It is important to remember, however, that in the countries mentioned above, the first pillar generally delivers only a part of the total retirement income and the public share is sometimes relatively small in the overall package. Apart from New Zealand, all other countries have additional mandatory or quasi-mandatory pension systems (either private or public) on top of the basic pension. The combination of private and pension schemes is thus a key element in the design of a pension scheme.
86. The amount of the old-age pension depends on the marital status/living arrangement of the
entitled person. For example, people who are married will get 50% each of the minimum wage, while a single person will get 70% of the minimum wage.

CHAPTER 4. THE WAY FORWARD: OPTIONS FOR PENSION REFORM IN IRELAND – AN INTERNATIONAL PERSPECTIVE – 111
REVIEW OF THE IRISH PENSION SYSTEM © OECD 2013
4.4.1.2. Tax-financed means-tested old-age pension On the other end of the spectrum of reform options for the public pension system is a
fully means-tested pension which is gradually withdrawn as the pensioner’s resources increase. Retirees whose resources exceed a certain level are not entitled to any public pension benefit in such a system. This model has been adopted in Australia. The Australian pension system consists of three pillars. The first is the means-tested flat-rate age pension. This is complemented by mandatory private pensions known as the Superannuation Guarantee. The third pillar consists of voluntary private pensions.
Australia’s first pension “pillar”, the Age Pension, serves primarily to guarantee a minimum standard of living but is not supposed to be the main component of retirement income for most people. It is worth only about one third of average full-time earnings. The Age Pension’s value is increased in line with price increases. It starts to be withdrawn once annual income from other sources exceeds a threshold known as the ‘free area’. An asset test is also applied. Just over 60% of pensioners receive the maximum-rate Age Pension. Almost 39% of all pensioners receive reduced benefits due to the means test. Within this group, 72% are income- tested and the remainder are asset-tested.
Superannuation as a form of savings has existed for more than a century in Australia. It was paid as a benefit to certain public sector employees and larger corporate organisations as early as the mid-1800s. In 1986, superannuation was introduced in industry, requiring individuals to pay 3% of their remuneration as superannuation contributions. As a result, coverage of superannuation increased substantially between 1986 and 1990 from around 40% of employees to 79%. Coverage in the private sector grew from 32% in 1987 to 68% in 1991. However, a substantial share of workers in the private sector was not covered. In addition, the 3% contribution rate was considered too low to provide for an effective increase in retirement incomes.
To remedy these deficiencies, the Government introduced in 1992 the ‘Superannuation Guarantee’. Employers were obliged to participate in this scheme and if they did not do so, they had to pay penalties that were larger than the contributions. The scheme started with employer contributions of 3% of salary (4% for employers with an annual payroll greater than AUD 1 million). Over a ten-year period contribution rates were increased to 9% in 2002/03. The contribution rate will be increased gradually with initial increments of 0.25 percentage points on 1 July 2013 and on 1 July 2014. Further increments of 0.5 percentage points will apply annually up to 2019-20, when the rate will reach 12%.
The superannuation guarantee initially provided for very few exemptions, mainly concerning employees earning less than AUD 450 per month, part-time employees under 18 years of age and employees aged 65 or over. The upper age limit for contributions was extended in 1997 from 65 to 70 years, and more recently to 74 years. As a result, coverage of occupational schemes has risen from 39% in 1986 to over 90% of workers today. Most superannuation schemes are on a DC rather than DB basis.
Many resource-tested pension schemes, including the Australian Age Pension, interact with the value of private pensions. In Australia and Denmark, for example, most current retirees receive resource-tested benefits.87 The value of these entitlements
87. If private pensions are not mandatory, however, these safety-nets for retirees might lead workers
to spend rather than save their money for retirement, in the expectation that without savings they

112– CHAPTER 4. THE WAY FORWARD: OPTIONS FOR PENSION REFORM IN IRELAND – AN INTERNATIONAL PERSPECTIVE
REVIEW OF THE IRISH PENSION SYSTEM © OECD 2013
increases as private pensions deliver lower returns, protecting much of the incomes of low- and middle earners. The withdrawal rate of the benefit against other income sources is currently 40% in Australia and 30% in Denmark. The public retirement-income programmes thus act as “automatic stabilisers”, meaning that some or most retirees do not bear the full brunt of the effect of the financial crisis on their income in old age.
4.4.1.3. Mandatory earnings-related pension A third option for structural pension reform in Ireland is to have a single public
earnings-related pension system. This is the route followed by Switzerland which like the majority of OECD countries, has a multi-pillar pension system.
The Swiss pension system comprises an unfunded and highly redistributive public pillar, a funded occupational pension pillar, and a third pillar based on personal savings. The first two are compulsory and the third voluntary. All Swiss residents participate in the public scheme, even if they are not working, and everyone has to pay at least a minimum contribution. Like in Ireland, there is no ceiling on contributions made to the public pension scheme.
The pension benefit is related to earnings and based on the lifetime average. There is a minimum pension, worth about 18% of average earnings, and a maximum pension which corresponds to twice the minimum benefit, i.e. 36% of average earnings. Between these lower and upper thresholds, the benefit is calculated in relation to individual earnings. The absence of a ceiling on income for the purpose of contributions, combined with a fairly flat benefit structure, results in a highly redistributive structure of the public pension system. For higher incomes, the replacement rate falls steeply to very low levels for this group (see the OECD, 2011 for more detail).88
The coordination between the public and the private pillar works in such a way that only people over a certain income threshold are mandatorily insured in occupational schemes. Employers are obliged to provide workers with earnings over the threshold with private pensions.
If Ireland would want to keep a link between contributions and pensions, the Swiss model could be an alternative to the purely duration-based model that Ireland currently has. Pension benefits would be linked to previous earnings within narrow limits and all Irish residents would participate in the scheme, thus ensuring complete coverage. Note, however, that again this system is combined with mandatory rather than voluntary private pensions.
will qualify for the means-tested benefit. This observation has led to a policy debate in some countries with voluntary private pensions regarding the relationship between the public safety-net and the individual savings effort. In Germany, for example, there is a debate on whether private pension savings should be disregarded in determining eligibility for the means-tested benefit; otherwise, it is feared there would be a disincentive for workers to take up private pensions, even though they are highly subsidised in Germany.
88. There is a locally-based additional means-tested benefit available to take account of the fact that income needs vary across Switzerland between metropolitan and rural regions, for example. Only very few people receive this supplement today.

CHAPTER 4. THE WAY FORWARD: OPTIONS FOR PENSION REFORM IN IRELAND – AN INTERNATIONAL PERSPECTIVE – 113
REVIEW OF THE IRISH PENSION SYSTEM © OECD 2013
4.5. Public service pensions
4.5.1. How do pension arrangements for Irish public servants compare to those in other OECD countries?
At present, around half of OECD countries have special pension schemes in place for public servants. However, in recent times, there has been a trend towards the harmonisation of pension policies for private and public sector workers, especially through the abolition of early retirement opportunities for civil servants and the introduction of some pre-funding or fully-funded complementary pension schemes.
This reform process has been driven mainly by the necessity to alleviate the fiscal burden imposed by relatively generous public employees’ pension schemes; but also by the will to introduce more equitable and financially sustainable social security systems.
The organisation of retirement-income provision for public-sector workers differs significantly between OECD countries (Table 16). The simplest arrangements are at the left- and right-hand ends of the spectrum presented in Table 16. At the left are seven countries where public-sector workers have exactly the same pension arrangements as their private-sector counterparts. These are all former socialist countries of Central and Eastern Europe and Mexico.89
At the other end of the spectrum lie nine countries in which there are entirely separate retirement-income arrangements for the public and private sectors. Here, public-sector workers are not covered by the national pension scheme. Moreover, the parameters and rules that determine benefit levels and eligibility are different from the national plan. Either pension benefits differ for people with the same earnings and career profiles, indexation procedures for pensions in payment vary or access to pensions is possible at different ages than in the national scheme, or some combination of these. In many countries, some low-paid, public-sector employees might be eligible for the safety-net benefits that are part of national retirement-income provision, such as means-tested benefits or non-contributory minimum pensions.
In the second column in Table 16, there are five countries in which there are again separate schemes for the public and private sectors. Unlike the countries in the right-hand column, however, benefit levels, indexation policies and pension eligibility ages are very similar. In Finland and Iceland, private-sector workers must be covered by occupational pension schemes which have the same or very similar parameters and rules to the schemes for the public sector. In Denmark and the Netherlands, nearly all the private-sector workforce is covered by occupational plans, but these are not compulsory. Instead, this is achieved through industrial-relations agreements; hence, the OECD (2011a) calls them “quasi-mandatory”. In both cases, there is variation in parameters and rules between different schemes. However, public-sector arrangements are broadly similar to the typical plan for private-sector workers. Similarly, the recent conversion of Israel’s public-service scheme from defined-benefit to defined-contribution and the introduction of mandatory defined-contribution schemes for private-sector workers mean that the two sets of arrangements are fairly closely aligned.
89. It is interesting to note, however, that even where there has been a trend towards harmonisation,
a number of separate schemes or rules usually exist for some categories of civil servants, such as the armed forces, police, fire-fighters, etc.

114– CHAPTER 4. THE WAY FORWARD: OPTIONS FOR PENSION REFORM IN IRELAND – AN INTERNATIONAL PERSPECTIVE
REVIEW OF THE IRISH PENSION SYSTEM © OECD 2013
Public-sector workers in the 12 countries in the third column of Table 16 are covered by the same arrangements as their private-sector counterparts. Unlike the countries in the first column, however, there are top-up arrangements to provide additional benefits to the national scheme. These vary significantly. In Italy and Slovenia, for example, the top-up is relatively small. Furthermore, it is not a statutory requirement in Italy (rather a result of industrial-relations agreements) and covers by no means all public-sector workers.90 In Canada – like in Ireland – the public-sector scheme provides much more substantial benefits on top of relatively modest public benefits. New Zealand is perhaps unique in the world in having abolished its centralised civil-service pension scheme. Instead, government departments and agencies are free to set up their own arrangements if they wish.
Australia and Switzerland might, arguably, be moved from “integrated with top-up” to the second column. Both have mandatory private pensions for private-sector workers. Australia recently changed its public-service scheme from the DB to the DC type, matching the arrangements for the private sector.91 However, government contributions as an employer are above the statutory minimum, although many private-sector employers offer similar deals. Similarly, many Swiss workers in the private sector receive benefits above the mandatory minimum.
In Finland, alignment between the private and public sectors has been ongoing since 1967. For instance, in 1989, partial pensions were introduced in both sectors. Beginning in 1993, a fundamental reform of public and private sector schemes was carried out which tried to correct the financial imbalances stemming from population ageing and early retirement. Because of the reform, the benefits for workers in the two sectors have become more similar. The reform, which had been intended to apply only to new entrants to the public sector, was eventually extended in 1995 to all persons under 55.
In Austria, an increasing number of public-service employees (contract staff) are subject to the same regulation as private sector employees. “Tenured” public service employees (civil servants) are subject to different rules in some areas of social protection.92 Under the 2004 pension reform, the provisions of the statutory pension insurance system will increasingly apply to civil servants under the age of 50 (2005). Pensions of civil servants appointed from 1 January 2005, and of those born on or after 1 January 1976, will be assessed in accordance with the same rules as the ones used under the statutory pension scheme (ASVG).
90. In Italy, a further step towards alignment of pension arrangements for civil servants and
employees or self-employed has been introduced by the 2012 pension reform. The reform has unified the two formerly separated authorities that administer, respectively, public- and private-sector pension assets: INPDAP and INPS. This move is intended to open the way forward to non-discriminatory pension arrangements across sectors.
91. The original DB, partially funded, Australian Public Sector Superannuation Scheme (PSS) was closed to new members in 2005 and replaced by the PSSap, a fully funded DC plan, open to any new entrant in government jobs.
92. These regulations differ according to employer, i.e. federal, Lander, local governments, Austrian federal railways, etc.

CHAPTER 4. THE WAY FORWARD: OPTIONS FOR PENSION REFORM IN IRELAND – AN INTERNATIONAL PERSPECTIVE – 115
REVIEW OF THE IRISH PENSION SYSTEM © OECD 2013
Table 16. Public-sector workers’ pensions: institutional arrangements in OECD countries
The United States offers an interesting example of the steady integration of groups of
workers into the national pension arrangements (known as social security).93 State and local governments were allowed to enrol their employees in social security; and the military and federal employees not covered by the Civil Service Retirement System were enrolled during the 1950s. From 1983, new civilian employees of the federal government were also covered by social security, the value of the additional DB element was significantly reduced and a new DC scheme, the Thrift Savings Plan (with government contributions as employer and voluntary employee contributions), was added on top.
In the United Kingdom, the Government has recently reached an agreement on the public sector pension schemes. In July 2012, it announced that the Public Service Pensions Bill will be brought forward “to establish a common framework for public service pensions and ensure that the schemes are sustainable with costs shared more fairly between employers, public service workers and taxpayers”. New legislation should be published before end of April 2013.94
Pension arrangements for public-sector workers are often ill-equipped to deal with job mobility. They were designed for a situation when people spent all or most of their career in the civil service from their entry until retirement. Pension schemes can penalise mobile workers in two main ways.
The first is through long “vesting” periods. People who leave the public service before their pension rights are vested often receive nothing from the system, or, at best, a modest lump-sum reflecting individual contributions. In Ireland, the vesting period is 2 years. Vesting is immediate (or takes one year or less) in Canada, Finland, the Netherlands, Sweden, Switzerland and the United Kingdom, for example. At the other end of the spectrum, service of at least 15 years is needed in Austria, France, Portugal and Spain.
The second way in which the pension system impedes mobility is through the treatment of “early leavers”, i.e. people whose pension rights are vested but who leave the civil service before retirement. An important concept here is that of “preservation”. The former public servant’s pension is deferred from the time they leave the job until
93. See Schreitmueller (1988) for a comprehensive review.
94. services.parliament.uk/bills/2012-13/publicservicepensions.html.
Fully integrated
Institutionally separate with similar benefits
Fully integrated with top-up arrangements
Partially integrated with top-up scheme
Entirely separate institutions and benefits
Chile Czech Republic Estonia Hungary Mexico Poland Slovak Republic
Denmark Finland Iceland Israel Netherlands
Australia Canada Ireland Italy Japan New Zealand Norway Slovenia Spain Sweden Switzerland United States
United Kingdom Belgium France Germany Greece Korea Luxembourg Portugal Turkey
116– CHAPTER 4. THE WAY FORWARD: OPTIONS FOR PENSION REFORM IN IRELAND – AN INTERNATIONAL PERSPECTIVE
REVIEW OF THE IRISH PENSION SYSTEM © OECD 2013
retirement, but some adjustment is made to the benefit value to reflect changes in costs or standards of living during that period. This preserves to some degree the value of the benefit at the time of leaving the job.95
Problems of mobility and portability arise particularly in DB schemes; mobility is much less of a challenge in DC schemes as every public servant has his or her own account and entitlements are accumulated regardless of the type of employer.
4.6. Should there be separate pension schemes for public and private sector workers?
A key policy question is whether this “dualism” of retirement-income provision still makes sense today or whether public-sector workers should be integrated into a single national pension programme.
First, many of the historical rationales for the original public-sector pension arrangements are less relevant now that national pension systems are in place. Pension schemes were often part of broader reform of the civil service to ensure professionalism and independence of employees from outside influence. This is less relevant today in the world of “revolving doors” between the public and the private sectors. The evidence on the extent of mobility is somewhat limited, but data from several countries show that few retiring public-sector workers have spent all or nearly all of their careers in a single scheme. Pension schemes were also designed to enhance the appeal of working for the public service. But public-sector pensions are often expensive, and it is important to evaluate whether this is a cost-effective recruitment tool compared with alternative policies.
Secondly, there are many arguments against dualism. On the equity side, there is the issue of comparability of benefits between public- and private-sector retirement-income provision. After all, it is private-sector workers’ taxes that finance much of public-sector workers’ pensions. Comparability of pension packages between sectors is in constant flux. Many national pension schemes which cover private sector workers have seen significant reforms in the past two decades. Furthermore, there has been much change to private pensions for private-sector workers in most of the countries where coverage of these is broad. In Canada, Ireland, Sweden, the United Kingdom and the United States, for example, there is a pronounced trend away from DB to DC provision.96 It seems difficult to argue that public-sector workers require higher income replacement in retirement (or consumption smoothing over the lifecycle) than their counterparts in the private sector.
On the efficiency side, administrative issues can be important. There are significant economies of scale in managing unified pension systems: in contribution collection, record-keeping and benefit payment, for example. Dual arrangements can entail significant duplication and wasted administrative expense, especially in smaller countries. But even in larger countries, there are cases of very fragmented provision between different groups of public-sector workers. Furthermore, the people who manage national
95. Preservation is thus akin to “valorisation” or pre-retirement indexation of benefits: see OECD
(2011a) for a discussion.
96. See Box I.1 in OECD (2009a) for detailed data on this trend.
CHAPTER 4. THE WAY FORWARD: OPTIONS FOR PENSION REFORM IN IRELAND – AN INTERNATIONAL PERSPECTIVE – 117
REVIEW OF THE IRISH PENSION SYSTEM © OECD 2013
pension schemes are generally employees of the civil service or of general government. If they are also members of the national scheme, they have a direct, personal interest in ensuring that this programme is well managed. Next, barriers to mobility between public and private sectors may reduce economic efficiency. The complexity of pension arrangements in public and private sectors makes it very difficult for individuals to compare the attractiveness of different jobs. Through greater transparency, a common pension scheme would make such choices easier and facilitate labour mobility.
The argument is often put that higher pensions for public-sector employees than offered by national schemes are a form of compensation for lower wages. The vast literature analysing differentials between the two sectors does not, however, provide robust evidence for such a differential. First, the differences in observable characteristics between public- and private-sector employees need to be taken into account: the public sector, for example, employs a disproportionate share of graduates. Secondly, the pay differentials have often been found to vary between different kinds of people: between men and women and between people with high levels of educational attainment and those with lower education levels. Careful analysis of both pay differentials and of differences in pension entitlements are needed before a definitive assessment can be made of the compensation argument for different public-sector pension arrangements.
4.7. What remains to be done in Ireland?
As outlined in Section 2.4.1 above, Ireland has already undertaken several significant reforms in public service pensions since 1995. The international comparison shows that Ireland thus belongs to the group of more advanced countries in this area. Nevertheless, more could be done to reduce government liabilities for public servants, and to ensure more equity between public and private sector workers. The introduction of a new pension scheme for new entrants in the public sector (which was enacted in July 2012) provides a unique opportunity to move forward in this area.97
4.7.1. Review the grand-fathering of existing public servants The introduction of the new rules in the DB pension scheme for public servants in
Ireland excluded all existing public servants, with the exception of post-retirement indexation which applies to both pensioners and serving Single Scheme members.
To illustrate how the grandfathering rules affect the access to and the level of pension, the case of an established civil servant with a 40-year career and a pensionable remuneration of EUR 50,000 is taken. We assume that recruitment has occurred at three different dates: a) before 6th April 1995; b) after 6th April 1995; and c) after April 2004. Table 17 summarises the entitlements for the different categories of public servants, depending on their date of entry in the public service. It shows that new entrants are generally entitled to lower amounts and since 2004 an unreduced pension is not available before age 65 (for the occupational pension) and 66 (for the State pension). As mentioned earlier, all rule changes are only applied to new entrants after the key dates on which the reforms kicked in.
97. See the Public Service Pensions (Single Scheme and Other Provisions) Act 2012.
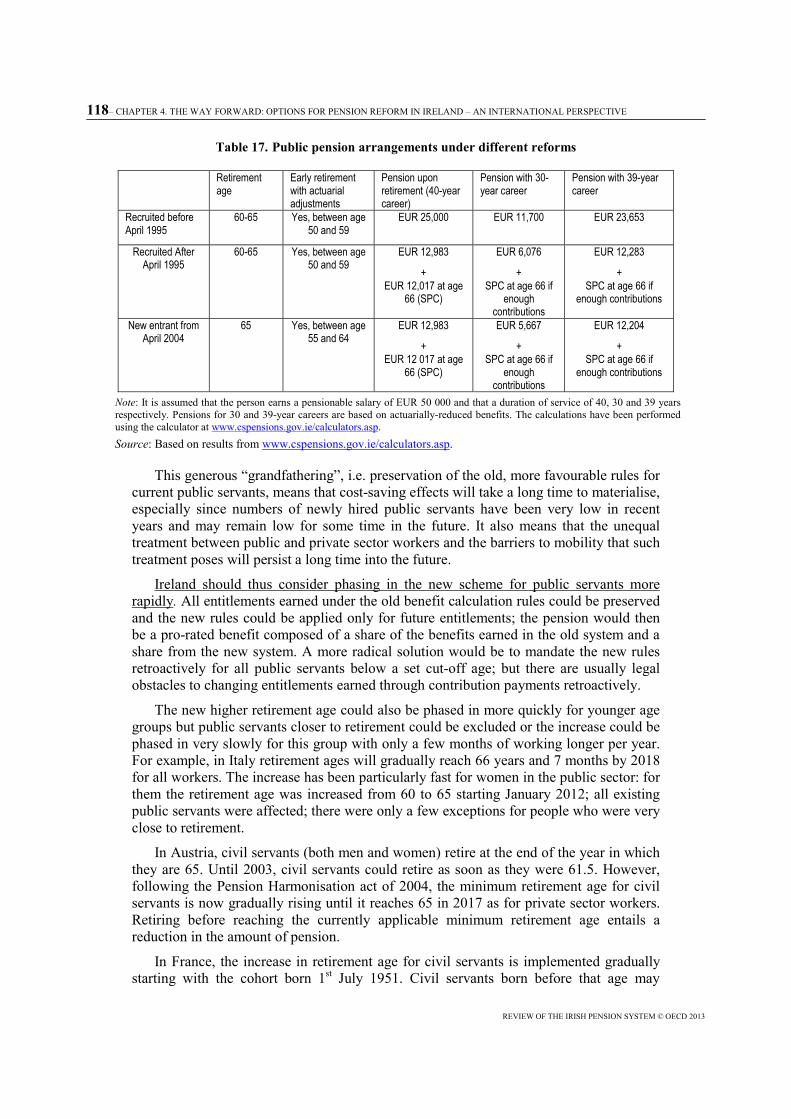
118– CHAPTER 4. THE WAY FORWARD: OPTIONS FOR PENSION REFORM IN IRELAND – AN INTERNATIONAL PERSPECTIVE
REVIEW OF THE IRISH PENSION SYSTEM © OECD 2013
Table 17. Public pension arrangements under different reforms
Retirement age
Early retirement with actuarial adjustments
Pension upon retirement (40-year career)
Pension with 30-year career
Pension with 39-year career
Recruited before April 1995
60-65 Yes, between age 50 and 59
EUR 25,000 EUR 11,700 EUR 23,653
Recruited After April 1995
60-65 Yes, between age 50 and 59
EUR 12,983
+ EUR 12,017 at age
66 (SPC)
EUR 6,076
+ SPC at age 66 if
enough contributions
EUR 12,283
+ SPC at age 66 if
enough contributions
New entrant from April 2004
65 Yes, between age 55 and 64
EUR 12,983
+ EUR 12 017 at age
66 (SPC)
EUR 5,667
+ SPC at age 66 if
enough contributions
EUR 12,204
+ SPC at age 66 if
enough contributions
Note: It is assumed that the person earns a pensionable salary of EUR 50 000 and that a duration of service of 40, 30 and 39 years respectively. Pensions for 30 and 39-year careers are based on actuarially-reduced benefits. The calculations have been performed using the calculator at www.cspensions.gov.ie/calculators.asp. Source: Based on results from www.cspensions.gov.ie/calculators.asp.
This generous “grandfathering”, i.e. preservation of the old, more favourable rules for current public servants, means that cost-saving effects will take a long time to materialise, especially since numbers of newly hired public servants have been very low in recent years and may remain low for some time in the future. It also means that the unequal treatment between public and private sector workers and the barriers to mobility that such treatment poses will persist a long time into the future.
Ireland should thus consider phasing in the new scheme for public servants more rapidly. All entitlements earned under the old benefit calculation rules could be preserved and the new rules could be applied only for future entitlements; the pension would then be a pro-rated benefit composed of a share of the benefits earned in the old system and a share from the new system. A more radical solution would be to mandate the new rules retroactively for all public servants below a set cut-off age; but there are usually legal obstacles to changing entitlements earned through contribution payments retroactively.
The new higher retirement age could also be phased in more quickly for younger age groups but public servants closer to retirement could be excluded or the increase could be phased in very slowly for this group with only a few months of working longer per year. For example, in Italy retirement ages will gradually reach 66 years and 7 months by 2018 for all workers. The increase has been particularly fast for women in the public sector: for them the retirement age was increased from 60 to 65 starting January 2012; all existing public servants were affected; there were only a few exceptions for people who were very close to retirement.
In Austria, civil servants (both men and women) retire at the end of the year in which they are 65. Until 2003, civil servants could retire as soon as they were 61.5. However, following the Pension Harmonisation act of 2004, the minimum retirement age for civil servants is now gradually rising until it reaches 65 in 2017 as for private sector workers. Retiring before reaching the currently applicable minimum retirement age entails a reduction in the amount of pension.
In France, the increase in retirement age for civil servants is implemented gradually starting with the cohort born 1st July 1951. Civil servants born before that age may
CHAPTER 4. THE WAY FORWARD: OPTIONS FOR PENSION REFORM IN IRELAND – AN INTERNATIONAL PERSPECTIVE – 119
REVIEW OF THE IRISH PENSION SYSTEM © OECD 2013
continue to retire at 60. Retirement age will increase to 60 years and 4 months for those born 1st July 1951, to 60 years and 9 months, for those born 1st January 1952, to 61 years and 2 months for those born 1st January 1953, to 61 years and 7 months for those born 1st January 1954, to reach 62 for those born 1st January 1955.
4.7.2. Align public service pensions with private sector pensions Another option would be to reform Irish public sector pensions in a more fundamental
way.
Under current rules, the new pension scheme for public servants remains a DB scheme which is integrated with the State pension scheme. As a new scheme is being designed for all non-covered private sector workers which will likely include more standardised private pension provision, possibly with an auto-enrolment mechanism, there is a question as to whether public servants should continue to have a different scheme. This could be perceived as unfair by the general public, given that DB schemes are generally regarded as a better deal for members due to the pension promise the employer guarantees while under the DC schemes which dominate in the private sector, risk is transferred to workers. The Government’s credibility when launching the new scheme could also be compromised if its own employees are left out of what is agreed to be a new and efficient long-term pension set-up for Irish workers.
It could thus be envisaged to switch from an occupational DB scheme in the public sector to a DC scheme. Given the continuous trend of private sector pension schemes towards the DC type, such a reform would constitute a true alignment of public and private sector pensions. Any specificities the Government would like to consider in the pension schemes (such as, for example, earlier retirement for some occupational groups such as the military, police or firefighters) could be reflected in higher contributions for such occupational groups.
Phasing in a new scheme
For a switch to a DC scheme, there are again a number of options, depending on how quickly the government would want to phase in such a scheme. As the majority of public sector schemes are unfunded, however, such a reform would necessarily entail a transition cost (see Box 6). Since new entrants would be required to save their occupational pension contributions in their individual pension accounts, this money would be missing for the payment of pensions of already retired and retiring public servants. If such an option is seen as too costly, an alternative would be to introduce a notional defined-contribution scheme, which continues to be financed on a pay-as-you-go basis. A number of OECD countries have introduced such schemes in recent years as a replacement of their national DB pension schemes (Italy, Sweden, Poland and Norway).
The simplest and slowest option would be to auto-enrol all new entrants in the public sector in a funded DC scheme. As hiring is low currently and presumably will remain so for some time in the future, this option would not change much for the Government in financial terms, but new entrants would be put on an equal pension footing with the vast majority of private sector workers.
A more ambitious approach would be to extend the reform to some of the already existing public servants, by setting a certain cut-off age (e.g. 35 or 40 years or older) under which all public servants would be required to join the new DC scheme, while preserving the entitlements that were already earned in the DB scheme. This approach

120– CHAPTER 4. THE WAY FORWARD: OPTIONS FOR PENSION REFORM IN IRELAND – AN INTERNATIONAL PERSPECTIVE
REVIEW OF THE IRISH PENSION SYSTEM © OECD 2013
would increase the transition cost in the short- and medium term but reduce Government liabilities for pensions in the longer term. As transition costs can be substantial, it is important to set the cut-off age at the right level. Recent experiences in other European countries (such as Hungary, Poland and to a lesser extent Estonia) show that unmanageable transition costs can jeopardise the whole reform process.
Box 6. Financing the cost of moving from a DB to a DC scheme
A pay-as-you-go financed pension system is based on the promise that future generations will pay the pensions for today’s workers; in return, today’s workers pay contributions to finance the payments for today’s pensioners. Thus, there is a liability for the Government, agency or enterprise running the pension scheme to honour this promise in the future. This liability is commonly referred to as the “implicit debt” of a pension scheme. The concept of implicit pension debt describes the stock of the sponsor’s liabilities towards current and future pensioners and is useful to outline the magnitude of the transition problem. For practical policy purposes, however, the financial flows associated with different transition paths towards the new pension system are more relevant. Once the general decision for a move towards more funding has been made, pension reform requires policy decisions at two levels. First, policy makers need to define a transition strategy to structure the cash flows required for repayment of the implicit pension debt; the transition strategy determines the depth and speed of reform. Then, the transition cash flows can be fine-tuned by choosing the appropriate mix of instruments.
In the transition from a pay-as-you-go to a fully or partially funded system, pension liabilities which are implicit in the old scheme are made explicit. The current workers’ contributions can no longer be used for the payment of current pensions as they must be accumulated to build retirement capital. At the same time, previous contributions of workers to the pay-as-you-go scheme have to be honoured. Thus, the sponsor of the pension scheme, i.e. usually the government, has to come up with a financing mechanism to repay the implicit debt.
The size of the implicit debt is measured by adding up the present value of benefits that will have to be paid to current pensioners plus the present value of pension rights that current workers have already earned. Its magnitude depends on several important factors: i) the coverage of the pension system, i.e. the number of pensioners and workers who have acquired rights in the pension system, ii) the age distribution of the covered population, iii) the level of benefits, and thus on real wage growth or any other indicator to which pension benefits are pegged, and iv) the discount rate applied in the calculation of the implicit debt.
The most commonly used method of calculating the implicit pension debt is based on the “termination hypothesis”, which assumes that the unfunded system would be terminated immediately and all pensioners and workers would have to be compensated for their future pensions and accrued rights. It does not take account of possible new obligations or income from future contributions or interest. Other calculation methods assume that the system is closed to new entrants but continues to exist until the last current contributor dies, or assume an open system by estimating the present value of all future pension payments including those to new entrants.
There is much debate on which discount rate should be used for the calculation of the implicit pension debt. For many countries, calculations have been conducted using a rate of 4% approximating the average long-term real interest rate on government bonds in the major OECD countries. At the same time, one could argue that the long-term interest rate is higher and that a rate closer to the returns of private pension funds should be used. If beneficiaries regard promised benefits as risk-bearing assets, on the other hand, it might be more appropriate to use the average real rate of return on equities. But a case could also be made for a discount rate lower than the capital market returns due to the public provision of annuities in social security schemes (Van den Noord and Herd, 1993). The results of pension debt calculations are very sensitive to the assumed discount rate which should be taken into account in the interpretation of the numbers obtained.

CHAPTER 4. THE WAY FORWARD: OPTIONS FOR PENSION REFORM IN IRELAND – AN INTERNATIONAL PERSPECTIVE – 121
REVIEW OF THE IRISH PENSION SYSTEM © OECD 2013
Calculating the unfunded liabilities of a pension system further requires a set of assumptions about various factors such as economic and population growth, wage growth and the future rules of the pension system. Vesting rules, i.e. regulations about a minimum contribution period before pension rights accrue, should also be taken into account. This shows that calculations of implicit debt should be treated cautiously and only used as broad indicators of the size of the transition problem; inter-country comparisons are problematic unless the calculations are conducted on the basis of the same assumptions.
The Government’s options for financing the transition are in principle the same as for any other kind of public expenditure. The gap can be covered by issuing debt, selling off government assets such as public enterprises, real estate or other holdings, raising taxes, and reducing public expenditure in other areas.
Selling off government assets and increasing government debt both constitute a swap of pension liabilities for government assets. In the first case, the government forsakes returns on the sold assets, in the second case interest payments have to be made on debt issued for transition. In both scenarios, future generations will be affected by the shift to funding through higher taxes. If the implicit pension debt is fully financed by these two instruments, the macroeconomic impact, i.e. the effect on savings and growth, is equivalent to the situation where the debt is implicit in the pay-as-you-go system, even if the intergenerational distribution might have changed. But despite the theoretical equivalence between implicit pay-as-you-go debt and explicit government debt, the reality is different. As explained earlier, the calculation of the implicit pension debt is subject to several key actuarial assumptions which may change in the future and lead to changes in the level of implicit debt while explicit debt is securitised and non-negotiable. Furthermore, the equivalence of implicit pension debt and explicit government debt is not necessarily perceived as such by the electorate, policy makers and markets. Therefore, a swap of implicit for explicit debt cannot be expected to be completely neutral with respect to interest rate moves on the financial markets (Schmidt-Hebbel, 1997), as this would imply total absence of fiscal illusion with respect to the pension debt.
The largest cash flows would be required in a reform where all public servants
switching from the DB scheme would be compensated with immediate lump-sum payments corresponding to the present value of their acquired rights. These lump-sums would be paid into the new individual accounts. An alternative is to recognise past contributions through the issue of bonds which mature at retirement of the individual worker. This reduces the pressure on cash flows since workers retire gradually. But, since there are lump-sum payments due at retirement, cash flows are still high compared to using a compensatory pension. Under this solution, past contributions are honoured through the payment of a monthly pension, which supplements the benefit of the new pension system.
The total cost of transition, however, does not depend so much on the instrument used but on the way the recognised rights are calculated and which discount rate is applied. Some countries, such as Chile and Colombia, were relatively generous in the recognition of acquired rights; the recognition bonds to existing affiliates carry real rates of interest of 4 and 3% while the Peruvian Government, for example, chose not to give workers a positive real rate of return; instead, recognition bonds are only indexed to prices. In some cases, countries chose to recognise accrued rights only up to a maximum ceiling. While the cost of recognition bonds is clearly defined, the total cost of using a compensatory pension is difficult to predict since the financing of the transition cost is stretched out over a long period of time. The cost projections depend on a host of actuarial assumptions used for the calculation of this pension, as well as the benefits payable to survivors and are thus subject to considerable uncertainty.

122– CHAPTER 4. THE WAY FORWARD: OPTIONS FOR PENSION REFORM IN IRELAND – AN INTERNATIONAL PERSPECTIVE
REVIEW OF THE IRISH PENSION SYSTEM © OECD 2013
Given the complexity of the financial engineering of the switch from DB to DC schemes, it would be difficult, however, to let workers switch back and forth between the two schemes. If Ireland were to introduce a DC scheme for public servants with auto-enrolment, the choices should be the same as for private sector workers, i.e. between participating in the new scheme or not saving for retirement. The switch from DB to DC, even if it were proposed on a voluntary basis, should be irreversible.
Finally, if Ireland were to introduce a notional, i.e. unfunded, defined-contribution scheme for public servants, a range of other decisions would have to be taken, regarding for example the setting of the notional interest rate and the determination of the parameters used to convert the notional balance into annuity payments. Introducing such a scheme, however, would again mean that public servants are treated differently from private sector workers and would thus not be advisable.
4.7.3. Policy options to expand private pensions coverage and retirement savings
The relatively low level of public pension benefits creates a need to complement retirement income, even at middle and low-income levels. According to OECD calculations, for average wage earners entering the labour market at age 20 in 2010 and retiring at the normal retirement age, the gross pension replacement rate from the public pension system is expected to reach 37.1% only. The inclusion of voluntary private pensions (assuming an occupational DC pension plan, with the typical or average contribution rate observed in each country) more than doubles the total gross replacement rate delivered by the public pension system, with an aggregate public-private replacement rate of 79.8%.98 However, as was argued above, in a voluntary system a large number of workers (more than 50% in the Irish case) do not participate in private pension arrangements, or do so during only part of their working careers. Policies need to be devised to encourage greater participation at sufficiently high contribution rates.
The OECD considers that the main policy goal of reforming the Irish pension system should be to improve the adequacy of pensions. This goal could be achieved by increasing coverage in the funded part of the pension system. This section therefore discusses three options to reach this goal: i) introduce compulsory enrolment; ii) introduce automatic enrolment; and/or iii) improve the existing financial incentives.
It is important to bear in mind that pension systems have a long-term horizon. Current economic considerations should therefore not be the main driving force behind any reform proposal. Short-term fiscal considerations may fail to achieve the policy goals of improving adequacy and increased coverage. In this context, the OECD proposes the possibility of approving a reform in 2013 with as broad political support as possible, but leaving the implementation for later on, as the United Kingdom did. This reform should include an outline of key features, such as basic parameters, provisions, designs, and phase-in timeframes, as well as a definitive operational date. In this regard, the reform could be implemented when the economic circumstances improve, and it could be linked to certain economic parameters. Otherwise, short-term considerations may trump the long-term thinking that is needed to design pensions.
98. Source: OECD Pension Models 2010.

CHAPTER 4. THE WAY FORWARD: OPTIONS FOR PENSION REFORM IN IRELAND – AN INTERNATIONAL PERSPECTIVE – 123
REVIEW OF THE IRISH PENSION SYSTEM © OECD 2013
4.7.3.1. Introduce compulsory enrolment As argued in OECD (2012), the simplest, less costly and most effective way to
increase coverage, given international experience, is through compulsion. As shown in Figure 10, making enrolment into private pensions compulsory is ultimately the most effective policy in reaching high coverage levels. In OECD countries, the difference in coverage rates between countries with mandatory and voluntary private pension systems is as much as 30 percentage points. Both mandatory (as in Australia) and quasi-mandatory solutions (as in the Netherlands) can ensure high coverage rates.
Evidence from the behavioural economics and psychology literature that argues that individuals are bad at committing to save for retirement supports compulsory enrolment. Procrastination, myopia and inertia lead many individuals to postpone or avoid making the commitment to save sufficiently for retirement even when they know that this is ultimately in their best interest. Compulsory enrolment also ensures a more equal distribution of any tax benefits or other government incentives offered to private pension arrangements.
There are, however, potential disadvantages to compulsory enrolment to consider. First, making a system compulsory requires setting a specific contribution rate, which may be inefficient for some workers, especially if it forces them to become more indebted or diverts funds from other necessary expenses such as educating children, or from investing in property or one’s own business. As argued by Blake et al. (2011), though, this problem can be at least partly addressed by setting age-dependent contribution rates.99 Second, mandatory contributions to pensions may be perceived as a tax, discouraging people from working. Third, compulsory enrolment can lead to a ratcheting down effect, where existing provision is reduced if the target set by the Government is lower than prevailing practice. Fourth, compulsory enrolment may not be necessary for all individuals depending on the design of the overall pension system. Low-income workers, for instance, may not need to contribute in private pension plans if they already enjoy high replacement rates from the public pension system.
The introduction of a mandatory system may be politically difficult in Ireland because it may be perceived as another tax and as a new burden on employers in the form of contributions to employees’ pension funds. Australia faced the same criticism when they implemented the superannuation reform in 1992. Research indicated 50% employee acceptance for compulsion when introduced, with many people complaining it was another tax. Support for compulsion increased to more than 80% after members received their first account statement. This was the result of the Government emphasizing that the contribution flows to the pension accounts belonged to the individuals and would not be used for anything else than financing their retirement. A good communication strategy and legal framework is therefore essential to reassure savers when a mandatory second pillar is introduced. Sending regular individual statements outlining what is in their respective fund could also help introduce confidence into the system and increase acceptance of a mandatory private pension system in Ireland.
99. However, Chapter 6 of OECD (2012) argues that making contribution rates age-dependent may
lead to time inconsistency as contribution rates would need to reach very high levels at late ages to achieve a certain target retirement income.
124– CHAPTER 4. THE WAY FORWARD: OPTIONS FOR PENSION REFORM IN IRELAND – AN INTERNATIONAL PERSPECTIVE
REVIEW OF THE IRISH PENSION SYSTEM © OECD 2013
4.7.3.2. Introduce automatic enrolment Automatic enrolment has gained popularity in recent years as an alternative to
compulsory enrolment. The policy relies on individual behavioural traits such as inertia and procrastination. Automatic enrolment has actually long been used by employers in the United Kingdom and the United States on a voluntary basis and there is a large body of empirical research supporting a positive impact on coverage.100 The popularity of automatic enrolment has increased in the United States with the passing of the Pension Protection Act in 2006, which made it much easier for companies to automatically enrol their employees into pension plans. In 2012, the United Kingdom also saw the introduction of nation-wide automatic enrolment for all those workers who are not currently covered by a private pension arrangement. Employers must automatically enrol and pay minimum contributions for any workers aged at least 22 but under age 65 or State pension age, depending on when they were born, who earn more than GBP 7 475 in a year. A new national, trust-based pension scheme has been established by the Government (the National Employment Savings Trust, NEST) that may be used by employers looking for a relatively low-cost alternative to establishing their own plan or hiring existing private sector pension providers. Chile also introduced auto-enrolment starting in 2012 for the self-employed working in certain tax categories. From 2015 on, though, contributing will be mandatory for these categories of workers, who will pay contributions through their annual income tax declaration.
The first two OECD countries that introduced automatic enrolment at the national level were Italy and New Zealand. There is potential to learn from experiences in these two countries if the Irish Government were to consider the implementation of an auto-enrolment scheme.101
In Italy, automatic enrolment was introduced in 2007. It involved the payment into the pension funds of the future flow of the severance contributions (Trattamento di fine raporto, TFR) for all salaried employees. The TFR is a sort of deferred salary. Its flow is set by law at 6.91% of gross salary, net of a residual percentage that is not accrued in favour of the individual workers. The TFR is accrued by employers as a debt to their workers, and is paid at termination of employment. It carries an annual yield of 1.5% plus three quarters of the inflation rate. With the introduction of the auto-enrolment system, the TFR was expected to be the major source of financing of pension funds in Italy. Individual workers were given a period of six months after the 1 January 2007 in order to decide whether to opt out of this arrangement (i.e. to refuse paying the future flows of the TFR into a pension fund, keeping their rights regarding the TFR with the employer as in the past). The same mechanism applies since to all first-time employees, with their period
100. Madrian and Shea (2001) and Beshears et al. (2006) found that automatic enrolment in two
different US firms increased coverage by as much as 35 percentage points, although the effect diminished with the tenure of employees. Substantial increases in participation have been documented in other papers (e.g. Choi et al., 2004, 2006, Thaler and Benartzi, 2004), while other papers have found that participation rates have remained high for several years (Choi et al., 2004, 2006). Evidence from the United Kingdom is also generally supportive. Horack and Wood (2005) looked at 11 company pension plans in the United Kingdom of which two had introduced automatic enrolment and had low initial levels of coverage. With the introduction of automatic enrolment, coverage in these firms increased by 33 and 17 percentage points.
101. It is still too early to assess the success of the introduction of automatic enrolment in the United Kingdom.
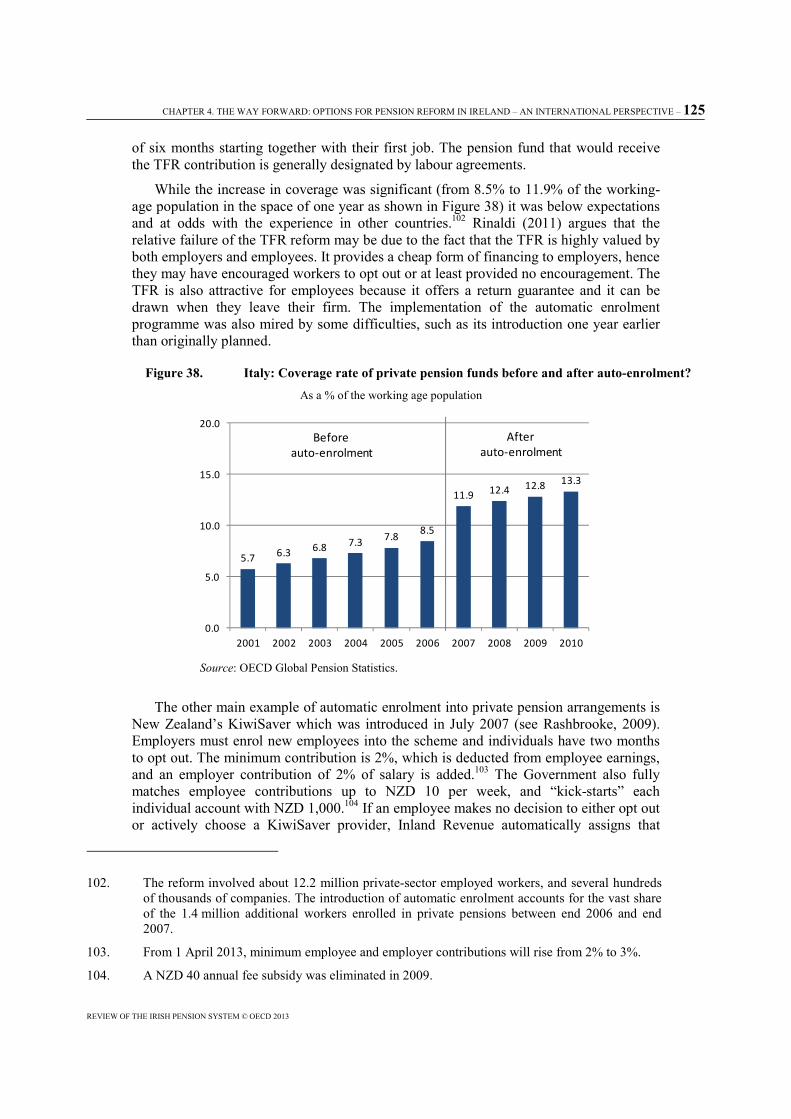
CHAPTER 4. THE WAY FORWARD: OPTIONS FOR PENSION REFORM IN IRELAND – AN INTERNATIONAL PERSPECTIVE – 125
REVIEW OF THE IRISH PENSION SYSTEM © OECD 2013
of six months starting together with their first job. The pension fund that would receive the TFR contribution is generally designated by labour agreements.
While the increase in coverage was significant (from 8.5% to 11.9% of the working-age population in the space of one year as shown in Figure 38) it was below expectations and at odds with the experience in other countries.102 Rinaldi (2011) argues that the relative failure of the TFR reform may be due to the fact that the TFR is highly valued by both employers and employees. It provides a cheap form of financing to employers, hence they may have encouraged workers to opt out or at least provided no encouragement. The TFR is also attractive for employees because it offers a return guarantee and it can be drawn when they leave their firm. The implementation of the automatic enrolment programme was also mired by some difficulties, such as its introduction one year earlier than originally planned.
Figure 38. Italy: Coverage rate of private pension funds before and after auto-enrolment? As a % of the working age population
Source: OECD Global Pension Statistics.
The other main example of automatic enrolment into private pension arrangements is New Zealand’s KiwiSaver which was introduced in July 2007 (see Rashbrooke, 2009). Employers must enrol new employees into the scheme and individuals have two months to opt out. The minimum contribution is 2%, which is deducted from employee earnings, and an employer contribution of 2% of salary is added.103 The Government also fully matches employee contributions up to NZD 10 per week, and “kick-starts” each individual account with NZD 1,000.104 If an employee makes no decision to either opt out or actively choose a KiwiSaver provider, Inland Revenue automatically assigns that
102. The reform involved about 12.2 million private-sector employed workers, and several hundreds
of thousands of companies. The introduction of automatic enrolment accounts for the vast share of the 1.4 million additional workers enrolled in private pensions between end 2006 and end 2007.
103. From 1 April 2013, minimum employee and employer contributions will rise from 2% to 3%.
104. A NZD 40 annual fee subsidy was eliminated in 2009.
5.7 6.3 6.8 7.3 7.88.5
11.9 12.4 12.8 13.3
0.0
5.0
10.0
15.0
20.0
2001 2002 2003 2004 2005 2006 2007 2008 2009 2010
Before auto-enrolment
After auto-enrolment
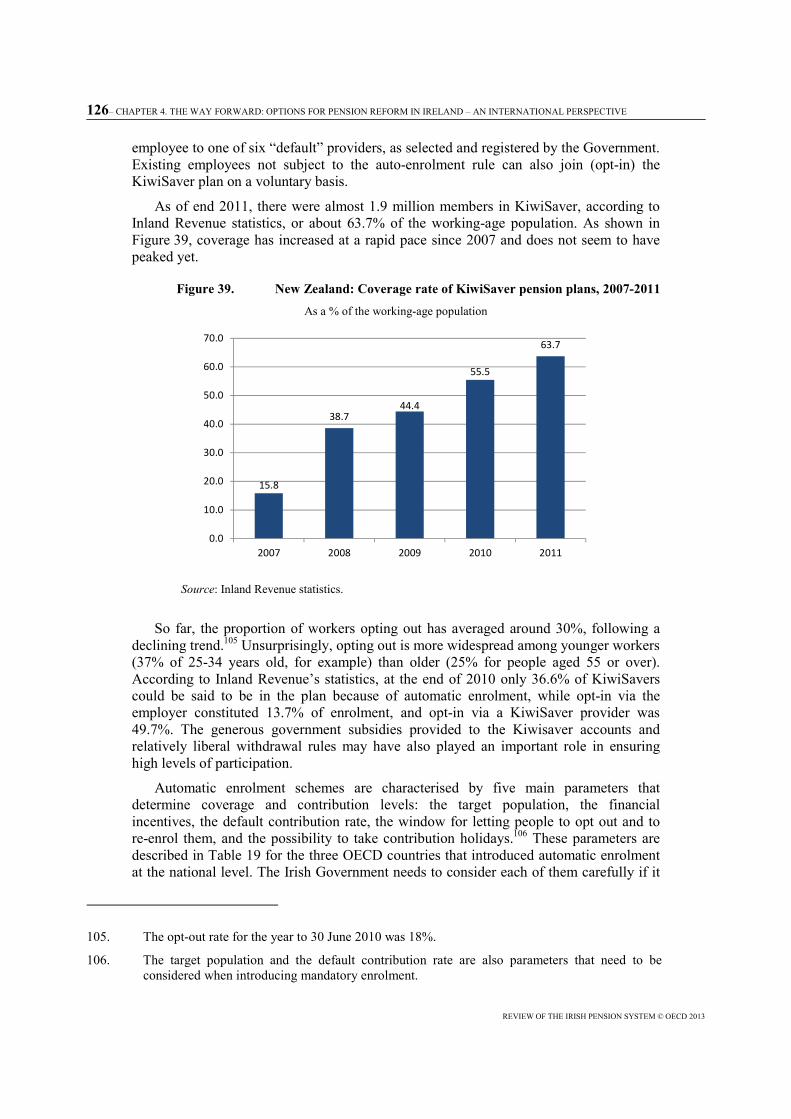
126– CHAPTER 4. THE WAY FORWARD: OPTIONS FOR PENSION REFORM IN IRELAND – AN INTERNATIONAL PERSPECTIVE
REVIEW OF THE IRISH PENSION SYSTEM © OECD 2013
employee to one of six “default” providers, as selected and registered by the Government. Existing employees not subject to the auto-enrolment rule can also join (opt-in) the KiwiSaver plan on a voluntary basis.
As of end 2011, there were almost 1.9 million members in KiwiSaver, according to Inland Revenue statistics, or about 63.7% of the working-age population. As shown in Figure 39, coverage has increased at a rapid pace since 2007 and does not seem to have peaked yet.
Figure 39. New Zealand: Coverage rate of KiwiSaver pension plans, 2007-2011 As a % of the working-age population
Source: Inland Revenue statistics.
So far, the proportion of workers opting out has averaged around 30%, following a declining trend.105 Unsurprisingly, opting out is more widespread among younger workers (37% of 25-34 years old, for example) than older (25% for people aged 55 or over). According to Inland Revenue’s statistics, at the end of 2010 only 36.6% of KiwiSavers could be said to be in the plan because of automatic enrolment, while opt-in via the employer constituted 13.7% of enrolment, and opt-in via a KiwiSaver provider was 49.7%. The generous government subsidies provided to the Kiwisaver accounts and relatively liberal withdrawal rules may have also played an important role in ensuring high levels of participation.
Automatic enrolment schemes are characterised by five main parameters that determine coverage and contribution levels: the target population, the financial incentives, the default contribution rate, the window for letting people to opt out and to re-enrol them, and the possibility to take contribution holidays.106 These parameters are described in Table 19 for the three OECD countries that introduced automatic enrolment at the national level. The Irish Government needs to consider each of them carefully if it
105. The opt-out rate for the year to 30 June 2010 was 18%.
106. The target population and the default contribution rate are also parameters that need to be considered when introducing mandatory enrolment.
15.8
38.744.4
55.5
63.7
0.0
10.0
20.0
30.0
40.0
50.0
60.0
70.0
2007 2008 2009 2010 2011

CHAPTER 4. THE WAY FORWARD: OPTIONS FOR PENSION REFORM IN IRELAND – AN INTERNATIONAL PERSPECTIVE – 127
REVIEW OF THE IRISH PENSION SYSTEM © OECD 2013
were to decided that auto-enrolment is its preferred option to reach the objectives of increasing pension coverage and ensuring sufficiently high contribution rates.
Table 18. Key features of nationwide auto-enrolment schemes in OECD countries
Target population
The new auto-enrolment scheme could target only employees or both employees and self-employed. There could be a minimum entry age, but the authorities need to keep in mind that people should contribute for long enough periods and therefore the system should encourage people to start contributing early. It may also be necessary to introduce transitional arrangements for early leavers from the system who may only accumulate small funds at retirement. People within ten years from retirement could for example be exempted from entering the new system. The introduction of automatic enrolment for employees of small firms and the self-employed would need to be carefully considered.107
An entry earning level could also be put in place if it is considered that low-income workers do not need to contribute in private pension plans as they already enjoy high replacement rates from the public pension system. This entry earning level has however to be determined carefully to avoid excluding people that were initially targeted by the reform. If the entry earning level were to correspond with the income tax threshold, the system would target approximately 840,000 households with income earners (those with the 20% marginal rate of income tax). All households exempted from income tax, representing 45% of Irish households (see Table 19), would therefore be excluded from the system, questioning the cost-effectiveness of implementing an auto-enrolment system if such a threshold were chosen.
107. For example because, as noted above, costs tend to be higher for smaller schemes compared to
larger ones.
Country Year of implementation Target population Opting-out window Contribution rate Financial incentives Contribution holidays
Italy 2007 All employed workers in the private sector
Opting out is possible within 6 months following enrolment
Employer contribution: 7% of salary (severance contributions)
None Not allowed
New Zealand 2007 New employees Opting out is possible within 2 months following enrolment
Employee contribution: 2%Employer contribution: 2%
The government fully matches employee contribution up to NZD 10 per week and "kick-starts" each individual account with NZD 1,000
After the first 12 months of membership, automatically enrolled workers can stop contributing for a minimum of 3 months, up to 5 years at a time for any reason
United Kingdom 2012 Employees between the age of 22 and State Pension Age who earn more than GBP 8,105 per year
Opting out is possible at any timePayments already made are refunded if opting out within the month following enrolmentWorkers are enrolled back every three years
The minimum contribution rate will increase over a period of 6 years. From 2018 onwards, the minimum contribution rate will be 8%, including the employer contribution (minimum 3%), the employee contribution and the government tax relief.Contributions are payable on earnings over GBP 5,564 up to a limit of GBP 42,475.
Government contribution through tax relief
Allowed in the sense that people can opt out at any time
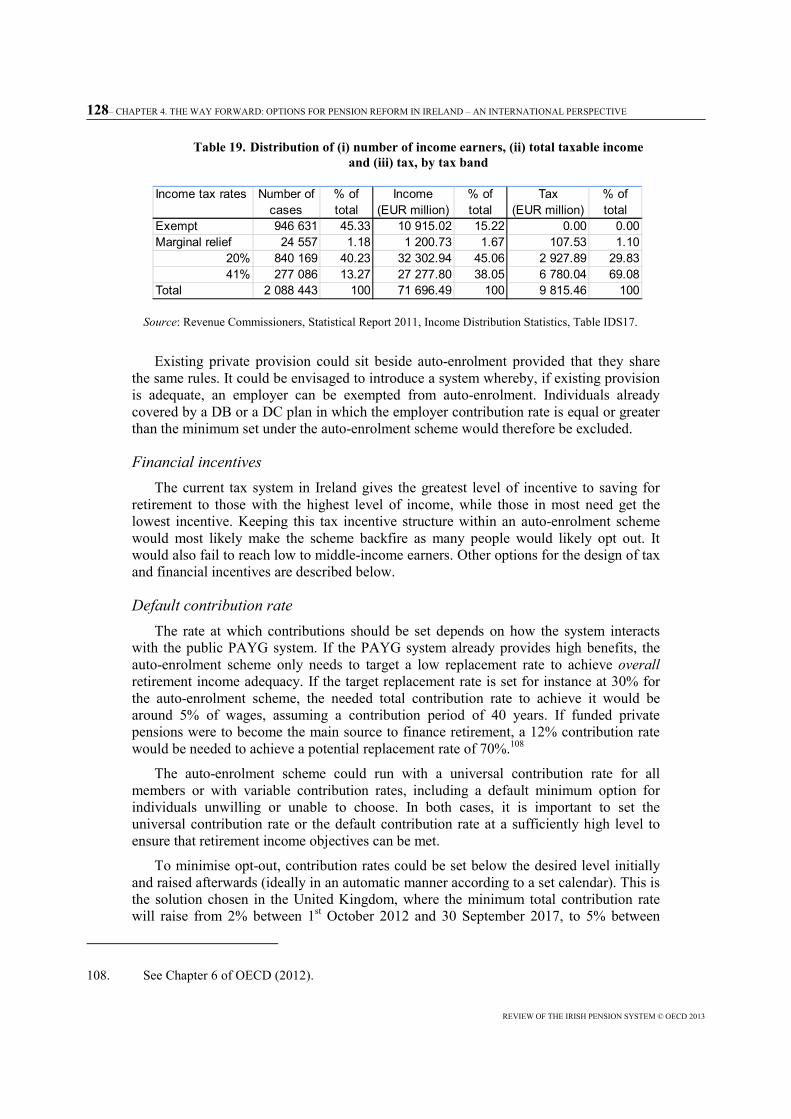
128– CHAPTER 4. THE WAY FORWARD: OPTIONS FOR PENSION REFORM IN IRELAND – AN INTERNATIONAL PERSPECTIVE
REVIEW OF THE IRISH PENSION SYSTEM © OECD 2013
Table 19. Distribution of (i) number of income earners, (ii) total taxable income and (iii) tax, by tax band
Source: Revenue Commissioners, Statistical Report 2011, Income Distribution Statistics, Table IDS17.
Existing private provision could sit beside auto-enrolment provided that they share the same rules. It could be envisaged to introduce a system whereby, if existing provision is adequate, an employer can be exempted from auto-enrolment. Individuals already covered by a DB or a DC plan in which the employer contribution rate is equal or greater than the minimum set under the auto-enrolment scheme would therefore be excluded.
Financial incentives The current tax system in Ireland gives the greatest level of incentive to saving for
retirement to those with the highest level of income, while those in most need get the lowest incentive. Keeping this tax incentive structure within an auto-enrolment scheme would most likely make the scheme backfire as many people would likely opt out. It would also fail to reach low to middle-income earners. Other options for the design of tax and financial incentives are described below.
Default contribution rate The rate at which contributions should be set depends on how the system interacts
with the public PAYG system. If the PAYG system already provides high benefits, the auto-enrolment scheme only needs to target a low replacement rate to achieve overall retirement income adequacy. If the target replacement rate is set for instance at 30% for the auto-enrolment scheme, the needed total contribution rate to achieve it would be around 5% of wages, assuming a contribution period of 40 years. If funded private pensions were to become the main source to finance retirement, a 12% contribution rate would be needed to achieve a potential replacement rate of 70%.108
The auto-enrolment scheme could run with a universal contribution rate for all members or with variable contribution rates, including a default minimum option for individuals unwilling or unable to choose. In both cases, it is important to set the universal contribution rate or the default contribution rate at a sufficiently high level to ensure that retirement income objectives can be met.
To minimise opt-out, contribution rates could be set below the desired level initially and raised afterwards (ideally in an automatic manner according to a set calendar). This is the solution chosen in the United Kingdom, where the minimum total contribution rate will raise from 2% between 1st October 2012 and 30 September 2017, to 5% between
108. See Chapter 6 of OECD (2012).
Income tax rates Number of cases
% of total
Income (EUR million)
% of total
Tax (EUR million)
% of total
Exempt 946 631 45.33 10 915.02 15.22 0.00 0.00Marginal relief 24 557 1.18 1 200.73 1.67 107.53 1.10
20% 840 169 40.23 32 302.94 45.06 2 927.89 29.8341% 277 086 13.27 27 277.80 38.05 6 780.04 69.08
Total 2 088 443 100 71 696.49 100 9 815.46 100

CHAPTER 4. THE WAY FORWARD: OPTIONS FOR PENSION REFORM IN IRELAND – AN INTERNATIONAL PERSPECTIVE – 129
REVIEW OF THE IRISH PENSION SYSTEM © OECD 2013
1 October 2017 and 30 September 2018 and 8% from 1 October 2018 onwards. Another example is Australia where the mandatory contribution rate was set at 3% initially and increased gradually to 12% by 2020. In addition, about 25% of the labour force in Australia contributes voluntarily to their superannuation fund, suggesting that these individuals may not perceive the current 9% employer contribution as enough.109
KiwiSaver provides a crucial insight into the importance of the default contribution rate. Members joining the KiwiSaver before 1 April 2009 were assigned to a default contribution rate of 4%. Since April 2009 the default contribution rate was reduced to 2%. Inland Revenue statistics show that as of 30 June 2011, 80% of people who joined the KiwiSaver after April 2009 contribute 2%, the default, while 62% of those who joined when the default contribution rate was 4%, still contribute 4%. The focal importance of the default rate and inertia are clearly at play here, showing how important it is to get the default contribution rate right. From 1 April 2013, the default contribution rate will increase to 3%.
There is the risk that auto-enrolment will lead to a levelling down of contribution rates in existing DC plans. Current contribution rates in Irish DC plans are around 6% for the employer and 4% for the employee. If the minimum-contribution rates set in the auto-enrolment scheme are far below these values, employers and employees may decide to align with those minima. This could damage adequacy of future retirement income if minimum contribution rates are not properly defined in line with the overall design of the pension system.
Opt-out window and re-enrolment The authorities should consider restricting opt-out options to reduce the
administrative burden. As shown in Table 19, in Italy and New Zealand, the opting out decision can only be made once, within a period of respectively six months and two months following automatic enrolment. After that period, people cannot opt out anymore and there is no automatic re-enrolment process. This system is straightforward and does not create too much burden on the employers.
The other option, as chosen in the United Kingdom, consists in allowing people to opt out at any time, with an automatic re-enrolment every three years. This assumes that people may not have chosen the right decision when opting out. It also implies a heavy burden on employers who have to keep track of each employee’s status as regard membership and automatically enrol them back at regular intervals if they opted out. In addition, this system may also pose the problem of low contribution densities, with some people only contributing a few years to the system as a result of frequent opt-outs.
Contribution holidays If contribution holidays are introduced, it is critical to set clear time boundaries and to
‘nudge’ workers to increase their contributions after the end of the holiday period (for instance, by automatically increasing the contribution rate temporarily). Affordability is the main reason people cite for not taking out a pension.110 Allowing for contribution
109. See Chapter 4 of OECD (2012).
110. According to the QNHS 2009 Q4, one third of workers without a pension stated that this was because they could not afford one.

130– CHAPTER 4. THE WAY FORWARD: OPTIONS FOR PENSION REFORM IN IRELAND – AN INTERNATIONAL PERSPECTIVE
REVIEW OF THE IRISH PENSION SYSTEM © OECD 2013
holidays may therefore encourage employees to stay in an auto-enrolment scheme, especially the low-income earners for whom affordability may be an important concern. Contribution holidays may be appropriate in auto-enrolment schemes where there is no possibility to opt out after a certain period in order to give some flexibility to workers, as is the case in the KiwiSaver. In New Zealand, after the first 12 months of membership, workers can stop contributing for a minimum of three months, up to five years at a time for any reason. As of June 2012, 83,370 individuals (representing 2.9% of working age population) had chosen to do so.
Summarising, while automatic enrolment is recognised to have a positive impact on coverage, it does not guarantee a high level of coverage. Its success depends on the design and the interaction with incentives to ensure that people will not opt out in large numbers. The other features of the system, such as the target population, the financial incentives, the default contribution rate, the window for letting people opt out and re-enrol, and the possibility to take contribution holidays are therefore crucial to achieve high and uniformly distributed levels of coverage. Moreover, the costs of establishing and managing an auto-enrolment system are much higher than those associated with compulsion.
4.7.3.3. Improve existing financial incentives Historically, tax incentives have been the main type of financial incentives provided
by governments to promote voluntary private pensions. Whether associated or not with an auto-enrolment scheme, the existing tax incentives provided in Ireland need to be improved to increase coverage and contribution levels, especially among low to middle-income earners. International evidence can help in identifying the most efficient policies in this respect.
Balance the incentives to save for retirement according to income Contributions to private pension plans enjoy tax advantages in Ireland in order to
promote savings for retirement. However, as in many other OECD countries, these tax advantages take the form of a deduction on the income tax base, called a “tax deduction”. Tax deductions give the greatest incentive to save for retirement to those with the highest level of income, while those most in need get the lowest incentive. In the case of Ireland, this translates as follows:
• Those who can most afford to provide for retirement are given the highest incentive through the income tax system (EUR 41 for each EUR 100 saved).
• Those on modest incomes who pay income tax at the 20% rate get lower incentives (EUR 20 for each EUR 100 saved).
• Those on low incomes who are exempt for filing income tax get no incentive at all.
The Government has announced that a cap to tax subsidised pensions at EUR 60,000 would be implemented in 2014. The purpose of the introduction of this cap is to reduce the incentive for high-income people to save for their retirement. However, it will not provide higher incentives to other income groups to increase their savings. The way tax incentives are currently structured therefore fails to provide equal incentives to all income groups. This is not in line with the general policy objective of increasing coverage in private pension plans among low to middle-income individuals.
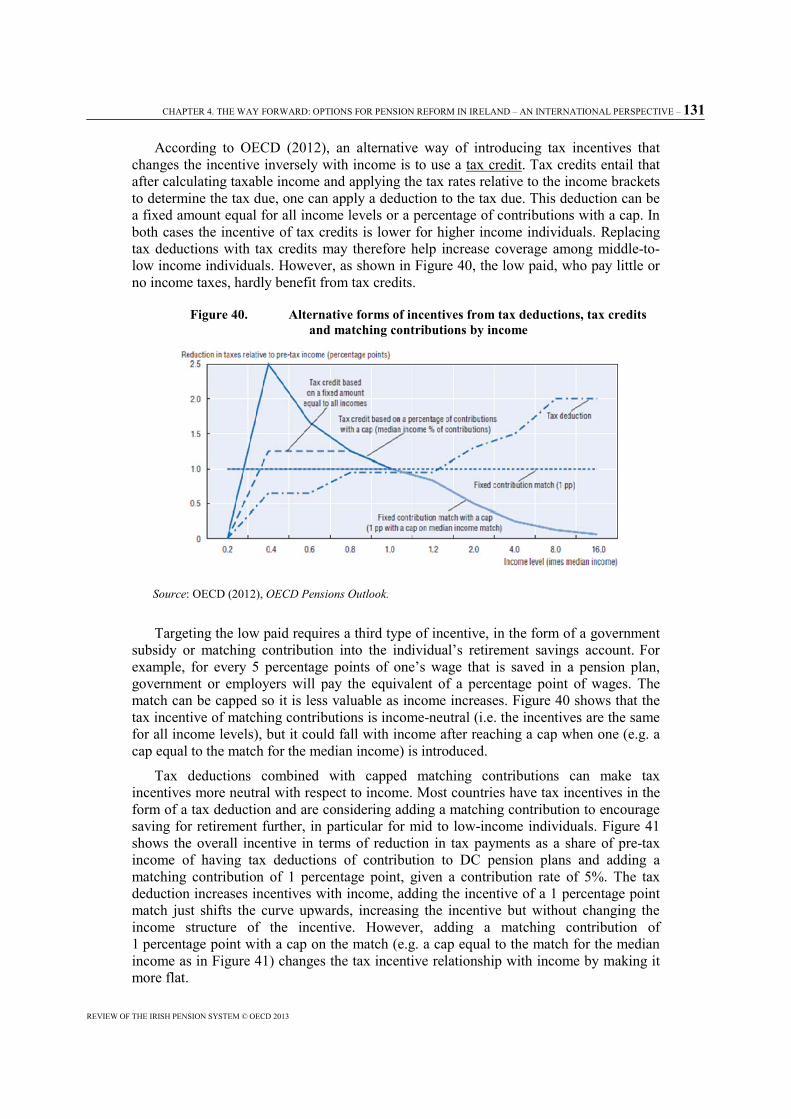
CHAPTER 4. THE WAY FORWARD: OPTIONS FOR PENSION REFORM IN IRELAND – AN INTERNATIONAL PERSPECTIVE – 131
REVIEW OF THE IRISH PENSION SYSTEM © OECD 2013
According to OECD (2012), an alternative way of introducing tax incentives that changes the incentive inversely with income is to use a tax credit. Tax credits entail that after calculating taxable income and applying the tax rates relative to the income brackets to determine the tax due, one can apply a deduction to the tax due. This deduction can be a fixed amount equal for all income levels or a percentage of contributions with a cap. In both cases the incentive of tax credits is lower for higher income individuals. Replacing tax deductions with tax credits may therefore help increase coverage among middle-to-low income individuals. However, as shown in Figure 40, the low paid, who pay little or no income taxes, hardly benefit from tax credits.
Figure 40. Alternative forms of incentives from tax deductions, tax credits and matching contributions by income
Source: OECD (2012), OECD Pensions Outlook.
Targeting the low paid requires a third type of incentive, in the form of a government subsidy or matching contribution into the individual’s retirement savings account. For example, for every 5 percentage points of one’s wage that is saved in a pension plan, government or employers will pay the equivalent of a percentage point of wages. The match can be capped so it is less valuable as income increases. Figure 40 shows that the tax incentive of matching contributions is income-neutral (i.e. the incentives are the same for all income levels), but it could fall with income after reaching a cap when one (e.g. a cap equal to the match for the median income) is introduced.
Tax deductions combined with capped matching contributions can make tax incentives more neutral with respect to income. Most countries have tax incentives in the form of a tax deduction and are considering adding a matching contribution to encourage saving for retirement further, in particular for mid to low-income individuals. Figure 41 shows the overall incentive in terms of reduction in tax payments as a share of pre-tax income of having tax deductions of contribution to DC pension plans and adding a matching contribution of 1 percentage point, given a contribution rate of 5%. The tax deduction increases incentives with income, adding the incentive of a 1 percentage point match just shifts the curve upwards, increasing the incentive but without changing the income structure of the incentive. However, adding a matching contribution of 1 percentage point with a cap on the match (e.g. a cap equal to the match for the median income as in Figure 41) changes the tax incentive relationship with income by making it more flat.

132– CHAPTER 4. THE WAY FORWARD: OPTIONS FOR PENSION REFORM IN IRELAND – AN INTERNATIONAL PERSPECTIVE
REVIEW OF THE IRISH PENSION SYSTEM © OECD 2013
Figure 41. Incentives by income of adding matching contributions to tax deductions
Source: OECD (2012), OECD Pensions Outlook.
International evidence on the impact of financial incentives’ reforms on coverage and contribution levels
Various OECD countries have used different kinds of financial incentives to promote private pensions. Historically, tax incentives (tax deductions) have been the main type of financial incentive provided by governments to promote private pensions. Such incentives benefit higher income households most (as they are subject to the highest tax rates). However, the largest coverage gaps are concentrated among low and middle-income households who may draw little benefit from tax incentives. In order to enhance the financial value of tax incentives for such households, some countries have introduced flat subsidies to private pensions. Countries where governments pay flat subsidies to private pension accounts include the Czech Republic, Germany, Mexico (the Cuota Social), and New Zealand. Matching contributions from either the employer or the state can also help increasing coverage and contributions in private pension plans. Matching contributions enable certain groups to be targeted. For example, governments can match contributions only for women, the young (as in Chile) or low-income individuals (as in Australia). In New Zealand, on the other hand, matching contributions from both the government and employers are available for all workers. Matching contributions are also common in some voluntary, occupational pension plans [e.g. 401(k) plans in the United States], where sponsoring employers match the contribution made by employees up to a certain percentage of the worker’s salary.
New Zealand offers an interesting case study as both flat subsidies (the “kick-start” payment) and matching contributions are used at the relatively generous levels described above, inciting existing employees to opt-in and new employees to remain (not to opt-out). According to Inland Revenue’s 2009/10 annual report, most people in New Zealand are joining KiwiSaver because they consider it to be a good way to save for retirement. The financial incentives from the Government and employers play a major part in the

CHAPTER 4. THE WAY FORWARD: OPTIONS FOR PENSION REFORM IN IRELAND – AN INTERNATIONAL PERSPECTIVE – 133
REVIEW OF THE IRISH PENSION SYSTEM © OECD 2013
positive perception of the KiwiSaver (they represent among the most important motivations to join the plan for 77% of the members).111 There are, however, other motivations to join KiwiSaver. In particular, its default and other design features make the KiwiSaver an easy and effective way to save for retirement and for purchasing a home.112
Germany also experienced an important increase in coverage, especially for low earners, thanks to the introduction of Riester pensions in 2001 as part of a major pension reform. Riester products can be purchased by anyone covered by the social insurance system and who is subject to full tax liability. Participants qualify for subsidies and tax relief from the Government, the level of which depends on the respective contribution rate and number of children. To receive the full state subsidy, pension participants must invest at least 4% of their previous year’s income in a Riester plan.113 Since 2008, the basic annual state subsidy is EUR 154 for single persons, EUR 308 for married couples (when each partner has his/her own plan) and EUR 185 for every child (EUR 300 for children born in 2008 or after). Only very low-income households can get the full subsidy without investing 4% of their income if they contribute at least EUR 60 annually. This exception holds for people receiving minimum social benefits, low-income workers (earnings less than EUR 800 per month) and non-retired inactive people without income. Both own contributions and state subsidies can then be deducted from the participant’s taxable income, up to EUR 2,100.114 The coverage rate of Riester pension plans was 28.4% of the working-age population at the end of 2011 (see Figure 42); the coverage rate has risen steadily since the scheme was introduced.
111. Employers and the State continue to make significant contributions to KiwiSaver. In 2012,
employers' contributions amounted to NZD 866 million. Over the five years to date, employers have contributed NZD 2.7 billion to KiwiSaver accounts. NZD 1,045 million were transferred by the government mainly in member tax credits. As a proportion of the total value of funds passed to providers for investment in members' accounts, this contribution is declining over time
112. For instance, deductions at source, savings lock-in, and the various default settings of KiwiSaver mean that, should they wish to, all an individual needs to do is to enrol and the decisions are made for them.
113. Both own contributions and state subsidies are taken into account to calculate this rate.
114. If the tax relief resulting from the deduction of Riester savings (both own contributions and state subsidies) from the taxable income is above the state subsidy, the tax authority pays to the participant the difference between both amounts in the form of a tax repayment.

134– CHAPTER 4. THE WAY FORWARD: OPTIONS FOR PENSION REFORM IN IRELAND – AN INTERNATIONAL PERSPECTIVE
REVIEW OF THE IRISH PENSION SYSTEM © OECD 2013
Figure 42. Germany: Coverage rate of Riester pension plans, 2001-2011 As a % of the working-age population
Source: German Ministry of Labour and Social Affairs.
Unlike occupational and other personal pensions in Germany, Riester pensions generally achieve a better distribution of coverage across income groups. Figure 43 shows the percentage of households where at least one of the partners is enrolled in a private pension plan other than a Riester plan (right panel) or in a Riester plan (left panel). When Riester plans are excluded, the higher the income of the household, the higher is the coverage rate of private pension plans. Coverage rates for Riester pensions are on the other hand more homogeneous across income groups and actually peak for individuals in the medium-income groups (4th and 7th deciles). The distribution of coverage rates by income is also more concentrated for Riester plans than for other private pension plans. In particular, Riester plans achieve higher coverage rates for low-income households (e.g. 13.6% of the labour force in the 1st decile) than other private pension plans (4.5%), even though the average coverage rate of Riester plans is lower.
Figure 43. Germany: Coverage rate of private pension plans according to the income of the household and the type of plan, December 2008
As a % of total labour force
Source: OECD calculations using the 2009 SAVE survey.
2.5
6.17.1 7.6
10.2
14.7
19.7
22.324.5
26.728.4
0.0
5.0
10.0
15.0
20.0
25.0
30.0
2001 2002 2003 2004 2005 2006 2007 2008 2009 2010 2011
13.6
23.327.7
37.432.7
36.6
44.5 42.1 40.3 40.6
0.0
10.0
20.0
30.0
40.0
50.0
60.0
70.0
1 2 3 4 5 6 7 8 9 10
Income deciles
Riester pension plans
4.5
12.5
29.3
38.0 35.840.3 43.2
46.950.9
57.5
0.0
10.0
20.0
30.0
40.0
50.0
60.0
70.0
1 2 3 4 5 6 7 8 9 10
Income deciles
Other pension plans

CHAPTER 4. THE WAY FORWARD: OPTIONS FOR PENSION REFORM IN IRELAND – AN INTERNATIONAL PERSPECTIVE – 135
REVIEW OF THE IRISH PENSION SYSTEM © OECD 2013
The main difference between Riester pensions and other pension arrangements is that they are predominantly of the personal kind and that they benefit from a substantial government subsidy.115 The fact that they are personal should in principle make them less accessible to low earners. However, as the system has been primarily designed so as to be accessible to low earners (through the minimum annual contribution of EUR 60 for people receiving minimum social benefits for instance), it is actually easier for them to get the full state subsidy. This is most probably the prime factor behind the comparatively high coverage rates among low earners.
Additionally, the design of the government subsidy in Riester plans may explain why contribution rates do not follow any clear pattern by income (Figure 44). As indicated above, the subsidy in Riester plans is the same for everyone independently of income and, consequently, introduces a strong incentive to enrol but it does not provide strong incentives to make contributions above the minimum required. The actual contribution rate is rather constant across the income scale, around the 4% minimum required by the legislation to obtain the full state subsidy.
Figure 44. Germany: Contribution rates in Riester pensions according to the income of the household, December 2008
As a % of household net income
Source: OECD calculations using the 2009 SAVE survey.
In Australia, since 2003, the Superannuation Co-contribution scheme provides matching contributions from the government for low-income earners who make additional contributions to their superannuation fund. The government pays 50 cents for each dollar contributed, up to a maximum of AUD 500 per year. On the other hand, unlike Germany and New Zealand, there is no flat subsidy. The target population for co-contributions is those who, during the previous financial year, lodged an income tax
115. Estimates presented in Bösch-Supan et al. (2012) suggest that the total cost reached a level of
EUR 3.5 billion in 2010, of which about 80% are attributable to the means-tested direct subsidies.
4.6
3.4
5.4
3.1
4.0
4.7
3.43.8 3.8
4.8
0.0
1.0
2.0
3.0
4.0
5.0
6.0
1 2 3 4 5 6 7 8 9 10
Income deciles

136– CHAPTER 4. THE WAY FORWARD: OPTIONS FOR PENSION REFORM IN IRELAND – AN INTERNATIONAL PERSPECTIVE
REVIEW OF THE IRISH PENSION SYSTEM © OECD 2013
return, were aged under 71, their total income was below the maximum threshold and their eligible income was at least 10% of total income. According to the Australian Taxation Office, of that target population, only 15.7% were entitled to a co-contribution in the 2010-11 year of processing. This has been reducing each year since the 2007-08 year peak of 20.3%. The reduction in co-contribution matching rates from 150% to 50% for eligible personal contributions made after 1 July 2012, combined with a reduction in the maximum entitlement from AUD 1,500 to AUD 500, can partially explain why fewer low-income individuals make use of this system.116 Starting with the 2012-13 income year, the Australian Government will however provide a new superannuation contribution for low-income earners (earning up to AUD 37,000) which will effectively refund the tax paid on concessional contributions, up to a maximum of AUD 500 per year. This contribution recognises that low-income earners currently do not receive a tax concession for contributing to superannuation.
In Australia, low-income people are less likely to voluntarily contribute than other income groups, but those contributing tend to contribute a higher share of their wage than other income groups. Coverage and contribution rates in the voluntary component of the Australian superannuation system (Figure 45) suggest that despite the matching, low-income individuals still have lower coverage rates than other income groups in Australia.117 However, among those who contribute to their superannuation account voluntarily, low-income people need to make a larger contribution effort than higher income groups to take advantage of the maximum matching.
Figure 45. Australia (voluntary component): Coverage and contribution rates according to income
As a % of total labour force and as a % of individual gross earnings
Source: OECD calculations using the 2006 HILDA survey.
The Australian, German and New Zealand experiences highlight the strong impact that subsidies and matching contributions can have on coverage and contribution rates. The German experience suggests that flat subsidies have a positive effect on the coverage
116. Between 2009 and 2012, the co-contribution matching rate was 100%, with a maximum
entitlement of AUD 1,000.
117. However, in Germany, the Riester system also shows lower coverage than other income groups, but higher coverage among low-income groups when comparing with other pension plans.
7.8
14.5
20.1 21.524.6
27.029.9 31.0
40.4 42.1
0.05.0
10.015.020.025.030.035.040.045.0
1 2 3 4 5 6 7 8 9 10
Income deciles
Coverage rate
24.7
15.1
8.4 8.86.7 6.9 7.8 7.5
9.2 10.5
0.0
5.0
10.0
15.0
20.0
25.0
30.0
1 2 3 4 5 6 7 8 9 10
Income deciles
Contribution rate
CHAPTER 4. THE WAY FORWARD: OPTIONS FOR PENSION REFORM IN IRELAND – AN INTERNATIONAL PERSPECTIVE – 137
REVIEW OF THE IRISH PENSION SYSTEM © OECD 2013
rate for low-income individuals, while the Australian case shows that matching contributions encourage higher contributions but are not necessarily effective in raising coverage among low-income groups. New Zealand, which combines both subsidies and matching contributions, achieves a similar income distribution of KiwiSaver members and the eligible population.
The design of financial incentives in Ireland, in an auto-enrolment scheme or for already existing pension plans, will also be critical to ensure not just high coverage levels, but also an equitable distribution of tax incentives. 118
4.7.4. Improving the efficiency and adequacy of DC arrangements Given current trends, DC pension plans, whether occupational or personal, will
rapidly become predominant in the Irish private pensions landscape. If the Irish Government were to decide to establish a mandatory system or an auto-enrolment system, the default option will also necessarily be of the DC kind, in the sense that employers will only be responsible for paying contributions and will not be liable for any guarantees or benefit promises offered in the default fund.
However, many important decisions need to be made with respect to the plan design and institutional set-up of the default option. A useful reference in this regard is the OECD Roadmap for the Good Design of DC Pensions, approved by the OECD Working Party on Private Pensions in June 2012.119 Below we address some of the key aspects of this recommendation, which is as relevant for any auto-enrolment or mandatory system as for other existing DC pension arrangements in Ireland, including PRSAs and RACs.
4.7.4.1. Coherent investment strategies and pay-out options In DC arrangements, individual members bear all the major risks inherent to such
plans, from market to longevity risk. Well-researched limits to rational behaviour and information processing show that a large number of individuals fail to make choices. In countries such as Chile, Hong Kong, China or Sweden which have well-established compulsory DC systems, the vast majority of members (over 90% of new entrants in the case of Sweden) do not make an active investment selection and end up in the default fund. One of the major problems in Sweden is the large amount of funds that individuals can choose from (over 700). This ‘menu choice overload’ has been identified as one of the possible causes for the low activity in choosing funds among existing and new members.120 In Ireland, the typical number of investment options in a DC plan is around five, which facilitates active investment selection.
The design of the default investment option is critical to ensure adequate retirement income outcomes. In Ireland, the regulatory framework does not specify any default. Trust-based plans that offer fund choice must assign default status to one or more of the
118. In Ireland, the total cost of tax incentives was estimated at EUR 2.5 billion in 2008. Recent
estimates suggest that the changes adopted in the past two years have resulted in savings for the Government of EUR 527 million. See IPE Magazine dated 1 February 2013. www.ipe.com/magazine/ireland-clear-intentions_49703.php?categoryid=20354.
119. The OECD Roadmap can be downloaded at the following address: www.oecd.org/insurance/privatepensions/designingfundedpensionplans.htm.
120. See Tapia and Yermo (2008).

138– CHAPTER 4. THE WAY FORWARD: OPTIONS FOR PENSION REFORM IN IRELAND – AN INTERNATIONAL PERSPECTIVE
REVIEW OF THE IRISH PENSION SYSTEM © OECD 2013
funds they offer as choices. Standard PRSAs in Ireland must offer one or more funds with a default investment strategy which the PRSA actuary must certify complies with legislative requirements. The investment in the default must reflect “general good practice for investment for retirement” and is limited to balanced funds, with certification by an actuary as to its appropriateness. This has been in many cases interpreted as a requirement for what is called “life-styling”, i.e. proposing funds which automatically rebalance their holdings towards a target asset mix (defined according to the risk profile of the individual) that remains constant over time. Actual equity allocations in the default funds tend to be relatively high, of the order of 65% or higher.121
While in a voluntary DC system, the flexibility granted to pension providers to define the default investment strategy may be acceptable, it is less defensible in a mandatory system or one based on auto-enrolment, where individuals with low incomes participate. For such workers, their pension savings is likely to be a major component of their retirement income and it would be irresponsible to leave the design of the default to commercial providers. Regulators should participate in the design of the default, potentially setting maximum equity exposures to contain the long-term pension risk that workers are exposed to.
According to the OECD Roadmap, investment strategies based on the life-cycle approach may be appropriate default investment strategies. Life-cycle investment strategies state that the amount of assets accumulated to finance retirement allocated to risky assets (e.g. equities) should fall as people get closer to retirement. They provide protection for people close to retirement in the case of a negative shock to the stock market just before retirement. It is however important to stress that life-cycle investment strategies are not a panacea. They do not address for instance the problem of volatility of retirement income resulting from market fluctuations or the problem of inadequate or low pensions. Regulators should only implement them as default options if their main concern is to protect people from sharp drops in retirement income as a result of extreme negative outcomes.
Requiring that at least one of the investment options offered in DC plans has a minimum-return guarantee could also be considered. Such guarantees can alleviate the effect of market risk on retirement income by providing a floor or minimum income at retirement. They also increase the attractiveness of saving for retirement in DC pension plans as people will always get back at least what they contributed. Several countries have introduced minimum-return guarantees at different levels (e.g. 2% nominal in Switzerland, 0% nominal in Germany, in line with long-term interest rates in Denmark). However, the cost of minimum-return guarantees can be relatively high and reduce the expected value of retirement income. An OECD study shows that capital guarantees that protect the nominal value of contributions are relatively cheap to provide, as long as the contribution period is sufficiently long.122 However, there are some serious implementation challenges that need to be addressed for a country willing to introduce such guarantees, such as the compatibility of the guarantee with free choice of investment and provider. Making the guaranteed investment the default option is also controversial, as on average it would lead to a lower level of retirement income compared with a similar investment with no guarantee.
121. See Ashcroft (2009).
122. See Chapter 5 of OECD (2012).

CHAPTER 4. THE WAY FORWARD: OPTIONS FOR PENSION REFORM IN IRELAND – AN INTERNATIONAL PERSPECTIVE – 139
REVIEW OF THE IRISH PENSION SYSTEM © OECD 2013
The principle of coherence is also essential when designing the payout phase. In Ireland, where there are different DC pension products it is striking to see that each one has a specific minimum age for payouts (65 for occupational DC and 60 for PRSAs). Another difference is that occupational DC plans have to be liquidated at retirement while PRSA balances can be kept open until age 75.
An important reform with respect to the annuitisation requirement took place during the financial crisis. Between 4 December 2008 and 5 March 2011, members of DC occupational pension plans were given the option of deferring for two years the need to buy an annuity at retirement. Before 2011, under the normal rules, members of occupational DC schemes generally had to buy an annuity as soon as they retired and after taking their tax-free lump sum. In volatile financial markets, the annuity income which can be purchased from a DC arrangement can vary significantly over a relatively short period of time, depending on when the annuity is purchased. The annuity purchase deferral option removed therefore the compulsion to purchase an annuity at a time of low fund values.
Since 2011, members of occupational DC plans are no longer required to buy an annuity since ARFs and AMRFs are also available to them. After taking their tax-free lump sum, the remainder of the pension fund, may either to be used to buy a life annuity, taken as a taxable sum, or invested in a regulated income drawdown product. The latter option (ARF) involves a minimum drawdown of 5% a year (6% in the case of ARFs with asset values in excess of EUR 2 million). Going forward, the ARF option can be used to defer the annuity purchase, as funds transferred to an ARF can subsequently be used to buy an annuity at any time. Members should also have the possibility of buying deferred annuities that pay at a future date during their retirement.
There is a risk that people may stop buying annuities now that they have other options available. Life annuities are usually perceived by people as costly. In addition, they are illiquid and inflexible, and do not allow for bequests. There are therefore strong incentives against taking up a life annuity at retirement. However, life annuities may need to be part of any default arrangement for the payout phase, depending on the overall pension system, as they provide insurance against longevity risk. A combination of programmed withdrawals with a deferred life annuity (e.g. starting payments at the age of 80-85) that offers protection against inflation could be seen as an appropriate default. This combination achieves a balance between protection from longevity risk, flexibility, liquidity, possibility of bequests, and access to portfolio investment gains.
Choosing an appropriate design for the default investment strategy and the payout phase would be a particularly challenging task in a new auto-enrolment system or a new mandatory system, as many of those ending up in the default option would be low-income individuals. A life-cycle investment strategy – with a declining exposure to equities as the retirement age approaches – would ensure better protection of the accumulated savings. The purchase of an annuity with at least part of the accumulated balance would also offer a minimum degree of protection against longevity risk. The default option at retirement that could be appealing for low-income workers is a combination of an income drawdown plan and a deferred annuity that starts paying benefits at an old age (say 85), with the possibility of recovering at least part of the annuity premia in case of early death.
4.7.4.2. Clearly delimiting access to funds For individuals, a major worry about putting money into private pension
arrangements, whether mandatory or not, is that they are not able to withdraw it until
140– CHAPTER 4. THE WAY FORWARD: OPTIONS FOR PENSION REFORM IN IRELAND – AN INTERNATIONAL PERSPECTIVE
REVIEW OF THE IRISH PENSION SYSTEM © OECD 2013
retirement. Yet, there may be cases where accessing some of those funds could help solve a major shock, such as defraying health expenses that are not covered by the health system (or private insurers). For this reason, some countries allow withdrawals from retirement saving systems under specific, exceptional circumstances. Such rules may reassure savers and increase the attraction of private pension arrangements.
Some countries have a rather more liberal approach to withdrawals. In New Zealand’s Kiwisaver, automatically enrolled workers may withdraw all of their funds at any time in the event of serious illness or permanent disability, if they face significant financial hardship (such as a dependent’s medical care or education) or if they wish to use the funds to make a down payment on the purchase of a first home after at least three years of saving in a KiwiSaver account. Similar rules on “hardship withdrawals” apply in the United States for 401(k) plans, Individual Retirement Accounts and other qualified plans. In addition, funds may be withdrawn at any time before age 59.5, but are subject to a 10% tax penalty in addition to the going income tax rate.123
Mexico provides an interesting case as a way to separate pension savings from savings for other contingencies, such as home purchase. Individual retirement accounts contain two separate sub-accounts – retirement and housing – and the contributions to these accounts represent 2% and 5% of the worker’s salary respectively, which are paid by the employer on behalf of the worker. As for the housing sub-account, retirement funds administrators (Afores) act only as record-keepers for each individual account. However, the savings are transferred to the Mexican federal institute for worker’s housing (Infonavit) and used for granting mortgage loans to contributing workers. Contributions not used by workers to repay a loan are withdrawn at retirement age together with the retirement sub-account to pay for an annuity or by means of programmed withdrawals.
In Ireland, at the request of the Economic Management Council, an ad-hoc group was established to consider the idea of allowing people to access their pension savings before pension age in order to assist with other debts they may have. The ad-hoc group concluded that there is no evidence that individuals most likely to be affected by mortgage debt have access to sufficient pension savings to make a difference to their situation. Furthermore, it concluded that the principle of pension savings being “locked away” for retirement should be maintained.
In December 2012, the Government announced that it would allow members to withdraw funds from their additional voluntary contributions (AVC) to occupational DC pension plans, capping the early drawdown at 30% of value. This option will only be available for three years from the passing of the Finance Bill in 2013. It is a short-term measure to allow people to deleverage debt. There is however the risk that this will create a precedent and that there will be pressure to extend this measure after 2016 and allow people to withdraw funds from personal pensions and DB schemes.
While still keeping the principle of pension savings being “locked away”, the Irish Government could consider allowing withdrawals only in the event of significant financial hardship across all DC and personal pension plans (including auto-enrolment or a mandatory scheme). This could minimise opt-out from an auto-enrolment scheme by reassuring savers that the money they put into private pension plans can be at least partly
123. In the United States, 401(k) plan members may also obtain loans drawn from their individual
accounts. However, as these have to be paid back, they only have a small impact on asset accumulation (see Beshears et al., 2010).
CHAPTER 4. THE WAY FORWARD: OPTIONS FOR PENSION REFORM IN IRELAND – AN INTERNATIONAL PERSPECTIVE – 141
REVIEW OF THE IRISH PENSION SYSTEM © OECD 2013
used for other contingencies in times of great need. For normal conditions, it is preferable not to allow early withdrawals, as they divert too much of the money initially intended to finance retirement and pose retirement income adequacy issues. Imposing tax penalties on early withdrawals may reduce them somewhat, but it also imposes a major cost on individuals who by nature have a strong preference for current consumption needs.
4.7.4.3. Strengthening governance and addressing high charges The governance and management of DC arrangements is a potential source of
weakness, in that there is an inherent imbalance between the information and incentives faced by commercial pension providers and individual members. To the extent that DC plans are set up at the workplace, employers may play a role in intermediating between providers and workers, for instance negotiating lower management fees than would be the case in a purely retail market.
However, in reality, employers themselves often face few incentives to act in the best interest of members or to dedicate special resources to ensure a high standard of governance in the management of DC pension plans. This problem is compounded when DC plans are small, as in Ireland where of the 65,770 DC plans (as at April 2012) only about 300 have more than 100 members. In the case of occupational DC plans, the interest of members is in principle served by the presence of a board of trustees, but these tend to be controlled by the sponsoring employer as there is no regulatory requirement for employee representation.
One of the most patent signs of a governance failure in DC systems is the high charges often observed. In the Irish case, some of the regulations in place, in particular for PRSAs, ensure that charges are not excessively high. However, at 5% on contributions and 1% on assets, the ceiling, which appears to be very much the norm, is substantially above the charge levels observed in the best performing countries like Denmark or Sweden, where total management fees are below 0.5% of assets under management. This is also the case of the default DC pension provider NEST in the United Kingdom’s recently launched auto-enrolment system. The difference between the maximum PRSA charge and the charge announced by NEST (about 50 basis points on average) translates into a cut in benefits of the order of 12%.
Various policy options have been considered in different OECD countries to reduce costs in the pension industry. They can be divided into three main groups: disclosure-based initiatives; pricing regulations; and structural solutions. Disclosure-based solutions include ensuring that members receive timely information on the fees they pay, including comparisons between providers. Pricing regulations include allowing a single charge structure (only contribution-based or only asset-management charges) and setting ceilings on the fees that pension providers can apply (as is the case for standard PRSAs).
A structural solution could be envisaged in the event of the introduction of auto-enrolment or compulsion in Ireland. A centralised institution could be established that is in charge of either delivering the various pension services, directly or via an outsourcing arrangement, or of negotiating better terms (lower fees) on behalf of individual plan members. Examples of such centralised institutions can be found in the United Kingdom (NEST) and Sweden (the Swedish Pensions Agency).124 This policy solution can be very
124. The Swedish Pensions Agency acts as the central clearinghouse of the mandatory individual
retirement account system, processing all administrative aspects of the accounts and channelling

142– CHAPTER 4. THE WAY FORWARD: OPTIONS FOR PENSION REFORM IN IRELAND – AN INTERNATIONAL PERSPECTIVE
REVIEW OF THE IRISH PENSION SYSTEM © OECD 2013
effective in achieving low fees as it ensures economies of scale and can avoid the marketing expenses of the retail model. However, it may be difficult to implement once a DC industry of competing providers is established, at least in a mandatory system. A centralised institution can also raise governance challenges that call for effective and independent oversight.
Taking account of the existing set up in Ireland, the administration and management of the assets could be handled by private sector entities or publicly-sponsored entities operating at arm’s length from Government. Ireland could then envisage the establishment of a semi-public option (or pension funds) which would compete with private funds. Rather than using the PRSI system, this centralised institution could focus on collecting contributions, keep records and channel them to private pension funds for management. The centralised institution could also provide a public fund as a default for those unwilling or unable to make a choice.
There are other structural solutions which can also be conductive to lower fees that may work better when a DC industry of competing providers is already established. These include establishing a tender process, for example by the regulator, for assigning new or undecided workers to a low-cost pension provider. For instance, in Chile a bidding process for new members was introduced in 2008 where the private provider with the lowest fee offered takes all new members for two years. As of 2012, two bidding processes have been completed. The first process took place in 2010 and the winner was a new provider (Modelo) that undercut the average fee in the market by more than 30%. The second bid took place in 2012. Again, Modelo presented the lowest bid more than 20% below its previous bid. Another example is the KiwiSaver system in New Zealand. Members can choose from around 30 providers and switch providers at any time, ensuring competition in the system. If they do not choose their own scheme, they are allocated randomly to one of the six government-appointed default providers. These default providers were initially appointed for a seven-year term, due to expire on 30 June 2014. While the default provider contracts could simply be re-tendered on their current terms, the Ministry of Business, Innovation and Employment has decided to use this opportunity to review the KiwiSaver default provider arrangements. The impact of fund size, scale and fees on final accumulation balances is expected to be one of the most important elements for discussion.
Other major governance issues in DC systems are lost accounts and multiple pots.125 In Australia, where both are major problems, the Australian Tax Office will implement from July 2013 a new system of auto-consolidation between funds. This issue should also be carefully addressed in the Irish case.
Finally, a further major policy issue, particularly in a compulsory or auto-enrolment DC system, is what are the compensation arrangements in the event of theft and/or fraud. Is it fair that in these circumstances an individual in a fund where this occurs – a rare event – should go uncompensated? The impact on the small number of individuals is very serious, but on the system as a whole very small. The reputational impact for the system as a whole is serious however. Accordingly, both Hong Kong, China and Australia have
funds to the mutual fund chosen by the member. It also has low costs of administration and negotiates low fees with the asset managers.
125. Multiple pots refer to the fact of having several dormant pension plans with different former employers.

CHAPTER 4. THE WAY FORWARD: OPTIONS FOR PENSION REFORM IN IRELAND – AN INTERNATIONAL PERSPECTIVE – 143
REVIEW OF THE IRISH PENSION SYSTEM © OECD 2013
compensation mechanisms if this occurs. This should be a consideration if Ireland adopts compulsion or auto-enrolment.
4.7.5. Enhancing benefit security in DB schemes Over the past few years, the Irish Government has been engaged in a series of reforms
to the regulation of DB plans in the country. The goal of these reforms has been to introduce greater equity to existing pension arrangements, to simplify current provision and to provide greater protection for pension scheme members.
4.7.5.1. Reforming the funding standard for DB plans The Pensions Board suspended funding rules during the financial crisis (in the fourth
quarter of 2008). The initial reason for the suspension was the extreme volatility of markets which made it very difficult to assess the funding position of schemes. In addition, it allowed giving sponsoring employers some breathing space and avoiding creating further stress on already weakened balance sheets. This suspension was extended when the Government announced its intention to modify the funding rules.
A new funding standard is in place since 1 June 2012. It mimics many features of the past standard, which is based on a wind-up measure of liabilities calculated using annuity rates. Additionally, the standard includes a risk reserve which will effectively link the minimum funding levels to the pension fund’s allocation to equities and other assets with a similar risk profile. All DB schemes have been given a deadline of 30 June 2013 to file recovery plans where they do not meet the new standard. They are required to eliminate any deficits by 2023. DB pension plans will also be required to hold an additional risk reserve from 1 January 2016. However, schemes whose recovery plans extend beyond this date must provide for the risk reserve in those plans immediately.
The Minister for Social Protection has the power to change the level of the reserve and to set it at a level between 0% and 50% of assets at risk. The level of reserve can be changed by Statutory Instrument. The amount of the risk reserve required is currently 15% of holdings other than bonds or cash plus the net effect on assets and liabilities of a reduction in interest rates of 0.5%. The Pensions Board estimates that it is unlikely that any scheme will have a risk-reserve requirement of more than 8% of liabilities.
The new Irish funding standard falls into the category of risk-based funding standards, which have been introduced in pension fund industries in other European countries such as Denmark, Finland, the Netherlands and Sweden. However, one feature of the Irish system sets it apart from those of the countries mentioned, namely the fact that it is the Government that sets and varies the level of reserve on the advice of, and in consultation with, the Pensions Board. Risk-based funding rules are usually set in legislation and any discretion to adjust the standard or to allow for some flexibility is left to the industry supervisor.
The main advantage of the risk-based funding standard is that it will force pension fund trustees and their sponsors to consider more carefully the impact that their investment strategies may have on the plan’s funding level. It should also heighten consciousness about the need for sound risk-management practices and the selection of investment strategies that are in line with the pension fund liabilities.
However, risk-based funding standards can create distortions that need to be carefully evaluated. In particular, investment strategies can become more short-term, as market-consistent funding valuations force trustees and sponsors to focus on short-term price

144– CHAPTER 4. THE WAY FORWARD: OPTIONS FOR PENSION REFORM IN IRELAND – AN INTERNATIONAL PERSPECTIVE
REVIEW OF THE IRISH PENSION SYSTEM © OECD 2013
movements, which could trigger knee-jerk, counterproductive shifts in investment strategies. In a worse-case hypothetical scenario, a full market-consistent approach to valuing pension assets and liabilities coupled with a risk reserve could trigger a fire sale of equities at a time of crisis, crystallising losses for pension funds.
Recent OECD work (see Severinson and Yermo, 2010) has recommended that funding rules allow for a high degree of counter-cyclicality, so that at times of financial distress the pressure on companies’ cash flow is not further intensified with requests for additional pension contributions. The new Irish funding standard has a number of features which minimise the likelihood of pro-cyclicality, and in some cases, were specifically designed for this purpose. These are:
• Schemes are normally allowed to file recovery plans nine months after the valuation date.
• Because recovery plans can extend to 2023, the pro-cyclical effect is substantially reduced.
• Any investment adjustments included as part of a recovery plan can be implemented over the term of the recovery plan.
• The rules governing the recovery plan, where the plans have what is in effect a shock-absorbing mechanism which does not require re-filing a recovery plan in the event of normal market movements.
Severinson and Yermo (2010) also recommend to align valuation standards with the long-term, illiquid nature of pension liabilities avoiding dependency on what may at times be rather erratic market prices, as is currently the case with long-term bond yields. Recent changes to valuation in countries such as Denmark, the Netherlands and Sweden have precisely tackled this problem, calculating discount rates for longer maturity liabilities on the basis of long-term growth and inflation projections.
Despite the latest tightening of the Irish funding rules, these still remain undemanding in comparison to other OECD countries. Other than the risk reserve which will be introduced from 2016, there is no obligation on Irish DB schemes to hold any assets over and above the value of their liabilities. In addition, the 2016 risk reserve is not demanding by international standards and could broadly be interpreted as being a requirement to hold reserves against a 10th percentile one-year investment loss. Finally, although the liability valuations for retired members126 tend to be substantially higher than those of countries that use an on-going measure of the pension liability (e.g. the accrued benefit obligation discounted at smoothed government bond yields, as is the case in the United States), the calculation basis for members more than ten years from retirement is less demanding, as it is based on a discount rate of 7.25%.
Another concern about the new funding standard may be that it offers a strong incentive for pension funds to invest in government bonds, in particular what is known as “sovereign annuities”. This is a new type of annuity product with payments directly linked to the proceeds of Euro-denominated bonds issued by any EU Member State. In the case of sovereign annuities linked to Irish bonds, these bonds are guaranteed by the
126. They are based on a wind-up measure of pension benefits using market annuity rates.
CHAPTER 4. THE WAY FORWARD: OPTIONS FOR PENSION REFORM IN IRELAND – AN INTERNATIONAL PERSPECTIVE – 145
REVIEW OF THE IRISH PENSION SYSTEM © OECD 2013
Irish Government. Pension schemes that purchase sovereign annuities or the underlying bonds will benefit from a reduction in their liabilities under the funding standard as the discount rate used will be the yield on the underlying bonds. Furthermore, there is no risk reserve as government bonds carry no capital charge. Finally, the incentive to invest in Irish (or other sovereign) bonds is conditional on the scheme effectively making corresponding changes to the benefits provided to pensioners. Therefore, from a solvency point of view, the sovereign bond investment affects both the asset and liability side of the scheme’s balance sheet. The measure was originally proposed by the Irish National Association of Pension Funds and the Irish Society of Actuaries and acted upon by the Government. The Irish approach of encouraging investment into Irish bonds seems out of step with trends observed in other OECD countries.
While the measure is clearly appealing to both trustees (funding is improved) and the Government (the Government can finance itself on a long-term basis), it creates new risks for pensioners. Sovereign annuities are not, thus, a panacea. Firstly, government bonds are not risk-free. Sovereign annuities can include debt from bailed-out countries such as Greece that has suffered substantial haircuts after the debt restructuring. In this context, the higher default risk is directly transferred to plan members. Second, an additional concern is that using a higher discount rate lowers the net present value of liabilities and may as a result hide funding problems.
4.7.5.2. Strengthening benefit protection in case of sponsor insolvency and plan wind-up
As enshrined in the 1990 Pensions Act (Section 48), if a scheme winds up, priority is currently given to pensioners (excluding future increases in their pensions) before other members. This means that an underfunded scheme, if it has a high weighting of pensioner liabilities, may deliver little or no benefit to active and deferred members on wind-up. This outcome is particularly harsh for those close to retirement, who could lose significant accrued benefits and have very little working lifetime left in which to build up additional pension benefits to compensate for the loss. Mercer (2012) has undertaken a review of the wind-up priority provision in Section 48 of the 1990 Pensions Act for the Department of Social Protection in the fourth quarter of 2012. The objective of this review is to determine to what extent, if any, the provisions in Section 48 of the Act might be revised to provide for a different approach to the distribution of assets in the wind-up of an underfunded pension scheme. One of the options suggested by the Minister for Social Protection in October 2011 and discussed in the review includes the introduction of a new threshold set at the lower of 75% of the pension and EUR 30,000 per annum. Pensions in payment (excluding future guaranteed increases) up to this level would have priority on wind-up as at present. The remaining assets would be applied for active and deferred members to the same limits. Any residual assets would be applied to top up current pensions to 100%, before any further assets are made available for active and deferred members.
The Social Welfare and Pensions Act 2009 introduced the Pensions Insolvency Payment Scheme (PIPS) to address cases of “double insolvency”. Double insolvency occurs when the employer is insolvent and the DB scheme is winding-up in deficit. Under PIPS, instead of buying an annuity, trustees of pension schemes in double insolvency pay the Government a lump sum. Then, the Government becomes responsible for paying the future pensions to the scheme retirees. The lump sum should cover for the entire cost of paying the pensions, making the approach cost-neural for the Government. Trustees
146– CHAPTER 4. THE WAY FORWARD: OPTIONS FOR PENSION REFORM IN IRELAND – AN INTERNATIONAL PERSPECTIVE
REVIEW OF THE IRISH PENSION SYSTEM © OECD 2013
choosing this scheme will see their cost reduced with respect to the option of purchasing of an annuity, thus having more funds to pay benefits to active and deferred members.
The Irish DB situation is also peculiar in that it is one of the few countries with traditional DB plans that does not have a guarantee arrangement in place to protect pension benefits in case of sponsor insolvency (see also Table 20). Indeed, sponsor insolvency is the main risk faced by company DB pension plan members and one that may be tackled most efficiently by establishing an insolvency guarantee arrangement that ensures the payment of benefits after the bankruptcy of the plan sponsor. A pension protection arrangement cannot work however unless the employer has the primary obligation to fund shortfalls, as otherwise there would be a strong incentive to transfer all pension shortfalls to the protection scheme.Ireland only has in place a statutory fund (the Insolvency Payments Scheme) that takes care of the payment of unpaid contributions by the plan sponsor where the plan has insufficient assets to meet its benefit commitments in winding-up. This statutory fund is administered by the Department of Social Protection and funded by the Social Insurance Fund. In the event of the employer’s insolvency, the payments that are required to be made to the employee correspond to the unpaid employer contributions and employee contributions not paid into the scheme for the 12 months preceding the insolvency, unless a lesser amount would discharge the liabilities of the scheme on dissolution as certified by an actuary.
Another weakness of Irish legislation is that it allows healthy sponsors to ‘walk away’ from DB pension plans, shutting them down, without creating a high-priority debt on the employer, as is the case for instance in the United Kingdom. Under the UK’s “debt upon employer obligation”, the sponsor’s debt (if the plan is underfunded) is determined by valuing the benefits on the basis that they are bought out in full via immediate annuities (for pensioners) or deferred annuities (for non-pensioners).
As a way to introduce some kind of employer guarantee, the new funding standard provided for the introduction of what is called “unsecured undertakings”, allowing companies with investment-grade rating to offer a written and binding guarantee in place of the risk reserve. The undertaking must become payable in the event that the scheme begins to wind-up or that the employer begins to wind-up, has a receiver or examiner appointed or in a number of other specific circumstances. The trustees of the scheme are fully responsible for the acceptance of an unsecured undertaking, as well as compliance of the undertaking with the Pensions Act. However, there is no employer obligation to propose an unsecured undertaking and the unsecured undertakings rule would only be beneficial to those able to achieve investment-grade ratings, most likely excluding all smaller Irish companies.
The Irish legislation regarding the protection of DB plan members when plans wind up could be further strengthened. For example, healthy plan sponsors127 should not be allowed to “walk away” from DB plans unless assets cover 90% of pension liabilities. This funding requirement would introduce some type of guarantees for members and it would allow at the same time some degree of risk sharing. The funding ratio should be calculated following prudent standard actuarial valuations.
127. Healthy employers could be defined as those with positive net revenues.

CHAPTER 4. THE WAY FORWARD: OPTIONS FOR PENSION REFORM IN IRELAND – AN INTERNATIONAL PERSPECTIVE – 147
REVIEW OF THE IRISH PENSION SYSTEM © OECD 2013
Table 20. Major pension insolvency guarantee programmes
Source: Stewart (2007).
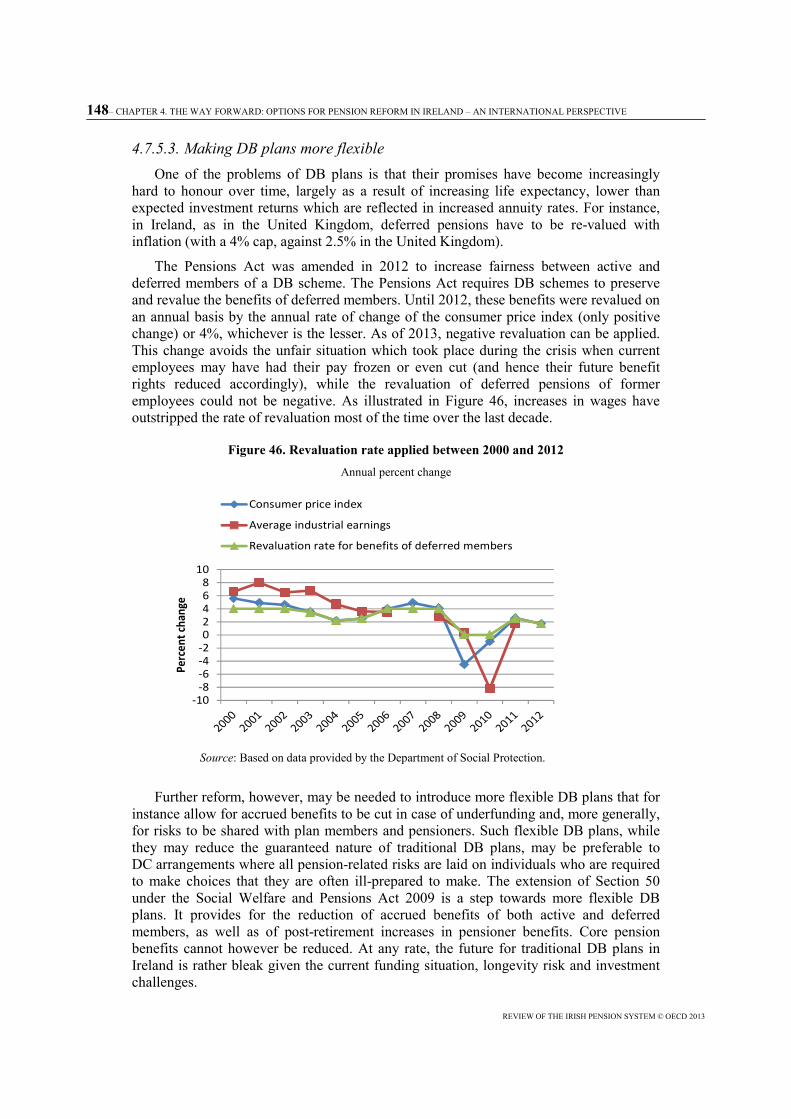
148– CHAPTER 4. THE WAY FORWARD: OPTIONS FOR PENSION REFORM IN IRELAND – AN INTERNATIONAL PERSPECTIVE
REVIEW OF THE IRISH PENSION SYSTEM © OECD 2013
4.7.5.3. Making DB plans more flexible One of the problems of DB plans is that their promises have become increasingly
hard to honour over time, largely as a result of increasing life expectancy, lower than expected investment returns which are reflected in increased annuity rates. For instance, in Ireland, as in the United Kingdom, deferred pensions have to be re-valued with inflation (with a 4% cap, against 2.5% in the United Kingdom).
The Pensions Act was amended in 2012 to increase fairness between active and deferred members of a DB scheme. The Pensions Act requires DB schemes to preserve and revalue the benefits of deferred members. Until 2012, these benefits were revalued on an annual basis by the annual rate of change of the consumer price index (only positive change) or 4%, whichever is the lesser. As of 2013, negative revaluation can be applied. This change avoids the unfair situation which took place during the crisis when current employees may have had their pay frozen or even cut (and hence their future benefit rights reduced accordingly), while the revaluation of deferred pensions of former employees could not be negative. As illustrated in Figure 46, increases in wages have outstripped the rate of revaluation most of the time over the last decade.
Figure 46. Revaluation rate applied between 2000 and 2012 Annual percent change
Source: Based on data provided by the Department of Social Protection.
Further reform, however, may be needed to introduce more flexible DB plans that for instance allow for accrued benefits to be cut in case of underfunding and, more generally, for risks to be shared with plan members and pensioners. Such flexible DB plans, while they may reduce the guaranteed nature of traditional DB plans, may be preferable to DC arrangements where all pension-related risks are laid on individuals who are required to make choices that they are often ill-prepared to make. The extension of Section 50 under the Social Welfare and Pensions Act 2009 is a step towards more flexible DB plans. It provides for the reduction of accrued benefits of both active and deferred members, as well as of post-retirement increases in pensioner benefits. Core pension benefits cannot however be reduced. At any rate, the future for traditional DB plans in Ireland is rather bleak given the current funding situation, longevity risk and investment challenges.
-10-8-6-4-202468
10
Perc
ent c
hang
e
Consumer price index
Average industrial earnings
Revaluation rate for benefits of deferred members

CHAPTER 4. THE WAY FORWARD: OPTIONS FOR PENSION REFORM IN IRELAND – AN INTERNATIONAL PERSPECTIVE – 149
REVIEW OF THE IRISH PENSION SYSTEM © OECD 2013
4.7.5.4. Promoting long-term investment As mentioned above, the love affair of Irish pension funds with equities is wilting.
This is partly a consequence of the two shocks of the past decade but is also driven by changes in accounting and solvency regulations that are making it increasingly costly to have a higher equity exposure. At the same time, pension funds are looking into alternative investments to make up for the low returns on equities and the low yields on part of their foreign debt portfolio.
One of the recent proposals touted by different stakeholders is to promote pension fund investment in domestic infrastructure projects. While such investments could well contribute to spurring economic development in Ireland if they are well chosen, they pose serious challenges. The size of infrastructure projects, the policy and revenue risks involved, and the technical skills required in managing infrastructure project investments make them particularly challenging for pension funds, particularly small and medium-sized ones.
Following on the experience of the National Pension Reserve Fund and the sovereign annuities, political pressure is mounting to direct Irish pension fund investments towards local projects. This is symptomatic of a growing encroachment of government objectives in the management of private pension assets. Such pressures have already materialised in Iceland, the first European country to be hit by the financial crisis, where the Government banned new foreign investment by pension funds and has been seeking ways to repatriate the existing stock of overseas assets to finance domestic investment.
While the role of pension funds in supporting domestic growth is valuable, it should not be used as an excuse to impose low returns on pension fund members. Promoting pension fund investments in domestic infrastructure projects may leave them wide open to being leaned on by politicians to invest in “white elephants”. Instead, a clear framework needs to be set up to facilitate domestic investment in infrastructure projects. Subsidies may indeed be needed for projects with a clear positive externality (such as clean energy). However, a general subsidy to all infrastructure projects (as entailed by the proposal to lift the pensions levy on such investments) would distort capital allocation and potentially cause an inefficient allocation to wasteful projects.
The critical requirements to attract pension funds to domestic infrastructure projects are, firstly, to create an attractive pipeline of projects under a well-regulated private financing environment. Secondly, appropriate financing vehicles must be developed in order to make it feasible for pension funds to participate. Given the current tendency to de-risk, infrastructure project bonds with the European Investment Bank backing could be a potentially attractive option for pension funds. Another investment option may be indirect equity control of infrastructure projects channelled via a manager jointly-owned by a group of pension funds, similar to the Industry Funds Management (IFM) in Australia or the UK infrastructure platform. Thirdly, the regulatory framework for pension funds needs to recognise the risk-diversification value of such investments and make sure that in particular the funding standard does not in any way discourage such investments. Fourthly, pension funds themselves need to bring their own governance and in-house skill set up to the standard required to oversee such investments.128
128. For an in-depth discussion of these conditions for successful pension fund investment in
infrastructure projects, see Della Croce (2011).

150 – MAIN FINDINGS AND POLICY RECOMMANDATIONS
REVIEW OF THE IRISH PENSION SYSTEM © OECD 2013
Main findings and policy recommendations
Main findings
• Ireland is facing challenges on the financial sustainability of the pension system as the population ages; despite large projected increases in expenditure over the next 50 years, however, Ireland’s pension spending will still be comparatively low in international comparison.
• The economic situation of pensioners in Ireland is comparatively good, both with respect to other age groups in the population and in international comparison.
• Ireland and New Zealand are the only OECD countries which do not have a mandatory earnings-related pillar to complement the State pension at basic level; as a result, Ireland, like New Zealand, faces the challenge of filling the retirement savings gap to reach adequate levels of pension replacement rates to ward off pensioner poverty.
• Private pension coverage, both in occupational and personal pensions, is uneven and needs to be increased urgently.
• Pension charges by the Irish pension industry on large occupational DC plans are not too high when assessed on an international context; they are however rather expensive for small occupational schemes and personal pension schemes.
• The existing tax deferral structure in Ireland provides higher incentives to save for retirement to high incomes as the incentives work through the marginal tax rates.
• The Irish legislation regarding the protection of DB plan members is weak. For example, the guarantee schemes in Ireland (Insolvency Payment Scheme and the Pensions Insolvency Payments Scheme) provide partial protection to DB plan members’ benefits in case of sponsor insolvency. In addition, the legislation allows any sponsor to ‘walk away’ from DB pension plans, shutting them down, without creating a high priority debt on the employer. Moreover, the priority currently given to pensioners before other members if a scheme winds up creates large inequalities across members. This outcome is particularly harsh for those close to retirement.
• There is unequal treatment of public and private sector workers due to the prevalence of defined-benefit (DB) plans in the public sector and defined-contribution (DC) plans in the private sector.
• The State pension system lacks transparency, both with respect to the calculation of benefit entitlements and to the interplay of the contributory and non-contributory pensions.
• The link between contributions and benefits in the Irish State pension scheme is very weak, for reasons spelt out in the report, contrary to what people’s perceptions of this link may be.
• The State pension scheme could be modernised to encourage working longer in line with the prevailing international trend.
• The new scheme for public servants is being phased in only very slowly and is unlikely to affect a majority of public sector workers for a long time.

MAIN FINDINGS AND POLICY RECOMMANDATIONS – 151
REVIEW OF THE IRISH PENSION SYSTEM © OECD 2013
Main policy recommendations for reform of pensions
Parametric changes in the State pension system
• Within the existing State pension system, Ireland could consider a number of parametric reforms which would improve the financial sustainability of the pension system in the future.
• The long-term retirement age, which at 68 is relatively high in international comparison, could be linked to life expectancy after 2028 in order to ensure that improvements in life expectancy do not significantly extend the duration of retirement.
• To provide incentives for workers to remain in the labour market longer and on the other hand provide more flexibility in making the retirement decision, increments and decrements of the State pension could be introduced for early and late retirement.
• More flexibility could also be provided in allowing retirees to combine work income and pension receipt; this could also ensure better adequacy of retirement income.
• Looking ahead, the adjustment of pensions – which have been frozen in recent years – also needs to be considered as this has a large impact on the evolution of pensions in payment; various options of combining indexation to wage growth and price inflation could be considered.
Structural reform of the State pension system
• Given the complex structure and the inequities resulting from the benefit calculation method in the public pension scheme and the interplay between the contributory pension, the non-contributory pension and other means-tested elements of retirement income provision, Ireland should consider a structural change of the State pension scheme.
• At a minimum, the current inequities in the treatment of workers’ contributions to the system should be removed and all contributions made should be honoured in the calculation of the pension benefit, as foreseen in the current plans to adopt a total contributions approach from 2020 onward.
• The best two options out of the three described in the report, for a structural reform of the State pension scheme are: a universal basic pension or a means-tested basic pension. Both of these options would have the advantage, compared with the existing scheme, of introducing a much simpler, more transparent and less costly public pension scheme.
Option 1: a universal basic pension scheme
• A universal basic pension scheme for the entire population would be based on residency requirements, provide a single flat-rate benefit and cover all of the Irish population, regardless of their life-time work or contribution status. It could be financed by taxes, contributions or a combination of the two.
• A basic pension scheme could be complemented with either mandatory private pension provision or auto-enrolment into private pension schemes. Participation could be targeted at workers above a certain income level as workers on low earnings would already be receiving a comparatively high replacement rate through the basic pension.
• The household benefits package and free travel scheme could either be transformed into a cash supplement and merged with the basic pension or it could be awarded to pensioners who need the extra benefit as a means-tested cash supplement.

152 – MAIN FINDINGS AND POLICY RECOMMANDATIONS
REVIEW OF THE IRISH PENSION SYSTEM © OECD 2013
• Setting the level of such a basic pension for all citizens in order to meet the twin goals of social adequacy and financial sustainability would require more detailed analysis, including the costing of alternative revenue scenarios.
Option 2: a single means-tested pension
• An alternative would be a single means-tested pension financed out of general revenue. The household benefits package, the free travel scheme, and other means-tested “advantages” would be included in the pension amount.
• The main design issues to be addressed under such a scheme would again be the appropriate level of the means-tested benefit, at what schedule the benefit should be withdrawn for higher earnings, what type of administrative arrangements would be needed and how much this scheme would cost under alternative scenarios.
• Combining the public and the private pension pillars, a means-tested scheme would function best in combination with mandatory participation in private pension plans. In a voluntary scheme, even with an auto-enrolment mechanism, there would be disincentives to contribute to a private pension, unless a certain amount of pension savings were exempted from the means-test for lower-earning groups.
Reform of the public service pension scheme
• At a minimum, a faster phase-in of the new rules of the occupational scheme for public servants should be considered; this would entail including existing public servants in the new scheme based either on a certain cut-off age or on length of service.
• Any new private pension scheme for private sector workers should also be extended to public servants, at a minimum for new entrants but ideally also for some of the existing public servants.
Policy options to expand private pensions coverage and retirement savings
• To increase adequacy of pensions in Ireland, there is a need to increase coverage in funded pensions. Increasing coverage can be achieved through 1) compulsion, 2) soft-compulsion, automatic enrolment, and/or 3) improving the existing financial incentives.
• Compulsion, according to international experience, is the less costly and most effective approach to increase coverage of private pensions (OECD Pensions Outlook, 2012, Chapter 4).
• Automatic enrolment is a second-best. Its success in increasing coverage depends on how it is designed and on its interaction with incentives in the system.
• The cost of establishing and managing auto-enrolment may be higher. Auto-enrolment requires monitoring, accurate record-keeping, fiscal incentives and careful design. Implementing a centralised institution to manage the system and provide default investment options would add to the costs.
• There is a misalignment to correct between the existing tax deferral structure in Ireland that provides higher incentives to high-income earners and the policy goal of increasing coverage, especially for middle to low-income people.
• International evidence (Germany, Australia, and New Zealand) suggests that flat subsidies and matching contributions increase incentives to save for retirement for middle to low incomes.
• Existing private schemes need to be subjected to the same rules as the new schemes under auto-enrolment or compulsion.
MAIN FINDINGS AND POLICY RECOMMANDATIONS – 153
REVIEW OF THE IRISH PENSION SYSTEM © OECD 2013
Improve the design of DC arrangements
• The design and institutional set-up of DC pension plans need to improve in line with the OECD Roadmap for the Good Design of DC Pension Plans.
• Establish appropriate default investment strategies, while also providing choice between investment options.
• Establish default life-cycle investment strategies as a default option to protect those close to retirement against extreme negative outcomes.
• Encourage annuitisation as a protection against longevity risk. For example, a combination of programmed withdrawals with a deferred life annuity (e.g. starting payments at age 85) could be an appropriate default.
• While still keeping the principle of pension savings being “locked away”, the Irish Government could consider allowing withdrawals strictly only in the event of significant financial hardship.
• Specialised private institutions (e.g. pension funds, asset managers) should manage the assets. The establishment of an autonomous public option could be envisaged to provide competition, lower costs, and a default pension fund for those unable or unwilling to make investment or fund choices.
Enhancing benefit security in DB schemes
• Strengthen the Irish legislation regarding the protection of DB plan members when plans wind up. For example, healthy plan sponsors should not be allowed to “walk away” from DB plans unless assets cover 90% of pension liabilities. This funding requirement would introduce some type of guarantees for members and it would allow at the same time some degree of risk sharing. The funding ratio should be calculated following prudent standard actuarial valuations. Moreover, the priority currently given to pensioners before other members if a scheme closes because of sponsor bankruptcy should be eliminated.
• Further legal reforms may be needed to introduce more flexible DB plans that for instance allow for accrued benefits to be cut in case of underfunding (e.g. the Netherlands) and, more generally, for risks to be shared between plan members and pensioners, as well as plan sponsors.
• Establish a clear framework to facilitate domestic investment in infrastructure projects, but a general subsidy to all infrastructure projects should be avoided as it would distort capital allocation. It is clearly desirable that pension funds should help support economic growth in Ireland, but the objective should not be used as an excuse to impose low returns on pension fund members.
• Revise the new funding standards as they may create new risks for pensioners by offering strong incentive for pension funds to invest in government bonds, in particular sovereign annuities.

References
Antolin, P. and E.R. Whitehouse (2009), “Filling the Pension Gap: Coverage and Value for Voluntary Retirement Savings”, OECD Social Employment and Migration Working Papers, No. 69, OECD Publishing, Paris.
Antolin, P., S. Payet and J. Yermo (2012), “Coverage of Private Pension Systems: Evidence and Policy Options”, OECD Working Papers on Finance, Insurance and Private Pensions, No. 20, OECD Publishing, Paris.
Aubert P. (2012), «Allongement de la durée requise pour le taux plein et âge de départ à la retraite des salariés du secteur privé : Une évaluation de l’impact de la réforme des retraites de 1993».
Ashcroft, J. (2009), “Defined-Contribution (DC) Arrangements in Anglo-Saxon Countries”, OECD Working Papers on Insurance and Private Pensions, No. 35, OECD Publishing, Paris.
Barrett, A. and S. Nikavoski (2012), “Supplementary Pensions and the Income of Ireland’s Retirees”, TILDA Report, November 2012.
Beshears, J., J.J. Choi, D. Laibson and B.C. Madrian (2006), “The Importance of Default Options for Retirement Saving Outcomes: Evidence from the United States”, Working Paper No. 12009, National Bureau of Economic Research, Cambridge, Mass.
Beshears, J., J.J. Choi, D. Laibson and B.C. Madrian (2010), “The Impact of 401(k) Loans on Saving”, Working Paper No. 09-05, National Bureau of Economic Research, Cambridge, Mass.
Blake, D., D. Wright and Y. Zhang (2011), “Age-Dependent Investing: Optimal Funding and Investment Strategies in Defined Contribution Pension Plans when Members are Rational Life Cycle Financial Planners”, Pensions Institute Working Paper 1111, London.
Börsch-Supan, A., M. Coppola and A. Reil-Held (2012), “Riester Pensions in Germany: design, dynamics, targeting success and crowding-in”, NBER Working Paper 18014, http://www.nber.org/papers/w18014.
Callan, T. and B. Nolan (1991), “Concepts of Poverty and the Poverty Line”, Journal of Economic Surveys, Wiley Blackwell, vol. 5(3), pages 243-61.
Choi, J.J., D. Laibson, B.C. Madrian, and A. Metrick (2004), “For Better or Worse: Default Effects and 401(k) Savings Behavior”, in D.A. Wise (ed.), Perspectives on the Economics of Aging, pp. 81-121, University of Chicago Press.
Choi, J.J., D. Laibson, B.C. Madrian, and A. Metrick (2006), “Saving for Retirement on the Path of Least Resistance”, in E.J. McCaffrey and J. Slemrod, eds, Behavioral Public Finance: Toward a New Agenda, pp. 304-351, Russel Sage Foundation.
CSO (2012), “Survey of Income and Living Conditions, Thematic Report on the Elderly, 2004, 2009 and 2010”.

REFERENCES – 155
REVIEW OF THE IRISH PENSION SYSTEM © OECD 2013
D'Addio, A.C. and O. Meslin (2013), “Pension Reform, Retirement Age and Subjective Well Being: Evidence from a German Natural Experiment”, forthcoming.
D'Addio, A.C. and M. Queisser (2011), “La prise en compte de la pénibilité du travail dans les systèmes de retraite des pays de l’OCDE”, Document de travail Conseil d’Orientation des Retraites, Séance plénière du 16 mars 2011, "Inaptitude, incapacité, invalidité, pénibilité et retraite”.
Department of Social and Family Affairs (2007), Green Paper on Pensions.
Department of Social and Family Affairs (2008), “Report on the Consultation process for the Green Paper on Pensions”.
Department of Social and Family Affairs (2010a), National Pensions Framework.
Department of Social and Family Affairs (2010b), “Implementation of the National Pension Framework Overview of Developments During 2010”.
Department of Social and Family Affairs (2010c), “Report of the National Pensions Framework Implementation Consultation Forum”, Thursday 15th July 2010, Farmleigh House, Dublin.
Department of Social Protection (2012a), “Report on Pension Charges in Ireland, 2012”.
Department of Social Protection (2012b), Statistical Information on Social Welfare Services, Section B: Pensions.
Della Croce, R. (2011), “Pension Fund Investments in Infrastructure: Policy Actions”, OECD Working Papers on Finance, Insurance and Private Pensions, No. 13, OECD Publishing, Paris.
Eurofound (2012), Income from Work After Retirement.
European Commission (2010), Green Paper on Pensions – Towards adequate, sustainable and safe European pension systems.
European Commission (2012a), White Paper on Pensions – An Agenda for Adequate, Safe and Sustainable Pensions.
European Commission (2012b), The 2012 Ageing Report- Economic and Budgetary Projections for the 27 EU Member States (2010-2060), European Economy 2|2012.
European Commission (2012c), Special Eurobarometer 378: Active Ageing.
Government Actuary Department, London (2002) (for the Department of Family and Social Affairs), “Actuarial Review of the Financial Condition of the Social Insurance Fund”.
Horack, S. and A. Wood (2005), “An Evaluation of Scheme Joining Techniques in Workplace Pension Schemes with an Employer Contribution”, Research Report, No. 292, Department for Work and Pensions, London.
IBEC (2012), IBEC Budget 2013 Submission, September 2012.
Mastrobuoni, G. (2009). “Labor Supply Effects of the Recent Social Security Benefit Cuts: Empirical Estimates Using Cohort Discontinuities”, Journal of Public Economics, Vol. 93, No. 11-12, pp. 1224-1233.

156 – REFERENCES
REVIEW OF THE IRISH PENSION SYSTEM © OECD 2013
Minister of Finance (2011), Keane Report on Mortgage Arrears (or Report of the Inter-Departmental Mortgage Arrears Working Group).
KPMG (2012), Actuarial Review of The Social Insurance Fund 31/12/, Undertaken by KPMG on behalf of the Department of Social Protection, June 2012.
Madrian, B.C. and D. Shea (2011), “The Power of Suggestion: Inertia in 401(k) Participation and Savings Behavior”, Quarterly Journal of Economics, Vol. 116, No. 4, pp. 1149-1525.
Manpower (2007), “Older Worker Recruiting & Retention Survey, Global Results”.
Mercer Human Resources Consulting (2007) (for the Department of Social Protection), “Actuarial Review of the Social insurance Fund”.
Milliman (2012), “Taxation Policy (Pensions) Group, Phase III Report”, September 2012.
OECD (2004), “OECD Classification and Glossary of Private Pensions”.
OECD (2005), Pensions at a Glance: Public Policies across OECD Countries, OECD Publishing, Paris.
OECD (2009), Pensions at a Glance 2009: Retirement-Income Systems in OECD Countries, OECD Publishing, Paris.
OECD (2011), Pensions at a Glance 2011: Retirement-Income Systems in OECD and G20 countries, OECD Publishing Paris.
OECD (2012), OECD Pensions Outlook 2012, OECD Publishing, Paris.
Rashbrooke, G. (2009), “Automatic Enrolment: KiwiSaver in New Zealand”, The Changing Pensions Landscape in Asia and the Pacific, OECD Publishing, Paris, forthcoming.
Rinaldi, A. (2011), “Auto-Enrolment in Private, Supplementary Pensions in Italy”, Improving Financial Education Efficiency: OECD-Bank of Italy Symposium on Financial Literacy, OECD Publishing, Paris.
Russell, H. and F. McGinnity (2011), "Workplace Equality in the Recession? The Incidence and Impact of Equality Policies and Flexible Working", Equality Authority and the Economic and Social Research Institute, Dublin.
Salonen, J. and M. Takala (2011), “Working Career and Income of Part-time Pensioners in Finland”, Working Papers 2011:2, Finnish Centre for Pensions, Helsinki.
Severinson, C. and J. Yermo (2010), “The Impact of the Financial Crisis on Defined Benefit Plans and the Need for Counter-Cyclical Funding Regulations”, OECD Working Papers on Finance, Insurance and Private Pensions, No. 3, OECD Publishing, Paris.
Society of Actuaries (2012a), “Response to Consultation on Review of Section 48 of the Pensions Act, 1990”.
Staubli, S. and J. Zweimüller (2011), “Does Raising the Retirement Age Increase Employment of Older Workers?”, IZA Discussion Papers No. 5863, Institute for the Study of Labor (IZA).
Stewart, F. (2007), “Benefit Security Pension Fund Guarantee Schemes”, OECD Working Papers on Insurance and Private Pensions, No. 5, OECD Publishing, Paris.
REFERENCES – 157
REVIEW OF THE IRISH PENSION SYSTEM © OECD 2013
Tapia, W. and J. Yermo (2008), “Fees in Individual Account Pension Systems: A Cross-Country Comparison”, OECD Working Paper on Insurance and Private Pensions, No. 27, OECD Publishing, Paris.
Thaler, R.H. and S. Benartzi (2004), “Save More Tomorrow: Using Behavioral Economics to Increase Employee Saving”, Journal of Political Economy, Vol. 112, No. 1, pt. 2.
United Nations, Department of Economic and Social Affairs, Population Division (2011), World Population Prospects: The 2010 Revision.
Whitehouse, E. and P. Antolin (2009), “Filling the Pension Gap: Coverage and Value of Voluntary Retirement Savings”, OECD Social, Employment and Migration Working Papers No. 69, OECD Publishing, Paris.
Whitehouse, E., A.C. D’Addio and A. Reilly (2011), “Evaluating Adequacy and Sustainability of Pension Systems”, Paper Prepared for the Working Party on Social Policy, DELSA/ELSA/WP1/RD(2011)3.


