138

1 | P a g e
REVIEW OF THE NATIONAL STATISTICAL SYSTEM OF SRI LANKA
Preface
The Review of the National Statistical System of Sri Lanka was jointly undertaken by the United Nations
Economic and Social Commission for Asia and the Pacific (ESCAP) and the Partnership for Statistics
Development in the 21st Century (PARIS21) within the framework of the Asia-Pacific Regional
Programme on Economic Statistics.
The review aims to identify the main strengths and challenges facing the national statistical system
(NSS) of Sri Lanka. The review looks broadly at the range of sectoral statistics being produced within
the current system to provide insights on the quality of existing statistical outputs, identifying gaps
and offering advice on potential improvements.
The review assesses the institutional, governance, managerial and strategic concerns in the NSS. In so
doing it examines the current status of the NSS – its legal framework and policies; the extent to which
there exists coordination within the NSS; the adequacy and availability of resources (human, financial,
technological, physical); the autonomy and role of the Department of Census and Statistics (DCS) and
the role of the Head of the DCS; statistical standards adopted in the NSS; relationship between data
producers and data users; and the adequacy of data – its availability, fitness for statistical purpose.
The Review was initiated in response to a request by the Government of Sri Lanka, which was followed
by a joint ESCAP-PARIS21 inception mission in September 2017 to agree on the substantive focus,
process and expected results of the Review. After a period of change in the senior management of
DCS, the Review was formally launched at a high-level stakeholder consultation in February 2019.
The Review is based on an extensive assessment performed during a mission in June-July 2019, with
the objective to describe and analyse the NSS of Sri Lanka. The assessment preparations and conduct
were aided by a guidance questionnaire (the Review Tool), tailored to the requested priority focus
areas of the review.
The Review Tool was developed in reference to the United Nations Fundamental Principles for Official
Statistics, international statistical standards and classifications, relevant quality assurance
frameworks, as well as developments such as the 2030 Agenda for Sustainable Development and
related requirements for NSS coordination and demands for statistics. As such it represents a fit-for-
purpose adjusted version of the standard questionnaire used for global assessments of NSS that have
2 | P a g e
been conducted during the past decade in countries of Eastern Europe, Caucasus and Central Asia,
and in Mongolia and the Maldives.
The review team included Mr. Mike Pepper (Lead consultant, ESCAP); Mr. Mahesh Subedi (consultant,
PARIS21); and Ms. Maria Fe Talento, Statistician, ESCAP. The review team worked under the
supervision of Ms. Millicent Gay Tejada, Regional Programme Coordinator, PARIS21; and Ms. Rikke
Munk Hansen, Chief, Economic and Environment Statistics Section, Statistics Division of ESCAP, who
also conducted a series of stakeholder consultations during the review process.
The assessment mission included sessions with staff and management of DCS as well as with experts
from relevant ministries and other national and international stakeholders. A zero draft of the present
report was widely circulated for comments and discussed at stakeholder consultations conducted in
October 2019. A list of the institutions visited by members of the review team during June-July 2019
is presented in Annex 4a. A list of institutions invited to send representatives to the stakeholder
consultations in October 2019 is presented in Annex 4b.
The report also utilised materials available at ESCAP, PARIS21 and other international organisations,
as well as supporting materials available on the website of DCS. It should be noted that the review
was severely limited by lack of detailed information provided by DCS and difficulties in meeting
relevant stakeholders from non-DCS institutions of the National Statistical System. This has resulted
in parts of the review being less in-depth than what was originally intended and desired.
We hope that the Review report and its recommendations, addressed to DCS but also to members of
the broader NSS as well as other users of official statistics, will benefit the further development of
statistics in Sri Lanka to ensure that arrangements for Sri Lanka to respond to the demands for data
and statistics for monitoring progress towards the Sustainable Development Goals of the 2030 Agenda
for Sustainable Development are as effective as possible and support the long-term strengthening of
official statistics in Sri Lanka.
The team acknowledges the work by the staff of DCS to facilitate the review and thank the Director
General, Dr. (Mrs.) I.R.Bandara and her deputies and staff for their availability and provision of
essential logistical, coordination and administrative support. We also express our gratitude to
former Minister of Economic Reforms and Public Distribution, for generously making his time
available for briefings and discussions with the review team.

3 | P a g e
Table of Contents
Executive Summary 3
Governance
1. Legal Framework 14
2. Institutional Governance – Managerial and Strategic issues in the
National Statistical System
16
3. Statistical Policies 24
4. The case for revisiting the Statistical Ordinance of 1956 26
5. The Path Ahead 29
Sector Reviews
6. National Accounts 32
7. Price Statistics 42
8. Agriculture Statistics 53
9. Population and Demographic Statistics 57
10.Industrial Statistics 60
11.Health Statistics 63
12.Education Statistics 66
13.Environmental Statistics 69
14.Sustainable Development Goal 72
15.Gender Statistics 75
16.Labour Statistics 77
17.Poverty Statistics 80
18.Tourism Statistics 82
19.Trade and Service Sector Statistics 84
20.Money and Banking Sector Statistics 86
21.Fisheries Statistics 88
Annexes
1a Statistical Ordinance 1956 93
1b Census Ordinance 1956 98
2 UN Fundamental Principles of Official Statistics 103
3a Summary of surveys conducted by DCS 105
3b Summary of Official Statistics by sector 106
4a Institutions visited by the review team in June/July 2019 120
4b Institutions represented at workshops on 24th/25th October 2019 122
5 Staff in DCS as at end of 2018 126
6 Sustainable Development Goal Indicators 129
Executive Summary
4 | P a g e
Executive Summary
There are two broad strands to the review.
First under the heading of governance we have examined the way in which official statistics are
constructed, the current legal framework, the degree of co-ordination that exists between
producers and suppliers of data, the extent to which official statistics are valued and used
within the community by those with an interest in their contribution to policy development,
monitoring and economic financial and commercial management.
Alongside this we have looked sector by sector at the range of statistics produced and (again
within the timescale available to us) we have identified strengths, weaknesses and gaps in the
range of official statistics.
Given the importance of national accounts and price statistics we have – in these particular
sectors taken a much closer look and the report includes a range of detailed proposals for the
improvement of national accounts and price statistics.
Governance (Chapters 1 – 5)
We find in DCS a highly centralised organisation – more centralised than many other
comparable national statistical institutes. Yet it also operates within a devolved government
structure in which many of its functions are carried out within the districts and by staff of other
departments and ministries with similarly devolved structures. We see an organisation which
is strongly internally compartmentalised, and which has yet to develop a more outward
perspective and to play its role as co-ordinator with other agencies – particularly those that
could offer valuable data sources to improve the quality of official statistics.
The sector analysis describes an organisation with effective technical skills but one which has
significant opportunities for applying these skills in a manner which, when co-ordinated with
those in other Ministries and Departments with access to administrative data, could over a
period of time substantially improve the quality, the range and the use of official statistics.
Data production consumes a high amount of human and financial resources, the best return
on such investment is achieved when data get used. However, some users experience delays
in access to microdata or find that access is sometimes not granted at all for reasons not clearly
specified. Addressing the needs of users whilst protecting the confidentiality of individual data
requires a subtle balance between conflicting objectives. A stronger user focused attitude to
dissemination should be a major component of improvements to governance within the
National Statistical System.
We recommend that urgent attention be given to the possibility of revising the legal framework
within which DCS currently operates to broaden its role, its powers and its legal responsibilities.
In the concluding Chapter 5 in the Governance Section of this Review we strongly suggest that
Sri Lanka adopts a framework based heavily upon the United Nations Generic Law on Official
Statistics which would require the Government of Sri Lanka to appoint a National Statistics
Council comprising senior and influential public figures from key Departments and Ministries

Executive Summary
5 | P a g e
(including from the Central Bank) together with representatives of some of a number of user
institutions with academic, research, commercial, NGO and media interests.
Such a National Statistics Council served by DCS would be given the following specific powers
and responsibilities:
• to develop the framework under which the collaborative development of the National
Statistical System shall take place
• to oversee the activities of the DCS
• to co-ordinate and regulate a single system of National Statistics: strengthening the
National Statistical System by:
o convening Committees to review the statistical programs of Ministries and of DCS
and coordinating with other Departments and Ministries and their devolved District
structures to develop a National Strategy for the Development of Statistics (NSDS)
consistent with and supportive of national strategic plans
o monitoring progress of the NSDS and reporting to Parliament
o setting quality standards for statistical outputs and their analyses
o setting standards for the publication of metadata and methodology
o developing a system for the accreditation of all published official statistics
o developing a code of Best Practice
o making agreements in the form of memoranda of understanding between Ministries
and DCS relating to delivery of NSDS objectives, accessibility of data, the uses to
which data may be put
o developing a cadre of high calibre statisticians
o introduce an effective enforcement regime for those who choose to fail to reply to
business survey questionnaires
Within this governance framework the role of DCS - in addition to its current duties - would be
to provide the Secretariat for the National Statistical Council.
However we envisage that the roadmap towards the passage of a new legal framework for
official statistics will be interrupted by competing pressures for parliamentary time, and in the
meantime urge the setting up of a non-statutory Statistical Council which although not backed
by legal powers could nevertheless become a pathfinder for the establishment under new
statistical legislation of a National Statistical Council.
We are keenly aware of the pressing need for Sri Lanka to co-ordinate an NSDS however we feel
that such a development requires the processes of co-ordination as set out in the proposed legal
framework and that should either await the creation of a statutory National Statistics Council or
at least an interim non-statutory Council.
Executive Summary
6 | P a g e
Within the timescale of our review we have not been able to examine in detail the organisational
structure of DCS. Superficially the overall staff complement of DCS – when all posts are filled –
compares well with many other National Statistical Institutes. However, from the discussions
held with staff during the Sector Analysis element of our review we have heard on a number of
occasions concern expressed about the adequacy of staffing resources.
We would therefore strongly urge that there be a thorough review of the internal organisational
structure of DCS examining the balance of resources deployed in the different sectors,
identifying opportunities for cross-sector collaboration, looking at ways to strengthen the cadre
of government statisticians, developing the skill base within that cadre to meet the requirements
of the National Statistical System, identifying the best talent within the NSS and building
succession planning strategies for the key posts in DCS looking forward over the coming years.
National Accounts (Chapter 6)
Chapter 6 provides a detailed appraisal of the work carried out by DCS in the compilation of
National Accounts and highlights ways in which National Accounts can be improved.
In particular it suggests that the rebased Accounts (base year 2010) should be properly
footnoted in the publication that it should be disassociated from the earlier series (base year
2002) given that there are differences in scope and coverage, classification systems,
methodology used in each series.
As with the Industrial sector review in Chapter 10 we draw attention as a top priority to the
need for business surveys to be designed using a Business Register constantly updated by data
from the Registrar of Companies and supported by individual company data from the Inland
Revenue Department. We highlight the need for consistency in classification from these
various sources. We also identify the need to introduce a regime of enforcement to require
businesses to supply timely and accurate data in response to the business surveys.
We see a need for clear publicly available description of the Sources and Methods adopted in
the compilation of National Accounts and recommend these be published and maintained.
We identify a number of administrative sources that could be explored to improve the accuracy
and coverage of the Accounts. In particular in the construction sector we draw attention to the
Construction Industry Development Agency Bulletin of Construction Statistics, which also
monitors construction projects by project type, by sector and by institution, in terms of funding
value, expected starting date and expected finished date. This data maybe tapped on an annual
basis, as supplementary information to validate the revised quarterly estimates.
Chapter 6 also makes recommendations relating to Revisions Policy for annual estimates, the
desirability of setting up a consultation forum, an inter-agency working group on macro-
economic statistics; setting shorter timescale targets for publication of GDP quarterly
estimates based on production and expenditure methodologies; and makes suggestions about
dissemination channels for National Accounts data.

Executive Summary
7 | P a g e
Price Statistics (Chapter 7)
While the price indices generated by DCS are timely and regularly available, there is a need to
continuously update and improve the quality of existing price indices to ensure relevance and
wider policy use. Chapter 7 includes recommendations relating to the
o Generation of updated/ rebased price indices
o Formulation and implementation of Policies on Price statistics
o Development of new price indices
o Development of Construction price index and Real estate price index
o Development of CPI low-income group households
o Establishment of Committee on Prices
o Technical Manual on Price Indices
o Dissemination of Price Statistics
o Conduct of Users-Producers Forum
The remaining sectoral analyses have been conducted largely by desk research and mostly
without the benefit of completed review questionnaire tools.
For the remaining sectors – those for which we have not been able to carry out a particularly
detailed analysis - we present below some preliminary assessments and recommendations. In
addition, we summarise the range of official statistics in these sectors in Annex 3b with a
breakdown of the range of official statistics by sector, activity, agency, geographical
disaggregation and frequency.
Agriculture (Chapter 8)
We commend the Agricultural Household Survey 2017/18. This could be a good source of
annual data if it regularised. However, Sri Lanka mainly lacks data on rural and environmental
variables such as soil degradation, land use, fertilizers and pesticides used, water and air
pollution, emissions due to agriculture, rural infrastructure, public expenditure on agriculture
and rural development. The strengthening of Ministry of Agriculture with scientific data
collection methodology and better coordination between the organizations in production of
agriculture statistics would help to reduce the inconsistencies in data. New technologies like
Computer Aided Personal Interviewing (CAPI) could be used in agriculture census and surveys
to speed up data collection. There is a need to introduce a crop cutting survey for high land
crops similar to paddy to estimate the yield based on area cultivated.
Population and Demographic Statistics (Chapter 9)
The DCS should plan to reduce the delay in final dissemination of population census results.
The DCS should use new IT based technologies like Computer Aided Personal Interviewing
(CAPI) in data collection and other new technologies in data processing and analysis leading to
more timely release of the final results. The RGD has taken steps to computerize vital event
since February 2019 and issue certificate centrally. This system could be decentralized and

Executive Summary
8 | P a g e
turned into online Vital Events Registration Management Information System (VER-MIS) for
ease of data collection and transfer to centre office.
The RGD needs support for equipment and skill development of manpower working in
computer and IT for upgrading the civil registration system into an online system.
A detailed survey of external migrants would also be useful – particularly as recent migration
patterns suggest that the gender and skills mix of migrants has been changing. There is a strong
case for Inter-agency co-ordination to improve access to internal and external migration data.
The Population and Housing Census is a valuable resource for many socio-economic
characteristics of the population and also provides a sample frame for many national and sub-
national household surveys. Therefore, this assessment recommends more open access to the
PHC microdata, while ensuring individual confidentiality.
Industrial Statistics (Chapter 10)
The extremely low response rate experienced in the conduct of business surveys is a very
serious challenge. This is partly due to a weak legal provision and the very small penalty for
failure to comply. Data collection is done under the existing 1956 Statistics act but the DCS has
never taken measures for non-response against offending businesses. A strong regime of
compulsory response under a new statistical ordinance is strongly recommended.
The industrial data collection system in DCS is paper based. No web-based system exists. An
online data collection system could ease and simplify the industry burden.
The sampling frame of the industrial survey is not updated regularly. A mechanism to update
the Statistical Business Register should be established. Establishing a registry with the base
registries of Registrar of Companies (ROC) and Provincial registry of Companies (PROC) and
updating it with other registries like tax registry, CEB, BOI, provincial council business registries
would be very productive and this could be matched with the economic census frame
obtained.
Absence of links to the administrative system of Company Registration Department, Inland
Revenue Department, and provincial business registration. The data stored as administrative
records in the line ministries should be shared with DCS. Here there is a need for co-ordination
between these Ministries, and a new statistics ordinance should make clear that it over-writes
any existing legislation which precludes sharing of individual business data with DCS.
Rebasing the Index of Industrial Production needs technical support. If this is done efficiently
the survey of industrial production may no longer be required.
Environmental issues related information on industrial survey is missing. The environmental
related questions should be added in the survey and census questionnaires.
Executive Summary
9 | P a g e
Health Statistics (Chapter 11)
An online reporting system based on patient episodes from hospitals and heath institutions to
the ministry and accessible to the National Statistical Service for the compilation of Health
statistics will have a profound impact on the quality, accuracy and timeliness of Health
Statistics. This requires a high level of collaboration and co-ordination between DCS and the
Ministry of Health (MoH) and it is essential that the requirements of statisticians are taken into
account within the Ministry as more streamlined data systems are introduced for health
service administrative purposes and there is a clear role for a National Statistical Council to
oversee such a development within the framework of a National Strategy for the Development
of Statistics
There are gaps in the sources of available health statistics. The Demographic Health Survey is
an important resource and ensuring the ongoing regular conduct of the DHS deserves strong
support.
Our attention has been drawn to the case for the conduct of a disability survey and/or the
maintenance of a disability register by each MoH areas.
Linkage and networking of available data from private health services and other health sectors
like Ayurvedic, Unani, Sidha and Indigenous medicine is recommended to ensure a more
comprehensive framework for health statistics.
Education Statistics (Chapter 12)
The timeliness and accuracy of the Annual School Survey (which is the main source of
education statistics in the country) could be improved if data were made online and the
schoolteachers who fill-in the questionnaire were trained to use an online system. The
information from small schools at remote areas could be collected by DCS field staff if the
necessary manpower and resources could be provided.
Such improvements require detailed collaboration and co-ordination and as discussed above
in relation to access to health management systems there is a clear need for a National
Statistical Council to be involved in ensuring the necessary levels of planning and co-ordination.
The recently developed online data portal 'NEMIS' in the Ministry of Education must be
updated regularly on time.
Environment Statistics (Chapter 13)
There are numerous agencies in NSS with the capability of producing environment related
statistics in Sri Lanka, but they lack data sharing procedure which needs to improve.
Many agencies under the Ministry of Mahaweli Development and Environment, which are the
main agencies in producing environmental statistics, are suffering from lack of manpower,
knowledge and support for producing and compilation of the environment statistics. The
government should ensure the required support for the agencies.

Executive Summary
10 | P a g e
As in many NSOs of other countries, a separate unit should be established at the DCS with
sufficient staff to support the compilation of environment related statistics and Green
Accounts with the collaboration of the Statistical unit of the Ministry of Mahaweli Development
and Environment and other stake holders.
Environmental impact assessment related questions could be included in future industrial and
agriculture surveys and censuses from DCS.
The United Nations concepts and methods of the environment, like FDES 2012, SEEA, SNA
2008, etc. need to be followed by the agencies in Sri Lanka which are responsible for producing
and providing environment data.
Sustainable Development Goals (Chapter 14)
Under the provision of the Sustainable Development Act, No.19 of 2017, the Sustainable
Development Council has the task of developing the "National policy and strategy for
sustainable development aligned with SDGs".
The Sustainable Development Council requires every ministry, department, provincial council,
provincial ministry and department and local authority to prepare a Sustainable Development
Strategy relevant to the scope of such ministry, department, provincial council, provincial
ministry and department and local authority in accordance with the National Policy and
Strategy on Sustainable Development.
The Council’s role has been set out to develop a profile of agencies and relevant SDG indicators,
and to identify and assign to agencies the responsibility for monitoring related indicators.
As identified by the DCS report "Status of Sustainable Development Goals indicators in Sri
Lanka, 2017" the other relevant agencies in NSS should act promptly to compile the 131
indicators.
As indicated by the DCS report, necessary provisions should be developed and required data
sources- census, survey, administrate records and new data sources should be explored to
provide disaggregate SDG indicators by various dimensions.
As mentioned in the VNR report the challenges with regard to the implementation of SDGs,
particularly in the areas of technology development, capacity building, policy and institutional
coherence, multi-stakeholder partnerships, and data monitoring and accountability has to be
addressed.
The DCS should take the lead in preparing concepts, classifications and standards for defining
and compiling the SDG indicators.
The council should develop capacity building trainings, especially for estimation of proxy
indicators for which data are not directly available.
Since the data from government sectors are not in themselves enough to produce the
numerous SDG indicators, an engagement and collaboration with private sectors, community
organizations, experts, academia and other related stakeholders should be enforced to

Executive Summary
11 | P a g e
produce more disaggregate data of different dimensions so as to ensure that the full range of
indicators are produced.
Gender Statistics (Chapter 15)
There is positive user feedback on gender statistics in Sri Lanka, especially those published in
the DCS webpage. However, the DCS, the Ministry of Women and Child Affairs and related
agencies should give more attention to producing required but as yet unmet data for the
targets and indicators in various dimensions of SDG 5: Achieve Gender Equality and Empower
all Women and Girls.
The gender database of the Ministry of Women and Child Affairs and the two responsible
agencies: National Committee on Women and Women's Bureau of Sri Lanka are found
relatively weak. They should strengthen the database using administrative records and with
more surveys and research studies in their priorities areas.
Labour Statistics (Chapter 16)
More disaggregation of Labour Force data by various socio-economic dimensions is requested
from Department of Labour. These requests should be considered by DCS against the
background of the likely accuracy of such more detailed breakdowns of estimate from a sample
survey.
Labour statistics for the informal sector are lacking. A special module of informal sector in LFS
or a separate labour force survey for the informal sector should be provisioned.
The data lack on domestic servants is hindering government effort to ensure labour rights and
legalize the sector. A special module on domestic servant could be considered for inclusion in
LFS or in HIES.
An efficient procedure should be developed to tackle the low response rate of postal based
surveys - Annual Employment Survey and the Survey on Hours of Actually Worked & Average
Earnings that have been conducted by the Department of Labour.
Poverty Statistics (Chapter17)
The time lag for the production of final results from HIES could be speeded up with the use of
CAPI technique in data collection. Adequate financial and manpower resources should be
ensured for timely delivery of the survey outputs.
The DCS and the Samurdhi Department have been using different methods of poverty
estimation. The poverty estimates from the Samurdhi department is far higher than the
poverty figures from the DCS. Therefore, the DCs and the Samurdhi need a combined program
for data collection and steps should be taken to standardize the poverty estimation
methodology.
The DCS poverty measures are available for district level at the survey year. An annual poverty
estimation procedure needs to be developed which could provide the poverty estimates at
DS division levels. The annual poverty estimates at DS levels would be of great help to the
Samurdhi department for annual updating of target areas for its welfare programs.

Executive Summary
12 | P a g e
The Multidimensional poverty measures which was compiled for the first time in 2018 by DCS
using DHS survey must be institutionalized in DCS with adequate skill development. The use
of HIES instead of DHS survey in the estimation of multidimensional poverty measures
ensures better sense of comparability of the MPI figures with the actual consumption-based
poverty figures using the same HIES data for the same year.
As per the UN agency in Sri Lanka the World Bank technical team recommended a few years
ago that for food consumption, data collection mode be switched from a recall-based to a
diary-based method. These improvements are yet to be implemented.
The Sri Lanka’s poverty line, which was established almost two decades ago in 2002, is now
likely to be outdated given recent fast changing household consumption behaviour. Best
practice dictates that this line is re-estimated at least every 10-15 years, to reflect updated
consumption patterns and ensure that the line captures a minimum decent living standard.
Tourism Statistics (Chapter 18)
The Sri Lanka Tourism Development Authority has been using the DCS Survey of Labour
Demand as a secondary source for identifying labour force in tourism sector. Some of the
classifications of tourism establishments as recommended by UNWTO are different from the
SLSIC and that needs to be standardized by the two agencies.
Compared to data on international tourism the data on domestic tourism, which is rapidly
growing in the country, is inadequate. It is recommended that consideration be given to the
conduct of a special survey or the development of a well-managed system for obtaining
required data on domestic tourism.
The delay in receiving information in SLTDA from tourism related agencies – hotels, airlines,
trekking and sightseeing companies could be sorted out with the implementation of a data
sharing protocol with the providers and use of online system for data sharing. The
confidentiality issue of the private companies has to be ensured in data sharing system. These
are issues (co-ordination and confidentiality) which should be considered by a National
Statistical Council.
Use of tourist related big data generated in telecom companies, through hotel bookings, use
of credit cards in banks, etc. should be investigated and could enrich the tourism statistics of
the SLTDA.
An online system of data sharing from the Department of Immigration and Emigration could
be established for timely acquisition of the main source of in and out bound tourist statistics.
Again, co-ordination with the requirements of those engaged in demographic statistics should
be considered by a National Statistics Council.
The Tourism Satellite Account, which needs a number of additional surveys and tourism related
information, should be conducted in collaboration with DCS for a complete evaluation of
tourism sector in the economy of the country.

Executive Summary
13 | P a g e
Trade and Services Statistics (Chapter 19)
The low response rate in the Annual Survey of Trade and Services has to be managed with
appropriate strategies. Provision of penalty for nonresponse in a new Statistical Ordinance is
an essential component in developing a regime in which response rates are dramatically
improved. Other simple alternatives like awareness and advocacy campaigns, engagement and
support from business associations are also essential ingredients in planning for increasing
response rate.
The attempt to cover the activities related to services sector through one questionnaire is
commendable approach for large enterprises but the low response rate makes it a
cumbersome exercise. The small and medium establishments can be covered by a simplified
questionnaire and measures to be taken to increase the response rate.
An attempt to introduce a quarterly survey measuring output in the Service sector has been
abandoned because of particularly low response rates. We recommend this be re-introduced
once a firm regime has been established to ensure high response rates as described above.
The results of the Annual Survey of Trade and Services are available for national level by
industrial classification. Further disaggregation of the information for district and DS divisions
increases the value of data in local level's planning and decision making of the sector but care
is essential in ensuring that - in publishing disaggregated data – confidentiality of individual
businesses is preserved. However, given the low response rate for the annual survey it unlikely
that more disaggregated estimates would be of sufficient accuracy as to warrant publication.
Overall, the economic statistics for trade and services within the country is found to be weak
compared with international trade and manufacture industrial statistics. The DCS and related
agencies should place more emphasis on this sector to uplift its status of data availability.
Money and Banking Sector Statistics (Chapter 20)
Although the Central Bank of Sri Lanka (CBSL) has a well-established system of data compilation and dissemination, the statistical publications and dissemination system in CBSL is mainly supply driven. No particular system has developed to engage with the users and to receive users’ feedback and data needs. A routine system of obtaining users’ feedback will enhance the value and use of the CBSL statistics.
The time lag in compilation of the monetary and financial data from the market and from financial institutions, which are mainly needed for timely forecast of inflation and price indices, could be reduced with introduction of online reporting system from the related agencies.
The CBSL has reported that data on Government public capital formation, private investments, expenditure of outgoing Sri Lankan tourists and students are weak and needs special survey or mechanism to capture either by DCS or relevant agency.
The CBSL as a major user of National Accounts (NA) has shown a serious concern on the delay in NA estimates, transparency of methodology of national accounts compilation, rebasing of NA series, coverage of new economic activities in NA, and in large differences in revision of the NA estimates. A good coordination with the DCS is an important step in ironing out these problems.

Executive Summary
14 | P a g e
(Note: In Chapter 20 we include a review of the Banking Statistics Sector. However, because of
time pressures this was not included in our Draft Zero review and therefore has not been
subjected to critical scrutiny during the workshop validation phase of our review and should be
read with this in mind.)
Fisheries Statistics (Chapter 21)
Development of Central Database Management System (CDMS) within the Statistics Unit of the Ministry of Fisheries and Aquatic Resources Development (MFARD) for consolidation of all existing fisheries and fishery related database systems in Sri Lanka into a Centralized System. (Proposal is being developed).
Development of national data policy for fisheries which support to avoid duplication of data collection programs among or within the institutions under the Ministry, encouraging sharing and using data on the basis of the open data principles and to be transparent on the reasonable explanations. (Ongoing).
Conducting a census for entire fisheries sector (Marine fisheries, freshwater fisheries & Aquaculture and fishery related economic activities) to produce of accurate, reliable, and timely data.
Amend the Statistics and Census Acts for enabling to transfer the technical advisory of DCS for all data collection programs which are conducted by various institutes under Government funds and for considering to include mandatory power of conducting the fisheries census under Department of Census and Statistics with parallel to agriculture census.
(Note: Chapter 21 is a review of the Fisheries Sector and this sector was not included in the
initial sector review process and has been added subsequently with a valuable contribution from
Lashanthi Perera a Statistician at the Ministry of Agriculture, Livestock Development, Irrigation
and Fisheries & Aquatic Resources Development following the workshops in October. This too
has not been the subject of corroborative discussion.)

Governance
15 | P a g e
Chapter 1: The current legal framework
1.The legal and administrative structure of the Democratic Socialist Republic of Sri Lanka is
based on its republican constitution. The country is divided into nine provinces for
administrative purposes. Power has been devolved to the provinces with the unit of devolution
being the Provincial Council comprised of members elected by the voters of each province. The
Head of State and Chief Executive is the President elected for a five-year term, by universal
franchise. The Prime Minister and Cabinet of Ministers are elected through Parliament, which
is the main legislative body. In spite of this three-tier governance structure, Sri Lanka continues
to have a highly centralized process of civil government with a high degree of centralization of
power and decision making. It is with this background that the legal framework within which
the Department of Census and Statistics (DCS) should operate needs to be examined.
2.There are two Ordinances which set out the powers and responsibilities of the DCS and of
the Director General of the DCS. Both were enacted in 1956 in the period between the
Independence of Sri Lanka and its constitution as a Republic. It may be noted that the wording
of the 1956 Ordinance follows closely the wording of an earlier law enacted in 1933. And it is
perhaps with this period of the history of the nation in mind that one should reflect on the way
in which the legislation was worded.
3.The first: the Statistics Ordinance (Annex 1a) establishes a Bureau of Statistics for the
collection and preparation of statistics relating to “agriculture, emigration, immigration,
factories, meteorology, mining, importation, exportation, manufacture and sale of products,
stocks of products in possession and in course of transportation by land or by water, trade,
labour, cost of living, wages, industry and commerce”. It also allows the appointment of a
Director of Statistics to control and manage the Bureau and gives him or her the power to
require statistics to be provided by businesses and individuals.
4.The Ordinance makes refusal to supply the Bureau with data an offence punishable by fine
in a Magistrate’s Court - albeit these days a fine of 50 rupees might not seem much of a
punishment - and requires officials employed by the Bureau to preserve confidentiality of
individual’s data or face prosecution which could lead to a prison sentence of up to one year.
5.The Ordinance however makes no reference to the need for adherence to any of the
statistical qualities set out in the United Nations Fundamental Principle of Official Statistics
(Annex 2) which of course postdate the legislation although these requirements are well
understood by those currently employed in the DCS. In Chapter3 we discuss in detail the
qualities that are laid out by the UN in the context of the development of a National Statistical
System and review the extent that these principles are reflected in policies enunciated by DCS.
6.The second is a Census Ordinance (Annex 1b also of 1956 which sets out powers for a
Minister to direct that a Census be taken, to appoint a Superintendent of Census and ascribe
roles of Commissioners of Census to Government Agents and to Mayors and Chairmen of
Governance
16 | P a g e
municipalities, urban and town councils. This Ordinance was amended in 1981 introducing the
role of the Director of Statistics as Superintendent and again in 2000 amending the scale of
penalties for failing to comply with the law. Prior to a Census the Minister directs by Order that
a Census shall take place, lists the duties of Census officers and prescribes the information that
will be required.
Summary assessment 7.There exists a legal framework in Sri Lanka enacted in 1956 which defines the powers and
responsibilities of a national Bureau of Statistics and of a Director of Statistics. The Ordinance
is based on the wording of a previous 1933 Ordinance. There is a separate Ordinance which
provides powers for the conduct of Population Censuses.
Recommendations
8.There be a revised Statistics Act which has a broader definition of a National Statistical System.
The case for this is discussed further in Chapter 4 and a draft structure is presented in Chapter 5.

Governance
17 | P a g e
Chapter 2: Institutional, governance, managerial and strategic issues in the
national statistical system
1.For the purpose of this review the National Statistical System (NSS) will be defined to be
I. The Department of Census and Statistics which is the leading authority of the National
Statistical System;
II. Other Producers of Official Statistics, consisting of organizational entities of national
authorities that develop, produce and disseminate official statistics
2.The above definition is consistent with that set out in Chapter 1 Article 2 of the UN Generic
Law (2016) on Official Statistics for Eastern Europe, Caucasus and Central Asia which may be
found at http://www.unece.org/index.php?id=45114. The Generic Law defines the parties to a
Law to include – in addition to those in paragraph 1(i) and 1(ii) above –
I. Respondents, consisting of persons, households, private and public entities that are
requested to provide information about themselves, including their activities, through
data collections carried out by Producers of Official Statistics.
II. Administrative data providers, consisting of national and local authorities that provide
Producers of Official Statistics with data collected primarily for administrative purposes.
III. Users of official statistics, including the general public, the media, researchers and
students, businesses, national and local authorities, non-governmental organizations,
international organizations and authorities of other countries who receive or access
official statistics.
IV. A Statistical Council, broadly representing different user categories
3.As things currently are the DCS is the sole entity in Sri Lanka which from its centralised role -
as described above in Chapter 1 - manages separate co-ordination with other Ministries either
through bedded out DCS staff in those Ministries or by discussion with administrators, planners
and monitoring/evaluation staff in the Ministries. There is (or at least there appears to be) at
present no formal structure for such process of co-ordination nor does there appear to be any
formal framework for managing the relationship that should exist between data producers and
data users and to that extent it there is scope for improved co-ordination.

Governance
18 | P a g e
4.DCS is well located in a modern office at Parliament Junction. Its senior management team is
led by the Director General who is supported by three Additional DGs, a Head of ICT, a Chief
Accountant and a Chief Internal Auditor. Staff in bedded-out divisions and Statisticians in
District Offices are located within the Ministries/ District Secretariats. The division of
responsibilities is as follows:
Director General of DCS
Directors of
ADG Statistics 1 •Industrial statistics; International Statistics Unit
•Publications
•Prices & Wages; Data Dissemination Unit
•Training
•Research & Special Studies; Printing Unit
ADG Statistics 2 •Population Census & Demography
•Cartography; SDG; Disaster management statistics
•Agriculture & Environment
•Agriculture Ministry Division
ADG Statistics 3 •Sample Survey
•National Accounts; Library
•Health Ministry Division

Governance
19 | P a g e
•Department of Education Ministry
•Department of the Registrar General
•Field Management Division; Districts & Other Ministries
Director for Information
Technology
Head of Administration
Chief Accountant
Chief Internal Auditor
5.The overall approved staffing complement was in - 2018 - 1843 (including field staff) of which
1276 posts were filled. A breakdown of staff by grade is given in Annex 5 sourced from the
2018 Annual Performance Report for DCS. There is a complicated explanation for this
difference which has been caused following the implementation of a Civil Service wide
restructure of the Public Service in 2006 which resulted in some high profile legal disputes
which have blocked some of the professional appointments pending their settlement.
Interviews have now taken place and a significant intake of staff is expected before the end of
2019. Expenditure levels are summarised in the following tables from the Performance Report
for 2018
Recurrent Expenditure 2018
Million Sri Lankan (Rs) Million USD
Pay 659 3.8
Other 175 1.0
Total 834 4.8
Capital Expenditure 2018
Million Sri Lankan (Rs) Million USD
Recurrence and development of capital assets 25 0.14
Acquisition of capital assets 27 0.15
Other capital expenditure:
Local funds
Foreign funds
56
11
0.32
0.06
Total 120 0.68
Governance
20 | P a g e
6.The budget for 2019 is for 900 million Rs of recurrent expenditure of which 710 million Rs is
for staff salaries and 107 million Rs for capital expenditure.
7.The statistical programme is mainly funded by the Government of Sri Lanka – the exceptions
being in areas including the Demographic Health Survey 2016 (World Bank); Survey of Labour
Demand 2017 (ILO); the Agricultural Household Survey 2017/18 (ADB and GoSL); the Child
Activity Survey (2016) ILO; the Women Wellbeing Survey 2019 (UNFPA); the Global Tobacco
Activity Survey 2018 (Centre for Disease Control -USA).
8.In broad terms the DCS has, compared with comparable nations, both a reasonably sufficient
staffing complement and a budget principally sourced by the Government of Sri Lanka. It has
not been possible within the timescale of this review to examine in any detail the staffing
structure or make any judgements as to whether the resource allocation matches the
pressures and demand in specific subject areas. There is debate within the Department as to
whether the rigid rules relating to years of experience in a grade prior to eligibility for
promotion to a higher grade may prove an obstacle to the efficient appointment of more senior
staff and we are aware that two legal actions still to be resolved in court have had the effect
of obstructing promotions to unfilled vacancies. We understand that the salaries in DCS are
consistent with those of parallel grades in other parts of the government machine and that
DCS is bound by service wide conventions of the Public Service Commission. However within
these conventions there is a case for a thorough review of allocation of existing resources
between different areas of statistical policy, incorporating the formal creation of a cadre of
statisticians within the NSS, with proposals for professional career development and succession
planning. We return to this theme in paragraph 9 and 10 of Chapter 4
9.In Chapters 6 to 14 of this review we address in more specific terms the programme of
statistical activities – sector by sector
10.In terms of current governance the DCS has its internal Management Board comprising the
DG and the senior management team consisting of DG/ADGs/Directors which meets regularly
on at least a monthly basis. This is a broad forum which includes Divisional Directors of bedded-
out teams in the various Ministries. More strategic decisions are taken by the DG with support
from the Head of Finance and the Auditor and the ADGs although it isn’t clear whether these
are taken in the formal framework of a committee or management board structure.
11.The DCS sits under the auspices of the Ministry of Economic Reforms and Public
Distribution. Recently the Minister has invited a Committee comprising representatives from
the Central Bank of Sri Lanka, the Institute for Policy Studies, LIRNasia, the Department of
National Planning bringing together some wider interests in official statistics within
Government and amongst other roles to advise him on future DCS initiatives. This development
is to be welcomed.

Governance
21 | P a g e
12.There have been previous attempts to co-ordinate the interests of a range of government
and parastatal organisations. In the past these have been relatively short-lived. In October
2010 the Treasury (then responsible for DCS) established a National Data Committee to create
more productive statistical system to fulfil data needs of users. This was an element in a
Statistical Capacity Upgrading Project implemented by the DCS jointly funded by the World
Bank and the Government.
13.The Committee was charged with identifying national statistical priorities and providing
necessary guidance to the DCS and other relevant institutions thereby contributing towards
strengthening the National Statistical System of the country.
14.The NDC was chaired by the Deputy Secretary to the Treasury and the core Members of
Committee were senior management level officials of the DCS; National Planning; and the
representatives from the Presidential Secretariat, Central Bank of Sri Lanka Demographic
Department of the University of Colombo, Institute of Policy. Representatives from other
ministries, public and private sector institutions were also invited to the Committee as and
when necessary.
15.The need for greater co-ordination of statistical activity has been recognised for a number
of years. At a UN Department of Economic and Social Affairs Division (Workshop on the
Organisation of National Statistical Systems and User – Producer Relations) in 2008 the then
Deputy Director of DCS – in a paper to the Workshop – listed a number of areas
•Improving co-ordination in National Statistical System
•Autonomy of National Statistical Offices
•Increase User Engagement
•Useful Administrative Data for Statistical Purposes and
•Role of National Statistical Offices in Analysis, including the provision of microdata
16.The paper observed that “the national statistical system in Sri Lanka provides
comprehensive statistics to policy makers and general public within a legal framework.
Authority to obtain information is provided in the legislation while assuring confidentiality of
data providers. Although this has enabled collecting information from the general public in
household surveys, it does not have enough provisions for encouraging public and private
sector agencies to provide data to the DCS. As a remedial solution, it has been suggested to
revise the legal framework.”
17.The need for a co-ordinating mechanism dates back further to 1957 when a National
Statistics Committee was appointed by the Minister of Finance to act as an advisory body to
the government on the development of statistics, to examine and report from time to time on
the statistical requirements of the country and the steps that need to be taken to meet these
requirements. This committee ceased to exist at some stage in the 20th century. A former DG

Governance
22 | P a g e
observed in 2002 in a DCS publication that this committee “did not function properly after
some time for some reason or another.”
18.More recently in a draft Strategic Plan 2016-2019 the then DCS listed a number of critical
issues facing the Office amongst which was the need to achieve co-ordination across all
Government Ministries, Departments and Agencies. The draft plan incorporated a SWOT
analysis which identified weaknesses and threats to DCS.
Weaknesses Threats
•Low profile of statistics within sector
Ministries
•Inadequate capacity to collect, compile,
store disseminate & use statistics
•Old and outdated legal & policy framework
•Inadequate human resources
•Undertrained staff
•Low investment in infrastructure and
equipment
•Un-coordinated & un-harmonised
statistical management
•Absence of co-ordination mechanisms
•Weak HR management
•Old & outdated legal Act
•Un-harmonised terms & concepts
•Placement of statistical units under
planning departments
•Too many lower ranking statistical officers
in the SCS
•Irregular promotions
•Inferior professional image of statisticians
•Limited value of statistics
19.The comment relating to the limited value of statistics is an interesting one. Whilst we
might disagree with the more general thought that statistics are of limited value it is possible
that this comment relates to a limited use and hence a limited demonstration/perception of
the value of statistics. It is also possible that this was intended to suggest the threat that
users have low regard for the quality and accuracy of the published statistics. In particular we
are aware of concern amongst some serious users of recent GDP estimates and while DCS
has genuine autonomy in terms of the 1956 Ordinance – autonomy also relies on perceived
trust in the published statistics and that trust could become in danger and unstable in the
present circumstances. We give particular emphasis to the sector review of economic
statistics in Chapter 6 which proposes a number of options for improved methodology whilst
separately identifying the need to improve the quality of the Business Register – the sample
frame for business surveys – through improved access to administrative data from The
Registrar of Companies and the Inland Revenue Department.
20. In February 2017 a spokesperson representing DCS at a UNESCAP workshop in Bangkok
and giving a paper “Preliminary national diagnostics for environmental statistics” argued for a
new Statistics Act for Sri Lanka and for the convening of a National Statistics Committee to
improve co-ordination of the various disparate sources.

Governance
23 | P a g e
21.More general questions have been raised both during the launch of this Review in February
and at the Ministerial Advisory Committee in July relating to the wider use of data collected by
DCS. There is the feeling that the quality of DCS outputs could be raised by more imaginative
dissemination strategies, for example by the greater use of infographics, and that strategic
partnerships with research institutions could encourage a greater use of DCS data bases. DCS
is quite properly concerned to protect the confidentiality of individual data entrusted to it by
households and businesses. But given some thought and appropriate technology and
necessary resources a National Statistical System should be able to develop a policy which,
whilst protecting confidentiality, encourages a wider use of official statistics. Dissemination is
just one of many policies which need to be discussed wisely and codified – these are discussed
further in Chapters 4 and 5 below.
22.Discussion with some key users (or in some cases potential users) of DCS outputs suggests
the need for wider consultation both at the planning phase and at the
publication/dissemination phases between statisticians and the user community. For example
the conduct of the Agricultural Household Survey is not mentioned on the DCS Agriculture and
Environment Statistics web site and we spoke to users for whom knowledge of such a survey
would have been of keen interest and who could have usefully contributed to discussion about
the shape of the survey and who would welcome access to disaggregated data for their
research purposes.
23.We do not feel equipped to agree or disagree with the propositions relating to the balance
between lower and higher rank of civil servants in the statistical profession or to the irregularity
of promotion opportunity
24.There are nevertheless recurring themes with the earlier paper. And these themes again re-
emerge in a draft Strategic Plan for 2019-2023 (not yet agreed at the time of our mission) but
under consideration by the recently appointed Committee being chaired by the Secretary of
the Ministry of Economic Reforms and Public Distribution which identifies among a range of
strategic objectives the need to co-ordinate activities of all data producers and to establish a
National Statistical System. The strategic objectives presented in the draft include:
• Collection, compilation, processing and analysis of socio-economic data and the
publication of official statistics according to international standards
• Coordinate activities of all data producers and establish the National Statistical System
• Identifying national and international demands for new official statistics and taking
measures to compile such statistics by using the most suitable methods
• Using new technology in collecting data
• Using new technical and theoretical methods for data summarizing and analysis
• Taking remedial steps to avoid non-response at censuses and surveys
• Introducing new and simple technologies for easy access to data
Governance
24 | P a g e
• Improve the statistical literacy of the general public
• Investing in professional staff with higher theoretical and practical knowledge and skills.
Summary assessment
25.We identify a highly centralised and compartmentalised statistical system with little
emphasis on co-ordination of activities and with a relatively low priority when it comes to
meeting data requirements beyond those of more traditional users of official statistics.
26.We recognise good levels of technical competence but missed opportunities to improve
accessibility to administrative data that would benefit and improve the quality of existing
official statistics.
27.We identify a willingness to embrace the notion of a more co-ordinated outward looking
national statistical system and a recognition of the benefit in following such a path and of the
part that DCS could and would have to play in such a development.
Recommendations
28.Recommendations following from the above assessment support the case for revisiting the
Statistical Ordinance of 1956 which is further discussed and elaborated in Chapters 3 and 4 and
specified in Chapter 5.
29.We recommend the continued centralisation of official statistics within a revised legal
framework which improves coordination with other suppliers of data including those Ministries
and Departments which have administrative data sources of value to the compilation of official
statistics.
30.We recommend - within a wider National Statistical System – that there be a review and
creation of a cadre of statisticians capable of filling key roles with ongoing professional
development programmes, an examination of the regulation of promotion rules with a
recognition of key positions identifying succession planning strategies.

Governance
25 | P a g e
Chapter 3: Statistical policies
1.In 1992, the United Nations Economic Commission for Europe (UNECE) adopted the now widely
promulgated fundamental principles of official statistics in the UNECE region. The United Nations
Statistical Commission adopted these principles in 1994 at the global level. The Economic and
Social Council (ECOSOC) endorsed the Fundamental Principles of Official Statistics in 2013; and in
January 2014, they were adopted by General Assembly. This recognition at the highest political
level underlines that official statistics - reliable and objective information - are crucial for decision
making, for informing national debate and for monitoring the success of policy initiatives.
2.The UN Fundamental Principles of Official Statistics which are set out fully in Annex 2 come
under the following 10 headings
• Relevance, impartiality and equal access
• Professional standards and ethics
• Accountability and transparency
• Prevention of misuse
• Sources of official statistics
• Confidentiality
• Legislation
• National coordination
• Use of international standards
• International cooperation
3.Any modern National Statistical System, whether it is entirely centralised, or partly
decentralised as appears the case in Sri Lanka, or more decentralised as is the case in a wide
range of different practices elsewhere in the world, will have formalised policies recognising
these 10 principles and reflecting the particular circumstances in their country. The policies
specify not only that the principles should be adhered to but set out how they are to be
adhered within their countries and across the components of their National Statistical System.
4.The UN Generic Law on Official Statistics - http://www.unece.org/index.php?id=45114 - uses
these 10 fundamental principles placing them at the heart of the responsibilities to be borne
by those involved in a modern national statistical system.
5.Evidence in DCS of the existence of such policy documents or of methods of promoting such
policies has been hard to uncover. Generally it should be found in crosscutting statistical policy
papers on such topics as:
• Confidentiality of individual data
• Dissemination policy
• The necessity to publish metadata describing methods of compilation and analysis
• Quality review/accreditation of official statistics
• Impartiality/statistical integrity

Governance
26 | P a g e
• Accessibility to raw data for researchers
• Co-ordination and accessibility administrative data
• Recruitment training and sustaining the cadre of statisticians
• Prevention of undue burden on suppliers of data
• Mechanisms/strategies for maintaining relevance of official statistics and feeding user
requirements
6.But with the exception of the policy on dissemination which is available on the DCS website
we have not come across evidence of other papers.
Summary Assessment
7.The absence of (or at least our failure to uncover) a formal range of statistical policy
documents is a matter requiring urgent attention. Each of the above policy areas listed above
in paragraph 5 may be seen as separate issues, but in reality they are interconnected and in
particular the quality review of official statistics should incorporate assessment of the extent
to which the statistics meet the demands as set out in each of the policy documents.
Recommendations
8.One of the key responsibilities to be placed upon a National Statistics Council – to be
constituted as a consequence of our recommendation for a new legal framework – should be to
commission and promulgate a programme of policy development based on the fundamental
principles.
Governance
27 | P a g e
Chapter 4: The case for revisiting the Statistics Ordinance of 1956
1.The current legislation was enacted in 1956 but its wording dates from 1933. Already the
review process has identified several drivers for change.
2.First there is clearly a need for statisticians to have wider access to administrative data and
the existing framework has not been able to facilitate such access. Some key examples lie in
the area of business surveys where the sample frame should be an up-to-date Statistical
Business Register supported by data from The Register of Companies, augmented by VAT and
PAYE data from the Inland Revenue and with not just a single classification of industry based
on ISIC but with that classification carried out by a single team in order that enterprises and
establishments have identical classification irrespective of the use to which they are put.
3.Where existing legislation prohibits the sharing of such administrative data – as is understood
to be the case with the data held by the Inland Revenue Department – then a revision of the
1956 Statistics Ordinance giving a National Statistical System the power to access such data
should supersede that prohibition.
4. Similarly, in the crucial area of population and demographic statistics is considerable
advantages in using the Registrar General’s individual data to improve estimates of birth and
deaths. The greater gains would come if better information were available on internal as well
as international migration and this could be a fruitful area of investigation in a range of Local
Government / Health / Education / Migration Department areas of policy.
5.Further co-operation between a range of Departments and DCS could uncover ways of
improving the quality of estimates of output in the national accounts across a range of
parastatal activities where current estimates are frequently based on relatively simplistic
assumed relationships between volumes of activity and current and constant priced estimates
of output. Certainly, there is an overriding requirement to introduce a strong enforcement
policy in order to increase the current very low levels of response in many of the DCS Industrial
Surveys. A recent initiative to introduce a quarterly service sector survey has had to be halted
due to very low response rates.
6.Attempts to co-ordinate statistical activity have in the past stumbled. It is not entire clear
why they have not been successful. It is possible that there has not always been a long term
will and those promoting greater co-ordination have not had the necessary legal powers to
overcome inertia or conflicting priorities.
7.In these circumstances a new law which sets out the powers and responsibilities of a National
Statistical System whilst not necessarily overcoming all the hurdles would at the least offer a
framework for improved co-ordination. It could open dialogues between producers of official
statistics, suppliers of components and users of published statistics leading to a greater
awareness of the uses to which DCS data are put and more flexibility in terms of developing

Governance
28 | P a g e
new products. This is particularly relevant in respect of our observations above in Chapter 2
section 22.
8. One of the main assets of any NSS is the cadre of professional statisticians. A new legal
framework could place weight on professional and career development and on succession
planning for key positions. Planning for this should lie at the heart of any future NSDS and a
Statistical Council could coordinate such planning with such institutions as the Public Service
Commission. .
9. Our discussions with the Minister’s Advisory Committee highlighted a concern relating to
the development and sustainability of the cadre of professional statisticians underpinning the
activities of the NSS particularly insofar as there are likely to be growing competitive external
pressures for the skills that are required in producing and processing official statistics.
Key strategic questions that need to be addressed include:
• What skills are needed now and in the future?
• What can statistical offices offer for staff?
• How to attract staff with those skills?
• How to communicate about job opportunities in statistics?
• How to train staff to maintain and develop their skills?
• How to provide the best possible working environment?
10.The capability of an NSS is highly dependent on the calibre of its staff. Organizational
arrangements may contribute to enabling people to do their best; but it is essential to give
utmost attention to building up the right skills for a statistical agency and its counterparts
throughout Government.
Our report does not presume to lay out the particular path Sri Lanka should take – but does
recommend that responsibility for determining the content of a human resource management
and development (HRMD) policy should be a statutory task placed on the National Statistics
Council and we would imagine that the development of such a strategy would parallel a
thorough review of the internal organisational structure of DCS
• examining the balance of resources deployed in the different sectors, identifying
opportunities for cross-sector collaboration,
• looking at ways to strengthen the cadre of government statisticians,
• developing the skill base within that cadre to meet the requirements of the National
Statistical System,
• identifying the best talent within the NSS
• building succession planning strategies for the key posts in DCS looking forward over
the coming years.

Governance
29 | P a g e
11. Within the remit of such a review we strongly recommend that consideration be given to
amending the status of the National Statistical System within the overall framework for the
appointment and management of government staff to an Island Wide Service giving the
NSS greater discretion in these areas.
12. And finally a new law would give Sri Lanka an opportunity to enshrine the fundamental
principles set out in Paragraph 2 of Chapter 3 and listed in detail in Annex 2 and over time
these could form the basis for explicit policies protecting the confidentiality of individual
data, strengthening the impartiality of official statistics, reducing the burden on businesses
supplying data whilst at the same time increasing response rates and improving the quality
of the results of such surveys.
Summary Assessment
13.The case for introducing a new statistical legal framework is set out above
Recommendation
14.It is strongly recommended that the Government considers the finding of this Review and
proceeds to introduce a revised statistical legal framework along the lines to be set out below in
Chapter 5.

Governance
30 | P a g e
Chapter 5: The path ahead
1.In this chapter we discuss two options for changed governance arrangements..
2.Adopting the Generic Law on Official Statistics(GLOS) under which the NSS would be defined
as suggested in Chapter 2 to include
• producers, who compile official statistics;
• suppliers, or providers, who supply the data for the compilation of official statistics;
3.The case for a new statistical act has been discussed above in Chapter 4 and there exists a
readily available and carefully thought through template for a new act in the form of the
Generic Law on Official Statistics for Eastern Europe, Caucasus and Central Asia promoted by
UNECE. A full text and explanatory notes are available at the website
http://www.unece.org/index.php?id=45114 and this does offer a path forward which
establishes the legal framework for the development, production and dissemination of official
statistics.
determines the main principles of official statistics according to the UN Fundamental Principles
describes the organisation of the NSS and of those parties to the NSS
• National Statistical Office – the DCS including the District Offices
• Chief Statistician (Director General of DCS) – role and responsibilities
• other producers of official Statistics
• a Statistical Advisory Council
• other advisory bodies
describes mechanisms, powers and responsibilities for the coordination and programming of
national statistical activities - in particular: multi-year statistical programming
provides the legal mandate for data collection whilst setting out the NSS obligations to
suppliers of data
gives powers to an NSS to have access to administrative data and to engage in record linking
activity
sets out the powers to conduct Censuses
requires the protection of data subject to statistical confidentiality
restricts the use of NSS data as exclusively for statistical purposes
places a responsibility on the NSS for secure data processing and storage
restricts access to confidential data for research purposes and creates a charging framework
for making such data accessible in permitted circumstances
lays down commitments to be signed by all upon taking up functions in official statistics and
conditions which must apply in the event of subcontracting of tasks of statistical production
which entail the use of confidential data

Governance
31 | P a g e
places a responsibility on the NSS to develop policies on
• quality assessing and improving the quality
• documentation of sources and methodologies
• co-ordinated dissemination and release practice
• provision of statistical processing services
• of data collection services.
• international cooperation
• penalties for violation of statistical confidentiality
• failure to fulfil the obligation to provide data
4.Under this model, the Statistical Advisory Council would be the main advisory body to the
Government and to the Director General of DCS on issues of strategic importance to official
statistics in Sri Lanka. According to the GLOS the Statistical Council should be composed of
appointed members who broadly represent different user categories.
5.However given the particular situation in Sri Lanka highlighted in this review a variation from
the generic law but nevertheless based upon the UN Fundamental Principles of Official
Statistics could establish a more powerful and authoritative National Statistics Council (as
opposed to an Advisory Council) for Sri Lanka (NSC) served by DCS with the following more
specific powers and responsibilities:-
• to develop the framework under which the collaborative development of the National
Statistical System shall take place
• to oversee the activities of the DCS
• to co-ordinate and regulate a single system of National Statistics: strengthening the
National Statistical System by
o convening Committees to review the statistical programs of Ministries and of DCS
and coordinating with other Departments and Ministries to develop an NSDS
consistent with and supportive of national strategic plans
o monitoring progress of the NSDS and reporting to Parliament
o setting quality standards for statistical outputs and their analyses
o setting standards for the publication of metadata and methodology
o developing a system for the accreditation of all published official statistics
o developing a code of Best Practice
o making agreements in the form of memoranda of understanding between
Ministries and DCS relating to delivery of NSDS objectives, accessibility of data, the
uses to which data may be put
o developing a cadre of high calibre statisticians
o introduce an effective enforcement regime for those who choose to fail to reply to
business survey questionnaires

Governance
32 | P a g e
6.Within this governance framework the role of DCS in addition to its current duties would be
to provide the Secretariat for the NSC.
7.Whilst a National Statistical Council would have an appointed membership including
representatives of a range of users of official statistics as suggested above in respect of an
Advisory Council. However it would differ from a purely Advisory Council in so far as its
membership would also include representatives of key Ministries in a manner closer to that of
the lapsed National Data Committee which was chaired by the Deputy Secretary to the
Treasury and the core Members of Committee were senior management level officials of the
DCS; National Planning; and the representatives from the Presidential Secretariat, Central Bank
of Sri Lanka, Demographic Department of the University of Colombo, the Institute of Policy
Studies. To this list should be added members of senior management of Ministries and
Department producing official statistics and supporting the production of official statistics
through making accessible administrative data.
Recommendation
8.This Review recommends the option which introduces a National Statistical Council as opposed
to the Advisory Council but recognises that this option places a greater burden on those
appointed to a National Statistical Council as such an institution would have executive functions,
roles and responsibilities. .
9.In recommending the introduction of a National Statistical Council we recognise that - even
with the support of the Government for such a development – there will inevitably be delays in
passing the necessary legislation. We therefore recommend that as an intermediate
development, a non-statutory Council be created with broadly the same membership and with
a remit to begin to address the policy issues alluded to above in Paragraph 5 of this chapter with
a view to such a Council evolving into a statutory Council once the necessary legislation has
passed through Parliament. One option – discussed briefly with stakeholders during the
Workshops in October – could involve such a Council being introduced initially as an expert
committee within the framework (Clause 10 f) which already exists under the Sri Lanka
Sustainable Development Act of 2017.
10. We are keenly aware of the pressing need for Sri Lanka to co-ordinate an NSDS however we
feel that such a development requires the processes of co-ordination as set out in the proposed
legal framework and that should either await the creation of a statutory National Statistics
Council or at least an interim non-statutory Council.

Sector reviews
33 | P a g e
Chapter 6. National Accounts
1.The National Accounts of Sri Lanka is compiled by the National Accounts Division of DCS. The
Gross Domestic Product (GDP) is estimated using three approaches: production, expenditure
and income approach expressed at current and constant prices.
Background
2.Gross Domestic Product (GDP) is the total unduplicated value of goods and services produced
within the economic territory in a particular period. GDP growth is the single, most important
indicator of economic growth.
3.The history of national accounts in Sri Lanka goes back to 1947, but compilation in the official
standard forms of the SNA began in the late 1960’s.
4.The Central Bank of Sri Lanka and the DCS jointly compiled the national accounts until 2006.
From 2007 onwards, it has been the sole responsibility of DCS.
5.As time passed, numerous economic and structural changes took place in the economy, and
that in the same way, national accounting standards needed to be updated every now to keep
track with the changing times. To date, the base year of SNA in Sri Lanka was updated to 1958,
1963, 1975, 1990, 1998, 2002 and, most recently to 2010.
GDP by Production approach
6.This is also called the output approach, it measures GDP as the difference between value of
output less the value of goods and services used in producing these outputs during an
accounting period.
7.GDP by production approach is estimated on a quarterly and annual basis. The GDP growth
is based on the production side where the data support is stronger than the expenditure side.
Expenditure Accounts
8.The expenditure approach measures the final uses of the produced output as the sum of final
consumption, gross capital formation and exports less imports.
9.GDP by expenditure is estimated on a quarterly and annual basis. It is estimated after the
release of the GDP by production approach.
GDP by Income Approach
10.The income approach measures GDP as the sum of the factor incomes generated to the
economy: compensation of employees, gross operating surplus and other taxes less subsidies.
It is estimated on an annual basis only after the annual estimates of the GDP by production
and expenditure are compiled.
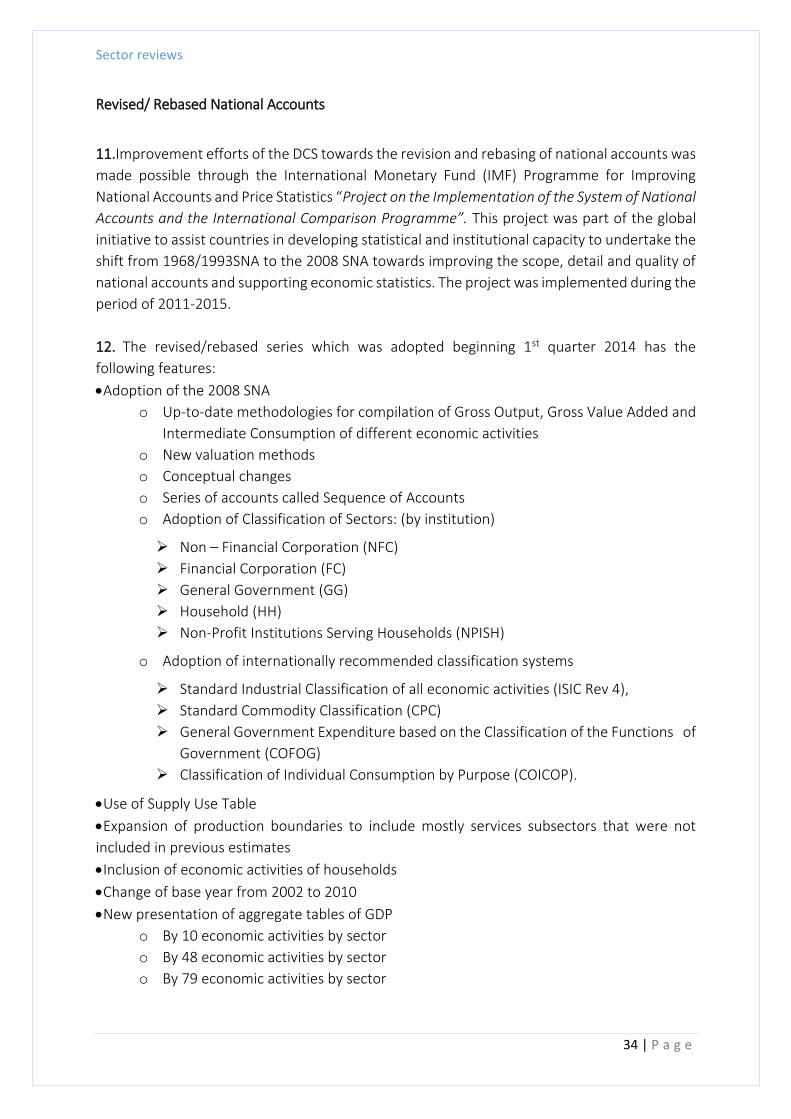
Sector reviews
34 | P a g e
Revised/ Rebased National Accounts
11.Improvement efforts of the DCS towards the revision and rebasing of national accounts was
made possible through the International Monetary Fund (IMF) Programme for Improving
National Accounts and Price Statistics “Project on the Implementation of the System of National
Accounts and the International Comparison Programme”. This project was part of the global
initiative to assist countries in developing statistical and institutional capacity to undertake the
shift from 1968/1993SNA to the 2008 SNA towards improving the scope, detail and quality of
national accounts and supporting economic statistics. The project was implemented during the
period of 2011-2015.
12. The revised/rebased series which was adopted beginning 1st quarter 2014 has the
following features:
•Adoption of the 2008 SNA
o Up-to-date methodologies for compilation of Gross Output, Gross Value Added and
Intermediate Consumption of different economic activities
o New valuation methods
o Conceptual changes
o Series of accounts called Sequence of Accounts
o Adoption of Classification of Sectors: (by institution)
➢ Non – Financial Corporation (NFC)
➢ Financial Corporation (FC)
➢ General Government (GG)
➢ Household (HH)
➢ Non-Profit Institutions Serving Households (NPISH)
o Adoption of internationally recommended classification systems
➢ Standard Industrial Classification of all economic activities (ISIC Rev 4),
➢ Standard Commodity Classification (CPC)
➢ General Government Expenditure based on the Classification of the Functions of
Government (COFOG)
➢ Classification of Individual Consumption by Purpose (COICOP).
•Use of Supply Use Table
•Expansion of production boundaries to include mostly services subsectors that were not
included in previous estimates
•Inclusion of economic activities of households
•Change of base year from 2002 to 2010
•New presentation of aggregate tables of GDP
o By 10 economic activities by sector
o By 48 economic activities by sector
o By 79 economic activities by sector
Sector reviews
35 | P a g e
Data Sources
13.Major sources of data for the revised/rebased series came from the various divisions of the
DCS: quarterly and annual industry, construction and services survey; prices; labor force
survey; household income and expenditure survey;
14.Data sources from other agencies include: Dept. of Agriculture; Central Bank of Sri Lanka;
Sri Lanka Customs; Construction Industry Development Authority; Ministry of Finance; Inland
Revenue Department; Ceylon Electricity Board; Sri Lanka Railway; Sri Lanka Transport Board;
Sri Lankan Airlines; Sri Lankan Tourism authority; among others.
Time Lag of GDP estimates
15.Quarterly estimates of GDP by Production are released first, 75 days after the reference
quarter while the quarterly GDP by Expenditure is released a week after; both are disseminated
via Web Release. The annual estimates are generated a year after.
Data dissemination policies
16.DCS has data dissemination policy put in place and is uploaded in the website for the
information of the public. It includes the advance release calendar of national accounts
estimates, Revision Policy and Technical notes on the compilation of the revised/rebases
series.
Assessment
17.The current revised/rebased GDP estimates (quarterly and annual) using the three
approaches comply with the concepts, definitions, classifications, guidelines and
recommendations of the 2008 SNA.
18.In terms of coverage, the quarterly and annual estimates likewise meet the requirements
of the SNA in terms of desired detail and availability. The use of the Supply Use Table is
commended; as it allows the balancing transactions of the resources of goods and services and
the uses of goods and services. The SUT framework shows the linkages and ensures the
consistency and coherence among industries, products and sectors.
Time Lag of National Accounts estimates
19.The time lag of 75 days after the reference quarter for the release of the accounts, however,
is considered too long. The delay greatly diminishes the relevance and usefulness of the output
as it is disseminated in the middle of the last month of the next quarter.

Sector reviews
36 | P a g e
20.If the performance of the economy, for instance, exceeded expectations and posted an
unprecedented growth, the impact of what could be a “breaking news” will not grab much
interest or attention from the public because the period covered is already “history.”
Web Releases
21.It should be noted that the performance of the economy is reported and analyzed in real
terms, or at constant prices to reflect the more accurate growth of production or output in an
economy without the effect of price changes or inflation. It is expected that the write-up is
consistent and accurate in its contents along these lines.
22. It should be brought to the attention of DCS, in the web release, that the write-up states
that it is releasing the GDP growth at current and constant prices. The percent share of the
major economic sectors is reported at current prices while the subsequent paragraphs on the
details of the major sectors are at constant prices. However, for an untrained eye and user who
is not familiar with GDP estimates, the subsequent paragraphs until the end of the report may
be assumed to be at current prices since there is no mention that the analysis has already
shifted to constant prices.
23.This may be a cause of confusion, erroneous reporting and analysis among media,
journalists and users of national accounts estimates. It is also advised that the National
Accounts staff be aware of the reports or write-ups that come out in the newspapers and other
media platforms if they pick up incorrect figures and analysis based on the web releases.
24.It should also be corrected that Taxes less Subsidies on products is not considered a sector
in the economy. It is part of the each of the industries’ Gross Value Added (GVA) but taxes less
subsidies are just taken as a lumped item to cover all industries and then added to the GDP
levels, to convert the GDP into market prices, or at current prices.
25.Meanwhile, it is worth mentioning that aside from the Web releases, the DCS comes out
with infographics on the GDP estimates as well. It is a good follow-up to reinforce the
information to the public for a better recall, emphasizing the industries posting the highest
growths during the period.
Recommendations
Revised/rebased series (base year 2010) should not be linked with the old series (base year 2002)
26.It should be noted that the revised/rebased series (base year 2010) is not linked to the old
series of (base year 2002) given that there are differences in scope and coverage, classification
systems, methodology used and base year. In time series analysis, this is what is termed as a
“break” in the series. Hence, the base year 2010 series is not comparable and should never be
linked to the series of base year 2002.
27.A short footnote should be placed in the new series of 2010 base year to inform the users
that they are not linked with the base year 2002 series. This is to alert planners, researchers
Sector reviews
37 | P a g e
and others who utilize time series analysis to project growth trends to exercise caution on the
use of the series.
Sources and Methods for the revised/rebased series
28.While there are numerous technical and information notes on the improved and revised
series, it will be helpful to the current and future staff of national accounts and major users to
have a detailed documentation on the sources and methods by sector for transparency and a
better understanding of the processes used. A standardized template for all the sectors is
beneficial, to ensure that all the required information is there, including assumptions, data
limitations, parameters used, (such as under-coverage ratios), deflators, and most importantly,
the methodology used.
29.Citing Principle 3 of the UN fundamental principles of official statistics, “To facilitate a
correct interpretation of the data, the statistical agencies are to present information according
to scientific standards on the sources, methods and procedures of the statistics.”
Conduct of Consultation Forum
30.In the future, it is encouraged for DCS to conduct a consultative forum to present the work-
in progress of a major undertaking in national accounts such as the rebasing and improvement
efforts. Considered as a good international practice, the consultation process is designed to
inform major stakeholders, experts, data producers, and users on the preliminary results with
a view to: 1) solicit their feedback on the changes made; 2) to seek expert opinion and advise
on methodological techniques used; and 3) propose interventions/solutions to challenges and
problems that DCS encountered along the way.
31.As a result of the feedback gained from the consultative forum, the DCS is expected to
implement the suggested improvements and/or changes whenever feasible. The ultimate
objective of incorporating these inputs is to improve the quality of the revised/rebased series,
where the major stakeholders are properly consulted and eventually, become part of the
process.
32.It is common among countries that implement this practice in their national accounts
improvement efforts to experience a general acceptance of the new revised series and
encounter fewer questions or inquiries on the results once they are officially disseminated.
Use of business registers to update economic surveys
33.The DCS and the Inland Revenue Department are currently collaborating on the harmonized
business registry based on the industry classification of the ISIC used in the SNA. Individuals or
Groups who file business permits in the Inland Revenue Department are then categorized into
the 2-digit level of ISIC, depending on the type of industry their business belong to. Information
on the business registry are then passed on to DCS for use in updating economic surveys based
on the list of establishments.

Sector reviews
38 | P a g e
34.There are concerns, however, that establishments entered into the registry may not be
properly categorized into the proper ISIC. There are also opportunities to augment business
register data with VAT and PAYE data from Inland Revenue administrative data sources, and to
ensure that there are no gaps or overlaps in the Business Register and it is recommended that
DCS engages with discussions with IR to establish how this may be developed.
35.DCS should ensure that regular guidance and monitoring of staff in the Inland Revenue is
provided. It is also important that the register is consistently maintained for "births" of new
businesses and "deaths" of existing businesses and that consistency in classification of business is
observed for both IR and DCS purposes.
Use of existing data and indicators from multiple sources
36.With data constraints that the national accounts staff regularly experience from the
traditional quarterly surveys such as low response rates; incomplete or delayed data from
regulatory agencies; and no data at all for a particular sector, it is necessary to find ways and
means to supplement these inadequacies.
37.It is suggested that the staff explore and exhaust all existing data sources that are available
from the various agencies and other sources and need not be limited to traditional data
sources.
38.There is a wealth of information, specifically, on administrative data that the DCS has not
fully tapped or may not be even aware of these information.
39.An example is the administrative data from the Construction Industry Development
Authority (CIDA). The CIDA Bulletin of Construction Statistics, which is compiled monthly,
contains all the relevant price indices for construction materials; price indices for labor (skilled,
semi-skilled and unskilled); price indices for equipment; fuel; and cost indices for various type
of construction work. They also monitor construction projects by project type, by sector and
by institution, in terms of funding value, expected starting date and expected finished date.
40.These information will already provide a solid data support to estimate the construction
sector on a quarterly basis, both as an industry (production side) and as an investment
(expenditure side). Indicators for estimating output include the price indices for labor and
cost indices for construction projects; and complemented by the ongoing value of construction
projects completed for the month.
41.Price indices of construction materials; equipment; and labour (as input) are sufficient
indicators of input or intermediate consumption; A composite price index may also be
constructed out of these indices to serve as deflator to derive the constant price estimates for
construction (production side).
42.Another source of good administrative data is from the Geological Survey and Mines Bureau
for Mining and Quarrying statistics. Aside from the results of the quarterly survey of industries,
it may be a good complement or substitute for the indicator on output for the mining industry.
The data compiled is very straightforward: it is compiled by commodity produced, categorized
by metallic and non-metallic, in the form of quantity and value. Other data produced are
exports and imports.

Sector reviews
39 | P a g e
43.Aside from administrative data sources, data from the private sector may be tapped as well
including service providers for telecommunication; and business and industry associations. The
Stock Exchange is also a rich source of information of publicly listed companies by industry as
they are required to report their quarterly financial income and expenses; as well as their
performance report and outlook of performance in the short term (succeeding quarters).
44.Major companies and businesses have their own websites and can be used to provide
additional information or indicators of growth, especially if these industries are key players of
the sector. The websites have information on quarterly financial reports and output
performance.
Need for an appropriate methodology for the Construction sector in the quarterly estimation
45.Given the available data on construction from the CIDA cited above, the national accounts
staff should be able to establish a new methodology for the sector. The staff may look into the
methods on how it is generated in other countries.
46.This is to replace the old practice of compiling Construction using basically the trend of
cement production to derive the current quarter estimates. It should be noted that only
indicators of output may be used to determine the production trend of the sector. Cement
production is an indicator of input in the construction industry, not an indicator of output.
Compilation of socio-economic statistics and indicators for local development planning
47.It may be an opportune time for DCS to compile and publish socio-economic statistics and
indicators at the local level (by districts), something similar to a District Profile. A lot of
information is already published (from administrative data and surveys) and just need to be
organized by District.
48.This will greatly help in identifying and analysing the socio-economic situations/conditions
of the different districts, relative to other districts and to the whole country. It will serve as
basis for local governments to implement strategies, deliver intervention programs and
mitigation efforts; and provide the statistical needs of local development planning.
Simultaneous release of GDP by production and expenditure
49.It is highly recommended that the next priority that the national accounts division should
work on, is the simultaneous release of the GDP by Production and GDP by Expenditure.
50.In most countries, these two accounts are released at the same time because each one is
compiled relative to one another and validation measures are done in the context of the
performance of related sectors on each side of the accounts.
51.For instance, the growth in the manufacture of textiles, wearing apparel on the production
side is validated using the growth in exports for textiles and wearing apparel in the expenditure
side. When there are questionable growths or declines in production, it cannot be validated
since there is no estimate of exports of textile to validate it with.

Sector reviews
40 | P a g e
52.Other inter-related sectors include Construction as a production sector and Construction as
an investment (expenditure); mining and quarrying production is both related to
manufacturing sector of metallic and non-metallic products (production) as well as exports of
mining products, (expenditure) and so on.
53.The emphasis made here is that once the Production Accounts has been released, it cannot
be revised if there were inconsistencies found in the production estimates based on the
compilation of the Expenditure Accounts which was generated at a later time and vice versa.
Shorten time lag of release of GDP by Production and Expenditure
54.Efforts should be exerted towards shortening the lag time of the GDP by Production and
Expenditure dissemination from 75 days to 60 days. With the new Statistics Act in the future
and when legal sanctions are already in place for non-respondents to survey questionnaires,
the mind-set of respondents may change to cooperate this time. At the same time, DCS should
still strive to initiate advocacy programs and activities for the survey respondents.
55.The DCS, as the official compiler of the GDP estimates in the NSS, is committed to provide
and deliver timely, relevant, accurate and useful data and information for the government and
the public.
Revision Policy of annual estimates
56.It is also suggested that the revision of the annual estimates be undertaken on a three-year
series at a time and not taken as a stand-alone year at a time. In the same way, the national
accounts estimates are always compiled and analysed relative to the earlier period and the
subsequent period. The three-year revision at a time will allow to correct inconsistencies in
data, valuation and trends in growth in the series, otherwise, the errors will be perpetuated
and will not be corrected.
Need for establishing a formal inter-agency working group on macroeconomic accounts
57.National accounts estimation entails the collaboration, cooperation and commitment of
data producers from relevant agencies and the DCS as coordinator of the NSS and as the official
compiler of national accounts, that it is essential for DCS to strengthen their linkages and
enhance partnerships amongst them. DCS may have a coordination mechanism in place but is
currently not being fully implemented or without formal arrangements.
58.Establishing an inter-agency working group through a Memorandum Order or Resolution
issued by the DCS will provide a venue to bring together the DCS and data source agencies to
address issues, concerns on national accounts compilation and other international
commitments, among them: institutional arrangements for the regular and timely provision of
data inputs for national accounts estimation, emerging requirements of other economic
frameworks and international initiatives, through the issuance of Memorandum of
Agreements (MoA); review of compilation methodologies and other macroeconomic
frameworks towards improvement in coverage, relevance and quality of statistics/indicators;
Sector reviews
41 | P a g e
frequency, timeliness and disaggregation; and designation of new ones to address emerging
information requirements.
59.Membership to the working group shall include the Director of National Accounts, her
designated senior staff and major data producers such as the Central Bank, Ministry of Finance,
the Construction Industry Development Authority, Department of agriculture, Inland Revenue
Department, Insurance Regulatory Dept., to mention a few; and the engagement of relevant
DCS divisions such as the Prices, Agriculture, Sample survey, industry and services divisions,
etc., whenever necessary.
60.The DCS, who is expected to lead this working group shall provide the technical, logistics
and secretariat support to the working group while the concerned agencies are enjoined to
give their full support to accomplish the tasks of the working group.
61.To enhance the efficiency and effectiveness of the working group, it is recommended for
DCS to play a proactive role in steering this group and provide directions towards meeting its
objectives; and to conduct meetings on regular basis, whether as a group or by way of bilateral
meetings. This will also serve as venue to review and monitor the compliance of agencies on
the agreements stated in the MOAs.
Dissemination of Outputs
Web Release
62.There is still much room for improving the Web Releases of the National Accounts
estimates. It is highly recommended to have a standardized template or format, to make sure
that all the required information is consistent and coherent; and is reported towards a better
understanding and analysis of the performance of the economy. It should be newsworthy, i.e.,
significant and brief, but specific, as the media and journalists may pick it up and publish the
press release as is, or they may use parts of it to create a larger news story. It may be
worthwhile to invest in effective communication strategies towards a better presentation of
national accounts outputs.
Dissemination via Press Conference
63.The DCS should seriously consider releasing and announcing the GDP growth through a
Press Conference in the future, to report and expound more on the details, such as sectoral
performance; indicators supporting the growth, among others. This will entail additional time
and preparation for the national accounts staff and the officials concerned, but it will be
beneficial to DCS in the long run.
64.Through this platform, journalists and reporters may be able to ask follow-up questions or
clarifications and DCS will have the opportunity to address queries or issues at hand face to
face and immediately; something that a prepared statement released through the web is
unable to provide. Further, this will provide DCS an opportunity to gain media exposure and to
reach out to a wider audience. As a result, DCS will increase its visibility and hopefully gain in
due time, favourable recognition and authority as an institution.

Sector reviews
42 | P a g e
Continuous training of national accounts staff
65.Regular capacity building on national accounts, other macroeconomic frameworks and
indicators as well as participation in international cooperation programs and trainings for
national accounts staff are highly recommended to strengthen and sustain an adequately
trained staff.
66.Capacity training on specific topics are also recommended such as Supply and Use Table,
Input-Output Table, Rebasing of National Accounts, Chained GDP, Linking and backtracking of
Time Series, among others.

Sector reviews
43 | P a g e
Chapter 7. Price Statistics
1.Information related to prices is collected, generated and disseminated by the Prices and
Wages Division of the DCS. Statistics compiled by the Division include the Consumer Price
Index, Producers Price Index and Producers and Retail Prices.
Consumer Price Index (CPI)
2.The CPI measures the average change over time in the weighted prices of a market basket of
commonly purchased goods and services by households relative to a base year; Weights are
assigned to the commodity groups/sub-groups, reflecting their priorities in the household
consumption. As the prices of goods and services do not all change at the same rate, the CPI
can only reflect their average movement.
3. It is a widely used as macroeconomic indicators of inflation or increase in prices. Such
changes affect the purchasing power of consumers’ incomes and their welfare. By comparing
the prices in the current month to the prices of the previous month, for example, it determines
how much more money one needs to buy the same goods and services at the current month,
compared to the previous month.
4. Several applications of the CPI include its use as deflator of expenditures at current prices to
derive measures of real consumption and real income in the national accounts; in labour
contracts to adjust salaries and wages; and indexation of social security benefits, taxes, rent
and interest.
5.For the CPI, the DCS generates two indices: the Colombo Consumer Price Index (CCPI) and
the National Consumer Price Index (NCPI), on a monthly basis. It is also compiled quarterly and
on an annual basis.
6. Historically, the DCS compiled the CPI covering the Colombo metropolitan area only, for the
period 1947 to 2008. From May 2008, the CPI expanded its coverage to include the urban areas
of Colombo. In June 2011, the CPI was rebased to 2006/2007 and from January 2017 onwards,
the base year was updated to 2012/2013. The CPI was renamed to CCPI with the development
of the NCPI to reflect the changes in prices for the entire country. This was released beginning
October 2015.
7. Prices for both the CCPI and the NCPI are collected by personal visits of price collectors from
DCS who have been trained and equipped with forms for entering price data and descriptions
of the items to be observed.
8. Prices for the CCPI are collected for 392 items in 14 selected pricing centers (outlets or
establishments where the prices of commodities are quoted) in the urban areas of Colombo

Sector reviews
44 | P a g e
district on a weekly basis. Meanwhile, prices for the NCPI are collected for 407 items from
three price outlets in each of the 24 districts of Sri Lanka. Frequency of collecting prices for the
items in the market basket vary depending on how fast the prices change: Fresh fish, rice, fruits
and vegetables prices are collected weekly; Once in two weeks for prices of dried fish and
spices and; monthly for textile and footwear; and quarterly for furniture, building materials
and pharmaceutical products.
9. There are 12 major expenditure groups covered in both indices and its classification is
aligned with the United Nations’ Classification of Individual Consumption According to Purpose
(COICOP).
Methodology:
10. DCS makes use of the Modified, or Two-Stage, Laspeyres formula to calculate the CPI. The
price collected in the current period is divided by its price collected in the previous period. This
short-term ratio is multiplied by the item’s estimated cost of base period spending in the
previous period to obtain the current period estimate of the cost of base period spending
assigned to the item. The CPI is the sum of the current period estimated cost of base period
spending divided by the spending in the fixed base period.
11. Currently, the weights for the 2013-based indices are derived from the latest Household
and Expenditure Survey (HIES) conducted by DCS covering 20,540 sample households for the
period June 2012-July 2013.
Time Series
12.The DCS maintains the following monthly time series of the CCPI and NCPI:
•1958-2008 CCPI (base year=1958)
•2003-2011 CCPI (base year=2002)
•2008-2016 CCPI (base year=2006/2007)
•2014-present CCPI (base year=2013)
•2014-present NCPI (base year=2013)
Producer’s Price Index (PPI)
13. The Producer Price Index (PPI) measures average change over time in the prices of goods
and services received by domestic manufacturers and producers for their output. The PPI
reflects price changes from the perspective of the seller. PPIs are usually generated for finished
goods, intermediate goods, and raw materials.

Sector reviews
45 | P a g e
14.The PPI is used for many purposes, among them: as deflator of current prices in production
sectors to derive measures of real income in the national accounts; as short-term indicator of
inflationary trends; indexation of legal contracts in both the public and private sectors; and an
analytical tool for businesses/researchers.
15.PPI is generated by DCS on a monthly basis covering three economic activities namely,
Agriculture, Manufacturing, and Electricity and Water. It is also compiled quarterly and on an
annual basis.
16. Prices for PPI are collected from domestic producers for 514 products from 376
manufacturing and utility establishments; 36 agricultural products from 331 divisional
secretariat divisions covering the entire country; and prices for electricity and water supply are
sourced from the Ceylon Electricity Board and National Water Supply and Drainage Board,
respectively.
17. The PPI groupings of economic activity follows the 2-digit level economic activity of the
United Nations’ International Standard Industrial Classification Revision 3.1 (ISIC Rev.3.1).
18.Currently, the weights for the 2013-based PPI are derived from the Census of Industry
conducted by DCS for reference year 2013.
Time Series
19.The DCS maintains the following time series of the PPI:
•2014 - present (base year=2013)
Producer’s Price of Locally produced Agricultural, Livestock & Fisheries products
20. Producer’s Prices for Agriculture represent the prices received by farmers and producers
for their produce at the first point of sale, excluding transport cost. Commodities covered
include cereals, milk, eggs, fish, livestock and miscellaneous products, which are collected in
the second week of every month. It is compiled on a monthly, quarterly and annual basis. Prices
are considered final once it is received from the field.
Time Series
21.The DCS maintains the following monthly time series of the Producer’s Price in agriculture:
•1980 - present

Sector reviews
46 | P a g e
Retail Prices for Selected Consumer Items
22. The DCS also compile retail prices for important commodities:
a. Open Market Retail Prices of Selected Food Items – This covers commodities such as rice,
bakery products, vegetable, meats, fish and condiments which average households from
purchase from the market in the following districts of Colombo: Pettah, Maradana, Borella,
Grandpass, Kirulapona, Dematagoda, Wellawatta, Dehiwala, Kotte, Nugegoda, Kolonnawa and
Ratmalana
Open market retail prices are collected on weekly, monthly and quarterly basis through the
field staff of the Department of Census and Statistics in sample market stalls in the City. In most
cases, food items such as vegetables and condiments, prices are obtained by interview method
as well as actual "test purchases" which are carried out in the markets of the city.
b. All Island Retail Prices of Selected Food Items and Miscellaneous – covers commodities such
22.20 as rice, pulses, vegetable, meat, eggs and groceries. Average prices of food &
miscellaneous items are based on the weekly, monthly and quarterly price collections
conducted in the principal urban areas of each District excluding Mannar, Mullaitiv and
Killinochchi by the statistical field staff of the DCS attached to each District Secretariat Office.
Time Series
23. The DCS maintains the following weekly time series of Retail Prices for Selected Consumer
Items:
Open market average retail prices : 2006 – present
All Island Retail Prices: 1999 – present
Validation Procedures
CCPI and NCPI
24.Price collectors undertake a weekly “test purchase” of selected commodities to ensure that
prices are realistic. In the test purchase, the collectors are instructed to buy items at sample
price outlets as ordinary consumers and not as price collectors of DCS. The prices they paid for
the items purchased are compared with the list of prices given by price outlets to the collection
officers. The list contains the names of the price outlets, which allows verification. Price
collectors are also given detailed instructions on the procedures of data collection. To ensure
the objectivity of price collection, the price collectors are assigned to a specific outlet on a
rotation basis, i.e., they don’t visit the same price outlet more than once.
25. Validation of the prices furnished by the price collectors is undertaken by the Senior
Statisticians-in-charge, with the assistance of Statisticians in the division.

Sector reviews
47 | P a g e
PPI
26. For PPI in agriculture, the validation procedure uses the Minimum and Maximum Ratio
(Min-Max) whereby the minimum and maximum range of prices is set for a commodity and
the collected price is expected to fall within the Min-Max range. The price collected is also
compared with Retail prices and international prices of the same commodity.
27. On the average, the response rate of collecting Producer’s Prices for manufacturing and
utility is both 100%, 45 days after the reference period; and electricity and water, 90%; both
45 days’ time lag and two months after the first release.
Producers’ Prices
28. Validation of prices for Producers’ prices is done at the head office, while heads of the
regional offices conduct field visits to check the prices. Instructions for price collection are
provided to field officers.
Open Market Average Retail Prices
29. The frequency of price collection is adjusted based on how frequent price changes take
place. When this occurs, prices are collected on a weekly, once in two weeks, monthly and
quarterly. Completed price schedules are verified for consistency. Correction of entries and
the tabulation are done using microcomputers.
Dissemination
30. The CCPI and the NCPI are disseminated to the public via Web Release on the last working
day of the current month and on the 21st day of the succeeding month, respectively.
31. The PPI for Manufacturing, Electricity and Water are likewise disseminated via Web
Release, 45 days after the reference month since January 2017.
32. The PPI in Agriculture is available internally in the Prices and Wages division only. It is
neither published nor disseminated on the web but may be provided to users upon request.
33. Open Market Weekly Average Retail Prices are released on a Tuesday, after the reference
week, via web release. The All Island Retail Prices of Selected Food Items and Miscellaneous, is
disseminated on an annual basis, published in the Bulletin of Selected Retail and Producers
Prices. The Bulletin comes in the form of a publication and is also uploaded in the web.

Sector reviews
48 | P a g e
Revision Policy
34. CCPI and NCPI: the CCPI and the NCPI are not revised.
35. PPI: Web releases of the PPI for the latest month is termed as “provisional” during the time
of release 45 days after the reference month as there are still establishments where prices
have not been collected; hence, prices are imputed for these establishments. The monthly PPI
is finalized two months after the first release.
Technical Notes
36. Some information on the technical notes on the CPI is found in the write-up of the web
releases. A more detailed information is documented in the publication “Bulletin of Selected
Retail and Producer Prices”, also uploaded in the website.
Issues and Challenges
37.The staff pointed out issues on staff shortage to carry out the price collection activities.
There were also concerns on the need to build capacity training on rebasing of price indices.
Assessment
CCPI and NCPI
38.The CCPI and NCPI recently produced by DCS is generally of good quality: the expenditure
grouping complies with the latest prescribed international standard classification system and
the base weights with the latest survey of HIES of 2013. The statistical method of compilation
is consistent with scientific principles and internationally agreed best practices. There is also a
high level of commitment to publish the CCPI and the NCPI on time as they are released in a
regular and timely manner.
39.Quality assurance of data is carried out using a range of field and validation checks. A
description of the processes is documented in the “Briefing on the first release of the National
Consumer Price Index (2013=100)” and the “Bulletin of Retail and Producers Prices 2013-
2016”, both uploaded in the website.
40. While DCS has exerted efforts in improving their price compilation system through rebasing
and updating of market baskets in recent years, and the addition of the NCPI in 2014, it appears
that the approach is on an ad hoc basis, rather than systematic i.e., where the rebasing is done
periodically, whenever the latest HIES is released; and the new base year is the reference year
of the HIES.

Sector reviews
49 | P a g e
On the Time Series
41.It is a general practice that the starting year of the rebased time series should be the same
as the new base year; i.e., time series of CCPI (base year 2013) should begin in 2013.
42.With the rebased CCPI (base year 2002; 2006/2007; 2013), it is observed that the beginning
of the time series does not start on the base year. For instance, the time series for 2003-2011
CCPI (base year=2002) begins in 2003, not 2002; the time series 2008-2016 CCPI (base
year=2006/2007) begins in 2008, not 2006 and time series 2014-present CCPI (base
year=2013) begins in 2014, and not 2013.
43. In the same manner, the beginning of the PPI time series 2014 - present (base year=2013)
is 2014, not 2013.
On Validation Procedures
44. Validation measures for all price indices are documented in the various web releases and
in the Bulletin of Selected Retail and Producers Prices annual publication. However, in reality,
it is not assured that all of these are practiced or implemented religiously given the long list of
commodities to be collected, time constraints, lack of staff and deadlines to meet. There will
be varying degrees of implementation depending on the time (if there is still available time or
lack of time) for the staff to do so
On Dissemination
45. Practically all the price statistics that the DCS produce are available in the website. Data
users in the government and private sector, research and in other fields, usually look for the
technical notes or sources and methods as well, on how these prices are generated. Some
information on these are interspersed in the write-ups of some web releases but there is no
particular tab or heading in the prices section where technical notes may be found.
Further, for users who are regularly monitoring prices in line with their work or research, there
is also particular tab or heading in the website on what date exactly these are uploaded. This
information is usually mentioned in the write-ups of the web releases.
On Technical Notes
46. Only the CCPI and the NCPI have a more detailed sources and methods than the rest of the
prices.

Sector reviews
50 | P a g e
47. Documentation of PPI, Producers and Retail Prices is lacking. Only a short note on an
introduction of the PPI is available in the DCS website. For the Producer’s price of locally
produced agricultural, livestock & fisheries products; and the Retail prices for selected
consumer items, there is only as brief mention in the Introduction and in the Footnotes on the
corresponding tables, published in the Bulletin of Selected Retail and Producer Prices.
Recommendations:
While the price indices generated by DCS are timely and regularly available, there is a need to
continuously update and improve the quality of existing price indices to ensure relevance and
wider policy use.
Data collection
48. Attention should be given to the following areas:
Continue to review the design of the pricing forms to reflect changes in the item characteristics
a. For consumer and retail prices, there should be continuous monitoring of price outlets to
account for “new” shopping centers, supermarkets and market stalls.
b. It is suggested that DCS considers shifting from the traditional questionnaire-based system
to a computer-assisted devise using Personal Digital Assistant (PDAs) that combines
computing, cellular phone, web browsing and networking features. There are available PDA
software that are customized for application in price statistics such as data entry form and
validation tools to reduce data entry errors. The use of PDAs provides big advantages in terms
of cost savings, quality of data and most importantly, data processing time is significantly
reduced from data collection to data dissemination.
Generation of updated/ rebased price indices
49.CCPI and NCPI need to be updated and rebased periodically, with its base year concurring
with the reference year of the latest HIES. This is to take into account changes in consumer
preferences and spending as reflected in the new weights of the updated market basket of
goods and services; some items may no longer be commonly bought due to changes in quality
or technology; and to exclude the products or services that no longer exist or being traded in
the market.
50. In the same manner, rebasing of the PPI should concur with the reference year of the
latest Census of Industry. It is worth mentioning that the current PPI base year is based on
the latest census of industry reference year of 2013.
51.Rebasing of the CCPI and NCPI time series should be generated in a specified timeline, say
three years after the release of the new HIES, which is conducted every five years; through

Sector reviews
51 | P a g e
the formulation of a Policy on the synchronized rebasing of the CCPI, and CCPI following the
guidelines mentioned above.
Formulation and implementation of Policies on Price statistics:
52. It is recommended that DCS develops in collaboration with users the following policies:
a. Policy on synchronized rebasing of price indices (CCPI and NCPI; PPI on Manufacturing and
Electricity and Water)
b. Policy on Revision of Price Indices- to explain the reference period when the prices are
revised and finalized; or if they are not revised at all.
c. Policy on the Dissemination of Price Statistics - commonly known as calendar of release, this
is to provide information on the date when the prices are expected to be uploaded in the
website; date of availability of publication (hard copy)
53. It is the discretion of DCS to formulate individual policies as mentioned above or come up
with an integrated policy on the generation, rebasing, revision and dissemination of price
statistics. Policies are put in place to address pertinent issues, identify key activities, provide
guidance, expectations and principles to follow regarding an organization’s procedures and
outputs, among others. They also serve as basis for performance monitoring to know if the
policies are actually implemented or not.
Development of new price indices
54. The DCS is recommended to come up with a short term and medium plan or program of
activities in price statistics, prioritizing on the improvement of existing price indices and the
compilation of new ones, in line with compliance to updated economic frameworks and to
capture recent economic developments in Sri Lanka:
Chained Price Indices
55.It is well-known that the use of fixed weights (as in Laspeyres type formula) introduces some
bias in the measure of price change. Fixed-weighted indexes have the tendency to overstate
price changes when the relative price of a commodity increases more quickly than other
commodities. In this regard, the relative weight of that commodity would be overestimated
until the index is rebased resulting in a higher estimate of price change.
56. A key recommendation in the 2008 SNA is to shift from the traditional fixed-based indices
towards chain-linked measures. The problem of base-period dependence and substitution bias
are eliminated with the shift to chained prices. Chain indices are considered superior than
fixed-base indices, because weights are updated every year to reflect the current trend in
prices.

Sector reviews
52 | P a g e
Development of Construction price index and Real estate price index
57. Development of an operational framework and estimation methodology for the
compilation of the Construction price index and the Real estate price index will provide the
ability to track price movements that reflect the supply and demand conditions in these sectors
amidst the flourishing developments in the real estate industry resulting from the on-going
massive construction ventures in Colombo. More importantly, they will also serve as the more
appropriate deflators in national accounts to convert the current value of production of the
construction industry and real estate services into volume measures.
Development of CPI for low-income group households
58. This will reflect the expenditure and the cost of goods and services purchased by the low-
income households. There is a strong demand for the compilation of this price index to support
poverty estimates and analysis.
Establishment of Committee on Prices
It is recommended for DCS to establish an inter-agency committee on prices to serve as a
forum towards the improvement of price statistics.
59.Suggested membership includes major users and stakeholders such as the Central Bank, the
Ministry of Planning, Ministry of Trade and Industry, the Director of National Accounts Division,
Ministry of Labor and Wages, Research Institutes and Private Industry Associations. The DCS
will be able to inform and present to the group its progress of work, including the
methodologies for consultation, validation and endorsement by the committee; determine the
needs/ develop a greater understanding on the uses of price statistics; and address the
emerging requirements of stakeholders and international initiatives on SDG, ICP and PPP, etc.
This mechanism will allow an exchange of views and expertise to resolve issues in price
statistics; provide guidance to DCS on the prioritization on the compilation of new price indices
and will enable monitoring of the compliance to the policies formulated on price statistics.
60.It is highly recommended to publish a Technical Manual on Price Statistics to cover all prices
statistics compiled by DCS for proper documentation. This should include the concepts, scope
and coverage, sources of data, criteria for choosing the sample outlets, collection and
validation procedures, methodology used, the calculation of weights and time series available.
Technical Manual on Price Indices
61.This will serve as a guide to both the staff of DCS and the users of prices statistics. Further,
it will enhance the transparency of DCS in the compilation and dissemination of price statistics;
it may also be used for audit purposes to avoid any risk of index manipulation.

Sector reviews
53 | P a g e
Dissemination of Price Statistics
62. In the event that the recommendations on the Policies on Prices and the publication of a
Technical Manual are implemented, these should have designated headings or tabs in the DCS
website on Prices. This will address the users’ long-standing request for such information.
Conduct of Users-Producers Forum
63.In order for DCS to be relevant and responsive to the needs of users, a regular dialogue
through a Users-Producers Forum is recommended to be undertaken amongst users,
producers and key decision makers. This mechanism aims to facilitate discussion and
cooperation by identifying user needs and for DCS to gain some feedback on the extent to
which the use of price statistics meets users' needs
64. Low responses or non-responses by the data providers affect the quality of price statistics.
The Users forum can also serve as a platform for advocacy in soliciting the cooperation of the
private sector and individuals, in responding to price surveys.
Continuous training of DCS staff
65. It is highly recommended for DCS to ensure that the staff engaged in the generation of price
statistics are up to date in their knowledge and skills to keep up with constantly changing
technologies and methodologies. Training on chained prices and chain-linking, rebasing of
indices; backtracking of indices; development of construction and real estate price indices are
among the priority areas for consideration.

Sector reviews
54 | P a g e
Chapter 8: Agriculture
1. Introduction: The agriculture sector remains an important source of livelihoods for a large
number of population who live in the rural and plantation areas of the country. About 70
percent of Sri Lanka people still live in rural and plantation areas. The agriculture sector
accounted for 7.0 percent of GDP in 2018 and provided employment for about 25.5% of the
labour force1. Agriculture in Sri Lanka mainly consists of crops, livestock, fisheries and aquatic
resources along with agriculture land and agro-forestry. However, changing weather patterns,
labour shortage, fragmentation of land holdings, land degradation, young people moving away
from agriculture, biotic and abiotic stresses to the crops, food waste and destruction of
products, and health concerns of farmers are reported as major problems in agriculture in Sri
Lanka.2
2. Responsible agencies for agriculture statistics: The Department of Census and Statistics
(DCS) and Ministry of Agriculture, Livestock Development, Irrigation and Fisheries and Aquatic
Resources Development are the two main responsible government agencies for the production
and generation of the agricultural statistics.
3. Major data sources, periodicity and geographical disaggregation: The Agriculture and
Environment Division of DCS has been carrying out an Agriculture Census once in 10 years. The
last Agriculture Census was carried out in 2013/14 as a part of Economic Census. Both
household and commercial agriculture activities are included in the census. The outputs are
provided for National and District level. The DCS has also been conducting bi-annual crop
cutting surveys to estimate the paddy statistics; Highland crops statistics for cultivation seasons
(Yala & Maha) at the Grama Niladhari Division level (14021 cases); annual livestock population
and production for district level; annual cost of production for Tea, Rubber and Coconut at
national level; and food balance sheet for each year.
Recently, with the technical support of Asian Development Bank (ADB), the DCS has conducted
an Agriculture Household Survey, 2017/2018 covering different aspects of agriculture
activities. But, the result are yet to be published.
The Department of Agriculture (DoA) provides national forecasts of major crops, fruit and
vegetables for Yala and Maha seasons at national level. The DoA also generates cost of
cultivation data of food crops by carrying out a cost of cultivation survey seasonally in addition
to providing national forecast of food crops. Likewise, the Ministry of Fisheries and Aquatic
Resources provides annual production of fisheries and aquaculture at national level.
4. Administrative data: the Sri Lanka Customs collects data on import and exports of agriculture
products as an official records of custom.
1 Central Bank Annual Report, 2018. 2 Mohan Munasinghe (2019), Sustainable Sri Lanka 2030 Vision and Strategic Path
(https://www.researchgate.net/publication/327221768_Sustainable_Sri_Lanka_2030_Vision_and_Strategic_Path)

Sector reviews
55 | P a g e
5. International standard and methodology: The DCS uses United Nations Food and Agriculture
Organization (FAO) guidelines for the compilation and dissemination of agriculture statistics.
6.The FAO has also recommended a Global Strategy to Improve Agricultural and Rural Statistics
which provides a conceptual framework for agricultural statistics covering the economic, social
and environmental dimensions. The Global Strategy defines a minimum set of internationally
comparable core agricultural data that countries should provide to enable international
comparisons to be made.
7.National policy and framework: The Public Investment Programme (PIP) 2017-2020 which is
a medium-term policy document of the government with sectoral development priorities and
policies, has presented targets, key strategies and investment priority areas for the
development of crops, livestock, plantation and fisheries sectors. Two of the five goals of
development in PIP related to agriculture sector are: (1) Development of rural economies, and
(2) Ensuring land ownership to rural and estate sectors, the middle class and government
employees.
8.The agriculture development targets and strategies in PIP are based on National Agriculture
Policies and Programmes like National Food Production Programmes (2016-2018), and
Agriculture Development Mega Zones for increasing production, substituting imports and
promoting exports of agro-based products. Even though, the agriculture policies have not
directly mentioned the needs of agriculture statistics, they have mentioned the importance of
research and development in agriculture and timely dissemination of the research outputs to
end-users. The new Agriculture Policy has been drafted and submitted to Government
approval to address many challenges in agriculture sector.
9. Data gaps and user's demands:
• Quarterly data on crops, livestock and fisheries production.
• Environmental impacts on agriculture and related environmental statistics.
• Agriculture price data.
• Post-harvest loss of agriculture.
• Crop damage data.
• Spatial data of farm lands related farmers details.
• Availability of real time data.
• Microdata of agriculture census and survey.
10. Issues and challenges

Sector reviews
56 | P a g e
• Accuracy of data: the crop forecasts from Ministry of Agriculture are based on eye
estimate.
• The data from the field is taken by ARPA (Agriculture Production & Research Assistant)
with the document of land area and the ownership according to the land registry. That
is maintained in Agrarian Development Centre level. They estimate the land area
cultivated with no measuring device.
• Data quality: lack of proper validation of agriculture data. Example: 30-40% post-
harvest loss is reported, but there does not appear to be accurate data to support the
findings.
• The Department of Agriculture lacks appropriate methods and skill in data collection.
• The crop cutting survey technique that has been used by DCS since the 1950s should
be improved with modern methodology and technique.
• Lack of proper data base of farmers related to service extended by the institutions
under the Ministry of Agriculture.
• Less accessibility of agriculture related data, e.g. Weather data, Irrigation data.
• Different data types available in different source which are contradictory to each other
• Considerable time required to enter the available data.
• Unwillingness to share the available information to government institutions.
11. Assessment and recommendations
• The DCS has been collecting agriculture statistics mainly through the agriculture
census. The last agriculture census was conducted in 2013/14 as a part of economic
census. The agriculture census was based on FAO guidelines and provides information
on agriculture holding, area and production of crops, number of livestock, poultry,
fisheries, farm labour, farm mechanization, etc. for smallholdings and estates at
national and district level.
• Most of the important agriculture information are captured in the agriculture census,
but the DCS provides a regular flow of quality agriculture data on annual basis. The
recently started Agricultural Household Survey 2017/18 could be a good source of
annual data if it is institutionalized.
• The Crop-cutting Survey for Paddy conducted by the DCS only covers the major
Mahaweli Systems; Udawalawa, B, C, G and H. The absence of a more
comprehensive Crop Cutting survey is a major challenge the Authority faces,
particularly when calculating Average Yields for other Systems. Accordingly we
recommend a more comprehensive survey including other Mahaweli Systems as
well as for some other crops to improve the accuracy of crop yield data.
• The Mahaweli Authority states that the cultivated and harvested crop damage is not
captured in the estimate of annual agriculture production. It unfavorably affects the

Sector reviews
57 | P a g e
accuracy level of estimates of production. Accordingly, it is important to take steps
to measure crop damage in annual production with the aim of minimizing the errors
occurred.
• The Global Strategy to Improve Agricultural and Rural Statistics defines a minimum
set of core agriculture data in three dimensions - economic, social and
environmental. Sri Lanka mainly lacks data on rural and environmental dimensions
such as soil degradation, land use, fertilizers and pesticides used, water and air
pollution, emissions due to agriculture, rural infrastructure, public expenditure on
agriculture and rural development etc.
• There is some evidence of duplication and discrepancy between DCS and Ministry of
Agriculture (Minister of Agriculture, Rural Economic Affairs, Livestock Development,
Irrigation, Fisheries and Aquatic Resources Development) in area and production of
crops, especially of rice and Livestock number and production. The strengthening of
Ministry of Agriculture with scientific data collection methodology and better
coordination between the organizations in production of agriculture statistics should
help to reduce the inconsistencies in data.
• The DCS has been using paper-based questionnaires for data collection in agriculture
surveys and censuses. New technologies like Computer Aided Personal Interviewing
(CAPI) could be used in agriculture census and survey to speed up data collection.
• The available microdata of past agriculture censuses and upcoming agriculture census
and surveys could be made available for users to expand it uses for researches and
better policy planning of agriculture sector.
• It will be important, if the national statistical system is able to focus on micro level
agricultural data too. For example, now paddy statistics (total extent, total production
etc.) available for annual as well as Yala and Maha seasons. If the paddy statistics are
available for long grain white paddy, long grain red paddy, and short grain paddy, such
information is important for the market monitoring purposes. Adoption of such
procedure for the rest of the crops also important.
Sector reviews
58 | P a g e
Chapter 9: Population and Demography
1. Introduction: According to Population and Housing Census 2012 the total population of Sri
Lanka is 20.4 million with sex ratio 93.8, population growth rate 1.1 percent during 1981-2012
and population density 325 per square kilometre. The Sinhalese (74.9 percent) is the largest
ethnic group in Sri Lanka and Buddhism (70.1 percent) is the biggest religion. The Crude Birth
Rate (CBR per 1000 population) is 17.6 and the Crude Death Rate is 6 persons per 1000
population. Apart from the population census the Sri Lanka has a good system of vital
registration for the registration of Births, Deaths, Marriages, and Divorces. These vital statistics
are used for the estimation of the mid-year population each year.
2. The Department of Census and Statistics (DCS) and Registrar General's Department are the
two main responsible government agencies for the production and dissemination of
population and demographic statistics. Department of Immigration and Emigration is provided
data on international migration.
3. Major data sources, periodicity and geographical disaggregation: The Population and
Housing Census which has been conducted once in every 10 years is the main source of
population and demographic data. The last population and housing census (PHC) took place in
2012. The population census provides population characteristics like size and age-sex
composition, dependency population, marital status, ethnicity and religion, literacy and
education, labour force, occupation, migration and fertility of the population. It is also the
source of housing characteristics. The population and demographic statistics from the PHC are
available for national, province, district and Grama Niladhari level. The demographic statistics
are also be obtained and updated by household surveys taking place in certain intervals or in
ad-hoc basis. The demographic and health survey, household income and expenditure survey,
labour force survey and women wellbeing survey are major household surveys in Sri Lanka.
Women wellbeing survey, conducted in 2019 also will provide demographic statistics.
The Registrar General's Department (RGD) uses an administrative data recording system to
compile vital statistics like birth, death, marriage, divorce, and cause of deaths each year. The
information is available at district level. The vital statistics with additional information on
international migration from the Department of Immigration and Emigration is used for the
estimation of mid-year population.
4. International standard and methodology: The DCS uses United Nations guidelines for
conducting population and housing census. The Principles and Recommendations for
Population and Housing Censuses, Rev. 2 (2008), which was recommended by United Nations
Statistics Division (UNSD) for the 2010 World Programme on Population and Housing Censuses,
was followed by DCS in 2012 PHC. Likewise, the RGD uses the UN manual for vital statistics -
Principles and Recommendations for a Vital Statistics System, Rev. 3 (2014) for the compilation
of vital statistics. Cause of death information is coded according to ICD 10 guidelines.
5. National policy and framework: The Statistics Ordinance, 1960 and the Census Ordinance,
1900 with last amendments in 2000 substantially remained the basis for census taking in Sri
Lanka. The same Ordinances also act as a main basis for the Vital Registration in Sri Lanka.

Sector reviews
59 | P a g e
6. Data gaps and user's demands:
Inter census population and demographic updates up to the lowest administrative level, the
GN (Grama Niladhari Division) level, are not available due to the lack of inter census population
surveys.
Internal migration between district to district, and rural to urban area are not available for
period other than census year and this presents a major challenge for those charged with
compiling mid-year population estimates.
On external migration, despite its long history of being a major migrant-sending country, there
is a large data gap on external migration of Sri Lankans. Other than administrative data which
likely exists somewhere, there is no detailed individual/household level information that would
provide a fuller profile of migrants.
The UN agency in Sri Lanka mentioned that the Government does not have a strategy with specific measures to provide assistance to immigrants in the event of an emergency. For example, Sri Lanka’s current crisis communication system operates mainly in the national languages, Sinhala and Tamil. Sri Lanka does not maintain a database of all its nationals living abroad, which would help facilitate emergency assistance, including evacuations and repatriations in the event of crises. To date, there has been no empirical research into the extent to which internal migration or emigration is the result of natural disasters, reoccurring adverse weather conditions or climate change.
Microdata of Population and Housing Census is not made available to users.
7. Issues and challenges:
• The final dissemination of population census results is subject to a 30 months delay.
However, there were a number of data releases in between for different themes of
public importance.
• Internal migration in population census is counted for district to district level, not from
DS to DS level or between sectors.
• Statistics relating to people who have gone abroad temporarily are captured partially.
• Population registry is not updated if person moves from one region to another region.
• Registration of birth and deaths is believed to be 100 percent but small percentage
with some delay.
• The DCS lacks funding for inter census population surveys for updating population
census figures.
• The RGD lacks an online system for registration and transfer of vital statistics from DS
(Divisional Secretariat) level to the centre.
8. Assessment and recommendations
• The DCS has used new technology, such as scanning and computer assisted coding, to
expedite the processing of data in last population census 2012, but there is a strong
case for new IT based technologies like Computer Aided Personal Interviewing (CAPI)

Sector reviews
60 | P a g e
to be used for data collection leading to more timely release and publication of results
We are informed that the DCS has made the decision to use CAPI in upcoming
Population Census 2021 and currently making necessary preparations.
• A shortage of funding in DCS hinders the regular and timely conduct of major
household surveys like DHS and inter census population census for updating
population and demographic statistics.
• The civil registration activities in RGD have been decentralized up to the Divisional
Secretariat (DS) level in all 332 DSs. RGD has taken steps to computerize vital event
since February, 2019 and issue certificate centrally. This system could be decentralized
and turned into online Vital Events Registration Management Information System (VER-
MIS) for ease data collection and transfer to centre office.
• The RGD needs support for equipment and skill development of manpower working in
computer and IT for upgrading the Civil registration system into online system.
• In the latest questionnaire for the 2021 Population and Housing Census, DCS
maintained the question on migration at the district level. The same question could
be re-formulated to ask about the DS division of origin and destination and the
responses could be aggregated as needed – so that more information can be elicited
with just one question.
• A detailed survey of external migrants would also be useful – particularly as recent
migration patterns suggest that the gender and skills mix of migrants has been
changing.
• The PHC is considered a major source of information on the size, distribution and
social- economic characteristics of population, farming and establishment. The
information is vital for making national, regional and local level plans and policy. It also
provides a list of frame for many national and sub-national household surveys.
Therefore, this assessment recommends an open access to the PHC microdata, while
ensuring individual confidentiality.

Sector reviews
61 | P a g e
Chapter 10: Industrial Statistics
1. Introduction: The industrial statistics sector covers data from three industry divisions,
namely the Mining and Quarrying, Manufacturing, and Electricity, Gas and Water sectors of
the International Standard Industrial Classification of all Economic Activities (ISIC) Rev. 4 of the
United Nations, and its localized version is Sri Lanka standard Industrial classifications-SLSIC.
The latest Annual Survey of Industries, 2017 covered industrial establishments with 5 or more
persons engaged and estimates that there are 21,295 such industrial establishments in the
country.
2.Responsible agencies for industrial statistics: The Department of Census and Statistics (DCS)
and Ministry of Industry and Commerce, Resettlement of Protected Displaced Persons,
Cooperative Development and Vocational Training and Skill Development (in short, Ministry of
Industry and Commerce) are the two main responsible government agencies for the
production and dissemination of industrial statistics. The other government agencies, namely
Tourism Development Board, Customs Department, Department of Registrar of Companies,
Department of Inland Revenue, and Construction Development Authority produce rather more
specific types of industrial statistics in their domains – mainly administrative data.
3. Major data sources, periodicity and geographical disaggregation: The Annual Survey of
Industries (ASI) that has been carried out by DCS every year is the main source of industrial
statistics in Sri Lanka. The ASI includes Mining and Quarrying, Manufacturing, and Electricity,
Gas and Water sectors of the ISIC, Rev. 4 and covers state owned industrial establishments,
industries coming within the preview of Board of Investment (BOI) and private sector
establishments with 5 or more persons engaged. The Census of Industries 2003/04 and
Economic Census 2013/14 which are conducted once in 10 years are also considered major
sources of industrial statistics. All the industrial surveys and censuses in DCS provide data to
the 2 digit level of Sri Lanka Standard Industrial Classification (SLSIC 2D). The industrial census
and Economic census data are available for district level.
4. The Index of Industrial production is compiled monthly by the DCS instead of the FIPI of the
Central Bank. The annual survey of Industries is conducted by the DCS for more than 50 years
and a time series of data are available for the industry sector.
5. The statistical Business registry (SBR) was established with the list of economic entities
prepared at the economic census. All the entities with more than three employees are included
in the registry.
6. The ministry of Industry and Commerce keeps records of administrative data through
registration of new industry. The Board of Investment maintains administrative records of big
industries.
7. International standard and methodology: The DCS follows United Nations International
Recommendations for Industrial Statistics 2008 (IRIS 2008) for collection and reporting of
industrial statistics. Likewise, The International Standard Industrial Classification (ISIC) Revision
4 of the United Nations was localized for the convenience of identifying specific industries in

Sector reviews
62 | P a g e
the country. Sri Lanka Standard Industrial Classification (SLSIC) and localized Central Product
Classification (CPC) codes are used to classify the economic activities and products in the
industrial survey and censuses.
8. National policy and framework: The DCS uses the Statistics Ordinance and the Census
Ordinance for the industrial survey and census taking in Sri Lanka. But the Ministry of Industry
and Commerce conducts registration of industries under the Industrial Promotion Act No. 46
of 1990.
9. Data gaps and user's demands:
• The results of AIS are not available at sub-national level, especially for district.
• The administrative data of registration of industries is not accessible to users.
• Needs of quarterly industrial data.
• Environmental issues related statistics on industry are not available.
10. Issues and challenges:
• Low response rate of Annual Survey of Industries (ASI), i.e. 70% on an average.
• Significantly lower response rates for the quarterly/monthly surveys – a recent
initiative in the service sector was discontinued because of disappointingly low
response rates in the order of 30%.
• Legal framework is weak. No separate ordinance for the production of industrial
statistics.
• The foreign investors engaged in major construction contracts report that they are
not bound to give information to DCS. If this is true then it should be source of great
concern given the scale of some key projects.
• Time lag in dissemination of monthly Index of Industrial Production (IIP) is 63 days.
• No mechanism for sharing industrial data among related stakeholders.
• The SBR available in the DCS does not have mechanism for regular updating. The unit
of SBR is establishment and this is also an obstacle in updating the registry with the
registries of other sources as the unit of those are enterprises.
• Changes in inventory levels are not included in monthly and quarterly surveys for
Industrial Production Index survey.
11. Assessment and recommendations:
• Low response rate is a serious challenge in industrial data collection in DCS. It is partly
due to weak legal provision. Data collection is done under Statistics act. But the DCS
has never had taken measures for non-responding establishments. A strong provision
of compulsory response in new statistical ordinance is required.
Sector reviews
63 | P a g e
• Duplication in data collection from industries. The respondent burden for the
collection of data by the prices division of DCS and by Central Bank should be reduced
by better coordination among these agencies.
• The industrial data collection system in DCS is paper based - no web-based system
exists. An online data collection system could encourage some businesses to contribute
and hence to increase response rates – although such initiatives require strong security
systems to protect commercially sensitive data.
• The sampling frame of the industrial survey is not updated regularly. A mechanism to
update the Statistical Business Register should be established as a matter of some
urgency. Establishing a registry with the base registries of Registrar of Companies
(ROC) and Provincial registry of Companies (PROC) and updating it with other
registries like tax registry, CEB, BOI, provincial council business registries would be
very productive and this could be matched with the economic census frame obtained.
• Absence of links to the administrative system of Company registry, Inland Revenue
department, and Provincial business registration: The data stored as administrative
records in the line ministries should be shared with DCS and where (for instance in the
Inland Revenue Department) the law prohibits the sharing of individual company tax
and staff number records a new Statistics Ordinance should explicitly overrule such
prohibition.
• Rebasing the Index of Industrial Production (IIP) needs technical support. If this is done
efficiently the survey of industrial production might no longer be required.
• There is an absence of environmental issues related information in the industrial
survey. The environmental related questions should be added to the survey and census
questionnaires.
Sector reviews
64 | P a g e
Chapter 11: Health Statistics
1. Introduction: The health system of Sri Lanka mainly comprises of preventive and curative
services widely distributed to ensure equitable health services for general public through-out
the country. It practises different systems of medicine i.e., Allopathic, Ayurveda, Unani, Siddha,
Traditional, Homeopathy and Acupuncture. Among them, allopathic medicine is the main
sector catering to public and the government health institutions which are the main agencies
for providing free health services to the public. The statistics show 1107 government hospitals
with 81580 beds operating in Sri Lanka. In 2016, about 6.4 million hospitalizations occurred.
The Ministry of Health, Nutrition and Indigenous Medicine (abbreviated as MoH - Ministry of
Health) is the leading agency responsible for health service development and regulation.
2. Responsible agencies for health statistics: The Department of Census and Statistics (DCS),
the Registrar General's Department and the MoH are the main responsible government
agencies for the production and dissemination of health statistics. The MoH is responsible for
ensuring resources for health services and major health infrastructure development. It also
generates administrative records of the state health sector to meet the information needs of
policy makers, researchers and other interested stakeholders.
3. Major data sources, periodicity and geographical disaggregation: The Annual Health Bulletin
is the main annual publication of the Ministry of Health. It is mainly based on the administrative
reporting of the health institutions, but it also uses information from other sources like
Demographic Health Survey from DCS, and vital statistics from Registrar General's Department.
It presents an overview of the country’s health status, details of service coverage, and
information on the health system which facilitate the provision of health services. The
information are presented by health institute and by district.
The Annual Health Statistics is another publication from the MoH but it also uses the
information from the health bulletin. It also presents an overview on the healthcare delivery
system and the health status of the country. The information on morbidity, mortality, resource
availability and provision of services of government healthcare system are included in the
report.
The Ministry of Health has prepared the National Health Accounts of Sri Lanka for the years;
2014, 2015 and 2016. It follows the guidelines of System of Health Accounts 2011, published
by the World Health Organization and presents the current health expenditures and capital
formation of the respective years.
The DCS conducts Demographic Health Survey (DHS) which provides information on some key
health indicators like fertility, family planning, maternal and child health through and nutrition.
The last DHS was conducted on 2016.
The Registrar General's Department collects annual vital statistics like Crude Birth Rate, Crude
Death Rate and Infant Mortality Rate.
4. International standard and methodology: The Ministry of Health follows the International
Classification of Diseases, Eleventh Revision (ICD-11). It is a classification system that is
proposed by the World Health Organization (WHO) and provides guidelines for universal

Sector reviews
65 | P a g e
comparability in the collection, processing, categorization, and presentation of the diseases
and health conditions.
The DCS follows the standard DHS procedures and methodologies to collect and describe the
data that are comparable across countries.
5. National policy and framework: The DCS mainly depends on the Statistics Ordinance and the
Census Ordinance for the production of health related statistics through DHS, Population and
Housing Census and other related household surveys.
The Ministry of Health, Nutrition and Indigenous Medicine has developed a National Health
Policy (2016 -2025) and a Strategic Framework for Development of Health Services (2016 -
2025). One of the main objectives of the policy is to strengthen evidence-based service delivery
to support journey along the continuum of the health care that needs a strong database of
health statistics. The specific areas which need a good back up of statistics data are mentioned
as:
• The promotion, support and planning, implementing, monitoring and evaluation of
health promotion programmes in different settings.
• The monitoring and evaluation of health promotion programmes and facilitation
monitoring and evaluation of them at different levels.
• The supporting and undertaking of research related to behaviour change of the
community and social mobilization.
6. Data gaps and user's demands:
• Health statistics especially from the Ministry of Health are not available for Divisional
Secretariat (DS) and Grama Niladhari (GN) division levels.
• Lack of periodic disability data.
• Health services data from private practitioners and hospitals are not available.
7. Issues and challenges:
• Poor quality and misclassification in documenting and reporting the diagnosis of the
actual disease.
• The system reporting administrative health data from hospitals to the ministry takes
a substantial time which causes delay in publication of the health bulletin. Currently
there is about one year delay.
• Poor reporting of mortality data of growing non-communicable diseases like heart
attacks, diabetes, etc.
• Deficiencies in coding system of diseases in different health institutions.
• Survey calendar for DHS has not been followed due to lack of funding problem.
• Frequent transfer of the statisticians in MOH without coordinating with the ministry.

Sector reviews
66 | P a g e
8. Assessment and recommendations:
• An on-line reporting system based on patients from hospitals and heath institutions to
the ministry and accessible to the National Statistical Service for the compilation of
health statistics will have a profound impact on the quality, accuracy and timeliness of
health statistics. This requires a high level of collaboration and co-ordination between
DCS and the Ministry of Health (MoH) and it is essential that the requirements of
statisticians are taken into account within the Ministry as more streamlined data systems
are introduced for health service administrative purposes and there is a clear role for a
National Statistical Council to be involved in such a development within the framework
of a National Strategy for the Development of Statistics
• The Demographic and Health Survey is useful for understanding changes in disease
patterns and health outcomes in the population. But it is conducted only about every 10
years, leaving large gaps in between, and moreover, there is not much information
relating to medical expenditures and detailed health service utilization patterns that are
crucial to understand, particularly in an aging society. The low periodicity of a health
survey also impacts monitoring of malnutrition trends, an important health challenge in
Sri Lanka. The Demographic Health Survey is an important resource and ensuring the
ongoing regular conduct of the DHS deserves strong support.
• Our attention has been drawn to the case for the conduct of a disability survey and/or
the maintenance of a disability register in each Medical Officer of Health (MOH) area.
• Linkage and networking of available data from private health services and other health
sectors like Ayurveda, Unani, Siddha and Indigenous medicine are recommended to
ensure a more complete framework for health statistics.
• Provide training for using new coding (ICD-11) system for related staff working in various
health institutions.

Sector reviews
67 | P a g e
Chapter 12: Education Statistics
1. Introduction: The education system of Sri Lanka is considered as one of the best among
developing countries. The adult literacy rate is about 95% and the primary enrolment rate has
reached 98%. It has a wide network of schools reaching every corner of the country. There are
10,194 government schools with 41,65,964 students in 2017. The level of education is divided
into six parts namely: pre-primary (Age 3-5), primary (G1-5), junior secondary (G6-9), senior
secondary (G9-10), collegiate and tertiary. The schools are running under government school
(national and provincial), pirivena schools (schools, mainly for Buddhist priests), government
approved private schools, government approved special schools and international schools. But
most of the schools are government-run and free. The Ministry of Education (MOE) and
Ministry of City Planning, Water Supply and Higher Education (earlier, Ministry of Higher Education) are
the two main central government agencies to administrate the education system in Sri Lanka.
Decentralized general education system by devolving the power to provincial councils in 1987
since then Ministry of Education (MOE) and Provincial council bodies are responsible for the
administration of government schools in Sri Lanka.
Selected Landmarks in the evolution of the present system of education in Sri Lanka.
• 1939 Enactment of Education Ordinance No. 31 of 1939
• 1943 Establishment of Central Colleges
• 1947 Introduction of free education from Kindergarten to University
• 1961 takeover of denominational schools to establish a national system of education
• 1987 Devolution of power to provincial councils
• 1991 Establishment of National Education Commission
2. Responsible agencies for educational statistics: The Department of Census and Statistics
(DCS), the Ministry of Education (MOE), the Ministry of City Planning, Water Supply and Higher
Education (earlier, Ministry of Higher Education) and University Grant Commission (UGC) are
the main responsible government agencies for the production and dissemination of education
statistics. The Ministry of Education (MOE) is in charge of general government school (national
and provincial), pirivena schools, government approved private schools, government approved
special schools and international schools, Teacher training bodies (Teachers Training Colleges,
Colleges of Education and Teacher Centres), National Institute of Education (preparation of
teaching material for pedagogy), Department of Educational Publications (preparation,
printing and distribution of subject-wise school text books for students) and Department of
Examination (for conducting national level examinations). The Ministry of Higher Education
plays an important role in the area of organizing and directing the higher education system.
3. Major data sources, periodicity and geographical disaggregation: The annual school census
carried out by the Ministry of Education (MOE) is the main source of general education
statistics in Sri Lanka. This census has been carried out for during the past five decades. It
initially covered only the government schools in the country and collects information on
schools, teachers, pupils and physical resources available in the schools. With the progress of

Sector reviews
68 | P a g e
the school census, data collection process has been expanded to pirivena schools, government
approved private schools and government approved special schools during the last few
decades and recent addition has been international schools since 2017. In addition, The
Ministry of Education (MOE) also collects information on education related institutions such as
Teacher Training, Colleges and National Colleges of Education and data related to non-formal
education through a separate data collection simultaneously along with the annual school
census. The information from the school census is made available annually by national and sub
national levels, such as province, administrative district, education zone, education division
and divisional secretariat level.
4. The page called ‘EduStat’ in Ministry of Education (MOE) official web site is the place where
users can download the statistical tables which are prepared based on the school census data
in the last few years. In addition to that, “Lanka SIS” data portal in Department of Census and
Statistics (DCS) official web site is a page where users can download the interactive statistical
tables of school census data for last few years. As a landmark of school censuses, the 2019
census is going to conduct as first ever online school census in Sri Lanka during the last quarter
of the year.
In parallel to school census data collections the Ministry of Education (MOE) has been started
to build an online Management Information System (MIS) called NEMIS at zonal and school
level to maintain the individual level records of teachers and students. The above system has
few integrated separate databases and which included database for teacher data (THRM), a
database for student data (SIS) and plan to expand to further more areas.
The Population and Housing Census that has been carried out by DCS is another important
source of education statistics. The census is used for the calculation of literacy rate and other
cross tabulations related to education by national and sub-national level of the country.
5. International standard and methodology: The DCS follows the International Standard
Classification of Education (ISCED) framework to collect and report education data in order to
produce internationally comparable education statistics and indicators. The ISCED is initially
developed by the UNESCO and it has published ISCED 2011 Operational Manual: Guidelines for
Classifying National Education Programmes and Related Qualifications.
6. National policy and framework: The DCS uses the Statistics Ordinance and the Census
Ordinance for the production of Education Statistics through Population and Housing Census
and related household surveys. The Ministry of Education uses the Education Act No. 31 of
1939 and the Education Sector Development Framework and Programme (ESDFP) for the
development of the education sector and production and dissemination of related education
statistics. The ESDFP is a medium-term educational development plan that has been started
since 2006. The last ESDFP is available for the period of 2013-2017.
7. Data gaps and user's demands:
Demand for school census data series at school level for trend analysis of the education system
of Sri Lanka is very necessary for implementing any development program on the ground.
Timely data from the Annual School Census is compulsory. It is time to improve the level of the

Sector reviews
69 | P a g e
quality of census data also necessary. Normally the school census result has one year time lag
for dissemination. To reduce the time lag for dissemination of census data already has
proposed an online census for 2019.
8. Issues and challenges:
• The annual school census data are not up to the quality standard level, DCS expected
due to incorrect data are filled with the census schedules at the school by less trained
school teacher/census officers.
• An absence of online reporting system of Annual School Census causes delay in census
data dissemination and release of the publication related to the census. However, due
to lack of computer and internet facilities in the small schools located in very remote
areas far away from local townships have to be adapted different method to provide
data of those schools to MOE by using the facilities at the zonal level.
• Absence of national household survey specific to education issues in between the
census years.
9. Assessment and recommendations:
• The quality and timeliness of the Annual School Survey, which is the main source of
education statistics in the country could be improved if it is made online and the school
teachers who fill-in the questionnaire were trained. The information from small schools
in remote areas could be collected by DCS field staff if necessary manpower and
incentives are provided.
• The DCS should consider the introduction of a regular education survey system to gather
and update education indicators obtained from the decennial population census.
• The recently developed online data portal 'NEMIS' in the Ministry of Education has to
be updated regularly on time.
• In addition to the International Standard Classification of Education (ISCED) framework
to produce internationally comparable education statistics and indicators,
internationally comparable statistics could also be considered (for example, the OECD
PISA for development).
Chapter 13: Environment Statistics

Sector reviews
70 | P a g e
1. Introduction: The United Nations Statistical Division (UNSD) publishes global environment
on ten indicator themes, namely Air and Climate, Biodiversity, Energy and Minerals, Forests,
Governance, Inland Water Resources, Land and Agriculture, Marine and Costal Areas, Natural
Disasters, and Waste. The Framework for the Development of Environment Statistics (FDES
2013) describes that the environment data comes from different sources, like
i. Statistical surveys (social, economic, industrial, etc.);
ii. Administrative records of government and non-government agencies responsible for
natural resources;
iii. Satellite imaging and mapping land cover, water bodies or forest cover;
iv. Monitoring systems for water quality, air pollution or climate; and
v. Scientific researches for environmental issues.
However, the environment statistics is still in an early stage of development in many countries,
including Sri Lanka and data are often scarce.
2. Responsible agencies for environmental statistics: The Ministry of Mahaweli Development
and Environment is the main government body in Sri Lanka responsible for the management
of the environment and natural resources of the country. There are a number of agencies
under the ministry working on the environment related area of each theme. The agencies are
Central Environment Authority, Forest Department, Geological Survey and Mines Bureau,
Marine Environment Protection Authority, National Gem and Jewellery Authority, State Timber
Cooperation, Costal Conservation and Coastal Resource Management Department, and
Central Engineering Consultancy Bureau.
The Meteorology Department generates weather and climate related data. Disaster
Management Centre (DMC) of the Ministry of Disaster Management collects data about losses
caused by natural and man-made disasters The DCS also produces environment related
statistics in some extends from its surveys and censuses.
3. Major data sources, periodicity and geographical disaggregation: The Statistics Unit of
Ministry of Mahaweli Development and Environment compiles environment related statistics
from more than 80 agencies of the government including different divisions of the ministry.
The statistical unit has identified and compiled a list of environmental related indicators and
statistics together with the potential data sources for each indicator, in line with FDES and SEEA
frameworks under the following categories:
(1) Environment condition and quality (physical condition, land cover, ecosystem and
biodiversity, environmental quality (air and water quality; soil pollution, noise pollution);
(2) Environmental resources and their use;
(3) Residuals and emission;
(4) Extreme events and disaster;
(5) Human settlements and environment health; and
(6) Environmental protection, management and engagement.
Some of the Environment Statistics are available on an annual basis at Province, District and
Divisional secretariat levels. However, the data requests for compilation from the statistics unit
Sector reviews
71 | P a g e
of the Ministry of Mahaweli are not readily made available from the agencies, leading to delays
in the publication of the report.
4. International standard and methodology: The UNSD has developed frameworks, concepts
and methods, and classifications for the production of environment statistics. The Framework
for the Development of Environment Statistics (FDES 2013), is a key framework for countries
for developing and organizing environmental and related socio-economic information. Further
it has supporting tools and manuals for compilation and dissemination of the environment
statistics. In Sri Lanka the guidelines and standards recommended under FDES framework 2013
is used to compile Environmental Statistics, and the standards and classifications
recommended under SEEA CF and SNA 2008 are used to compile Environmental Economic
Accounting
5. National policy and framework: A Central Environmental Authority (CEA) was established in
Sri Lanka under the provisions of the National Environmental Act No. 47 of 1980 - last amended
in 2000. The Act provides authorities to CEA to make provision for the protection, management
and enhancement of the environment, regulation, maintenance and control of the quality of
the environment and prevention, abatement and control of pollution. The Environmental Act
also authorizes power to CEA to undertake surveys and investigations of the causes, nature,
and the extent of pollution and to assist and co-operate with other persons and bodies carrying
out similar surveys or investigations.
National Policy Framework for marine pollution prevention was established under Marine
Pollution Prevention Act No 35 of 2008. This act provides Marine Environment Protection
Authority (MEPA) to make provisions for the prevention, reduction and control of marine
pollution in waters of Sri Lanka by five regulations formulated. MEPA is the responsible
organization to implement international conventions related to ship based pollution
prevention and compensation related conventions.
6. Data gaps and user's demands:
• There is a very high demand for Environmental Economic Accounts and other
environmental statistics from data users, such as international organizations, different
government and non-governmental agencies, academia and other data users.
• A complete set of data as per the recommendations of the Framework for the
Development of Environment Statistics (FDES 2013) is not available.
• Environmental issues related statistics on industry in not available.
7. Issues and challenges:
• There is a weak data sharing culture with other related agencies outside and within
the various agencies under the Ministry of Mahaweli development and Environment,
which creates delay and difficulties in data compilation.
• Many sectors of the environment lack enough data on environment related issues.
• The statistical unit in the Ministry of Mahaweli Development and Environment which
compile environment statistics suffers from lack of staff, skills and funding.

Sector reviews
72 | P a g e
• Data integration is somewhat difficult due to differences in concepts and definitions
on environment data produced by different but related agencies in NSS.
• The Agriculture and Environment Statistics Division of the DCS collects very limited
environmental related statistics. Likewise the Industrial and Construction Division of
the DCS lacks questions related to environmental degradation in its industrial census
and surveys.
• Agency wise administrative data on environment are not found easily in the web.
8. Assessment and recommendations:
• There are numerous agencies in NSS for producing environment related statistics in
Sri Lanka but they lack data sharing procedure which needs to improve.
• Many agencies under the Ministry of Mahaweli Development and Environment, which
are the main agencies in producing environmental statistics, are suffering from lack
of manpower, knowledge and support for producing and compilation of the
environment statistics. The government should ensure the required support for the
agencies.
• As in many NSOs of other countries, a separate unit should be established at the DCS
with sufficient staff to support the compilation of environment related statistics and
Green Accounts with the collaboration of the Statistical unit of the Ministry of
Mahaweli Development and Environment and other stake holders.
• Environmental impact assessment related questions should be included in upcoming
industrial and agriculture surveys and censuses from DCS.
• The United Nations concepts and methods of the environment, like FDES 2012, SEEA,
SNA 2008, etc. need to be followed by the agencies in Sri Lanka which are responsible
for producing and providing environment data.
Sector reviews
73 | P a g e
Chapter 14: Sustainable Development Goals
1. Assessment
Along with the 179 member countries of the United Nations, Sri Lanka has in September 2015
unanimously adopted the 2030 Agenda for Sustainable Development and the 17 Sustainable
Development Goals (SDGs). Since the endorsement of the 2030 Agenda for the Sustainable
Development, Sri Lanka has taken a number of initiatives to facilitate the implementation of
the SDGs. The main initiatives include: (1) the establishment of a dedicated ministry "The
Ministry of Sustainable Development, Wildlife and Regional Development" for sustainable
development as the focal point for coordinating and reporting of the SDGs, (2) the
establishment of a Parliamentary Select Committee for Sustainable Development to provide
political leadership for the implementation of the SDGs, (3) the enactment of the Sustainable
Development Act No. 19 of 2017 to provide the legal framework for implementing the SDGs,
and (4) establishing cluster committees for SDGs reporting.
The enforcement of the Sri Lanka Sustainable Development Act, No.19 of 2017, facilitates the
development and implementation of a national policy and strategy on sustainable
development and for the establishment of a Sustainable Development Council. Since the
restructure of the Ministry of Sustainable Development, Wildlife and Regional Development in
new government structure, the Sustainable Development Council has been functioning as a
primary agency responsible for the coordination and facilitation on the implementation of the
SDGs.
As per the provision of the Sustainable Development Act, No.19 of 2017, the Sustainable
Development Council has started preparing a "National policy and strategy for sustainable
development aligned with SDGs", that should be approved by parliament. The council has also
requested every ministry, department, provincial council and provincial ministry to identify and
select the goals and targets based on applicability and implementability and to prepare a
sustainable development strategy relevant to the scope of such agency. However, the council
is yet to identify relevant agencies for allocating particular targets and indicators to compile
and monitor.
The country has aligned long and medium term policy frameworks such as the Public
Investment Programme 2017-2020, Vision 2025 in line with the implementation of the SDGs.
It has further initiated the government actions to localize the SDGs into its plans at national,
provincial and local levels including awareness building and training of public officers.
Since the implementation of SDGs two notable actions were conducted to improve the
country's position on the implementation and achievements of the SDGs monitoring. These
include, (1) publication of the "Status of Sustainable Development Goals indicators in Sri Lanka:
2017", by DCS in May 2017, and (2) publication of the "Sri Lanka Voluntary National Review on
the Status of Implementing Sustainable Development Goals" under the leadership of the
Ministry of Sustainable Development, Wildlife and Regional Development in June, 2018.
Status of Sustainable Development Goals indicators in Sri Lanka, 2017: As a central agency in
NSS of Sri Lanka the DCS has published a report "Status of Sustainable Development Goals
indicators in Sri Lanka: 2017" in May 2017. The DCS has classified all the 244 indictors in 6

Sector reviews
74 | P a g e
categories according to the DCS Tier system. Where the UN definition is different from the DCS
definition both definitions are provided in the publication. According to the DCS classification,
(1) 46 indicators are already compiled by DCS through available censuses and surveys,
(2) 29 indicators can be complied by adding new modules in ongoing censuses and surveys,
(3 & 4) 131 indictors for which data are either available or are to be compiled by other
agencies in the NSS,
(5) 35 indicators corresponding to the global and regional level, (6) 3 indictors which are not
relevant to Sri Lanka.
The report presents the status of the baseline data including year, unit, value, source and
frequency of updating the 46 indicators compiled by the DCS. It concludes that data
disaggregation by various dimensions (age, sex, race, income, geographic location, etc.) as
mentioned in the UN guidelines is "critical because aggregate level data do not show
discrepancies at lower levels."
The DCS has also developed an SDG web portal in its website:
http://www.statistics.gov.lk/sdg/index.php/sdg/page/home , which shows the information
and status of the SDG indicators and the statistical activities carried out in Sri Lanka in
implementing the SDGs.
Sri Lanka Voluntary National Review on the Status of Implementing Sustainable Development
Goals (VNR report): The Ministry of Sustainable Development, Wildlife and Regional
Development has produced and published the VNR report in the High Level Political Forum
(HLPF) in July 2018. The VNR report reviews the SDG related policies and the initiatives taken
to facilitate SDG implementation by the relevant government institutions. It also shows the
"current status and trends, gaps and challenges, and the way forward for all the 17 SDGs."
According to the VNR report "Sri Lanka has made significant progress in several areas related
to SDGs, in particular education, health and poverty. However the SDGs 6, 7, 11, 12, and 15
bear a special significance to Sri Lanka given the rising environmental challenges faced by the
country."
The report also indicates the "challenges with regard to the implementation of SDGs,
particularly in the areas of financing, technology development, capacity building, trade and
investments, as well as systemic issues such as policy and institutional coherence, multi-
stakeholder partnerships, and data monitoring and accountability."
Annex 6 on page 112 lists SDG Indicators compiled by DCS and other Agencies in Sri Lanka
2. Recommendations
• Under the provision of the Sustainable Development Act, No.19 of 2017, the Sustainable
Development Council has the task of developing the "National policy and strategy on
sustainable development" in conformity with the Sustainable Development goals and
associated targets.

Sector reviews
75 | P a g e
• The Sustainable Development Council requires that every ministry, department,
provincial council, provincial ministry and department and local authority shall prepare
a Sustainable Development Strategy relevant to the scope of such ministry, department,
provincial council, provincial ministry and department and local authority in accordance
with the National Policy and Strategy on Sustainable Development.
• The Council role has been set out to develop a profile of agencies and relevant SDG
indicators, and assign proper agency as a focal point for monitoring related indicators.
• As identified by the DCS report "Status of Sustainable Development Goals indicators in
Sri Lanka, 2017" the other relevant agencies in NSS should act promptly to compile the
131 indicators.
• As indicated by the DCS report necessary provisions should be developed and required data
sources- census, survey, administrate records and new data sources should be explored to
provide disaggregate SDG indicators by various dimensions.
• As mentioned in the VNR report the challenges with regard to the implementation of SDGs,
particularly in the areas of technology development, capacity building, policy and
institutional coherence, multi-stakeholder partnerships, and data monitoring and
accountability should be addressed.
• The DCS should take the lead in preparing concepts, classifications and standard in defining
and compiling the SDG indicators.
• The council has to develop capacity building and training, especially for estimation of proxy
indicators for which data are not directly available.
• Since the data from government sectors are not in themselves enough to produce the
numerous SDG indicators, an engagement and collaboration with private sectors,
community organizations, experts, academia and other related stakeholders should be
enforced to produce more disaggregate data of different dimensions so as to ensure that
the full range of indicators are produced.

Sector reviews
76 | P a g e
Chapter 15: Gender Statistics
1. Assessment
Sri Lanka has a dedicated "Ministry of Women & Child Affairs and Dry Zone Development" to
formulate, implement, monitor, evaluate and co-ordinate policies and programmes required
for development and ensuring rights of women and children. Two separate agencies: National
Committee on Women and Women's Bureau of Sri Lanka, function under the ministry for
women's wellbeing and empowerment. However, the key functions of the ministry and the
two agencies are identifying, designing, implementing and evaluating programs suitable for
economic and social empowerment of Sri Lankan women. These agencies are mainly policy
making, implementing, coordinating bodies.
The ministry has implemented a Policy Framework and National Plan of Action to address
Sexual and Gender based Violence in Sri Lanka, 2016-2020. Also, the ministry has been
developing a "National Policy on Women, Sri Lanka" with the technical support of UN Women
and the United Nations Population Fund (UNFPA).
The Women's Bureau of Sri Lanka conducts programmes under the key areas of empowering
Women Headed Families economically and socially, preventing Gender-Based Violence and
creating equality. One of the programs in its annual action plan for 2018 is to build capacity
in research and study. A study on Domestic Violence and its correlation with the Economy has
been proposed for 2018.
The Ministry of Justice, Human rights & Legal Reforms chairs the National Anti-Human
Trafficking Task Force and leads government agency for the coordination of all initiatives
taken to address human trafficking in Sri Lanka and to eliminate all forms of violence against
women and girls. The ministry provides statistical records on cases each year.
The Department of Census and Statistics (DCS) has been functioning as a main source of
Gender statistics in Sri Lanka. A separate webpage has been developed in DCS website
(http://www.statistics.gov.lk/page.asp?page=Gender%20Statistics) to publish statistics and
indicators to portray the situation of women in major economic and social spheres. The main
sources of data for the gender statistics in DCS come from the various censuses and surveys
conducted by DCS. However, the DCS surveys do not cover all aspects of gender statistics.
Additional data on gender statistics are also collected from other government and semi-
government agencies and from various administrative records. The webpage publishes
gender statistics in seven major areas: Population, Education, Health and Nutrition, Violence
against Women, Contribution to Economy, Women Empowerment, and Special Concerns. The
data are disaggregated as per the scope and limitations of their sources.
The DCS has been also publishing special gender disaggregated report from 1995 for catering
specific needs of the users who needs a diverse gender statistics and indicators. The webpage
shows four such publications which are published in 1995, 1997, 2007 and 2014. The last two
publications in 2007 and 2014 were titled "The Sri Lankan Woman-Partner in Progress".
Sector reviews
77 | P a g e
The publication in 2014 “The Sri Lankan Woman – Partner in Progress" was prepared by the
Department of Census and Statistics upon a request received from the then Ministry of Child
Development and Women’s Affairs. This publication contains gender related data of their
fields from various agencies: Department of Census and Statistics, Central Bank of Sri Lanka,
Registrar General's Department, Ministry of Education, University Grants Commission,
Ministry of Youth Affairs and Skills Development. Department of Technical Education and
Training, Department of Health Services, Parliamentary Handbook, Ministry of Local
Government and Provincial Councils, Department of Police, Department of Prisons,
Department of Election, Board of Investment, and Bureau of Foreign Employment.
The DCS conducted Women Wellbeing Survey in 2019 with the technical support of UNFPA.
The survey is also taken as a good source of gender statistics.
2. Recommendations
There is positive user feedback on gender statistics in Sri Lanka, especially those published
in the DCS webpage. However, the DCS, the Ministry of Women and Child Affairs and
related agencies should direct more attention to produce required but as yet unmet data
for the targets and indicators in various dimensions of SDG 5: Achieve Gender Equality and
Empower all Women and Girls.
The gender database of the Ministry of Women and Child Affairs, and the two responsible
agencies: National Committee on Women and Women's Bureau of Sri Lanka are found
relatively weak. They should strengthen the database using administrative records and with
more surveys and research studies in their priorities areas.

Sector reviews
78 | P a g e
Chapter 16: Labour Statistics
1. Assessment
The Department of Census and Statistics (DCS), the Department of Labour, the Department of
Manpower and Employment, and the Central Bank are the main government agencies
responsible for the production and dissemination of labour statistics. However apart from DCS
the other three agencies are considered rather data users than data producers. The DCS mainly
uses Labour Force Survey (LFS) to collect data on labour statistics. The DCS has been using the
LFS on a quarterly basis, to measure the levels and trends of employment, unemployment and
labour force in Sri Lanka since 1990. The LFS follows the ILO statistical guidelines as embodied
in the ILO international definitions for measurement of employment and unemployment. It
uses Sri Lanka Standard Classification of Occupation - 2008 (SLSCO – 08) derived from ISCO-08,
and the Sri Lanka Standard Industry Classification Rev. 4 (SLSIC Rev.4) derived from the ISIC,
Rev.4 for Industry classification.
The LFS 2018 report which is based on an annual sample of 25,750 housing units, provides
national, provincial and district level estimates. The report shows the estimated
unemployment rate is 4.4% for Sri Lanka in 2018. Unlike the HIES, the time lag in publication
of the LFS outputs is only three months due to the introduction of Computer Assisted Data
Collection (CAPI) method using tablet computers from 2017.
The DCS has since 1999 conducted a Child Activity Survey (CAS) to capture all activities children
aged 5-17 years are engaged in and then to estimate the child labour situation in Sri Lanka. The
CAS 2016 with a sample of 25,000 housing units covers all 25 districts in the country.
The main function of the Department of Labour (DoL) is to enforce Labour Acts and Ordinances
enacted for the welfare and the betterment of the working community; settling industrial
disputes; and implement social security programmes for the workers of the of the Semi-
government and Private Sectors of the country. It uses surveys and administrative records
maintained by various divisions of the Department of Labour, other Government Ministries,
Departments and Organizations to collects and presents data relevant to labour statistics.
The DoL conducts an Annual Employment Survey to collect information from employers in
semi-government and private sector with at least one paid employee and who were
contributing to the Employees’ Provident Fund. This survey provides comprehensive
information on labour force characteristics, labour market situations and background
information on industry categories of establishments including the industries which were
registered under the Wages Board Ordinance. It follows ISIC, Rev 4 for the classification of the
establishments and ISCO-8 for the classification of occupation. The AES was designed as a
postal survey and therefore receives low rate of responses from the establishments. The
results are published by occupation and industry group for national and district level.
The DoL has since 2008 conducted a Survey on Hours Actually Worked & Average Earnings
twice a year, with the reference period of whole months March and September respectively.
The report is published annually. According to the survey report 2015, the main purpose of the
survey is to compare the average earnings and hours of work of employees covered by the
Wages Board Ordinance with information of Earnings, Hours of Work, and all the Occupations

Sector reviews
79 | P a g e
covered by 44 Wages Boards. Like AES the survey adopts a Postal Survey technique and suffers
for same low responses problem to collect the information from employers covered by the
Wages Board Ordinance in the Private Establishments. The survey depends on the sample of
establishments selected from the Annual Employment Survey respond list of the preceding
year.
The Survey on Hours Actually Worked & Average Earnings follows the ILO definitions for the
Hours of Work spent by persons in the performance of activities, and the production boundary
as defined by the United Nations System of National Accounts for defining the production of
goods and services. The survey results are available by industry division.
The Department of Manpower and Employment is established with a main objective of making
arrangements to provide employment opportunities in the private sector for the unemployed
youth in order to strengthen the economy of the country. Accordingly, it conducts quarterly
labour demand analysis designed to reveal all the vacancies available in private, semi-
government and government sectors. These are based on the data gathered by the Newspaper
Advertisement Survey in which vacancies advertised in “Silumina” and “Sunday Observer”, the
two highly circulated weekend newspapers together with those in the Sri Lanka Gazette are
included in the analyses. The labour demands are presented by occupation (ISCO) and industry
(ISIC) categories for national level.
Although the Central Bank is not a key agency for labour statistics, it also provides international
labour migration related information by type of migrant's occupation working abroad and the
public sector wage rate index by level of officers in public services. A more detail level
information on departures of foreign employment by country and occupational levels are
available through administrative records of the Sri Lanka Bureau of Foreign Employment.
However, the occupation coding of the data are not directly matched with the ISCO system.
The National Labour Migration Policy for Sri Lanka explains enumerating steps to be taken to
harness the benefits of international migration and accelerate development, e.g. taking
advantage of substantial migrant remittances received by the country and leveraging on the
skills of return migrants.
2. Recommendations
More disaggregation of Labour Force data by various socio-economic dimensions is requested
from Department of Labour. These requests should be considered by DCS against the
background of the likely accuracy of such more detailed breakdowns of estimate from a sample
survey.
Labour statistics for informal sector is lacking. A special module of informal sector in LFS or a
separate labour force survey for the informal sector could be undertaken.
There is a lack of data on domestic servants which is hindering government efforts to ensure
labour rights and legalize the sector. A special module on domestic servant could be considered
for inclusion in LFS or in HIES.

Sector reviews
80 | P a g e
An efficient procedure has to be developed to tackle the low response rate of postal based
surveys - Annual Employment Survey and the Survey on Hours of Actually Worked & Average
Earnings that are being conducted by the Department of Labour.
The coverage for the Labour Demand Survey by the Department of Manpower and Employment
would benefit if enlarged from two national newspapers review to include more national and
local newspaper for assessing vacancies announcements in private, semi-government and
government sectors.
The Department of Manpower and Employment should consider conducting a special survey for
assessing labour demands, labour skills and job matching in the private sector.
The administrative data accumulated in the Department of Labour and the Department of
Manpower and Employment should be made available for users in machine readable format
through their websites.

Sector reviews
81 | P a g e
Chapter 17: Poverty
1. Assessment
The DCS has been using the Household Income and Expenditure Survey (HIES) to calculate
poverty in Sri Lanka since 1990. The HIES is conducted once in every three years. According
to the last HIES 2016 the poverty rate in Sri Lanka is 4.1%. The DCS uses the consumption
approach to measure poverty and the poverty line is calculated based on Cost of Basic Needs
(CBN) approach. The official poverty line, Rs. 4,166 per month per person was established in
2004 and has been updated to allow for price changes using the Colombo Consumer Price
Indies (CCPI) over the survey periods from 2002 to 2016. The HIES has been also used to
calculate the inequality in income distribution which is measured by Gini coefficient in Sri
Lanka (0.39) for real per capita expenditure. The poverty and inequality measures are made
available for sector, province and district level.
The poverty measures are available only for the districts at the lowest level. But the DCS has
periodically used a Small Area Estimation (SAE) technique developed by Elbers, Lanjouw, and
Lanjouw (2003) with the support of the World Bank to estimate the poverty measures for
Divisional Secretariat (DS) level. The last poverty mapping was prepared in 2015 based on the
last available Census and Population and Housing 2012 and HIES 2012. The poverty maps
provide poverty headcount ratios estimated at the DS division level. The Department of
Samurdhi uses the poverty maps to identify the poorest DS divisions in the country and to
reform the Sumurdthi transfer program.
In addition to the consumption approach based poverty, the DCS has for the first time in 2018
used a multidimensional approach poverty measurement technique developed by Alkire and
Foster (2007) to estimate the poverty measures as official statistics in collaboration with the
Oxford Poverty & Human Development Initiative (OPHI). The Demographic Health Survey
2016 has been used to compile the Multidimensional poverty measures for national, sector
and district level.
The HIES which is the main source of data for poverty and other welfare measures has a one
year delay in publication of final results.
The Department of Samurdhi Development under Ministry of Social Empowerment has been
implementing Samurdhi (Prosperity) Programme since 1995 with the main objective of
reducing poverty in Sri Lanka. It attempts to improve the economic and social conditions of
the selected family through economic development projects coupled with a welfare package
identified on the basis of specific needs, skills, assets and other abilities of each family. The
Department of Samurdhi uses a family profile survey "Samurdhi beneficiary families and low
income family survey" to collect the socio-economic conditions of the families from the field
level. The family income, expenditure and asset ownership is used as a criterion for
determining poverty. However, the methodology of estimating poverty and selecting poor
family is different than the methodology used by DCS.

Sector reviews
82 | P a g e
2. Recommendations
The time lag for the production of final results from HIES could be speed up with the use of
CAPI technique in data collection. Adequate financial and manpower resources has to be
ensured for timely delivery of the survey outputs.
The DCS and the Samurdhi Department has been using different methods of poverty
estimation. The poverty estimates from the Samurdhi department is far higher than the
poverty figures from the DCS. Therefore, the DCS and the Samurdhi need a combined
program for data collection to standardize the poverty estimation method or to give an
explanation for the different statistics derived from the different methodologies.
The DCS poverty measures are available for district level for the survey year. An annual
poverty estimation procedure should if possible be developed which could provide the
poverty estimates at DS division levels. The annual poverty estimates at DS levels could be
of great help to the Samurdhi department for annual update of poor areas for its welfare
programs.
The UN agency in Sri Lanka informs us that the World Bank technical team recommended a
few years ago that for food consumption, the data collection mode be switched from a recall-
based to a diary-based method. These improvements are yet to be implemented.
The Sri Lanka’s poverty line, that was established almost two decades ago in 2002, is likely to
be outdated given recent fast changing household consumption behaviour. Best practice
dictates that this line is re-estimated every 10-15 years, to reflect updated consumption
patterns and ensure that the line captures a minimum decent living standard.
The Multidimensional poverty measures which was compiled for the first time in 2018 by
DCS using DHS survey has to be institutionalized in DCS with adequate skill development.
The use of HIES instead of DHS survey in the estimation of multidimensional poverty
measures ensures better sense of comparability of the MPI figures with the actual
consumption based poverty figures using the same HIES data for the same year.

Sector reviews
83 | P a g e
Chapter 18: Tourism Statistics
1. Assessment
Tourism is the one of the largest foreign currency earning industries in Sri Lanka. The 2019
Annual Statistical Report of Sri Lanka Tourism Development Authority indicates that it is the
third largest export earner in the economy, after remittances and textiles and garments. The
statistics shows about 2.1 million international tourists arrived in Sri Lanka in 2017 and the
country received USD 3.9 billion foreign exchange earnings (4.5% direct contribution to GDP)
from the tourism arrivals.
Under the Ministry of Tourism Development and Christian Affairs four separate institutions: Sri
Lanka Tourism Development Authority (SLTDA), Sri Lanka Tourism Promotion Bureau (SLTPB),
Sri Lanka Convention Bureau (SLCB), and Sri Lanka Institute for Tourism and Hotel Management
(SLITHM) function for the promotion and development of tourism in Sir Lanka. However, the
Sri Lanka Tourism Development Authority (SLTDA) is the main government authority tasked
with planning, development, regulation, and policy implementation of tourism and related
industries in Sri Lanka. It compiles administrative data from other related agencies like the
Department of Immigration and Emigration, Central Bank, Hotel's associations, Airlines offices,
etc, and also conducts its own surveys for different tourism related issues.
The Research and International Relations Division of the SLTDA is responsible for data
collection and conducting research and studies related to tourism. The Monthly Statistical
Bulletin and the Annual Statistical Report are the two main regular publications of the SLTDA
which presents the performance of Sri Lanka Tourism in terms of tourist arrivals, foreign
exchange earnings, creation of employment opportunities and hotel occupancy rates.
The SLTDA follows the UNWTO concepts, definitions, and classification for tourism statistics
(Technical manual no. 1) and its corresponding country classification for the grouping of hotels,
tourism and related activities.
Sri Lanka has prepared a Tourism Strategic Plan (TSP), 2017-2020 with the support of the World
Bank Group and the Australian High Commission, which recommends actions and
implementation mechanisms for the next four years, with a long-term view toward Tourism
Vision 2025 and achieving the United Nations sustainable development goals related to
tourism. The TSP defines "a framework and a transformation agenda intended to expand
tourism’s economic footprint to underused natural, cultural, geographic and human resources
in sri Lanka."
Understanding Visitors is one of the six transformational themes which is emphasized in
developing research programme and Visitor Segmentation Model (VSM) to profile source and
niche markets systematically as input to guide product development and marketing decisions.
Strengthening the research unit within the SLTDA, and achieving robust data collection and
analysis techniques coupled with effective communication of research findings to guide SLTDA
and the tourism industry is some of the main strategies proposed under the Understanding
Visitors transformational theme.
Sector reviews
84 | P a g e
In line with the implementation of the Understanding Visitors theme a number of surveys have
been planned by the SLTDA: Tourist inbound survey, Domestic tourist outbound survey,
Visitors satisfaction survey, Work force in tourism survey, and a Tourism Satellite Account to
estimate the overall value of tourism in the economy of the country.
The Department of Census and Statistics (DCS) is mainly considered as a user of tourism
statistics produced by SLTDA and other related agencies for including the tourism statistics in
its regular publications like Statistical Abstract and Statistical Pocket Book. However the DCS
conducted a Domestic Tourism Expenditure Survey in 2017.
2.Recommendations
The Sri Lanka Tourism Development Authority has been using the DCS Survey of Labour Demand
as a secondary source for identifying labour force in tourism sector. Some of the classifications
of tourism establishments as recommended by UNWTO are different from the SLSIC and that
needs to be standardized by the two agencies.
Compared to data on international tourism the data on domestic tourism, which is rapidly
growing in the country, is inadequate. It is recommended that consideration be given to the
conduct of a special survey or the development of a well-managed system for obtaining required
data on domestic tourism.
The delay in receiving information in SLTDA from tourism related agencies – hotels, airlines,
trekking and sightseeing companies could be sorted out with the implementation of a data
sharing protocol with the providers and use of online system for data sharing. The confidentiality
of sensitive data supplied by private companies has to be ensured in data sharing system. These
are issues (co-ordination and confidentiality) which should be considered by a National Statistical
Council
Use of tourist related big data generated in telecom companies, through hotel bookings, use of
credit cards in banks, etc. should be investigated and could enrich the tourism statistics of the
SLTDA.
An online system of data sharing from the Department of Immigration and Emigration could be
established for timely acquisition of the main source of in and out bound tourist statistics. Again
co-ordination with the requirements of those engaged in demographic statistics should be
considered by a National Statistics Council
The Tourism Satellite Account, which needs a number of additional surveys and tourism related
information, should be conducted in collaboration with DCS for a complete valuation of tourism
sector in the economy of the country.

Sector reviews
85 | P a g e
Chapter 19: Trade and Service Statistics
1. Assessment
The Sri Lanka Department of Customs, Central Bank and the Department of Census and
Statistics (DCS) are the main government agencies collecting and disseminating trade and
service statistics. The Department of Customs compiles data on international trade, while the
DCS conducts surveys for collecting data on internal trade and services. The Central Bank
compiles data on international trade and services through Balance of Payment account.
The department of Customs follows the HS code (Harmonized Commodity Description and
Coding System) developed by the World Customs Organization for the classification of
commodities, for customs tariffs and for the compilation of international trade statistics. The
Customs department takes support of ASYCUDA (the UNCTAD Automated System for Customs
Data) which is an integrated customs management system for international trade and
transport operations and recording of the export and import goods.
The Customs department generates real time data on imports of goods by value, country of
origin and under major group headings such as consumer goods, intermediate goods, and
investment goods. Likewise, data on the exports by value, country of destination and major
commodities such as tea, rubber, coconut products, garments, etc. are collected.
The Central Bank compiles and publishes data on trade of goods and services through Balance
of Payment (BOP) in the Current Account. Monthly data on earnings from tourism and workers
remittances are two key indictors in trade in services published by the Central Bank. The
Central Bank also publishes monthly and annual Trade indices for exports and imports by
exports (Industrial, Agricultural and Mineral exports) and imports (Consumer, Intermediate
and Investment goods) categories.
The DCS is a main data provider for trade and services conducted within the country. The
Economic Census which was conducted in 2013/14 provided comprehensive information on
the structure and functioning of a country’s economy, including information on trade and a
variety of other services activities carried out within Sri Lankan territory. The Economic census
conducted by the DCS is a milestone in the trade and Services statistics from which DCS
managed to prepare a frame for the services sector establishments. At the economic census
trade and services were covered through separate questionnaire.
The register of establishments obtained at the economic census 2013/14 serves as a sample
frame for the Annual Survey of Trade and Services that has been conducting by the DCS from
2016. The need for this sample frame to be constantly updated has been referred to elsewhere
in our Review as has the need for it to be augmented with administrative data from the Inland
Revenue Department and from the Registrar of Companies Department.
The Annual Survey of Trade and Services covers privately owned establishments within the
country and provides important indicators on the nature, structure and the performance of
the trade and other services activities undertaken by the private sector establishments.
However, the survey does not include the financial and insurance activities, construction

Sector reviews
86 | P a g e
services, and the trade with less than 4 persons engaged and the services establishments with
less than 5 persons engaged.
The Annual Survey of Trade and Services follows the Sri Lanka Standard Industry Classification
(SLSIC), the localized version of the ISIC, Rev. 4 for the classification of trade and service
establishments. It also uses the recommendation of System of National Accounts 2008 for the
valuation of outputs of the trade and service sectors. The last annual survey was conducted in
2017 and the key indicators of trade and services activities from the survey are made available
by the economic sectors for national level only.
As mentioned in the survey report, a low response rate is the main challenge of the annual
trade and services survey. The questionnaires are initially posted to the selected
establishments and only the default establishments are approached by the field officers of the
DCS. Despite the repeated enumeration efforts the annual survey 2017 mentioned that the
SLSIC divisions 51, 70 and 75 were excluded in data analysis due to low response rates.
The above assessment of Trade and Service Statistics should be read alongside our assessment
of national account statistics in Chapter 6.
2. Recommendations
The low response rate in the Annual Survey of Trade and Services has to be managed with
appropriate strategies. Provision of penalty for nonresponse in a new Statistical Ordinance is an
essential component in developing a regime in which response rates are dramatically improved.
Other simple alternatives like awareness and advocacy campaigns, engagement and support
from business associations are also essential ingredients in planning for increasing response
rates.
The attempt to cover the activities related to services sector through one questionnaire is
commendable approach for large enterprises but the low response rate makes it a cumbersome
exercise. The small and medium establishments can be covered by a simplified questionnaire
and measures to be taken to increase the response rate.
An attempt to introduce a quarterly survey measuring output in the Service sector has been
abandoned because of particularly low response rates. We recommend this be re-introduced
once a firm regime has been established to ensure high response rates as described above.
The results of the Annual Survey of Trade and Services are available for national level by
industrial classification. Further disaggregation of the information for district and DS divisions
increases the value of data in local level's planning and decision making of the sector but care is
essential in ensuring that - in publishing disaggregated data – confidentiality of individual
businesses is preserved. However given the low response rate for the annual survey it unlikely
that more disaggregated estimates would be of sufficient accuracy as to warrant publication.
Overall, the economic statistics for trade and services within the country is found weak
compared to international trade and manufacture industrial statistics. The DCS and related
agencies should pay more emphasis to uplift its status of data availability.
Sector reviews
87 | P a g e
Chapter 20: Money and Banking Sector Statistics
Assessment
The Central Bank of Sri Lanka (CBSL) is the apex body in the financial sector of the country. Two core objectives of the central bank are to maintain economic and price stability and to maintain financial stability. Monetary policy is the main tool to achieve price and financial stability. Each year the central bank formulates monetary policy based on financial and economic information to manage the supply and the cost of money in an economy. The bank itself was established in 1950 under the Monetary Law Act No. 58 of 1949 (MLA) as a semi-autonomous body.
The central bank is the custodian agency for the monetary and financial statistics. The compilation, dissemination and analysis of financial and economic data and statistics is one of the core functions of the central bank. It compiles data on real sector, monetary sector, financial sector, fiscal sector, external sector and provincial statistics. In addition, the bank also conducts economic, financial and business surveys to compile required information for economic and financial policies formulation as well as for research and analytical uses. The Statistical Department and the Economic Research Department are the two many divisions in the Central Bank responsible for the production, compilation and uses of data.
The central bank is a producer as well as user of financial and economic data produced in DCS, Customs, different ministries, international organizations and private financial sectors as well. Based on the data generated and compiled it publishes economic and financial Reports, periodicals, statistical tables of different sectors, and economic indicator with required standards and in timely manner.
Detailed list of statistics (https://www.cbsl.gov.lk/en/statistics/) and publications (https://www.cbsl.gov.lk/publications/) are available on the CBSL website: https://www.cbsl.gov.lk/en/. In addition, a well-structured Data Library for time series data of different sectors is also maintained at https://www.cbsl.lk/eresearch/.
The CBSL follows the International Monetary Fund’s data dissemination standards and is a subscriber of the Special Data Dissemination Standard (SDDS) and the Enhanced General Data Dissemination System (e-GDDS). The SDDS page of CBSL can be accessed at: http://erd.cbsl.gov.lk/presentation/htm/english/erd/sdds/rpt_sdds.aspx/.
A major publication of the CBSL is the Annual Report of the Monetary Board of the Central Bank. It provides statistics and information on the condition of the economy, analyses the economic and financial circumstances and reviews the policies and measures adopted by the bank during the financial year. The Balance of Payments Statistics (BOP) are an important output of the bank and these reflect the country’s economic transactions with the rest of the world. The bank follows BPM6 format from 2012 for the compilation of the BOP. The national income statistics are mainly derived from the National Accounts estimates of the DCS. The data are presented on the base year 2010 from 2010 onwards.
Recommendations
The CBSL has a well-established and efficient system of data compilation and management. The monetary and financial statistics are available to users in publications as well as in machine readable data format. However, the statistical publications and dissemination system in CBSL is mainly supply driven. No particular system has developed to engage with the users and to

Sector reviews
88 | P a g e
receive users’ feedback and data needs. A routine system of obtaining users’ feedback will enhance the value and use of the CBSL statistics.
The infographics and data visualization procedure that have been introduced in CBSL is found relatively week compared to its influx of economic and financial data, could be developed to attract more users and readers for easy understanding and extending the use of the data for policy making.
The time lag in compilation of the monetary and financial data from the market and from financial institutions, which are mainly needed for timely forecast of inflation and price indices, could be reduced with introduction of online reporting system from the related agencies.
The CBSL has reported that data on Government public capital formation, private investments, expenditure of outgoing Sri Lankan tourists and students are weak and needs special survey or mechanism to capture either by DCS or relevant agency.
The CBSL is a major user of National Accounts (NA) data produced by the DCS. But the CBSL has shown a serious concern on the delay in NA estimates, transparency of methodology of national accounts compilation, rebasing of NA series, coverage of new economic activities in NA, and in large differences in revision of the NA estimates. A good coordination with the DCS is an important step in ironing out these problems.

Sector reviews
89 | P a g e
Chapter 21: Fisheries Statistics3
Fisheries Statistics Collection and Reporting System in Sri Lanka
Background
Fisheries is an important sub-sector of the economy of Sri Lanka in terms of its contribution to the Gross Domestic Production (GDP), employment generation, foreign exchange earnings, etc. As per available information, the Fisheries sector currently contributes about 1.4 percent to the GDP of the country and provides livelihoods for more than one million population in coastal areas, rural and estate sectors. As a source of animal nutrition fish enjoys a good demand. Fisheries sector in the national economy is recognized as one of the vital sectors that could be developed with available resources by introducing modern technology with a minimum effort. Therefore, in sustainable development of fisheries, reliable statistics is prerequisite. In this content, establishing a well-developed centralized statistical system for fisheries sector has become a timely requirement.
Introduction
The fisheries of Sri Lanka can be broadly divided into three main categories – marine coastal fisheries, offshore & high seas fisheries and freshwater & aquaculture fisheries. Since there is no clear separation of the two fishing regimes coastal and offshore waters, for administrative purposes, all fisheries conducted within a day (24 hours) are considered as coastal fisheries. Offshore and high seas fisheries are conducted by boats that stay out at sea for more than one day which are commonly referred to as “multi-day” boats.
At present, Six institutions functioning under the Ministry of Fisheries and Aquatic Resources Development (MFARD) namely Department of Fisheries and Aquatics Resources (DFAR), National Aquaculture Development Authority (NAQDA), National Aquatic Resources Research and Development Agency (NARA), Ceylon Fishery Harbours Corporation (CFHC), Ceylon Fisheries Corporation (CFC) and Cey-Nor Foundation which engages in sector development and infrastructure development. Out of these six institutions, DFAR (implementing agency for marine fisheries), NAQDA (implementing agency for freshwater and aquaculture fishery) and NARA (research arm of the Ministry) are responsible for fishery data collection in their respective areas of responsibility. The Ministry of Fisheries and Aquatic Resources Development of Sri Lanka (MFARD) has responsibility for the dissemination of fisheries data in Sri Lanka through its Statistical Unit (SU). The services of a Statistician as well as Statistical Officers are made available to SU by the National Statistics Office of Sri Lanka (Dept. of Census and Statistics) since 1950’s.
Fisheries Statistics Collection System
The Statistics Unit (SU) of MFARD functions as the clearing house and the coordination point of the fisheries statistics in Sri Lanka. It receives fisheries data reports from various sources and also collects some limited data itself (fish markets surveys and specific surveys). The tasks of the SU include collection and compilation of data; computerization of these data using databases or other procedures when it is necessary; estimates of catch, effort and other information using the available data; and dissemination of information in response to national or international requirements.
3 Chapter 21 has been contributed to the Review Paper by Lashanthi Perera. Statistician, Ministry of Agriculture, Livestock Development, Irrigation and Fisheries & Aquatic Resources Development.
Sector reviews
90 | P a g e
Following data are among the main data items collected by the SU of MFARD
• Catch and effort data (DFAR, NARA, CFHC, NAQDA)
• Prices of fish, boats, gears, etc. (Statistics Unit, DFAR, DCS, HARTI)
• Import and Export (Sri Lanka Customs, DFAR)
• Fishermen, Fishing boats, etc. (DFAR, NAQDA)
• Infrastructure (CFHC, CFC, DFAR)
• Fisheries sector development programs (DFAR, NAQDA)
Catch and effort data
Catch data collection for estimation of fish production is the main component of data collection carried out by the four institutes (SU, DFAR, NARA and NAQDA) with a huge effort.
At present, national marine fish production is estimated based on the data collected by the DFAR fisheries officers for their respective Fisheries Inspector Divisions covering entire marine fisheries. There are 15 fisheries administrative districts covered by 149 fisheries officers. A monthly data sheet is used to submit such data to the SU. The basic information collected by Fisheries Inspectors (FIs) are catch by species/group, number of crafts operated within the month (effort), fish prices, etc.
A rapid improvement is being occurred in offshore and high seas fishery data collection system since 2012 as several data collection programs have been established targeting offshore and high seas catch and effort data collection. This is due to the mandatory requirement in reporting fisheries statistics to Indian Ocean Tuna Commission (IOTC).
• The Port Sampling Programme for large pelagic fisheries data collection which was initially put in place by NARA in 1987 was improved and updated in number of occasions with broader institutional participation over the past years. It was strengthen in 2013 for the last time as a collaborative task of MFARD, DFAR and NARA under the technical supporting of IOTC. The data collection program was strengthened by improving sampling strategy, increasing the coverage, improving data collection materials, data storage and reporting system. Information of catch and effort by gear, length by species are recorded through this port sampling programme. Under this port sampling program multiday boats and some coastal boats which targets the large pelagic fishery is sampled.
• The logbook data recording system is legally mandatory for multiday fishing vessels over 34 feet in length operating basically in catching large pelagic fish within EEZ and high seas by Fish Catch Data Collection Regulations, 2012. It has been mandated to submit log sheets after every fishing trip. They have to provide detail data on the spatial and temporal distribution of catch and effort by the fishing gear. This task is fully carried out by the DFAR and currently this system is being upgraded to e–log book system.
• Installing vessel monitoring devices for multiday boats over 34 feet operated in high seas was commenced in 2013 as VMS is mandatory for high seas fishing vessels. All high seas operating boats are equipped with VMS since 2016. It produces cruise track report of the vessel. This system has established in the DFAR.

Sector reviews
91 | P a g e
As the coastal regime is not fully covered by the above data collection programs A new sampling strategy is under development by Sri Lanka-Norway Bilateral Project to ensure representative and reliable statistics for all fisheries, including coastal fisheries. A baseline survey has been carried out and development of sampling strategy is in progress. The database and relevant applications are being developed in cooperation with DFAR and the project team. This will enable electronic registration of fisheries data at the landing sites.
National freshwater fisheries and aquaculture production are estimated collaboratively by NAQDA and MFARD based on the log book data of the reservoirs and other data reported by extension officers of NAQDA for their respective areas.
Fleet data
The Vessels Registry of DFAR contains information on all fishing vessels under this category, including vessel identification, dimensions and other vessel attributes and vessel licensing and infractions history. The record of fishing vessels is maintained by DFAR registration and licensing of vessels. Data is stored in an MS-SQL Server 2005 database, which is accessed using a Microsoft Access interface.
Fish imports and exports data
Export and import data on fish and fishery products; including records of HS codes and descriptions, destination countries, quantity and values are collected in monthly basis from the Sri Lanka Custom. Based on these data the SU of MFARD produces monthly import and export of fish and fishery products.
Fish and dried fish prices
Market data, including data on the prices of fresh fish and dried fish are collected in weekly basis by statistics unit of MFARD and process using the spread sheets.
Other fishery related data
• Market survey on canned fish is conducted by SU itself.
• Ice plant survey is conducted once two years by the SU. The ice plants information is collected through fisheries officers of DFAR and extension officers of NAQDA.
• For the purpose of reporting statistics to FAO, SU collects fishermen data for both marine and inland fisheries sector through the fisheries officers of DFAR and extension officers of NAQDA.
Issues and constrains
• It is noted that isolating valuable data gathered with a huge effort within the institutions and expire without optimum use. This is due to non-availability of data for timely use or non-access for other individuals to use the data. Due to this reason, it was experienced that the duplication of data collection programs conducted by the institutions under the Ministry and it caused misusing of funds born by the Government or any other Non-Governmental Organizations. This practice also causes discrepancies between national published data and the data issued for other data requirements as well.
• No proper systems have been established and guidelines have been developed within the institutions for conserving data and non-availability of historical data collected by

Sector reviews
92 | P a g e
the past data collection programs in any institute is an interruption for important analysis for future benefit of the sector. Non-availability of Meta data is also noted as a disadvantage.
• Most of the data collection programs are individually developed and conducted by the institutions functioning under this Ministry. Some are for their internal purposes. In most of the cases standards, guidelines and procedures are lacking for the implementation of the data collection programs specially the sampling surveys (technical aspects are not fully considered at developing questionnaires, sample selection, etc. Some have coverage issues; no instruction manuals and code lists are developed; not considered the guidelines, not training the data collectors and other relevant staff properly.)
• The first ever Census of Fisheries was conducted 47 years back, in year 1972 by the Ministry of Fisheries and Department of Census and Statistics jointly with the technical and financial support of FAO. There after no such a statistical exercise had been undertaken for the fisheries sector even though the structure of fisheries industry in Sri Lanka has been frequent changed due to the effects caused by Tsunami 2004 which was severely affected to the fisheries sector in Sri Lanka, the ethnic conflict which has affected to the fishing community in North and East for over three decades, Development activities undertaken by the Government and Non–Governmental agencies after the Tsunami and ethnic conflicts, rapid development in fishing technology, converting of traditional near shore fishing operations to multiday fishing operations, improvement in post-harvest technologies, vast change in irrigation channel with the Mahaweli development project, development in freshwater fisheries and speedy expansion in aquaculture. It is a practice of conducting Censuses of population and Housing, Agriculture and Livestock, Trade, industry and manufacturing at 10 yearly intervals and this vital sector to the national economy has been continuously neglected.
• Lack of funds to establish and strengthen the systems identified to avoid the existing issues and gaps (specially mentioned under above 2 and 4).
Suggestions/Recomendations
• Development of Central Database Management System (CDMS) within the Statistics Unit of the Ministry of Fisheries and Aquatic Resources Development for consolidation of all existing fisheries and fishery related database systems in Sri Lanka into a Centralized System to avoid the existing gaps in fisheries data while strengthening the MFARD successful long-term data management and reporting system which also support to the National Statistical System. (Proposal is being developed)
• Development of national data policy for fisheries which support to avoid duplication of data collection programs among or within the institutions under the Ministry, encouraging sharing and using data on the basis of the open data principles and to be transparent on the reasonable explanations if there is restricted access to certain data, support the Ministry for implementation of CDMS within the Ministry to enable to effective use avoiding discrepancies in data, comprehensive analyses, timely dissemination, etc. (ongoing)
Sector reviews
93 | P a g e
• Conducting a census for entire fisheries sector (Marine fisheries, freshwater fisheries & Aquaculture and fishery related economic activities) to produce of accurate, reliable, and timely data which is vital in effective decision - making and successful development planning. (Several proposals have been submitted to the National Planning Department during past few years and they have recommended obtaining funds within the Fisheries Ministry budget. Due to lack of Government funds and no sources for funding not implemented)
• Amend the Statistics and Census Acts
o Enabling to transfer the technical advisory of DCS for all data collection programs which are conducted by various institutes under Government funds
o Considering to include mandatory power of conducting the fisheries census under Department of Census and Statistics with parallel to agriculture census

Annex 1a: Statistical Ordinance
94 | P a g e
ANNEX 1a: Statistical Ordinance

Annex 1a: Statistical Ordinance
95 | P a g e

Annex 1a: Statistical Ordinance
96 | P a g e

Annex 1a: Statistical Ordinance
97 | P a g e

Annex 1a: Statistical Ordinance
98 | P a g e

Annex 1b: Census Ordinance
99 | P a g e
ANNEX 1b: Census Ordinance

Annex 1b: Census Ordinance
100 | P a g e
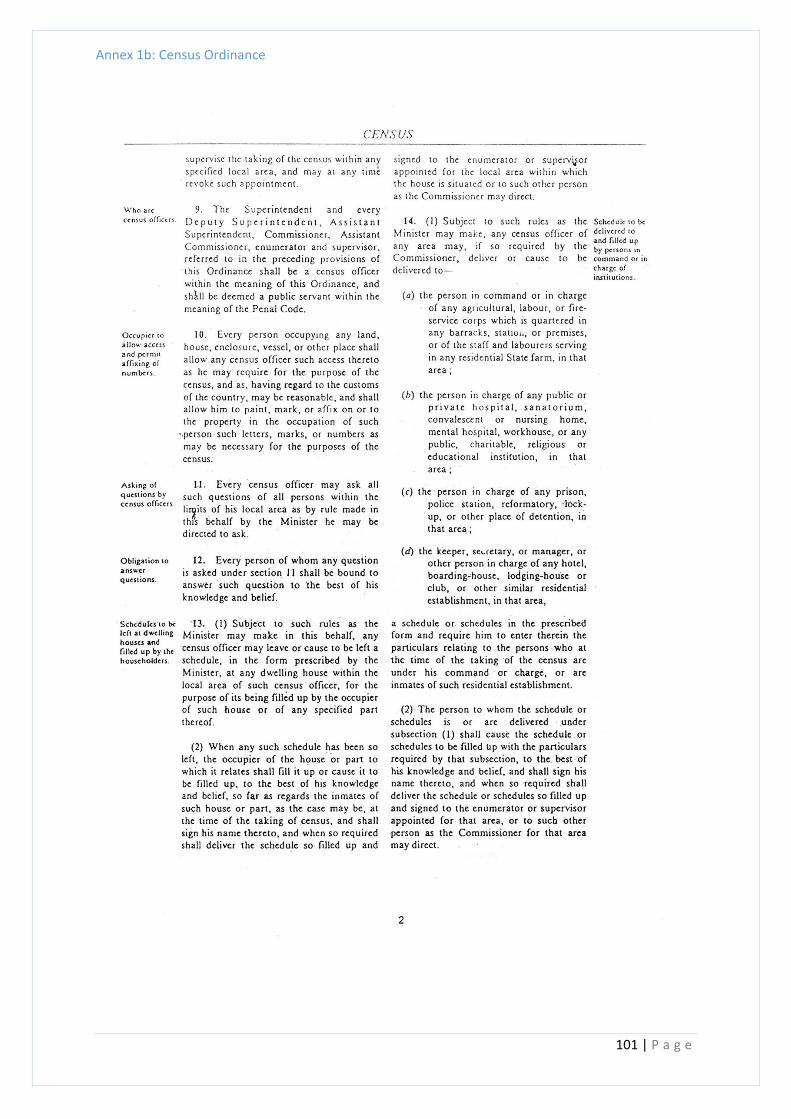
Annex 1b: Census Ordinance
101 | P a g e
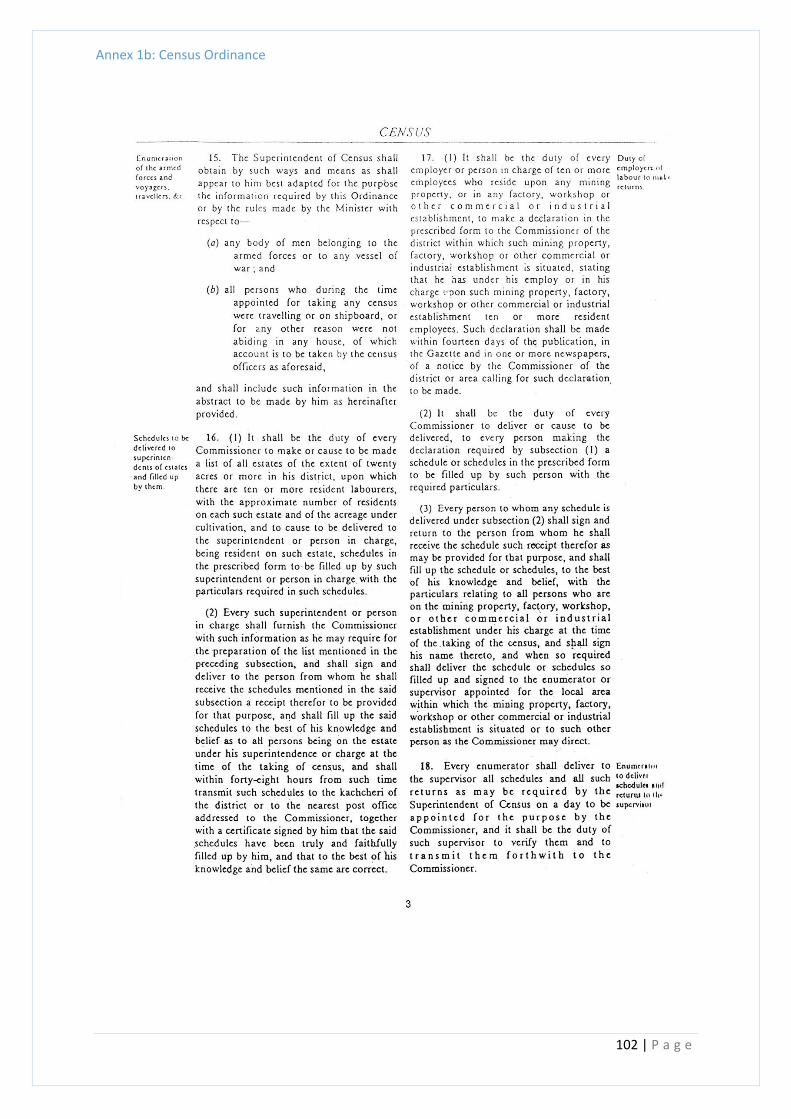
Annex 1b: Census Ordinance
102 | P a g e

Annex 1b: Census Ordinance
103 | P a g e

UN Fundamental Principles of Official Statistics
104 | P a g e
Annex 2: UN Fundamental Principles of Official Statistics
In 1992, the United Nations Economic Commission for Europe (UNECE) adopted the
fundamental principles of official statistics in the UNECE region. The United Nations Statistical
Commission adopted these principles in 1994 at the global level. The Economic and Social
Council (ECOSOC) endorsed the Fundamental Principles of Official Statistics in 2013; and in
January 2014, they were adopted by General Assembly. This recognition at the highest political
level underlines that official statistics - reliable and objective information - is crucial for decision
making.
1. Relevance, impartiality and equal access
Official statistics provide an indispensable element in the information system of a democratic
society, serving the government, the economy and the public with data about the economic,
demographic, social and environmental situation. To this end, official statistics that meet the
test of practical utility are to be compiled and made available on an impartial basis by official
statistical agencies to honour citizens' entitlement to public information.
2. Professional standards and ethics
To retain trust in official statistics, the statistical agencies need to decide according to strictly
professional considerations, including scientific principles and professional ethics, on the
methods and procedures for the collection, processing, storage and presentation of statistical
data.
3. Accountability and transparency
To facilitate a correct interpretation of the data, the statistical agencies are to present
information according to scientific standards on the sources, methods and procedures of the
statistics.
4. Prevention of misuse
The statistical agencies are entitled to comment on erroneous interpretation and misuse of
statistics.
5. Sources of official statistics
Data for statistical purposes may be drawn from all types of sources, be they statistical surveys
or administrative records. Statistical agencies are to choose the source with regard to quality,
timeliness, costs and the burden on respondents.
6. Confidentiality
Individual data collected by statistical agencies for statistical compilation, whether they refer to
natural or legal persons, are to be strictly confidential and used exclusively for statistical
purposes.
7. Legislation

UN Fundamental Principles of Official Statistics
105 | P a g e
The laws, regulations and measures under which the statistical systems operate are to be made
public.
8. National coordination
Coordination among statistical agencies within countries is essential to achieve consistency and
efficiency in the statistical system.
9. Use of international standards
The use by statistical agencies in each country of international concepts, classifications and
methods promotes the consistency and efficiency of statistical systems at all official levels.
10. International cooperation
Bilateral and multilateral cooperation in statistics contributes to the improvement of systems of
official statistics in all countries.

Summary of Surveys conducted by DCS
106 | P a g e
Annex 3a: Summary of surveys conducted by DCS
with apologies for small print size…….

Summary of Sector Statistics
107 | P a g e
Annex 3b: A summary of Sector Statistics
Assessment of Sector Statistics, Sri Lanka I. Agriculture statistics
S.N. Activity Agency Geographic disaggregation
Frequency of conduct
Additional information
1 Production of Paddy, other seasonal and permanent crops, livestock and cost of production
Department of Census and Statistics (DCS)
National, subnational (District)
Annual, seasonal (Yala, Maha)
2 Census of Agriculture DCS National, subnational (District)
In every 20 year Last one in 2002
3 Food Balance Sheet DCS National Annual
4 Extent, Production and Cost of Production (COP) of Tea, Rubber and Coconut
Sri Lanka Tea Board, Rubber Development Department, Coconut Development Authority
National Annual
5 Fisheries and aquaculture production Ministry of Fisheries and Aquatic Resources
National Annual
6 Production forecasts of major crops and vegetables Department of Agriculture National Seasonal (Yala, Maha)

Summary of Sector Statistics
108 | P a g e
2a. Population and Demographic Statistics
S.N. Activity Agency Geographic disaggregation
Frequency Additional information
1 Census of Population and Housing (CPH) Department of Census and Statistics (DCS)
National, Provincial, Districts
Every 10 years Last CPH in 2012
* Population characteristics
> Size and age-sex composition, Dependency population, Marital status, Ethnicity and religion, Literacy and education, Labour force, Occupation and industry, Migration, Fertility
* Housing characteristics
> Number and type of housing units, Construction
materials and quality of housing units, Household amenities and facilities
* Characteristics of the disabled persons
2 Population Atlas of Sri Lanka Department of Census and Statistics (DCS)
National, Provincial, Districts
Every 10 years
3 Population projection DCS After the CPH
2b. Civil registration and vital statistics
S.N. Activity Agency Geographic disaggregation
Frequency of conduct
Additional information
1 Registration of vital statistics Registrar General's Department National, Provincial, Districts
Annual
* Marriages, Births, Deaths, Infant Deaths, Cause of Deaths
* Estimation of mid-year population
* Life expectancy, Fertility

Summary of Sector Statistics
109 | P a g e
2 Enumeration of vital events in Northern province in 2011
DCS Northern Province, District
Once in 2011
3a. Industrial Statistics
S.N. Activity Agency Geographic disaggregation
Frequency of conduct
Additional information
1 Annual survey of industries (ASI) Department of Census and Statistics (DCS)
National, Provincial, District
Annual
* Economic activities categorized under the four industrial divisions, namely mining and quarrying, manufacturing, electricity, gas, steam and air conditioning supply and water supply, sewerage, waste management and remediation activities
* Private sector establishments with 5 or more persons engaged
2 Index of Industrial Production (IIP) Department of Census and Statistics (DCS)
National, Annual. Quartely
3 Industrial Production, Construction and Energy in state owned industrial establishements
Board of Investment of Sri Lanka
National, Provincial, District
Annual
3b. Economic Census
S.N. Activity Agency Geographic disaggregation
Frequency of conduct
Additional information
1 Distribution of establishments and person engaged by economic sector (Industries, Constructions and Trade & services)
Department of Census and Statistics (DCS)
National, Provincial, District
First time in 2014

Summary of Sector Statistics
110 | P a g e
4a. Health statistics
S.N. Activity Agency Geographic disaggregation
Frequency of conduct
Frequency of conduct
1 Demographic Health Survey DCS National, provincial
Every 5 years Last one in 2016
* information on Fertility, Family Planning, Maternal and Child Health, Nutrition and awareness of HIV/AIDS.
2 National Survey on Self-reported Health in Sri Lanka DCS National, Provincial, District
First time in 2014
* Self reported information on on chronic illnesses, acute illnesses and some other health related issues at household level.
3 Annual Health Statistics Ministry of Health, Nutrition and Indigenous Medicine
National, Provincial, District
Annual
* Morbidity, Mortality, Resource availability and Provision of services of government health sector.
4 Annual Health Bulletin Ministry of Health, Nutrition and Indigenous Medicine
National, Provincial, District
Annual
5 Indoor Morbidity and Mortality Report Ministry of Health, Nutrition and Indigenous Medicine
National Annual
6 Distribution of Government hospitals and health services
Ministry of Health, Nutrition and Indigenous Medicine
National, Provincial, District
Annual

Summary of Sector Statistics
111 | P a g e
4b. Disability statistics
S.N. Activity Agency Geographic disaggregation
Frequency of conduct
Frequency of conduct
1 Distribution and Characteristics of the disabled persons in Sri Lanka
DCS National, Provincial, District
In every 10 year
Data source: Population and Housing Census
5. Education statistics
S.N. Activity Agency Geographic disaggregation
Frequency of conduct
Additional information
1 School Census Ministry of Education National, subnational (District)
Annual Last School Census 2017
* Information on schools, teachers, pupils, physical resources
Ministry of Education National, subnational (District)
Annual
2 Census of Population and Housing Department of Census and Statistics (DCS)
National, subnational (District)
Decennial Last CPH 2012
* Information on the literacy level, educational achievements and the school attendance of every member of the population
DCS National, subnational (District)
Decennial
3 Undergraduate Admissions by University and Higher Educational Institutes
University Grants Commission National Annual
4 Number of Passed Out Graduates by University and Higher Educational Institute
University Grants Commission National Annual

Summary of Sector Statistics
112 | P a g e
6. Environment statistics
S.N. Activity Agency Geographic disaggregation
Frequency of conduct
Additional information
1 Meteorological observation Department of Meteorology Observation station
Yearly, monthly
* Temperature, humidity, rainfall
2 Air pollution Central Environmental Authority
Major cities Annual
3 Noise pollution Central Environmental Authority
Major cities Annual
4 Water pollution Central Environmental Authority
Major river Annual
5 Land area by geography Survey Department
Province, district, divisional secretariat divison
Survey year
6 Land Use Pattern within Agricultural Holdings Land Use Policy Planning Department
Province, district Agriculture census year
7 Forestry Department of Forests National, province, district
Yearly
* Area and type of forest
* Area of wild life reserves
8 Sea bathing site water quality Marine Environment Protection Authority
Selected bathing sites
Annual
9 Average marine acidity (ph) Marine Environment Protection Authority
Selected sampling stations around Sri Lanka
Annual

Summary of Sector Statistics
113 | P a g e
7. Poverty and income distribution
S.N. Activity Agency Geographic disaggregation
Frequency of conduct
Additional information
1 Household Income and Expenditure Survey (HIES) DCS National In every 3 year
Every 3 year after 2009. Earlier in every 5 year.
2 Measures of poverty DCS National, provincial, District
In every 3 year based on HIES
3 Gini coefficient of household income and expenditure
DCS National, provincial, District
In every 3 year based on HIES
4 Estimation and updating of national poverty line DCS National, District In every 3 year based on HIES
5 Small area estimation of poverty DCS & World Bank National, Sector, District, DS level
2015 based on HIES 2012 & CPH 2012
6 Global multi-dimension poverty for Sri Lanka DCS & Oxford Poverty and Human Development Initiative (OPHI)
National, Sector, District
2018 based on DHS 2016
7 Diriya Saviya Loan Programme Issued List
Department of Samurthi District, DS level Annual
8 Performance report
Department of Divineguma Development
National Annual
8. Labour statistics
S.N. Activity Agency Geographic disaggregation
Frequency of conduct
Additional information
1 Labour Force Survey (LFS) DCS National Quarterly
* Annual
* Quarterly
2 Levels and trends of employment, unemployment and labour force
DCS National, provincial, District
Annual, Quarterly
Based on LFS

Summary of Sector Statistics
114 | P a g e
3 Annual Employment Survey Department of Labour National Annual
*Distribution of Employees by Nature of Economic Activities and Sex
4 Minimum Wage Rate Index by sector Department of Labour National Annual
5 Average Earnings and Hours of Work by Wages Boards
Department of Labour National Annual
6 Census of Public and Semi - Government Sector Employment
DCS National Annual In every 4 or 5 year
* Distribution of Public Employees by Sector and Year
9. Tourism statistics
S.N. Activity Agency Geographic disaggregation
Frequency of conduct
Additional information
1 Tourism statistics Sri Lanka Tourism Development Authority
National Annual
* Tourist arrivals by county of residence
* Tourist arrivals and purpose of visits
* Tourist arrivals and tourist receipts
* Number of establishments involved in tourism by category
10. Gender statistics
S.N. Activity Agency Geographic disaggregation
Frequency of conduct
Additional information
1 The Sri Lankan Women DCS National, Provincial
1995, 1997, 2007, 2014
* Population DCS CPH
* Education DCS CPH, LFS, HIES, DHS

Summary of Sector Statistics
115 | P a g e
DOE, Ministry of Education School Census
University Grants Commission University Statistics
Ministry of Youth Affairs and Skills Development
Ministry of Sports
National Sports Festival Report
* Health Department of Health Services
National STD/AIDS Control Programme
DCS DHS
Registrar General's Department Vital events
* Public Life DCS Census of Public Sector Employment
Parliament Office Parliamentary Hand Book
Ministry of Local Government and Provincial Council
Ministry of Public Administration and Home Affairs
Attorney General Department
* Special Concerns DCS LFS
Board of Investment

Summary of Sector Statistics
116 | P a g e
Bureau of Foreign Employment
Department of Police
Department of Prison
2 Labour Force Participation Rate, Employment Rate and Unemployment Rate by Gender
DCS National, Provincial
Annual Based on LFS
11. Trade and Services Statistics
S.N. Activity Agency Geographic disaggregation
Frequency of conduct
Additional information
1 Annual Survey of Trade and Services DCS National Annual
2 Economic Census DCS National, Provincial, District
Last EC in 2013/14
3 Imports Department of Customs
Total imports by value, country of origin and major
groups such as Consumer Goods, Intermediate
Goods and Investment Goods. National Monthly, Annual
4 Exports Department of Customs
Total exports by value, country of destination and
major commodities such as Tea, Rubber, Coconut
products, Garments, etc.
5 Balance of Payment
Central Bank National Monthly, Quaterly
6 Trade in Services Central Bank National Annual
Earning from Tourism
Workers remittances
7 Trade indices Central Bank National Monthly, Annual
12. Other Socal Statistics 12a. Labour migration statistics

Summary of Sector Statistics
117 | P a g e
S.N. Activity Agency Geographic disaggregation
Frequency of conduct
Additional information
1 Distribution of International Labour Migration by sex, destination countries and occupation
Sri Lanka Bureau of Foreign Employment
National Annual
2 Worker's remittances by destination country Central Bank Annual
12b. Natural disaster and casualty statistics
S.N. Activity Agency Geographic disaggregation
Frequency of conduct
Frequency of conduct
1 Disaster incidents and damages Disaster Management Centre, National, Provincial, District
Annual
* Desinventar Database (www.desinventar.lk) The National Council for Disaster Management (NCDM)
12c. Crime statistics
S.N. Activity Agency Geographic disaggregation
Frequency of conduct
Frequency of conduct
1 Strength of Police force Department of Police National, Yearly
2 Number and type of crime Department of Police National, Yearly 3 Prisoners and type of offences Department of Prisoners National, Yearly
12d. Social security statistics
S.N. Activity Agency Geographic disaggregation
Frequency of conduct
Frequency of conduct
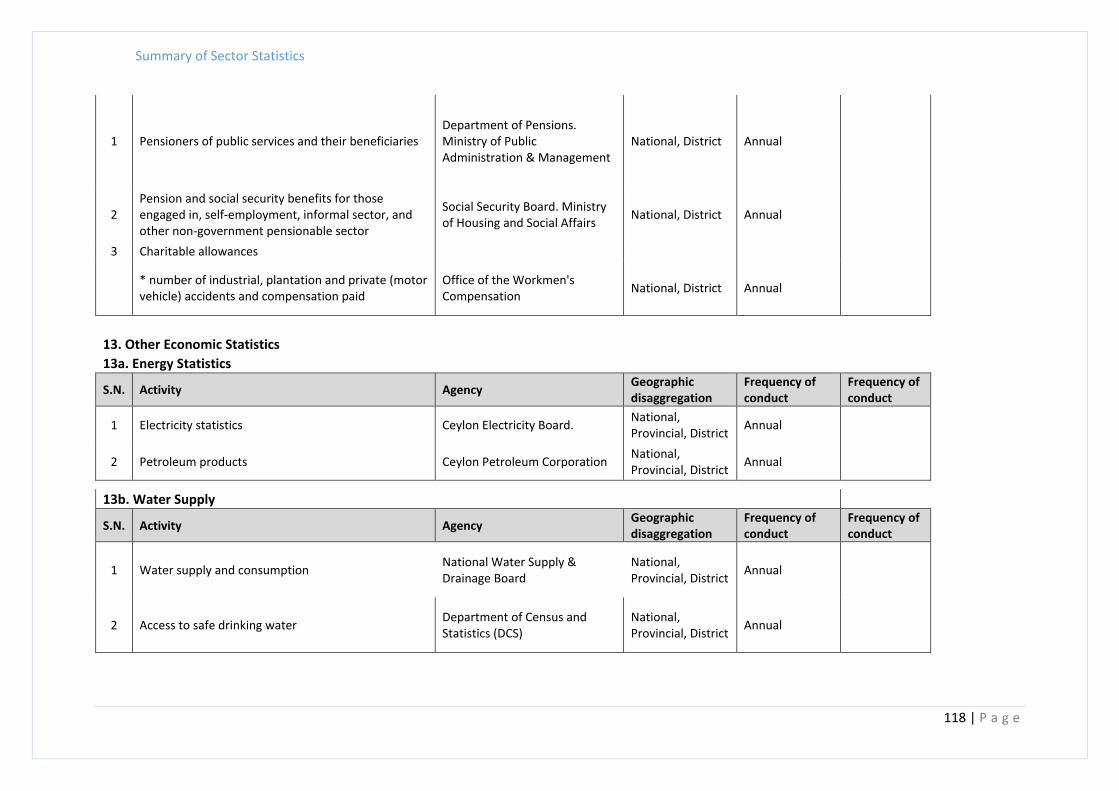
Summary of Sector Statistics
118 | P a g e
1 Pensioners of public services and their beneficiaries Department of Pensions. Ministry of Public Administration & Management
National, District Annual
2 Pension and social security benefits for those engaged in, self-employment, informal sector, and other non-government pensionable sector
Social Security Board. Ministry of Housing and Social Affairs
National, District Annual
3 Charitable allowances
* number of industrial, plantation and private (motor vehicle) accidents and compensation paid
Office of the Workmen's Compensation
National, District Annual
13. Other Economic Statistics
13a. Energy Statistics
S.N. Activity Agency Geographic disaggregation
Frequency of conduct
Frequency of conduct
1 Electricity statistics Ceylon Electricity Board. National, Provincial, District
Annual
2 Petroleum products Ceylon Petroleum Corporation National, Provincial, District
Annual
13b. Water Supply
S.N. Activity Agency Geographic disaggregation
Frequency of conduct
Frequency of conduct
1 Water supply and consumption National Water Supply & Drainage Board
National, Provincial, District
Annual
2 Access to safe drinking water Department of Census and Statistics (DCS)
National, Provincial, District
Annual

Summary of Sector Statistics
119 | P a g e
13c. Transport statistics
S.N. Activity Agency Geographic disaggregation
Frequency of conduct
Frequency of conduct
1 Road transport Department of Motor Traffic National Annual
Sri Lanka Transport Board
National Transport Commission
2 Railway transport Department of railway National Annual
3 Sea transport Sri Lanka Ports Authority National Annual
4 Air transport Civil Aviation Authority National Annual
13d. Communication statistics
S.N. Activity Agency Geographic disaggregation
Frequency of conduct
Frequency of conduct
1 Telecommunication services Telecommunications Regulatory Commission of Sri Lanka
National Annual
2 Postal services Department of Posts National Annual
3 Newspaper circulation Department National Archives National Annual

Annex 4a and 4b: List of institutions visited by members of the review team in June/July 2019 or attending the consultation workshops on October 2019
120 | P a g e
Annex 4.a: Institutions visited by the review team
In addition to meeting staff members of the Department of Census and Statistics we met
Institute/Organisation Officer Designation
UN Resident Coordinator Office Ms Hanaa Singer Office of the Resident Coordinator
Mr Lohitha Karunasekara Data Management and Result Monitoring and Reporting Specialist
United Nations Population Fund (UNFPA)
Ms Ritsu Nacken Representative
International Organization for Migration
Mr Sarat Dash Chief of Mission
Statistics Branch - Ministry of Education
Mr Mr. G.T.K.S. Perera Senior Statistician
Construction Industry Development Authority(CIDA)
Mr S. Amarasekara Director(Development)
Department of Samurdhi Development
Mr Mahesh Perera Deputy Director-Planning
Ministry of Women and Child Affairs and Dry Zone Development
Mr J.P.S. Jayasinghe Director-Planning
Sri Lanka Sustainable Energy Authority
Mr Harsha Wickramasinghe Deputy Director General
Ministry of Health, Nutrition and Indigenous Medicine
Dr Sunil De Alwis Additional Secretary (Medical Services)
National Planning Department Mr Sanjaya Mudalige Director General
Sustainable Development Council of Sri Lanka
Mr Pradeep Saputhanthri Director
Dr Sugath Yalegama Director General
Central Bank of Sri Lanka Dr Chandranath Amarasekara Additional Director-Research Department Mr Rohana Wijesekara Director-Statistics
Department of Inland Revenue Mr Priyantha
Sri Lanka Tourism Development Authority
Mr Anura
Ms Dinushki
Ministry of Labour and Trade Union Relations
Mr U.H.C. Priyantha Additional Secretary-Administration
Internal and Home Affairs section of the Ministry of Internal and Home Affairs and Provincial Councils and Local Government
Mr K.G. Darmathilaka Additional Secretary-Administration
Sri Lanka Police-Research and Development Division
Mr S.W.M. Senarathna Director-Research and Development, Senior Superintendent of Police
Department of Registrar of Companies
Mr L.K.S. Darmakeerthi Company Registrar (Cover of Duties)
Registrar General's Department Ms Bandara Acting Deputy Director General
Department of Immigration and Emigration
Mr M.L.Dashitha Niroshana Controller-Visa and Border Control
Ministry of Agriculture Ms Kasundari Dissanayake Assistant Director-Agriculture and Agrarian Insurance Board

Annex 4a and 4b: List of institutions visited by members of the review team in June/July 2019 or attending the consultation workshops on October 2019
121 | P a g e
Ministry of Economic Reforms and Public Distribution
Ms Chandanie Wijewardhana Secretary, Ministry of Economic Reforms and Public Distribution
Institute of Policy Studies of Sri Lanka
Dr Nisha Arunathilaka Director of Research
LIRNE Asia Mr Sriganesh Lakanthan Head od Big Data Unit
JB Securities Mr Murthasa Jaffergyee Chief Executive Officer
Ministry of Mahaweli Development and Environment
Mr Mahinda Gunarathna Director-Planning
Mr Sujeewa Fernando Assistant Director Mr D.T.A.Hewapathirana Development Officer Mr I.A.S.Ranaweera Assistant Director Ms Nilmini Ranasinghe Assistant Director(Biodiversity) Mr S.U.A.Weerasinghe Assistant Secretary(Admin) Mr P.A.Shyamali Priyadarshani Development Officer
Climate Change Secretariat Ms Dakshini Perera Assistant Director
Biodiversity Secretariat Ms M.A.Chanuka Maheshani Development Officer-Environment
Land Resources Division Mr Manori Karunarathna Development Officer
Air Resource Management. and National Ozone Unit
Mr C.D.Siriwardena Development Officer
Forest Resources Division Mr Peshala Amarathunga Assistant Director(Forest Resources)
Forest Resources Division Mr D.Upul Premalal Research Assistant

Annex 4a and 4b: List of institutions visited by members of the review team in June/July 2019 or attending the consultation workshops on October 2019
122 | P a g e
Annex 4.b Organisations invited by DCS to participate in the
National Consultation Workshops on the 23rd/ 24th and 25th
of October 2019 to discuss the emerging findings in the
Review of the National Statistical System
National Consultation Workshop on National Statistical System (NSS) Review Pre-Workshop Session: 2019 October 23, Olu Hall, Waters Edge Hotel, Battaramulla, From 14.00 pm To 16.30 pm
Name Position
Dr. Harsha De Silva Honourable Minister, Economic Reforms & Public Distribution
Ms. Chandanie Wijewardena Secretary, Ministry of Economic Reforms & Public Distribution
Dr. Nisha Arunatilake Institute of Policy Studies of Sri Lanka
Mr.Murthaza Jaffergyee JB Securities
Mr.Sriganesh Lokanthan LIRNEasia
Mr.Mubarak National Planning Department
Mr.Shiran Fernando Ceylon Chamber of Commerce
Dr.Chandranath Amarasekara Central Bank of Sri Lanka
Mr.Rohana Wijayawardhana Central Bank of Sri Lanka
Mr.Kapila Weerakoon Central Bank of Sri Lanka
Dr. I.R. Bandara Director General, Department of Census and Statistics

Annex 4a and 4b: List of institutions visited by members of the review team in June/July 2019 or attending the consultation workshops on October 2019
123 | P a g e
Department of Census and Statistics (DCS) Sri Lanka
Consultation Workshop on the National Statistical System (NSS) Review of Sri Lanka
Stakeholder Group day 1-Session 1: 09.00 – 13.00
Prime Minister's Policy Development Office
Institute of Policy Studies of Sri Lanka
National Planning Department
Department of External Resources (ERD)
National Accounts Division-Department of Census and Statistics
Prices and Wages Division-Department of Census and Statistics
Industries and Construction Statistics Division-Department of Census and Statistics
Central Bank of Sri Lanka
Department of Inland Revenue
Sri Lanka Customs
Department of Commerce
Securities and Exchange Commission of Sri Lanka
Sri Lanka Export Development Board
Board of Investment of Sri Lanka (BOI)
Sri Lanka Tourism Development Authority
National Gem and Jewellery Authority
Industrial Development Board of Ceylon (IDB)
Construction Industry Development Authority (CIDA)
Central Engineering Consultancy Bureau (CECB)
Geological Survey and Mines Bureau (GSMB)
Department of Registrar of Companies (ROC)
Civil Aviation Authority of Sri Lanka
Road Development Authority (RDA)
Urban Development Authority (UDA)
Department of Motor Traffic
Sri Lanka Ports Authority
Ceylon Petroleum Corporation (CPC/CEYPETCO)
Ceylon Electricity Board (CEB)

Annex 4a and 4b: List of institutions visited by members of the review team in June/July 2019 or attending the consultation workshops on October 2019
124 | P a g e
Department of Census and Statistics (DCS) Sri Lanka
Consultation Workshop on the National Statistical System (NSS) Review of Sri Lanka
Stakeholder Group day 1 - Session 2: 14.00-16.30
Department of Census and Statistics
Ministry of Health, Nutrition & Indigenous Medicine
Registrar General's Department
Department of Registration of Persons
Ministry of Education
Ministry of Higher Education and Highways
National Science Foundation
Ministry of Science Technology and Research
Sri Lanka Bureau of Foreign Employment
Vocational Training Authority of Sri Lanka (VTA)
Ministry of Justice and Prison Reforms
Sri Lanka Police-Research and Development Division
Department of Probation and Childcare Services
Department of Social Services
Ministry of Women and Child Affairs
Department of Samurdhi Development
Insurance Regulatory Commission of Sri Lanka
Sri Lanka Bureau of Foreign Employment (SLBFE)
Department of Labour
Department of Pensions
National Insurance Trust Fund
Employees' Trust Fund Board
Employees' Provident Fund-Central Bank of Sri Lanka
Postal Department
Information and Communication Technology Agency (ICTA)
Telecommunication Regulatory Commission of Sri Lanka (TRC)

Annex 4a and 4b: List of institutions visited by members of the review team in June/July 2019 or attending the consultation workshops on October 2019
125 | P a g e
Department of Census and Statistics (DCS) Sri Lanka
Consultation Workshop on the National Statistical System (NSS) Review of Sri Lanka
9.00 to 13.00
Department of Census and Statistics
Ministry of Mahaweli Development & Environment
Central Environmental Authority
Mahaweli Authority of Sri Lanka
Ministry of Agriculture, Rural Economic Affairs, Livestock Development, Irrigation and Fisheries
Department of Agrarian Development
Department of Agriculture (DOA)
Coconut Cultivation Board
Sri Lanka Tea Board
Hector Kobbekaduwa Agrarian Research and Training Institute (HARTI)
Disaster Management Centre (DMC)
National Building Research Organisation
Ministry of Megapolis and Western Development
Irrigation Department
Rubber Development Department
Ministry of Fisheries and Aquatic Resources
Department of Fisheries and Aquatic Resources
National Water Supply and Drainage Board
Sri Lanka Sustainable Energy Authority
Geological Survey and Mines Bureau (GSMB)
Urban Development Authority
Sustainable Development Council

Staff complement for DCS as at end of December 2018
126 | P a g e
ANNEX 5 Staff in DCS as at end of 2018
Designation
Approved
Cadre
Existing
Cadre as at
31.12.2018
Vacancies
1 Director General 1 1 0
2 Additional Director General(Statistics) 3 1 2
3 Additional Director General(Information & Communication
Technology) 1 0 1
4 Additional Director General (Administration) 1 1 0
5 Director (Statistics) 16 8 8
6 Director (Administration) 1 1 0
7 Director (Information & Communication Technology) 2 0 2
8 Chief Accountant 1 1 0
9 Chief Internal Auditor 1 1 0
10 Deputy Director (Statistics) 36 0 36
11 Deputy Director (ICT) 6 6 0
12 Deputy/Assistant Director (Administration/Establishment) 2 0 2
13 Assistant Director (ICT) 15 7 8
14 Accountant 2 2 0
15 Internal Auditor 1 0 1
16 Senior Statistician 37
200
21 -
17 Statistician 105 74 ®
18 Printing Manager 1 0 1
19 Legal Officer 1 0 1
20 Administrative Officer 1 1 0

Staff complement for DCS as at end of December 2018
127 | P a g e
21 Statistical Draughtsman 1 0 1
22 Librarian (Special grade) 1 0 1
23 Librarian 3 3 0
24 Translator 3 2 1
25 Editor (English/Tamil) (On contract basis) 2 0 2
26 Information & Communication Technology Officer – SLICTS
Class II Grade I,II 30 9 21
27 Statistical Officer 494 364 130
28 Development Officer 64 55 9
29 Statistical Assistant 202 120 0 •
30 Budget Assistant 1 1 0 •
31 Information & Communication Technology Assistant –
SLICTS Class III, Grade I,II,III 262 212 50
32 Post Press Printer 5 0 5
33 Technician (Printing) 2 0 2
34 Technical Officer 1 0 1
35 Pre-Press Printer 3 0 3
36 Offset Litho Machine Operator 1 0 1
37 System Controller 6 2 0
38 Senior System Operator 3 2 0
39 Foreman (Printing) 1 1 0
40 Public Management Assistants‟ Service 170 149 21
41 Data Entry Operator 5 4 0
42 Data Entry Operator/Coding Clerk 33 30 3
43 Clerk (Sinhala Medium) 10 6 4
44 Clerk (Tamil Medium) 20 16 4
45 Camera Operator 1 1 0
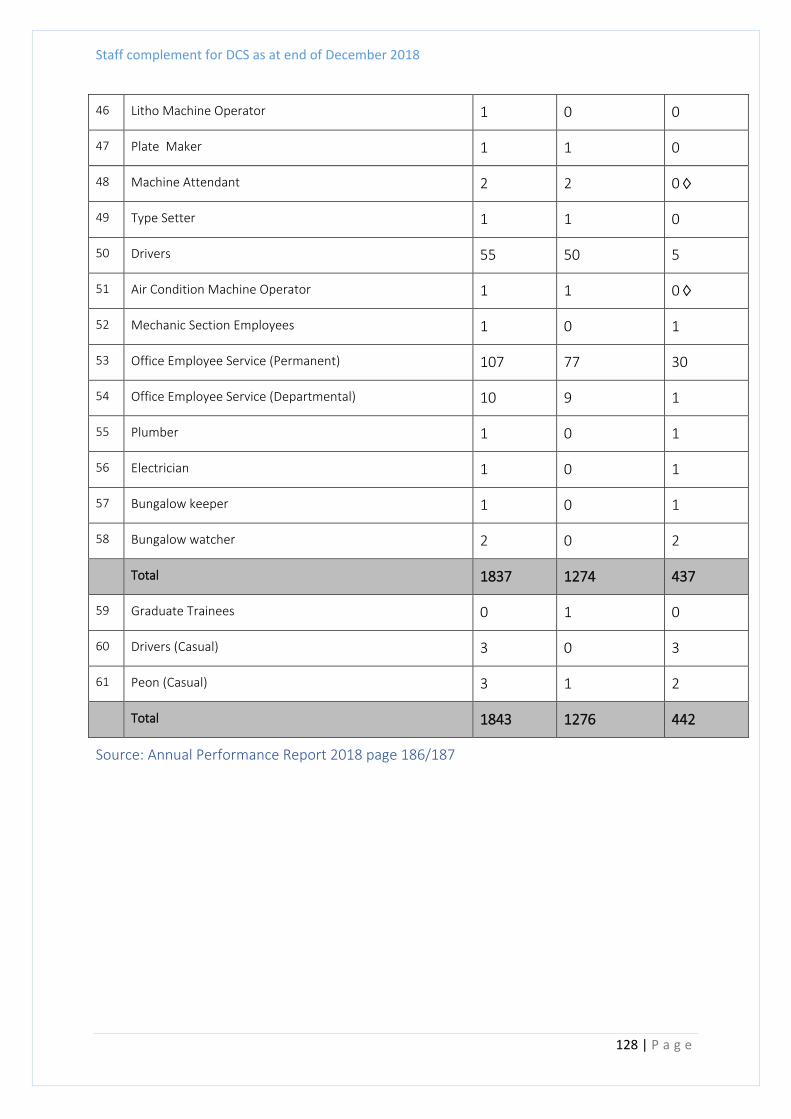
Staff complement for DCS as at end of December 2018
128 | P a g e
46 Litho Machine Operator 1 0 0
47 Plate Maker 1 1 0
48 Machine Attendant 2 2 0
49 Type Setter 1 1 0
50 Drivers 55 50 5
51 Air Condition Machine Operator 1 1 0
52 Mechanic Section Employees 1 0 1
53 Office Employee Service (Permanent) 107 77 30
54 Office Employee Service (Departmental) 10 9 1
55 Plumber 1 0 1
56 Electrician 1 0 1
57 Bungalow keeper 1 0 1
58 Bungalow watcher 2 0 2
Total 1837 1274 437
59 Graduate Trainees 0 1 0
60 Drivers (Casual) 3 0 3
61 Peon (Casual) 3 1 2
Total 1843 1276 442
Source: Annual Performance Report 2018 page 186/187
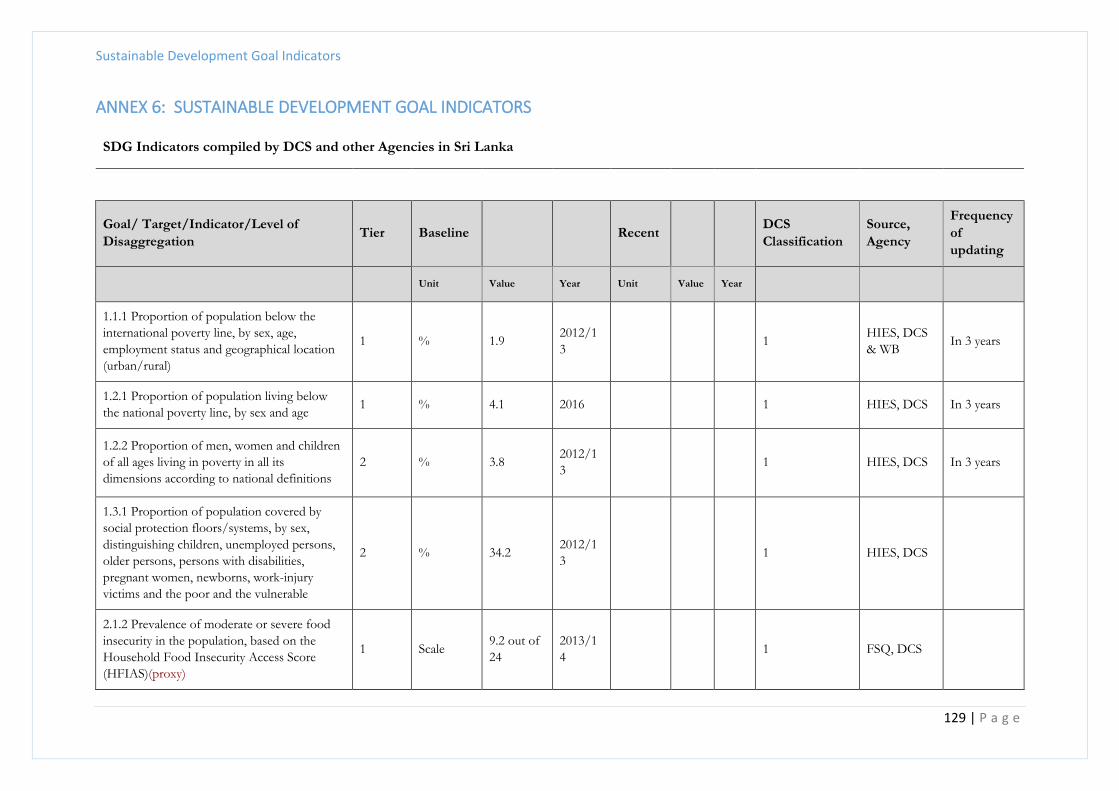
Sustainable Development Goal Indicators
129 | P a g e
ANNEX 6: SUSTAINABLE DEVELOPMENT GOAL INDICATORS
SDG Indicators compiled by DCS and other Agencies in Sri Lanka
Goal/ Target/Indicator/Level of
Disaggregation Tier Baseline Recent
DCS
Classification
Source,
Agency
Frequency
of
updating
Unit Value Year Unit Value Year
1.1.1 Proportion of population below the
international poverty line, by sex, age,
employment status and geographical location
(urban/rural)
1 % 1.9 2012/1
3 1
HIES, DCS
& WB In 3 years
1.2.1 Proportion of population living below
the national poverty line, by sex and age 1 % 4.1 2016 1 HIES, DCS In 3 years
1.2.2 Proportion of men, women and children
of all ages living in poverty in all its
dimensions according to national definitions
2 % 3.8 2012/1
3 1 HIES, DCS In 3 years
1.3.1 Proportion of population covered by
social protection floors/systems, by sex,
distinguishing children, unemployed persons,
older persons, persons with disabilities,
pregnant women, newborns, work-injury
victims and the poor and the vulnerable
2 % 34.2 2012/1
3 1 HIES, DCS
2.1.2 Prevalence of moderate or severe food
insecurity in the population, based on the
Household Food Insecurity Access Score
(HFIAS)(proxy)
1 Scale 9.2 out of
24
2013/1
4 1 FSQ, DCS

Sustainable Development Goal Indicators
130 | P a g e
2.2.1 Prevalence of stunting (height for age <-
2 standard deviation from the median of the
World Health Organization (WHO) Child
Growth Standards) among children under 5
years of age
1 % 17.3 2016 1 DHS, DCS In 5 yeas
2.2.2 Prevalence of malnutrition (weight for
height >+2 or <-2 standard deviation from
the median of the WHO Child Growth
Standards) among children under 5 years of
age, by type (wasting and overweight)
1 % 17.1 2016 1 DHS, DCS In 5 years
3.1.1 Maternal mortality ratio 2
Per
100,000
live births
26.8 2013
Per
100,000
live
births
25.7 2014 1
Report on
Vital
Statistics,
RGD
Annually
3.1.2 Proportion of births attended by skilled
health personnel 1 % 99.5 2016 1 DHS, DCS In 5 years
3.2.1 Under-five mortality rate 1 Per 1000
live births 9.4 2014
Per 1000
live
births
10.1 2015 1
Report on
Vital
Statistics,
RGD
Annually
3.2.2 Neonatal mortality rate 1 Per 1000
live births 5.6 2014
Per 1000
live
births
6.0 2015 1
Report on
Vital
Statistics,
RGD
Annually

Sustainable Development Goal Indicators
131 | P a g e
3.4.1 Mortality rate attributed to cardiovascular
disease, cancer, diabetes or chronic respiratory
disease
2
Per 10,000
population
of aged
30-69
31.9 2013 1
Report on
Vital
Statistics,
RGD
Annually
3.4.2 Suicide mortality rate 2
Per
100,000
population
14.3 2016 1 Sri Lanka
Police Annually
3.6.1 Death rate due to road traffic injuries 1
Per
100,000
population
14.2 2016 1 Sri Lanka
Police Annually
3.7.1 Proportion of women currently married
of reproductive age (aged 15-49 years) who
have their need for family planning satisfied
with modern methods(The proportion of
demand stratified by modern methods)
1 % 74.2 2016 1 DHS, DCS In 5 years
3.7.2 Adolescent birth rate (aged 10-14 years;
aged 15-19 years) per 1,000 women in that age
group
2
Per 1000
women in
15-49 age
group
36 2012 1 CPH, DCS In 10 years
3.8.2 Number of people covered by health
insurance or a public health system per 1,000
population
2 1
3.c.1 Health worker density and distribution 1 1
Annual
Health
Bulletin –
MOH&IM
Annually
4.2.2 Participation rate in organized learning
(one year before the official primary entry age),
by sex
1 % 97.7 2016 1
School
Census,
MOE

Sustainable Development Goal Indicators
132 | P a g e
4.4.1 Proportion of youth and adults with
information and communications technology
(ICT) skills, by type of skill
2 % 27.6 2016 1 LFS, DCS
4.a.1 Proportion of schools with access to:
(a) electricity; (b) the Internet for pedagogical
purposes; (c) computers for pedagogical
purposes; (d) adapted infrastructure and
materials for students with disabilities; (e) basic
drinking water; (f) single-sex basic sanitation
facilities; and (g) basic hand washing facilities
(as per the WASH indicator definitions)
2 1
School
Census,
MOE
4.c.1 Proportion of teachers in: (a) pre-
primary; (b) primary; (c) lower secondary; and
(d) upper secondary education who have
received at least the minimum organized
teacher training (e.g. pedagogical training) pre-
service or in-service required for teaching at
the relevant level in a given country
1 % 1
5.1.1 Whether or not legal frameworks are in
place to promote, enforce and monitor
equality and non-discrimination on the basis of
sex
3
Legal
framewor
k are in
place.
1
Ministry of
Women and
Child Affairs
5.2.1 Proportion of ever-partnered women
and girls aged 15 years and older subjected to
physical, sexual or psychological violence by a
current or former intimate partner in the
previous 12 months, by form of violence and
by age
2 16.6 2016 1 DHS, DCS In 5 years

Sustainable Development Goal Indicators
133 | P a g e
5.2.2 Proportion of women and girls aged 15
years and older subjected to sexual violence by
persons other than an intimate partner in the
previous 12 months, by age and place of
occurrence (Proxy indicator)
2 15.1 2016 1 DHS, DCS In 5 years
5.3.1 Proportion of women aged 20-24 years
who were married or in a union before age 15
and before age 18
1 1 DHS, DCS
5.5.2 Proportion of women in managerial
positions 1 % 28.4 2016 1 LFS, DCS Annually
6.1.1 Proportion of population using safely
managed drinking water services 1 % 80.9 2012 1 CPH, DCS In 10 years
7.1.1 Proportion of population with access to
electricity 1 % 87.0 2012 1 CPH, DCS In 10 years
8.1.1 Annual growth rate of real GDP per
capita 1 % 3.2 2016 1
National
Accounts
estimates,
DCS
Annually
8.2.1 Annual growth rate of real GDP per
employed person 1 % 2.9 2016 1
National
Accounts
estimates,
DCS
Annually
8.5.2 Unemployment rate, by sex, age and
persons with disabilities 1 % 4.4 2016 1 LFS, DCS Annually
8.6.1 Proportion of youth (aged 15-24 years)
not in education, employment or training 1 % 26.1 2016 1 LFS, DCS Annually

Sustainable Development Goal Indicators
134 | P a g e
8.7.1 Proportion and number of children aged
5-17 years engaged in child labour, by sex and
age
1 % 1.0 2016 1 CAS, DCS In 5 years
9.1.1 Proportion of the rural population who
live within 2 km of an all-season road 3 % 95.6
2012/1
3 1 HIES, DCS In 3 years
9.2.1 Manufacturing value added as a
proportion of GDP and per capita 1 % 18.0 2016 1
Annual
estimates on
National
Accounts,
DCS
Annually
9.2.2 Manufacturing employment as a
proportion of total employment 1 % 18.0 2016 1 LFS, DCS Annually
9.3.1 Proportion of small-scale industries in
total industry value added (Small industries -
(10 to 25 persons engaged.)
3 % 2.7 2013/1
4 1
Economic
Census, DCS In 10 years
10.1.1 Growth rates of household expenditure
or income per capita among the bottom 40 per
cent of the population and the total population
1 2012/1
3 1 HIES, DCS In 3 years
10.2.1 Proportion of people living below 50
per cent of median income, by age, sex and
persons with disabilities
3 % 13.5 2012/1
3 1 HIES, DCS In 3 year
10.4.1 Labour share of GDP, comprising
wages and social protection transfers 1 % 28.0 2016 1
Annual
estimates on
National
Accounts,
DCS
Annually
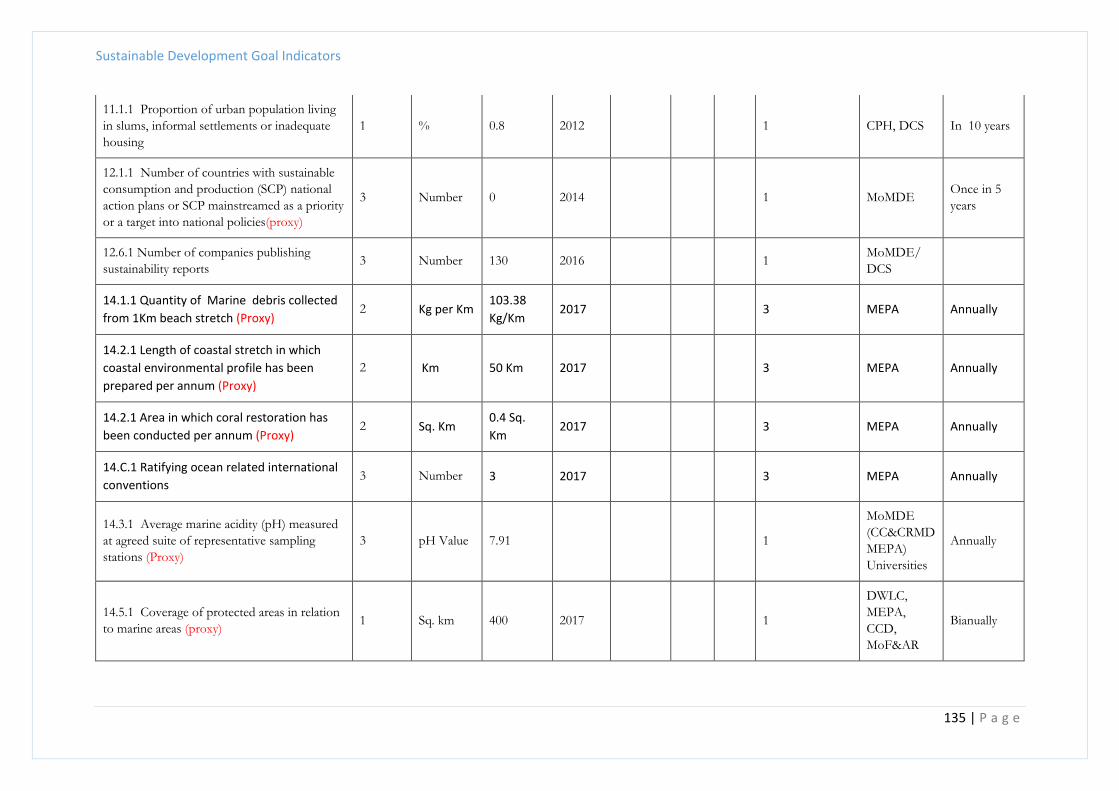
Sustainable Development Goal Indicators
135 | P a g e
11.1.1 Proportion of urban population living
in slums, informal settlements or inadequate
housing
1 % 0.8 2012 1 CPH, DCS In 10 years
12.1.1 Number of countries with sustainable
consumption and production (SCP) national
action plans or SCP mainstreamed as a priority
or a target into national policies(proxy)
3 Number 0 2014 1 MoMDE Once in 5
years
12.6.1 Number of companies publishing
sustainability reports 3 Number 130 2016 1
MoMDE/
DCS
14.1.1 Quantity of Marine debris collected
from 1Km beach stretch (Proxy) 2 Kg per Km
103.38
Kg/Km 2017 3 MEPA Annually
14.2.1 Length of coastal stretch in which
coastal environmental profile has been
prepared per annum (Proxy)
2 Km 50 Km 2017 3 MEPA Annually
14.2.1 Area in which coral restoration has
been conducted per annum (Proxy) 2 Sq. Km
0.4 Sq.
Km 2017 3 MEPA Annually
14.C.1 Ratifying ocean related international
conventions 3 Number 3 2017 3 MEPA Annually
14.3.1 Average marine acidity (pH) measured
at agreed suite of representative sampling
stations (Proxy)
3 pH Value 7.91 1
MoMDE
(CC&CRMD
MEPA)
Universities
Annually
14.5.1 Coverage of protected areas in relation
to marine areas (proxy) 1 Sq. km 400 2017 1
DWLC,
MEPA,
CCD,
MoF&AR
Bianually

Sustainable Development Goal Indicators
136 | P a g e
15.1.1 Forest area as a proportion of total
land area 1 % 30.7 2010 2 FD
Once in
Every 5
Years
15.5.1 Red List Index 1 2
MoMDE ,
Biodiversity
Secretriat
16.1.1 Number of victims of intentional
homicide per 100,000 population, by sex and
age
1
Per
100,000
population
2.5 2016 1 Sri Lanka
Police Annually
16.1.3 Proportion of population subjected to
physical, psychological or sexual violence in
the previous 12 months
Per
100,000
population
55.2 2016 1 Sri Lanka
Police Annually
16.2.2 Number of victims of human
trafficking per 100,000 population, by sex, age
and form of exploitation
1
Per
100,000
population
0.12 2016 1 Sri Lanka
Police Annually
16.3.2 Un-sentenced detainees as a proportion
of overall prison population 1
Per
Overall
Prison
Populatio
n
0.5 2016 1 Department
of Prisons Annually
16.4.2 Proportion of seized small arms and
light weapons that are recorded and traced, in
accordance with international standards and
legal instruments
3
Per
100,000
population
0.4 2016 1 Sri Lanka
Police Annually
** Some of the proxy indicators Compiled by
other Agencies are highlighted in Red

Sustainable Development Goal Indicators
137 | P a g e


