HSE Health & Safety Executive Review of workplace control measures to reduce risks arising from the movement of vehicles Phase 1 & Phase 2 Prepared by Transport Research Laboratory (TRL) Limited for the Health and Safety Executive 2002 RESEARCH REPORT 038
Transcript
HSE Health & Safety
Executive
Review of workplace control measures to reduce risks arising
from the movement of vehicles
Phase 1 & Phase 2
Prepared by Transport Research Laboratory (TRL) Limited
for the Health and Safety Executive 2002
RESEARCH REPORT 038
HSE Health & Safety
Executive
Review of workplace control measures to reduce risks arising
from the movement of vehicles
Phase 1
Camilla Fowler Transport Research Laboratory
Old Wokingham Road Crowthorne
Berkshire RG45 6AU
United Kingdom
The research aims to obtain information about workplace transport safety from organisations of varying size and industry sector. The research was divided into two sections, phase one and phase two. This report marks the completion of phaseone.
One hundred companies were randomly selected from each of the identified industry sectors. The companies were of varying size (number of employees) and were operating from premises of different ages. Through a brainstorming session key technical members of the project team compiled a list of potential measures that could be used to control workplace transport. The measures could be grouped under the following categories: pedestrian safety, traffic routes, vehicle safety, site safety engineering measures and signs, safe systems of work, training and selection and personal protective equipment.
This report and the work it describes were funded by the Health and Safety Executive (HSE). Its contents, including any opinions and/or conclusions expressed, are those of the author alone and do not necessarily reflect HSE policy.
All rights reserved. No part of this publication may bereproduced, stored in a retrieval system, or transmitted inany form or by any means (electronic, mechanical,photocopying, recording or otherwise) without the priorwritten permission of the copyright owner.
Applications for reproduction should be made in writing to: Licensing Division, Her Majesty's Stationery Office, St Clements House, 2-16 Colegate, Norwich NR3 1BQ or by e-mail to [email protected]
CONTENTS
EXECUTIVE SUMMARY v
1. INTRODUCTION 1
2. AIMS OF THE RESEARCH PROJECT 4
2.1 Overall aims 4
2.2 Detailed aims of Phase 1 5
3. METHODOLOGY 6 3.1 Sample Selection 6
3.2 Questionnaire design 7
3.3 Mailing of the questionnaire 8 3.4 Analysis 8
4. RESULTS 11
5. DISCUSSION 43
6. CONCLUSIONS FOR PHASE ONE 47
7. AIMS FOR PHASE TWO 47
8. REFERENCES 49
APPENDIX ONE 50
APPENDIX TWO 59
APPENDIX THREE 85
iii
Printed and published by the Health and Safety ExecutiveC30 1/98
iv
EXECUTIVE SUMMARY
The research aims to obtain information about workplace transport safety from organisations of varying size and industry sector. The research was divided into two sections, phase one and phase two. This report marks the completion of phase one.
100 companies were randomly selected from each of the identified industry sectors. The companies were of varying size (number of employees) and were operating from premises of different ages. Through a brainstorming session key technical members of the project team compiled a list of potential measures that could be used to control workplace transport. The measures could be grouped under the following categories: pedestrian safety, traffic routes, vehicle safety, site safety engineering measures and signs, safe systems of work, training and selection and personal protective equipment.
After an extensive literature search and familiarisation with relevant legislation and guidance, a questionnaire was designed. The information being sought included general information about the company, such as the number of employees, the types of vehicles in use within the work site, accident reporting, general workplace transport safety, awareness of legislation, the implementation of control measures and their perceived effectiveness.
The questionnaire was piloted on 10 local companies through face to face interviewing. Comments were noted and suggestions fed into the redesign of the questionnaire. The questionnaire was then re-piloted on 25 companies through telephone interviewing. The final version of the questionnaire was mailed to 2000 companies and a covering letter and pre-paid envelope were included.
Sufficient responses were received to allow statistical analysis and the responses were weighted in line with the total number of organisations in each industry sector, so conclusions could be drawn about the population as a whole.
There is a reasonably high reported level of awareness of health and safety legislation, but a sizeable minority of companies have little awareness, and do not record accident data. About 40% of the companies who reported being aware of the Management of Health and Safety at Work Regulations said they had not conducted a risk assessment of workplace transport. These finding suggest that there is considerable scope for improving the promulgation of regulations, guidance on good practice, and enforcement.
As the number of vehicles on site increases, the rated effectiveness of vehicle safety measures, safe systems of work, and personal protective equipment decreases. However, the use of training, selection and site safety engineering measures and signs tends to increase. It may be that, with many vehicles on site, the complexity of the safety problem is seen to require these additional types of measure. Also, some sites with many vehicles will be ones in which companybased vehicle safety measures are inappropriate as the cars are owned and maintained outside the control of the organisation.
Control of vehicle movements in the workplace seen as a high priority for 41% of the sampled companies, and 52% of the sample said they had conducted risk assessments to identify and evaluate the risks posed. All participating companies have implemented some measures to control workplace transport safety. The
v
measures implemented by the most companies are suitable and effective brakes on vehicles, horns on vehicles and suitable lighting in the workplace.
There was a tendency for implementation and perceived effectiveness scores for workplace transport safety control measures to increase as number of employees increased. Such a tendency is probably to be expected since larger companies will tend to have more complex workplace transport safety problems requiring a wider spectrum of control measures. However, another part of the explanation may be that larger companies have better organised and better resourced health and safety functions, suggesting that the smaller companies may be a particularly important target for future efforts to improve workplace transport safety.
Phase 2 of this project will explore further the above issues, and other issues raised by the work to date.
vi
1. INTRODUCTION
The Health and Safety at Work Act, 1974, states:
‘It shall be the duty of every employer to ensure, so far as is reasonably practicable, the health, safety and welfare at work of his employees.’ (Section 2(1)).
Section 3 of the Act extends the employer’s duty of care to include the health and safety of persons not in his employment who may be affected by the risks posed by his undertaking.
Underpinning this Act are the Management of Health and Safety at Work Regulations, 1999. These state that every employer shall conduct a suitable and sufficient assessment of the risk to the health and safety of persons in his employment and persons who may be affected by his undertaking. The employer must record the findings of this assessment and implement any preventative or protective measures to reduce the risks posed, as low as reasonably practicable.
Therefore, legislation requires a risk assessment to be conducted for all workplace activities including workplace transport. Workplace transport refers to any vehicle or piece of mobile equipment, used by employers, employees, self-employed people or visitors in any work setting, with the exception of travelling on public roads. Examples of workplace transport vehicles and equipment are listed below:
The risks posed by workplace transport must be identified, minimised and controlled. Measures that can be taken to reduce the inherent risk posed by workplace transport are outlined in The Workplace (Health, Safety and Welfare) Regulations 1992. Further Regulations include The Construction (Health, Safety and Welfare) Regulations 1996 (only applicable to constructions sites) and The Provision and Use of Work Equipment Regulations, 1998. Further guidance on workplace transport risks and control measures includes:
· Workplace Transport Safety, HS(G)136
· Managing Vehicle safety at the Workplace, INDG. 199
· Safety Policy Directorate – Workplace Transport
· Danger, Vehicles at Work – HSE video.
1
The HSE hierarchy of risk control measures (HS(G)65) is as follows:
1. Eliminate risks or substitute activity, substance or process by a less hazardous activity/ substance/ process.
2. Combat risk at source by engineering control measures.
3. Minimise risk by suitable safe systems of work, for example reduce exposure to hazards.
4. Mitigate the consequences.
Workplace layout is often the primary control measure, but it is important not to overlook other essential control measures. Workplace transport safety control measures can be grouped into seven main categories:
1. Pedestrian Safety, for example, pedestrian crossings and separate vehicle and pedestrian traffic routes.
2. Traffic Routes, for example, crash barriers and one way systems.
3. Vehicle Safety, for example, seat belts and reversing lights.
4. Safety Measures and Signs, for example, speed ramps and warning signs. (Hereafter referred to as ‘site safety engineering measures and signs’)
5. Safe Systems of Work, for example, designated areas for reversing and overtaking restrictions.
6. Training and Selection, for example, driving assessments and vehicle maintenance training.
7. Personal Protective Equipment, for example, hard hats and high visibility clothing.
On average, 70 people are killed and 2000 seriously injured in workplace transport accidents every year (HSC Newsletter, October 1999). Vehicles are the second highest cause of death in the workplace. Whilst the type of equipment and the working environment may differ significantly across workplaces, transport is recognised as a significant risk for all industries.
The greatest number of deaths from workplace transport arises from the movement of vehicles, including people being struck by objects falling from vehicles (usually part of the load) or vehicles overturning. Reversing vehicles also presents a particular hazard. (HSC Newsletter, October, 1999)
These facts alone demonstrate that the risks posed by workplace transport are not being suitably identified and sufficiently controlled. Therefore, employer’s compliance with UK health and safety legislation is questionable.
It is important to establish the extent that recommended control measures have been implemented and gain an insight into the types of organisation and industry that contribute to the high death rate from workplace transport accidents. Such
2
industries can then be targeted for guidance and assistance from regulatory bodies in the future.
Many organisations have implemented measures and systems to control the risks posed by vehicles in their workplace. It is important to examine these measures, assess their effectiveness in reducing the inherent risk and calculate their cost of implementation and maintenance. Lessons can be learnt from these companies experience and considered when establishing best practice.
The HSE are aware of the large number of industrial accidents that are attributable to workplace transport. The HSE believe that industries hold a negative attitude towards the control of vehicle movements and are concerned that the level of compliance with relevant health and safety legislation is low. The HSE recognises the need to develop a workable, comprehensive and transparent strategy on workplace transport and need information from research to develop supporting material.
This research aims to gain an insight into the types of measures used within industry to control workplace transport and the effectiveness, implementation costs and maintenance costs of such measures. Compliance with legislation will be examined and the reasons why safety problems arising from vehicle movements in workplaces is neglected, explored. From the research, best practice will be established and fed into the HSE transport strategy and future workplace transport guidance.
3
2. AIMS OF THE RESEARCH PROJECT
2.1 OVERALL AIMS
The aims of the project, as specified by the HSE are as follows:
· Determine the types of workplace control measures in use to reduce the risk from vehicle movements.
· Establish the degree to which control measures are implemented across industry and evaluate compliance with Workplace Regulations and the Construction (Health, Safety and Welfare Regulations 1996.
· Review the effectiveness of different types of control measures, their cost of implementation and cost of maintenance.
· Establish changes to the workplace and best practice demonstrated. · Gain an understanding of why the control of vehicle movements in workplaces
is neglected or not seen as a problem. · Examine interface with the public and extended workforce. · Provide six suitable case studies for HSE publications. · Identify further suitable case study material.
4
2.2 DETAILED AIMS OF PHASE ONE
The project is being conducted in two phases. Phase one involves obtaining and analysing data on workplace transport control measures through a postal questionnaire to a number of specified industrial sectors. Phase two involves undertaking more in depth studies of workplace controls through the inspection of 20 industrial sites.
This report deals with phase one, the aims of which are as follows:
§ To determine the types of workplace control measures in use to reduce the risk from vehicle movements.
§ To determine the perceived effectiveness of different types of measures that could be used to control workplace transport.
§ To establish, within the limits imposed by the size of the study, whether the size of company affects the type of control measures implemented and the effectiveness of the measure.
§ To determine whether the control of vehicle movements in the workplace are seen as a high priority and establish whether steps have been taken to identify, evaluate and reduce the risks posed.
§ To discover whether companies claim to be aware of the current health and safety legislation applicable to workplace transport.
5
3. METHODOLOGY
3.1 SAMPLE SELECTION
The Health and Safety Executive stipulated in the project specification that data for phase one should be collected from a number of specified industrial sectors. The named sectors were as follows:
The HSE also indicated that the sample should include companies with varying numbers of people employed.
Response rates for postal questionnaires vary dramatically depending on the nature of the information being researched, the target population and the incentive being offered to participate. Previous research, of a similar nature, which was conducted for the HSE is the ‘Evaluation of the Six Pack Regulations, 1992’ (Institute of Occupational Medicine). This research achieved a 24% response rate. A similar response rate was expected for this research as a similar group of companies was to be contacted for relatively sensitive information. As recognised in the TRL proposal study, a high response rate was not expected because of the nature of the questionnaire and the companies’ perceived implications with completing it.
Providing adequate statistical power for comparisons between the above industry sectors would require a very large sample for the survey. This was discussed with the HSE customer during the bidding stage, who confirmed that between-sector comparisons were not required. Accordingly, it was decided that a returned sample of 400 questionnaires would be adequate, since this would allow the proportion of companies reporting, for example the use of a particular safety intervention, to be estimated within five percentage points.
Initial contact was made with the Chamber of Commerce with regards to the obtaining the required information for the 2000 companies. They suggested that Dun and Bradstreet would be a more appropriate company to contact as they hold the complete database and could supply the required information on CD-ROM.
A sample of 100 companies from each of the 20 identified industry sectors was selected at random from the Dun and Bradstreet database. Information on the number of companies within each sector was also provided to enable the sample data to be re-weighted.
6
3.2 QUESTIONNAIRE DESIGN
The responses from the questionnaires form the foundations of the research. Obtaining useful information from a relatively high number of respondents was deemed an essential part of ensuring that the research was accurate and successful. Therefore, the questionnaire was meticulously designed and piloted to ensure that the following objectives were met:
i) To obtain useful information from companies in a range of industry sectors with varying number of employees regarding workplace transport, transport control measures and their perceived effectiveness, general workplace safety and compliance with/ knowledge about health and safety legislation.
ii) To achieve a high enough response rate so representative and accurate conclusions could be drawn from the analysis of responses.
iii) To ensure that the questions asked were not misleading, unnecessary or confusing and to minimise the amount of effort required by the respondent to complete them.
The questionnaire design process consisted of four main stages:
3.2.1 Literature Search
A literature search was undertaken to ensure a complete understanding of the hazards associate with workplace transport and the control measures that could be implemented in the workplace to mitigate these risks. All relevant legislation and guidance was also obtained to refer to during the process of designing the questionnaire.
3.2.2 Brainstorming
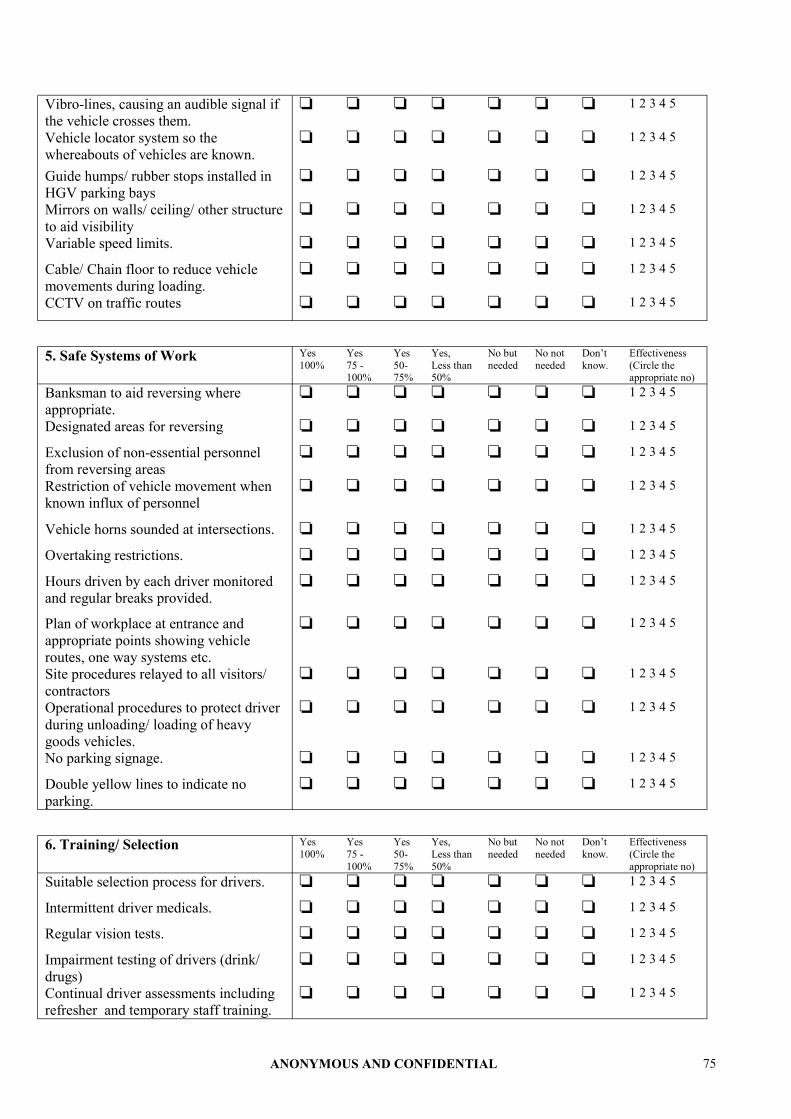
Key technical members of the project team undertook a brainstorming session to create a list of all control measures that could potentially reduce the inherent risk posed by workplace transport. 130 control measures were listed and were categorised into 7 groups: i) Vehicle safety ii) Pedestrian safety iii) Site safety engineering measures and signs iv) Workplace safety v) Safe systems of work vi) Training vii) Personal protective equipment
The list of control measures is intended to be used both in the phase one questionnaire survey and in the site visits, to be conducted in phase two.
3.2.3 Initial Questionnaire Design.
A high response rate was not expected from the questionnaire because of the nature of the information being sought and the company’s perceived implications of providing it. It was therefore important to maximise the response rate through ensuring minimal burden on the respondent, encouraging response through the careful design of a covering letter and informing the participant that there would be no repercussions by assuring complete confidentiality and anonymity.
7
A time limit of 20 minutes was aimed for, to maximise the response rate. It was decided that an eight page questionnaire could be completed within this time frame.
3.2.4 Piloting
Due to the complexity of the research it was deemed essential to thoroughly pilot the questionnaire. Two piloting procedures were conducted. Pilot one involved contacting ten local companies to ask for their permission to involve them in the study, mailing a questionnaire to the volunteering companies and following this up with a face to face interview, where any problems encountered when answering the questionnaire were discussed. Pilot two involved mailing a questionnaire to 25 companies and following this up with a telephone interview to discuss any issues with the content or completion of the questionnaire.
All companies were selected from the internet and local business guides. It was important to ensure that the piloted industries reflected the industries to be included in the final sample. Therefore the companies selected were of varying size and age of premises, and from different industry sectors.
The HSE customer also reviewed the questionnaire and comments were made.
All comments made by the pilot companies and the HSE were deemed valid and a subsequent version of the questionnaire was designed incorporating the suggestions made. Further information on the questionnaire design and pilot studies can be found in Appendix One. The final questionnaire is shown in Appendix Two. It included questions on the age of premises, size of the company, methods of transport used within the company, safety information recorded, details of transport accidents encountered, general workplace transport safety, awareness of legislation and the measures in place to control workplace transport, the extent to which they had been implemented and their perceived effectiveness.
3.3 MAILING OF THE QUESTIONNAIRE
Questionnaires were mailed to 2000 companies i.e 100 companies randomly selected from the Dun and Bradstreet database for each of the 20 specified industry sectors. Covering letters were enclosed with the questionnaire explaining the purpose of the research and assuring anonymity and confidentiality. A TRL contact name and number was included on the letter, so respondents could seek assurance if required. The letters were addressed to the safety manager, as the pilot studies revealed this as the best option. Pre-paid envelopes were also included to reduce the participating companies’ expenditure and to increase the likelihood of response.
Reminder letters, questionnaires and pre-paid envelopes were mailed to nonresponding companies after three weeks. These companies were then given a further two weeks to respond.
3.4 ANALYSIS
All responses from the returned questionnaires were input into a spreadsheet created on Microsoft Access software. The primary aim of the analysis was to fulfil the objectives set for phase one as listed in section one.
8
3.4.1 Weighting of responses
Randomly sampling 100 organisations from each of the 20 industry sectors gives at least a limited possibility of being able to make comparisons between sectors. However it does not produce a representative sample of the total population of companies across all the sectors: companies from small industrial sectors will be over-represented in the sample. For some analyses the sample data were reweighted to provide population estimates using a standard procedure, that is the weights being calculated as:
Weight for sector i = (population for sector i x total sample)/(sample for sector i x total population)
3.4.2 Analysis
For the majority of the questions, frequency counts, percentages or mean scores for each response category were calculated.
The questionnaire included 90 questions relating to workplace transport safety control measures.
Respondents were asked to tick boxes to indicate whether the work site had implemented the identified control measure and to what extent, as well as assigning a score of effectiveness for each implemented control measure between 1 and 5. The 90 control measures were grouped into the seven categories, as listed below:
· Pedestrian safety · Traffic routes · Vehicle safety · Site safety engineering measures and signs · Safe systems of work · Training/selection · Personal protective equipment
Three scores were calculated for each of the seven categories as follows:
Implementation Score: respondents ticked a box to indicate the percentage of “appropriate places” in which the control measure was implemented.
Response Mid point percentage Yes, 100% 100%
Yes, 75-100% 87.5% Yes, 50-75% 62.5%
Yes, less than 50% 25% No, but needed 0% No, not needed n/a
Don’t know n/a
Since a response box covered a range of percentages, the mid point of that range was used in the calculation of the score. The implementation score for a category of control measures was calculated as the mean of these mid points values for all measures in the category, treating n/a as not contributing to the score.
9
Effectiveness score: this was the average of the effectiveness ratings for all control measures in the category of safety measures. ‘Not applicable’ responses were treated as not contributing to the score, and missing ratings were assigned a value of 3.
Combined implementation and effectiveness score: this was calculated as: Combined score = å(percenti x effectivei)/ åeffectivei
3.4.3 Tests of statistical significance
Some of the analyses presented in this report seek to determine whether variables such as implementation or effectiveness scores differ between industry sectors, between sizes of company, or according to the number of vehicles on site. Oneway analysis of variance was used here to establish whether there was any statistical significant association between the variables. Having detected a significant association, a technique attributable to Duncan (1975) was used to explore which industry sectors, company sizes etc were responsible for the effect. This technique ensures that the ‘type – 1 error rate’ is maintained at the desired level (in this case 5 per cent) regardless of how many comparisons are made.
10
4. RESULTS
Questionnaires were mailed to 2000 randomly selected companies of varying industry sector and company size. 63 questionnaires were returned to TRL as undelivered.
In total 275 companies responded to the questionnaire. 226 companies answered all questions and 49 companies only answered section A. Table 1 shows the population of industries, the achieved sample and the weighting factors referred to in section 3.4.1.
Table 1 Population of industries, achieved sample and weighting factors
Question A1 – What is your role within this organisation?
Table 2 identifies the roles of the questionnaire respondents. The responses to the response option ‘other’ included several similar roles. Thus a new category was formed 'Director/Owner' which included director, managing director, owner, company owner, proprietor, working partner, works director. The remaining responses were kept as 'other'.
11
Table 2 The roles of the questionnaire respondents
Response Category Middle Manager Safety Advisor
Safety/ Risk Manager Senior Manager
Shop Floor Worker Supervisor
Transport Manager Director/ Owner
Other
Number of responses 16 29 54 74 1 2
11 43 17
Percentage 6.5% 11.7% 21.9% 30% 0.4% 0.8% 4.5%
17.4% 6.9%
It can be seen from the above table that the majority of respondents were senior managers within the participating organisation. A large number of safety or risk managers also responded.
4.2 AGE OF COMPANY AND PREMISES
Question A2 – How many years has the company been established? Question A3 – How many years has the company been operating from this site? Question A4 – How old are the buildings on this site, within which your company operates?
Responses to these questions are summarised in Table 3.
Table 3 Responses to questions A2, A3 and A4.
Number of responses for each response category (%) 0-2 3-5 6-10 11-15 16-25 26-40 Over
QA2. Number of years the company has been established?
QA3. Number of years the company has been operating from this site?
QA4. The age of the buildings on the site?
6 2.4%
25 9.8%
29 8.4%
35 13.9%
51 20%
38 11%
90 35.7%
81 31.9%
43 12.5%
21% 8.3%
20 7.9%
49 11.3%
33 13%
30 11.8%
50 14.5%
23 9.1%
16 6.3%
53 15.4%
44 17.5%
31 12.2%
83 24.1%
The majority of responding companies have been established between six and ten years, with only 2% being less than 2 years old.
32% of the buildings on the responding companies premises have been built in the last ten years. This is a positive factor as they ought to have been built to incorporate the requirements of the six pack regulations. However, 68% of the buildings are over ten years old, with 24% of all buildings being over 40 years old.
12
40
4.3 SIZE OF ORGANISATION
4.3.1 Employees
Question A5 - How many employees are there within the company?
It can be seen from Table 4 that the majority of responding companies have less than 10 employees. However there is a range of company size across the sample, with the largest company having 6000 employees.
Table 4 Number of employees in the responding companies in each industry sector
0-10 11-20 21-40 Number of permanent staff
41-60 61-100 101-200 201-1k 1001-6k TOTAL Brick/cement Builders
Brick/cement Builders merchant Construction Docks Drinks Engineering Food Freight transport Glass/ceramic Hospitals Paper Printing Road haulage Retail premises Rubber Plastics Scrap yards Textiles Warehouses Wholesalers Woodworking TOTAL
The majority of responding companies employ less than 10 non-permanent members of staff per month. Companies from a few industry sectors such as hospitals and glass and ceramics employ more than 100 non-permanent members of staff per month.
4.4 VEHICLES ON SITE
Question A8 – Which of the following vehicles are used at, or driven onto this work site and in what quantity?
Ten different vehicle types were identified under question A8. The respondent was required to indicate the number of vehicles and identify whether this was a daily, weekly or monthly figure. A monthly figure has been calculated for each response, so that the number of vehicles could be standardised. This assumes that there are 22 working days per month and 4 working weeks. Therefore a daily figure of 10 cars becomes 220 per month. If no frequency field was completed, it has been assumed that this is a daily figure. There had to be at least one vehicle of that category per month in order to contribute to any statistics. Table 6 shows the average monthly vehicles, by vehicle type and sector. There is also a count of the number of contributing respondents.
By a large margin, the most commonly used vehicles within the workplace are cars. Heavy goods vehicles are the next most frequently used vehicles within the workplace and dumper trucks are the least prominent vehicle within the workplace.
4.5 ACCIDENT AND INCIDENT RECORDING
Question 11 – is the following information recorded in your company: a) Accidents (damage to property) b) Injuries to people c) Near misses d) Safety objectives e) Safety performance indicators f) Spillage
Table 7 Information recorded by sample of companies
Number of responses for each response category Yes No Don’t Know Accidents 197 (90%) 19 (9%) 2 (1%) Injuries to people Near Misses
Nine per cent of responding companies do not record accidents within the workplace. A large number of companies do not record near misses, indicating a poor safety management system and reporting culture.
16
4.6 INJURY ACCIDENTS AND FATALITIES
Question 12 – over the past three years have there been any of the following vehicle accidents on your company site? a) Vehicle accidents causing death b) Vehicle accidents causing major injury (requiring the injured person to have more than three days off work) c) Vehicle accidents causing minor injury (requiring the injured person to have less than three days off work)
Table 8 Accidents reported by the survey sample and industry sector
Sector Number of vehicle Number of vehicle Number of vehicle accidents causing
death accidents causing
major injury accidents causing
minor injury Brick/cementDocks
1 4
1 3
Drinks 1 3 4 Engineering Food
1 1 2
Glass/ceramic Hospitals Paper Printing Rubber/plastics Scrap yards Warehouses
2
2 3
2 3
1 6 2 2 3 1 2
Wholesalers 1 Group Total 3 21 27
In the sample, companies from 13 industry sectors had encountered fatal, major or minor accidents. The companies from the seven remaining sectors either had not encountered any of these accidents, not recorded the accidents that had occurred or failed to complete the question. Two out of the three fatal accidents had occurred within scrap yards and the majority of major accidents had occurred at docks. Out of 275 responding companies 51 accidents had been recorded. This figure is higher than the average number of accidents recorded to the HSE. This may indicate that the companies who responded to the questionnaire have a higher reporting culture than those who did not respond.
4.7 INCIDENTS
Question 13 - Over the past three years, have there been any of the following incidents at this site involving workplace transport?
a) Objects falling from vehicles b) People falling from vehicles c) Vehicles overturning d) People struck by a vehicle e) People run over by a vehicle f) People hit by objects dislodged by vehicles g) People injured getting on or off vehicles. h) Vehicle malfunctioning causing accident or injury. i) Collision between vehicles j) Collision between vehicles and property. k) Accident or injury occurring during maintenance of vehicle l) Loading/ unloading of vehicles causing accident or injury.
17
Table 9 Total number of each incident type for sample
Incident Type Total Number Objects falling from vehicles 24 People falling from vehicles 11 Vehicles overturning 12 People struck by a vehicle 16 People run over by a vehicle 1 People hit by objects dislodged by vehicles 1 People injured getting on or off vehicles. 32 Vehicle malfunctioning causing accident or injury. 6 Collision between vehicles 36 Collision between vehicles and property. 70 Accident or injury occurring during maintenance of vehicle 4 Loading/ Unloading of vehicles causing accident or injury. 29
The majority of the incidents experienced within the responding companies involved vehicles colliding with property. Relatively few incidents have occurred where a pedestrian was injured by a moving vehicle.
18
4.8 OPINIONS ON WORKPLACE TRANSPORT SAFETY
Question B1 – Please indicate how much you agree or disagree with the following statements:
a) This company has taken appropriate steps to ensure workplace transport safety b) The workplace is rarely tidy c) The workplace is organised so vehicles and pedestrians can operate in a safe manner d) Employees understand the dangers of workplace transport e) We have a problem with reversing vehicles. f) This company has found it difficult to reduce dangers arising from workplace transport.
The respondents were asked to indicate whether they strongly agreed, agreed, neither agreed or disagreed, disagreed or strongly disagreed with each statement. The responses were scored as follows:
As discussed in section 2, the sample size means that the survey cannot be relied upon to detect as statistically significant any between-sector differences that exist, unless they are very big. That is, the survey has low statistical power for such comparisons. Nevertheless, it was thought worthwhile to test for such differences. Table 11 gives the results of a one-way analysis of variance showing that only for statements 3 and 4 were there between-sector differences significant at the p=0.05 level, though between-sector differences for statements 1 and 5 approached significance.
21
Table 11 A one-way analysis of variance to determine significant differences between industry
sectors
Sum of Squares
df Mean Square
F p.
1 This company has taken appropriate steps to ensure workplace transport safety
Between Groups
Within Groups Total
13.748
94.949 108.697
18
199 217
.764
.477
1.601 .063
2 The workplace is rarely tidy Between Groups Within Groups Total
16.557
170.039 186.595
18
201 219
.920
.846
1.087 .367
3 The workplace is organised so vehicles and pedestrians can operate in a safe
Between Groups
18.118 18 1.007 1.842 .023*
manner Within Groups Total
108.768 126.885
199 217
.547
4 Employees understand the dangers of workplace
Between Groups
14.052 18 .781 1.949 .014*
transport Within Groups Total
80.122 94.174
200 218
.401
5 We have a problem with reversing vehicles
Between Groups Within Groups Total
18.866
131.959 150.826
18
199 217
1.048
.663
1.581 .068
6 This company has found it difficult to reduce dangers arising from workplace
Between Groups
17.036 18 .946 1.109 .345
transport Within Groups 170.672 200 .853 Total 187.708 218
*difference between sectors significance at the P = 0.05 level
Tables 12.1 and 12.2 that follow use Duncan’s technique (see Section 3) to explore which industry groups give rise to these differences.
22
Table 12.1 Means for groups in homogenous subsets (computed by Duncan’s technique) “The workplace is organised so vehicles and pedestrians can operate in a safe
Table 12.1 shows that for this statement, the responses given by the freight transport, scrap yards, warehouses, engineering and construction industry sectors are significantly different from the responses given by the food, hospitals and brick cement industry sectors. Respondents in the industry sectors listed first on the above table agreed strongly that their workplace was organised so that pedestrians and vehicles could operate in a safe manner.
23
Table 12.2 Means for groups in homogenous subsets (computed by Duncan’s technique)
“Employees understand the dangers of workplace transport”
The table above reveals that the responses for the industry sectors freight transport, road haulage, retail premises and scrap yards were statistically significantly more positive than those of the industry sector brick/cement.
24
4.9 WORKPLACE TRANSPORT SAFETY MEASURES
Question B2 – Respondents were asked to indicate whether their company had conducted certain measures to control workplace transport, for example regularly inspecting vehicles.
Table 13 Responses to question B2 about whether certain control measures have been
implemented
Number of responses and percentage of total responses for that question
Control measure Yes No Don’t Not Applicable Know
A risk assessment has been 113 69 7 28 conducted for our workplace (52%) (32%) (3%) (13%) transport Traffic and warning signs in the 70 79 4 66 workplace are the same as those (32%) (36%) (2%) (30%) found on public highways. Regular inspections and services are 193 7 4 16 carried out on all vehicles, in (88%) (3%) (2%) (7%) accordance with manufacturer’s recommendations. Control of vehicle movements is a 113 59 11 33 priority within this organisation. (52%) (27%) (5%) (16%) Documented daily/ weekly safety 115 60 13 31 checks are conducted on vehicles. (53%) (27%) (6%) (14%) Persons required to drive company 116 65 12 26 vehicles have their driving licence (53%) (30%) (5%) (12%) checked annually.
Over one quarter of the responding companies have not conducted a risk assessment for their workplace transport and over 50% of companies do not have traffic signs that are the same as those found on public highways. However, almost all participating companies reported conducting regular inspections of their vehicles. 53% of companies responded affirmatively to the other three items, that is: the control of vehicle movements is a priority within their organisation; documented daily/ weekly safety checks are conducted on vehicles; persons required to drive company vehicles have their driving licence checked annually.
25
4.10 AWARENESS OF LEGISLATION
Question C1 – Respondents were asked to tick the legislation they felt was appropriate to their company.
Table 14 Overall awareness of health and safety legislation
Legislation Health and Safety at Work Act 1974
Management of Health and Safety at Work Regulations 1999 Workplace (Health, Safety and Welfare) Regulations 1992 Provision and Use of Work Equipment Regulations 1998
Construction (Health, Safety and Welfare) Regulations 1996 Traffic Signs Regulations and General Directions 1994 Reporting of Injuries, Diseases and Dangerous Occurrences, 1995
Number of responses in each category and percentage of total responses for that question.
Yes No Don’t Know 207 (74%) 4 (1%) 68 (25%)
190 (89%) 6 (3%) 17 (8%)
190 (89%) 6 (3%) 18 (8%)
160 (76%) 28 (13%) 22 (11%)
73 (36%) 99 (49%) 29 (15%)
62 (30%) 106 (52%) 36 (18%)
184 (85%) 14 (6%) 18 (9%)
An encouraging number of companies claimed to be familiar with The Health and Safety at Work Act and the six pack regulations. However, although 190 companies said they were familiar with The Management of Health and Safety at Work Regulations 1999, only 113 had conducted a risk assessment. This suggests that either respondents felt they ought to be familiar with the regulations and were not, or they were familiar with the regulations but were not compliant.
4.11 IMPLEMENTATION AND EFFECTIVENESS OF WORKPLACE TRANSPORT SAFETY CONTROL MEASURES
Question D1 – Control measures for pedestrian safety Question D2 – Control measures for traffic routes Question D3 – Control measures for vehicle safety Question D4 – Site safety engineering measures and signs for workplace transport safety Question D5 – Safe systems of work for workplace transport safety Question D6 – Training and selection for workplace transport safety Question D7 – Personal protective equipment for workplace transport safety
4.11.1 All sectors combined
A number of control measures were identified for each question and respondents were asked to indicate whether their companies had implemented the control measure, to what extent, and the perceived effectiveness of that measure. Table 15 shows the control measure which has been implemented by the greatest number of companies and the average extent to which it has been implemented at those companies, and the control measure which has been implemented by the fewest companies and the average extent to which it has been implemented. The
26
table also shows the control measure that was perceived as the most effective and the least effective by the companies that had implemented the control measure.
Table 15 The most and least common control measure and the most and least effective control
measure for each category of control measure.
Question Most Least Most effective Least Common Common Effective
Pedestrian safety Separate vehicle,
pedestrian and public doors
(130 companies
implemented the measure in
72.3% of all
Pedestrian deterrent
paving (25 companies
implemented the measure in
32% of all necessary
places)
Separate vehicle,
pedestrian and public doors
(mean score = 3.6)
Subways/ footbridges for
pedestrians (mean score =
3.0)
necessary places)
Traffic routes Easy access for emergency vehicles (186 companies
implemented the measure in
92% of all
Safety banks to prevent
vehicles from overturning (29
companies implemented
the measure in
Forklift truck routes
avoiding public roads (mean score = 4.0)
Mirrors on vehicles to aid visibility (mean
score = 3.2)
necessary places)
30.2% of all necessary
places) Vehicle safety Suitable and
effective CCTV on
vehicles to aid Suitable and
effective Radar sensors to warn drivers
brakes on vehicles (198 companies on 98.7% of the necessary vehicles)
reversing (22 companies on
25% of the necessary vehicles)
brakes on vehicles (mean
score = 4.1)
if reversing too close to
vehicles (mean score = 3.2)
Site safety engineering measures and signs
Clearly displayed
speed limits (112
companies implemented
the measure in
Speed activated
warning signs (22 companies implemented
the measure in 34.7% of all
Guide humps installed in
HGV parking bays (mean score = 3.6)
Speed activated
warning signs (mean score =
3.1)
73.1% of all necessary
places)
necessary places)
Safe systems of work Hours driven by each driver monitored and regular breaks provided (107
companies implemented
the measure in 58.1% of all
Operational procedures to protect driver
during un/loading of HGV’s (98 companies
implemented the measure in
Restriction of vehicle
movement when known
influx of personnel
(mean score = 3.8)
Hours driven by each driver monitored and regular breaks
provided (mean score =
3.2)
necessary situations)
86.7% of all necessary situations)
27
Training and selection Suitable selection
process for drivers (153 companies
implemented the measure in
Impairment testing of
drivers (80 companies test drivers 33.8% of the time)
Suitable selection
process for drivers (mean score = 3.7)
Impairment testing of
drivers (mean score = 3.1)
85.3% of all necessary
cases) Personal protective equipment
Provision of necessary
PPE for staff
High visibility clothing for
workers in all
Steel toe capped boots
for all
High visibility clothing for
workers in all and visitors
(140 companies
implement the 91% of all
transport areas (124
companies implement the
measure in
employees (mean score =
3.8)
transport areas (mean score =
3.5)
necessary situations)
73.9% of all necessary situations)
It can be seen from Table 15 that the control measure implemented by the largest number of companies, is not necessarily the control measure that has been implemented to the greatest extent by the companies who have implemented it. For example 107 companies have implemented regular breaks and monitoring of hours but have only implemented these in 58% of the places that are necessary. More detailed data can be found in Appendix 3.
Further analysis was then conducted to determine whether variables such as industry sector, number and type of accident, number of vehicles or size of company had any significant effect on the control measures implemented.
As explained in the methodology section, control measures were grouped into the seven categories of pedestrian safety, traffic routes, vehicle safety, site safety engineering measures and signs, safe systems of work, training and selection and personal protective equipment. For each control measure category there are three figures, each calculated as described in section 2.
a) percentage implementation b) effectiveness score c) combined implementation/ effectiveness score
4.11.2 Control measures and sector
Table 16 The average mid point of responses for each control measure category
Table 16 shows the percentage implementation score for each category of control measure in each sector, together with the weighted score that estimates the overall population score for the industry sectors covered by the sample. The implementation score is the average extent to which the group of control measures have been implemented by those companies who have indicated that the control measures are applicable to their company.
29
Tables 17 and 18 present the effectiveness scores and the combined implementation/ effectiveness scores, in the same way. Table 17 shows that the most effective control measure category is vehicle safety as this scored an average effectiveness of 3.87. Table 18 shows that when effectiveness and the extent to which a control measure has been implemented are combined, vehicle safety scores the highest.
Table 17 Average effectiveness scores for the control measure categories.
Again, although the sample size means that the survey cannot be relied upon to detect between sector differences it was thought worthwhile to conduct a one-way analysis of variance to attempt to detect such differences. The result is shown in Table 19.
Table 19 Statistically significant findings from a one-way analysis of variance to identify
differences between the industry sectors
Sum of Squares
df Mean Square
F p.
Pedestrian safety effectiveness
Between Groups 19.805 18 1.100 1.781 .032
Within Groups 96.397 156 .618 Total 116.202 174
Safe systems of work implementation
Between Groups
Within Groups
35391.385
175674.840
18
166
1966.188
1058.282
1.858 .023
Total 211066.225 184 Safe systems of work combined
Between Groups 35162.716 18 1953.484 1.847 .024
implementation/ effectiveness
Within Groups 175552.530 166 1057.545 Total 210715.247 184
Personal protective equipment implementation
Between Groups
Within Groups
19220.092
89067.185
18
160
1067.783
556.670
1.918 .018
Total 108287.277 178 Personal protective equipment weighted
Between Groups 19488.446 18 1082.691 2.034 .011
average Within Groups 85176.530 160 532.353 Total 104664.975 178
It can be seen from Table 19 that there are significant differences between industry sectors for the perceived effectiveness of control measures for pedestrian safety, the extent control measures have been implemented for safe systems of work and personal protective equipment, and the combination implementation/ effectiveness score for safe systems of work and personal protective equipment.
Duncan’s technique was used to identify which industry sectors were responsible for these differences. Tables 20.1 to 20.5 show the results.
32
Table 20.1 Means for groups in homogenous subsets (computed by Duncan’s technique)
Pedestrian safety effectiveness
Industry Sector Drinks Wholesalers Woodworking Food Retail premises Brick/cement Scrap yards Freight transport Docks Hospitals Paper Construction Builders merchants Rubber/plastics Road haulage Printing Warehouses Engineering Glass/ceramic
Industry sectors drink, wholesale, woodwork and food have a lower perception of the effectiveness of pedestrian safety control measures than the glass/ceramic industry sector.
33
Table 20.2 Means for groups in homogenous subsets (computed by Duncan’s technique)
Safe systems of work implementation
Industry sector Brick/cement Engineering Drinks Construction Rubber/plastics Woodworking Food Hospitals Builders merchants Glass/ceramic Retail premises Warehouses Scrap yards Docks Road haulage Wholesalers Paper Printing Freight transport
Industry sectors brick/cement, engineering and drinks have fewer safe systems of work implemented to control workplace transport than industry sectors wholesale, paper printing and freight transport.
Table 20.3 Means for groups in homogenous subsets (computed by Duncan’s technique)
Safe systems of work combined implementation/ effectiveness score
Subset Industry sector 1 2 3 Engineering Brick/cement Drinks
7 7 15
40.402 41.974 42.375
41.974 42.375
Construction 10 49.107 49.107 49.107 Rubber/plastics Woodworking Hospitals Food
19 6 21 16
51.723 57.670 60.026 62.444
51.723 57.670 60.026 62.444
51.723 57.670 60.026 62.444
Retail premises Builders
6 6
65.931 66.303
65.931 66.303
65.931 66.303
merchants Glass/ceramic Scrap yards Docks
12 12 6
67.991 74.280 76.131
67.991 74.280 76.131
67.991 74.280 76.131
Warehouses 16 76.160 76.160 76.160 Road haulage Paper Printing Wholesalers
2 12 3 6
77.888 83.398 83.796
77.888 83.398 83.796 84.886
77.888 83.398 83.796 84.886
Freight transport 3 89.137
34
Freight transport and wholesale industry sectors had lower combined implementation/ effectiveness scores than the engineering, brick/ cement and drink sectors.
Table 20.4 Means for groups in homogenous subsets (computed by Duncan’s technique)
Personal protective equipment implementation
Industry Sector Printing Road haulage Hospitals Rubber/plastics Wholesalers Construction Drinks Food Scrap yards Builders merchants Paper Woodworking Glass/ceramic Retail premises Docks Warehouses Brick/cement Engineering Freight transport
Printing and road haulage industry sectors implement significantly fewer personal protective equipment rules for their exposed employees than any other sampled industry sector.
35
Table 20.5 Means for groups in homogenous subsets (computed by Duncan’s technique)
Personal protective equipment weighted average
Industry Sector Printing Road haulage Hospitals Rubber/plastics Wholesalers Construction Drinks Food Scrap yards Builders merchants Woodworking Paper Retail premises Docks Glass/ceramic Brick/cement Warehouses Engineering Freight transport
Printing and road haulage industry sectors had a lower combined implementation/ effectiveness scores than the other sampled industries.
4.12 CONTROL MEASURES AND ACCIDENTS.
Information was requested in the questionnaire about the number of fatal accidents, major accidents and minor accidents in the past three years due to workplace transport. Respondents were asked to tick boxes, yes, no or don’t know and if they had ticked yes to state the number of that accident type encountered. In the following analysis, the accident types have been combined. For example, if a company had encountered any accidents of any type, their overall response was recorded as ‘yes’. The table below shows how the yes, no or don’t know responses were combined.
Table 21 Combinations of answers and the response used for analysis.
Fatal Accident Major Accident Minor Accident Overall response Yes No/ Don’t Know No/ Don’t Know No
Site safety engineering measures and signs implementation YesNo
37 130
71.3 55.1
Don't know 2 77.7 Total 169 58.9
Site safety engineering measures and signs effectiveness YesNo
37 130
3.4 3.2
Don't know 2 3.4 Total 169 3.3
Site safety engineering measures and signs combined Yes 37 72.8 implementation/ effectiveness score No 130 56.0
Don't know 2 81.4 Total 169 60.0
Safe systems of work implementation YesNo
38 145
65.7 59.5
Don't know 2 75.0 Total 185 60.9
37
Accident? N Mean Safe systems of work effectiveness Yes
No 38
145 3.5 3.5
Don't know 2 3.6 Total 185 3.5
Safe systems of work combined implementation/ Yes 38 67.2 effectiveness score
No 145 61.6 Don't know 2 80.1 Total 185 63.0
Personal protective equipment implementation YesNo
36 140
80.7 84.3
Don't know 3 95.8 Total 179 83.8
Personal protective equipment effectiveness YesNo
36 140
3.8 3.6
Don't know 3 3.2 Total 179 3.7
Personal protective equipment combined implementation/ Yes 36 82.0 effectiveness score
No 140 85.3 Don't know 3 97.4 Total 179 84.8
Training implementation YesNo
38 142
71.5 60.7
Don't know 3 73.0 Total 183 63.1
Training effectiveness YesNo
38 142
3.5 3.4
Don't know 3 3.2 Total 183 3.4
Training combined implementation/ effectiveness score YesNo
38 142
73.0 62.2
Don't know 3 73.0 Total 183 64.6
A one way analysis variance was then used to determine whether the number of accidents encountered by companies was significantly affected by the control measures implemented and their perceived effectiveness. Results are shown in Table 23.
38
Table 23 Significant findings from a one way variance to establish significant association
between control measures implemented and accidents encountered
Sum of df Mean Square F Sig. Squares
Site safety engineering Between Groups 8246.218 2 4123.109 3.403 .036 measures and signs implementation
Within Groups 201124.200 166 1211.592 Total 209370.418 168
Site safety engineering Between Groups 9011.330 2 4505.665 3.673 .027 measures and signs combined implementation/ effectiveness score.
Within Groups 203653.672 166 1226.829 Total 212665.001 168
The above shows that the implementation of site safety engineering measures and signs is associated with the number of accidents encountered by companies. Table 22 reveals that, on average site safety engineering measures and signs are implemented in 71.3% of all places necessary in organisations who have encountered accidents and only in 55.1% of all necessary places in companies that have not encountered accidents. Since it is unlikely that signs make the workplace less safe, this finding suggests that ‘high-risk’ companies tend to install more signs, perhaps as a response to risk assessments or to accidents themselves. Some control measure categories do not reveal this pattern. For example, in the pedestrian safety category, the extent to which control measures are implemented is higher in companies that have not encountered accidents, than in those who have. This therefore suggests that the control measures that have been implemented in these companies are effective. However, this statistically is not a significant effect.
39
4.13 CONTROL MEASURES AND VEHICLES
Information was requested in question 8 about the types and numbers of vehicles used on the work site. The correlation between the number of vehicles and control measure categories was computed and the following statistically significant relationships found:
Table 24 Statistically significant relationships between vehicles and control measures
Control measure Vehicle type Sample Correlation Sig. level
Vehicle safety Motorcycle 79 -0.25 <0.05 effectiveness Vehicle safety Cars 177 -0.25 <0.001 implementation Vehicle safety combined Cars 177 -0.24 <0.001 implementation/ effectiveness score Site safety engineering Forklift 112 0.20 <0.05 measures and signs implementation HGV 132 0.19 <0.05 Site safety engineering Forklift 112 0.23 <0.05 measures and signs combined implementation/ effectiveness score HGV 132 0.20 <0.05 Safe systems of work Trucks 85 -0.24 <0.05 effectiveness Safe systems of work Mobile equipment 16 -0.54 <0.05 implementation Safe systems of work Mobile equipment 16 -0.62 <0.01 combined implementation/ effectiveness score Training effectiveness Forklift 127 0.20 <0.05 HGV 146 0.24 <0.01 Training implementation Forklift 127 0.19 <0.05 HGV 146 0.20 <0.05 Training combined Forklift 127 0.18 <0.05 implementation/ effectiveness score HGV 146 0.19 <0.05 Personal protective HGV 142 0.18 <0.05 equipment effectiveness Motorcycle 74 -0.31 <0.01 Trucks 87 -0.23 <0.05
A negative correlation means that as the number of vehicles increases, the effectiveness or combined score for the control measure reduces. Table 24 reveals that this is the case for vehicle safety, safe systems of work and personal protective equipment, but not for training, or site safety engineering measures and signs. The explanation may be that with higher numbers of vehicles, it is more difficult to control vehicle safety and implement safe systems of work and there is a greater input to training and site safety engineering measures and signs to redress this situation. It also seems likely that where there are very large numbers of cars on site, these will generally be customers’, patients’ or employees’ vehicles, not a suitable target for company-based vehicle safety measures.
40
4.14 CONTROL MEASURES AND THE SIZE OF THE COMPANY.
It was decided to establish whether there was a significant correlation between the number of employees within the sampled companies and the implementation and effectiveness of control measure categories. A one way variance was used here.
Table 25 Statistically significant results from a one way analysis of variance used to establish
any relationship between the number of employees in a company and the implementation and effectiveness of control measures.
Sum of Squares df Mean Square F p Site safety Between 19825.348 7 2832.193 2.406 .023 engineering Groups measures and signs implementation Site safety Between 19879.587 7 2839.941 2.372 .025 engineering Groups measures and signs combined implementation/ effectiveness score
Table 25 shows that a statistically significant relationship was found between the number of employees and the implementation of site safety engineering measures and signs to control workplace transport safety. The same was true of the combined implementation and effectiveness score for site safety engineering measures and signs. There were no statistically significant effects for other types of control measure.
As before, Duncan’s technique was used to explore where these effects occurred. Tables 26 and 27 show the results.
41
Table 26 Means for groups of homogenous subsets (computed by Duncan’s technique).
Number of employees and implementation of site safety engineering measures and signs
Tables 26 and 27 reveal that the extent to which site safety engineering measures and signs have been implemented and their implementation and effectiveness score differs between companies with under 10 employees and companies with 4160 or over 200 employees.
42
5. DISCUSSION The overall response rate was 13.8 per cent – well below the hoped-for rate of 20 to 25 per cent – and the response rate in some industry sectors was particularly low. For example only two companies responded from the textiles sector. This reduced the precision of the population estimates available from the survey, and its power to detect differences between sub-groups such as industry sectors. Nevertheless, useful information was obtained on the implementation and rated effectiveness of safety measures, and some between-sector differences were detected.
The reasons for the low response rate can only be guessed at present. Given the degree of care put into piloting the questionnaire it seems likely that factors other than questionnaire design were mainly responsible. It seems likely that the timeburden, coupled with the fact that most respondents were being asked to report less than fully satisfactory compliance with Health and Safety legislation to a survey sponsored by HSE, will have played its part in reducing the survey response. Also, some of the questions would have required respondents either to think fairly deeply about implementation and effectiveness of control measures, or to collect further information from within the company. This, too, will have tended to reduce response rate.
Even with the intended response rate of over 20 per cent, the scope for nonresponse bias in the survey was important. In general, response rates will probably have been lowest for companies with poor implementation of safety measures, and poor safety culture. If so, the survey will have tended to over-estimate the degree of implementation of workplace transport safety control measures.
This section deals, in turn with each of the identified objectives for phase 1 of the study.
5.1 WHAT TYPES OF WORKPLACE CONTROL MEASURES ARE IN PLACE TO REDUCE THE RISK FROM VEHICLE MOVEMENTS?
Before establishing the types of control measures used to reduce the risk from vehicle movements, it is important to have an insight into the types of vehicles that are in use within British industries. Table 6 shows that the vehicle most commonly present within the workplace is the car. This will primarily be because of the number of employees who drive to work. At certain times of the day, for example at the end of a shift, the movement of these vehicles and the potential for interaction with pedestrians and cyclists will need to be controlled. Visiting heavy goods vehicles are also prominent within many companies’ workplaces. Such vehicles will need different or additional control measures to minimise the hazards posed from reversing, reduced visibility and loading and unloading. Hospitals have a large number of all types of vehicles on site and present a particular hazard associated with interaction between vehicles. There are also a large number of pedestrians present within such premises, who may disrupt the measures implemented to control vehicle movements and who may be the most likely victims in any accidents.
Table 13 reveals that a majority of participating companies document daily or weekly safety checks on vehicles, and check drivers’ UK driving licenses annually. Almost all companies reported that vehicles are also regularly inspected and serviced in accordance with manufacturer recommendations. Such control
43
measures will reduce the risk of a vehicle malfunctioning and will ensure that drivers would legally be permitted to be in charge of a vehicle on the public highways. Only about half the participating companies reported that traffic and warning signs in the workplace are the same as those found on the public highway.
The most and least commonly implemented control measures for each control measure category can be seen in Table 15. Overall the control measure that has been implemented by the largest number of companies and to the greatest extent is easy access for emergency vehicles. The provision of personal protective equipment for visitors and staff has also been implemented by a large proportion of companies to a great extent. CCTV on vehicles to aid reversing and speed activated warning signs has only been implemented by 22 companies in fewer than 35% of the necessary locations. However these control measures are not a requirement under UK legislation and it is encouraging that companies have taken steps to introduce control measures beyond legislative requirements.
5.2 WHAT IS THE PERCEIVED EFFECTIVENESS OF DIFFERENT TYPES OF MEASURES THAT ARE USED TO CONTROL WORKPLACE TRANSPORT?
Table 17 shows that overall effectiveness scores (i.e. across all the industry sectors represented in the survey) were highest for the ‘vehicle safety’ category of control measure, and lowest for personal protective equipment. The individual control measures with the highest scores were suitable and effective brakes on vehicles and horns on vehicle (refer to table in Appendix 3). Those with the lowest scores were CCTV on vehicles to aid reversing and speed activated warning signs.
Degree of implementation of a control measure does not appear to be a good indicator of rated effectiveness. For example 80 companies claim to have implemented a suitable selection process for drivers but this was rated as the least effective measure. Superficially it might be expected that companies would tend to implement those control measures that they perceive to be effective, but no doubt other factors intervene, including the cost of control measures and the perceived degree of enforcement.
A further indicator of effectiveness is number of accidents. This survey covered far too small a sample to enable firm conclusions to be drawn about any relationship between accidents and control measures, but it was found that ‘site safety engineering measures and signs’ had a statistically significantly higher level of implementation in companies experiencing accidents than in other companies. Since it is unlikely that site safety engineering measures and signs have a negative effect on safety, a speculative explanation is that ‘high risk’ companies tend to implement more of these safety measures perhaps in response to risk assessments or to accidents or incidents themselves.
Table 24 shows the statistically significant relationships between number of vehicles and the implementation and effectiveness of control measures. It is interesting to note that as the number of vehicles increase the rated effectiveness of vehicle safety, safe systems of work and personal protective equipment decreases. However, as the effectiveness of these measures decrease the implementation of training, selection and site safety engineering measures and signs increases, thereby redressing the situation.
44
5.3 DOES THE SIZE OF THE COMPANY EFFECT THE TYPE OF CONTROL MEASURES IMPLEMENTED AND THE EFFECTIVENESS OF THE MEASURE?
The majority of the participating companies employ over 10 personnel. The Health and Safety Commission define small companies as having less than 50 employees and a large company having over 50 employees. Using this definition, the achieved sample contained small and large companies in the ratio 60:40. There is a tendency for the implementation and effectiveness scores to increase as the number of employees increases. Within the sample, this is true for all control measure categories but, generalising beyond the sample, the difference is statistically significant only for site safety engineering measures and signs (Table 25).
A general tendency for larger companies to implement control measures more widely is probably to be expected. It seems reasonable to assume that larger companies will tend to have more complex workplace transport safety problems, requiring a wider spectrum of control measures. They are also more likely to have a specialist health and safety functions in their management teams, better awareness of health and safety regulations and guidance, more sophisticated safety management and risk appraisal systems, and perhaps more resources to devote to control measures.
5.4 IS THE CONTROL OF VEHICLE MOVEMENTS IN THE WORKPLACE SEEN AS A HIGH PRIORITY AND HAVE STEPS BEEN TAKEN TO IDENTIFY, EVALUATE AND REDUCE THE RISKS POSED?
Table 13 shows that 41% of the responding companies feel that the control of vehicle movements in the workplace is a high priority within their organisation. 12% felt that the control of vehicles within their company was not a high priority and 4% did not know. Overall 52% of the sample said they had conducted a risk assessment for workplace transport. This indicates that companies who do recognise the importance of workplace transport safety are also taking steps to identify and evaluate the risks posed, though the survey cannot tell us which is the cause and which the effect here. Table 7 shows that over 70% of responding companies said they record accidents and injuries to people. This is a low figure considering that the reporting of injuries is a legal requirement. Table 16 shows that all sectors claim to have implemented some control measures to reduce the inherent risk of workplace transport. Table 10 reveals that on average companies report that appropriate steps have been taken to ensure workplace transport safety.
It is apparent that the companies who do not see workplace transport as a priority and have not conducted a formal risk assessment, still claim to be implementing some control measures to reduce the risk. However, it is important to realise that the implementation of control measures prior to assessing the risks may not combat the risk posed at source and may potentially give rise to additional hazards.
5.5 ARE COMPANIES AWARE OF THE CURRENT HEALTH AND SAFETY LEGISLATION APPLICABLE TO WORKPLACE TRANSPORT?
Table 14 shows that 75% of companies say they are aware of The Health and Safety at Work Act, 1974 and feel that it is appropriate to their company. Over 65% of the sampled companies also feel that the “six pack” regulations, such as The
45
Management of Health and Safety at Work Regulations, are appropriate to their company. 71% of companies record accident data but only 66% feel that the Reporting of Injuries, Diseases and Dangerous Occurrences Regulations are appropriate to their company. This may be because at the time of completing the questionnaire no reportable accidents under RIDDOR had been encountered.
Although 190 companies said they were aware of the Management of Health and Safety at Work Regulations, only 113 reported having conducted a risk assessment on their workplace transport. Presumably, the remainders of the 190 were either claiming to be aware of the legislation, when they were not or had not yet conducted a risk assessment they knew to be necessary. It seems possible that some companies may be generally aware of the legislation but not fully aware of how they apply to workplace transport safety.
The reported level of awareness of health and safety legislation by the responding companies is encouraging. Compliance with such legislation will be examined in phase two of this research.
46
6 CONCLUSIONS FOR PHASE ONE There is a reasonably high reported level of awareness of health and safety legislation, but a sizeable minority of companies have little awareness, and do not record accident data. About 40% of the companies who reported being aware of the Management of Health and Safety at Work Regulations said they had not conducted a risk assessment of workplace transport. These finding suggest that there is considerable scope for improving the promulgation of regulations, guidance on good practice, and enforcement.
As the number of vehicles on site increases, the rated effectiveness of vehicle safety measures, safe systems of work, and personal protective equipment decreases. However, the use of training, selection and site safety engineering measures and signs tends to increase. It may be that, with many vehicles on site, the complexity of the safety problem is seen to require these additional types of measure. Also, some sites with many vehicles will be ones in which companybased vehicle safety measures are inappropriate as the cars are owned and maintained outside the control of the organisation.
Control of vehicle movements in the workplace seen as a high priority for 41% of the sampled companies, and 52% of the sample said they had conducted risk assessments to identify and evaluate the risks posed. All participating companies have implemented some measures to control workplace transport safety. The measures implemented by the most companies are suitable and effective brakes on vehicles, horns on vehicles and suitable lighting in the workplace.
There was a tendency for implementation and effectiveness scores for workplace transport safety control measures to increase as number of employees increased. Such a tendency is probably to be expected since larger companies will tend to have more complex workplace transport safety problems requiring a wider spectrum of control measures. However, another part of the explanation may be that larger companies have better organised and better resourced health and safety functions, suggesting that the smaller companies may be a particularly important target for future efforts to improve workplace transport safety.
Phase 2 of this project will explore further the above issues, and other issues raised by the work to date.
7. AIMS FOR PHASE TWO § To evaluate compliance with health and safety legislation that is applicable to
workplace transport safety.
§ To review the effectiveness of different types of control measures, their effectiveness and cost of implementation.
§ To gain an understanding of whether the control of vehicle movements in workplaces are neglected and if so, why?
§ To determine the steps taken by companies to identify, evaluate and reduce the risks posed by workplace transport.
§ To examine, where appropriate the interface of workplace transport with the public and extended workforce.
47
§ Establish best practice for controlling workplace transport.
§ To provide six case studies for future HSE publications.
20 organisations will be selected from the 65 companies who have volunteered to participate in phase two. Each company will be visited and the above objectives fulfilled through inspection, investigation, assessment, observation and interviewing.
48
8. REFERENCES
Duncan D B (1975) t-tests and intervals for comparisons suggested by the data,Biometrics, 31, pp 339-359
Health and Safety Commission (1999), Newsletter, Issue 127, October
Health and Safety at Work Act (1974). London: HMSO
Statutory Instrument (1999) Management of health and safety at work regulations No 3242 London: HMSO
Statutory Instrument (1995) The reporting of injuries, diseases and dangerous occurrences regulations No. 3163 London: HMSO
Statutory Instrument (1996) The construction (health, safety and welfare)regulations No. 1592 London: HMSO
Statutory Instrument (1998) The provision and use of work equipment regulations No. 3163 London: HMSO
HSE (1992) Workplace (health, safety and welfare): Approved code of practice. L24 HSE Books
HSE (1995) Workplace transport safety: Guidance for employers. HS(G)136 London: HMSO
Institute of Occupational Medicine (1998) The evaluation of the Six-Pack Regulations 1992. HSE Contract Research Report 177/1998.
49
APPENDIX ONE – DETAILED QUESTIONNAIRE DESIGN.
A. LITERATURE SEARCH.
Before commencing on the questionnaire design, it was vital to have a complete understanding of the hazards associated with workplace transport and the control measures that could be implemented in the workplace to mitigate these risks. It was also essential to be aware of all relevant legislation and guidance relating to workplace transport safety. It was thought that control measures recommended in such documents could have shaped the transport safety systems of some of the organisations being researched.
B. BRAINSTORMING.
The objective of the brainstorming session was to create a list of all control measures that could potentially reduce the inherent risk posed by workplace transport. The key technical members of the project team undertook the session and were encouraged to use previous experience from site investigations and research as well as knowledge gained from literature reviews and professional training to create the required list of control measures. It was decided that the control measures should be categorised into five main groups:
· Vehicle Safety · Workplace Safety · Safe Systems of Work · Training · Personal Protective Equipment.
A total of 130 control measures were listed, each fitting into one of the identified categories. The measures ranged from those thought to be relatively inexpensive, simple to implement and generally in wide use, such as mirrors on walls to aid visibility at intersections, to measures such as crash data recorders which may be less common amongst the participating companies.
The list of control measures is intended to be used both in the phase one questionnaire survey and in the site visits to be conducted in phase two of the research.
C. INITIAL QUESTIONNAIRE DESIGN
A high response rate was not expected from the questionnaire because of the nature of the information being sought and the company’s perceived implications with providing it. It was therefore important to maximise the response rate through ensuring minimal burden on the respondent, encouraging response through the careful design of a covering letter and informing the participant that there would be no repercussions by assuring complete confidentiality and anonymity.
A time limit of 20 minutes was aimed for, to maximise the response rate. It was decided that an eight page questionnaire could be completed within this time frame.
The questionnaire was divided into four main sections:
50
a) General. This section covered demographics and general information about the age and size of premises, number of employees, types of vehicles used on the premises, basic information about the company’s safety management system and accident data.
b) Workplace Transport. The questions in this section focused on the company’s overall attitude towards workplace transport safety, including whether risk assessments had been conducted, general control measures such as vehicle checks and company attitudes towards and their understanding of the safety issues surrounding workplace transport.
c) Legislation. One of the aims of the research is to determine the extent to which companies are complying with relevant workplace transport legislation. This section listed seven pieces of appropriate legislation and asks the participant to indicate whether they are appropriate to the company.
d) Control Measures. The control measures listed in the brainstorming session had been categorised into 7 categories.
- Pedestrian Safety- Traffic Routes - Vehicle Safety- Safety Measures and Signs - Safe Systems of Work- Training/ Selection - Personal Protective Equipment
It was felt that these categories were suitable for the questionnaire, for ease of answering the questions and ease of analysis. For each control measure listed the respondent was required to indicate whether or not their company had implemented the control measure and the perceived effectiveness of it.
It was important that this section did not place an unnecessary burden on the respondent, so some of the control measures from the original brainstorming list were excluded. The control measures not included in this phase will be investigated during the site visits in Phase Two of the research.
The questionnaire included a final section, where respondents could complete company information, if they were prepared to participate in the subsequent phase of the project.
D. PILOTING
Due to the complexity of the research, it was deemed essential to thoroughly pilot the questionnaire. Two piloting procedures were conducted:
(a) Pilot One:
The aims of the primary pilot were as follows:
§ To identify any misleading or irrelevant questions and instructions.
§ To identify any questions that needed further response categories
§ To estimate the time taken to complete the questionnaire.
51
§ To establish who to address the questionnaire and letter to in the main survey.
§ To discuss the company’s need for anonymity and confidentiality and establish how this should be dealt with in the main survey.
§ To discuss how to persuade companies to respond and how to assure them that there will be no repercussions.
§ To discuss how the main survey should describe its sponsorship, that is, should the HSE sponsorship be stressed, or would it be preferable to emphasise TRL’s independent status?
§ To identify any further relevant questions or additional control measures.
§ To discuss how to ensure that the questions were answered honestly and openly.
§ To determine how easy it was for respondents to score the effectiveness of each of the control measures.
Ten local companies were selected from the internet and local business guides. It was deemed important for the pilot companies to reflect the industries to be included in the final sample. Therefore, the companies selected were of varying size and age of premises and from different industry sectors. Each of the ten selected companies were telephoned and asked if they would be prepared to participate in this pilot study. After agreement was given, an appointment was made to visit the company in the subsequent two weeks. A questionnaire and letter, reminding them of the appointment booked, was mailed to each of the companies. All of the companies contacted agreed to participate. (The mailed questionnaire can be seen in the appendix 2 – questionnaire 1)
The main comments and suggestions made by the pilot companies are listed below:
§ Several of the pilot companies were concerned about the confidentiality of the information they were giving. Although confidentiality and anonymity were stressed in the opening paragraph of the questionnaire, it was felt that this was not sufficient. It was, therefore decided that the words ‘strictest confidence’ and ‘complete anonymity’ should be enhanced on the questionnaire in bold typeface and a footer should be added on every page reminding the respondent that the questionnaire is anonymous and confidential.
§ Question A1 asks about the role of the respondent within the participating organisation. It was decided that as the questionnaire focused on transport safety as opposed to general safety, the inclusion of ‘transport manager’ as a response option would be appropriate. However, all participating pilot companies agreed that the survey should be addressed to the generic title ‘safety manager’.
§ It was decided that question A4 needed to clarify that the buildings being referred to were the ones situated on that site.
52
§ Question A5 requested the respondent to state the number of employees within the company. Several of the pilot companies thought that a larger category than ‘over 200’ should be included in the options.
§ Question A6 asked about contractors working at the company. It was felt that this should be changed to ‘non-permanent members of staff’ as the term ‘contractor’ was taken to mean only persons such as plumbers and electricians and not agency staff, for example.
§ It was thought that Question A7 needed some clarification about the vehicles to be included as well as those to be excluded from the count. It was also deemed necessary to clarify the meanings of the terms ‘mobile equipment’ and ‘selfpropelled machinery’. Another issue raised for this question was the fact that some of the vehicles using the site may only visit one a month, whilst others may be in use every day, therefore leading to confusion when completing the ‘number of vehicles’ column. A ‘delete as appropriate’ column was added, so the respondent could specify whether there were 10 vehicles in total, for example, or per day or per week etc.
§ Within the pilot companies, there was one company that did not own any vehicles and did not have any deliveries. The respondent stated that if he had received this questionnaire speculatively he would not have completed or returned it. It was decided that a statement should be added at the bottom of question A7, asking respondents who had ‘ticked no to all of the above vehicles’, to return the questionnaire to TRL. It was felt that receiving partially completed questionnaires from companies with no vehicles was more useful to the research than obtaining an inexplicably high number of non-respondents.
§ Question A9 required the respondent to estimate the percentage of the site as a whole that is accessible to vehicles. Several respondents felt that this was an ambiguous question to answer, as some vehicles could access all areas, whilst others may only be able to access 10%. To reduce this ambiguity, an additional column was added to question A7, asking the respondent to specify the amount of site accessible for each of the identified vehicles.
§ Question A11 enquires about the safety related information that may be recorded within the organisation. One pilot company suggested that organisations might also record spillages as these may contribute to subsequent transport related incidents.
§ Questions A12 and A13 required the participant to supply accident information for the last 10 years. It was suggested by several of the pilot companies that this should be reduced to 3 years. Reasons given for this were
a) there may have bee significant changes to the workplace and safety systems in the last ten years, thereby rendering the accident records meaningless,
b) downloading accident/ incident information for the last 10 years is time consuming and may reduce response rate and
c) companies may not have details of accidents dating back that far.
§ One of the pilot participants revealed that their most common incident type involves vehicles colliding with property. This option was therefore added to question A13.
53
§ Three issues were raised regarding question B2. Firstly the participants were unsure of the term ‘penalised’. It was deemed more appropriate to use the word ‘disciplined’. Secondly, several of the pilot participants thought that all companies within the final sample would agree that daily safety checks are conducted on their vehicles. However by adding the word ‘documented’ before the statement, it ensures that this is an implemented company procedure as opposed to a presumed action. Thirdly, one pilot company revealed that their transport policy required all company drivers to have their driving license checked annually. It was felt that this revealed good practice and should be added to the question.
§ One pilot company noticed that some of the dates on legislation in question C1 were incorrect. This was updated immediately.
§ All participating pilot companies had problems completing section D regarding workplace transport control measures. The main issue raised was with the options ‘yes’, ‘no’, ‘don’t know’ and ‘not needed’. Many of the identified control measures may be partially implemented but not all over the site. For example, barriers may have been positioned where previous incidents had occurred but not on all areas of the site where vehicles are present. After serious consideration, it was decided that the best option for solving this problem was to increase the response options. Respondents would be required to indicate the extent to which the control measure in question had been implemented. The response, ‘Yes, 100%’ would indicate that the control measure had been implemented in all necessary places. The response ‘no’ was also divided into two categories, these being ‘no, but needed’ and ‘no, not needed’.
The pilot companies were also concerned about the column regarding the effectiveness of the identified control measure. It was decided that the respondent would be more likely to complete this column if the scale was reduced from 10 to 5 points and they were presented with the numbers to circle.
§ Several of the pilot companies also suggested that an additional ‘further comments’ section would be useful. It was felt that this would allow respondents to clarify any answers given throughout the questionnaire.
§ The pilot companies were asked whether they felt it was appropriate to identify that the questionnaire is for the HSE. All companies, without exception felt that a higher response rate would be achieved if the respondents were unaware of the HSE involvement.
A meeting was held on March 1st 2001 with Nick Ratty from the HSE and further suggestions were made about the questionnaire. Two main issues arose from the meeting. Firstly, in question A1, job titles should not include the terms “not safety” as safety is the responsibility if all employers and employees. Secondly, question A7 excluded vehicles used to travel to and from work. It was felt that as this was likely to be a major part of the company’s traffic flow, such vehicles should be included in the research.
All comments made by the pilot companies and the HSE were deemed valid and a second version of the questionnaire was designed, incorporating the suggestions made. (Questionnaire 2 in appendix2 ).
54
(b) Pilot Two:
The aims of pilot two were similar to those of pilot one, with the emphasis being on ensuring the highest response rates possible. Issues such as who to address the questionnaire to, anonymity and confidentiality, and whether to stress the involvement with the HSE were focused on, as opposed to the technical content of the questionnaire. The aims were as follows:
§ To identify whether the questionnaire reaches the appropriate person by addressing it to the ‘safety manager’.
§ To identify whether amendments made to the questionnaire after the first pilot had given rise to any misleading or inappropriate questions and to ensure that all questions could be easily interpreted and answered.
§ To discuss the company’s need for anonymity and confidentiality.
§ To discuss how to persuade companies to respond and how to assure them that there would be no repercussions.
§ To confirm that was appropriate not to stress that the questionnaire is for the HSE.
§ To identify any further relevant questions or additional control measures.
§ To discuss how to ensure that the questions were answered honestly and openly.
§ To determine whether it was easier to score effectiveness for each of the control measures when the respondent is given the categories to circle.
Twenty-five companies were selected from the internet and local business guides. The companies were chosen from a variety of industry sectors with ranging numbers of employees, to ensure that pilot was representative of the final sample selection. Each selected company was sent a copy of the questionnaire and a covering letter explaining the purpose of the research and the aims of the pilot study. The companies were informed that TRL would be contacting them by telephone to discuss the questionnaire and were requested to inform us if this was inconvenient. All companies were made aware that participation in the survey was entirely voluntary.
Twenty-five companies were contacted by telephone and 17 agreed to discuss the questionnaire. The 8 companies who were not willing to participate were asked for their reasoning behind this decision. The following reasons were given:
§ The questionnaire had not reached the company and therefore had not been completed.
§ The questionnaire was not relevant to their company.
§ The company did not have time to complete the questionnaire in the given time frame.
§ The company was concerned that if they participated in this survey, they would be included in all subsequent TRL surveys.
55
§ The company was concerned that TRL was trying to sell them products to reduce the risks posed by their workplace transport.
It was important to ensure that the highest possible response rate was achieved. Therefore changes were made to the questionnaire and covering letter, in light of the above comments, to minimise the number of non-participating companies in the main study. The changes made were as follows:
§ A sentence was added to the covering letter in bold typeface stating ‘ We urge your company to respond even if workplace transport does not seem to be applicable to your line of business’.
§ It was stressed that TRL is an independent centre for the study of transport and the unabbreviated name of ‘Transport Research Laboratory’ was used in place of TRL Limited. It was felt that these changes would assure companies that the research is legitimate and minimise participants’ concerns about TRL selling products to reduce their workplace transport risk.
§ Amendments were made to the covering letter to assure respondents that the information they provided would only be used for the purposes of this research and not subsequent TRL studies.
The main comments and suggestions made by the pilot companies are listed below:
§ Participants of pilot one believed that a higher response rate would be achieved if the respondents were unaware of the HSE involvement. However, all participants in pilot two disagreed strongly with this belief. Participants felt that naming the HSE on the covering letters and questionnaires would legitimise the research and encourage companies to respond. Participants also felt that they would be more inclined to complete the questionnaire, knowing that the research was being conducted for a regulatory body.
§ Several pilot companies were concerned about the reference number on the questionnaire, as they felt that it put the anonymity of their responses into question. The questionnaire was therefore amended so respondents were aware that the reference number related to the industry sector as opposed to individual companies.
§ The participating pilot companies were able to answer three out of four of the sections without any problems. However, the amended section D regarding workplace transport control measures was still being completed incorrectly. All participants had overlooked the column regarding the effectiveness of the control measures. It was felt that the instructions were too long and the respondents were not reading to the end of the paragraph where the scoring of effectiveness was explained. After consideration, it was decided that the most appropriate way of simplifying the instructions was to split the paragraph into two bullet points, one for each task required. The sentence instructing the participant to score the effectiveness of the control measure from 1 to 5 was underlined to ensure that the respondent noticed it.
§ It was suggested by some of the pilot companies, that participants of the main sample may not be prepared to volunteer their company for phase two of the research without more detailed information. Care had to be taken not to
56
dramatically increase the length of the questionnaire or covering letter as this may reduce the number of responses returned. Therefore, a contact name was added to the questionnaire so concerned companies could telephone TRL and find out the necessary information.
All comments were deemed valid and the relevant changes were made to the questionnaire. The amended questionnaire was mailed to the HSE and the TRL internal technical authority for comment. No comments were made. (The amended questionnaire can be seen in appendix 2, with the covering letter – questionnaire 3).
57
58
APPENDIX TWO – QUESTIONNAIRES:
§ VERSION ONE § VERSION TWO § FINAL VERSION § COVERING LETTER
59
60
Ref No.
CONTROL MEASURES FOR WORKPLACE TRANSPORT SAFETY.
Please complete this questionnaire by ticking the appropriate boxes and writing in the spaces provided. It should only take about 20 minutes to complete. All of the information you provide will be treated in the strictest confidence and complete anonymity can be assured. Thank you for your help.
A. GENERAL
If your organisation has more than one site, please only answer for the site to which this questionnaire was addressed.
(Please tick the boxes as appropriate.)
1. What is your role within this organisation?
Safety Manager o Middle Manager (not safety) o
Safety Representative o Supervisor (not safety) o
Senior Manager (not safety) o Shop Floor Worker o
Other (Please State)
Years 0-2 3-5 6-10 11-15 16-25 26-40 Over 40
2 How many years has the company o o o o o o obeen established?
3 How many years has the company o o o o o o obeen operating from this (these) building(s)?
4 How old are the buildings within o o o o o o owhich your organisation operates? (If your company has more than one building, of different ages, please tick all appropriate boxes)
1-10 11-20 21-30 31-40 41-50 51-100 101-200 Over 200
5 How many employees are o o o o o o o othere within the company?(at this site).
6 How many contractors o o o o o o o owork in the company, on a typical day? (at this site)
61
7. Which of the following methods of transport are used within your workplace and in what quantity: (Please tick as appropriate and state numbers). Excludes vehicles used for transport to work.
Yes Cars o
Vans o
Forklift Trucks o
Heavy Goods Vehicles o
Industrial Trucks o
Mobile Equipment o
Dumpers o
Self Propelled Machinery o
Bicycles o
Motorcycles o
Other (Please State)
Number No Don’t Know o o
o o
o o
o o
o o
o o
o o
o o
o o
o o
8. What is the approximate area of this site? (Please state approximate area in sq miles/ sq metres/ dimensions in no of walking paces/ no of football pitches, for example)
9. What percentage of this area is accessible to vehicles?
0-25% o 50-75% o
25-50% o 75-100% o
10. What does your company do at these premises? (For example, manufacture ball bearings)
11. Is the following information recorded in your company: (Please tick as appropriate)
Yes Accidents (damage only) o
Injuries o
Near misses o
Safety Objectives o
Safety Performance oIndicators
No Don’t Know o o
o o
o o
o o
o o
62
12. Over the past ten years, have there been any of the following accidents within your company? (Please tick as appropriate and state number, if known).
Yes If Yes, No Don’t Know Number
Accidents causing death o o o
Accidents causing major injury (Requiring the injured person o o oto have more than three days off work)
Accidents causing minor injury (requiring the injured person o o oto have less than three days off work)
13. Over the past ten years, have there been any of the following incidents involving workplace transport (Cars/ Vans/ Fork Lift Trucks/ Lorries etc): (Please tick as appropriate and state number).
Objects falling from vehicles People falling from vehicles Vehicles overturning People struck by a vehicle People run over by a vehicle People hit by objects dislodged by vehicles People injured getting on or off vehicles.
Yes If Yes, No Don’t Know Quantity
o o o o o o o o o o o o o o o o o o o o o
Vehicle malfunctioning causing accident or injury,. Collision between vehiclesMaintenance of vehicles causing accident or injury. Loading/ Unloading of vehicles causing accident or injury.
o o o o o o o o o o o o
B. WORKPLACE TRANSPORT
1. Please indicate how much you agree or disagree with the following statements:
Strongly Agree Neither Disagree Strongly Agree Agree or Disagree
Disagree This company has taken appropriate steps to ensure workplace transport safety.
The workplace is rarely tidy.
The workplace is organised so vehicles and pedestrians can operate in a safe manner. Employees understand the dangers of workplace transport. We have a problem with reversing vehicles.
63
2. Please tick the appropriate boxes: Yes No Don’t Know
A risk assessment has been conducted for our workplace transport o o o Traffic and warning signs in the workplace are the same as those found on o o o public highways. Regular inspections and services are carried out on vehicles, in accordance o o owith manufacturer’s recommendations. Employees are penalised for having accidents. o o o
Control of vehicle movements is a priority within this organisation. o o o
Daily safety checks are conducted on vehicles. o o o
C. LEGISLATION
1. Please tick the regulations you feel are appropriate to your company:
Yes No Don’t Know Health and Safety at Work Act 1974 o o o
Management of Health and Safety at Work Regulations 1999 o o o
Workplace (Health, Safety and Welfare) Regulations 1992 o o o
Provision and Use of Work Equipment Regulations 1998 o o o
Construction (Health, Safety and Welfare) Regulations 1992 o o o
Traffic Signs Regulations and General Directions 1994 o o o
Reporting of Injuries, Diseases and Dangerous Occurrences, 1985 o o o
D. CONTROL MEASURES
The following questions relate to workplace transport safety control measures that may be found in your workplace. Please tick the appropriate boxes to indicate whether the measures have been implemented in your workplace. Indicate how effective you feel your company’s control measures are at making your workplace transport safer. Score effectiveness from 1 to 10, with 1 being not at all effective and 10 being extremely effective.
1. Pedestrian Safety Yes No Don’t Not Effectiveness Know Needed (score out of 10)
Separate vehicle and pedestrian routes o o o o 444
Separate vehicle, pedestrian and public doors o o o o 444
Subways/ footbridges for pedestrians o o o o 444
Level crossings for pedestrians o o o o 444
Dropped kerbs at all pedestrian crossing places o o o o 444
Signage to warn pedestrians of hazards o o o o 444
Pedestrian deterrent paving. o o o o 444
Safe haven for pedestrians to stand when vehicles are reversing o o o o 444
Barriers positioned so vehicles do not collide with people o o o o 444
when reversing
64
2. Traffic Routes Yes No Don’t Not Effectiveness Know Needed (score out of 10)
Crash barriers. o o o o
Suitable barriers at entrances, exits and corners o o o o
444
444
Height barriers. o o o o 444
No low wiring or lighting/ shielded pipes/ electric cables o o o o 444
Loading bays situated away from overhead cables or on steep o o o o 444
gradients Loading bay and sheeting area protected from adverse weather o o o o
444 conditions Loading bays situated away from passing traffic. o o o o
444
No forklift truck routes crossing public highways o o o o 444
Easy access for emergency vehicles o o o o 444
Sufficient, wide enough traffic routes so vehicles can pass and o o o o 444
circulate easily. One way system. o o o o
444
No blind spots or tight corners on traffic routes o o o o 444
Regular maintenance of traffic routes o o o o 444
Safety banks to prevent vehicles overturning o o o o 444
No forklift truck routes over speed bumps. o o o o 444
Wide entrances/ gates o o o o 444
Traffic routes away from vulnerable or potentially hazardous o o o o 444
structures. Safe, practical, suitable and sufficient parking areas for all o o o o
444 vehicles Suitable lighting o o o o
444
Firm, even flooring. o o o o 444
3. Vehicle Safety Yes No Don’t Not Effectiveness Know Needed (score out of 10)
Seat belt on all vehicles o o o o
Suitable and effective brakes on vehicles o o o o
444
Windscreens with wipers on vehicles. o o o o
444
444
Head lights on vehicles. o o o o 444
Horns on vehicles. o o o o
Bumpers on vehicles o o o o
444
444
Sun visors on vehicles. o o o o
Reversing warning light or sound on vehicles o o o o
444
444
Flashing amber lights on vehicles o o o o 444
65
Warning signs on vehicles, eg slow vehicle.
Control system to prevent vehicles from moving when fork lift trucks are loading or unloading Speed limiter on vehicles
Rollover protection strategy on vehicles
Mirrors on vehicles to aid visibility.
Rear lens on vehicles to aid reversing.
Radar sensors to warn drivers if reversing too near to an object.
Crash Data Recorders on Vehicles (black box technology)
Vehicle ‘skirts’ to minimise damage.
Guarding of dangerous parts on vehicles.
o
o
o
o
o
o
o
o
o
o
o
o
o
o
o
o
o
o
o
o
o
o
o
o
o
o
o
o
o
o
o
o
o
o
o
o
o
o
o
o
444
444
444
444
444
444
444
444
444
444
4. Safety Measures and Signs Yes No Don’t Not Effectiveness Know Needed (score out of 10)
Speed bumps o o o o 444
Speed activated warning signs o o o o 444
Clearly displayed speed limits o o o o 444
Clean, well maintained warning signs o o o o 444
Road markings o o o o 444
Traffic Lights o o o o 444
Vibro-lines, causing an audible signal if the vehicle crosses o o o o 444
them. Vehicle locator system so the whereabouts of vehicles are o o o o
444 known. Guide humps/ rubber stops installed in HGV parking bays o o o o
444
Mirrors on walls/ ceiling/ other structure to aid visibility o o o o 444
Variable speed limits. o o o o 444
CCTV o o o o 444
5. Safe Systems of Work Yes No Don’t Not Effectiveness Know Needed (score out of 10)
Banksman to aid reversing where appropriate. o o o o 444
Courier on vehicles to aid reversing. o o o o 444
Restricted areas for reversing o o o o 444
Exclusion of non-essential personnel from reversing areas o o o o 444
Restriction of vehicle movement when known influx of o o o o personnel
444
Overtaking restrictions. o o o o 444
66
Hours driven by each driver monitored and regular breaks provided.
Plan of workplace at entrance and appropriate points showing vehicle routes, one way systems etc.
Site procedures relayed to all visitors/ contractors
Operational procedures to protect driver during unloading/ loading of heavy goods vehicles. Parking restrictions
o
o
o
o
o
o
o
o
o
o
o
o
o
o
o
o
o
o
o
o
444
444
444
444
444
6. Training/ Selection Yes No Don’t Not Effectiveness Know Needed (score out of 10)
Thorough selection process for drivers. o o o o 444
Regular physical fitness tests. o o o o 444
Regular vision tests. o o o o 444
Impairment testing of drivers (drink/ drugs) o o o o 444
Competent operators o o o o 444
Skills training for drivers. o o o o 444
Provision of information and instruction for drivers. o o o o
Supervision of vehicles and drivers. o o o o
444
444
7. Personal Protective Equipment Yes No Don’t Not Effectiveness Know Needed (score out of 10)
Personal protective equipment for visitors. o o o o 444
Provision of protective equipment e.g. hard hats o o o o 444
High visibility clothing for workers in all transport areas o o o o 444
Steel toe capped boots for all employees. o o o o 444
Workplace clothing to avoid hazards from loose clothing. o o o o 444
Protection for drivers in adverse weather conditions. o o o o
Employee protection to prevent injury from overturning or o o o o
444
444 falling objects.
67
A small number of organisations will be invited to take part in the second phase of this research. This will involve visiting your premises and viewing some of the workplace transport control measures you have implemented. All information collected during these visits will be completely confidential and will only be used for the purposes of this research.
If you would be willing to participate in this second phase, please complete the details below.
SURNAME: INITIALS: TITLE:
JOB TITLE: WORK TEL NO.
COMPANY NAME:
ADDRESS:
POSTCODE:
Thank you for your assistance.
Please return this questionnaire to TRL Limited by April 6th in the pre-paid envelope provided.
68
Ref No.
CONTROL MEASURES FOR WORKPLACE TRANSPORT SAFETY.
Please complete this questionnaire by ticking the appropriate boxes and writing in the spaces provided. It should only take about 20 minutes to complete. All of the information you provide will be treated in the strictest confidence and complete anonymity can be assured. Thank you for your help.
A. GENERAL
If your organisation has more than one site, please only answer for the site to which this questionnaire was addressed.
(Please tick the boxes as appropriate.)
1. What is your role within this organisation?
Safety/ Risk Manager o Middle Manager o
Safety Advisor o Supervisor o
Senior Manager o Shop Floor Worker o
Transport Manager o Other (Please State)
Years 0-2 3-5 6-10 11-15 16-25 26-40 Over 40
2 How many years has the company been o o o o o o oestablished?
3 How many years has the company been operating o o o o o o ofrom this site?
4 How old are the buildings on this site within which o o o o o o oyour organisation operates? (If your company has more than one building, of different ages, please tick all appropriate boxes)
0-10 11-20 21-40 41-60 61-100 101- Over If over 200, 200 200 Please state no:
5 How many employees are there o o o o o o owithin the company? (at thissite).
6 How many non-permanent members of staff (agency,
o o o o o o o contractors etc.) work at thissite, in a typical month? (at thissite)
7. What tasks do the non-permanent members of staff undertake at this site?
ANONYMOUS AND CONFIDENTIAL 69
7. Which of the following vehicles are used at this work site, (both inside and outside buildings) and in what quantity: Please include all visiting vehicles e.g. delivery. (Please tick as appropriate and state amount either in total or per day/ week etc, if known)
How much of the work site is accessible to this vehicle?
Yes Number No 0-25% 25-50% 50-75% 75-100%
Cars o total/ per day/ week/ month o o o o o(Delete as appropriate)
Vans o total/ per day/ week/ month o o o o o
Forklift Trucks o total/ per day/ week/ month o o o o o
Heavy Goods Vehicles o total/ per day/ week/ month o o o o o
Trucks/ vans for carrying o total/ per day/ week/ month o o o o oequipment Mobile Equipment eg tugs o total/ per day/ week/ month o o o o oDumper Trucks o total/ per day/ week/ month o o o o o
Self Propelled Machinery o total/ per day/ week/ month o o o o oeg floor cleanersBicycles o total/ per day/ week/ month o o o o o
Motorcycles o total/ per day/ week/ month o o o o o
Other (Please State)
If you have ticked no to all of the above vehicles, please return this questionnaire to TRL in the pre-paid envelope.
8. What is the approximate area of this site? (Please state approximate area in sq miles/ sq. metres/ dimensions in no of walking paces/ no of football pitches, for example)
9. What does your company do at these premises? (For example, manufacture ball bearings)
10. Is the following information recorded in your company: (Please tick as appropriate)
Yes No Don’t Know Accidents (damage to property) o o o
Injuries to people o o o
Near misses o o o
Safety Objectives o o o
Safety Performance Indicators o o o
Spillage (e.g. fuel/ chemicals) o o o
ANONYMOUS AND CONFIDENTIAL 70
11. Over the past three years, have there been any of the following vehicle accidents on your company site? (Exclude accidents on public roads). (Please tick as appropriate and state number, if known).
Yes If Yes, No Don’t KnowNumber
Vehicle accidents causing death o o o
Vehicle accidents causing major injury (Requiring the injured o o operson to have more than three days off work)
Vehicle accidents causing minor injury (requiring the injured o o operson to have less than three days off work)
12. Over the past three years, have there been any of the following incidents at this site (exclude incidents on public roads) involving workplace transport (Cars/ Vans/ ForkLift Trucks/ Lorries etc): (Please tick as appropriate and state number. If one incident fits into more than one of the categories below, please tick the most relevant option).
Yes If Yes, No Don’t Know Number
Objects falling from vehicles o o o People falling from vehicles o o o Vehicles overturning o o o People struck by a vehicle o o o People run over by a vehicle o o o People hit by objects dislodged by vehicles o o o People injured getting on or off vehicles. o o o Vehicle malfunctioning causing accident or injury. o o o Collision between vehicles o o o Collision between vehicles and property. o o o Accident or injury occurring during maintenance of vehicle o o o Loading/ Unloading of vehicles causing accident or injury. o o o
B. WORKPLACE TRANSPORT
1. Please indicate how much you agree or disagree with the following statements:
Strongly Agree Neither Agree Disagree Strongly Agree or Disagree Disagree
This company has taken appropriate steps to ensure workplace transport safety. The workplace is rarely tidy. The workplace is organised so vehicles and pedestrians can operate in a safe manner. Employees understand the dangers of workplace transport. We have a problem with reversing vehicles. This company has found it difficult to reduce dangers arising from workplace transport.
ANONYMOUS AND CONFIDENTIAL 71
2. Please tick the appropriate boxes: Yes No Don’t Not
Know Applicable A risk assessment has been conducted for our workplace transport o o o o Traffic and warning signs in the workplace are the same as those o o o o found on public highways. Regular inspections and services are carried out on all vehicles, in o o o oaccordance with manufacturer’s recommendations. Employees are disciplined for having accidents. o o o oControl of vehicle movements is a priority within this organisation. o o o oDocumented daily/ weekly safety checks are conducted on vehicles. o o o oPersons required to drive company vehicles have their driving o o o olicence checked annually.
C. LEGISLATION
1. Please tick the regulations you feel are appropriate to your company:
Yes No Don’t Know Health and Safety at Work Act 1974 o o o
Management of Health and Safety at Work Regulations 1999 o o o
Workplace (Health, Safety and Welfare) Regulations 1992 o o o
Provision and Use of Work Equipment Regulations 1998 o o o
Construction (Health, Safety and Welfare) Regulations 1996 o o o
Traffic Signs Regulations and General Directions 1994 o o o
Reporting of Injuries, Diseases and Dangerous Occurrences, 1995 o o o
D. CONTROL MEASURES
The following questions relate to workplace transport safety control measures that may be found in your workplace. Please tick the appropriate boxes to indicate whether this work site has these control measures and to what extent they are present e.g. if you feel that this site has the control measure in all appropriate places, you would tick the box “yes, 100%”. Indicate how effective you feel the control measures present at this work site are at making your workplace transport safer. Score effectiveness from 1 to 5, with 1 being not at all effective and 5 being extremely effective.
1. Pedestrian Safety Yes 100%
Yes 75 –
Yes 50-
Yes, Less than
No but needed
No not needed
Don’t know.
Effectiveness (Circle the
100% 75% 50% appropriate no.) Separate vehicle and pedestrian routes o o o o o o o 1 2 3 4 5
Separate vehicle, pedestrian and public o o o o o o o 1 2 3 4 5 doors Subways/ footbridges for pedestrians o o o o o o o 1 2 3 4 5
Level crossings for pedestrians o o o o o o o 1 2 3 4 5
Dropped kerbs at all pedestrian crossing o o o o o o o 1 2 3 4 5 places
Signage to warn pedestrians of hazards o o o o o o o 1 2 3 4 5
ANONYMOUS AND CONFIDENTIAL 72
o o o o o o o 1 2 3 4 5 Pedestrian deterrent paving.
Safe haven for pedestrians to stand when o o o o o o o 1 2 3 4 5 vehicles are reversing Barriers positioned so vehicles do not o o o o o o o 1 2 3 4 5 collide with people when reversing
2. Traffic Routes Yes 100%
Yes 75 -
Yes 50-
Yes, Less than
No but needed
No not needed
Don’t know.
Effectiveness (Circle the
100% 75% 50% appropriate no) Crash barriers, where appropriate. o o o o o o o 1 2 3 4 5
Suitable barriers at entrances, exits and o o o o o o o 1 2 3 4 5 corners Height barriers. o o o o o o o 1 2 3 4 5
High wiring, lighting/ shielded pipes and o o o o o o o 1 2 3 4 5 electric cables Loading bays situated away from steep o o o o o o o 1 2 3 4 5 gradients Loading bays situated away from o o o o o o o 1 2 3 4 5 overhead cables Loading bay and sheeting area protected o o o o o o o 1 2 3 4 5 from adverse weather conditions Loading bays situated away from o o o o o o o 1 2 3 4 5 passing traffic and public roads. Forklift truck routes avoiding public o o o o o o o 1 2 3 4 5 roads Easy access for emergency vehicles o o o o o o o 1 2 3 4 5
Sufficient, wide enough traffic routes so o o o o o o o 1 2 3 4 5 vehicles can pass and circulate easily. One way system. o o o o o o o 1 2 3 4 5
Traffic routes without blind spots or o o o o o o o 1 2 3 4 5 tight corners. Regular inspections and maintenance of o o o o o o o 1 2 3 4 5
traffic routes
Safety banks to prevent vehicles o o o o o o o 1 2 3 4 5 overturning on unmade roads Forklift truck routes avoiding speed o o o o o o o 1 2 3 4 5 ramps Wide entrances/ gates o o o o o o o 1 2 3 4 5
Traffic routes away from vulnerable or o o o o o o o 1 2 3 4 5 potentially hazardous structures.
Safe, practical, suitable and sufficient o o o o o o o 1 2 3 4 5 parking areas for vehicles
Suitable lighting o o o o o o o 1 2 3 4 5
Firm, even ground o o o o o o o 1 2 3 4 5
ANONYMOUS AND CONFIDENTIAL 73
Yes Yes Yes Yes, No but No not Don’t Effectiveness 3. Vehicle Safety 100% 75 - 50- Less than needed needed know. (Circle the
100% 75% 50% appropriate no) Seat belt on vehicles o o o o o o o 1 2 3 4 5
Suitable and effective brakes on vehicles o o o o o o o 1 2 3 4 5
Windscreens with wipers on vehicles. o o o o o o o 1 2 3 4 5
Head lights on vehicles. o o o o o o o 1 2 3 4 5
Horns on vehicles. o o o o o o o 1 2 3 4 5
Bumpers on vehicles o o o o o o o 1 2 3 4 5
Sun visors on vehicles. o o o o o o o 1 2 3 4 5
Brake lights on vehicles o o o o o o o 1 2 3 4 5
Reversing warning light or sound on o o o o o o o 1 2 3 4 5 vehicles
Flashing amber lights on vehicles, where o o o o o o o 1 2 3 4 5 appropriate. Warning signs on vehicles, eg long o o o o o o o 1 2 3 4 5 vehicle, where appropriate. Control system to prevent vehicles from o o o o o o o 1 2 3 4 5 moving when fork lift trucks are loading or unloading Speed limiter on vehicles o o o o o o o 1 2 3 4 5
Rollover protection strategy on vehicles o o o o o o o 1 2 3 4 5
Mirrors on vehicles to aid visibility. o o o o o o o 1 2 3 4 5
Rear lens on vehicles to aid reversing, o o o o o o o 1 2 3 4 5 where appropriate. Radar sensors to warn drivers if o o o o o o o 1 2 3 4 5 reversing too near to an object.
CCTV on vehicles to aid reversing. o o o o o o o 1 2 3 4 5
Crash Data Recorders on Vehicles o o o o o o o 1 2 3 4 5 (black box technology) Vehicle ‘skirts’ to minimise damage. o o o o o o o 1 2 3 4 5
Guarding of dangerous parts on vehicles o o o o o o o 1 2 3 4 5 eg exposed exhaust pipes, chain drives)
4. Safety Measures and Signs
Speed ramps
Speed activated warning signs
Clearly displayed speed limits
Clean, well maintained warning signs
Road markings
Traffic Lights
Yes Yes Yes Yes, 100% 75 - 50- Less than
100% 75% 50% o o o o
o o o o
o o o o
o o o o
o o o o
o o o o
No but No not Don’t Effectiveness needed needed know. (Circle the
appropriate no) o o o 1 2 3 4 5
o o o 1 2 3 4 5
o o o 1 2 3 4 5
o o o 1 2 3 4 5
o o o 1 2 3 4 5
o o o 1 2 3 4 5
ANONYMOUS AND CONFIDENTIAL 74
Vibro-lines, causing an audible signal if o o o o o o o 1 2 3 4 5 the vehicle crosses them. Vehicle locator system so the o o o o o o o 1 2 3 4 5 whereabouts of vehicles are known. Guide humps/ rubber stops installed in o o o o o o o 1 2 3 4 5 HGV parking bays Mirrors on walls/ ceiling/ other structure o o o o o o o 1 2 3 4 5 to aid visibility Variable speed limits. o o o o o o o 1 2 3 4 5
Cable/ Chain floor to reduce vehicle o o o o o o o 1 2 3 4 5 movements during loading. CCTV on traffic routes o o o o o o o 1 2 3 4 5
5. Safe Systems of Work Yes 100%
Yes 75 -
Yes 50-
Yes, Less than
No but needed
No not needed
Don’t know.
Effectiveness (Circle the
100% 75% 50% appropriate no) Banksman to aid reversing where o o o o o o o 1 2 3 4 5 appropriate. Designated areas for reversing o o o o o o o 1 2 3 4 5
Exclusion of non-essential personnel o o o o o o o 1 2 3 4 5 from reversing areas Restriction of vehicle movement when o o o o o o o 1 2 3 4 5 known influx of personnel
Vehicle horns sounded at intersections. o o o o o o o 1 2 3 4 5
Overtaking restrictions. o o o o o o o 1 2 3 4 5
Hours driven by each driver monitored o o o o o o o 1 2 3 4 5 and regular breaks provided.
Plan of workplace at entrance and o o o o o o o 1 2 3 4 5 appropriate points showing vehicle routes, one way systems etc. Site procedures relayed to all visitors/ o o o o o o o 1 2 3 4 5 contractors Operational procedures to protect driver o o o o o o o 1 2 3 4 5 during unloading/ loading of heavy goods vehicles. No parking signage. o o o o o o o 1 2 3 4 5
Double yellow lines to indicate no o o o o o o o 1 2 3 4 5 parking.
6. Training/ Selection Yes 100%
Yes 75 -
Yes 50-
Yes, Less than
No but needed
No not needed
Don’t know.
Effectiveness (Circle the
100% 75% 50% appropriate no) Suitable selection process for drivers. o o o o o o o 1 2 3 4 5
Intermittent driver medicals. o o o o o o o 1 2 3 4 5
Regular vision tests. o o o o o o o 1 2 3 4 5
Impairment testing of drivers (drink/ o o o o o o o 1 2 3 4 5 drugs) Continual driver assessments including o o o o o o o 1 2 3 4 5 refresher and temporary staff training.
ANONYMOUS AND CONFIDENTIAL 75
Skills training for drivers. o o o o o o o 1 2 3 4 5
Provision of information and instruction o o o o o o o 1 2 3 4 5 for drivers. Basic vehicle maintenance training. o o o o o o o 1 2 3 4 5
Supervision of vehicles and drivers. o o o o o o o 1 2 3 4 5
7. Personal Protective Equipment Yes 100%
Yes 75 -
Yes 50-
Yes, Less than
No but needed
No not needed
Don’t know.
Effectiveness (Circle the
100% 75% 50% appropriate no) Provision of necessary protective o o o o o o o 1 2 3 4 5 equipment for staff and visitors e.g. hard hats High visibility clothing for workers in o o o o o o o 1 2 3 4 5 all transport areas Steel toe capped boots for all employees. o o o o o o o 1 2 3 4 5
Workplace clothing to avoid hazards o o o o o o o 1 2 3 4 5 from loose clothing. Protection for drivers in adverse weather o o o o o o o 1 2 3 4 5 conditions.
Please write any additional information or comments in this box:
A small number of organisations will be invited to take part in the second phase of this research. This will involve visiting your premises and viewing some of the workplace transport control measures you have implemented. All information collected during these visits will be completely confidential and will only be used for the purposes of this research.
If you would be willing to participate in this second phase, please complete the details below.
SURNAME: INITIALS: TITLE:
JOB TITLE: WORK TEL NO.
COMPANY NAME:
ADDRESS:
POSTCODE:
Thank you for your assistance.
Please return this questionnaire to TRL Limited by April 6th in the pre-paid envelope provided.
ANONYMOUS AND CONFIDENTIAL 76
Industry sector ref. no.
CONTROL MEASURES FOR WORKPLACE TRANSPORT SAFETY.
Please complete this questionnaire by ticking the appropriate boxes and writing in the spaces provided. It should only take about 20 minutes to complete. All of the information you provide will be treated in the strictest confidence and complete anonymity can be assured. Thank you for your help.
A. GENERAL
If your organisation has more than one site, please only answer for the site to which this questionnaire was addressed.
(Please tick the boxes as appropriate.)
1. What is your role within this organisation?
Safety/ Risk Manager o Middle Manager o
Safety Advisor o Supervisor o
Senior Manager o Shop Floor Worker o
Transport Manager o Other (Please State)
Years 0-2 3-5 6-10 11-15 16-25 26-40 Over 40
2 How many years has the company been o o o o o o oestablished?
3 How many years has the company been operating o o o o o o ofrom this site?
4 How old are the buildings on this site within which o o o o o o oyour organisation operates? (If your company has more than one building, of different ages, please tick all appropriate boxes)
0-10 11-20 21-40 41-60 61-100 101- Over If over 200, 200 200 Please state no:
5 How many employees are there o o o o o o owithin the company? (at thissite).
6 How many non-permanent members of staff (agency,
o o o o o o o contractors etc.) work at thissite, in a typical month? (at thissite)
7. What tasks do the non-permanent members of staff undertake at this site?
ANONYMOUS AND CONFIDENTIAL 77
8. Which of the following vehicles are used at, or driven onto, this work site, (inside or outside buildings) and in what quantity: Please include all visiting vehicles e.g. delivery. (Please tick as appropriate and state amount either in total or per day/ week etc, if known)
How much of the entire work site is accessible to this type of vehicle?
Yes Number (Delete total/ per day etc as No 0-25% 25-50% 50-75% 75-100% appropriate)
Cars o total/ per day/ week/ month o o o o o
Vans o total/ per day/ week/ month o o o o o
Forklift Trucks o total/ per day/ week/ month o o o o o
Heavy Goods Vehicles o total/ per day/ week/ month o o o o o
Trucks/ vans for carrying o total/ per day/ week/ month o o o o oequipment Mobile Equipment eg tugs o total/ per day/ week/ month o o o o oDumper Trucks o total/ per day/ week/ month o o o o o
Self Propelled Machinery o total/ per day/ week/ month o o o o oeg floor cleanersBicycles o total/ per day/ week/ month o o o o o
Motorcycles o total/ per day/ week/ month o o o o o
Other (Please State)
If you have ticked no to all of the above vehicles, please return this questionnaire to TRL
9. What is the approximate area of the whole of this site? (Please state approximate area in sq miles/ sq. metres/ dimensions in no of walking paces/ no of football pitches, for example)
10. What does your company do at these premises? (For example, manufacture ball bearings)
11. Is the following information recorded in your company: (Please tick as appropriate)
Yes No Don’t Know Accidents (damage to property) o o o
Injuries to people o o o
Near misses o o o
Safety Objectives o o o
Safety Performance Indicators o o o
Spillage (e.g. fuel/ chemicals) o o o
ANONYMOUS AND CONFIDENTIAL 78
12. Over the past three years, have there been any of the following vehicle accidents on your company site? (Exclude accidents on public roads). (Please tick as appropriate and state number, if known).
Yes If Yes, No Don’t KnowNumber
Vehicle accidents causing death o o o
Vehicle accidents causing major injury (Requiring the injured o o operson to have three days or more off work)
Vehicle accidents causing minor injury (requiring the injured o o operson to have less than three days off work)
13. Over the past three years, have there been any of the following incidents at this site (exclude incidents on public roads) involving workplace transport (Cars/ Vans/ ForkLift Trucks/ Lorries etc): (Please tick as appropriate and state number. If one incident fits into more than one of the categories below, please tick the most relevant option).
Yes If Yes, No Don’t Know Number
Objects falling from vehicles o o o People falling from vehicles o o o Vehicles overturning o o o People struck by a vehicle o o o People run over by a vehicle o o o People hit by objects dislodged by vehicles o o o People injured getting on or off vehicles. o o o Vehicle malfunctioning causing accident or injury. o o o Collision between vehicles o o o Collision between vehicles and property. o o o Accident or injury occurring during maintenance of vehicle o o o Loading/ Unloading of vehicles causing accident or injury. o o o
B. WORKPLACE TRANSPORT
1. Please indicate how much you agree or disagree with the following statements:
Strongly Agree Neither Agree Disagree Strongly Agree or Disagree Disagree
This company has taken appropriate steps to ensure workplace transport safety. The workplace is rarely tidy. The workplace is organised so vehicles and pedestrians can operate in a safe manner. Employees understand the dangers of workplace transport. We have a problem with reversing vehicles. This company has found it difficult to reduce dangers arising from workplace transport.
ANONYMOUS AND CONFIDENTIAL 79
2. Please tick the appropriate boxes: Yes No Don’t Not
Know Applicable A risk assessment has been conducted for our workplace transport o o o oTraffic and warning signs in the workplace are the same as those o o o ofound on public highways. Regular inspections and services are carried out on all vehicles, in o o o o accordance with manufacturer’s recommendations. Control of vehicle movements is a priority within this organisation. o o o oDocumented daily/ weekly safety checks are conducted on vehicles. o o o oPersons required to drive company vehicles have their driving o o o olicence checked annually.
C. LEGISLATION
1. Please tick the regulations you feel are appropriate to your company:
Yes No Don’t Know Health and Safety at Work Act 1974 o o o
Management of Health and Safety at Work Regulations 1999 o o o
Workplace (Health, Safety and Welfare) Regulations 1992 o o o
Provision and Use of Work Equipment Regulations 1998 o o o
Construction (Health, Safety and Welfare) Regulations 1996 o o o
Traffic Signs Regulations and General Directions 1994 o o o
Reporting of Injuries, Diseases and Dangerous Occurrences, 1995 o o o
D. CONTROL MEASURES
The following questions relate to workplace transport safety control measures that may be found in your workplace. · Please tick the appropriate boxes to indicate whether this work site has these control measures and to what
extent they are present e.g. if you feel that this site has the control measure in all appropriate places, you would tick the box “yes, 100%”
· Indicate how effective you feel the control measures present at this work site are at making your workplace transport safer. Score effectiveness from 1 to 5, with 1 being not at all effective and 5 being extremely effective.
1. Pedestrian Safety Yes 100%
Yes 75 –
Yes 50-
Yes, Less than
No but needed
No not needed
Don’t know.
Effectiveness (Circle the
100% 75% 50% appropriate no.) Separate vehicle and pedestrian routes o o o o o o o 1 2 3 4 5
Separate vehicle, pedestrian and public o o o o o o o 1 2 3 4 5 doors Subways/ footbridges for pedestrians o o o o o o o 1 2 3 4 5 Level crossings for pedestrians o o o o o o o 1 2 3 4 5 Dropped kerbs at all pedestrian crossing o o o o o o o 1 2 3 4 5 places
Signage to warn pedestrians of hazards o o o o o o o 1 2 3 4 5
ANONYMOUS AND CONFIDENTIAL 80
Yes Yes Yes Yes, No but No not Don’t Effectiveness 100% 75 – 50- Less than needed needed know. (Circle the
100% 75% 50% appropriate no.) 1 2 3 4 5 Pedestrian deterrent paving. o o o o o o o
1 2 3 4 5 vehicles are reversing Barriers positioned so vehicles do not
Safe haven for pedestrians to stand when o o o o o o o
1 2 3 4 5 collide with people when reversing
o o o o o o o
2. Traffic Routes Yes 100%
Yes 75 -
Yes 50-
Yes, Less than
No but needed
No not needed
Don’t know.
Effectiveness (Circle the
100% 75% 50% appropriate no) Crash barriers, where appropriate. o o o o o o o 1 2 3 4 5
Suitable barriers at entrances, exits and o o o o o o o 1 2 3 4 5 corners Height barriers. o o o o o o o 1 2 3 4 5
High wiring, lighting/ shielded pipes and o o o o o o o 1 2 3 4 5 electric cables Loading bays situated away from steep o o o o o o o 1 2 3 4 5 gradients Loading bays situated away from o o o o o o o 1 2 3 4 5 overhead cables Loading bay and sheeting area protected o o o o o o o 1 2 3 4 5 from adverse weather conditions Loading bays situated away from o o o o o o o 1 2 3 4 5 passing traffic and public roads. Forklift truck routes avoiding public o o o o o o o 1 2 3 4 5 roads Easy access for emergency vehicles o o o o o o o 1 2 3 4 5
Sufficient, wide enough traffic routes so o o o o o o o 1 2 3 4 5 vehicles can pass and circulate easily. One way system. o o o o o o o 1 2 3 4 5
Traffic routes without blind spots or o o o o o o o 1 2 3 4 5 tight corners. Regular inspections and maintenance of o o o o o o o 1 2 3 4 5 traffic routes Safety banks to prevent vehicles o o o o o o o 1 2 3 4 5 overturning on unmade roads Forklift truck routes avoiding speed o o o o o o o 1 2 3 4 5 ramps
Wide entrances/ gates o o o o o o o 1 2 3 4 5
Traffic routes away from vulnerable or o o o o o o o 1 2 3 4 5 potentially hazardous structures.
Safe, practical, suitable and sufficient o o o o o o o 1 2 3 4 5 parking areas for vehicles
Suitable lighting o o o o o o o 1 2 3 4 5
Firm, even ground o o o o o o o 1 2 3 4 5
ANONYMOUS AND CONFIDENTIAL 81
3. Vehicle Safety Yes 100%
Yes 75 -
Yes 50-
Yes, Less than
No but needed
No not needed
Don’t know.
Effectiveness (Circle the
100% 75% 50% appropriate no) Seat belt on vehicles o o o o o o o 1 2 3 4 5
Suitable and effective brakes on vehicles o o o o o o o 1 2 3 4 5
Windscreens with wipers on vehicles. o o o o o o o 1 2 3 4 5
Head lights on vehicles. o o o o o o o 1 2 3 4 5
Horns on vehicles. o o o o o o o 1 2 3 4 5
Bumpers on vehicles o o o o o o o 1 2 3 4 5
Sun visors on vehicles. o o o o o o o 1 2 3 4 5
Brake lights on vehicles o o o o o o o 1 2 3 4 5
Reversing warning light or sound on o o o o o o o 1 2 3 4 5 vehicles
Flashing amber lights on vehicles, where o o o o o o o 1 2 3 4 5 appropriate. Warning signs on vehicles, eg long o o o o o o o 1 2 3 4 5 vehicle, where appropriate. Control system to prevent vehicles from o o o o o o o 1 2 3 4 5 moving when fork lift trucks are loading or unloading Speed limiter on vehicles o o o o o o o 1 2 3 4 5
Rollover protection strategy on vehicles o o o o o o o 1 2 3 4 5
Mirrors on vehicles to aid visibility. o o o o o o o 1 2 3 4 5
Rear lens on vehicles to aid reversing, o o o o o o o 1 2 3 4 5 where appropriate. Radar sensors to warn drivers if o o o o o o o 1 2 3 4 5 reversing too near to an object.
CCTV on vehicles to aid reversing. o o o o o o o 1 2 3 4 5
Crash Data Recorders on vehicles (black o o o o o o o 1 2 3 4 5 box technology) Vehicle ‘skirts’ to minimise damage. o o o o o o o 1 2 3 4 5
Guarding of dangerous parts on vehicles o o o o o o o 1 2 3 4 5 eg exposed exhaust pipes, chain drives)
4. Safety Measures and Signs
Speed ramps
Speed activated warning signs
Clearly displayed speed limits
Clean, well maintained warning signs
Road markings
Traffic Lights
Yes 100%
o
o
o
o
o
o
Yes 75 100% o
o
o
o
o
o
Yes 5075% o
o
o
o
o
o
Yes, Less than 50% o
o
o
o
o
o
No but needed
o
o
o
o
o
o
No not needed
o
o
o
o
o
o
Don’t know.
o
o
o
o
o
o
Effectiveness (Circle the appropriate no) 1 2 3 4 5
1 2 3 4 5
1 2 3 4 5
1 2 3 4 5
1 2 3 4 5
1 2 3 4 5
ANONYMOUS AND CONFIDENTIAL 82
Yes Yes Yes Yes, No but No not Don’t Effectiveness 100% 75 – 50- Less than needed needed know. (Circle the
100% 75% 50% appropriate no.) Vibro-lines, causing an audible signal if o o o o o o o 1 2 3 4 5 the vehicle crosses them. Vehicle locator system so the o o o o o o o 1 2 3 4 5 whereabouts of vehicles are known. Guide humps/ rubber stops installed in o o o o o o o 1 2 3 4 5 HGV parking bays Mirrors on walls/ ceiling/ other structure o o o o o o o 1 2 3 4 5 to aid visibility Variable speed limits. o o o o o o o 1 2 3 4 5
Cable/ Chain floor to reduce vehicle o o o o o o o 1 2 3 4 5 movements during loading. CCTV on traffic routes o o o o o o o 1 2 3 4 5
5. Safe Systems of Work Yes 100%
Yes 75 -
Yes 50-
Yes, Less than
No but needed
No not needed
Don’t know.
Effectiveness (Circle the
100% 75% 50% appropriate no) Banksman to aid reversing where o o o o o o o 1 2 3 4 5 appropriate. Designated areas for reversing o o o o o o o 1 2 3 4 5
Exclusion of non-essential personnel o o o o o o o 1 2 3 4 5 from reversing areas Restriction of vehicle movement when o o o o o o o 1 2 3 4 5 known influx of personnel
Vehicle horns sounded at intersections. o o o o o o o 1 2 3 4 5
Overtaking restrictions. o o o o o o o 1 2 3 4 5
Hours driven by each driver monitored o o o o o o o 1 2 3 4 5 and regular breaks provided.
Plan of workplace at entrance and o o o o o o o 1 2 3 4 5 appropriate points showing vehicle routes, one way systems etc. Site procedures relayed to all visitors/ o o o o o o o 1 2 3 4 5 contractors Operational procedures to protect driver o o o o o o o 1 2 3 4 5 during unloading/ loading of heavy goods vehicles. No parking signage. o o o o o o o 1 2 3 4 5
Double yellow lines to indicate no o o o o o o o 1 2 3 4 5 parking.
6. Training/ Selection Yes 100%
Yes 75 -
Yes 50-
Yes, Less than
No but needed
No not needed
Don’t know.
Effectiveness (Circle the
100% 75% 50% appropriate no) Suitable selection process for drivers. o o o o o o o 1 2 3 4 5
Intermittent driver medicals. o o o o o o o 1 2 3 4 5
Regular vision tests. o o o o o o o 1 2 3 4 5
Impairment testing of drivers (drink/ o o o o o o o 1 2 3 4 5 drugs)
ANONYMOUS AND CONFIDENTIAL 83
Yes Yes Yes Yes, No but No not Don’t Effectiveness 100% 75 – 50- Less than needed needed know. (Circle the
100% 75% 50% appropriate no.) Continual driver assessments including o o o o o o o 1 2 3 4 5 refresher and temporary staff training. Skills training for drivers. o o o o o o o 1 2 3 4 5
Provision of information and instruction o o o o o o o 1 2 3 4 5 for drivers. Basic vehicle maintenance training. o o o o o o o 1 2 3 4 5
Supervision of vehicles and drivers. o o o o o o o 1 2 3 4 5
7. Personal Protective Equipment Yes 100%
Yes 75 -
Yes 50-
Yes, Less than
No but needed
No not needed
Don’t know.
Effectiveness (Circle the
100% 75% 50% appropriate no) Provision of necessary protective o o o o o o o 1 2 3 4 5 equipment for staff and visitors e.g. hard hats High visibility clothing for workers in o o o o o o o 1 2 3 4 5 all transport areas Steel toe capped boots for all employees. o o o o o o o 1 2 3 4 5
Workplace clothing to avoid hazards o o o o o o o 1 2 3 4 5 from loose clothing. Protection for drivers in adverse weather o o o o o o o 1 2 3 4 5 conditions.
Please write any additional information or comments in this box:
A small number of organisations will be invited to take part in the second phase of this research. This will involve one visit to your premises to view some of the workplace transport control measures you have implemented. All information collected during these visits will be completely confidential and will only be used for the purposes of this research. If more information is required, please contact Camilla Fowler on 01344 770710 or [email protected].
If you would be willing to participate in this second phase, please complete the details below.
SURNAME: INITIALS: TITLE:
JOB TITLE: WORK TEL NO.
COMPANY NAME:
ADDRESS:
POSTCODE:
Thank you for your assistance.
Please return this questionnaire to TRL Limited by April 27th
ANONYMOUS AND CONFIDENTIAL 84
APPENDIX THREE – TABLE SHOWING THE IMPLEMENTATION AND EFFECTIVENESS SCORES FOR
INDIVIDUAL CONTROL MEASURES:
85
86
Control Measure Number of companies who
have implemented the identified control measure
Mean extent to which the measure has been
implemented
Mean perceived effectiveness
1. Pedestrian Safety Separate vehicle and pedestrian routes 124 61.2 3.5
Separate vehicle, pedestrian and public doors
130 72.3 3.6
Subways/ footbridges for pedestrians 17 50.0 3.0
Level crossings for pedestrians 36 45.1 3.3
Dropped kerbs at all pedestrian crossing places
40 70.0 3.6
Signage to warn pedestrians of hazards 130 71.2 3.4
Pedestrian deterrent paving. 25 32.0 3.1
Safe haven for pedestrians to stand when vehicles are reversing
71 54.6 3.3
Barriers positioned so vehicles do not collide with people when reversing
63 43.5 3.2
2. Traffic Routes Crash barriers, where appropriate. 87 59.1 3.5
Suitable barriers at entrances, exits and corners
109 60.2 3.5
Height barriers. 40 43.1 3.2 High wiring, lighting/ shielded pipes and electric cables
78 76.6 3.7
Loading bays situated away from steep gradients
115 83.2 3.8
Loading bays situated away from overhead cables
117 87.9 3.9
Loading bay and sheeting area protected from adverse weather conditions
110 62.2 3.6
Loading bays situated away from passing traffic and public roads.
138 82.0 3.8
Forklift truck routes avoiding public roads 116 83.1 4.0
Easy access for emergency vehicles 186 92.0 3.9
87
Sufficient, wide enough traffic routes so vehicles can pass and circulate easily.
167 77.7 3.6
One way system. 59 51.5 3.4 Traffic routes without blind spots or tight corners.
131 72.0 3.3
Regular inspections and maintenance of traffic routes
134 68.3 3.4
Safety banks to prevent vehicles overturning on unmade roads
Continual driver assessments including refresher and temporary staff training.
120 62.5 3.4
Skills training for drivers. 97 64.6 3.3
Provision of information and instruction for drivers.
134 71.0 3.4
90
Basic vehicle maintenance training. 101 65.2 3.3
Supervision of vehicles and drivers. 128 76.4 3.5
7. Personal Protective Equipment Provision of necessary protective equipment for staff and visitors e.g. hard hats
140 91.0 3.7
High visibility clothing for workers in all transport areas
124 73.9 3.5
Steel toe capped boots for all employees. 146 87.0 3.8
Workplace clothing to avoid hazards from loose clothing.
139 88.1 3.7
Protection for drivers in adverse weather conditions.
144 86.3 3.7
91
92
HSE Health & Safety
Executive
Review of workplace control measures to reduce risks arising
from the movement of vehicles
Phase 2
Camilla Fowler Transport Research Laboratory
Old Wokingham Road Crowthorne
Berkshire RG45 6AU
United Kingdom
The aim of the research is to obtain information about workplace transport safety including the types and effectiveness of the control measures and systems implemented in industry, so best practice can be established. The research has been conducted in two phases. Phase one involved obtaining and analysing data on workplace transport control measures through a postal questionnaire to a number of specified industry sectors. Phase two involved undertaking more in-depth studies of workplace controls through the inspection of twenty industrial sites. This report marks the completion of phase two.
This report and the work it describes were funded by the Health and Safety Executive (HSE). Its contents, including any opinions and/or conclusions expressed, are those of the author alone and do not necessarily reflect HSE policy.
HSE BOOKS
ii
1.2. 2.1 2.2 2.3 3.4.4.1 4.1.1
4.1.2
4.1.3
4.1.4
4.1.5
4.2 4.2.1
4.2.2
4.2.3
4.2.4
4.2.5
4.2.6
4.2.7
4.2.8
4.3 4.3.1
4.3.2
4.3.3
4.4 4.4.1
4.4.2
4.4.3
4.4.4
CONTENTS
Page
EXECUTIVE SUMMARY v
near misses
INTRODUCTION 1
AIMS OF THE RESEARCH PROJECT 4 Overall aims 4
Summary of phase one 5 Detailed aims for phase two 7
METHODOLOGY 8
RESULTS 10
Risk assessment and safety management systems 10 Risk assessment 10
Safety documentation 11
Communication 11
Safety Culture 12
Improvement notices 12
Safe systems of work 12 Regular inspections of driving licences 13
Monitoring of driver hours and frequency of breaks 13
Use of banksmen to aid reversing 13
Sounding the horn of vehicles at intersections in warehouses 13
Contractor and visitor safety 14
Designated areas for reversing 14
Safe loading and unloading of vehicles 15
Additional safe systems of work 15
Accident and incident reporting 16 Recording of accidents, incidents and near misses 16
Use of accident, incident and near miss data 16
Incentives and disincentives to report accidents, incidents and 16
Traffic routes and safety engineering measures 19 Pedestrian safety 25
Segregated vehicle and pedestrian routes 25
Pedestrian routes that are protected from vehicles 25
Pedestrian crossings 26
Pedestrian deterrent paving 26
Suitable pedestrian safety for the number of pedestrians using the 26
site
Selection and training 26
Selection 26
Training 27
Personal protective equipment 27 Cost of implementation 28 Compliance with legislation 30
DISCUSSION 36
CONCLUSIONS 40 RECOMMENDATIONS FOR FURTHER WORK 42
REFERENCES
CASE STUDIES Case study one
Case study two
Case study three
Case study four
Case study five
Case study six
Additional best practice
43 45 47
54
59
63
69
73
77
APPENDIX ONE – SITE CHECKLIST FOR CONTROL 83
MEASURES
ENGINEERED CONTROL MEASURES COMPARED BETWEEN COMPANIES
APPENDIX TWO – SUMMARY TABLES OF THE DATA 91
COLLECTED FROM EACH COMPANY APPENDIX THREE – THE EFFECTIVENESS OF KEY 107
iv
EXECUTIVE SUMMARY
The aim of the research is to obtain information about workplace transport safety including the types and effectiveness of the control measures and systems implemented in industry, so best practice can be established. The research has been conducted in two phases. Phase one involved obtaining and analysing data on workplace transport control measures through a postal questionnaire to a number of specified industry sectors. Phase two involved undertaking more indepth studies of workplace controls through the inspection of twenty industrial sites. This report marks the completion of phase two. Phase one is detailed in project report PR/SE/325/01 (Fowler, 2000).
Twenty companies were selected for phase two of the research out of the sixty-five companies that volunteered to participate. It was ensured that the twenty companies selected were from a range of industry sectors, with varying number of employees, vehicle types and quantities, and age of premises. It was also ensured that all of the control measures identified in phase one and detailed on the questionnaire had been implemented by at least one company. The selected companies were contacted and appointments made. The companies were assured confidentiality and anonymity.
At each of the sites, traffic movements were observed and the implemented control measures noted using a previously designed checklist. The effectiveness of each control measure observed was subjectively evaluated based on observations made and professional judgement. An interview was conducted with the safety or transport manager from each of the companies as well as a driver and pedestrian. The aim of the interviews was to gain information about the company safety systems, safe working practices, safe systems of work, the effectiveness of these systems, risk assessment, accident and incident reporting, the company safety culture, communication, awareness of legislation and the cost of implementing the control measures observed. At the sites where it was inconvenient to conduct a formal interview with a pedestrian or driver, they were questioned informally, if possible, whilst observations were being conducted. Once all information had been collated about the control measures and safety systems implemented, a subjective assessment was made about the overall effectiveness of the measures and systems implemented to control workplace transport. The majority of the companies visited could not supply information about the cost of implementing control. Therefore this data was obtained independently from various information sources.
Two of the twenty companies visited were deemed to have implemented adequate systems and control measures to ensure workplace transport safety. However the six companies revealing the best practice observed were selected as case studies.
It is considered that workplace transport safety can only be achieved through the implementation of an entire system, including safety documentation, risk assessment, accident, incident and near miss reporting and analysis, training and education, communication, risk assessment and the implementation of control measures to reduce identified risks. If one or several elements of the system are omitted, the system becomes less effective. For example one of the companies visited had only implemented safe systems of work to control workplace transport. Through observations at this company it was noted that as the frequency of traffic movements increased, the compliance with the implemented safe systems of work decreased. Had engineered control measures been implemented, this may have
v
encouraged employees to comply with the safe systems of work by creating physical reminders of the systems. There is likely to be a beneficial, two-way interaction between engineered control measures and measures based on training and education. Not only will the education improve acceptance of engineering measures as mentioned above, but the fact that the company has introduced engineering measures is likely to reinforce the perceived importance of what is learned during training.
The effectiveness of control measures depends on several variables, including the types and number of vehicles being used, the frequency of traffic movements, the tasks being undertaken, the dimensions and condition of the site, the number of pedestrians and members of the public, the safety systems implemented and the overall safety culture of the company.
The companies visited had a lower level of compliance with The Traffic Signs Regulations and General Directions 1994 and The Management of Health and Safety at Work Regulations 1999 than with other relevant legislation. This may be because companies were not aware of the need to comply with the traffic signs regulations, and companies tend not to be aware of the need to conduct a risk assessment for workplace transport.
It was noted that the companies who had been issued with improvement notices from the HSE had high level of awareness about workplace transport safety and had conducted a suitable and sufficient risk assessment. Guidance on the content and the need to conduct a risk assessment for workplace transport may be required. Some companies felt that the safety of their site could be significantly improved if they were able to communicate with the HSE without being inhibited by concerns about negative repercussions. They felt that the HSE should demonstrate a proactive approach to safety and conduct inspections before an accident happens or a safety issue raised.
A tendency was observed at the companies visited to implement systems and measures that they were already familiar with. For example, there was a high level of vehicle safety and the most frequently implemented control measures were standard measures that are not necessarily implemented for safety, for example drainage and lighting. Few companies had implemented measures specifically to ensure workplace transport safety. These measures were more likely to be implemented in companies that had conducted a risk assessment on workplace transport and had identified the specific risks that needed to be reduced.
The findings of this research are based on inspections and findings made at twenty companies. It would be desirable to conduct further, more in depth evaluations on a larger sample of companies to ensure that the conclusions drawn apply generally.
vi
1. INTRODUCTION
The Health and Safety at Work Act, 1974, states:
‘It shall be the duty of every employer to ensure, so far as is reasonably practicable, the health, safety and welfare at work of his employees.’ (Section 2(1)).
Section 3 of the Act extends the employer’s duty of care to include the health and safety of persons not in his employment who may be affected by the risks posed by his undertaking.
Underpinning this Act are the Management of Health and Safety at Work Regulations, 1999. These state that every employer shall conduct a suitable and sufficient assessment of the risk to the health and safety of persons in his employment and persons who may be affected by his undertaking. The employer must record the findings of this assessment and implement any preventative or protective measures to reduce the risks posed, as low as reasonably practicable.
Therefore, legislation requires a risk assessment to be conducted for all workplace activities including workplace transport. Workplace transport refers to any vehicle or piece of mobile equipment, used by employers, employees, self-employed people or visitors in any work setting. Examples of workplace transport vehicles and equipment are listed below:
The risks posed by workplace transport must be identified, minimised and controlled. Measures that can be taken to reduce the inherent risk posed by workplace transport are outlined in The Workplace (Health, Safety and Welfare) Regulations 1992. Further Regulations include The Construction (Health, Safety and Welfare) Regulations 1996 (only applicable to constructions sites) and The Provision and Use of Work Equipment Regulations, 1998. Further guidance on workplace transport risks and control measures includes:
· Workplace Transport Safety, HS(G)136
· Managing Vehicle safety at the Workplace, INDG. 199
1
· Safety Policy Directorate – Workplace Transport and Workplaces (www.hse.gov.uk/spd/noframes/spdwktra.htm) (www.hse.gov.uk/spd/noframes/spdwkpl.htm)
· Danger, Vehicles at Work – HSE video.
The HSE hierarchy of risk control measures (HS(G)65) is as follows:
1. Eliminate risks or substitute activity, substance or process by a less hazardous activity/ substance/ process.
2. Combat risk at source by engineering control measures.
3. Minimise risk by suitable safe systems of work, for example reduce exposure to hazards.
4. Mitigate the consequences.
Workplace layout is often the primary control measure, but it is important not to overlook other essential control measures. Workplace transport safety control measures can be grouped into seven main categories:
1. Pedestrian Safety, for example, pedestrian crossings and separate vehicle and pedestrian traffic routes.
2. Traffic Routes, for example, crash barriers and one way systems.
3. Vehicle Safety, for example, seat belts and reversing lights.
4. Safety Measures and Signs, for example, speed ramps and warning signs. (Hereafter referred to as ‘site safety engineering measures and signs’)
5. Safe Systems of Work, for example, designated areas for reversing and overtaking restrictions.
6. Training and Selection, for example, driving assessments and vehicle maintenance training.
7. Personal Protective Equipment, for example, hard hats and high visibility clothing.
On average, 70 people are killed and 2000 seriously injured in workplace transport accidents every year (HSC Newsletter, October 1999). Vehicles are the second highest cause of death in the workplace. Whilst the type of equipment and the working environment may differ significantly across workplaces, transport is recognised as a significant risk for all industries.
The greatest number of deaths from workplace transport arises from the movement of vehicles, including people being struck by objects falling from vehicles (usually part of the load) or vehicles overturning. Reversing vehicles also presents a particular hazard. (HSC Newsletter, October, 1999)
These facts alone demonstrate that the risks posed by workplace transport are not being suitably identified and sufficiently controlled. Therefore, employer’s compliance with UK health and safety legislation is questionable.
2
It is important to establish the extent that recommended control measures have been implemented and gain an insight into the types of organisation and industry that contribute to the high death rate from workplace transport accidents. Such industries can then be targeted for guidance and assistance from regulatory bodies in the future.
Many organisations have implemented measures and systems to control the risks posed by vehicles in their workplace. It is important to examine these measures, assess their effectiveness in reducing the inherent risk and calculate their cost of implementation and maintenance. Lessons can be learnt from these companies’ experience and considered when establishing best practice.
The HSE is aware of the large number of industrial accidents that are attributable to workplace transport. The HSE believe that industries hold a negative attitude towards the control of vehicle movements and are concerned that the level of compliance with relevant health and safety legislation is low. The HSE recognises the need to develop a workable, comprehensive and transparent strategy on workplace transport and need information from research to develop supporting material.
This research aims to gain an insight into the types of measures used within industry to control workplace transport and the effectiveness, implementation costs and maintenance costs of such measures. Compliance with legislation will be examined and the reasons why safety problems arising from vehicle movements in workplaces is neglected, explored. From the research, best practice will be established and fed into the HSE transport strategy and future workplace transport guidance.
3
2. AIMS OF THE RESEARCH PROJECT 2.1 OVERALL AIMS
The aims of the project, as specified by the HSE are as follows:
· Determine the types of workplace control measures in use to reduce the risk from vehicle movements.
· Establish the degree to which control measures are implemented across industry and evaluate compliance with Workplace Regulations and the Construction (Health, Safety and Welfare Regulations 1996.
· Review the effectiveness of different types of control measures, their cost of implementation and cost of maintenance.
· Establish changes to the workplace and best practice demonstrated. · Gain an understanding of why the control of vehicle movements in workplaces is
neglected or not seen as a problem. · Examine interface with the public and extended workforce. · Provide six suitable case studies for HSE publications. · Identify further suitable case study material.
The project has been conducted in two phases. Phase one involved obtaining and analysing data on workplace transport control measures through a postal questionnaire to a number of specified industry sectors. Phase two involves undertaking more in depth studies of workplace controls through the inspection of twenty industrial sites. This report marks the completion of phase two. Phase one is detailed in project report PR/SE/325/01 (Fowler, 2000).
4
2.2 SUMMARY OF PHASE ONE
One hundred companies were randomly selected from each of the identified industry sectors. The companies were of varying size (number of employees) and were operating from premises of different ages. Through a brainstorming session key technical members of the project team compiled a list of potential measures that could be used to control workplace transport. The measures could be grouped under the following categories: pedestrian safety, traffic routes, vehicle safety, site safety engineering measures and signs, safe systems of work, training and selection and personal protective equipment.
After an extensive literature search and familiarisation with relevant legislation and guidance, a questionnaire was designed. The information being sought included general information about the company, such as the number of employees, the types of vehicles in use within the work site, accident reporting, general workplace transport safety, awareness of legislation, the implementation of control measures and their perceived effectiveness.
The questionnaire was piloted on ten local companies through face to face interviewing. Comments were noted and suggestions fed into the redesign of the questionnaire. The questionnaire was then re-piloted on twenty-five companies through telephone interviewing. The final version of the questionnaire was mailed to two thousand companies and a covering letter and pre-paid envelope were included.
Sufficient responses were received to allow statistical analysis and the responses were weighted in line with the total number of organisations in each industry sector, so conclusions could be drawn about the population as a whole.
There was a reasonably high reported level of awareness of health and safety legislation, but a sizeable minority of companies had little awareness, and did not record accident data. About 40% of the companies that reported being aware of the Management of Health and Safety at Work Regulations said they had not conducted a risk assessment of workplace transport. These findings suggest that there is considerable scope for improving the promulgation of regulations, guidance on good practice, and enforcement.
As the number of vehicles on site increased, the rated effectiveness of vehicle safety measures, safe systems of work, and personal protective equipment decreased. However, the use of training, selection and site safety engineering measures and signs tended to increase. It may be that, with many vehicles on site, the complexity of the safety problem is seen to require these additional types of measure. Also, some sites with many vehicles will be ones in which company-based vehicle safety measures are inappropriate as the cars are owned and maintained outside the control of the organisation.
Control of vehicle movements in the workplace seen as a high priority for 41% of the sampled companies, and 52% of the sample said they had conducted risk assessments to identify and evaluate the risks posed. All participating companies had implemented some measures to control workplace transport safety. The measures implemented by the most companies were suitable and effective brakes on vehicles, horns on vehicles and suitable lighting in the workplace.
There was a tendency for implementation and perceived effectiveness scores for workplace transport safety control measures to increase as number of employees increased. Such a tendency is probably to be expected since larger companies will
5
tend to have more complex workplace transport safety problems requiring a wider spectrum of control measures. However, another part of the explanation may be that larger companies have better organised and better resourced health and safety functions, suggesting that the smaller companies may be a particularly important target for future efforts to improve workplace transport safety.
6
2.3 DETAILED AIMS FOR PHASE TWO
Phase two of the research involves undertaking in depth studies of workplace control measures through the inspection of twenty industrial sites.
The aims of phase two are as follows:
§ To evaluate compliance with health and safety legislation that is applicable to workplace transport safety.
§ To review the effectiveness of different types of control measures and their cost of implementation.
§ To gain an understanding of whether the control of vehicle movements in workplaces is neglected and if so, why?
§ To determine the steps taken by companies to identify, evaluate and reduce the risks posed by workplace transport.
§ To examine, where appropriate, the interface of workplace transport with the public and extended workforce.
§ Establish best practice for controlling workplace transport.
§ To provide six case studies for future HSE publications.
7
3. METHODOLOGY Phase two of the research involved undertaking in-depth studies of the measures used to control workplace transport at selected industrial sites. Sixty-five companies indicated on the phase one questionnaire that they would be willing to participate in phase two of the research. The Health and Safety Executive indicated in the project specification that visits to twenty companies would be sufficient for this phase. It was ensured that the twenty companies selected were from a range of industry sectors, with varying number of employees, vehicle types and quantities, and age of premises. It was also ensured that all of the control measures identified in phase one and detailed on the questionnaire had been implemented by at least one company. The selection of the companies relied on the companies volunteering to participate, it is therefore likely that the sample tends to over-represent companies that have reasonably good practice in workplace transport safety.
The selected companies were contacted by telephone and appointments made to visit the company sites. The companies were assured confidentiality and anonymity and were briefed on the outline agenda for the visit. The outline agenda for the visits included observing the traffic movements on the site, evaluating the effectiveness of the control measures observed and informal interviews with a pedestrian, a driver and the safety or transport manager.
Prior to visiting the twenty companies, a site checklist was designed detailing all of potential control measures that could be observed. The checklist was divided into the following categories:
i) Pedestrian safety, for example pedestrian crossings.ii) Traffic routes, for example one way systems.iii) Vehicle safety, for example audible reversing alarms.iv) Site safety engineering measures and signs, for example road markings. v) Safe systems of work, for example designated areas for reversing.vi) Personal protective equipment, for example safety boots.vii) Additional observations, for example damage to vehicles or skid marks.
The checklist can be seen in Appendix 1. Guidance questions were also developed for the interviews with the driver and the safety or transport manager. A more realistic and overall impression of the company could be obtained from talking to a pedestrian and driver as well as the company safety or transport manager. The aim of the interviews was to gain information about the company safety systems, safe working practices, safe systems of work, the effectiveness of these systems, risk assessment, accident and incident reporting, the company safety culture, communication, awareness of legislation and the cost of implementing the control measures observed.
At each of the sites, traffic movements were observed and the control measures noted. The effectiveness of each control measure observed was subjectively evaluated based on observations made and professional judgement. Video footage and still photographs were taken at each of the sites visited to act as an aide memoir.
An interview was conducted with the safety or transport manager from each of the companies. Some of the companies visited felt that it would be inconvenient to conduct an interview with a driver or pedestrian. At these sites, wherever possible, pedestrians and drivers were questioned informally whilst observations were being conducted. Once all information had been collated about the control measures and
8
safety systems, a subjective assessment was made about the overall effectiveness of the measures and systems to control workplace transport.
The majority of the companies visited could not supply information about the cost of implementing control measures either because they did not have sufficient records detailing this information or because they felt it was inappropriate to supply this information. Therefore this data was obtained independently from various supply companies, information on the Internet and Spon’s Civil Engineering and Highway Works Price Book (Davis, Langdon and Everest, 1995).
Once all of the selected companies had been visited it became apparent that two of the identified control measures had not been observed. Therefore, a further two sites were visited that were known to have these measures. In depth studies were not conducted at these sites, but the control measures were observed and a subjective evaluation made on their effectiveness.
The Health and Safety Executive stipulated in the project specification that six case studies would be required for future HSE publications. The six companies revealing the best practice observed were selected as these case studies. It must be remembered that the conclusions drawn are based on assessments conducted at a relatively small sample of volunteering companies over a period of one day.
9
4. RESULTS
Twenty companies were visited and through interviews, observations and professional judgement subjective evaluations were made of the effectiveness of the systems and measures implemented to control workplace transport. Summary tables of the data collected from each company are presented in Appendix Two. The effectiveness of key engineered control measures is compared in Appendix Three.
4.1 RISK ASSESSMENT AND SAFETY MANAGEMENT SYSTEMS
The following factors were considered when examining risk assessment and safety management systems:
i. Whether a risk assessment had been conducted for workplace transport. ii. Whether the risk assessment was suitable, sufficient, appropriately documented. iii. Whether the company had a safety manual, safety procedures and documented
safe working practices. iv. Whether safety was adequately communicated. Safety committees and forums
were included here. v. Whether the company revealed a positive culture, based on the attitude of staff,
effective implementation of the safety management system, commitment of management to safety and communication.
4.1.1 Risk Assessment
Fourteen of the twenty companies visited had conducted a risk assessment on their workplace transport.
Seven of the fourteen risk assessments conducted were considered to be suitable, sufficient and appropriately documented. In each of these seven companies, risks had been assessed for each mode of transport used and the tasks for which the vehicle was used. Hazards had been identified, consequences analysed, risks evaluated and corrective measures used to eliminate or reduce the risks posed. The assessments had been fully documented and the actions closed out within a specified date.
Two of the seven companies that had assessed their risks had also conducted traffic assessments, involving traffic counts and the identification of hazards through the use of CCTV or personal observations. One of the companies visited involves the entire workforce in the assessment of risks. A monthly awareness forum is held, where all staff are required to identify the risks posed in their individual tasks. The identified hazards are then fed into the risk assessments, which result in specific actions to reduce risks and mitigate consequences.
Risk assessments undertaken by seven of the fourteen companies were not considered to be suitable or sufficient. Two of the companies that had conducted risk assessments for workplace transport had not documented the assessment, findings or actions required to eliminate or reduce the risks posed. One company had conducted a single generic risk assessment intended to cover all of their twenty sites. This was not considered to be suitable because there had been no consideration of the different risks that may be present at each site.
An additional two of the seven companies employ a health and safety agency to conduct risk assessments and to ensure compliance with relevant legislation. The
10
health and safety agency visit the sites approximately six times per year and conduct their assessments of the risks purely on observations made during these visits without consultation with the relevant staff. It is likely that the agency did not wholly understand the processes, company procedures and practices, and the risks posed on a daily basis to the workforce. Therefore such risk assessments were not deemed as suitable or sufficient.
Two of the companies had followed the guidance ‘Five Steps to Risk Assessment’ issued by the HSE, when conducting their assessments. This guidance provides a suitable generic risk assessment model, to guide assessors when assessing risks and to encourage lateral thinking. However, these companies had taken the guidance too literally and only considered the hazards listed in the publication. This had led to significant hazards, such as pedestrian and vehicle conflicts, being overlooked or ignored because the companies felt they had conducted an assessment and therefore complied with legislation.
Six companies had not conducted a risk assessment for workplace transport. Three of these companies were not aware of the need to undertake such assessments for transport, but made it clear that they had conducted risk assessments for other tasks undertaken on the site. Two of the companies had minimal knowledge of risks, hazards or health and safety legislation and seemed unconcerned with the safety of their employees. They considered risk assessments to be unnecessary and time consuming. One company did not concern themselves with transport safety, as they did not believe that their traffic movements posed any risk. However, this company had approximately 60 vehicle movements per day with 50% of these movements coming from vehicles belonging to members of the public. In addition to these vehicle movements there was also an average of one hundred pedestrians visiting or working at the site per day.
4.1.2 Safety Documentation
Sixteen of the companies visited had a safety manual, safety procedures and documented safe working practices. However, only ten companies had implemented these procedures and safe working practices. The remaining five companies had documented the safety procedures in line with HSE guidance. The documents were not communicated to staff, resulting in the systems not being integrated into normal working practices. One of these companies had lifted paragraphs of text from various guidance booklets to create a safety manual. The manual contained thorough, comprehensive safety procedures but they were not entirely relevant to the company and were considered to be highly ambitious.
The four companies that did not have a safety manual or procedures were not aware of the need to have such documentation.
4.1.3 Communication
Fifty percent of the companies visited were deemed to have adequate systems in place to communicate safety issues. In seven of the ten companies, safety issues were discussed in the safety committee’s monthly or quarterly meetings and information subsequently tiered down through the management structure. Three companies revealed particularly strong communication links involving two-way safety forums, monthly safety briefs, open door policies and daily safety reminders via electronic mail.
11
The companies without suitable communication mechanisms included the companies that had not conducted risk assessments or implemented safety procedures or systems.
4.1.4 Safety Culture
A subjective assessment was made on the companies’ overall safety culture including issues such as the attitude of staff towards safety, commitment of management to safety, safety management systems and the mechanisms used to communicate safety. Eleven of the twenty companies were deemed to have a positive safety culture. Interestingly, some of these companies had not conducted sufficient risk assessments and had not communicated their safety management system effectively but the actions and attitudes of employees and certain managers revealed their concern about safety and enthusiasm to improve. Some of the companies visited have a limited knowledge of safety legislation and risk management but through senior management’s unwillingness to recruit staff with such expertise and allocate adequate resources to safety, the employees were unable to develop solutions to the identified risks. However, the employees were aware of the risks and showed a positive attitude to combating them through unofficial systems.
4.1.5 Improvement Notices
Four out of the twenty companies visited had been issued with at least one improvement notice from the HSE regarding transport safety. They felt that the improvement notices had raised awareness of transport safety within the company and encouraged senior management to budget for safety improvements. The period of time spent closing out the improvement notices had improved their communication links and relationship with the HSE. The safety culture of the four companies was considered to be positive and each company revealed documented and implemented risk assessments and safe systems of work. Three of the remaining sixteen companies expressed concerns about the HSE as a regulatory body. They felt that they could not approach the HSE for advice, and as a result did not address health and safety issues sufficiently. These companies believed that being able to communicate with the HSE without being inhibited by the possibility of negative repercussions would significantly improve the safety at their site. They felt that the HSE should demonstrate a proactive approach to safety and conduct inspections before an accident happens or a safety issue raised.
4.2 SAFE SYSTEMS OF WORK
The safe systems of work implemented by the visited companies for workplace transport safety form eight groups:
i) Regular inspections of driving licences.ii) Monitoring of driver hours and frequency of breaks.iii) Use of banksmen to aid reversing.iv) Sounding the horn of vehicles at intersections in warehouses.v) Contractor and visitor safety.vi) Designated areas for reversing.vii) Safe loading and unloading of vehicles.viii) Additional safe systems of work.
12
4.2.1 Regular inspections of driving licences
Five of the companies visited regularly inspected employee’s driving licences for any driving convictions. These inspections were conducted either annually or every six months. The five companies felt that checking driving licences regularly would encourage drivers to drive safely and ensure that all drivers employed were legally permitted to drive on the public highways.
4.2.2 Monitoring of driver hours and frequency of breaks
Eight of the companies visited monitored the number of hours driven by each of their drivers and the frequency and duration of breaks taken. Four of these companies monitored driving hours and breaks through the analysis of tachographs. Three companies relied on data entered by the drivers on weekly timesheets and one company cross-referenced time sheet data with the amount of fuel purchased.
One company had implemented data recorders on vehicles that required drivers to enter a personal identification number before the engine could be started. This data enabled hours driven and the frequency and duration of breaks to be accurately monitored for each driver.
Twelve companies did not monitor driver hours or breaks. One of these companies subcontracted all long distance deliveries, thereby eliminating their need to employ long distance drivers. Five companies only had on-site vehicles that were not driven by one person all day and six companies believed that the monitoring of driver hours and breaks was not relevant within their organisation. The monitoring of driver hours and breaks is a legal requirement outlined in ‘Drivers’ hours and Tachograph Rules for Goods Vehicles in the UK and Europe (GV262)’ and is relevant to any company employing long distance drivers.
4.2.3 Use of banksmen to aid reversing.
Two companies employed banksmen to aid the reversing of all vehicles. The banksmen had been appropriately trained and the drivers educated in the signals the banksmen would be using. In one of the companies, the banksman wore a different coloured high visibility jacket to the other staff so he could be easily distinguished.
Four companies used staff periodically to act as a banksman to aid reversing. These banksmen tended to be the second person in a double crew vehicle and acted as banksmen only if the reversing manoeuvres presented unusual hazards.
Two companies had systems in place prohibiting the use of banksmen. This was because, firstly the companies had not trained staff in the appropriate signals and secondly pedestrians were prohibited in the reversing areas and the presence of a banksman could create an additional, unnecessary risk. It is felt that the use of a banksman is only effective if identified risks would be significantly reduced by their guidance and the allocated banksman and drivers have been appropriately trained.
4.2.4 Sounding the horn of vehicles at intersections in warehouses
Twelve of the companies visited used a forklift truck on a daily basis. Ten of these companies required forklift trucks to be used inside warehouses. Half of the companies using forklift trucks in warehouses had implemented a system whereby forklift trucks were required to sound their horn on entering the warehouse and at intersections.
13
In companies where several forklift trucks were being used simultaneously, it was difficult to determine where the horns were being sounded, as the sound of horns was seemingly continuous. The drivers of the forklift trucks, however, appeared to rely on this system and presumed that as they had sounded their horn, it was automatically their right of way at the approaching intersection. In companies where fewer fork lift trucks were being operated, the sounding of the horn appeared to be more effective at warning pedestrians and other vehicles of their presence because it was easier, with fewer vehicles, to determine where the horn sound originated from.
Two of the five companies that required drivers to sound the horn of vehicles at intersections also required staff to wear hearing defenders in the warehouse. It was considered that hearing defenders would significantly reduce the effectiveness of sounding horns at intersections.
4.2.5 Contractor and visitor safety
Seven of the companies visited had systems in place to ensure visitors and contractors were aware of the site safety procedures. Four of these companies required visitors and contractors to sign a visitor book on arrival. Visitors and contractors would then be issued with an identification pass once they had been informed of the safety procedures. Two of these companies were food manufacturers and also required visitors and contractors to complete and sign a health questionnaire to minimise the risk of infection on site.
To ensure contractor safety and the safety of those affected by the contractor’s work, one company had implemented a system that required contractors to erect a site safety board in their area of work. The board was required to state the appropriate dress code, current hazards and risks, necessary induction training, the company’s policy on accident and incident reporting and the number of reportable accidents to date.
One company had experienced customers and contractors disregarding safe working practices and safety warning signs due to an over-familiarity with the site. A leaflet was sent to all customers, staff and contractors stating company safety procedures and outlining their duty of care. The company reported that contractor and visitor safety had been significantly improved since the launch of this initiative.
One company required all visitors and contractors to watch a five minute safety video before entering the site. The video included information about where to park, where to load and unload vehicles, the site speed limit and transport movement awareness, pedestrian safety, identification of traffic routes, hazards, control measures, personal protective equipment and incident reporting.
4.2.6 Designated areas for reversing
Seven companies had designated areas for reversing vehicles. These tended to be areas marked out with road markings situated near loading bays. Drivers and pedestrians were aware that vehicles would be reversing in these areas through training, awareness and the warning signs. Reversing vehicles in other areas was prohibited. The purpose of designated areas for reversing is to reduce the potential for vehicle and pedestrian conflicts as a result of a driver failing to observe a pedestrian when reversing. However, only two of these companies had restricted or eliminated pedestrian activity in these areas. In six of the seven companies, vehicles were observed reversing in areas that were not designated reversing areas. Through
14
the implementation of designated areas, pedestrians may become less aware of the potential for reversing vehicles outside the designated areas, thereby increasing the risk of pedestrian and vehicle conflicts.
4.2.7 Safe loading and unloading of vehicles
Eight companies had safe systems of work in place to ensure the safe loading and unloading of vehicles. Four companies operated a system whereby a shunt vehicle driven by a trained company driver transferred the containers from good vehicles to the appropriate loading bays and then returned the loaded containers to the appropriate goods vehicle cabs. This system ensured that the person required to reverse the vehicle into the loading bay had adequate training and competencies to perform the required tasks. It also reduced the potential congestion and traffic conflicts that may have been caused by several vehicles reversing into the loading area simultaneously. One of these companies used an additional system whereby the loading bays were controlled by a traffic light system. The vehicle was only permitted to leave the loading bay when the traffic light was green indicating that it was safe to move the vehicle.
One company used a system that required drivers to hang their vehicle keys on a hook positioned on the ‘up and over’ loading bay door prior to opening it. When the loading bay door was opened the keys would be suspended out of the driver’s reach, meaning the vehicle could not be driven away until the loading bay door had been closed. The company had experienced drivers disregarding this system, but this had always resulted in disciplinary action.
Goods vehicles tend to have two gates on a tail lift at the rear of a lorry. During loading, pallets are wheeled onto the tail lift and the tailgates secured in an upright position whilst the hydraulic tail lift lifts the pallets into the rear of the vehicle. One company had experienced drivers suffering from back problems due to the continual lifting of the tailgates into upright positions. To reduce the amount of lifting and therefore the risk of back problems, one of the two tailgates was permanently left in the upright position. This meant that a pallet could be easily wheeled onto the tail lift over the horizontal tailgate and positioned by the upright tailgate to prevent the movement of the pallets during loading.
4.2.8 Additional safe systems of work
Four companies operated a permit to work system for transport safety. Drivers could not enter the site or undertake any tasks on site without being issued with a permit to work from an authorised person.
Two companies had reduced the risk of traffic conflicts through arranging goods to be delivered out of the normal working hours.
One company operated a regular bus service to transfer customers and staff between sites and to public transport stations, to reduce the number of vehicle movements on site.
Reversing lights are positioned at the rear of vehicles and audible reversing alarms are only clearly audible to a person outside. A driver of a vehicle positioned in front of a reversing vehicle may not hear the audible reversing alarm and would not be able to see the reversing lights. Therefore, two companies had a system in place that required vehicles to use their hazard lights when reversing, to warn other drivers of their movements.
15
One company required visitors, contractors and employees to wear different coloured hats whilst on site. Records were kept of the number of people in each of the different groups observed not following company safety procedures. Safety awareness would then be targeted at the higher risk groups. One of the companies visited relied heavily on safe systems of work to ensure workplace transport safety. Systems included the use of hazard lights to warn other vehicles of their movements, designated areas for specific vehicle activities and a trained banksman to aid reversing. Through observations it was apparent that the systems were effective during periods of low traffic movements but as the traffic movements increased the safe systems of work were increasingly disregarded.
4.3 ACCIDENT AND INCIDENT REPORTING
4.3.1 Recording of accidents, incidents and near misses
Eighteen of the companies visited recorded accidents, although only fifteen of these companies were aware of the Reporting of Injuries, Diseases and Dangerous Occurrences Regulations 1995. One of the companies that did not record accidents was not aware of the need to and the second company stated that ‘accidents, incidents and near misses are not recorded because we don’t have any’. Out of the eighteen companies that recorded accidents, eleven also recorded near misses. However, five of these companies experienced underreporting of near misses. It is not a legal requirement to report occupational road traffic accidents to the HSE under RIDDOR, but it was encouraging that companies record the information regardless.
4.3.2 Use of accident, incident and near miss data
Seven companies collected accident data solely to allow insurance claims to be made or to comply with legislation. Two of the companies visisted used accident data to feed into subsequent risk assessments and one company used the data to investigate litigation claims.
Eight of the eleven companies analysed the data regularly and provided reports on the number and type of accidents. Lessons learnt were then fed back to all staff, to reduce the risk of the accident recurring. Corrective action was also taken including the implementation of engineered control measures or increased safety awareness. These companies felt that the analysis of data allowed high-risk areas and procedures to be focused on, as well as providing justification for expenditure on safety improvements. Three of the companies used accident data as a key safety performance indicator.
4.3.3 Incentives or disincentives to report accidents, incidents and near misses.
Nine of the companies visited actively encouraged staff to report accidents but four companies had systems in place that were deemed to actively discourage staff from reporting accidents. Seven companies neither actively encouraged nor discouraged staff to report accidents.
Eight of the nine companies that were deemed to actively encourage staff to report accidents did so through training and awareness. Staff were trained in the reporting procedure and made aware of the benefits of reporting accidents and incidents. All
16
of the eight companies offered a ‘no blame’ culture and stated that the accident is investigated, not the person.
The ninth company also encouraged employees to report accidents did so through the implementation of crash data recorders. Prior to driving a vehicle, a personal identification number needed to be input into the recorder by the driver. The crash data recorder would record five seconds prior to impact and five seconds after impact. The accidents could then be linked directly to the person driving the vehicle at the time of the accident. The company felt that this system actively encouraged employees to report accidents because an accident revealed by the crash data recorder that had not been officially reported would result in disciplinary action.
Four companies had systems in place that were deemed to actively discourage staff from reporting accidents. Two of the companies required staff to pay the excess on any insurance claim resulting from an accident considered to be their fault. One of these companies felt that this discouraged staff from making claims through the insurance and encouraged the staff to mend the vehicles themselves. However, the representative spoken to at the other company felt that the system made it more difficult to investigate the accidents and take corrective action, because the root causes of the accident could not be established due to the driver continually rejecting responsibility.
One of the companies automatically cut a drivers bonus payment if they had been involved in an accident and one company suspended the driver without pay whilst the accident was investigated.
4.4 VEHICLE SAFETY
Two of the companies visited leased all of their vehicles from external companies, eight companies owned all of their vehicles and one company subcontracted all work involving the use of vehicles. The vehicles observed included automated vehicles (not requiring a driver), forklift trucks, vans, light goods vehicles, heavy goods vehicles, cars and tugs. Twelve companies used at least one forklift truck on a daily basis.
The principal factors inspected at the companies with regards to vehicle safety were as follows:
i. Engineered reversing aids. ii. Servicing and maintenance of the vehicles. iii. Vehicle safety checks. iv. Additional control measures implemented for vehicle safety. v. Overall vehicle safety.
4.4.1 Engineered reversing aids
Fourteen of the companies visited had reversing alarms fitted to vehicles. Where vehicles were being used at night or in residential areas the alarms could be overridden and switched off. Thirteen companies had reversing lights fitted to vehicles. The companies that had not fitted reversing lights to vehicles, did not use any vehicles on the public highways. The effectiveness of the reversing lights on forklift trucks was questionable, as their visibility to other drivers and pedestrians, and their ability to illuminate the area being reversed into in an adequately lit warehouse or in daylight was negligible.
17
One company had fitted a reversing lens on the rear window of their van. For the majority of the vehicles observed, this was not a viable option as there was no visibility out of the rear of the vehicle.
Six companies had engineered systems to aid reversing. Two of the companies had implemented close circuit television at the rear of at least one vehicle. When the driver engaged reverse, the view behind the vehicle could be observed on a monitor positioned adjacent to the steering wheel. Three reversing sensor systems were observed. A sensor system had been fitted to the front and rear of the automated vehicles observed at one company. If the automated vehicle manoeuvred too close to an object, the vehicle would automatically shut down thereby eliminating the risk of a collision. The vehicles are fitted with mechanisms to ensure that the vehicles do not fail-to-danger. The other two sensor systems sent signals to the cab of the vehicle, if it was being reversed within three metres of a fixed object. One of the systems warned the driver with an audible signal and the other with flashing lights. Neither system had back-up signals if the principal signal failed.
The sixth company had recently piloted a reversing sensor system on their goods vehicles. The system involved the automatic application of vehicle brakes if the vehicle reversed too close to an object. However, the system had significant flaws, whereby the brakes were being activated whilst the vehicle was travelling forwards if another vehicle drove too close to the rear.
4.4.2 Service and maintenance of vehicles
All companies regularly serviced and maintained the vehicles used on public highways and the on-site vehicles that had been leased. The frequency of services and maintenance varied between companies ranging from weekly to every six months depending on usage. All companies claimed to comply with the manufacturer’s guidelines. However, on-site vehicles owned by the companies tended by less regularly serviced and maintained.
Vehicles were observed at five companies that were poorly maintained and revealed basic but significant defects, for example bald tyres and malfunctioning lights and indicators.
4.4.3 Vehicle checks
Thirteen companies conducted daily vehicle checks and two companies conducted weekly vehicle checks. The items included in these checks were largely consistent between companies. They included lights, tyres, water, oil and brake efficiency.
However, regular checking of vehicles is a difficult procedure to implement and enforce. This was confirmed by the negative attitude of staff towards the vehicle checks. All fifteen companies required the checks to be documented but several drivers admitted that they completed the forms as and when management requested them, as opposed to on a daily or weekly basis.
Two companies had implemented systems to enforce the completion of daily checks. One company required the drivers to pay for any vehicle repairs that resulted from daily checks not being conducted. This is difficult to enforce as a vehicle malfunctioning may be attributable to a variety of causes rather than as a direct result from not conducting daily vehicle checks. The second company had a system whereby the vehicle keys would not be issued to the driver until the checks had been
18
undertaken and the appropriate documentation signed. This system can only be effective in companies where the driver is required to collect vehicle keys on a regular basis.
4.4.4 Additional control measures
The additional control measures observed included mirrors on vehicles, seat belts on vehicles and warning signs on vehicles such as ‘long vehicle’ or ‘keep clear’. These control measures tended to be implemented on vehicles used on the public highway as opposed to the vehicles limited to site use.
All companies visited had limited the speed of their goods vehicles to below sixty miles per hour, as required by law. However, one company admitted that drivers disable the speed limiter when undertaking long distance driving.
Five of the twelve companies using forklift trucks on a daily basis had limited the speed of the trucks to below twelve miles per hour. Two additional companies had found that when they attempted to limit the speed on the forklift trucks, there was insufficient torque to either lift the required load or travel up a slight gradient.
4.4.5 Overall vehicle safety
A subjective assessment was made at each site regarding the overall safety of the vehicles. The evaluation was based on whether the vehicles were so poorly maintained or inadequate that they posed an unnecessary risk to drivers of the vehicle, drivers of other vehicles, pedestrians, members of the public or the maintenance worker. It was decided that only two of the twenty companies were using vehicles that posed this unnecessary risk. It was considered that eighteen companies revealed overall adequate vehicle safety.
4.5 TRAFFIC ROUTES AND SITE SAFETY ENGINEERING MEASURES
A checklist was used at each of the twenty sites visited to determine which control measures had been implemented to ensure safety on their traffic routes. The checklist can be seen in Appendix 1. The effectiveness of individual control measures was subjectively evaluated taking into consideration the traffic flows at the site and the vehicles used. The combined effectiveness of control measures was also evaluated. Table 1 identifies the control measures observed at each of the companies visited, the number of companies that had implemented that measure and specific comments on the observed effectiveness of each measure. The effectiveness of these measures is discussed in greater depth in Section 5. The combination of control measures at each site can be seen in the summary tables presented in Appendix 2.
Table 1 Identification of measures implemented at the companies visited to increase safety on
their traffic routes
Control measure
Number of companies
in which
Comments/ Effectiveness
measure observed
Drainage 19 One company had not implemented any drainage and suffered flooding as a result. The remaining nineteen companies had implemented sufficient drainage systems to reduce this risk.
19
Lighting 18 Two companies had not implemented any lighting. Flood lighting was observed in nine companies and this was deemed more effective than street lighting. Lighting had been implemented in fifteen of the companies to ensure security rather than safety.
Firm even flooring
16 Four of the companies visited had severely pot holed flooring. All of these companies also operated forklift trucks. Two of the companies with pot holed flooring had attempted to re lay the surfacing, but had not undertaken this task effectively, resulting in the surfacing being churned up by the subsequent movement of vehicles.
Wide traffic routes
16 Four of the companies observed did not have wide enough traffic routes for vehicles to pass each other. However, none of these companies could widen the routes because of restrictions due to buildings, natural features or preservation orders.
Mirrors to aid visibility at blind junctions
3 Three companies had implemented mirrors at intersections, to increase visibility at blind junctions. The effectiveness of mirrors is questionable because visibility in the mirrors depends on how clean the mirrors are and the amount of light reflected from the mirror. The distorted image that mirrors provide combined with excess light being reflected from them may lead to the mirrors posing additional hazards rather than reducing them.
Vegetation cut back
1 One company had vegetation on either side of the traffic route. The vegetation could not be removed because of preservation orders but had been cut back sufficiently to ensure that the traffic route was as wide as possible. Vegetation did not effect any other company visited.
Reversing guide humps
4 Reversing guide humps were observed at four of the companies visited. Two of the companies had implemented speed humps as reversing guide humps. This was ineffective in one company and effective in the other. In the first company, vehicles were required to reverse up to the guide humps and stop when their rear wheels touched the humps. However speed humps are designed to be driven over rather than to stop a vehicle. The extensive damage to the barrier positioned behind the reversing guide hump indicated that the guide humps were ineffective. In the second company, vehicles were required to reverse until their rear wheels had travelled over the hump. This use of speed humps as reversing guides was considered to be effective, assuming that all vehicles using the device had the same rear overhang. Another company used a ridge in the traffic route as a reversing guide hump. The guide hump was not considered effective, as drivers were unaware of its purpose. The final company used half logs fixed to the ground as reversing guide humps. These were considered to be effective as vehicles could not easily reverse over the humps and they were inexpensive to implement.
Speed humps
6 Six companies had implemented speed humps to reduce the speed of traffic through their site. Each of the sets of speed humps observed were deemed to be fit for purpose. However, seven additional companies commented that they had not implemented speed humps because they caused loads in goods vehicles to become unstable, thereby creating an additional, unnecessary risk.
Road signs 8 Four of the eight companies observed had implemented road signs that were compliant with The Traffic Signs Regulations
20
and General Directions 1994. Based on observations made at the sites, these signs appeared to be more effective than implemented road signs that were unique to the company. This may have been due to the motorists being more familiar with the signs they were used to observing on the public highway.
Warning signs and safety posters
17 All companies that operated forklift trucks had implemented signs warning pedestrians and other drivers about their presence. One company had implemented ‘Are you driving too fast?’ signs around the site. The company had noticed a reduction in vehicle speed through the site since their implementation. Other signs implemented included pedestrian warning signs, prohibition signs and signs informing employees about the required personal protective equipment in the area.
Safety fencing
12 All of the companies that had implemented safety fencing had done so to protect the infrastructure of buildings, pipe-work or fire hydrants. It was considered that the safety fencing implemented at one company was positioned too low, as the under-run bars on vehicles were higher than the safety fence. One company had implemented a length of safety fence adjacent to a cutting, to mitigate the consequences of a vehicle egressing from the traffic route.
Canopy to protect employees from adverse weather conditions
10 Canopies were observed at ten companies. Their effectiveness depended on the width and positioning of the canopy. In one company, the canopy offered little protection because it was only approximately one metre wide. Canopies were deemed particularly useful positioned over areas where vehicles were required to travel in and out of warehouses. The canopies reduced the amount of water being taken into the warehouses on vehicle tyres.
Bollards 9 Eight companies had implemented bollards to protect the infrastructure of buildings. One company had used bollards to prevent vehicles being parked in areas where parking was prohibited.
Roundabouts 3 Three companies had implemented roundabouts. When implementing roundabouts, the turning circle and stability of vehicles using the roundabout must be considered. The effectiveness of a roundabout is increased when implemented in conjunction with appropriate road signs and road markings.
Height barriers
5 Height barriers are an effective control measure and were implemented in the companies visited effectively. They were predominantly used to prevent forklift trucks entering areas where their use was prohibited. The implementation of warning signs with the height barrier is desirable, to avoid unnecessary collisions. However, care must be taken to position the warning signs within the driver’s sight line.
‘No entrance’ barriers
6 Physical barriers were considered to be an effective method of preventing vehicle from entering a prohibited area. Physical barriers were considered to be less effective at preventing pedestrians from entering prohibited areas.
Vehicle locator system
3 Three of the companies visited had implemented a vehicle locator system. Two of these companies had implemented global positioning systems on vehicles being used on the public highway. One company used a radar system to control the warehouse vehicles. Each driver was instructed by the system where to collect goods from and the route the vehicle should take to deliver the goods to the appropriate place. The radar system organised the vehicles in such a way that collisions were eliminated.
21
Use of forklift 2 Two companies used forklift trucks periodically on public trucks on highways to transfer goods and the forklift truck between sites. public Other companies that were required to move their forklift truck highways or goods between sites transported the forklift trucks or goods
in goods vehicles. Overhead 4 Four of the companies visited required forklift trucks to collect Storage items from overhead storage. None of the companies supplied
the relevant staff with safety helmets. Two of the companies visited used overhead storage areas that were regularly accessed by pedestrians. The companies had implemented different measures to reduce the risk of these pedestrians falling from heights. One company had implemented a removable guard. However, employees tended to remove the guard at the beginning of the shift and replace it at the end of the shift. The removable guard was therefore not considered to be an effective means of protecting the pedestrians from falling from heights. The other company had implemented a one way gate. This meant that the gates could only be pushed open by a forklift truck operating from the ground floor. These were considered effective as the risk of a person falling from the storage area was significantly reduced.
Road 9 Road markings were observed in nine of the companies markings visited. The effectiveness of the road markings observed were
variable. Through observations made, it was concluded that road markings that were clear and the same as those found on the public highway were more effective than those that were faded or not familiar to the person using them.
Marked 9 Marked loading bays were observed in nine companies and loading bays were deemed effective at ensuring vehicles parked, loaded and
unloaded in appropriate places. CCTV 11 The majority of companies that had implemented CCTV used it
to ensure security. However two of the companies used CCTV footage to investigate reported accidents or to identify high risk areas and procedures.
One way 8 One way systems were observed in eight companies. For a system one way system to be effective there has to be enough space
on the site to implement it entirely. Ineffective one way systems were observed in four companies. The systems were ineffective because although a one way system operated, vehicles were still required to travel against the organised flow of traffic on a regular basis. In one company vehicles were required to reverse down the one way system to exit the site! An enforced one way system was considered to be very effective, but implementing a one way system and informing drivers of it, when vehicles still travel against the flow of traffic was considered to be creating a higher risk than if the route was two way and drivers were aware of this.
Speed activated warning signs
Displayed Speed limit
0 None of the companies visited had implemented speed activated warning signs. However, an additional site was visited solely to observe this measure. If a vehicle approaching the sign were travelling in excess of the speed limit the sign would illuminate and reveal ‘Slow 20 mph’. The company had monitored the speed of vehicles before and after the implementation of the measure and had found a significant decrease in the speed of vehicles.
16 A displayed speed limit was observed in sixteen of the twenty companies visited. Through observing the speed of the traffic at the sites visited the following observations were made.
22
§ A speed limit was considered to be more effective if staff were aware of the dangers of travelling in excess of it.
§ Signs showing the speed limit needed to be positioned in the sight line of the driver to increase effectiveness.
§ A speed limit of 5 mph was less likely to be complied with. From talking to drivers they argued that a 5 mph speed limit is unrealistic and difficult for the driver to monitor because the minimum speed that is monitored on a vehicle speedometer is usually 10 mph.
23
Table 2 identifies the control measures implemented at the sites visited to control parking and discusses the effectiveness of these measures.
Table 2 Measures implemented at the companies visited to control parking on site
Parking Number of companies measure observed in.
Comments/ Effectiveness
Sufficient parking 10 Out of the twenty companies visited, thirteen Marked parking bays Double yellow lines Yellow hatchings No parking signage Physical barriers to prevent parking Enforcement system Parking systems judged to be effective?
15 12 9
15 2
7 13
companies were deemed to have an effective parking system. Marked parking bays, double yellow lines, yellow hatchings and no-parking signage have limited effectiveness if there is insufficient parking and no enforcement system. If a company has not implemented sufficient parking facilities and does not have a system of enforcement, physical barriers to prevent vehicles parking in prohibited areas was deemed as the most effective measure.
Table 3 identifies specific deficiencies noted at some of the sites visited concentrating on those that are not directly attributable to the ineffectiveness of implemented control measures. These are in addition to the deficiencies of control measures shown in Table 1.
Table 3 Deficiencies observed on the traffic routes of companies visited
Deficiencies observed
Blind corners with no control measures Uneven flooring Untidy premises Gradient on forklift truck route Narrow access and egress routes Low electricity cable Shared access and egress Flammable liquids stored next to exit route
Number of companies in which deficiency observed
7 6 4 6 6 1 6 2
Seven of the sites visited had blind corners on their traffic routes. None of these companies had considered the implementation of control measures to reduce the risk of vehicle conflicts at these junctions. Six sites had uneven flooring on traffic routes, six sites required their forklift trucks to manoeuvre up a gradient and four sites had particularly untidy premises. Uneven flooring, gradients and untidiness were considered to be less than desirable characteristics for vehicle routes. This was particularly so for forklift truck routes, owing to the unstable nature of forklift trucks and their loads.
Six sites had narrow access and egress routes. In companies with few deliveries and minimal traffic movements this was not deemed as a significant problem. However, on sites with more frequent vehicle movements, including the movement of heavy goods vehicles, narrow access and egress routes were considered to be insufficient. Six companies shared access and egress routes with other companies. The problem identified with the shared routes was that none of the companies using
24
the route were willing to take responsibility for maintenance, repair and the implementation of safety measures. This resulted in routes with few safety control measures but heavy traffic movements and potentially frequent traffic conflicts.
One company had a very low electricity cable across their forklift truck route. There were no signs to warn drivers and no attempt had been made by the company to rectify the situation. From observations made at the site, it was apparent that a forklift truck would not be able to safely drive under the electricity cable with the vehicle forks raised. Two companies had chosen to store flammable liquids next to the warehouses’ emergency exits. This was considered to be a fire hazard and therefore less than desirable.
4.6 PEDESTRIAN SAFETY
The following factors were considered when examining pedestrian safety at each of the sites visited:
i. Segregated vehicle and pedestrian routes. ii. Pedestrian routes that are protected from vehicles. iii. Pedestrian crossings. iv. Prohibited pedestrian areas or safe havens for pedestrians to stand during
vehicle activity. v. Pedestrian deterrent paving. vi. Suitable pedestrian safety for the number of pedestrians using the site.
4.6.1 Segregated vehicle and pedestrian routes
Nine of the twenty companies visited had segregated vehicle and pedestrian routes. However, two of these companies had only put in pedestrian routes in some areas of the sites. The areas with pedestrian walkways had not been selected as a result of a risk assessment revealing intolerable risk but because there was sufficient space to implement walkways in these areas.
Four companies had indicated pedestrian routes with appropriate signage. One company had painted all pedestrian routes red, two companies had marked a pedestrian symbol on the designated routes and one company had marked a broken yellow line on all pedestrian routes. Two companies also had pedestrian gantries, raised above the shop floor. The gantries meant that pedestrians could access all areas of the site without any risk of conflict with vehicles. There were, however limited provisions for disabled people on the site, as the gantries could only be accessed via a staircase. One company had constructed a footbridge from the car park into the main building to ensure pedestrians and vehicles were entirely segregated. One company had extended speed humps into the pedestrian walkways that were positioned adjacent to the traffic route. The aim of this was to prevent vehicles travelling into the pedestrian walkways to avoid speed humps.
4.6.2 Pedestrian routes that are protected from vehicles
Seven of the nine companies with pedestrian walkways also had barriers on some of the pedestrian routes to protect pedestrians from errant vehicles. In addition to barriers, two companies had walkways that were set a distance away from the traffic routes. One of these companies used chain fencing or kerbs positioned half a metre away from the kerb of the pedestrian walkway to deter vehicles from travelling too close to the pedestrian walkway.
25
Barriers positioned alongside a pedestrian walkway prevent pedestrians from crossing the traffic route except at identified safe locations. However, the barriers are equally as effective at preventing pedestrians from rejoining the walkway if they have egressed, thereby potentially creating an additional risk.
4.6.3 Pedestrian crossings
Seven of the twenty companies visited had implemented pedestrian crossings across traffic routes. Four of these companies had crossings that were the same as those found on the public highway and three companies had used different coloured road markings, as opposed to the standard black and white stripes. These companies stated that they had not implemented a standard design because pedestrians were required to give way to vehicles on the site and the implementation of a standard design crossing may confuse the pedestrians required to use it.
One of the companies visited had crossings positioned diagonally across the traffic routes, to reflect pedestrian desire lines. Two additional companies had plans to implement such changes to their pedestrian crossings.
One of the companies had implemented a level crossing on the site for pedestrians. When a sufficient number of pedestrians were waiting to cross the traffic route, the barriers either side of the crossing were lowered to prevent vehicle access whilst the pedestrians crossed the route. Due to the infrequent traffic movements on this route, few pedestrians waited for the barriers to be lowered before using the crossing.
4.6.4 Pedestrian deterrent paving
None of the twenty companies visited had implemented pedestrian deterrent paving, so an additional company was visited who had implemented this measure. The deterrent paving was positioned on the access road to the site to encourage pedestrians to use the designated walkways to access the site. The paving was also positioned adjacent to the pedestrian crossing to discourage pedestrians from egressing from the crossing. Through observations made the pedestrian deterrent paving was considered to be fit for purpose.
4.6.5 Suitable pedestrian safety for the number of pedestrians using the site
At each of the sites visited, a subjective assessment was made as to whether the control measures implemented to ensure pedestrian safety were adequate for the number of pedestrian using the site. Twelve of the companies visited were considered to have adequate pedestrian safety. Four of these companies had not implemented any measures to ensure pedestrian safety but due to the minimal pedestrian movements on the site, pedestrian safety was deemed adequate. Similarly, one of the companies that had protected pedestrian routes in some areas and pedestrian crossings was not considered to have adequate pedestrian safety because of the large amount of pedestrian activity on the site.
4.7 SELECTION AND TRAINING
4.7.1 Selection
Twelve of the companies visited did not have a specific selection process for drivers but six of these companies trained drivers in the skills required once appointed. Two companies based their selection process on previous experience and qualifications and two companies only appointed drivers with no previous history of road traffic
26
accidents or driving convictions. Three companies tested the competency of drivers prior to appointment, two through a practical driving test and one through the completion of a questionnaire. One company only appointed drivers that lived in the area where they would be required to deliver goods.
Eleven companies required all staff to undertake a medical examination on appointment. This included a vision test for employees being appointment as drivers. Five of these companies required employees to undertake regular medicals throughout their employment in that organisation. Two companies also required regular impairment testing for drugs and alcohol, through blood and urine testing.
4.7.2 Training
Twelve of the companies visited used forklift trucks daily. All employees required to drive the forklift trucks had undertaken specific forklift truck training and gained the required operating licence. The forklift truck training included training on the safe loading and unloading of vehicles. However, nine companies supplied additional training on the safe loading and unloading of vehicles.
Four of the companies visited trained all staff in risk assessment and seven companies trained all staff in the dangers of workplace transport safety.
Eleven companies required drivers to undertake driver training and eight of these companies offered refresher training periodically. The effectiveness of training programs and selection processes are not known, as no training courses were observed and the contents of the training courses not supplied by the companies.
4.8 PERSONAL PROTECTIVE EQUIPMENT
Employees were required to wear personal protective equipment in nineteen of the twenty companies visited. Safety boots and high visibility jackets were observed in all of these companies. Other personal protective equipment included safety helmets, safety gloves, ear defenders, respirators, wellington boots and safety goggles.
Twelve companies had conducted a risk assessment to determine whether personal protective equipment was required and the most appropriate type of personal protective equipment for the different tasks undertaken. The companies visited tended to have the attitude that personal protective equipment eliminated the risks associated with workplace transport. Personal protective equipment can be used to reduce certain risks associated with workplace transport but should not be relied upon as the most effective measure. However, the one company that did not use personal protective equipment as a measure to control the risks posed by workplace transport had conducted a risk assessment for the use of personal protective equipment and deemed it as unnecessary.
Eleven companies enforced the use of personal protective equipment through educating staff on the importance of personal protective equipment, and ensuring staff observed without the appropriate equipment were suitably disciplined. The nine companies that did not enforce the use of personal protective equipment, felt that by ensuring the staff had access to the equipment, the company was complying with legislation. They believed it was the responsibility of the employee to decide whether to wear the supplied personal protective equipment. However, Regulation ten of the Personal Protective Equipment Regulations 1992 states that it is the duty of both the
27
employer and the employee to ensure that the personal protective equipment supplied is properly used.
Three of the companies visited did not pay for all of the personal protective equipment used by employees. One of the companies had identified through risk assessment that the use of safety boots in the warehouse was not essential. The company therefore subsidised the cost of safety boots, rather than supplying them with no charge, for those who chose to wear them. However, two of these companies enforced the use of personal protective equipment but required the employee to pay for it. This practice is not compliant with regulation four of the Personal Protective Equipment Regulations 1992 or section nine of the Health and Safety at Work Act 1974, that state that it is the responsibility of employers to supply and pay for safety equipment.
4.9 COST OF IMPLEMENTATION
The majority of the companies visited would not supply information about the cost of implementing their control measures. Ideally information would be gathered on the whole lifecycle of the control measure including implementation, maintenance and decommissioning but to gather this information from sources other than the companies visited was considered to be outside the scope of this project. Therefore, where possible miscellaneous information on the cost of implementing measures to control workplace transport was obtained through various supply companies, information on the Internet and Spon’s Civil Engineering and Highway Works Price Book (Davis Langdon and Everest, 1995). Additional information on cost is supplied in Appendix three.
Table 4 lists various control measures and their associated price of implementation. Many of the listed costs are estimated and the actual cost of implementation would depend on factors such as site conditions, the cost of labour and the chosen supplier. The costs are difficult to compare because some are the costs are for an entire item, such as a high visibility jacket but some of the costs are per area, such as road markings. Similarly some of the costs are estimated per item and the number required will depend on the particular item. For example, on a site one speed activated warning sign may be sufficient, but one reflectorised road stud would not.
Therefore the total cost of each control measure for a hypothetical company have been calculated, so the costs can be more easily compared. The hypothetical company has fifty employees, each requiring personal protective equipment. The company uses four forklift trucks and ten lorries on a daily basis. The area of the site is one hundred metres by one hundred metres with two traffic routes, each one hundred metres long. The site currently has no control measures.
Table 4 lists the control measures in order of cost, from the least to the most expensive. It must be remembered that the overall costs are based on a hypothetical company and can, therefore only be referred to as a comparative guide. The figures listed are the likely costs of the measures at the outset and take no account of lifespan or the maintenance required.
28
Printed and published by the Health and Safety Executive1/98
Table 4 The cost of implementing measures to control workplace transport per item and the
total costs for a hypothetical company
Control Measure
Disabled marked parking bay Yellow hatchings Traffic cones Road markings Reversing warning light Rear lens on vehicles Dropped kerbs Temporary signs Double yellow lines Standard marked parking bay Waterproof clothing Horn on vehicle Drainage Flashing amber lights on vehicle Sun visor on vehicle Plan of workplace Speed limit signs Warning signs on vehicles Hard hat Ear defenders Signage High visibility trousers Additional door for pedestrians Height barrier Mirrors on walls to aid visibility Flood lighting Speed ramps Mirrors on vehicles Audible reversing alarm Reflectorised road studs Traffic lights Safety boots Reversing guide humps Radar system to aid reversing CanopyHigh visibility jacket CCTV on vehicles to aid reversing Subway for pedestrians Crash barrier Pedestrian island Cycle lane Footway for pedestrians GPS system Speed activated warning signs Zebra Crossing Pedestrian walkway guarded by railings Extra lane Resurfacing Non skid surfacing Pelican crossing CCTV on traffic routes
Cost Number required for hypothetical
Overall cost
£6.00 each C30 5 company
£30.00 £0.75 per m 50 £37.50 £6.20 each 10 £62.00 £0.50 per m 200 £100.00
£10 each 14 £140.00 £10 each 14 £140.00 £35 each 4 £140.00
£29.11 each 6 £174.66 £2 per m 100 £200.00
£4.50 each 45 £202.50 £4.41 each 50 £220.50
£16 each 14 £224.00 £2.68 per m 100 £268.00
£20 each 14 £280.00
£25 each 14 £350.00 £89 each 4 £356.00 £70 each 6 £420.00
£42.92 each 10 £429.20 £8.93 each 50 £446.50 £8.95 each 50 £447.50
£65 each 8 £520.00 £14.18 each 50 £709.00
£800 each 1 £800.00 £800 each 1 £800.00 £150 each 6 £900.00 £225 each 4 £900.00 £165 per m 6 £990.00
£40 each 28 £1,120.00 £80 each 14 £1,120.00
£6.50 each 200 £1,300.00 £1,388 each 1 £1,388.00
£30 each 50 £1,500.00 £200 each 10 £2,000.00
£149.95 each 14 £2,099.30 £2,361 each 1 £2,361.00
£49.28 each 50 £2,464.00 £274.95 each 10 £2,749.50
£141.55 per m3 25 £3,538.75 £50 per m 75 £3,750.00
£5,000 each 1 £5,000.00 £30 per m 200 £6,000.00 £30 per m 200 £6,000.00
£575.75 each 14 £8,060.50 £5,000 each 2 £10,000.00 £7,000 each 2 £14,000.00 £99.42 per m 200 £19,884.00
£100 per m £8 per m2
£10 per m2
200 5,000 5,000
£20,000.00 £40,000.00 £50,000.00
£30,000 each 2 £60,000.00 £60,000 each 1 £60,000.00
29
4.10 COMPLIANCE WITH LEGISLATION
The main pieces of legislation that are applicable to workplace transport safety are as follows:
i. The Management of Health and Safety at Work Regulations 1999. Regulation three requires employers to make a suitable and sufficient assessment of the risks to the health and safety of employees at work and the health and safety of persons who may be affected by his undertaking. The employer also has a duty to record the findings of the assessment. Regulation thirteen requires employers to provide employees with adequate health and safety training and to refresh the training when required.
ii. The Workplace (Health, Safety and Welfare) Regulations 1992. Regulation twelve places requirements on the employer about the condition of floors and traffic routes. The floors should not be uneven or slippery, should have suitable drainage and should be kept free of obstructions. Slopes and staircases should have handrails. Regulation 17 concentrates on the organisation of traffic routes. Pedestrians and vehicles must be able to circulate in a safe manner, there must be sufficient separation between pedestrians and vehicles and traffic routes must be suitably indicated for reasons of health or safety. Traffic routes must be sufficient in number and size, be in a suitable position and suitable for the persons and vehicles using them. Regulation five requires employers to ensure that workplace equipment is maintained in an efficient state and is in good repair.
iii. The Personal Protective Equipment at Work Regulations 1992. Regulation four states that suitable personal protective equipment must be provided to employees who may be exposed to a risk at work. Regulation six requires employers to conduct an assessment to determine whether the personal protective equipment is suitable. Regulation ten requires employers to ensure that the personal protective equipment provided is properly used.
iv. The Health and Safety at Work Act 1974 (section nine) states that it is the duty of an employer not to charge employees for things done or provided pursuant to certain specific requirements.
v. The Reporting of Injuries, Diseases and Dangerous Occurrences Regulations 1995. Regulation seven requires employers to record reportable injuries, diseases and dangerous occurrences.
vi. Drivers Hours and Tachographs Rules for Goods Vehicles in UK and Europe (GV262). This document includes legal requirements regarding the monitoring of driver hours and tachographs, the nine hours daily driving limit and the requirement for drivers to take a forty five minute break after every four and a half hour driving period.
vii. The Traffic Signs Regulations and General Directions 1994. The companies visited are legally required to comply with this legislation and it is considered to be good practice to implement standard road signs normally found on the public highway.
Tables 5 to 13 show the number of companies visited that complied with the relevant sections of legislation regarding workplace transport safety. The results for each of the twenty companies visited can be seen in Appendix 2.
30
Table 5 Compliance with The Management of Health and Safety at Work Regulations 1999
Legislation The Management of Health and Safety at Work Regulations 1999
Relevant Suitable and Record findings of Adequate health and safety Requirements sufficient risk risk assessment training.
assessment Number of compliant
companies visited
7 (35%) 7 (35%) 7 (35%)
Table 5 shows that seven of the twenty companies visited had conducted suitable and sufficient risk assessments for workplace transport safety, seven of the twenty companies had recorded the significant findings and seven of the twenty companies ensured all employees received adequate health and safety training. Six of the companies visited, complied on all of the three requirements.
31
Table 6 Compliance with The Workplace (Health, Safety and Welfare) Regulations 1992
Legislation The Workplace (Health, Safety and Welfare) Regulations 1992 Relevant Even and Drainage Traffic route Handrails on Pedestrians and
Requirements non slip flooring
free from obstructions
slopes and staircases
vehicles able to circulate in a safe manner
Number of compliant
companies visited
16 (80%) 19 (95%) 16 (80%) 20 (100%) 12 (60%)
Table 7 Compliance with The Workplace (Health, Safety and Welfare) Regulations 1992
Legislation The Workplace (Health, Safety and Welfare) Regulations 1992 Relevant
Requirements Separation between
vehicles and pedestrians
Traffic route suitably
indicated
Sufficient number and size of traffic
routes
Workplace equipment
maintained and repaired regularly
Number of 7 (35%) 11 (55%) 13 (65%) 18 (90%) compliant
companies visited
Tables 6 and 7 show that the majority of companies visited had suitable drainage, even flooring that was free from obstructions, hand rails on staircases and well maintained and repaired vehicles. However, there were thirteen companies that did not separate vehicles from pedestrians, seven companies that did not have sufficiently wide traffic routes and eight companies where it was decided that vehicles and pedestrians could not circulate in a safe manner.
32
Table 8 Compliance with The Personal Protective Equipment Regulations 1992
Legislation The Personal Protective Equipment Regulations 1992
Relevant Requirements
PPE provided Assessment made Use of PPE enforced
Number of compliant
companies visited
19 (95%) 13 (65%) 11 (55%)
Table 8 shows that nineteen of the companies visited supplied employees with personal protective equipment. Thirteen of these companies had conducted an assessment to determine the most appropriate personal protective equipment and eleven of the companies visited enforced the use of personal protective equipment. Ten of the companies visited complied with all three of the relevant regulations.
Table 9 Compliance with The Health and Safety at Work Act 1974
Legislation The Health and Safety at Work Act 1974
Relevant Do not charge employees for equipment Requirements
Number of 17 (85%) compliant
companies visited
Table 9 shows that three of the twenty companies visited charged employees for at least a percentage of the cost of personal protective equipment. However, one of these companies only charged employees for personal protective equipment that was shown not to be essential through risk assessment. The use of this personal protective equipment was not enforced.
33
Table 10 Compliance with The Reporting of Injuries, Diseases and Dangerous Occurrences
Regulations 1995
Legislation The Reporting of Injuries, Diseases and Dangerous Occurrences Regulations 1995
Relevant Record reportable information Requirements
Number of 15 (75%) compliant
companies visited
Fifteen of the twenty companies visited recorded the necessary information about reportable accidents and reported them to the HSE, under The Reporting of Injuries, Diseases and Dangerous Occurrences Regulations 1995.
Table 11 Compliance with Drivers Hours and Tachograph Rules for Goods Vehicles in UK and
Europe (GV262)
Legislation Drivers Hours and Tachograph Rules for Goods Vehicles in UK and Europe (GV262)
Relevant Monitor driver hours 9 hour daily driving 45 minute break after 4.5 Requirements and tachographs limit hours of driving
Number of 8 (40%) 19 (95%) 8 (40%) compliant
companies visited
Sixteen of the twenty companies visited did not monitor driver hours and did not require drivers to take regular breaks from driving. However, nineteen of the companies visited did not allow drivers to work in excess of forty-five hours each week, which equates to nine hours of driving per day, presuming a five-day week.
34
Table 12 Compliance with The Traffic Signs Regulations and General Directions 1994
Legislation The Traffic Signs Regulations and General Directions 1994
Number of 4 (20%) compliant
companies visited
The companies visited are required to comply with The Traffic Signs Regulations and General Directions 1994 and it was considered best practice to comply especially on sites used by members of the public. Four of the companies visited complied with these Regulations. Members of the public regularly used three of the compliant sites.
The summary table in Appendix 2 on compliance with legislation, lists each of the appropriate regulations to workplace transport safety and shows which of the companies visited complied. The percentage of the Regulations each company visited complied with was also calculated. These percentages are shown in Table 13.
Table 13 Overall compliance with relevant legislation for each of the companies visited
Table 13 shows that the levels of compliance with the legislation relevant to workplace transport safety ranged from 19% to 100%. The average percentage is 63% compliant with relevant legislation.
35
5. DISCUSSION
After visiting twenty companies and examining their safety management systems, observing their work practices, inspecting their control measures and evaluating their workplace transport safety, a model workplace transport safety management system was devised. This was based on the insights gained from the company visits and on HSE guidance HS(G)65 and British Standard 8800. It is considered that through the integration of workplace transport into a recognised safety management system, workplace transport safety could be improved. The main components of this system are summarised in diagram 1.
Diagram 1 Workplace Transport Safety Management System
ion
A i ii
Ri§
§
§
i§
is
§ il
§ iivi
§ i
i ing
§ Mi i
§ Miti
-icles
i ii
- ii
Safety Documentation
External awareness and guidance
Legislat
Training and education
Communication
cc dent and Inc dent Report ng System
sk Assessment Identify Hazards Analyse the consequences Estimate/ measure r sks Determine whether risktolerable Decide on r sk contro strategy
Hierarchy of Controls Eliminate r sks or substitute act ty Combat r sk at source by eng neercontrol measures
nim se risk by suitable safe systems of work
gate the consequences.
Cost of Implementation
One way system - Automated veh
- Personal protective equipment - Safety fencing
- Overtak ng restr ctions - Des gnated areas for reversing
CCTV on vehicles to aid revers ng - Segregated pedestr an routes
SAFETY CULTURE
EXAMPLES
SAFETY CULTURE
36
It is likely that adequate workplace transport safety can only be achieved through the effective implementation of all stages. Only two of the twenty companies visited had implemented all aspects of this system. All other companies visited had at least one significant element missing. The missing element was largely the conducting of a suitable and sufficient risk assessment, which only seven of the twenty companies visited had achieved. A suitable and sufficient risk assessment should identify all hazards, including continuing hazards and hazardous events, analyse the consequences, estimate or measure the risks, determine whether the risk is tolerable and then decide on a risk control strategy to reduce risks to a tolerable level. The risk control strategy should reflect the HSE hierarchy of risk control measures (HS(G)65) which is as follows:
i. Eliminate risks or substitute activity, substance or process by a less hazardous activity/ substance/ process.
ii. Combat risk at source by engineering control measures. iii. Minimise risk by suitable safe systems of work. iv. Mitigate the consequences.
Findings of the risk assessment must be fully documented and suitably communicated to the appropriate members of staff.
One of the areas that companies were not undertaking sufficiently with regards to risk assessment was identifying the hazards. Two of the companies had relied on the hazards identified in the HSE guidance ‘Five Steps to Risk Assessment’ which was not considered to be sufficient. One company had conducted a generic risk assessment intended to cover all of their twenty sites and had not considered the different risks presented at each site and two of the companies relied on external consultants to conduct the risk assessments without detailed knowledge of the site activities and processes.
However, some of the companies visited seemed to have identified all hazards. Two companies used CCTV footage to identify high risk areas and procedures, two companies used accident data to identify hazards and one company held a monthly awareness forum where staff were required to identify the hazards involved in the tasks they were required to undertake. All of these methods were considered to be good practice.
Four of the companies visited had been issued with improvement notices from the HSE regarding workplace transport. It is interesting to note that with the improved links with the HSE and guidance from inspectors, all four of these companies had conducted a suitable and sufficient risk assessment for workplace transport. This information combined with the observation that two other companies relied on hazards outlined in ‘Five Steps to Risk Assessment’ guidance indicates that additional guidance on conducting risk assessments for workplace transport may be required. The fact that six of the companies visited had not conducted any form of risk assessment for workplace transport suggests that awareness of the risks posed by workplace transport and the legal requirement to conduct a risk assessment needs to be raised.
One of the key elements of risk assessment is to implement a suitable risk control strategy to reduce the identified risks to a tolerable level. Nineteen of the companies visited had used personal protective equipment as part of this risk control strategy. Personal protective equipment falls within the remit of the final measure suggested by the hierarchy of control measures. Over fifty percent of the companies operated from sites with adequate drainage, lighting, warning signs, safety posters, speed limit
37
signs, wide traffic routes, firm even flooring, safety fencing to protect infrastructure and CCTV. However, with the exception of signage, these measures had not been implemented primarily for safety or as remedial measures to combat identified risks.
Engineered control measures should be used to eliminate or reduce the risks identified through the proactive risk assessment process or through reactive accident investigation. There is no ‘one size fits all’ solution to the implementation of control measures. It is not possible to state for example, that all companies with pedestrians should implement a zebra crossing, or all companies using heavy goods vehicles should implement traffic lights, because the effectiveness of control measures largely depends on the individual company. A control measure that is considered to be effective in one company may give rise to additional hazards in another. The effectiveness of individual control measures depends on the following factors:
§ The types of vehicles being used § The number of vehicles being used § The number of traffic movements § The tasks being undertaken on the site § The dimensions and condition of the site § The number of pedestrians § The number of members of the public using the site. § The safety systems implemented and the overall safety culture of the company.
Once suitable control measures have been implemented to reflect findings of the risk assessment, their effectiveness depends on them being used or followed appropriately and adequately maintained. For example, road markings and road signs are potentially effective measures for controlling traffic movements, but if the road markings have been partially worn away or the road signs are dirty or broken their effectiveness is immediately reduced. With regards to road markings and signage, their effectiveness is increased if the people using them are familiar with them. This can be achieved through education and training but it is considered to be a better option to implement measures that are consistent with those found on the public highway, as these are measures people are already accustomed to.
Similarly pedestrian crossings, pedestrian routes and one way systems are potentially effective control measures assuming that the pedestrians use the allocated walkways and designated crossing areas and drivers follow the one way system.
Engineered control measures can be overridden or violated if there is a desire to do so. For example, in one of the companies visited the drivers disabled the speedlimiting device on their vehicles. There are several approaches to solving this problem. One is to use enforcement, penalties or incentives to persuade people to accept and use the control measure. Another is to improve their understanding of the risks involved and the importance of the control measures. A third approach is to modify the control measure itself - either so that it is more difficult to over-ride or so that it is becomes more acceptable. For example, one company had implemented one-way doors to reduce the risk of pedestrians falling from heights, whereas the removable guard used in another company for the same purpose was simply removed by the staff. Similarly, three of the companies visited had implemented or planned to implement pedestrian crossings that followed the identified pedestrian desire lines.
There is likely to be a beneficial, two-way interaction between engineered control measures and measures based on training and education. Not only will the
38
education improve acceptance of engineering measures as mentioned above, but the fact that the company has introduced engineering measures is likely to reinforce the perceived importance of what is learned during training. Seven of the companies visited trained staff in the dangers of workplace transport and ten companies were deemed to have adequate systems in place to communicate safety issues. Communication and adequate training should be key elements in any safety management system and it is likely that improved communication and training would improve the safety culture of a company and subsequently workplace transport safety.
Adequate communication is also vital for the effective implementation of safety documentation. Sixteen of the companies visited had a safety manual, safety procedures and documented safe working practices, but only ten of these companies had integrated the safety procedures into normal working practices. These companies were the same ten companies deemed to have effective communication systems. Six of the companies visited had documented safety procedures solely to comply with legislation. Similarly, seven of the companies visited recorded accident data to just ensure compliance with The Reporting of Injuries, Diseases and Dangerous Occurrences Regulations 1995.
The collection and analysis of information about accidents, incidents and near misses can, however, be a useful tool. Through the analysis of such data, high-risk areas and processes can be identified and remedial action taken. Lessons learnt through accident investigation and near miss reports can be fed back to staff to raise awareness and to reduce the likelihood of an undesired event reoccurring. Two of the companies visited used accident data for this purpose and an additional three companies used the data gathered to assess the companies’ safety performance.
However, for accident data to be meaningful and constructively used, the information gathered must be accurate. Employees should be educated on the reporting system and the importance of recording such data. If employees are to report accidents, incidents and near misses, they must believe that these reports are valued and that they will not be personally penalised or disciplined as a result. However, failure to report an important event should have consequences for the individual or team. Eight of the companies visited offered a blame free culture and stated that they investigate an accident not a person. However, four of the companies visited financially penalised individuals involved in accidents. It is though that such action is likely to discourage the reporting of accidents and cause difficulties in identifying the root causes and the remedial action required.
Out of the twenty companies visited, two companies were considered to reveal good practice in all elements of the identified workplace transport safety management system. However, a further four companies revealed good practice in a large percentage of the elements of the system. These companies will be discussed in greater depth in the case studies section.
39
6. CONCLUSIONS
Two of the twenty companies visited were deemed to have adequate systems and control measures to ensure workplace transport safety. The remaining eighteen companies had not implemented at least one key element to ensure workplace transport safety. It is considered that workplace transport safety can only be achieved through the implementation of an entire system, including safety documentation; risk assessment; accident, incident and near miss reporting and analysis; training and education; communication; risk assessment and the implementation of control measures to reduce identified risks.
If one or several elements of the system are omitted, the system becomes less effective. For example one of the companies visited had only implemented safe systems of work to control workplace transport. Through observations it was noted that as the frequency of traffic movements increased, the compliance with the safe systems of work decreased. Had engineered control measures been implemented this may have encouraged employees to comply with the safe systems of work by creating physical reminders of the systems. Engineered control measures should be used to enforce safe systems of work and the lessons already learnt through education, training and awareness.
The effectiveness of control measures depends on several variables, including the types and number of vehicles being used, the frequency of traffic movements, the tasks being undertaken, the dimensions and condition of the site, the number of pedestrians and members of the public, the safety systems implemented and the overall safety culture of the company.
The companies visited had a lower level of compliance with The Traffic Signs Regulations and General Directions and The Management of Health and Safety at Work Regulations 1999 than with the other legislation examined. This may be because companies are not aware of the need to comply with the traffic signs regulations and companies tend not to be aware of the need to conduct a risk assessment for workplace transport.
Interestingly, four of the companies visited had been issued with improvement notices from the HSE regarding workplace transport. Since receiving these notices, these companies had all conducted suitable and sufficient risk assessments for workplace transport and showed a high level of awareness of the risks. This indicates that additional guidance on the content and the need to conduct a risk assessment for workplace transport may be required to encourage other companies to comply. An additional three companies felt that the safety of their site could be significantly improved if they were able to communicate with the HSE without concerns about negative repercussions. They felt that the HSE should demonstrate a proactive approach to safety and conduct inspections before an accident happens or a safety issue raised.
A tendency was observed at the companies visited to implement systems and measures that they were already familiar with. For example, there was a high level of vehicle safety including maintenance and repair, and the most frequently implemented control measures were standard measures that are not necessarily implemented for safety, for example drainage, lighting, CCTV and even flooring. Few companies had implemented measures specifically to ensure workplace transport safety, for example speed activated warning signs, pedestrian deterrent paving and one way systems. These measures were more likely to be implemented in
40
companies that had conducted a risk assessment on workplace transport and had identified the specific risks that needed to be reduced.
These conclusions are based on inspections and findings made at twenty companies. It would be desirable to conduct further, more in depth evaluations on a larger sample of companies to ensure that the conclusions drawn are applicable generally.
41
7. RECOMMENDATIONS FOR FURTHER WORK
The findings of this research have highlighted areas where further work may be required. These are outlined below:
§ Develop guidance for companies on conducting a risk assessment for workplace transport.
§ Develop awareness material for companies on the role of the HSE. § Six of the companies visited subcontracted long distance deliveries of goods to
road haulage companies. This research received a very low response rate from road haulage companies, so it would be desirable to conduct further research on workplace transport safety in this industry sector.
§ Validate the workplace transport safety management system developed from the findings of this research.
§ Examine the effectiveness of health and safety training, in particular training on workplace transport safety.
§ Gather further information on the costs of control measures including cost of implementation, maintenance and decommissioning.
42
8. REFERENCES
BS 8800: 1996 Guide to occupational health and safety management systems.
Department of the Environment, Transport and the Regions (2000), Drivers’ hours and tachograph rules for goods vehicles in the UK and Europe, GV262
Health and Safety Commission (1999), Newsletter, Issue 127, October
Health and Safety at Work Act (1974). London: HMSO
Statutory Instrument (1999) Management of health and safety at work regulations No 3242 London: HMSO
Statutory Instrument (1995) The reporting of injuries, diseases and dangerous occurrences regulations No. 3163 London: HMSO
Statutory Instrument (1996) The construction (health, safety and welfare) regulations No. 1592 London: HMSO
Statutory Instrument (1998) The provision and use of work equipment regulations No. 3163 London: HMSO
Statutory Instrument (1992) The personal protective equipment regulations at work regulations No. 2966 London: HMSO
HSE (1992) Workplace (health, safety and welfare): Approved code of practice. L24 HSE Books
HSE (1995) Workplace transport safety: Guidance for employers. HS(G)136 London: HMSO
Institute of Occupational Medicine (1998) The evaluation of the Six-Pack Regulations 1992. HSE Contract Research Report 177/1998.
Langdon D and Everest (1995) Spons civil engineering and highway works price book. London: E & FN Spon
43
ACKNOWLEDGEMENTS TRL Limited wishes to thank the twenty-two companies who participated in this research project for their co-operation and assistance. The author gratefully acknowledges the contribution made to site visits by TRL colleagues, Judith Barker, Jayne Dando-Budgen, Sam Keating, Lee Smith and Tim Sterling.
44
9. CASE STUDIES
45
46
9. CASE STUDIES
9.1 CASE STUDY ONE (Manufacturer and distributor of drink)
Number of employees: 500 per shift
Vehicle Type Quantity (per day)
Articulated lorries 30
Forklift trucks Numerous
Cars 500
Tugs 4
§ All accidents, incidents and near misses are reported. Near misses are
underreported but it has improved in the past year through training and
awareness. All accidents are investigated and reports are analysed to find trends.
§ Risk assessments have been conducted for all vehicles and all tasks. They are
reviewed annually unless there is a change, in which case they are reviewed
immediately so changes can be incorporated. Traffic and pedestrian surveys are
also undertaken, so areas with more traffic movements can be identified and
additional measures implemented.
§ A yellow dotted line leads pedestrians around the site on a safe route.
(Photograph 1)
Photograph 1
47
§ Some of the pedestrian crossings are red and white stripes, to ensure that
pedestrian give way to traffic rather than expecting the route to be their right of
way, as it is on the public highway. Pedestrian crossings follow desire lines, so
many are set at 45 degrees to the route (Photograph 2)
Photograph 2
§ Black and yellow chain fencing is used to prevent pedestrians from egressing
from the route. This is situated approximately 0.5 metres away from the kerb, to
prevent vehicles driving too close to the pedestrian walkway. (Photograph 3). In
some areas, an additional kerb has been implemented for the same purpose
(Photograph 4).
Photograph 3 Photograph 4
48
§ Pedestrians and forklift trucks are always segregated. Height barriers positioned
to prevent forklift trucks entering parts of warehouse where their access is
prohibited. (Photograph 5)
Photograph 5
§ Non-slip flooring has been implemented in the warehouses where forklift trucks
are required to operate.
§ Barriers have been positioned on the corners of traffic routes to prevent vehicles
taking corners at high speed. (Photograph 6)
Photograph 6
49
§ Pedestrians are prohibited from reversing areas unless there is a protected
walkway. Signage has been implemented to remind pedestrians of the prohibited
areas (Photograph 7). Signage has been implemented on pedestrian routes
where a risk is posed from vehicles, such as ‘Beware vehicles reversing’ and
‘Use extreme care when crossing here’ (Photograph 8). Some areas have a safe
haven for pedestrians to stand whilst vehicles are reversing.
Photograph 7 Photograph 8
§ Hazard lights are used on vehicles when reversing.
§ Reversing guide humps have been implemented in appropriate places. The
guide humps used are actually speed humps normally used to reduce vehicle
speed. However, vehicles are required to reverse their back wheels over the
hump before stopping. Therefore, their purpose on this site is not to stop
vehicles, but to guide them (Photograph 9).
Photograph 9
§ A one way system has been implemented throughout the site.
§ The company has implemented a dedicated lane on the access route to the site
for emergency vehicles.
50
§ A sign has been positioned on the exit route from the site saying ‘please drive
carefully, safety does not stop here’. This sign is for the benefit of staff and
visitors as well as goods vehicle drivers. Other signs implemented include stop
signs and speed limit signs (Photograph 10).
Photograph 10
§ Amber lights are located where a traffic route meets with a fire exit. If there is a
need to evacuate from the building, the lights flash to stop vehicles and allow
pedestrians out of the building (Photograph 11).
Photograph 11
51
§ Mirrors have been implemented on buildings where a blind corner exists to aid
visibility (Photograph 12).
Photograph 12
§ The site is flood lit.
§ The company has implemented marked parking bays and loading bays including
a specific trailer park, where trailers can be collected and shunted to the
appropriate areas (Photograph 13). Double yellow lines have been implemented
to show no parking areas.
Photograph 13
§ Driver’s hours and breaks are monitored weekly through the analysis of
tachographs. Driving licences are also checked annually for any convictions.
§ Daily checks are conducted on vehicles, for example tyres, water, oil, lights and
brakes. Drivers are required to undertake the checks and sign a check sheet
before the vehicle keys are given to them.
§ A video is shown to all visitors and contractors on arrival on site. The video
includes information about where to park, where to load and unload, speed limit
and transport movement awareness, identification of pedestrian routes, hazards,
control measures, PPE and incident reporting system.
§ If drivers are not experienced they are accompanied on the job until they are
considered to be competent. Drivers are given medicals and vision tests every
52
three years. There is a very strict no alcohol policy on site and employees are
aware that drinking on duty would lead to instant dismissal.
§ All staff are trained in the dangers of workplace transport and the company
procedures, to ensure the employees health and safety.
§ Any expenditure for safety does not need to be justified.
53
9.2 CASE STUDY TWO (Hospital)
Number of employees: 7,500 employees (plus members of the public)
Vehicle Type Quantity (per day)
Cars 2000
Vans 100
Heavy goods vehicles 50
Trucks 50
Bicycles 100
Motorcycles 100
§ The company has developed their own system for incident and accident
reporting, which is now being used by other similar companies. The accident
reporting policy requires all staff to report near misses, as well as accidents and
incidents. All new staff undertake a two-day induction training course where the
importance of reporting accidents, incidents and near misses is lectured on. The
training course combined with a ‘no blame’ culture has significantly increased the
number of accidents and near misses that are reported. All information about
accidents, incidents and near misses is recorded on an incident form that is
subsequently entered onto a database. Information from the database is
presented on a monthly, quarterly, half yearly, annually and biannually basis to all
departments. This form of feed back encourages all people to learn lessons from
accidents that have happened in other areas of the company and enables a
proactive approach to be taken to prevent a more serious event occurring. The
analysis of the database identifies high-risk areas, which are then prioritised for
action. These reports help to justify expenditure on safety.
§ A risk assessment is conducted to identify the personal protective equipment
required for employees. It is ensured that any equipment purchased is of the
highest standard.
§ Transport risk assessments have been undertaken in all areas and suitable
control measures identified.
54
§ The company has implemented segregated vehicle and pedestrian routes. In
identified high-risk areas pedestrian walkways are protected by barriers
(Photograph 14) or set back from the traffic route (Photograph 15). Pavements
with dropped kerbs have been implemented at all designated pedestrian crossing
areas. Bollards are also used to protect the pedestrian walkway from reversing
vehicles (Photograph 16). A canopy has been implemented to protect people in
adverse weather conditions. (Photograph 14)
Photograph 14 Photograph 15
Photograph 16
§ The majority of the vehicles have been fitted with an audible alarm that states
‘vehicle reversing’ when the vehicle engages reverse. Recently purchased
vehicles also have sensors on to warn drivers if they are reversing too close to an
object. All vehicles have been labelled with the appropriate warning signage, for
example long vehicle
55
§ The frequency of traffic movements have been reduced on the site through:
i. Implementing a supplies building positioned away from the main workplace
and public areas. Goods are then transported locally, on an ad hoc basis
rather than the goods vehicles delivering all over the site.
ii. Limiting delivery times of goods to times when there are fewer pedestrian
movements.
iii. Implementing a company bus service that transports employees and
members of the public between sites and to public transport stations.
§ Parking on the site is controlled by:
i. Double yellow lines and yellow hatching (Photograph 17).
ii. Bollards located on grass verges to prevent parking in unsuitable locations,
for example in motorists sight lines at junctions (Photograph 18).
iii. Keep clear road markings to keep entrances clear of parked vehicles
iv. No parking road markings on adjoining roads to egress points to ensure that
vehicles do not park in motorists sight lines. (Photograph 19).
v. Marked parking bays. (Photograph 20).
Photograph 17 Photograph 18
Photograph 19 Photograph 20
56
§ CCTV has been implemented to monitor all traffic routes (Photograph 21).
Photograph 21
§ Vegetation cut back from the traffic route, to ensure the traffic route is as wide as
possible (Photograph 22).
Photograph 22
§ A one way system has been implemented on some of the traffic routes. This is
enforced with the appropriate signage. Two-way traffic signs have been
implemented to remind motorists when they are using two-way traffic routes.
§ High visibility no entry signage and a barrier have been implemented to prevent
vehicles entering prohibited areas. Good directional signage has been
implemented throughout the site. Road signs and road markings that have been
implemented comply with the Road Traffic Act. Due to the considerable number
57
of members of the public using the private road network, the company considered
this to be essential. (Photograph 23)
Photograph 23
§ Speed humps have been implemented in areas where they will not disrupt the
loads of goods vehicles.
§ Roundabouts have been implemented at identified high-risk junctions. Signage to
warn motorists of the approaching roundabouts has been positioned within the
motorists’ sight lines.
§ Tachographs have been implemented on all good vehicles. These are analysed
to monitor driver hours and the frequency and duration of breaks. This
information is cross-referenced with the information supplied on time sheets.
§ All drivers undergo formal external driver training, which is refreshed annually.
§ Drivers are required to have a medical every twelve months, which includes
vision and impairment testing.
§ The company safety manager has the power to issue internal prohibition notices
if an activity is identified as posing an intolerable risk.
§ All employees and contractors are give adequate training on workplace transport
safety.
58
9.3 CASE STUDY THREE (Hospital)
Number of employees: 3,500 (plus members of the public)
Vehicle Type Quantity (per day)
Cars 3000
Vans 200
Forklift trucks 2
Heavy goods vehicles 20
Trucks 30
Tugs 20
Floor cleaners 50
Bicycles 80
Motorbikes 20
§ All accidents, incidents and near misses are reported and logged. Staff are
encouraged to report accidents as it is one way that they can bid for money to
improve safety – it provides evidence to justify expenditure. An accident, incident
or near miss is investigated rather than a person. Staff are not disciplined for
having an accident but drivers displaying unsafe behaviour, regardless of
whether they have had an accident are disciplined. Through the analysis of
accident data they have noted significant accident reduction since the
implementation of control measures.
§ Risk assessments and traffic assessments are regularly undertaken on the site.
High-risk areas or operations are identified and measures implemented to reduce
or control the risk. They are currently making numerous improvements to the site
including segregating pedestrians and vehicles by building a covered footbridge
between the car park and the main building (Photograph 24).
Photograph 24
59
§ They are also implementing additional car parking, resurfacing traffic routes,
implementing flood lighting and marked parking bays. They are also improving
access and egress to and from the site, implementing additional signage
positioned in the sight line of motorists, additional speed limit signs and directions
to the necessary departments. A pedestrian crossing that is currently situated on
a bend is being removed and positioned in a safer, more suitable location
(Photograph 25).
Photograph 25
§ As part of the improvements for workplace transport, a new car park has been
developed. Zebra crossings have been implemented leading to and from all
access and egress points to and from the car park and from the central
pedestrian walkway. The pedestrian walkway is guarded from vehicles by
bollards and is indicated with suitable signage, yellow hatchings and pictures of
pedestrians on the surfacing (Photograph 26).
Photograph 26
60
§ There is a height barrier entering the car park to prevent large vehicles entering
the car park (Photograph 27).
Photograph 27
§ Vehicles being clamped enforce parking restrictions. If the position of the vehicle
is deemed dangerous, it is towed away and then clamped.
§ Dropped kerbs have been implemented at all designated pedestrian crossing
points (Photograph 28).
Photograph 28
§ Contractors undertaking construction work on the site are required to erect a site
board stating the required personal protective equipment, current hazards or
risks, the necessary induction training, policy on accident, incident and near miss
reporting, the number of reportable accidents to date and their target (Photograph
29)
Photograph 29
61
§ Staff are supplied with PPE as and when they require it, for example high visibility
jackets, safety boots and hard hats in construction areas. Risk assessments are
used to identify what PPE is needed and in what situations.
§ Vehicles with rear windows have been fitted with rear lenses fitted to aid
reversing.
§ Tugs are fitted with flashing amber lights and audible reversing alarms.
§ Staff are given both internal training and external training on safe driving and the
dangers of workplace transport.
§ Tug drivers are taught how to manoeuvre the tugs safely, especially indoors
where there is likely to be pedestrians.
§ Speed ramps entering the site because the speed of vehicles was identified as a
risk (Photograph 30).
Photograph 30
§ Signs showing that roads have returned to two ways after a one way system
(Photograph 31).
Photograph 31
§ Road markings have been implemented on all traffic routes and these comply
with the highway road markings.
62
9.4 CASE STUDY FOUR (Manufacturer and distributor of food)
Number of employees: 1,500
Vehicle Type Quantity (per day)
Cars 150
Vans 20
Forklift trucks 10
Heavy goods vehicles 60
§ The company encourages employees to report accidents through the
implementation of crash data recorders. Prior to driving a vehicle, a personal
identification number must be input into the recorder by the driver. The crash
data recorder records five seconds prior to impact and five seconds after impact.
The accidents can then be linked directly to the person driving the vehicle at the
time of the accident.
§ Staff are disciplined if an accident revealed by the crash data recorder had not
been officially reported. This has increased the reporting of accidents and
incidents, at the same time as seeing the reduction in accidents. All accidents are
investigated and the root causes identified and corrective action taken. The crash
data recorders also monitor driver hours. The company has found that there has
been a severe reduction in the unauthorised usage of vehicles.
§ Accident investigation conclusions are fed back to staff on a weekly basis. This
is communicated through staff notice boards and e-mail. Depending on the
severity, accidents are also communicated at the start of a shift or immediately.
63
§ All areas of site can be accessed via pedestrian walkways; there are also
numerous zebra crossing points. Speed bumps extend into the pedestrian
walkway, to discourage vehicles from driving in the pedestrian walkway to avoid
the speed humps (Photograph 32).
Photograph 32
§ Zebra crossings are going to be replaced at a 45-degree angle to suit pedestrian
desire lines.
§ Pedestrian routes are marked with a symbol of a pedestrian (Photograph 33).
Photograph 33
§ Vehicles’ speed is limited to 12 mph. This was originally 10 mph but the forklift
trucks could not develop enough power to get up the incline.
64
§ Forklift trucks have reversing lights, flashing beacon, audible reversing alarm and
horns.
§ Vehicles are serviced and maintained monthly, unless there is a fault with the
vehicle. The maintenance company is on twenty four hour call out.
§ The company has implemented marked parking bays, loading bays and
segregated marked bays for tankers to avoid congestion on the traffic routes
(Photograph 34).
Photograph 34
§ Crash barriers are positioned adjacent to traffic routes to protect the infrastructure
of buildings. Crash barriers are also positioned in areas where it would be unsafe
to park (Photograph 35).
Photograph 35
65
§ There is a displayed 10-mph speed limit throughout site. A 5-mph speed limit
was deemed inappropriate as the majority of vehicles register 10 mph as the
minimum speed (Photograph 36).
Photograph 36
§ Give way and right of way signage has been implemented at all junctions
(Photograph 37).
Photograph 37
66
§ ‘Are you driving too fast’ signage is located throughout the site. These were
supplied by the council on request as part of the councils drive safely scheme.
(Photograph 38)
Photograph 38
§ Forklift trucks are not permitted inside the warehouses, so height restriction
barriers have been implemented to prevent such vehicles entering (Photograph
39).
Photograph 39
§ As a rule banksmen are not used to aid reversing, as it was felt that this would
increase the risk of an accident, as pedestrians are not allowed in the designated
reversing areas.
67
§ The company has implemented a system that requires drivers to hang their
vehicle keys on a hook positioned on the loading bay door prior to opening the
loading bay hatch. When the hatch is opened the keys are suspended out of the
drivers reach, meaning the vehicle cannot be driven away until the loading bay
hatch has been closed. The company has experienced drivers disregarding this
system, but this has always resulted in disciplinary action (Photographs 40 and
41).
Photograph 40
Photograph 41
§ All contractors are required to attend induction training before they are issued
with a permit to work. Site procedures, including transport safety procedures are
related to visitors at reception.
§ All drivers undertake an internal driving course and test on appointment. Drivers
are re-tested intermittently or if they have an accident. Drivers are also given
instructions on safe driving, in the form of a video presentation.
§ Shifts are briefed monthly on safety issues. All issues are discussed in a two
way forum. This has been happening for four months and there is a marked
improvement in staff’s attitude towards safety.
68
9.5 CASE STUDY FIVE (Manufacturer and distributor of drink)
Number of employees: 350
Vehicle Type Quantity (per day)
Cars 700
Vans 60
Forklift trucks 6
Heavy goods vehicles 50
Trucks 20
Tugs 12
Automated vehicles 4
Bicycles 40
Motorcycles 6
§ Accidents, incidents and near misses are reported and investigated. The health
and safety committees drive the ownership of safety out to the shop floor workers
to encourage incident reporting. Staff are also trained in the importance of
reporting accidents. Periodically reports are issues to all staff showing the
number of accidents over preceding months and years. The apparent reduction
in accidents motivates staff to work safely. Accident reports are also used to
justify expenditure on health and safety improvements. All reports are
investigated and remedial actions are noted. These are closed off when the
action is complete. Reports are regularly audited to ensure that all actions are
fulfilled. The company was experiencing a high rate of accidents by contractors.
This has been improved through increased awareness, induction training, the
development of a preferred contractor list and by not allowing contractor vehicles
on site. Employees of the company who have undertaken specific training
undertake all vehicle movements.
69
§ Pedestrian walkways are situated throughout the site. These are painted red
(Photograph 42)
Photograph 42
§ Pedestrian gantries are located throughout the warehouse, to enable the
processes to be observed without being on the shop floor. They also provide a
safe route for pedestrians to take, avoiding potential conflict with workplace
transport. They have a guardrail surrounding them (Photograph 43).
Photograph 43
70
§ Pedestrians are penned into the walkways from the access points to the building.
There are strategic points where the pedestrian walkway can be left but the
gateways are positioned adjacent to pedestrian crossings, which lead to other
pedestrian walkways. Crash barriers are located at pedestrian access points to
protect the pedestrian (Photograph 44)
Photograph 44
§ Sensors are located on doorways leading to pedestrian free areas to detect
pedestrians if they enter, sound an alarm and shut all machinery down. This is
particularly important in the area where the manufacturing process is conducted
by automated vehicles.
§ Automatic guided vehicles are used in one of the warehouses to eliminate both
pedestrians and vehicles from the area. The automated vehicles have front and
rear sensors that automatically stop the vehicle if it is about to collide with an
object.
§ There are segregated car, good vehicle and pedestrian routes entering the site.
§ Mirrors are located at intersections to aid visibility.
§ Drivers are expected to check lights, brakes, oil, water and batteries daily. There
is a checklist in each vehicle to remind the driver of what to check. The check
sheets are audited regularly.
§ Contractors, visitors and employees wear different coloured hats to differentiate
between them. This ensures that there is no presumed safety knowledge
between visitors and employees, for example. First aiders wear green hats so
they can be easily identified. It is a disciplinary offence to wear the wrong
coloured hat.
§ All drivers are assessed for competency periodically and refresher training given.
71
§ There is currently a roll out program of risk assessment training to all staff.
§ Health and safety committees meet with a safety representative from each of the
warehouses. They drive the ownership of safety out to the shop floor workers, to
improve the safety culture of the company.
72
9.6 CASE STUDY SIX (Storage and distribution of food)
Number of employees: 2000
Vehicle Type Quantity (per day)
Heavy goods vehicles 250
Cars 1500
Forklift trucks 26
Picking truck 120
Unloading trucks 20
Pallet trucks Numerous
§ Risk assessments have been undertaken to identify the appropriate personal
protective equipment for employees. Employees are supplied with waterproof
jackets, high visibility jackets, gloves and goggles. The company requires staff to
wear safety helmets in racked areas.
§ Risk assessments have been conducted in consultation with all employees
concerned for workplace transport. They are reviewed annually or more
frequently if required. A safety committee made up of a cross section of staff
meets regularly to discuss risk assessment findings and other safety issues.
§ As a result of the risk assessment findings, the company has implemented
marked pedestrian routes that are protected from vehicles by a barrier
(Photograph 45). They have also implemented a pedestrian crossing with
flashing amber lights and dropped kerbs. (Photograph 46)
Photograph 45 Photograph 46
73
§ The road markings used are same as those found on the public highway
including the word ‘slow’ on the traffic route surfaces to remind drivers to reduce
their speed in higher risk areas (Photograph 47).
Photograph 47
§ All traffic routes are marked with the appropriate road markings.
§ Areas of the traffic route are marked with yellow hatchings to ensure that vehicles
to not park in vehicle turning areas (Photograph 48).
Photograph 48
§ A one way system operates through the majority of the site.
74
§ Speed limit of 15 mph is adequately displayed throughout site both on signs and
marked on the traffic route (Photograph 49).
Photograph 49
§ Audible reversing alarms are fitted to good vehicles, but these can be switched
off if the vehicle is reversing at night-time in residential areas.
§ On site, vehicles are required to use their hazard warning lights when they are
reversing.
§ Height barriers are used at the loading bay openings, to prevent forklift trucks
entering the vehicle being loaded (Photograph 50).
Photograph 50
§ The loading bays are controlled with a traffic light system. A vehicle is only
permitted to leave the loading bay when the traffic light is green indicating that it
is safe to move the vehicle (Photographs 50 and 51).
75
Photograph 51
§ Vehicle movements within the warehouse are controlled by a radar system. Each
driver was instructed by the system where to collect goods from and the route the
vehicle should take to deliver the goods to the appropriate place. The radar
system organised the vehicles in such a way that collisions were eliminated. In
addition to this, forklift trucks were required to sound their horn at intersections.
§ Tachographs are fitted to all vehicles. They are analysed by an external company
to investigate any public complaints and analysed internally to monitor driver
hours.
§ Driving licenses are checked annually to ensure that all drivers are legally
allowed to drive on public highways.
§ Drivers are selected on experience and qualifications. They are then trained to
the company standard on a three-day induction course. A qualified driving
instructor assesses drivers annually, unless it is required more frequently. All
employees are retrained in the dangers of workplace transport and the safe
loading and unloading of vehicles every three months. Employees have a
personal training record so that their training needs can be monitored.
76
9.7 ADDITIONAL BEST PRACTICE MEASURES OBSERVED
9.7.1 Pedestrian Deterrent Paving (Retail Outlet)
Photograph 52 showing pedestrian deterrent paving
The pedestrian deterrent paving has been positioned on the access road to the site,
to encourage pedestrians to use the designated walkways. The paving is also
positioned adjacent to the pedestrian crossing to discourage pedestrians from