Building Equipment 484 3,532 3,500 3,458 3,497 $62,609,852 $5,9682382
Building Finishing 349 1,079 1,109 1,084 1,091 $12,676,993 $3,8732383
Page 1 of 701/ Oil Gas industry employment includes oil and gas exploration and oilfield services, or North American Industrial Classification System (NAICS) codes 211, 213111, 213112Quarterly Census of Employment Wages (QCEW): January - March 2020Data are preliminary and subject to revisionBlanks in the Employment, Total Earnings and Average Monthly Earnings columns due to confidentiality; data are suppressedSource: Alaska Department of Labor and Workforce Development, Research and Analysis Section
Coating, Engraving, etc. 4 10 9 9 9 $96,687 $3,5813328
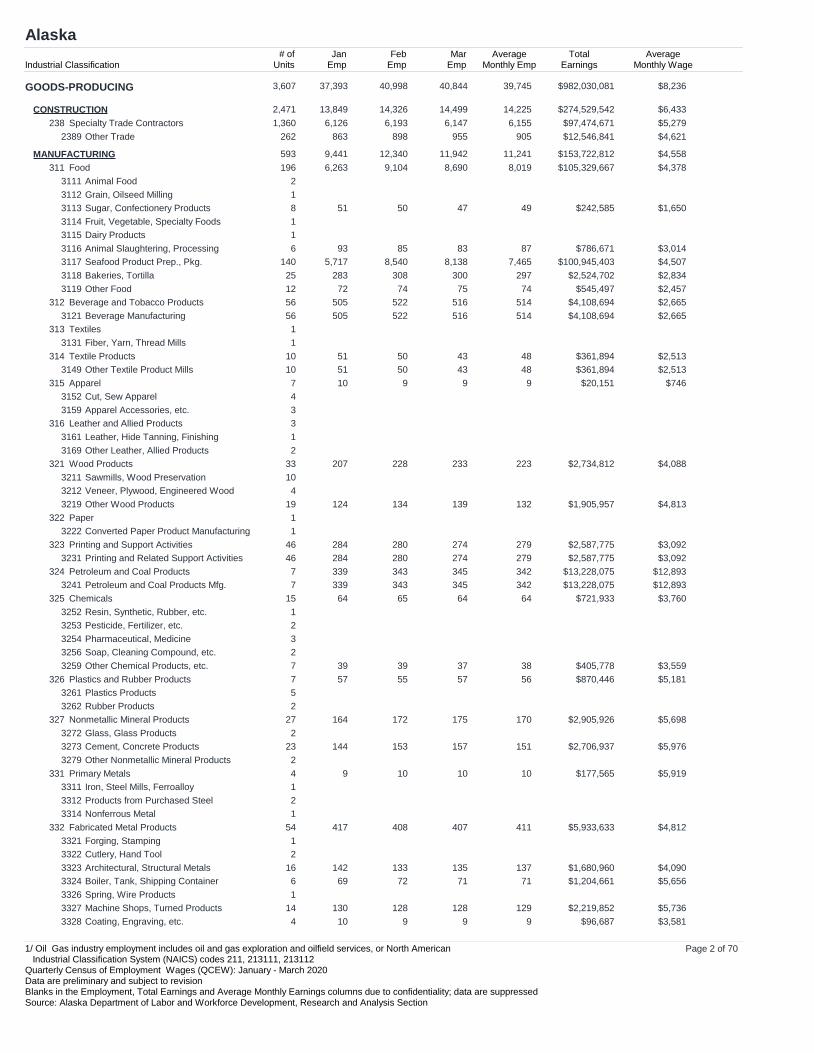
Page 2 of 701/ Oil Gas industry employment includes oil and gas exploration and oilfield services, or North American Industrial Classification System (NAICS) codes 211, 213111, 213112Quarterly Census of Employment Wages (QCEW): January - March 2020Data are preliminary and subject to revisionBlanks in the Employment, Total Earnings and Average Monthly Earnings columns due to confidentiality; data are suppressedSource: Alaska Department of Labor and Workforce Development, Research and Analysis Section
Home Furnishings Stores 60 358 332 324 338 $2,609,372 $2,5734422
Page 3 of 701/ Oil Gas industry employment includes oil and gas exploration and oilfield services, or North American Industrial Classification System (NAICS) codes 211, 213111, 213112Quarterly Census of Employment Wages (QCEW): January - March 2020Data are preliminary and subject to revisionBlanks in the Employment, Total Earnings and Average Monthly Earnings columns due to confidentiality; data are suppressedSource: Alaska Department of Labor and Workforce Development, Research and Analysis Section
Page 4 of 701/ Oil Gas industry employment includes oil and gas exploration and oilfield services, or North American Industrial Classification System (NAICS) codes 211, 213111, 213112Quarterly Census of Employment Wages (QCEW): January - March 2020Data are preliminary and subject to revisionBlanks in the Employment, Total Earnings and Average Monthly Earnings columns due to confidentiality; data are suppressedSource: Alaska Department of Labor and Workforce Development, Research and Analysis Section
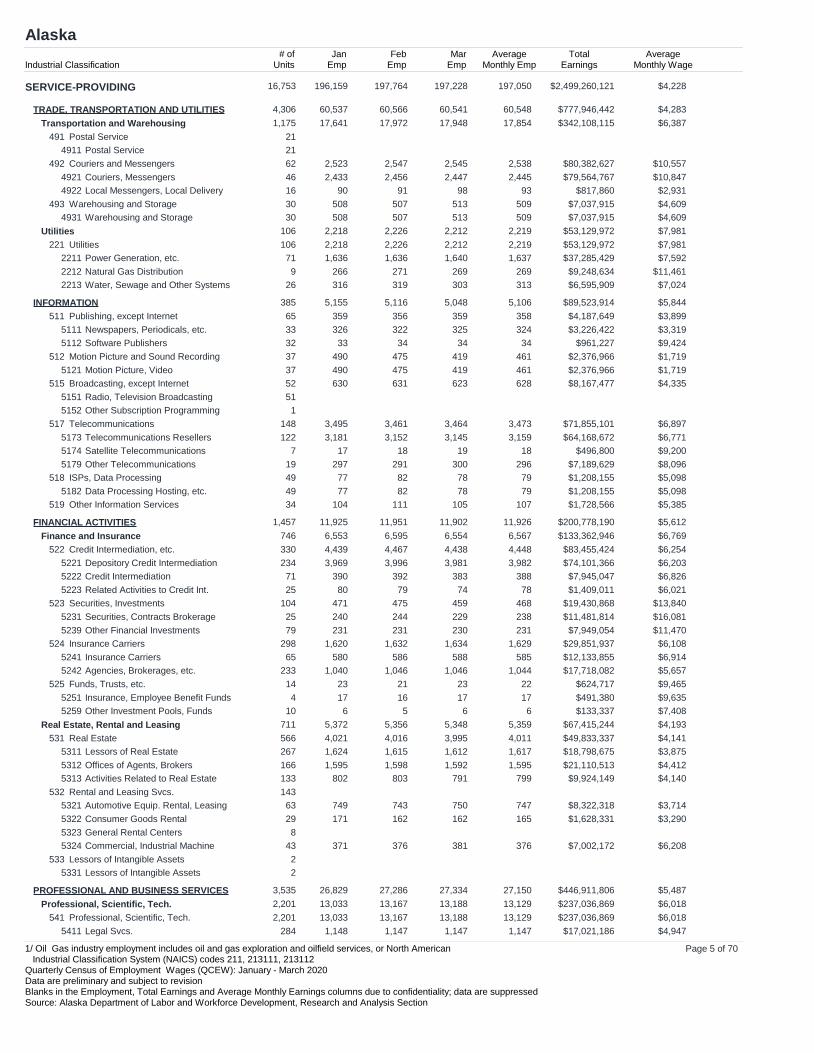
Page 5 of 701/ Oil Gas industry employment includes oil and gas exploration and oilfield services, or North American Industrial Classification System (NAICS) codes 211, 213111, 213112Quarterly Census of Employment Wages (QCEW): January - March 2020Data are preliminary and subject to revisionBlanks in the Employment, Total Earnings and Average Monthly Earnings columns due to confidentiality; data are suppressedSource: Alaska Department of Labor and Workforce Development, Research and Analysis Section
Child Day Care 150 1,883 1,894 1,818 1,865 $11,140,623 $1,9916244
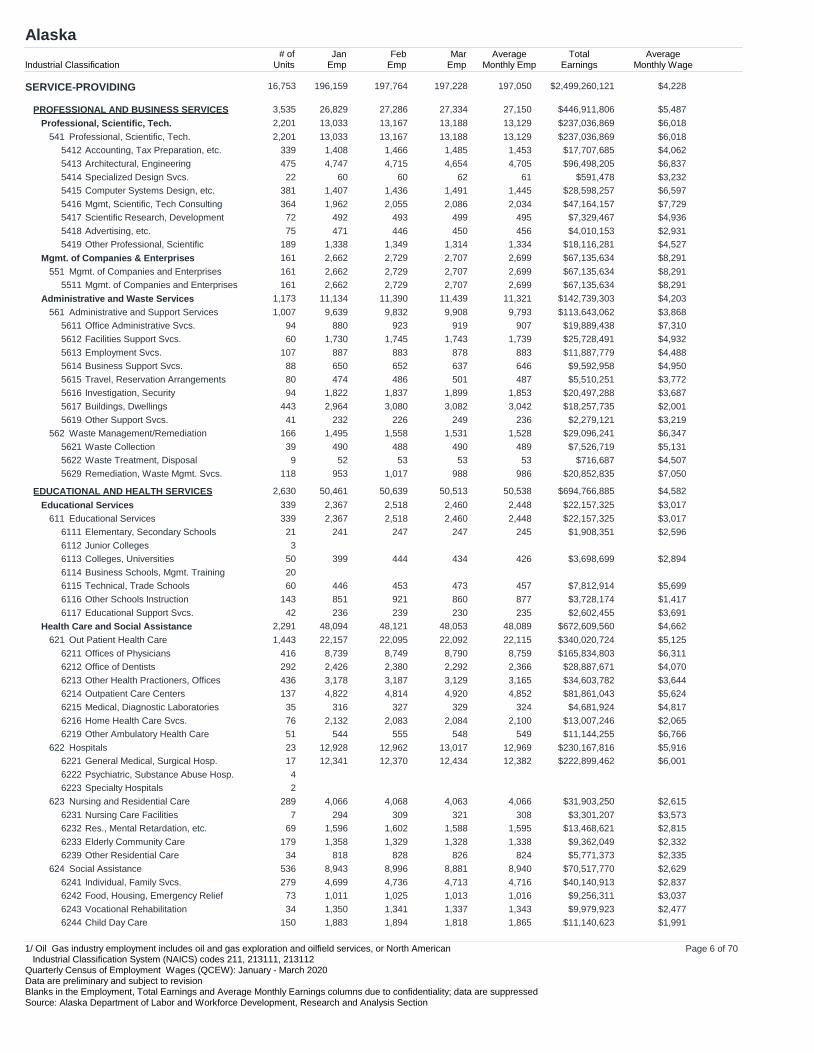
Page 6 of 701/ Oil Gas industry employment includes oil and gas exploration and oilfield services, or North American Industrial Classification System (NAICS) codes 211, 213111, 213112Quarterly Census of Employment Wages (QCEW): January - March 2020Data are preliminary and subject to revisionBlanks in the Employment, Total Earnings and Average Monthly Earnings columns due to confidentiality; data are suppressedSource: Alaska Department of Labor and Workforce Development, Research and Analysis Section
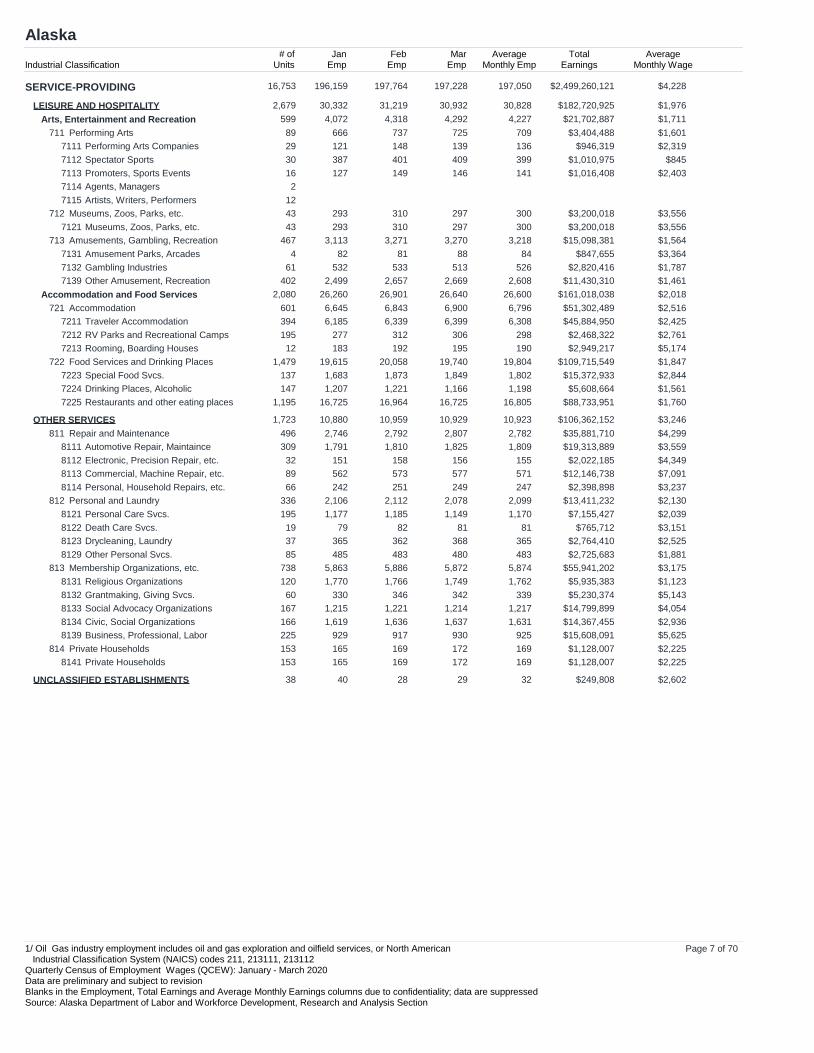
Page 7 of 701/ Oil Gas industry employment includes oil and gas exploration and oilfield services, or North American Industrial Classification System (NAICS) codes 211, 213111, 213112Quarterly Census of Employment Wages (QCEW): January - March 2020Data are preliminary and subject to revisionBlanks in the Employment, Total Earnings and Average Monthly Earnings columns due to confidentiality; data are suppressedSource: Alaska Department of Labor and Workforce Development, Research and Analysis Section
Aleutians East Borough
Industrial Classification# of
UnitsJan
EmpFeb
EmpMar
EmpAverage
Monthly EmpTotal
EarningsAverage
Monthly Wage
TOTAL INDUSTRIES 102 2,088 3,028 2,702 2,606 $37,566,829 $4,805
TOTAL GOVERNMENT 40 293 305 316 304 $2,724,783 $2,988
FEDERAL GOVERNMENT 8 13 14 16 14 $213,899 $5,093
STATE GOVERNMENT 13 13 12 14 13 $160,341 $4,111
LOCAL GOVERNMENT 19 267 279 286 277 $2,350,543 $2,829
Transportation and Warehousing 11 6 8 8 7 $146,986 $6,999
Air Transportation 1481
Water Transportation 8483
Truck Transportation 2484
Utilities 3
Utilities 3221
INFORMATION 3 11 11 11 11 $41,261 $1,250
Broadcasting, except Internet 1515
Telecommunications 2517
FINANCIAL ACTIVITIES 1
Real Estate, Rental and Leasing 1
Real Estate 1531
PROFESSIONAL AND BUSINESS SERVICES 3
Professional, Scientific, Tech. 1
Professional, Scientific, Tech. 1541
Mgmt. of Companies & Enterprises 2
Mgmt. of Companies and Enterprises 2551
EDUCATIONAL AND HEALTH SERVICES 12
Health Care and Social Assistance 12
Out Patient Health Care 7621
Social Assistance 5624
LEISURE AND HOSPITALITY 9 22 24 23 23 $104,882 $1,520
Arts, Entertainment and Recreation 3
Amusements, Gambling, Recreation 3713
Accommodation and Food Services 6
Accommodation 2721
Food Services and Drinking Places 4722
OTHER SERVICES 1
Membership Organizations, etc. 1813
Page 8 of 701/ Oil Gas industry employment includes oil and gas exploration and oilfield services, or North American Industrial Classification System (NAICS) codes 211, 213111, 213112Quarterly Census of Employment Wages (QCEW): January - March 2020Data are preliminary and subject to revisionBlanks in the Employment, Total Earnings and Average Monthly Earnings columns due to confidentiality; data are suppressedSource: Alaska Department of Labor and Workforce Development, Research and Analysis Section
Aleutians West Census Area
Industrial Classification# of
UnitsJan
EmpFeb
EmpMar
EmpAverage
Monthly EmpTotal
EarningsAverage
Monthly Wage
TOTAL INDUSTRIES 173 3,689 4,754 4,604 4,349 $66,247,223 $5,078
TOTAL GOVERNMENT 38 565 588 592 582 $6,942,041 $3,976
FEDERAL GOVERNMENT 6 12 13 12 12 $209,119 $5,809
STATE GOVERNMENT 18 25 24 25 25 $450,662 $6,009
LOCAL GOVERNMENT 14 528 551 555 545 $6,282,260 $3,842
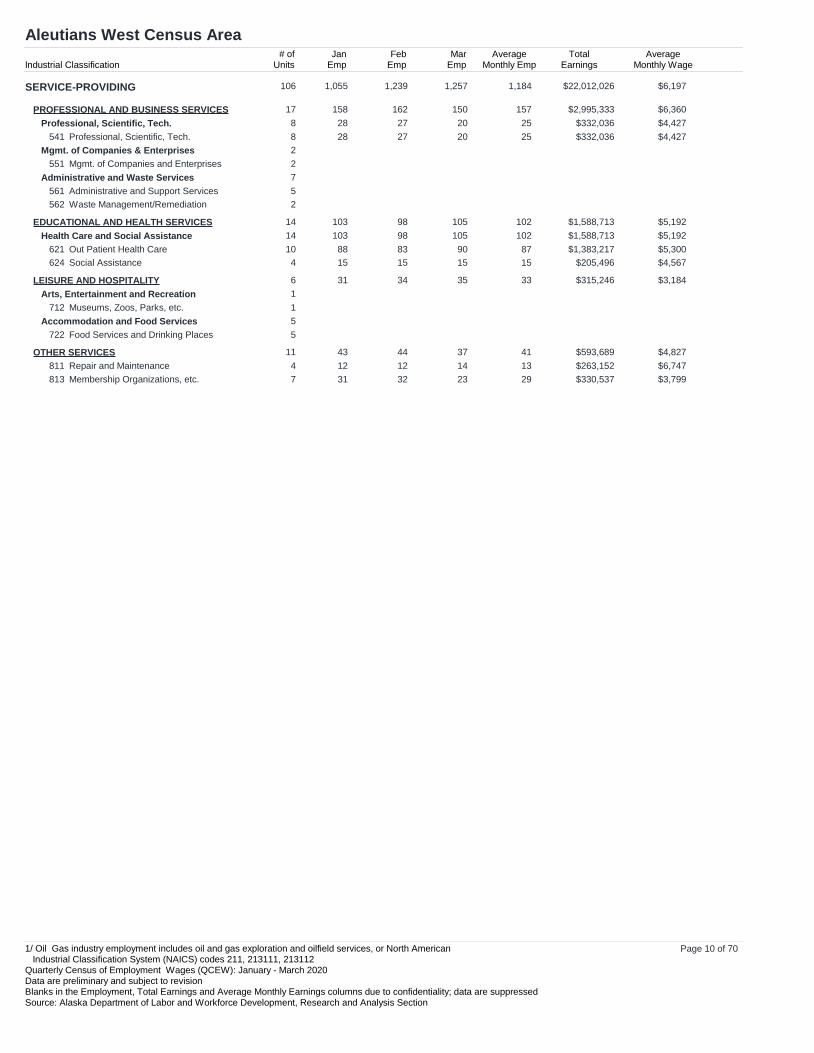
PROFESSIONAL AND BUSINESS SERVICES 17 158 162 150 157 $2,995,333 $6,360
Page 9 of 701/ Oil Gas industry employment includes oil and gas exploration and oilfield services, or North American Industrial Classification System (NAICS) codes 211, 213111, 213112Quarterly Census of Employment Wages (QCEW): January - March 2020Data are preliminary and subject to revisionBlanks in the Employment, Total Earnings and Average Monthly Earnings columns due to confidentiality; data are suppressedSource: Alaska Department of Labor and Workforce Development, Research and Analysis Section
EDUCATIONAL AND HEALTH SERVICES 14 103 98 105 102 $1,588,713 $5,192
Health Care and Social Assistance 14 103 98 105 102 $1,588,713 $5,192
Out Patient Health Care 10 88 83 90 87 $1,383,217 $5,300621
Social Assistance 4 15 15 15 15 $205,496 $4,567624
LEISURE AND HOSPITALITY 6 31 34 35 33 $315,246 $3,184
Arts, Entertainment and Recreation 1
Museums, Zoos, Parks, etc. 1712
Accommodation and Food Services 5
Food Services and Drinking Places 5722
OTHER SERVICES 11 43 44 37 41 $593,689 $4,827
Repair and Maintenance 4 12 12 14 13 $263,152 $6,747811
Membership Organizations, etc. 7 31 32 23 29 $330,537 $3,799813
Page 10 of 701/ Oil Gas industry employment includes oil and gas exploration and oilfield services, or North American Industrial Classification System (NAICS) codes 211, 213111, 213112Quarterly Census of Employment Wages (QCEW): January - March 2020Data are preliminary and subject to revisionBlanks in the Employment, Total Earnings and Average Monthly Earnings columns due to confidentiality; data are suppressedSource: Alaska Department of Labor and Workforce Development, Research and Analysis Section
Anchorage Municipality
Industrial Classification# of
UnitsJan
EmpFeb
EmpMar
EmpAverage
Monthly EmpTotal
EarningsAverage
Monthly Wage
TOTAL INDUSTRIES 8,257 145,813 146,795 146,188 146,265 $2,229,009,936 $5,080
TOTAL GOVERNMENT 203 28,125 28,344 28,198 28,222 $461,664,434 $5,453
FEDERAL GOVERNMENT 104 8,404 8,365 8,404 8,391 $168,444,781 $6,691
STATE GOVERNMENT 86 9,497 9,684 9,677 9,619 $140,836,699 $4,881
LOCAL GOVERNMENT 13 10,224 10,295 10,117 10,212 $152,382,954 $4,974
Page 11 of 701/ Oil Gas industry employment includes oil and gas exploration and oilfield services, or North American Industrial Classification System (NAICS) codes 211, 213111, 213112Quarterly Census of Employment Wages (QCEW): January - March 2020Data are preliminary and subject to revisionBlanks in the Employment, Total Earnings and Average Monthly Earnings columns due to confidentiality; data are suppressedSource: Alaska Department of Labor and Workforce Development, Research and Analysis Section
Page 12 of 701/ Oil Gas industry employment includes oil and gas exploration and oilfield services, or North American Industrial Classification System (NAICS) codes 211, 213111, 213112Quarterly Census of Employment Wages (QCEW): January - March 2020Data are preliminary and subject to revisionBlanks in the Employment, Total Earnings and Average Monthly Earnings columns due to confidentiality; data are suppressedSource: Alaska Department of Labor and Workforce Development, Research and Analysis Section
Page 13 of 701/ Oil Gas industry employment includes oil and gas exploration and oilfield services, or North American Industrial Classification System (NAICS) codes 211, 213111, 213112Quarterly Census of Employment Wages (QCEW): January - March 2020Data are preliminary and subject to revisionBlanks in the Employment, Total Earnings and Average Monthly Earnings columns due to confidentiality; data are suppressedSource: Alaska Department of Labor and Workforce Development, Research and Analysis Section
Bethel Census Area
Industrial Classification# of
UnitsJan
EmpFeb
EmpMar
EmpAverage
Monthly EmpTotal
EarningsAverage
Monthly Wage
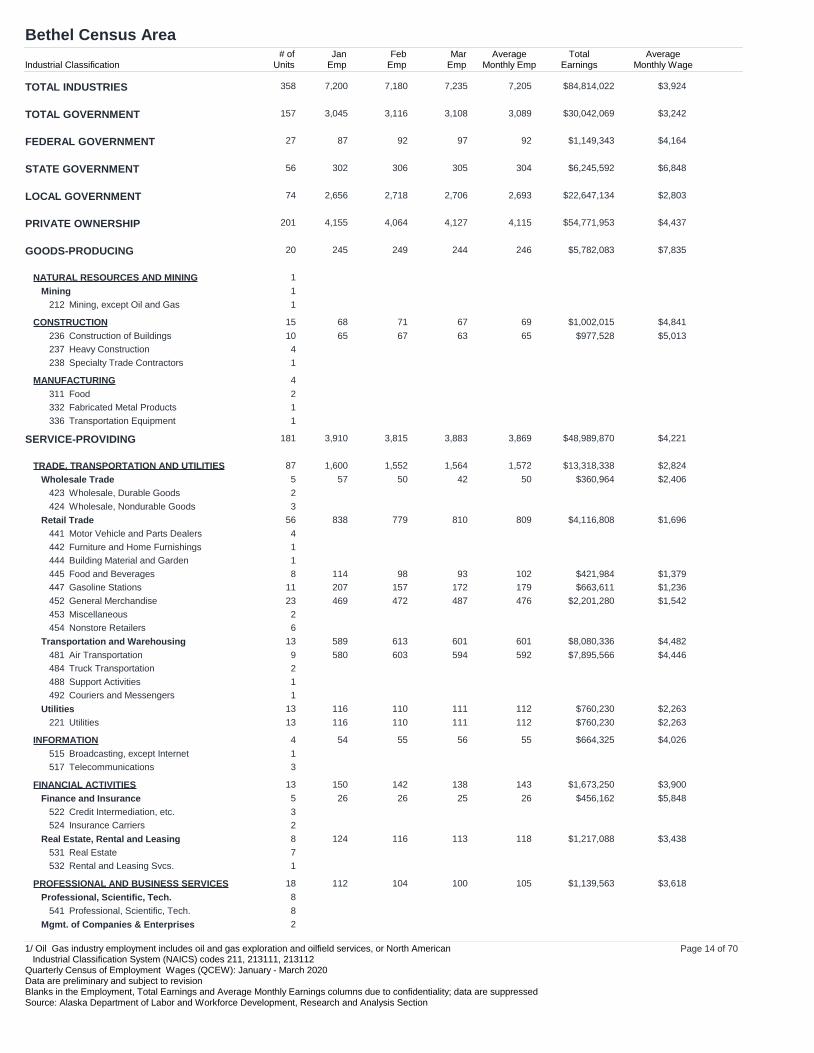
TOTAL INDUSTRIES 358 7,200 7,180 7,235 7,205 $84,814,022 $3,924
TOTAL GOVERNMENT 157 3,045 3,116 3,108 3,089 $30,042,069 $3,242
FEDERAL GOVERNMENT 27 87 92 97 92 $1,149,343 $4,164
STATE GOVERNMENT 56 302 306 305 304 $6,245,592 $6,848
LOCAL GOVERNMENT 74 2,656 2,718 2,706 2,693 $22,647,134 $2,803
Finance and Insurance 5 26 26 25 26 $456,162 $5,848
Credit Intermediation, etc. 3522
Insurance Carriers 2524
Real Estate, Rental and Leasing 8 124 116 113 118 $1,217,088 $3,438
Real Estate 7531
Rental and Leasing Svcs. 1532
PROFESSIONAL AND BUSINESS SERVICES 18 112 104 100 105 $1,139,563 $3,618
Professional, Scientific, Tech. 8
Professional, Scientific, Tech. 8541
Mgmt. of Companies & Enterprises 2
Page 14 of 701/ Oil Gas industry employment includes oil and gas exploration and oilfield services, or North American Industrial Classification System (NAICS) codes 211, 213111, 213112Quarterly Census of Employment Wages (QCEW): January - March 2020Data are preliminary and subject to revisionBlanks in the Employment, Total Earnings and Average Monthly Earnings columns due to confidentiality; data are suppressedSource: Alaska Department of Labor and Workforce Development, Research and Analysis Section
OTHER SERVICES 21 539 561 558 553 $7,557,300 $4,555
Repair and Maintenance 5811
Membership Organizations, etc. 15 530 553 552 545 $7,496,646 $4,585813
Private Households 1814
Page 15 of 701/ Oil Gas industry employment includes oil and gas exploration and oilfield services, or North American Industrial Classification System (NAICS) codes 211, 213111, 213112Quarterly Census of Employment Wages (QCEW): January - March 2020Data are preliminary and subject to revisionBlanks in the Employment, Total Earnings and Average Monthly Earnings columns due to confidentiality; data are suppressedSource: Alaska Department of Labor and Workforce Development, Research and Analysis Section
Bristol Bay Borough
Industrial Classification# of
UnitsJan
EmpFeb
EmpMar
EmpAverage
Monthly EmpTotal
EarningsAverage
Monthly Wage
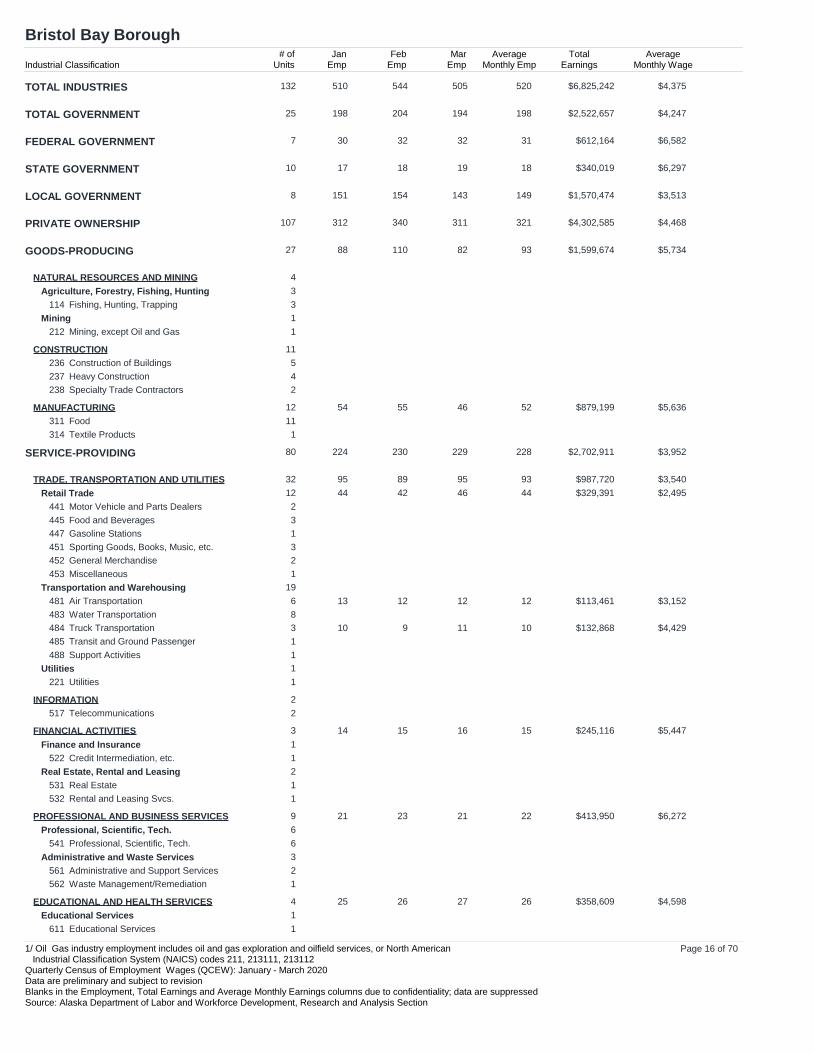
TOTAL INDUSTRIES 132 510 544 505 520 $6,825,242 $4,375
TOTAL GOVERNMENT 25 198 204 194 198 $2,522,657 $4,247
FEDERAL GOVERNMENT 7 30 32 32 31 $612,164 $6,582
STATE GOVERNMENT 10 17 18 19 18 $340,019 $6,297
LOCAL GOVERNMENT 8 151 154 143 149 $1,570,474 $3,513
PROFESSIONAL AND BUSINESS SERVICES 9 21 23 21 22 $413,950 $6,272
Professional, Scientific, Tech. 6
Professional, Scientific, Tech. 6541
Administrative and Waste Services 3
Administrative and Support Services 2561
Waste Management/Remediation 1562
EDUCATIONAL AND HEALTH SERVICES 4 25 26 27 26 $358,609 $4,598
Educational Services 1
Educational Services 1611
Page 16 of 701/ Oil Gas industry employment includes oil and gas exploration and oilfield services, or North American Industrial Classification System (NAICS) codes 211, 213111, 213112Quarterly Census of Employment Wages (QCEW): January - March 2020Data are preliminary and subject to revisionBlanks in the Employment, Total Earnings and Average Monthly Earnings columns due to confidentiality; data are suppressedSource: Alaska Department of Labor and Workforce Development, Research and Analysis Section
EDUCATIONAL AND HEALTH SERVICES 4 25 26 27 26 $358,609 $4,598
Health Care and Social Assistance 3
Out Patient Health Care 2621
Social Assistance 1624
LEISURE AND HOSPITALITY 26 49 56 50 52 $350,066 $2,244
Arts, Entertainment and Recreation 8
Museums, Zoos, Parks, etc. 1712
Amusements, Gambling, Recreation 7713
Accommodation and Food Services 18
Accommodation 13 28 34 25 29 $242,964 $2,793721
Food Services and Drinking Places 5722
OTHER SERVICES 4
Repair and Maintenance 2811
Membership Organizations, etc. 2813
Page 17 of 701/ Oil Gas industry employment includes oil and gas exploration and oilfield services, or North American Industrial Classification System (NAICS) codes 211, 213111, 213112Quarterly Census of Employment Wages (QCEW): January - March 2020Data are preliminary and subject to revisionBlanks in the Employment, Total Earnings and Average Monthly Earnings columns due to confidentiality; data are suppressedSource: Alaska Department of Labor and Workforce Development, Research and Analysis Section
Chugach Census Area (formerly part of Valdez-Cordova CA)
Industrial Classification# of
UnitsJan
EmpFeb
EmpMar
EmpAverage
Monthly EmpTotal
EarningsAverage
Monthly Wage
TOTAL INDUSTRIES 423 2,827 2,945 3,020 2,931 $49,686,275 $5,651
TOTAL GOVERNMENT 59 893 917 920 910 $12,929,390 $4,736
FEDERAL GOVERNMENT 10 61 61 62 61 $1,056,673 $5,774
STATE GOVERNMENT 35 165 165 161 164 $2,191,433 $4,454
LOCAL GOVERNMENT 14 667 691 697 685 $9,681,284 $4,711
Transportation and Warehousing 47 392 398 401 397 $16,492,927 $13,848
Air Transportation 4 25 25 26 25 $340,298 $4,537481
Water Transportation 23483
Truck Transportation 3484
Transit and Ground Passenger 3485
Pipeline 1486
Scenic and Sightseeing 8487
Support Activities 2488
Couriers and Messengers 1492
Warehousing and Storage 2493
Utilities 1
Utilities 1221
INFORMATION 10 89 93 91 91 $1,434,575 $5,255
Motion Picture and Sound Recording 1512
Page 18 of 701/ Oil Gas industry employment includes oil and gas exploration and oilfield services, or North American Industrial Classification System (NAICS) codes 211, 213111, 213112Quarterly Census of Employment Wages (QCEW): January - March 2020Data are preliminary and subject to revisionBlanks in the Employment, Total Earnings and Average Monthly Earnings columns due to confidentiality; data are suppressedSource: Alaska Department of Labor and Workforce Development, Research and Analysis Section
Chugach Census Area (formerly part of Valdez-Cordova CA)
Repair and Maintenance 10 17 17 16 17 $177,760 $3,485811
Personal and Laundry 2812
Membership Organizations, etc. 18 70 65 71 69 $432,411 $2,089813
Private Households 1814
Page 19 of 701/ Oil Gas industry employment includes oil and gas exploration and oilfield services, or North American Industrial Classification System (NAICS) codes 211, 213111, 213112Quarterly Census of Employment Wages (QCEW): January - March 2020Data are preliminary and subject to revisionBlanks in the Employment, Total Earnings and Average Monthly Earnings columns due to confidentiality; data are suppressedSource: Alaska Department of Labor and Workforce Development, Research and Analysis Section
Copper River Census Area (formerly part of Valdez-Cordova CA)
Industrial Classification# of
UnitsJan
EmpFeb
EmpMar
EmpAverage
Monthly EmpTotal
EarningsAverage
Monthly Wage
TOTAL INDUSTRIES 150 863 882 905 883 $11,069,817 $4,179
TOTAL GOVERNMENT 43 310 322 319 317 $3,259,236 $3,427
FEDERAL GOVERNMENT 7 53 55 58 55 $1,021,661 $6,192
STATE GOVERNMENT 23 65 65 65 65 $919,077 $4,713
LOCAL GOVERNMENT 13 192 202 196 197 $1,318,498 $2,231
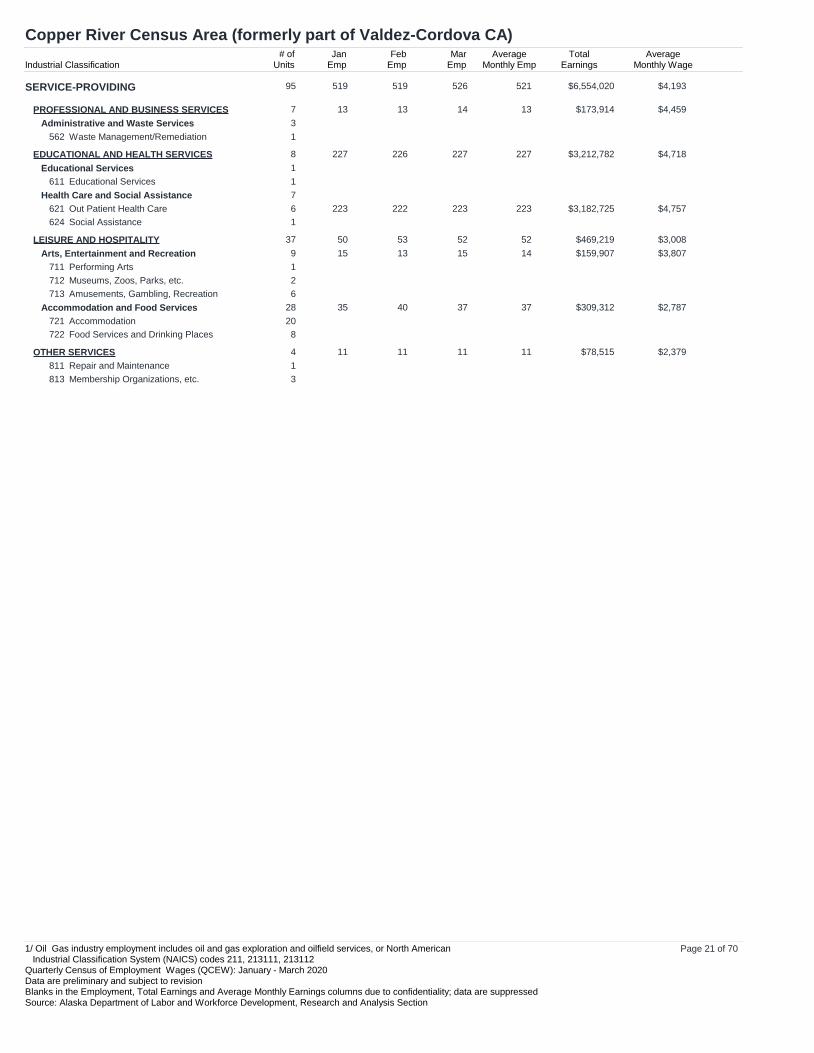
PROFESSIONAL AND BUSINESS SERVICES 7 13 13 14 13 $173,914 $4,459
Professional, Scientific, Tech. 3
Professional, Scientific, Tech. 3541
Mgmt. of Companies & Enterprises 1
Mgmt. of Companies and Enterprises 1551
Administrative and Waste Services 3
Administrative and Support Services 2561
Page 20 of 701/ Oil Gas industry employment includes oil and gas exploration and oilfield services, or North American Industrial Classification System (NAICS) codes 211, 213111, 213112Quarterly Census of Employment Wages (QCEW): January - March 2020Data are preliminary and subject to revisionBlanks in the Employment, Total Earnings and Average Monthly Earnings columns due to confidentiality; data are suppressedSource: Alaska Department of Labor and Workforce Development, Research and Analysis Section
Copper River Census Area (formerly part of Valdez-Cordova CA)
Page 21 of 701/ Oil Gas industry employment includes oil and gas exploration and oilfield services, or North American Industrial Classification System (NAICS) codes 211, 213111, 213112Quarterly Census of Employment Wages (QCEW): January - March 2020Data are preliminary and subject to revisionBlanks in the Employment, Total Earnings and Average Monthly Earnings columns due to confidentiality; data are suppressedSource: Alaska Department of Labor and Workforce Development, Research and Analysis Section
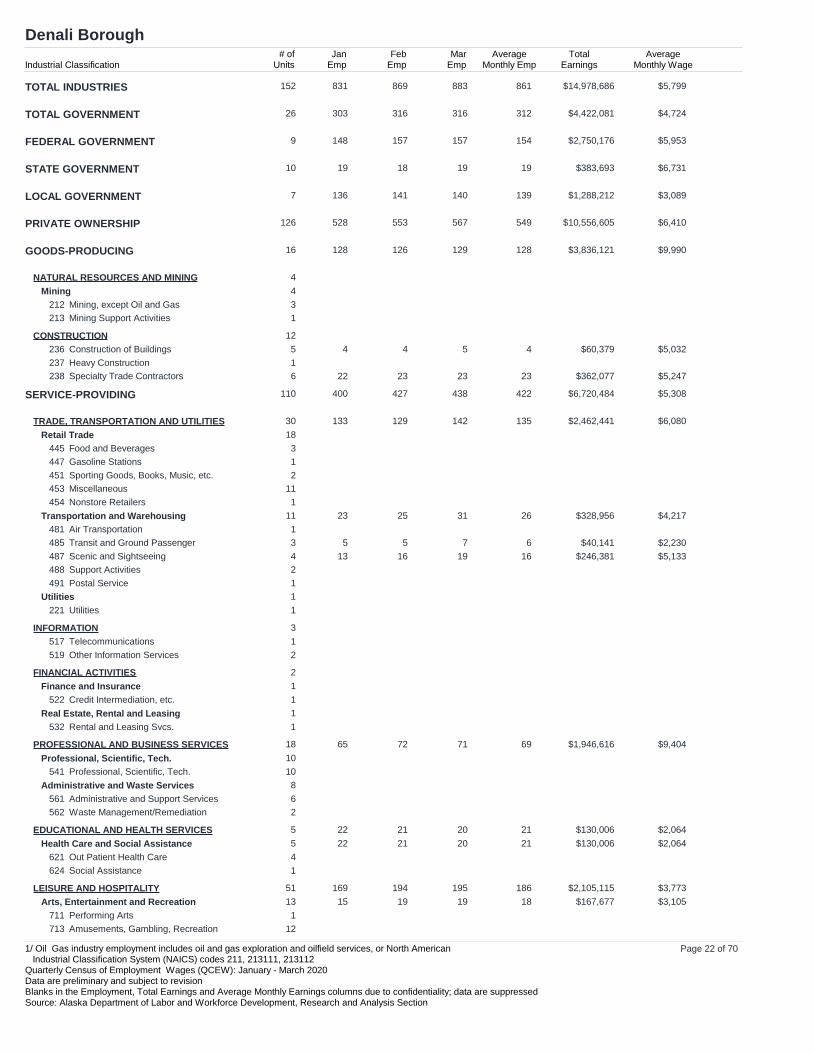
Denali Borough
Industrial Classification# of
UnitsJan
EmpFeb
EmpMar
EmpAverage
Monthly EmpTotal
EarningsAverage
Monthly Wage
TOTAL INDUSTRIES 152 831 869 883 861 $14,978,686 $5,799
TOTAL GOVERNMENT 26 303 316 316 312 $4,422,081 $4,724
FEDERAL GOVERNMENT 9 148 157 157 154 $2,750,176 $5,953
STATE GOVERNMENT 10 19 18 19 19 $383,693 $6,731
LOCAL GOVERNMENT 7 136 141 140 139 $1,288,212 $3,089
Scenic and Sightseeing 4 13 16 19 16 $246,381 $5,133487
Support Activities 2488
Postal Service 1491
Utilities 1
Utilities 1221
INFORMATION 3
Telecommunications 1517
Other Information Services 2519
FINANCIAL ACTIVITIES 2
Finance and Insurance 1
Credit Intermediation, etc. 1522
Real Estate, Rental and Leasing 1
Rental and Leasing Svcs. 1532
PROFESSIONAL AND BUSINESS SERVICES 18 65 72 71 69 $1,946,616 $9,404
Professional, Scientific, Tech. 10
Professional, Scientific, Tech. 10541
Administrative and Waste Services 8
Administrative and Support Services 6561
Waste Management/Remediation 2562
EDUCATIONAL AND HEALTH SERVICES 5 22 21 20 21 $130,006 $2,064
Health Care and Social Assistance 5 22 21 20 21 $130,006 $2,064
Out Patient Health Care 4621
Social Assistance 1624
LEISURE AND HOSPITALITY 51 169 194 195 186 $2,105,115 $3,773
Arts, Entertainment and Recreation 13 15 19 19 18 $167,677 $3,105
Performing Arts 1711
Amusements, Gambling, Recreation 12713
Page 22 of 701/ Oil Gas industry employment includes oil and gas exploration and oilfield services, or North American Industrial Classification System (NAICS) codes 211, 213111, 213112Quarterly Census of Employment Wages (QCEW): January - March 2020Data are preliminary and subject to revisionBlanks in the Employment, Total Earnings and Average Monthly Earnings columns due to confidentiality; data are suppressedSource: Alaska Department of Labor and Workforce Development, Research and Analysis Section
Page 23 of 701/ Oil Gas industry employment includes oil and gas exploration and oilfield services, or North American Industrial Classification System (NAICS) codes 211, 213111, 213112Quarterly Census of Employment Wages (QCEW): January - March 2020Data are preliminary and subject to revisionBlanks in the Employment, Total Earnings and Average Monthly Earnings columns due to confidentiality; data are suppressedSource: Alaska Department of Labor and Workforce Development, Research and Analysis Section
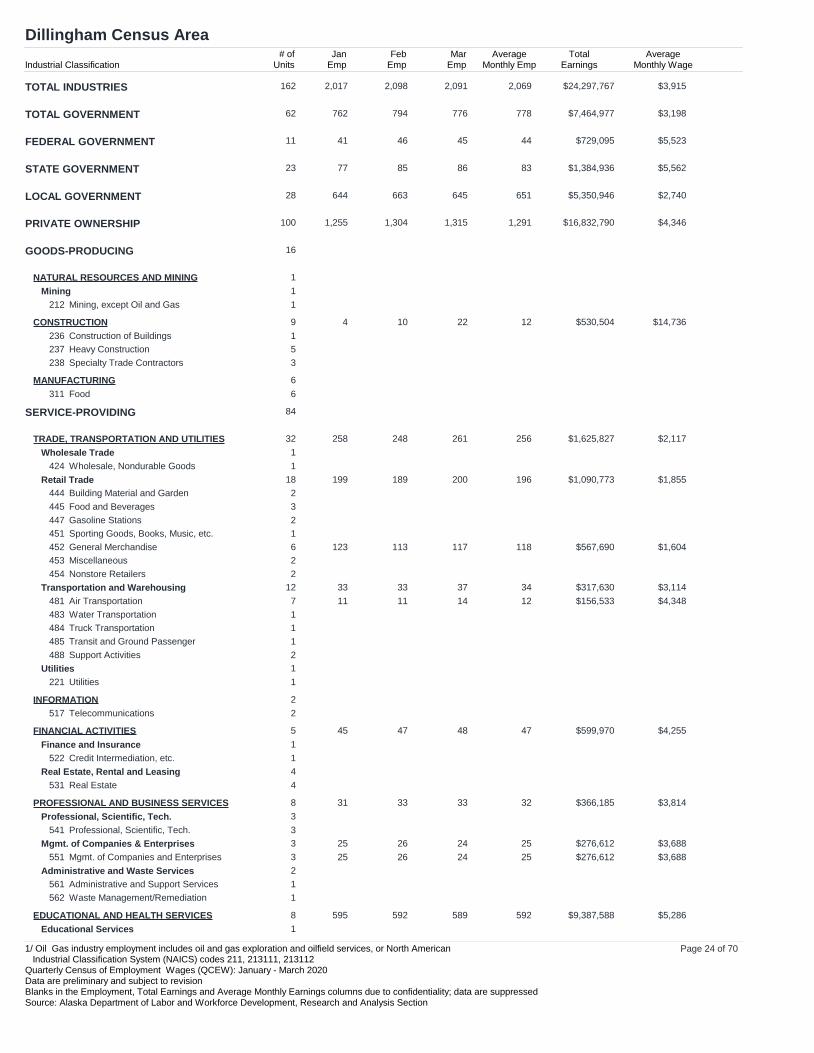
Dillingham Census Area
Industrial Classification# of
UnitsJan
EmpFeb
EmpMar
EmpAverage
Monthly EmpTotal
EarningsAverage
Monthly Wage
TOTAL INDUSTRIES 162 2,017 2,098 2,091 2,069 $24,297,767 $3,915
TOTAL GOVERNMENT 62 762 794 776 778 $7,464,977 $3,198
FEDERAL GOVERNMENT 11 41 46 45 44 $729,095 $5,523
STATE GOVERNMENT 23 77 85 86 83 $1,384,936 $5,562
LOCAL GOVERNMENT 28 644 663 645 651 $5,350,946 $2,740
Mgmt. of Companies and Enterprises 3 25 26 24 25 $276,612 $3,688551
Administrative and Waste Services 2
Administrative and Support Services 1561
Waste Management/Remediation 1562
EDUCATIONAL AND HEALTH SERVICES 8 595 592 589 592 $9,387,588 $5,286
Educational Services 1
Page 24 of 701/ Oil Gas industry employment includes oil and gas exploration and oilfield services, or North American Industrial Classification System (NAICS) codes 211, 213111, 213112Quarterly Census of Employment Wages (QCEW): January - March 2020Data are preliminary and subject to revisionBlanks in the Employment, Total Earnings and Average Monthly Earnings columns due to confidentiality; data are suppressedSource: Alaska Department of Labor and Workforce Development, Research and Analysis Section
Dillingham Census Area
Industrial Classification# of
UnitsJan
EmpFeb
EmpMar
EmpAverage
Monthly EmpTotal
EarningsAverage
Monthly Wage
SERVICE-PROVIDING 84
EDUCATIONAL AND HEALTH SERVICES 8 595 592 589 592 $9,387,588 $5,286
Page 25 of 701/ Oil Gas industry employment includes oil and gas exploration and oilfield services, or North American Industrial Classification System (NAICS) codes 211, 213111, 213112Quarterly Census of Employment Wages (QCEW): January - March 2020Data are preliminary and subject to revisionBlanks in the Employment, Total Earnings and Average Monthly Earnings columns due to confidentiality; data are suppressedSource: Alaska Department of Labor and Workforce Development, Research and Analysis Section
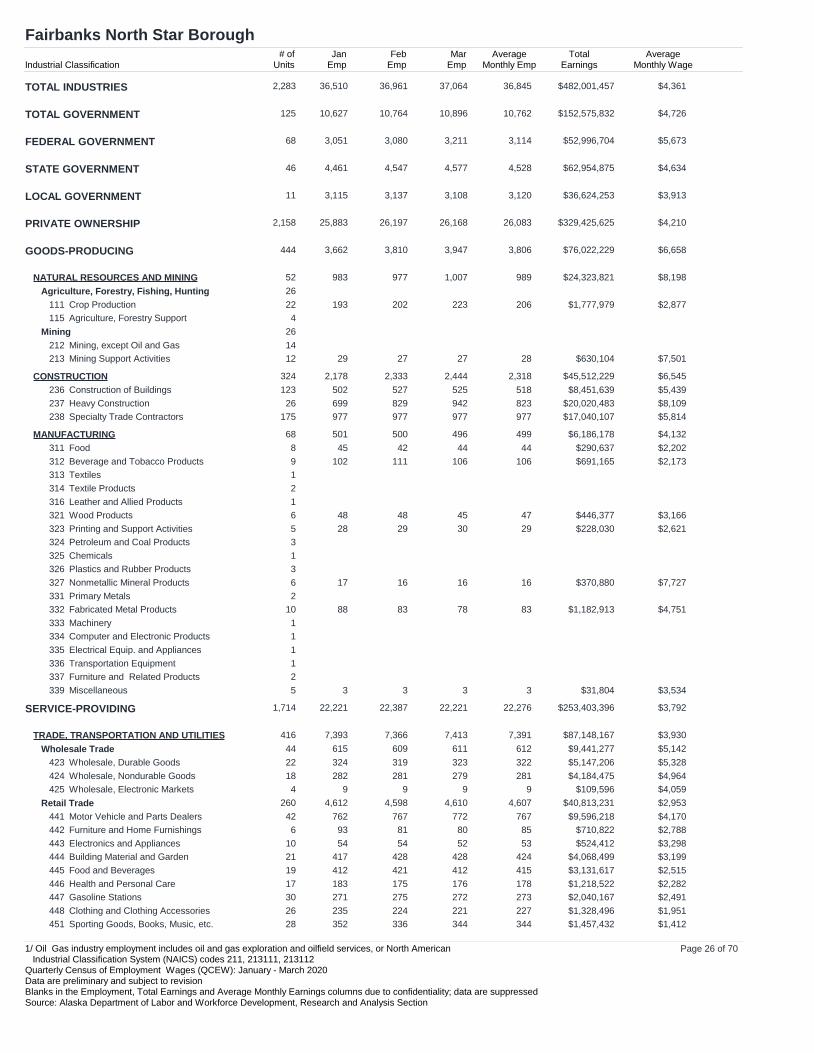
Fairbanks North Star Borough
Industrial Classification# of
UnitsJan
EmpFeb
EmpMar
EmpAverage
Monthly EmpTotal
EarningsAverage
Monthly Wage
TOTAL INDUSTRIES 2,283 36,510 36,961 37,064 36,845 $482,001,457 $4,361
TOTAL GOVERNMENT 125 10,627 10,764 10,896 10,762 $152,575,832 $4,726
FEDERAL GOVERNMENT 68 3,051 3,080 3,211 3,114 $52,996,704 $5,673
STATE GOVERNMENT 46 4,461 4,547 4,577 4,528 $62,954,875 $4,634
LOCAL GOVERNMENT 11 3,115 3,137 3,108 3,120 $36,624,253 $3,913
Page 26 of 701/ Oil Gas industry employment includes oil and gas exploration and oilfield services, or North American Industrial Classification System (NAICS) codes 211, 213111, 213112Quarterly Census of Employment Wages (QCEW): January - March 2020Data are preliminary and subject to revisionBlanks in the Employment, Total Earnings and Average Monthly Earnings columns due to confidentiality; data are suppressedSource: Alaska Department of Labor and Workforce Development, Research and Analysis Section
OTHER SERVICES 186 1,023 1,017 1,033 1,024 $9,002,009 $2,930
Repair and Maintenance 77 397 394 410 400 $4,824,163 $4,020811
Personal and Laundry 38 243 236 232 237 $1,532,140 $2,155812
Membership Organizations, etc. 56 370 376 377 374 $2,581,270 $2,301813
Page 27 of 701/ Oil Gas industry employment includes oil and gas exploration and oilfield services, or North American Industrial Classification System (NAICS) codes 211, 213111, 213112Quarterly Census of Employment Wages (QCEW): January - March 2020Data are preliminary and subject to revisionBlanks in the Employment, Total Earnings and Average Monthly Earnings columns due to confidentiality; data are suppressedSource: Alaska Department of Labor and Workforce Development, Research and Analysis Section
Page 28 of 701/ Oil Gas industry employment includes oil and gas exploration and oilfield services, or North American Industrial Classification System (NAICS) codes 211, 213111, 213112Quarterly Census of Employment Wages (QCEW): January - March 2020Data are preliminary and subject to revisionBlanks in the Employment, Total Earnings and Average Monthly Earnings columns due to confidentiality; data are suppressedSource: Alaska Department of Labor and Workforce Development, Research and Analysis Section
Haines Borough
Industrial Classification# of
UnitsJan
EmpFeb
EmpMar
EmpAverage
Monthly EmpTotal
EarningsAverage
Monthly Wage
TOTAL INDUSTRIES 162 680 691 734 702 $6,249,760 $2,968
TOTAL GOVERNMENT 22 200 187 197 195 $2,035,256 $3,479
FEDERAL GOVERNMENT 3 11 11 17 13 $291,745 $7,481
STATE GOVERNMENT 15 23 23 23 23 $315,779 $4,577
LOCAL GOVERNMENT 4 166 153 157 159 $1,427,732 $2,993
Page 29 of 701/ Oil Gas industry employment includes oil and gas exploration and oilfield services, or North American Industrial Classification System (NAICS) codes 211, 213111, 213112Quarterly Census of Employment Wages (QCEW): January - March 2020Data are preliminary and subject to revisionBlanks in the Employment, Total Earnings and Average Monthly Earnings columns due to confidentiality; data are suppressedSource: Alaska Department of Labor and Workforce Development, Research and Analysis Section
Membership Organizations, etc. 9 26 27 28 27 $164,355 $2,029813
Page 30 of 701/ Oil Gas industry employment includes oil and gas exploration and oilfield services, or North American Industrial Classification System (NAICS) codes 211, 213111, 213112Quarterly Census of Employment Wages (QCEW): January - March 2020Data are preliminary and subject to revisionBlanks in the Employment, Total Earnings and Average Monthly Earnings columns due to confidentiality; data are suppressedSource: Alaska Department of Labor and Workforce Development, Research and Analysis Section
Hoonah-Angoon Census Area
Industrial Classification# of
UnitsJan
EmpFeb
EmpMar
EmpAverage
Monthly EmpTotal
EarningsAverage
Monthly Wage
TOTAL INDUSTRIES 140 614 607 632 618 $5,513,365 $2,974
TOTAL GOVERNMENT 42 368 368 372 369 $3,497,344 $3,159
FEDERAL GOVERNMENT 9 77 78 79 78 $1,318,868 $5,636
STATE GOVERNMENT 17 9 9 9 9 $112,418 $4,164
LOCAL GOVERNMENT 16 282 281 284 282 $2,066,058 $2,442
Food and Beverages 5 15 16 14 15 $47,265 $1,050445
Gasoline Stations 2447
Sporting Goods, Books, Music, etc. 2451
General Merchandise 3 25 25 20 23 $159,810 $2,316452
Miscellaneous 3453
Nonstore Retailers 2454
Transportation and Warehousing 12 22 11 9 14 $96,893 $2,307
Air Transportation 1481
Water Transportation 2483
Truck Transportation 3 5 3 5 4 $33,166 $2,764484
Scenic and Sightseeing 6487
Utilities 2
Utilities 2221
FINANCIAL ACTIVITIES 2
Finance and Insurance 1
Credit Intermediation, etc. 1522
Real Estate, Rental and Leasing 1
Rental and Leasing Svcs. 1532
EDUCATIONAL AND HEALTH SERVICES 17 61 62 61 61 $511,634 $2,796
Educational Services 4 7 7 7 7 $63,034 $3,002
Educational Services 4 7 7 7 7 $63,034 $3,002611
Health Care and Social Assistance 13 54 55 54 54 $448,600 $2,769
Out Patient Health Care 6621
Social Assistance 7624
LEISURE AND HOSPITALITY 24 51 51 64 55 $789,975 $4,788
Arts, Entertainment and Recreation 4
Amusements, Gambling, Recreation 4713
Accommodation and Food Services 20
Accommodation 17 20 20 23 21 $103,054 $1,636721
Page 31 of 701/ Oil Gas industry employment includes oil and gas exploration and oilfield services, or North American Industrial Classification System (NAICS) codes 211, 213111, 213112Quarterly Census of Employment Wages (QCEW): January - March 2020Data are preliminary and subject to revisionBlanks in the Employment, Total Earnings and Average Monthly Earnings columns due to confidentiality; data are suppressedSource: Alaska Department of Labor and Workforce Development, Research and Analysis Section
LEISURE AND HOSPITALITY 24 51 51 64 55 $789,975 $4,788
Accommodation and Food Services 20
Food Services and Drinking Places 3722
OTHER SERVICES 4
Repair and Maintenance 1811
Membership Organizations, etc. 3 8 7 6 7 $27,869 $1,327813
Page 32 of 701/ Oil Gas industry employment includes oil and gas exploration and oilfield services, or North American Industrial Classification System (NAICS) codes 211, 213111, 213112Quarterly Census of Employment Wages (QCEW): January - March 2020Data are preliminary and subject to revisionBlanks in the Employment, Total Earnings and Average Monthly Earnings columns due to confidentiality; data are suppressedSource: Alaska Department of Labor and Workforce Development, Research and Analysis Section
Juneau City and Borough
Industrial Classification# of
UnitsJan
EmpFeb
EmpMar
EmpAverage
Monthly EmpTotal
EarningsAverage
Monthly Wage
TOTAL INDUSTRIES 1,146 16,480 16,807 16,847 16,711 $225,949,732 $4,507
TOTAL GOVERNMENT 84 6,764 6,945 6,971 6,893 $108,026,334 $5,224
FEDERAL GOVERNMENT 24 657 658 698 671 $15,304,564 $7,603
STATE GOVERNMENT 53 3,534 3,694 3,686 3,638 $55,540,475 $5,089
LOCAL GOVERNMENT 7 2,573 2,593 2,587 2,584 $37,181,295 $4,796
Page 33 of 701/ Oil Gas industry employment includes oil and gas exploration and oilfield services, or North American Industrial Classification System (NAICS) codes 211, 213111, 213112Quarterly Census of Employment Wages (QCEW): January - March 2020Data are preliminary and subject to revisionBlanks in the Employment, Total Earnings and Average Monthly Earnings columns due to confidentiality; data are suppressedSource: Alaska Department of Labor and Workforce Development, Research and Analysis Section
Page 34 of 701/ Oil Gas industry employment includes oil and gas exploration and oilfield services, or North American Industrial Classification System (NAICS) codes 211, 213111, 213112Quarterly Census of Employment Wages (QCEW): January - March 2020Data are preliminary and subject to revisionBlanks in the Employment, Total Earnings and Average Monthly Earnings columns due to confidentiality; data are suppressedSource: Alaska Department of Labor and Workforce Development, Research and Analysis Section
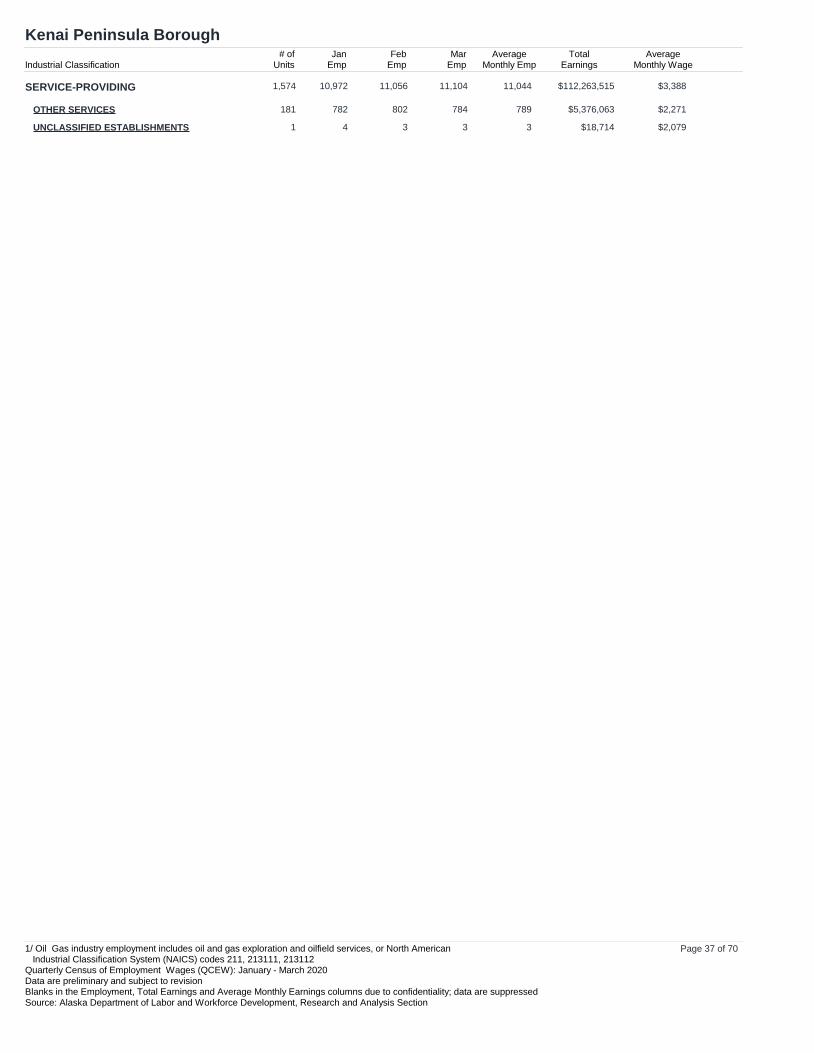
Kenai Peninsula Borough
Industrial Classification# of
UnitsJan
EmpFeb
EmpMar
EmpAverage
Monthly EmpTotal
EarningsAverage
Monthly Wage
TOTAL INDUSTRIES 2,127 18,401 18,614 18,808 18,608 $238,205,073 $4,267
TOTAL GOVERNMENT 163 4,875 4,949 5,009 4,944 $68,809,213 $4,639
FEDERAL GOVERNMENT 30 339 334 383 352 $6,629,724 $6,278
STATE GOVERNMENT 95 1,182 1,189 1,203 1,191 $17,499,358 $4,898
LOCAL GOVERNMENT 38 3,354 3,426 3,423 3,401 $44,680,131 $4,379
General Merchandise 12 692 699 706 699 $5,268,152 $2,512452
Page 35 of 701/ Oil Gas industry employment includes oil and gas exploration and oilfield services, or North American Industrial Classification System (NAICS) codes 211, 213111, 213112Quarterly Census of Employment Wages (QCEW): January - March 2020Data are preliminary and subject to revisionBlanks in the Employment, Total Earnings and Average Monthly Earnings columns due to confidentiality; data are suppressedSource: Alaska Department of Labor and Workforce Development, Research and Analysis Section
Page 36 of 701/ Oil Gas industry employment includes oil and gas exploration and oilfield services, or North American Industrial Classification System (NAICS) codes 211, 213111, 213112Quarterly Census of Employment Wages (QCEW): January - March 2020Data are preliminary and subject to revisionBlanks in the Employment, Total Earnings and Average Monthly Earnings columns due to confidentiality; data are suppressedSource: Alaska Department of Labor and Workforce Development, Research and Analysis Section
Page 37 of 701/ Oil Gas industry employment includes oil and gas exploration and oilfield services, or North American Industrial Classification System (NAICS) codes 211, 213111, 213112Quarterly Census of Employment Wages (QCEW): January - March 2020Data are preliminary and subject to revisionBlanks in the Employment, Total Earnings and Average Monthly Earnings columns due to confidentiality; data are suppressedSource: Alaska Department of Labor and Workforce Development, Research and Analysis Section
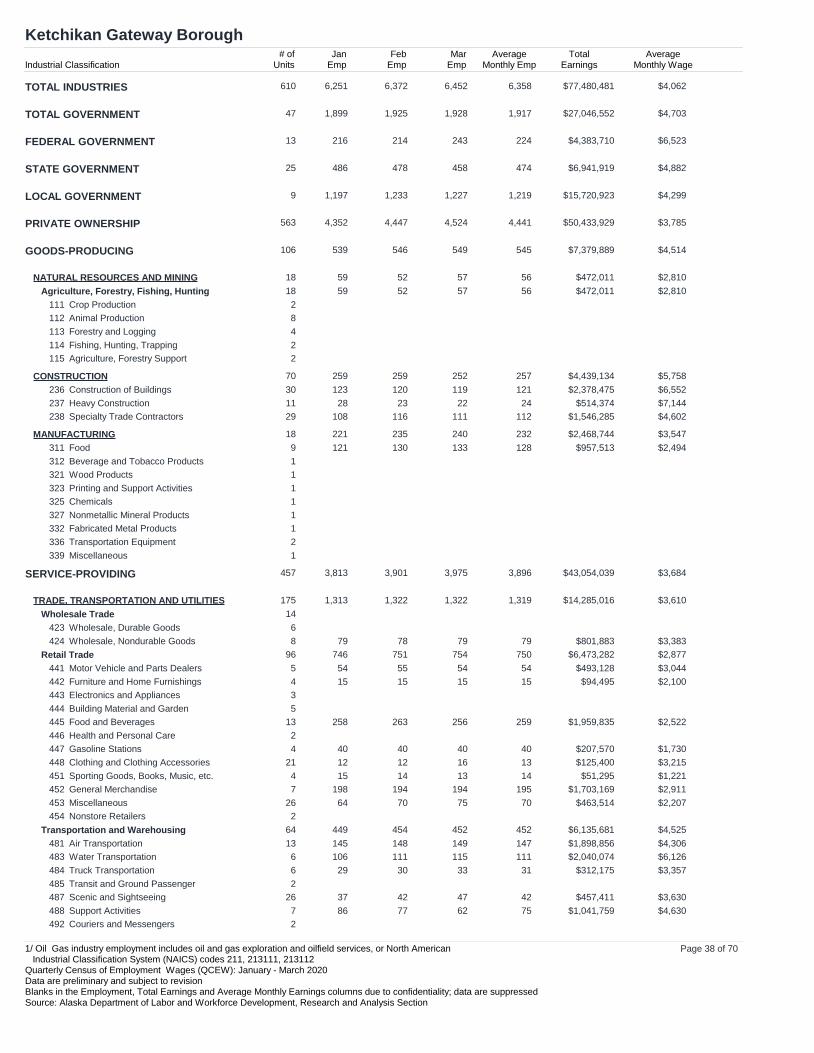
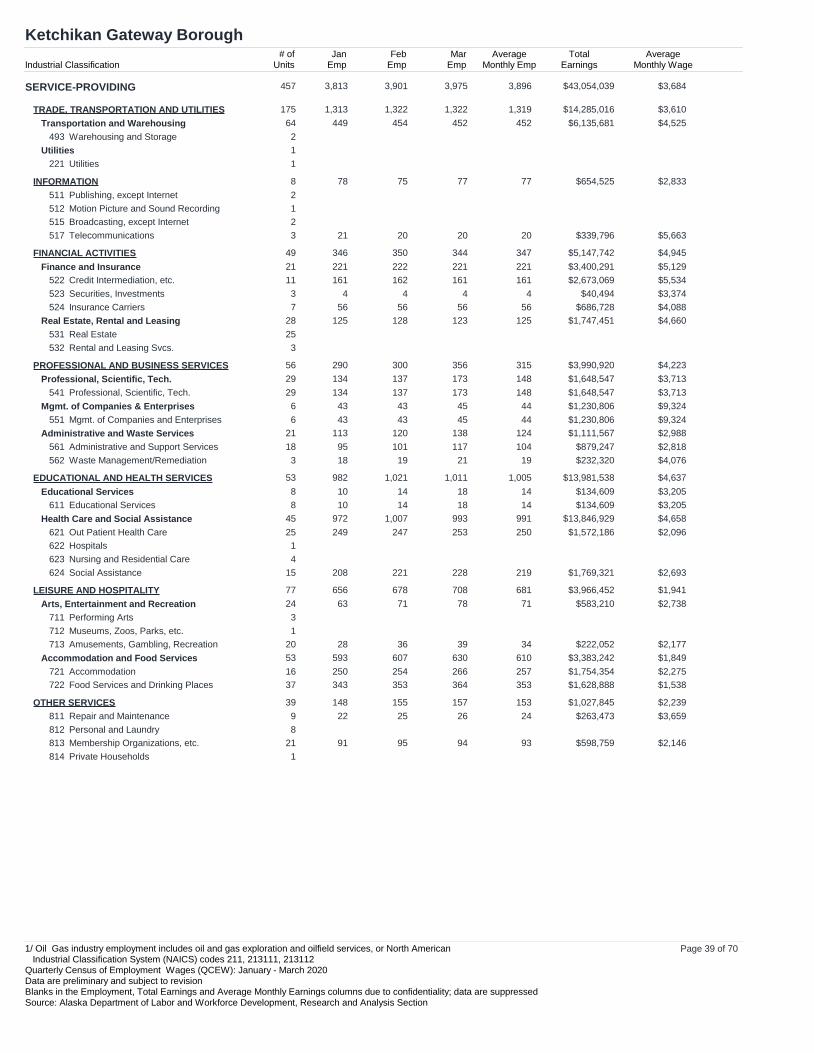
Ketchikan Gateway Borough
Industrial Classification# of
UnitsJan
EmpFeb
EmpMar
EmpAverage
Monthly EmpTotal
EarningsAverage
Monthly Wage
TOTAL INDUSTRIES 610 6,251 6,372 6,452 6,358 $77,480,481 $4,062
TOTAL GOVERNMENT 47 1,899 1,925 1,928 1,917 $27,046,552 $4,703
FEDERAL GOVERNMENT 13 216 214 243 224 $4,383,710 $6,523
STATE GOVERNMENT 25 486 478 458 474 $6,941,919 $4,882
LOCAL GOVERNMENT 9 1,197 1,233 1,227 1,219 $15,720,923 $4,299
Scenic and Sightseeing 26 37 42 47 42 $457,411 $3,630487
Support Activities 7 86 77 62 75 $1,041,759 $4,630488
Couriers and Messengers 2492
Page 38 of 701/ Oil Gas industry employment includes oil and gas exploration and oilfield services, or North American Industrial Classification System (NAICS) codes 211, 213111, 213112Quarterly Census of Employment Wages (QCEW): January - March 2020Data are preliminary and subject to revisionBlanks in the Employment, Total Earnings and Average Monthly Earnings columns due to confidentiality; data are suppressedSource: Alaska Department of Labor and Workforce Development, Research and Analysis Section
OTHER SERVICES 39 148 155 157 153 $1,027,845 $2,239
Repair and Maintenance 9 22 25 26 24 $263,473 $3,659811
Personal and Laundry 8812
Membership Organizations, etc. 21 91 95 94 93 $598,759 $2,146813
Private Households 1814
Page 39 of 701/ Oil Gas industry employment includes oil and gas exploration and oilfield services, or North American Industrial Classification System (NAICS) codes 211, 213111, 213112Quarterly Census of Employment Wages (QCEW): January - March 2020Data are preliminary and subject to revisionBlanks in the Employment, Total Earnings and Average Monthly Earnings columns due to confidentiality; data are suppressedSource: Alaska Department of Labor and Workforce Development, Research and Analysis Section
Kodiak Island Borough
Industrial Classification# of
UnitsJan
EmpFeb
EmpMar
EmpAverage
Monthly EmpTotal
EarningsAverage
Monthly Wage
TOTAL INDUSTRIES 490 5,126 5,987 5,924 5,679 $66,446,777 $3,900
TOTAL GOVERNMENT 69 1,599 1,582 1,584 1,588 $20,112,197 $4,222
FEDERAL GOVERNMENT 15 271 263 280 271 $3,972,489 $4,886
STATE GOVERNMENT 34 249 256 256 254 $3,743,915 $4,913
LOCAL GOVERNMENT 20 1,079 1,063 1,048 1,063 $12,395,793 $3,887
Support Activities 6 18 50 23 30 $213,665 $2,374488
Postal Service 1491
Couriers and Messengers 2492
Utilities 1
Utilities 1221
Page 40 of 701/ Oil Gas industry employment includes oil and gas exploration and oilfield services, or North American Industrial Classification System (NAICS) codes 211, 213111, 213112Quarterly Census of Employment Wages (QCEW): January - March 2020Data are preliminary and subject to revisionBlanks in the Employment, Total Earnings and Average Monthly Earnings columns due to confidentiality; data are suppressedSource: Alaska Department of Labor and Workforce Development, Research and Analysis Section
OTHER SERVICES 29 181 172 179 177 $1,284,455 $2,419
Repair and Maintenance 10 62 49 55 55 $641,900 $3,890811
Personal and Laundry 4 9 10 10 10 $28,960 $965812
Membership Organizations, etc. 15 110 113 114 112 $613,595 $1,826813
Page 41 of 701/ Oil Gas industry employment includes oil and gas exploration and oilfield services, or North American Industrial Classification System (NAICS) codes 211, 213111, 213112Quarterly Census of Employment Wages (QCEW): January - March 2020Data are preliminary and subject to revisionBlanks in the Employment, Total Earnings and Average Monthly Earnings columns due to confidentiality; data are suppressedSource: Alaska Department of Labor and Workforce Development, Research and Analysis Section
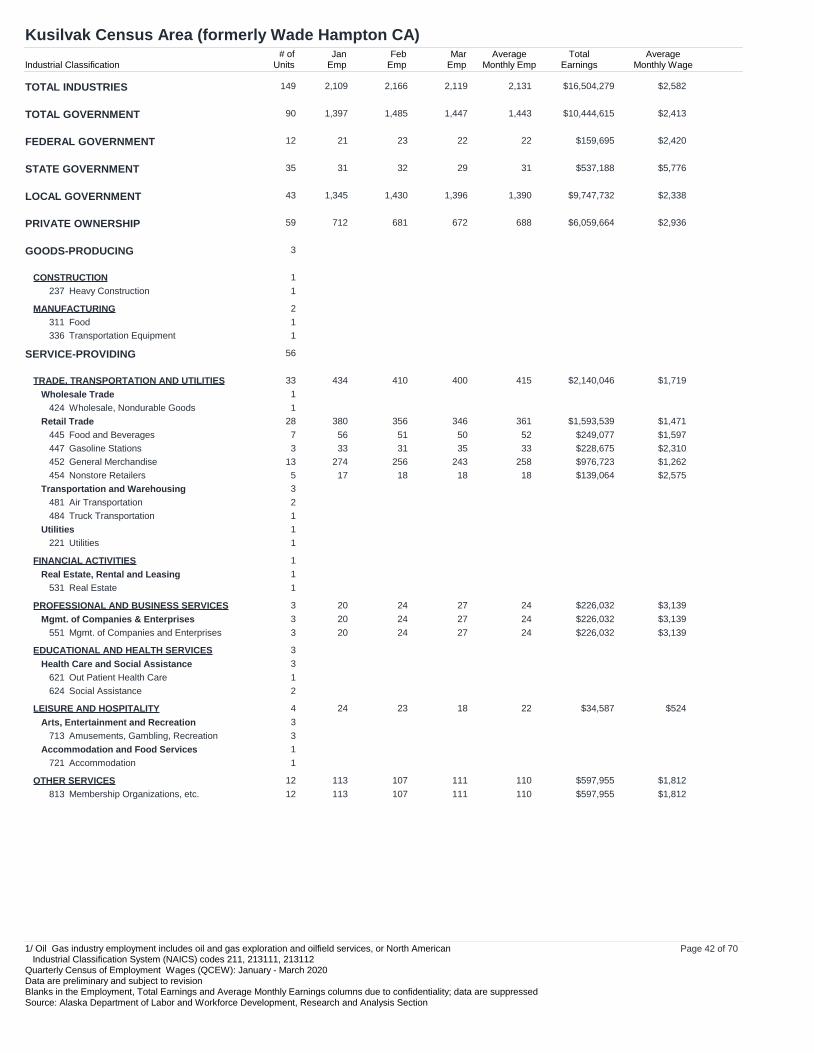
Kusilvak Census Area (formerly Wade Hampton CA)
Industrial Classification# of
UnitsJan
EmpFeb
EmpMar
EmpAverage
Monthly EmpTotal
EarningsAverage
Monthly Wage
TOTAL INDUSTRIES 149 2,109 2,166 2,119 2,131 $16,504,279 $2,582
TOTAL GOVERNMENT 90 1,397 1,485 1,447 1,443 $10,444,615 $2,413
FEDERAL GOVERNMENT 12 21 23 22 22 $159,695 $2,420
STATE GOVERNMENT 35 31 32 29 31 $537,188 $5,776
LOCAL GOVERNMENT 43 1,345 1,430 1,396 1,390 $9,747,732 $2,338
Mgmt. of Companies and Enterprises 3 20 24 27 24 $226,032 $3,139551
EDUCATIONAL AND HEALTH SERVICES 3
Health Care and Social Assistance 3
Out Patient Health Care 1621
Social Assistance 2624
LEISURE AND HOSPITALITY 4 24 23 18 22 $34,587 $524
Arts, Entertainment and Recreation 3
Amusements, Gambling, Recreation 3713
Accommodation and Food Services 1
Accommodation 1721
OTHER SERVICES 12 113 107 111 110 $597,955 $1,812
Membership Organizations, etc. 12 113 107 111 110 $597,955 $1,812813
Page 42 of 701/ Oil Gas industry employment includes oil and gas exploration and oilfield services, or North American Industrial Classification System (NAICS) codes 211, 213111, 213112Quarterly Census of Employment Wages (QCEW): January - March 2020Data are preliminary and subject to revisionBlanks in the Employment, Total Earnings and Average Monthly Earnings columns due to confidentiality; data are suppressedSource: Alaska Department of Labor and Workforce Development, Research and Analysis Section
Lake and Peninsula Borough
Industrial Classification# of
UnitsJan
EmpFeb
EmpMar
EmpAverage
Monthly EmpTotal
EarningsAverage
Monthly Wage
TOTAL INDUSTRIES 124 729 756 789 758 $6,110,735 $2,687
TOTAL GOVERNMENT 58 452 476 462 463 $3,146,942 $2,266
FEDERAL GOVERNMENT 11 23 26 27 25 $299,068 $3,988
STATE GOVERNMENT 10 4 4 3 4 $50,870 $4,239
LOCAL GOVERNMENT 37 425 446 432 434 $2,797,004 $2,148
Transportation and Warehousing 7 88 84 79 84 $852,761 $3,384
Air Transportation 5 86 83 77 82 $848,741 $3,450481
Truck Transportation 1484
Transit and Ground Passenger 1485
Utilities 4 23 22 24 23 $131,264 $1,902
Utilities 4 23 22 24 23 $131,264 $1,902221
INFORMATION 1
Telecommunications 1517
FINANCIAL ACTIVITIES 2
Finance and Insurance 1
Securities, Investments 1523
Real Estate, Rental and Leasing 1
Real Estate 1531
PROFESSIONAL AND BUSINESS SERVICES 5 9 8 5 7 $208,310 $9,920
Professional, Scientific, Tech. 2
Professional, Scientific, Tech. 2541
Mgmt. of Companies & Enterprises 2
Mgmt. of Companies and Enterprises 2551
Administrative and Waste Services 1
Administrative and Support Services 1561
EDUCATIONAL AND HEALTH SERVICES 2
Educational Services 1
Educational Services 1611
Health Care and Social Assistance 1
Out Patient Health Care 1621
LEISURE AND HOSPITALITY 22 43 39 41 41 $402,601 $3,273
Arts, Entertainment and Recreation 7
Amusements, Gambling, Recreation 7713
Accommodation and Food Services 15
Accommodation 15721
Page 43 of 701/ Oil Gas industry employment includes oil and gas exploration and oilfield services, or North American Industrial Classification System (NAICS) codes 211, 213111, 213112Quarterly Census of Employment Wages (QCEW): January - March 2020Data are preliminary and subject to revisionBlanks in the Employment, Total Earnings and Average Monthly Earnings columns due to confidentiality; data are suppressedSource: Alaska Department of Labor and Workforce Development, Research and Analysis Section
Lake and Peninsula Borough
Industrial Classification# of
UnitsJan
EmpFeb
EmpMar
EmpAverage
Monthly EmpTotal
EarningsAverage
Monthly Wage
SERVICE-PROVIDING 55
OTHER SERVICES 4
Membership Organizations, etc. 4813
Page 44 of 701/ Oil Gas industry employment includes oil and gas exploration and oilfield services, or North American Industrial Classification System (NAICS) codes 211, 213111, 213112Quarterly Census of Employment Wages (QCEW): January - March 2020Data are preliminary and subject to revisionBlanks in the Employment, Total Earnings and Average Monthly Earnings columns due to confidentiality; data are suppressedSource: Alaska Department of Labor and Workforce Development, Research and Analysis Section
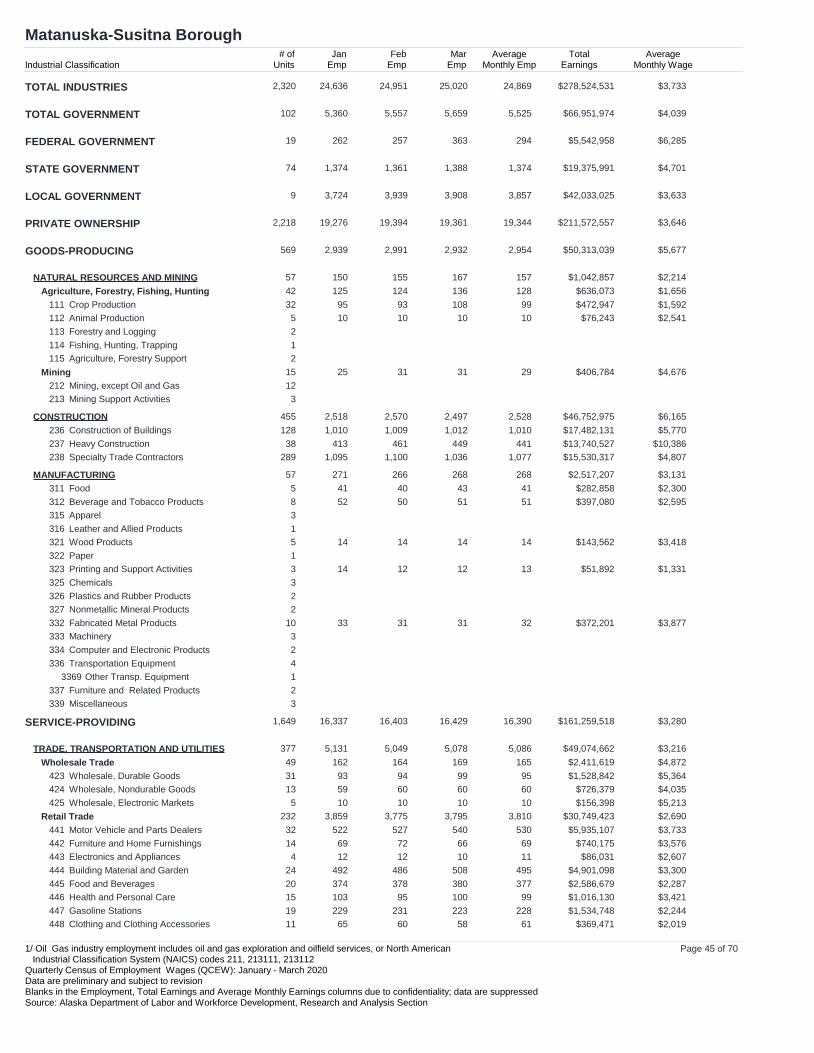
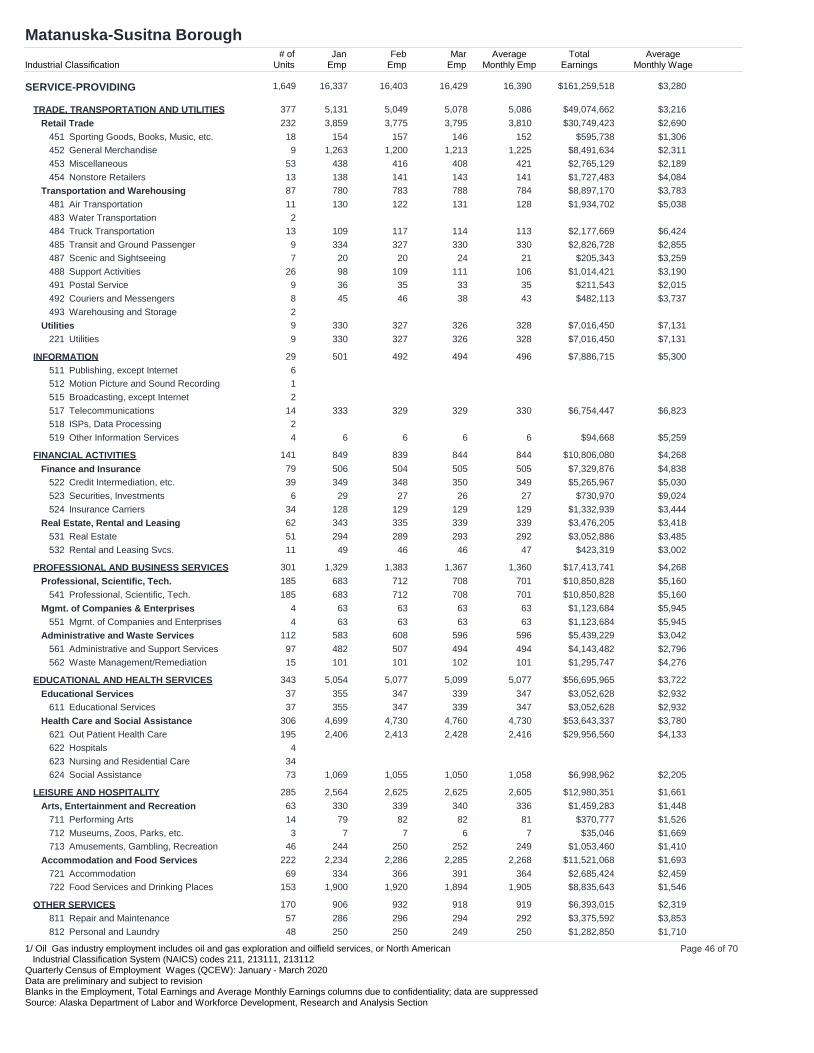
Matanuska-Susitna Borough
Industrial Classification# of
UnitsJan
EmpFeb
EmpMar
EmpAverage
Monthly EmpTotal
EarningsAverage
Monthly Wage
TOTAL INDUSTRIES 2,320 24,636 24,951 25,020 24,869 $278,524,531 $3,733
TOTAL GOVERNMENT 102 5,360 5,557 5,659 5,525 $66,951,974 $4,039
FEDERAL GOVERNMENT 19 262 257 363 294 $5,542,958 $6,285
STATE GOVERNMENT 74 1,374 1,361 1,388 1,374 $19,375,991 $4,701
LOCAL GOVERNMENT 9 3,724 3,939 3,908 3,857 $42,033,025 $3,633
Page 45 of 701/ Oil Gas industry employment includes oil and gas exploration and oilfield services, or North American Industrial Classification System (NAICS) codes 211, 213111, 213112Quarterly Census of Employment Wages (QCEW): January - March 2020Data are preliminary and subject to revisionBlanks in the Employment, Total Earnings and Average Monthly Earnings columns due to confidentiality; data are suppressedSource: Alaska Department of Labor and Workforce Development, Research and Analysis Section
OTHER SERVICES 170 906 932 918 919 $6,393,015 $2,319
Repair and Maintenance 57 286 296 294 292 $3,375,592 $3,853811
Personal and Laundry 48 250 250 249 250 $1,282,850 $1,710812
Page 46 of 701/ Oil Gas industry employment includes oil and gas exploration and oilfield services, or North American Industrial Classification System (NAICS) codes 211, 213111, 213112Quarterly Census of Employment Wages (QCEW): January - March 2020Data are preliminary and subject to revisionBlanks in the Employment, Total Earnings and Average Monthly Earnings columns due to confidentiality; data are suppressedSource: Alaska Department of Labor and Workforce Development, Research and Analysis Section
Page 47 of 701/ Oil Gas industry employment includes oil and gas exploration and oilfield services, or North American Industrial Classification System (NAICS) codes 211, 213111, 213112Quarterly Census of Employment Wages (QCEW): January - March 2020Data are preliminary and subject to revisionBlanks in the Employment, Total Earnings and Average Monthly Earnings columns due to confidentiality; data are suppressedSource: Alaska Department of Labor and Workforce Development, Research and Analysis Section
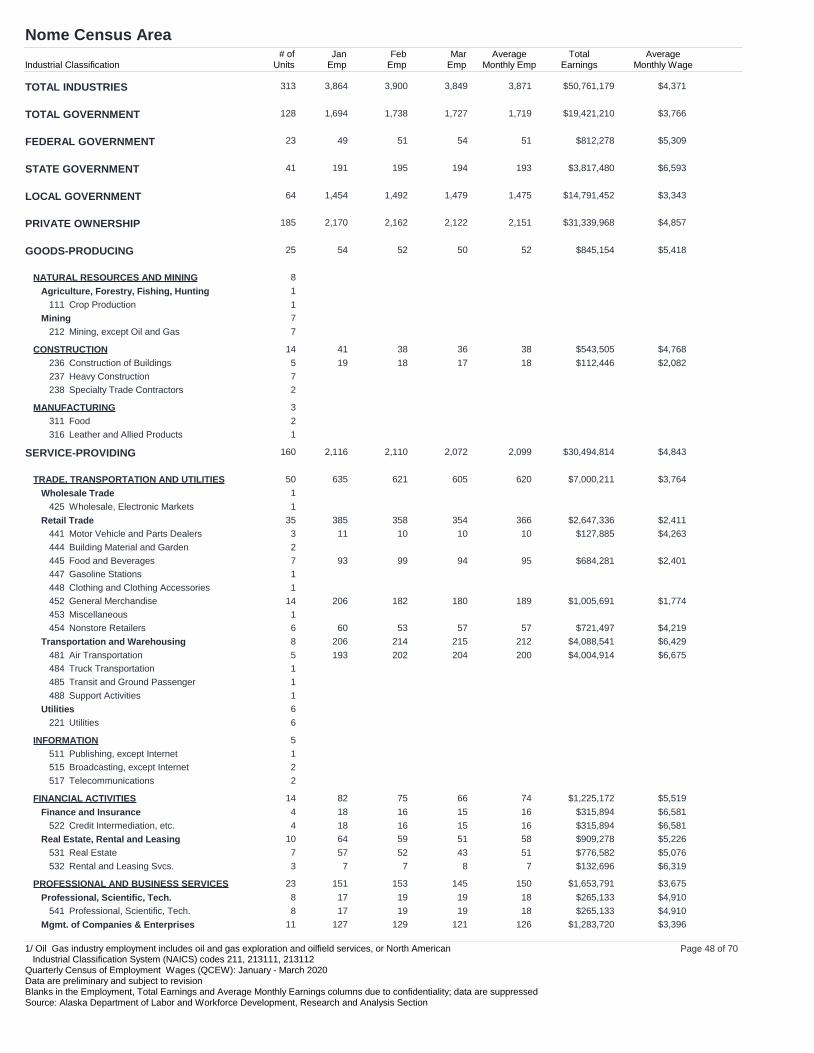
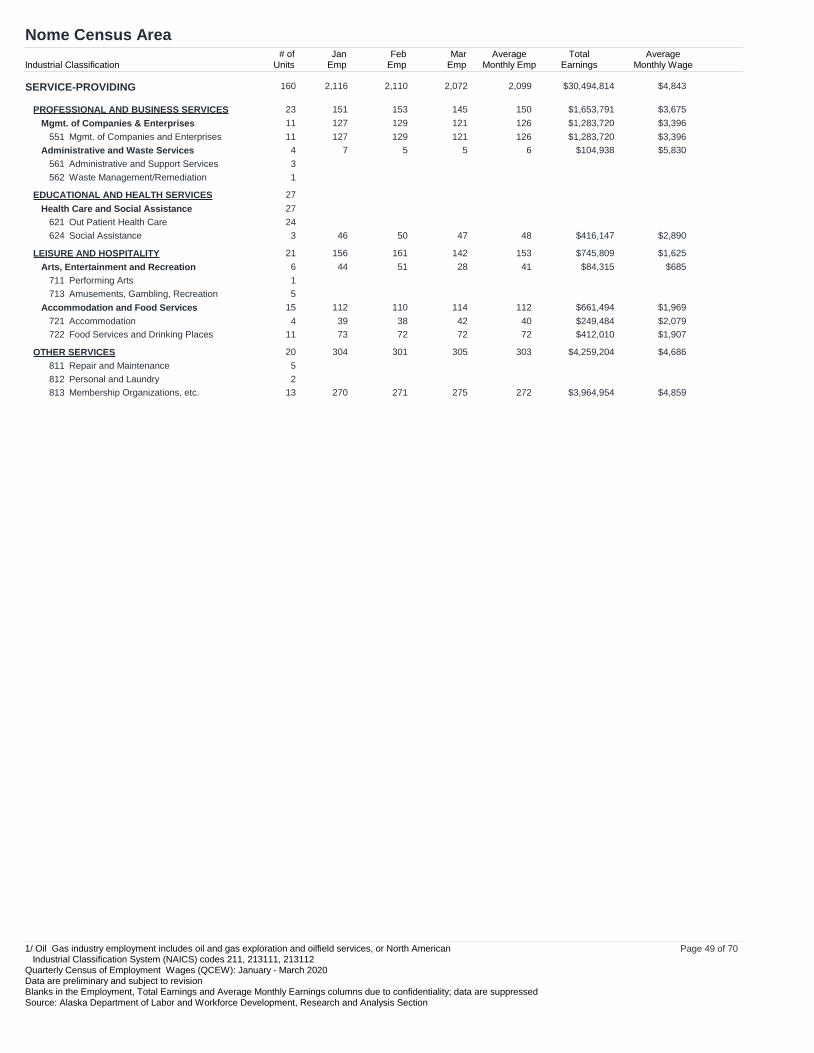
Nome Census Area
Industrial Classification# of
UnitsJan
EmpFeb
EmpMar
EmpAverage
Monthly EmpTotal
EarningsAverage
Monthly Wage
TOTAL INDUSTRIES 313 3,864 3,900 3,849 3,871 $50,761,179 $4,371
TOTAL GOVERNMENT 128 1,694 1,738 1,727 1,719 $19,421,210 $3,766
FEDERAL GOVERNMENT 23 49 51 54 51 $812,278 $5,309
STATE GOVERNMENT 41 191 195 194 193 $3,817,480 $6,593
LOCAL GOVERNMENT 64 1,454 1,492 1,479 1,475 $14,791,452 $3,343
Page 48 of 701/ Oil Gas industry employment includes oil and gas exploration and oilfield services, or North American Industrial Classification System (NAICS) codes 211, 213111, 213112Quarterly Census of Employment Wages (QCEW): January - March 2020Data are preliminary and subject to revisionBlanks in the Employment, Total Earnings and Average Monthly Earnings columns due to confidentiality; data are suppressedSource: Alaska Department of Labor and Workforce Development, Research and Analysis Section
OTHER SERVICES 20 304 301 305 303 $4,259,204 $4,686
Repair and Maintenance 5811
Personal and Laundry 2812
Membership Organizations, etc. 13 270 271 275 272 $3,964,954 $4,859813
Page 49 of 701/ Oil Gas industry employment includes oil and gas exploration and oilfield services, or North American Industrial Classification System (NAICS) codes 211, 213111, 213112Quarterly Census of Employment Wages (QCEW): January - March 2020Data are preliminary and subject to revisionBlanks in the Employment, Total Earnings and Average Monthly Earnings columns due to confidentiality; data are suppressedSource: Alaska Department of Labor and Workforce Development, Research and Analysis Section
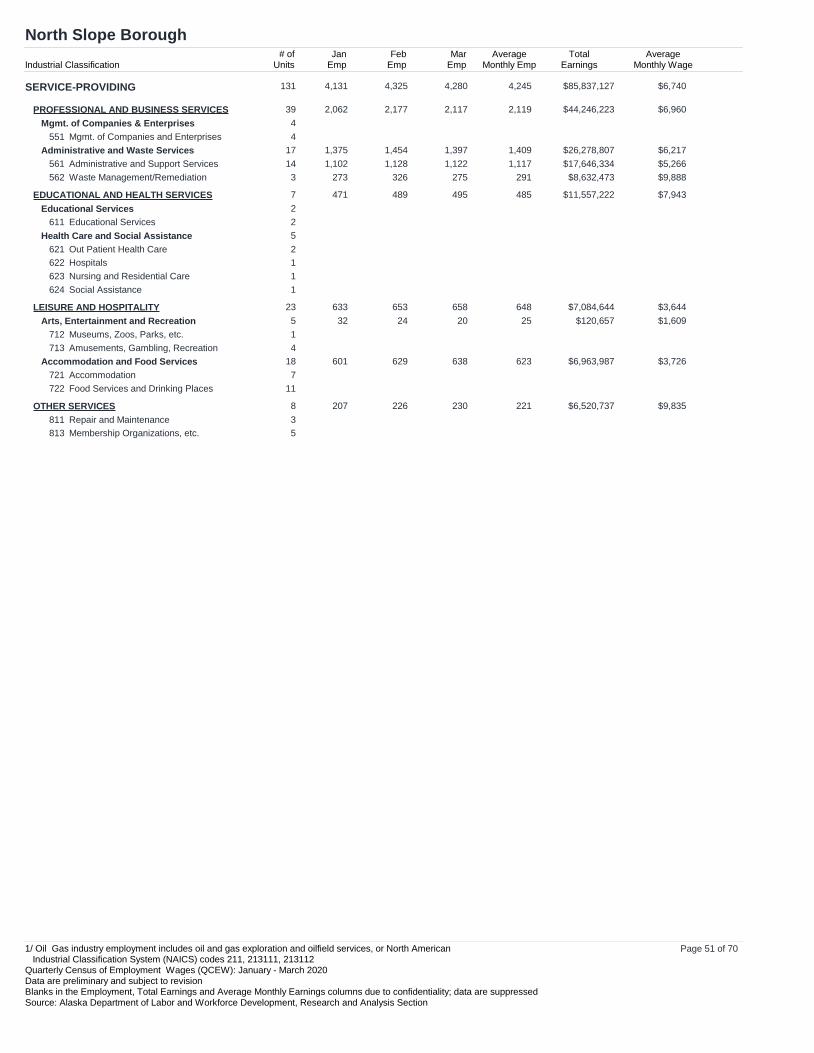
North Slope Borough
Industrial Classification# of
UnitsJan
EmpFeb
EmpMar
EmpAverage
Monthly EmpTotal
EarningsAverage
Monthly Wage
TOTAL INDUSTRIES 248 13,579 13,964 13,811 13,785 $391,168,912 $9,459
TOTAL GOVERNMENT 64 2,133 2,138 2,180 2,150 $30,171,466 $4,678
FEDERAL GOVERNMENT 10 17 17 16 17 $264,212 $5,181
STATE GOVERNMENT 20 56 56 57 56 $1,004,707 $5,980
LOCAL GOVERNMENT 34 2,060 2,065 2,107 2,077 $28,902,547 $4,639
PROFESSIONAL AND BUSINESS SERVICES 39 2,062 2,177 2,117 2,119 $44,246,223 $6,960
Professional, Scientific, Tech. 18
Professional, Scientific, Tech. 18541
Page 50 of 701/ Oil Gas industry employment includes oil and gas exploration and oilfield services, or North American Industrial Classification System (NAICS) codes 211, 213111, 213112Quarterly Census of Employment Wages (QCEW): January - March 2020Data are preliminary and subject to revisionBlanks in the Employment, Total Earnings and Average Monthly Earnings columns due to confidentiality; data are suppressedSource: Alaska Department of Labor and Workforce Development, Research and Analysis Section
OTHER SERVICES 8 207 226 230 221 $6,520,737 $9,835
Repair and Maintenance 3811
Membership Organizations, etc. 5813
Page 51 of 701/ Oil Gas industry employment includes oil and gas exploration and oilfield services, or North American Industrial Classification System (NAICS) codes 211, 213111, 213112Quarterly Census of Employment Wages (QCEW): January - March 2020Data are preliminary and subject to revisionBlanks in the Employment, Total Earnings and Average Monthly Earnings columns due to confidentiality; data are suppressedSource: Alaska Department of Labor and Workforce Development, Research and Analysis Section
Northwest Arctic Borough
Industrial Classification# of
UnitsJan
EmpFeb
EmpMar
EmpAverage
Monthly EmpTotal
EarningsAverage
Monthly Wage
TOTAL INDUSTRIES 165 2,908 2,923 2,883 2,905 $54,338,656 $6,235
TOTAL GOVERNMENT 88 1,004 1,034 975 1,005 $12,140,142 $4,027
FEDERAL GOVERNMENT 14 45 46 50 47 $637,748 $4,523
STATE GOVERNMENT 24 59 59 61 60 $1,283,027 $7,128
LOCAL GOVERNMENT 50 900 929 864 898 $10,219,367 $3,793
PROFESSIONAL AND BUSINESS SERVICES 5 43 43 40 42 $632,291 $5,018
Professional, Scientific, Tech. 2
Professional, Scientific, Tech. 2541
Mgmt. of Companies & Enterprises 1
Mgmt. of Companies and Enterprises 1551
Administrative and Waste Services 2
Administrative and Support Services 1561
Waste Management/Remediation 1562
EDUCATIONAL AND HEALTH SERVICES 14
Health Care and Social Assistance 14
Out Patient Health Care 14621
LEISURE AND HOSPITALITY 8 127 127 126 127 $1,788,256 $4,694
Arts, Entertainment and Recreation 2
Page 52 of 701/ Oil Gas industry employment includes oil and gas exploration and oilfield services, or North American Industrial Classification System (NAICS) codes 211, 213111, 213112Quarterly Census of Employment Wages (QCEW): January - March 2020Data are preliminary and subject to revisionBlanks in the Employment, Total Earnings and Average Monthly Earnings columns due to confidentiality; data are suppressedSource: Alaska Department of Labor and Workforce Development, Research and Analysis Section
Northwest Arctic Borough
Industrial Classification# of
UnitsJan
EmpFeb
EmpMar
EmpAverage
Monthly EmpTotal
EarningsAverage
Monthly Wage
SERVICE-PROVIDING 65
LEISURE AND HOSPITALITY 8 127 127 126 127 $1,788,256 $4,694
Membership Organizations, etc. 3 19 18 18 18 $107,621 $1,993813
Private Households 1814
Page 53 of 701/ Oil Gas industry employment includes oil and gas exploration and oilfield services, or North American Industrial Classification System (NAICS) codes 211, 213111, 213112Quarterly Census of Employment Wages (QCEW): January - March 2020Data are preliminary and subject to revisionBlanks in the Employment, Total Earnings and Average Monthly Earnings columns due to confidentiality; data are suppressedSource: Alaska Department of Labor and Workforce Development, Research and Analysis Section
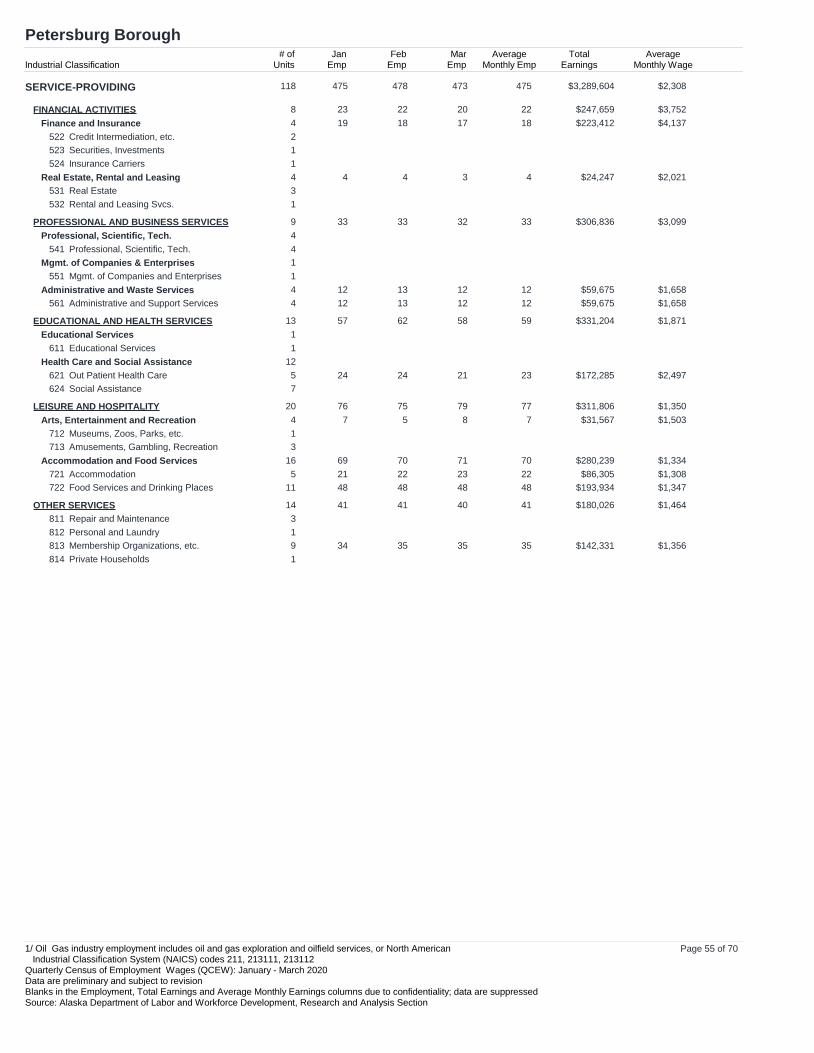
Petersburg Borough
Industrial Classification# of
UnitsJan
EmpFeb
EmpMar
EmpAverage
Monthly EmpTotal
EarningsAverage
Monthly Wage
TOTAL INDUSTRIES 168 1,172 1,227 1,222 1,207 $11,853,378 $3,274
TOTAL GOVERNMENT 23 509 522 531 520 $6,531,711 $4,187
FEDERAL GOVERNMENT 5 69 68 82 73 $1,346,145 $6,147
STATE GOVERNMENT 12 35 39 41 38 $489,404 $4,293
LOCAL GOVERNMENT 6 405 415 408 409 $4,696,162 $3,827
Page 54 of 701/ Oil Gas industry employment includes oil and gas exploration and oilfield services, or North American Industrial Classification System (NAICS) codes 211, 213111, 213112Quarterly Census of Employment Wages (QCEW): January - March 2020Data are preliminary and subject to revisionBlanks in the Employment, Total Earnings and Average Monthly Earnings columns due to confidentiality; data are suppressedSource: Alaska Department of Labor and Workforce Development, Research and Analysis Section
Membership Organizations, etc. 9 34 35 35 35 $142,331 $1,356813
Private Households 1814
Page 55 of 701/ Oil Gas industry employment includes oil and gas exploration and oilfield services, or North American Industrial Classification System (NAICS) codes 211, 213111, 213112Quarterly Census of Employment Wages (QCEW): January - March 2020Data are preliminary and subject to revisionBlanks in the Employment, Total Earnings and Average Monthly Earnings columns due to confidentiality; data are suppressedSource: Alaska Department of Labor and Workforce Development, Research and Analysis Section
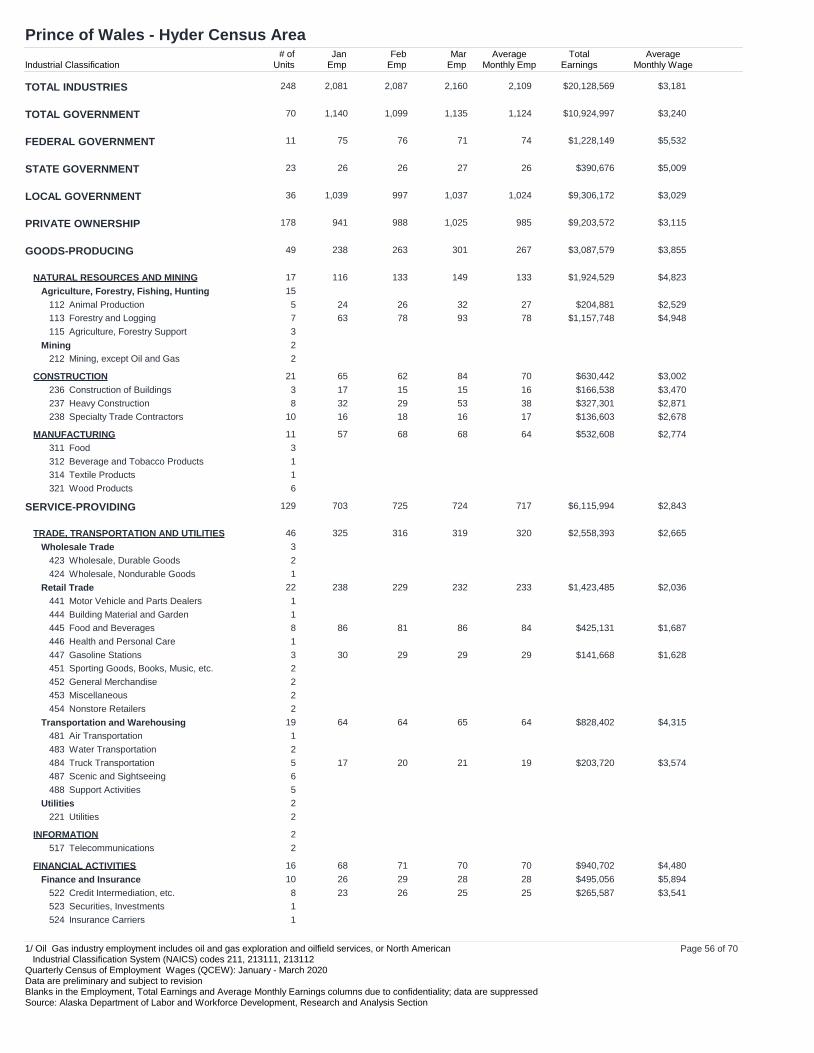
Prince of Wales - Hyder Census Area
Industrial Classification# of
UnitsJan
EmpFeb
EmpMar
EmpAverage
Monthly EmpTotal
EarningsAverage
Monthly Wage
TOTAL INDUSTRIES 248 2,081 2,087 2,160 2,109 $20,128,569 $3,181
TOTAL GOVERNMENT 70 1,140 1,099 1,135 1,124 $10,924,997 $3,240
FEDERAL GOVERNMENT 11 75 76 71 74 $1,228,149 $5,532
STATE GOVERNMENT 23 26 26 27 26 $390,676 $5,009
LOCAL GOVERNMENT 36 1,039 997 1,037 1,024 $9,306,172 $3,029
Finance and Insurance 10 26 29 28 28 $495,056 $5,894
Credit Intermediation, etc. 8 23 26 25 25 $265,587 $3,541522
Securities, Investments 1523
Insurance Carriers 1524
Page 56 of 701/ Oil Gas industry employment includes oil and gas exploration and oilfield services, or North American Industrial Classification System (NAICS) codes 211, 213111, 213112Quarterly Census of Employment Wages (QCEW): January - March 2020Data are preliminary and subject to revisionBlanks in the Employment, Total Earnings and Average Monthly Earnings columns due to confidentiality; data are suppressedSource: Alaska Department of Labor and Workforce Development, Research and Analysis Section
Mgmt. of Companies and Enterprises 3 15 30 31 25 $242,777 $3,237551
Administrative and Waste Services 5
Administrative and Support Services 5561
EDUCATIONAL AND HEALTH SERVICES 17 159 165 164 163 $1,704,014 $3,485
Health Care and Social Assistance 17 159 165 164 163 $1,704,014 $3,485
Out Patient Health Care 7621
Social Assistance 10624
LEISURE AND HOSPITALITY 27 81 88 89 86 $417,342 $1,618
Arts, Entertainment and Recreation 1
Amusements, Gambling, Recreation 1713
Accommodation and Food Services 26
Accommodation 17 24 28 29 27 $207,964 $2,567721
Food Services and Drinking Places 9722
OTHER SERVICES 10
Repair and Maintenance 1811
Personal and Laundry 1812
Membership Organizations, etc. 8 40 41 38 40 $135,846 $1,132813
Page 57 of 701/ Oil Gas industry employment includes oil and gas exploration and oilfield services, or North American Industrial Classification System (NAICS) codes 211, 213111, 213112Quarterly Census of Employment Wages (QCEW): January - March 2020Data are preliminary and subject to revisionBlanks in the Employment, Total Earnings and Average Monthly Earnings columns due to confidentiality; data are suppressedSource: Alaska Department of Labor and Workforce Development, Research and Analysis Section
Sitka City and Borough
Industrial Classification# of
UnitsJan
EmpFeb
EmpMar
EmpAverage
Monthly EmpTotal
EarningsAverage
Monthly Wage
TOTAL INDUSTRIES 372 3,544 3,719 3,812 3,692 $42,079,896 $3,799
TOTAL GOVERNMENT 40 855 911 952 906 $12,506,197 $4,601
FEDERAL GOVERNMENT 11 100 100 130 110 $2,059,167 $6,240
STATE GOVERNMENT 25 263 313 318 298 $3,574,818 $3,999
LOCAL GOVERNMENT 4 492 498 504 498 $6,872,212 $4,600
Page 58 of 701/ Oil Gas industry employment includes oil and gas exploration and oilfield services, or North American Industrial Classification System (NAICS) codes 211, 213111, 213112Quarterly Census of Employment Wages (QCEW): January - March 2020Data are preliminary and subject to revisionBlanks in the Employment, Total Earnings and Average Monthly Earnings columns due to confidentiality; data are suppressedSource: Alaska Department of Labor and Workforce Development, Research and Analysis Section
Repair and Maintenance 7 29 30 29 29 $272,745 $3,135811
Personal and Laundry 4812
Membership Organizations, etc. 18 81 79 77 79 $559,231 $2,360813
Private Households 2814
UNCLASSIFIED ESTABLISHMENTS 1 0 0 0 0 $0
Page 59 of 701/ Oil Gas industry employment includes oil and gas exploration and oilfield services, or North American Industrial Classification System (NAICS) codes 211, 213111, 213112Quarterly Census of Employment Wages (QCEW): January - March 2020Data are preliminary and subject to revisionBlanks in the Employment, Total Earnings and Average Monthly Earnings columns due to confidentiality; data are suppressedSource: Alaska Department of Labor and Workforce Development, Research and Analysis Section
Skagway Municipality
Industrial Classification# of
UnitsJan
EmpFeb
EmpMar
EmpAverage
Monthly EmpTotal
EarningsAverage
Monthly Wage
TOTAL INDUSTRIES 131 519 512 527 519 $5,035,118 $3,234
TOTAL GOVERNMENT 16 173 173 177 174 $2,334,015 $4,471
FEDERAL GOVERNMENT 5 38 41 46 42 $776,839 $6,165
STATE GOVERNMENT 7 10 9 9 9 $115,039 $4,261
LOCAL GOVERNMENT 4 125 123 122 123 $1,442,137 $3,908
EDUCATIONAL AND HEALTH SERVICES 9 9 9 9 9 $40,995 $1,518
Educational Services 1
Educational Services 1611
Health Care and Social Assistance 8
Out Patient Health Care 2621
Social Assistance 6 6 6 6 6 $26,758 $1,487624
LEISURE AND HOSPITALITY 27 64 59 59 61 $532,687 $2,911
Arts, Entertainment and Recreation 10 31 33 27 30 $311,150 $3,457
Performing Arts 1711
Page 60 of 701/ Oil Gas industry employment includes oil and gas exploration and oilfield services, or North American Industrial Classification System (NAICS) codes 211, 213111, 213112Quarterly Census of Employment Wages (QCEW): January - March 2020Data are preliminary and subject to revisionBlanks in the Employment, Total Earnings and Average Monthly Earnings columns due to confidentiality; data are suppressedSource: Alaska Department of Labor and Workforce Development, Research and Analysis Section
Membership Organizations, etc. 4 26 22 21 23 $113,298 $1,642813
Page 61 of 701/ Oil Gas industry employment includes oil and gas exploration and oilfield services, or North American Industrial Classification System (NAICS) codes 211, 213111, 213112Quarterly Census of Employment Wages (QCEW): January - March 2020Data are preliminary and subject to revisionBlanks in the Employment, Total Earnings and Average Monthly Earnings columns due to confidentiality; data are suppressedSource: Alaska Department of Labor and Workforce Development, Research and Analysis Section
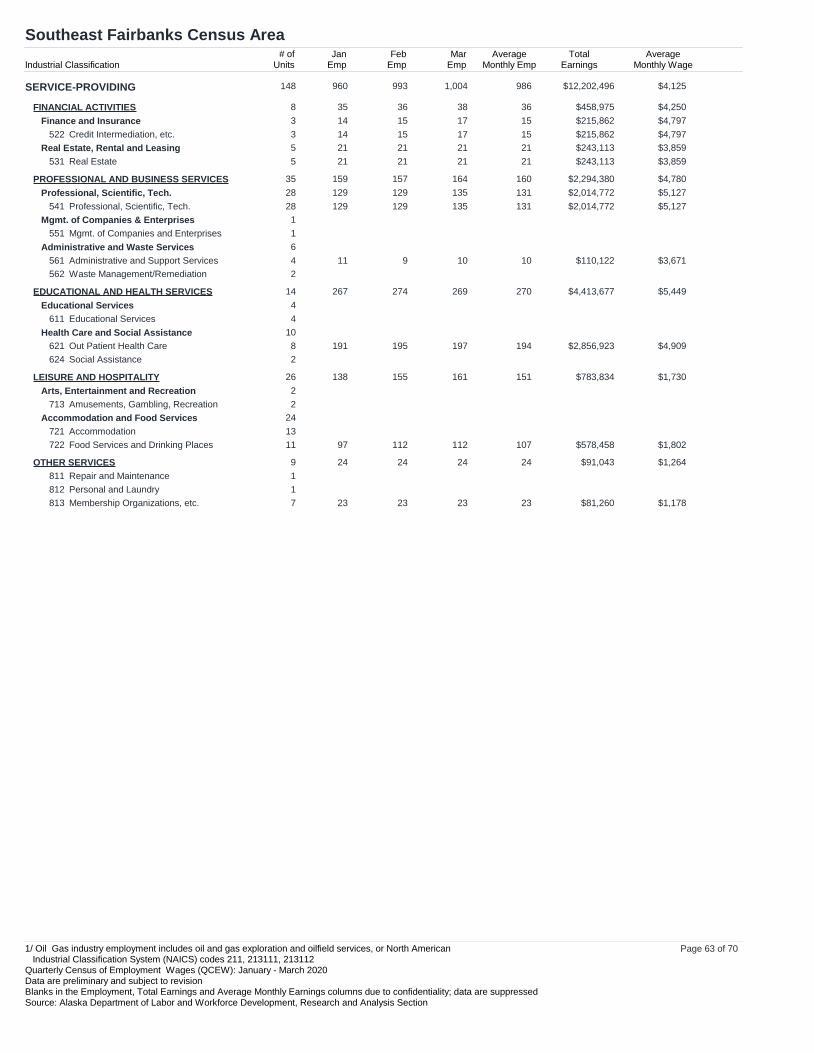
Southeast Fairbanks Census Area
Industrial Classification# of
UnitsJan
EmpFeb
EmpMar
EmpAverage
Monthly EmpTotal
EarningsAverage
Monthly Wage
TOTAL INDUSTRIES 250 2,379 2,428 2,465 2,424 $42,511,617 $5,846
TOTAL GOVERNMENT 65 786 777 796 786 $12,281,093 $5,208
FEDERAL GOVERNMENT 13 343 333 338 338 $7,088,697 $6,991
STATE GOVERNMENT 36 96 90 108 98 $1,345,307 $4,576
LOCAL GOVERNMENT 16 347 354 350 350 $3,847,089 $3,664
Page 62 of 701/ Oil Gas industry employment includes oil and gas exploration and oilfield services, or North American Industrial Classification System (NAICS) codes 211, 213111, 213112Quarterly Census of Employment Wages (QCEW): January - March 2020Data are preliminary and subject to revisionBlanks in the Employment, Total Earnings and Average Monthly Earnings columns due to confidentiality; data are suppressedSource: Alaska Department of Labor and Workforce Development, Research and Analysis Section
Membership Organizations, etc. 7 23 23 23 23 $81,260 $1,178813
Page 63 of 701/ Oil Gas industry employment includes oil and gas exploration and oilfield services, or North American Industrial Classification System (NAICS) codes 211, 213111, 213112Quarterly Census of Employment Wages (QCEW): January - March 2020Data are preliminary and subject to revisionBlanks in the Employment, Total Earnings and Average Monthly Earnings columns due to confidentiality; data are suppressedSource: Alaska Department of Labor and Workforce Development, Research and Analysis Section
Wrangell City and Borough
Industrial Classification# of
UnitsJan
EmpFeb
EmpMar
EmpAverage
Monthly EmpTotal
EarningsAverage
Monthly Wage
TOTAL INDUSTRIES 96 745 762 762 756 $6,968,654 $3,073
TOTAL GOVERNMENT 20 218 223 220 220 $2,258,668 $3,422
FEDERAL GOVERNMENT 5 37 37 38 37 $620,702 $5,592
STATE GOVERNMENT 11 15 16 16 16 $225,579 $4,700
LOCAL GOVERNMENT 4 166 170 166 167 $1,412,387 $2,819
Finance and Insurance 4 15 15 14 15 $152,010 $3,378
Credit Intermediation, etc. 3522
Securities, Investments 1523
Real Estate, Rental and Leasing 4 4 4 4 4 $10,750 $896
Real Estate 3531
Rental and Leasing Svcs. 1532
PROFESSIONAL AND BUSINESS SERVICES 4 8 10 10 9 $42,054 $1,558
Professional, Scientific, Tech. 2
Professional, Scientific, Tech. 2541
Administrative and Waste Services 2
Administrative and Support Services 2561
EDUCATIONAL AND HEALTH SERVICES 4
Page 64 of 701/ Oil Gas industry employment includes oil and gas exploration and oilfield services, or North American Industrial Classification System (NAICS) codes 211, 213111, 213112Quarterly Census of Employment Wages (QCEW): January - March 2020Data are preliminary and subject to revisionBlanks in the Employment, Total Earnings and Average Monthly Earnings columns due to confidentiality; data are suppressedSource: Alaska Department of Labor and Workforce Development, Research and Analysis Section
Page 65 of 701/ Oil Gas industry employment includes oil and gas exploration and oilfield services, or North American Industrial Classification System (NAICS) codes 211, 213111, 213112Quarterly Census of Employment Wages (QCEW): January - March 2020Data are preliminary and subject to revisionBlanks in the Employment, Total Earnings and Average Monthly Earnings columns due to confidentiality; data are suppressedSource: Alaska Department of Labor and Workforce Development, Research and Analysis Section
Yakutat City and Borough
Industrial Classification# of
UnitsJan
EmpFeb
EmpMar
EmpAverage
Monthly EmpTotal
EarningsAverage
Monthly Wage
TOTAL INDUSTRIES 47 247 272 263 261 $3,121,868 $3,987
TOTAL GOVERNMENT 17 96 109 105 104 $1,267,092 $4,061
EDUCATIONAL AND HEALTH SERVICES 4 43 56 53 51 $666,547 $4,357
Health Care and Social Assistance 4 43 56 53 51 $666,547 $4,357
Out Patient Health Care 3621
Social Assistance 1624
LEISURE AND HOSPITALITY 8 26 25 29 27 $161,005 $1,988
Arts, Entertainment and Recreation 1
Amusements, Gambling, Recreation 1713
Accommodation and Food Services 7
Accommodation 6 14 12 15 14 $107,389 $2,557721
Food Services and Drinking Places 1722
OTHER SERVICES 1
Membership Organizations, etc. 1813
Page 66 of 701/ Oil Gas industry employment includes oil and gas exploration and oilfield services, or North American Industrial Classification System (NAICS) codes 211, 213111, 213112Quarterly Census of Employment Wages (QCEW): January - March 2020Data are preliminary and subject to revisionBlanks in the Employment, Total Earnings and Average Monthly Earnings columns due to confidentiality; data are suppressedSource: Alaska Department of Labor and Workforce Development, Research and Analysis Section
Yukon-Koyukuk Census Area
Industrial Classification# of
UnitsJan
EmpFeb
EmpMar
EmpAverage
Monthly EmpTotal
EarningsAverage
Monthly Wage
TOTAL INDUSTRIES 278 2,097 2,158 2,145 2,133 $20,265,336 $3,167
TOTAL GOVERNMENT 157 1,473 1,515 1,523 1,503 $12,712,870 $2,819
FEDERAL GOVERNMENT 29 56 53 63 57 $693,828 $4,057
STATE GOVERNMENT 59 75 74 79 76 $1,198,707 $5,257
LOCAL GOVERNMENT 69 1,342 1,388 1,381 1,370 $10,820,335 $2,633
Mgmt. of Companies and Enterprises 3 11 13 9 11 $113,759 $3,447551
Administrative and Waste Services 2
Administrative and Support Services 2561
EDUCATIONAL AND HEALTH SERVICES 8 194 194 196 195 $2,293,039 $3,920
Educational Services 1
Educational Services 1611
Page 67 of 701/ Oil Gas industry employment includes oil and gas exploration and oilfield services, or North American Industrial Classification System (NAICS) codes 211, 213111, 213112Quarterly Census of Employment Wages (QCEW): January - March 2020Data are preliminary and subject to revisionBlanks in the Employment, Total Earnings and Average Monthly Earnings columns due to confidentiality; data are suppressedSource: Alaska Department of Labor and Workforce Development, Research and Analysis Section
EDUCATIONAL AND HEALTH SERVICES 8 194 194 196 195 $2,293,039 $3,920
Health Care and Social Assistance 7
Out Patient Health Care 4 36 35 36 36 $715,802 $6,628621
Nursing and Residential Care 1623
Social Assistance 2624
LEISURE AND HOSPITALITY 17 32 32 34 33 $152,010 $1,535
Arts, Entertainment and Recreation 2
Amusements, Gambling, Recreation 2713
Accommodation and Food Services 15
Accommodation 8 17 18 19 18 $78,269 $1,449721
Food Services and Drinking Places 7722
OTHER SERVICES 11 112 114 112 113 $1,205,706 $3,557
Membership Organizations, etc. 11 112 114 112 113 $1,205,706 $3,557813
UNCLASSIFIED ESTABLISHMENTS 1 0 0 0 0 $0
Page 68 of 701/ Oil Gas industry employment includes oil and gas exploration and oilfield services, or North American Industrial Classification System (NAICS) codes 211, 213111, 213112Quarterly Census of Employment Wages (QCEW): January - March 2020Data are preliminary and subject to revisionBlanks in the Employment, Total Earnings and Average Monthly Earnings columns due to confidentiality; data are suppressedSource: Alaska Department of Labor and Workforce Development, Research and Analysis Section
Unknown Location
Industrial Classification# of
UnitsJan
EmpFeb
EmpMar
EmpAverage
Monthly EmpTotal
EarningsAverage
Monthly Wage
TOTAL INDUSTRIES 830 1,396 1,426 1,485 1,436 $26,464,027 $6,143
TOTAL GOVERNMENT 103 237 240 249 242 $3,721,604 $5,126
FEDERAL GOVERNMENT 25 90 88 90 89 $1,787,910 $6,696
STATE GOVERNMENT 78 147 152 159 153 $1,933,694 $4,213
Health and Personal Care 4 11 9 10 10 $54,100 $1,803446
Clothing and Clothing Accessories 1448
Sporting Goods, Books, Music, etc. 1451
General Merchandise 2452
Miscellaneous 1453
Nonstore Retailers 3454
Transportation and Warehousing 25 31 33 33 32 $812,406 $8,463
Air Transportation 2481
Water Transportation 12 9 8 8 8 $225,258 $9,386483
Truck Transportation 2484
Scenic and Sightseeing 1487
Support Activities 1488
Page 69 of 701/ Oil Gas industry employment includes oil and gas exploration and oilfield services, or North American Industrial Classification System (NAICS) codes 211, 213111, 213112Quarterly Census of Employment Wages (QCEW): January - March 2020Data are preliminary and subject to revisionBlanks in the Employment, Total Earnings and Average Monthly Earnings columns due to confidentiality; data are suppressedSource: Alaska Department of Labor and Workforce Development, Research and Analysis Section
Page 70 of 701/ Oil Gas industry employment includes oil and gas exploration and oilfield services, or North American Industrial Classification System (NAICS) codes 211, 213111, 213112Quarterly Census of Employment Wages (QCEW): January - March 2020Data are preliminary and subject to revisionBlanks in the Employment, Total Earnings and Average Monthly Earnings columns due to confidentiality; data are suppressedSource: Alaska Department of Labor and Workforce Development, Research and Analysis Section