ecbi European Capacity Building Initiative www.eurocapacity.org Benito Müller and Lavan Mahadeva January 2014 The Oxford Approach Operationalizing the UNFCCC Principle of ‘Respective Capabilities’ REVISED SECOND EDITION
Transcript
ecbi European Capacity Building Initiativewww.eurocapacity.org
Benito Müller and Lavan MahadevaJanuary 2014
The Oxford Approach Operationalizing the UNFCCC Principle of ‘Respective Capabilities’ REVISED SECOND EDITION
ecbi European Capacity Building Initiativewww.eurocapacity.org
The contents of this paper are the sole responsibility of the Authors. Any views expressed are solely those of the authors and do not necessarily represent those of ecbi member organisations or funding partners.
All rights reserved. No part of this publication may be reproduced, stored in aretrieval system, or transmitted in any form or by any means, electronic, mechanical, photocopying, recording, or otherwise, without prior permission of the ecbi.
Dr Benito Müller is Director, Energy and Climate Change, at the OIES, and Managing Director of Oxford Climate Policy. A list of his publications can be found at www.OxfordClimatePolicy.org. Email: [email protected]
Dr Lavan Mahadeva is Senior Research Fellow, at the OIES. Email: [email protected]
Member Organisations
ecbi
European Capacity Building Initiative www.eurocapacity.org 1
WHAT IS THE ISSUE? ..................................................................................................................................................... 3
THE OXFORD APPROACH ............................................................................................................................................ 5
The Measures ................................................................................................................................................................ 5
Assessing Cost/Burden Distributions: The Oxford Capability Index ............................................ 10
Levels of capability .................................................................................................................................................. 12
Oxford Capabilities and Capability Levels .............................................................................................. 12
Poverty Intensity as Capability Level Proxy.......................................................................................... 13
This is a revised second edition of the original Brief that served as summary for policy makers
of a technical report by the same authors published by the Oxford Institute for Energy Studies,
The revision is mainly with regards to the final section on ‘Levels of Capability’
ecbi
European Capacity Building Initiative www.eurocapacity.org 2
ABSTRACT
The Parties should protect the climate system for the benefit of present and future generations of
humankind, on the basis of equity and in accordance with their common but differentiated
responsibilities and respective capabilities. Accordingly, the developed country Parties should
take the lead in combating climate change and the adverse effects thereof.
- Article 3.1, UN Framework Convention on Climate ChangeArticle 3.1, UN Framework Convention on Climate ChangeArticle 3.1, UN Framework Convention on Climate ChangeArticle 3.1, UN Framework Convention on Climate Change
Whether or not the regime emerging from the current negotiations under the UN Framework Convention on Climate Change (UNFCCC) will be based on an explicit cost/burden sharing formula, the debate about (implied) costs/burdens will be central. Such a debate cannot be genuinely meaningful in the absence of an acceptable operationalisation of Article 3.1 in general, and of the concept of ‘respective capability’ in particular.
We propose a framework (‘The Oxford Approach’) for measuring national ‘differentiated economic capabilities’ (‘ability to pay’) as integral part of an operationalisation. It is based on the well-known income tax paradigm:
• A measure of overall economic size is progressively modified in terms of relative prosperity levels to produce a ‘gross capability measure’ (analogous to gross taxable income). As such, gross capability represents a measure of general ability to pay.
• Drawing further from the tax paradigm, the framework introduces deductions in order to take into account other costs deemed to have priority. In keeping with the global priority to address poverty explicitly stated in the UNFCCC and the Rio+20 Declaration, Poverty Capability Adjustments are deducted from the gross capability measure, to arrive at what we call the net ‘Oxford Capability Measure’ (OCM) to pay for climate change cost/burdens.
The primary purpose of the OCM is to define or assess climate change cost/burden sharing (schemes). We believe the Oxford Approach to be acceptable for this not only because it is modelled on progressive income tax with deductions, a burden sharing scheme used by most if not all countries of the world, but also because of the progressiveness calibration through countries’ revealed preferences.
To illustrate the potential use of this methodology we consider two examples: assessing the fairness of a given cost distribution; and developing a (rule-based) ‘graduation scheme’ regarding obligations to pay. We assess the fairness of the 2010 distribution of climate change impact costs as reported in the second edition of the Climate Vulnerability
Monitor with reference to an OCM equity benchmark. We then turn to the question of defining categories of countries with similar capability levels, concluding that while an 'OCM-intensity of GDP'-based scheme would be best, one could use ‘poverty intensity of GDP’ as a second-best substitute. This will be of importance in deciding how countries should engage in the new regime, i.e. the type of commitment that would be fair for them.
ecbi
European Capacity Building Initiative www.eurocapacity.org 3
WHAT IS THE ISSUE?
Article 3.1 of the UNFCCC stipulates that Parties should protect the climate system … in
accordance with their common but differentiated responsibilities and respective capabilities. The question of how this should be achieved has become a central issue in the deliberations of the Ad Hoc Working Group on the Durban Platform for Enhanced Action (ADP) established in 2011 to develop a protocol, another legal instrument or an agreed outcome
with legal force under the Convention applicable to all Parties.
During the climate conference in Doha in December 2012, the ADP held a number of round table discussions on the question of how UNFCCC principles should be applied in the new agreement. The ADP Co-Chairs’ summary of these discussions records a number of comments related to capabilities, including: “Commitments should be defined and
differentiated on the basis of equity, the principle of common but differentiated responsibilities
and respective capacities, and historical responsibility”; “Countries with the greatest capacity
should take on economy-wide quantified emission reduction targets, while other countries
should contribute in accordance with their national circumstances and on the basis of equity”;
“No Party should be forced to do something it is not capable of.”
Although there are a multitude of important questions arising in this context, we believe there are two that are paramount: (i) how to distribute the costs/burdens associated with climate change equitably (in a fair or just manner) among countries; and (ii) how to design a fair system of ‘graduation’, i.e. a typology of ways in which countries may/should engage under the ADP outcome?
Neither of these issues is new. For example, William Nordhaus, the well-known American economist, asked in 2007: What should be the distribution of emissions reductions among
countries, and how should the costs be allocated? … Economics offers a simple, unambiguous,
but elusive answer: emissions reductions should be carried out in the most efficient way; and
the burden of reducing emissions should be shared in a fair way. … Neither science nor
economics can provide a “correct” answer to the question of how to share the burden of
reducing emissions. Disinterested observers might argue that the costs should be allocated on
the basis of ability to pay, with richer countries and generations paying a larger fraction of the
costs. … It is crucial to have a mechanism whereby countries “graduate” into a set of
obligations that are commensurate with their abilities to pay – in a way similar to the “ability
to pay” principle of an income tax system.
The Oxford Approach is a methodology to quantify ‘respective capabilities’ of countries and an attempt to answer the two questions (i & ii) posed above. More precisely, it introduces a capability measure that can be used in designing both a benchmark for a country’s fair/just/equitable capability-based share of a given climate change cost/burden, and a graduation scheme that fairly reflects some of the most basic national circumstances, such as the degree of prosperity and the magnitude of poverty. It needs to be stressed that we do not advocate the position that equity in cost/burden sharing or graduation should only be measured in terms of respective capabilities. Our focus on capabilities in this context is due to the desire to complement some earlier work at the OIES on measuring (historic)
responsibilities, and on how to combine different indices (see Box 1).
ecbi
European Capacity Building Initiative www.eurocapacity.org 4
Also, while there are many different types of ‘capabilities’ that are relevant to dealing with climate change, we focus on economic capabilityeconomic capabilityeconomic capabilityeconomic capability interpreted as ability to pay (as referred to by Nordhaus), which we believe is the most important capability in the context of both (i) and (ii). As regards the former the idea is in particular to define a measure for a country’s economic capability (ability to pay), and then define equitable distributions in terms of the proportions between these economic capabilities, implying, in particular, that if two countries have the same ‘capability level’, then they should shoulder the same share of the cost/burden.
We do not think that economic capability (‘ability-to-pay’) − as an indicator of how much a county should pay for climate change − lends itself per se to define country categories as required for graduation schemes. But we do believe that, as such an indicator, it is a multi-dimensional function involving (at least) measures of overall economic size (e.g. GDP) and of economic prosperity (e.g. GDP per capita), none of which will result in a fair distribution of costs/burdens when used on their own.
For instance, if GDP per capita figures are used as sole indicators of economic capability China and Belize, with roughly the same GDP per capita, would have to shoulder the same share of the cost/burden under consideration (see Table 1). Given that China’s GDP is more than four thousand times that of Belize, this would be intuitively unfair. A similar example can be made at the other end of the prosperity spectrum with the US and Switzerland.
Box 1. Combining respective capabilities with differentiated responsibilities
The issue of distributing a homogeneous divisible, such as a cost, has one significant advantage over other distributional issues, namely the fact that different criteria/points of view can easily be numerically aggregated. For example, if cI and rI denote the capability and responsibility indices of a country k (i.e. k ’s share in the total capability/responsibility), then it is possible to obtain an aggregate distribution by forming a weighted (arithmetic) mean:
aI J wIK · cI + wI
KK · rI.
Moreover, the element of arbitrariness associated with the choice of weights wI in such aggregations can easily be overcome, for example by using the preference score method proposed in Benito Müller (2001) ‘Varieties of Distributive Justice in Climate Change’, Climatic Change, Vol. 48 No. 2-3:273-88.
Table 1. 2009 PPP $
GDP/cap GDP
Belize $6,658 $2bn$2bn$2bn$2bn China $6,863 $9$9$9$9,,,,137bn137bn137bn137bn
Switzerland $45,104 $349bn$349bn$349bn$349bn US $45,793 $14$14$14$14,,,,059bn059bn059bn059bn
India $3$3$3$3,,,,167167167167 $3,658bn Japan $32$32$32$32,,,,050050050050 $4,088bn
Sierra Leone $799$799$799$799 $5bn Liechtenstein $132,$132,$132,$132,177177177177 $5bn
ecbi
European Capacity Building Initiative www.eurocapacity.org 5
The use of economic size on its own as a capability measure would lead to equally unfair outcomes. Take the situation of India and Japan with roughly equal GDP. We find it morally counterintuitive that they should in fairness be asked to pay the same amount, given that Japan’s level of prosperity is ten times that of India. If this is not self-evident, then one might wish to consider the case of Liechtenstein and Sierra Leone, again both with the same absolute economic size, but a 165-fold divergence in prosperity level. To ask both to pay the same amount clearly cannot be right.
Such intuitive comparisons break down in the absence of a ceteris paribus situation where at least one of the component parameters is roughly the same. Thus it is not intuitively clear whether China and Japan should have the same capability or not, given that the former is five times more prosperous, but the latter twice as large.1
All that can be concluded from these examples is that being of similar size (e.g. ‘being large’), on its own, does not imply having the same capability, and the same holds for being similarly prosperous (‘same GDP per capita’). Any other conclusions can only be drawn in the context of an explicit capability measure.
THE OXFORD APPROACH
The Measures
The Oxford Capability Measure (OCM) developed in the Report combines both GDP and per capita GDP figures (as measures of overall economic size and relative prosperity), together with a measure (based on the Multidimensional Poverty Index: MPI2) that reflects the size of the poverty problem facing some countries. Examples of the interaction of the different measures of this Oxford Approach are illustrated at the end of the section.
The OCM is modelled on the well-known methodologies used to assess people’s taxable income – seen as their ‘income tax capability’. Starting with the overall economic size − i.e. (purchasing power parity) gross domestic product TUVW3 − as Base Base Base Base Capability Capability Capability Capability MeasureMeasureMeasureMeasure, a progressive adjustment is introduced to reflect differences in average income (‘prosperity’) levels − i.e. GDP per capita XYZW − leading to a country’s Gross CGross CGross CGross Capabilityapabilityapabilityapability MeasureMeasureMeasureMeasure (akin to an individual’s gross taxable income):
T[\W] J (^W)] _ TUVW
with ^W J XYZW XYZ`abcd⁄ and f as progressivity parameter, which − calibrated against the calibrated against the calibrated against the calibrated against the progressivenessprogressivenessprogressivenessprogressiveness of national income tax regimesof national income tax regimesof national income tax regimesof national income tax regimes4 − is set to be 0.5. The Oxford Gross Oxford Gross Oxford Gross Oxford Gross Capability Capability Capability Capability measure is accordingly defined as:5
gT[W J h^W _ TUVW.
1 As it happens, under the Oxford Approach they would, see Figure 1. 2 The MPI was launched in July 2010 by the UNDP Human Development Report Office and the Oxford Poverty & Human Development Initiative (Department of International Development, University of Oxford). See http://hdr.undp.org/en/statistics/mpi/. 3 The Report considers other potential measures of overall economic size – such as net national income, or wealth – with the conclusion, for a number of reasons, that (PPP) GDP or GNI are the most appropriate. 4 See Section II.2 and Appendix 2 of the Report. 5 Note: (^)i.j J √^.
ecbi
European Capacity Building Initiative www.eurocapacity.org 6
A further adjustment is then introduced to reflect the domestic obligation generally acknowledged to take precedence over international obligations regarding sharing climate change costs/burdens: the obligation to address/eradicate domestic poverty.6 Following the income tax paradigm, this is done by allocating ‘Poverty CPoverty CPoverty CPoverty Capability apability apability apability AAAAdjustmentsdjustmentsdjustmentsdjustments ’ (V[lW) in proportion to the number of poor people and the poverty intensity,7 which are deducted from the figure for gross capability. The resulting (net) amount is the Oxford Capability Oxford Capability Oxford Capability Oxford Capability MeasureMeasureMeasureMeasure::::
g[\W J gT[W − V[lW
Examples
Before we turn to discuss some of the characteristics of this measure in a bit more detail, it may be useful to illustrate the transition from (Oxford) base, to gross, to net capabilities, say by looking at five large economies (India, China, Japan, the EU, and the US) and the aggregate of all LDCs. The vertical axes in Figure 1 depict the relevant capabilities (base capability as squares, gross capabilities as circles, net capabilities as diamonds).8 The horizontal axes represent 2009 per capita GDP in thousands of US$ (PPP).
Figure 1.a shows the way in which the Oxford Base Capability (measured by GDP) of countries with per capita GDP more/less than the world average of US$10,643 gets magnified (yellow arrows) or contracted (green arrows) in the transition to Oxford Gross Capabilities. Countries with (roughly) the same per capita GDP – such as the EU and Japan − will have the same level of progressive magnification/contraction, the degree of which is in proportion to the distance from world average GDP per capita. US Base Capability is roughly doubled (+100 per cent); the EU and Japan following, each with a three-quarter addition (+74 per cent); China a one-fifth contraction (−20 per cent); and India just under halving its Base Capability (−45 per cent).
Figure 1.b, in turn, depicts the relevant transitions from gross to net capability after deducting the Poverty Capability Adjustments (where applicable). Not surprisingly, there are no such adjustments for the three rich economies. China’s capability contraction due to these poverty adjustments is relatively small (an additional 5 base capability percentage points), while India and the LDCs have significant additional reductions of 56 and 136
6 “Affirming that responses to climate change should be coordinated with social and economic development in an integrated manner with a view to avoiding adverse impacts on the latter, taking into full account the legitimate priority needs of developing counlegitimate priority needs of developing counlegitimate priority needs of developing counlegitimate priority needs of developing countries for the achievement of sustained economic growth and the tries for the achievement of sustained economic growth and the tries for the achievement of sustained economic growth and the tries for the achievement of sustained economic growth and the eradication of povertyeradication of povertyeradication of povertyeradication of poverty,”[UNFCCC preamble, emphasis added] “7. The extent to which developing country Parties will effectively implement their commitments under the Convention will depend on the effective implementation by developed country Parties of their commitments under the Convention related to financial resources and transfer of technology and will take fully into account that economic and social development and poverty eradication are thepoverty eradication are thepoverty eradication are thepoverty eradication are the first and overriding priorities of the first and overriding priorities of the first and overriding priorities of the first and overriding priorities of the developing country Partiesdeveloping country Partiesdeveloping country Partiesdeveloping country Parties.”[UNFCCC, emphasis added] 7 V[lW J Π _ VW _ \VpW, with VW J population size, \VpW J multidimensional poverty index, and Π J a general poverty capability allowance [per poor person per year], calibrated with respect to the Group of Least Developed Countries and denominated in the same units as GDP. 8 Note that while the Base Measure, given by a country’s GDP, can be associated with monetary units in the sense of there being certain sums of money associated with the Base Measure figures, the same is not true for the other two measures. By contracting or expanding these figures (progressively) in order to get our Gross Measure, such an association with actual amounts of money is lost. The adapted GDP figures no longer refer to actual monetary amounts but are ‘merely’ (dimensionless) numbers, used to fix relative proportions. Hence the absence of measurement units on the vertical (capability) axes.
ecbi
European Capacity Building Initiative www.eurocapacity.org 7
percentage points respectively, leaving India 1 and the LDCs 67 percentage points below zero capability.
(a) From Base to Gross Capability (b) From Gross to Net Capability
Figure 1. Capability Adjustments under the Oxford Approach
Two features of the Oxford Approach that deserve a special mention in this context: it incorporates an empirically calibrated degree of (prosperity) progressiveness, and it accommodates the primacy of poverty reduction/eradication.
Prosperity Progressiveness
As indicated above, a capability measure based solely either on economic size/income (GDP) or levels of prosperity (per capita GDP) would lead to outcomes (exemplified in Table 1) that are counter-intuitive from an equity point of view. However, the two parameters can be used jointly to form such a measure.
While it is relatively simple to show that such a measure should be ‘income proportionalincome proportionalincome proportionalincome proportional ’ – meaning that, all else being equal, an n-fold income ratio leads to an n-fold capability
$0 $20 $40 $60
Gross Capability (OGC)
Net Capability (OCM)
Wo
rld
GD
P p
er
cap
ita
GDP per capita ('000 PPP US$)
$0 $20 $40 $60
Base Capability (= GDP)Gross Capability (OGC)
Wo
rld
GD
P p
er
cap
ita
GDP per capita ('000 PPP US$)
ecbi
European Capacity Building Initiative www.eurocapacity.org 8
ratio – the degree of prosperity progressivenessprosperity progressivenessprosperity progressivenessprosperity progressiveness required to accommodate the Sierra Leone/Lichtenstein issue (see above) is more difficult.
Following the general idea of the Oxford Approach, i.e. modelling economic capability on income taxation, the Report uses the progressiveness of domestic tax regimes to calibrate the progressiveness of the relevant gross capability measure. This is done by looking at the cost that would be allocated to a country under the Oxford Approach in terms of average inhabitant (per capita terms) and calibrating the resulting per capita distribution by looking at existing domestic income tax distributions. The idea was that what is deemed to be acceptable for individuals (domestically) should also be acceptable for average inhabitants (internationally).
Prioritising Poverty
The language of the UNFCCC,9 as well as the recent acknowledgment by the international community at Rio+20 that eradicating poverty is the greatest global challenge facing the world today and an indispensable requirement for sustainable development,10 clearly indicate that the demands of poverty on a country’s capability to pay should have priority over those of climate change. The key in designing a capability measure is to ensure that this is respected.
Probably the best known formulation of a capability measure – at least in the world of climate change negotiations – is the concept of ‘capable income’ introduced in the Greenhouse Development RightsGreenhouse Development RightsGreenhouse Development RightsGreenhouse Development Rights (GDR) approaches in order to develop their ‘capacity indicator’ (which serves the same function as our capability index).11 It measures a country’s capability in terms of the ‘surplus’ annual income of its ‘rich’ inhabitants over and above a US $9000 ‘development threshold’. Poverty, in other words, is taken into account by exempting the income of poor people from being counted as ‘capable’.
This, however, means that no matter how large a country’s poor population (and its poverty problem), under the GDR capability measure it is deemed to have some capability to pay for climate change, and expected to share the burden/cost of climate change.12 This failure to reflect the magnitude of ‘development needs’ of countries with poor populations is, we believe, not compatible with the idea that countries should have the option to prioritise spending on poverty eradication over climate change cost/burdens.
The Oxford ApproachOxford ApproachOxford ApproachOxford Approach incorporates the priority of demands of addressing poverty on a country’s capability to pay over payments for climate change by following the income tax model of providing allowances to be deducted as adjustments from (gross) tax liability. Poverty Capability AdjustmentPoverty Capability AdjustmentPoverty Capability AdjustmentPoverty Capability Adjustments V[lW are deducted from gross capability to reflect the magnitude of the poverty problem/development needs. While there is a normative element in specifying these adjustments – in the Oxford Approach chosen to be that LDCs should generally not be deemed economically capable – it is important to point out that no reference is made to domestic income distribution or degrees of domestic inequity. For 9 See footnote 14. 10 The Future We Want; I. Our Common Vision, para. 2; www.un.org/disabilities/documents/rio20_outcome_document_complete.pdf 11 The GDR Approaches are discussed at some length in Part III of the Report. 12 The assumption being that every country will have an inhabitant who earns more than $9000.
ecbi
European Capacity Building Initiative www.eurocapacity.org 9
reasons explained in Box 2, we felt these are not relevant to capability in the present context.
The key feature of these deductions is their ability to reduce the resulting net-capability to zero or even to make it possible for it to be negative. Following the income tax paradigm, the idea is that a net-capability measure of less or equal to zero means a capability index of zero, i.e. an exemption from having to contribute to costs, in the same way in which earning less than ones tax allowances entails an exemption from paying income tax.13 The magnitude of negative net-capability can be interpreted in terms of ‘capability headroom’, indicating (under certain growth assumptions) how long a country will be exempt from contributing to climate change costs/burdens and consequently be able to prioritise poverty eradication to the fullest possible degree. The Oxford Approach cannot guarantee that countries will actually act accordingly, but it gives them the benefit of the doubt by providing the opportunity to do so.
13 Although negative net capability does not entail ‘negative-cost’ in the cost/burden sharing context, its magnitude can be regarded as a capability ‘headroom’ indicator
Box 2. Domestic income inequities and the issue of the ‘global rich’
Domestic income distributions are most frequently invoked in discussions on the issue of “the global rich in developing countries hiding behind their poor” and not pulling their weight compared to their developed country peers. This is often raised as a point of interpersonal equity based on, say, the Aristotelian imperative to treat like cases as like.*
Aristotle is obviously right. However, his imperative should not be applied selectively. If it is applied to climate change, it should also be applied to addressing global poverty. The global rich should − like everybody else − be made to pay their fair share wherever they may live, for climate change and for poverty eradication (anywhere in the world).
If developing countries, in addition to addressing poverty, are mandated to pay for climate change on the grounds that they have inhabitants who should be treated like their global rich peers in developed countries, then Aristotle’s imperative would entail that developed countries should be mandated to pay for poverty alleviation in proportion to what developing country rich are asked to pay for that purpose.
In an ideal world, this could take place through a (progressive) global income tax, levied by a world government that would ensure that both the plight of the global poor and the cost of climate change are addressed. In the absence of such a regime that tackles both issues on an equal footing, however, Aristotle’s imperative cannot be evoked because the cases of the rich living in developing countries and the rich living in the developed world are not alike.
The equal treatment of the global rich is not the only reason why one might wish to consider domestic income distributions in this context. For example, one might think that extreme in-country income inequalities need to be remedied as a matter of equity.** However, we do not think that this issue, no matter how legitimate, is one that should flow into considerations of how to measure capability to pay for climate change.
* Nicomachean Ethics, V.3. 1131a10-b15; Politics, III.9.1280 a8-15, III. 12. 1282b18-23 ** One might wonder why this issue is restricted to in-country income differences.
ecbi
European Capacity Building Initiative www.eurocapacity.org 10
APPLICATIONS
Assessing Cost/Burden Distributions: The Oxford Capability Index14
As mentioned above, a country’s share in the total (positive) OCM amounts – its Oxford Oxford Oxford Oxford Capability IndCapability IndCapability IndCapability Index ex ex ex (OCI) – is meant to define its fair/just climate change cost/burden share, from a capability point of view. This (capability) equity benchmark – in combination with other benchmarks reflecting other pertinent features, such as differentiated responsibilities − could thus be used to allocate to countries how much they are meant to pay for a given purpose, say to replenish the Green Climate Fund. Alternatively it could be used to assess the fairness/justice of a given ex ante cost/burden distribution.
Take, for example, the 2010 climate change impact cost estimates recently published in the second edition of the Climate Vulnerability MonitorClimate Vulnerability MonitorClimate Vulnerability MonitorClimate Vulnerability Monitor (CVM2).15 Figure 3 displays, in (a), the respective total cost shares of the top five impact cost sufferers/sharers, together with the share of the EU and the LDC Group aggregates. It also represents (b) the benchmark shares given by the (net) Oxford Capability Index (OCI).
(a) Shares of total 2010 impact costs (b) Oxford (net) Capability Shares
Figure 2. 2010 CVM Impact Cost Distributions
What is apparent at the first glance is the striking difference between the two. Consequently, if one were to judge the fairness of this distribution of actual costs just in terms of respective (economic) capabilities, this would suggest a significant degree of unfairness.
There is, in principle, a simple way to rectify this situation, namely through Excess Cost Excess Cost Excess Cost Excess Cost TransfersTransfersTransfersTransfers (ECT):
14 See Section VI.1 of the Report. 15 DARA (2012). Climate Vulnerability Monitor (2nd Edition): A guide to the cold calculus of a hot planet. http://daraint.org/climate-vulnerability-monitor/climate-vulnerability-monitor-2012/report/
USA, 31%
EU, 28%China, 7%
Mexico, 2%
Indo-nesia, 0.5%
India, 0%
LDCs, 0%
ROW, 32%
India,
16%
China,
13%
Mexico,
9%
USA, 8%
Indon.
6%EU, 5%
LDCs, 4%
ROW,
39%
ecbi
European Capacity Building Initiative www.eurocapacity.org 11
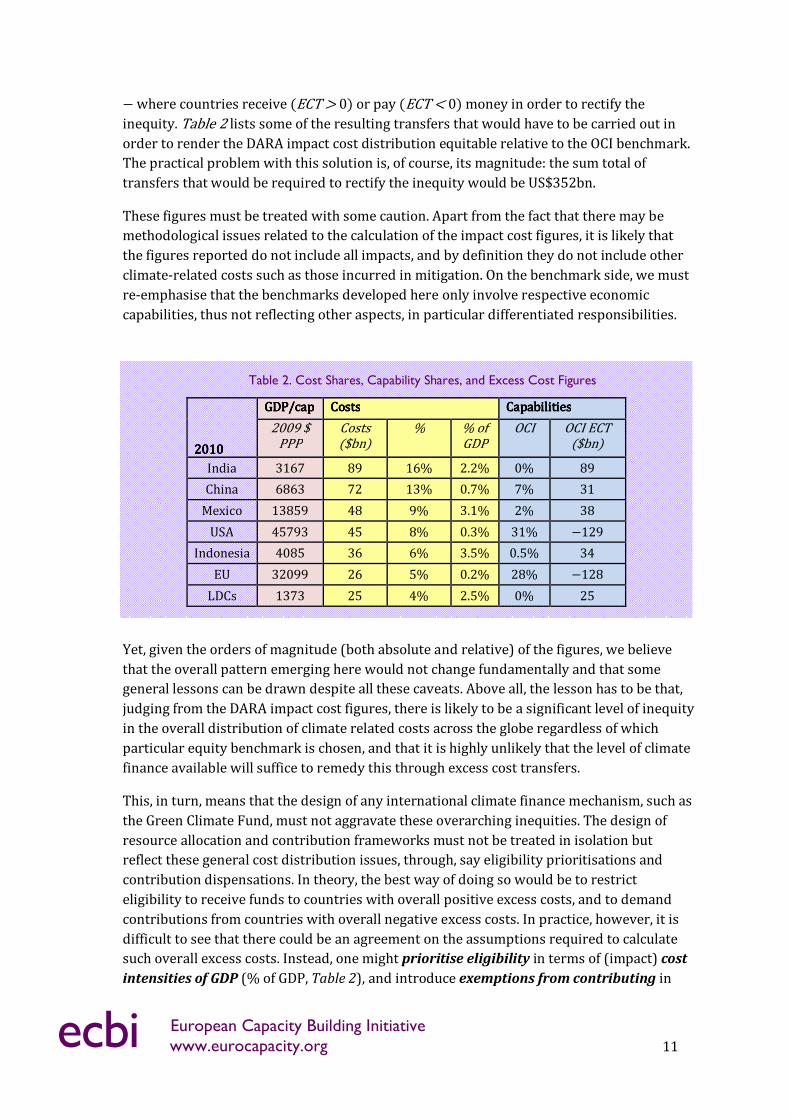
− where countries receive (ECT > 0) or pay (ECT < 0) money in order to rectify the inequity. Table 2 lists some of the resulting transfers that would have to be carried out in order to render the DARA impact cost distribution equitable relative to the OCI benchmark. The practical problem with this solution is, of course, its magnitude: the sum total of transfers that would be required to rectify the inequity would be US$352bn.
These figures must be treated with some caution. Apart from the fact that there may be
methodological issues related to the calculation of the impact cost figures, it is likely that
the figures reported do not include all impacts, and by definition they do not include other
climate-related costs such as those incurred in mitigation. On the benchmark side, we must
re-emphasise that the benchmarks developed here only involve respective economic
capabilities, thus not reflecting other aspects, in particular differentiated responsibilities.
Yet, given the orders of magnitude (both absolute and relative) of the figures, we believe
that the overall pattern emerging here would not change fundamentally and that some
general lessons can be drawn despite all these caveats. Above all, the lesson has to be that,
judging from the DARA impact cost figures, there is likely to be a significant level of inequity
in the overall distribution of climate related costs across the globe regardless of which
particular equity benchmark is chosen, and that it is highly unlikely that the level of climate
finance available will suffice to remedy this through excess cost transfers.
This, in turn, means that the design of any international climate finance mechanism, such as
the Green Climate Fund, must not aggravate these overarching inequities. The design of
resource allocation and contribution frameworks must not be treated in isolation but
reflect these general cost distribution issues, through, say eligibility prioritisations and
contribution dispensations. In theory, the best way of doing so would be to restrict
eligibility to receive funds to countries with overall positive excess costs, and to demand
contributions from countries with overall negative excess costs. In practice, however, it is
difficult to see that there could be an agreement on the assumptions required to calculate
such overall excess costs. Instead, one might prioritise eligibility in terms of (impact) cost
intensities of GDP (% of GDP, Table 2), and introduce exemptions from contributing in
Table 2. Cost Shares, Capability Shares, and Excess Cost Figures
European Capacity Building Initiative www.eurocapacity.org 12
terms of poverty intensities of GDP (see below).16 While neither of these proxies can be
guaranteed not to aggravate the overall cost distribution issue − not least because of its
inherent specification difficulties − it stands to reason that they are likely not to do so, at
least not excessively.
Levels of capability
Oxford Capabilities and Capability Levels
The Oxford Capability Measure is designed to measure how much (cost/burden/effort) countries can in fairness be expected to shoulder. As indicated in the introductory section (What is the issue?), it cannot be used on its own to define country categories of having similar levels of capability as it would lead to counterintuitive outcomes.
Nonetheless, it is important to have an idea of how to define such levels because they may be required to deal with the issue of how countries are to engage in the future climate change regime. To give an historical example: while the negotiations under the Ad-hoc Group on the Berlin Mandate (AGBM) that led to the Kyoto Protocol were, by and large, about ‘How much?’, the negotiations that led to the Berlin Mandate itself were primarily about ‘How?’, resulting in two categories (Annex I and non-Annex I) and how countries in them were meant to engage under the treaty mandated to be negotiated. And it stands to reason that this question of how countries will be engaging (i.e. the form of their commitments) will be equally important as how much they are meant to do.
As explained above, the Oxford Approach is modelled on progressive income taxation. It uses a two-dimensional ‘gross’ measure essentially multiplying GDP qua ‘base capability’ with the level of prosperity (GDP/cap). The actual (net) Oxford Capability Measure (OCM) is slightly more complicated for it not only applies the square root to relative prosperity levels, but also allows for the deduction of Poverty Capability Allowances (PCA):
g[\W J hXYZW _ TUVW − V[lW with XYZW J GDP/cap relative to world average.
In the absence of a capability measure, capability levels are often identified in terms of per capita GDP, i.e. what we used as a measure of average prosperity. However, in the presence of capability measures − such as the ones defined in the Oxford or Greenhouse Development Rights (GDR) approaches − it stands to reason that capability levels should somehow be related to/derived from these measures, while respecting the intuition underlying the use of per capita GDP figures.
As it happens, the Oxford approach allows for a very simple derivation: The simple ‘gross’ capability measure (TUVw xyZ⁄ ) suggests that the intuition about capability levels as indicators of capability strength is best captured by the capability measure per unit of GDP:
TUVw xyZ⁄ z TUV (J TUV xyZ)⁄ .
16 The idea here is that while the level of contributions is assigned, say, in proportion to respective economic capabilities (and/or differentiated responsibilities), countries are exempted from contributing if their poverty intensity of GDP is higher than n people per million of GDP.
ecbi
European Capacity Building Initiative www.eurocapacity.org 13
i.e. in economic parlance: the capability intensitycapability intensitycapability intensitycapability intensity. This idea can be applied not only to the Oxford measure, but also to the corresponding measure in the GDR approaches, namely the ‘Capable Income’ of a country (for more on the GDR approaches, see Section II of the technical report). Each of these capability measures accordingly generates its own capability levels:
However, the issue here is not which measure is more appropriate or ‘correct’, the point is merely that capability measures in general can be used not only to define capability indices (as benchmark parameters for equitable burden distributions), but also – when relativised to a unit of GDP − to characterise levels of capability as benchmarks for differentiations characterise levels of capability as benchmarks for differentiations characterise levels of capability as benchmarks for differentiations characterise levels of capability as benchmarks for differentiations between countriesbetween countriesbetween countriesbetween countries.
Poverty Intensity as Capability Level Proxy
Aware of the fact that certain normative choices are involved in establishing the Oxford measure which might seem too ‘subjective’,17 the technical report proposes to use what they call ‘poverty intensity of the economypoverty intensity of the economypoverty intensity of the economypoverty intensity of the economy ' (Vp�W) as ‘objective’ proxy parameter for measuring capability levels, at least for poorer countries.18 More precisely, the idea was to use a simple proxy parameter � for capability levels which varies directly with levels of prosperity (given by per capita GDP), and indirectly with the degree of poverty as measured by the UNDP Multidimensional Poverty Index (MPI):19
� J (TUV VgV)⁄ _ (1 \Vp)⁄ , and hence (see Box 3) � J 1 Vp�⁄
Figure 3 lists the countries with poverty intensities greater than 1 cap/$m20 and Figure 4 their per capita GDP, reflecting the relevant main negotiating groups: Least Developed Countries (LDC): yellow; (non-LDC) African countries: black; BASIC (Brazil, China, India and South Africa): red; and Annex I: green bars. Given these mathematical relationships, it
17 Note, incidentally, that this is not just a problem for the Oxford approach. It equally applies to the choice of ‘development threshold’ in the GDR approaches. 18 Given that this measure is the same for all countries without poverty, it is clearly not an adequate proxy for capability levels of rich countries, where the traditional GDP/cap might be a better choice. 19 The higher the prosperity, the higher the capability level, and the higher the poverty (MPI) level, the lower the capability level. 20 ‘cap’ : short for 'caput' (Latin for ‘head’) as in 'per capita'.
Box 3. Poverty Intensity
The ‘poverty intensity of the economy’ of a country k is defined as the Poverty Headcount (V�W J number of poor people) in k times its poverty intensity index (VppW, if available), divided by the GDP of the country: Vp�W J (V�W _ VppW) TUVW⁄ Given that the Multidimensional Poverty Index is defined as \VpW J (V�W/VgVW) _ VppW, (with VgVW : the population of k), this means that: Vp�W J (\VpW _ VgVW) TUVW⁄ .
ecbi
European Capacity Building Initiative www.eurocapacity.org 14
(b) High to extreme poverty intensity [ > 50cap./$m]
ecbi
European Capacity Building Initiative www.eurocapacity.org 15
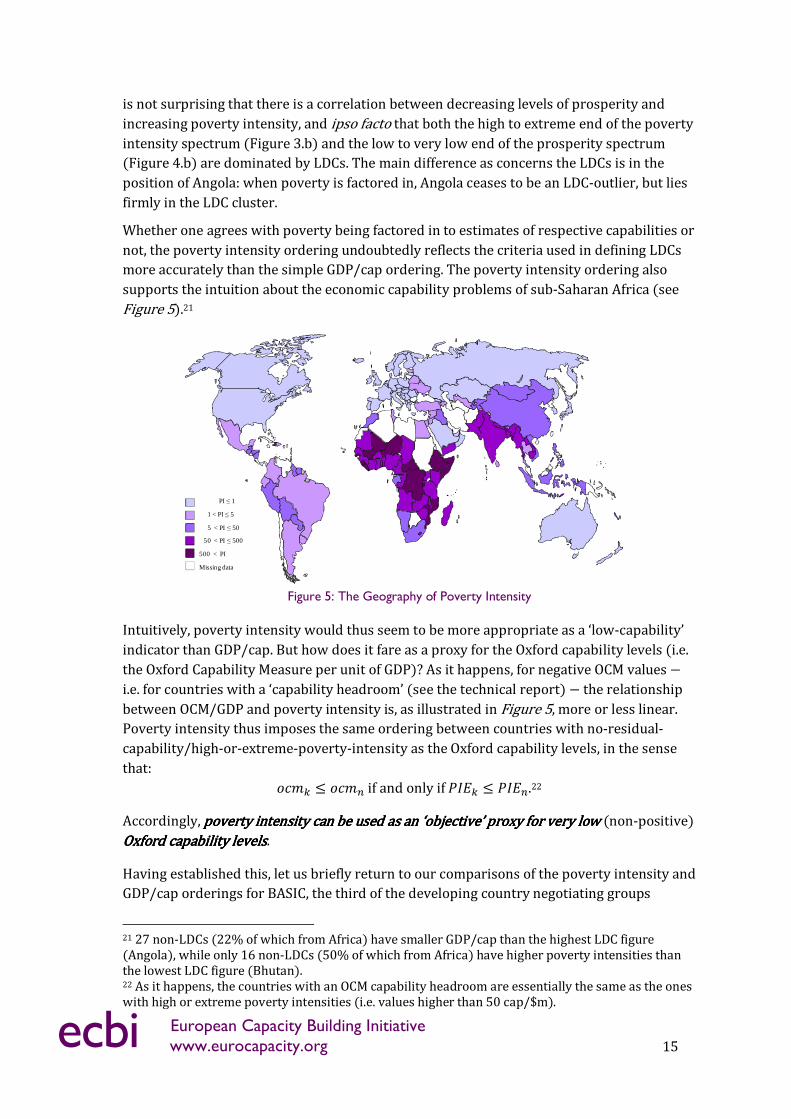
is not surprising that there is a correlation between decreasing levels of prosperity and increasing poverty intensity, and ipso facto that both the high to extreme end of the poverty intensity spectrum (Figure 3.b) and the low to very low end of the prosperity spectrum (Figure 4.b) are dominated by LDCs. The main difference as concerns the LDCs is in the position of Angola: when poverty is factored in, Angola ceases to be an LDC-outlier, but lies firmly in the LDC cluster.
Whether one agrees with poverty being factored in to estimates of respective capabilities or not, the poverty intensity ordering undoubtedly reflects the criteria used in defining LDCs more accurately than the simple GDP/cap ordering. The poverty intensity ordering also supports the intuition about the economic capability problems of sub-Saharan Africa (see Figure 5).21
Figure 5: The Geography of Poverty Intensity
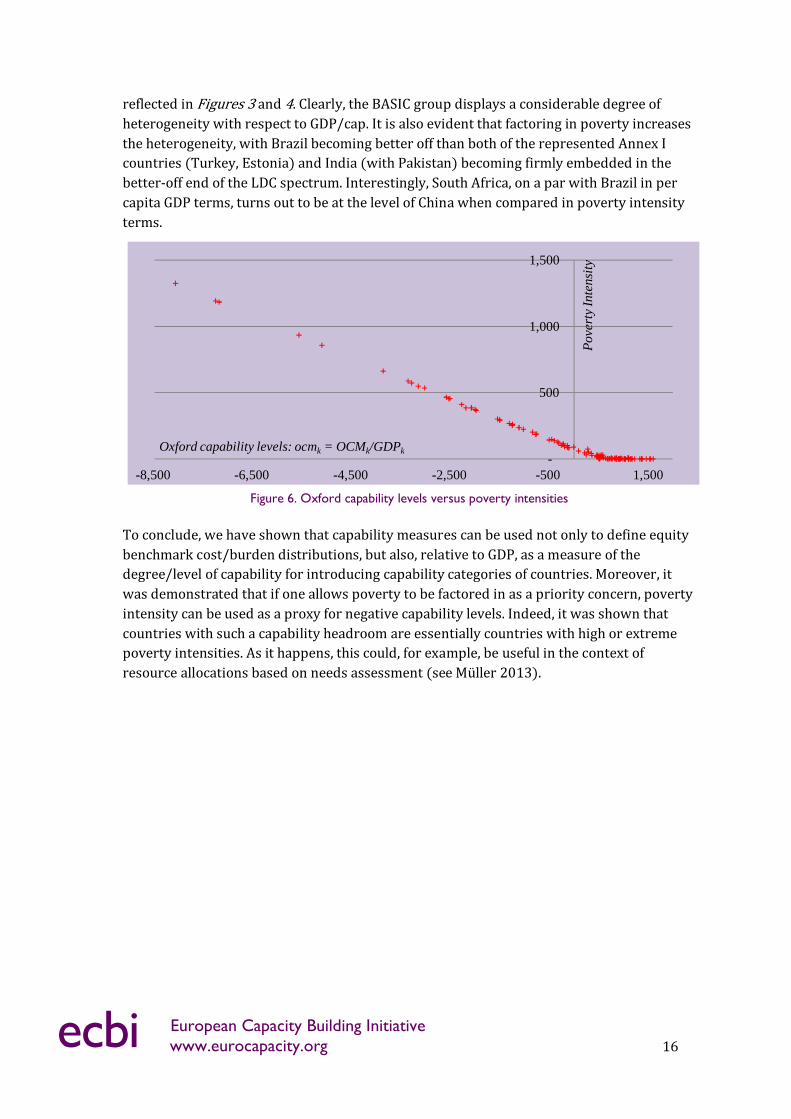
Intuitively, poverty intensity would thus seem to be more appropriate as a ‘low-capability’ indicator than GDP/cap. But how does it fare as a proxy for the Oxford capability levels (i.e. the Oxford Capability Measure per unit of GDP)? As it happens, for negative OCM values − i.e. for countries with a ‘capability headroom’ (see the technical report) − the relationship between OCM/GDP and poverty intensity is, as illustrated in Figure 5, more or less linear. Poverty intensity thus imposes the same ordering between countries with no-residual-capability/high-or-extreme-poverty-intensity as the Oxford capability levels, in the sense that:
{x|W � {x|� if and only if Vp�W � Vp��.22
Accordingly, poverty intensity can be used as apoverty intensity can be used as apoverty intensity can be used as apoverty intensity can be used as an ‘objective’n ‘objective’n ‘objective’n ‘objective’ proxy for very lowproxy for very lowproxy for very lowproxy for very low (non-positive) Oxford capability levelsOxford capability levelsOxford capability levelsOxford capability levels.
Having established this, let us briefly return to our comparisons of the poverty intensity and GDP/cap orderings for BASIC, the third of the developing country negotiating groups
21 27 non-LDCs (22% of which from Africa) have smaller GDP/cap than the highest LDC figure (Angola), while only 16 non-LDCs (50% of which from Africa) have higher poverty intensities than the lowest LDC figure (Bhutan). 22 As it happens, the countries with an OCM capability headroom are essentially the same as the ones with high or extreme poverty intensities (i.e. values higher than 50 cap/$m).
PI ≤ 1
1 < PI ≤ 5
5 < PI ≤ 50
50 < PI ≤ 500
500 < PI
Missing data
ecbi
European Capacity Building Initiative www.eurocapacity.org 16
reflected in Figures 3 and 4. Clearly, the BASIC group displays a considerable degree of heterogeneity with respect to GDP/cap. It is also evident that factoring in poverty increases the heterogeneity, with Brazil becoming better off than both of the represented Annex I countries (Turkey, Estonia) and India (with Pakistan) becoming firmly embedded in the better-off end of the LDC spectrum. Interestingly, South Africa, on a par with Brazil in per capita GDP terms, turns out to be at the level of China when compared in poverty intensity terms.
Figure 6. Oxford capability levels versus poverty intensities
To conclude, we have shown that capability measures can be used not only to define equity benchmark cost/burden distributions, but also, relative to GDP, as a measure of the degree/level of capability for introducing capability categories of countries. Moreover, it was demonstrated that if one allows poverty to be factored in as a priority concern, poverty intensity can be used as a proxy for negative capability levels. Indeed, it was shown that countries with such a capability headroom are essentially countries with high or extreme poverty intensities. As it happens, this could, for example, be useful in the context of resource allocations based on needs assessment (see Müller 2013).
-
500
1,000
1,500
-8,500 -6,500 -4,500 -2,500 -500 1,500
Po
vert
y In
ten
sity
Oxford capability levels: ocmk = OCMk/GDPk
European Capacity Building Initiative57 Woodstock Road, Oxford, OX2 7FA, UK