+ All Categories
Home > Documents > Revisiting African Agriculture: Institutional Change and ... · Revisiting African Agriculture:...

Revisiting African Agriculture: Institutional Change and ... · Revisiting African Agriculture:...

Date post: 13-Apr-2018
Category:
Upload: lyphuc
View: 213 times
Download: 0 times
Share this document with a friend
38
1 Revisiting African Agriculture: Institutional Change and Productivity Growth 1 Robert H. Bates Harvard University Steven A. Block Tufts University 1 We wish to thank the Weatherhead center, Harvard University, and the National Bureau of Economic Research, Cambridge MA, for support for this research and to acknowledge the assistance of Kaiyang Huang and Brett Carter. We thank the editors for recruiting tough minded reviewers and the reviewers themselves for their criticisms and advice. We have posted the definitions and of our variables, the sources from which they were taken and descriptive statistics in an online Appendix, which appears at EDITOR TO PROVIDE ADDRESS, along with material excised from the article for want of space.. The replication data are available on our websites.
Transcript

1

Revisiting African Agriculture: Institutional Change and Productivity Growth 1

Robert H. Bates

Harvard University

Steven A. Block

Tufts University

1 We wish to thank the Weatherhead center, Harvard University, and the National Bureau of Economic Research,

Cambridge MA, for support for this research and to acknowledge the assistance of Kaiyang Huang and Brett Carter.

We thank the editors for recruiting tough minded reviewers and the reviewers themselves for their criticisms and

advice. We have posted the definitions and of our variables, the sources from which they were taken and descriptive

statistics in an online Appendix, which appears at EDITOR TO PROVIDE ADDRESS, along with material excised from the

article for want of space.. The replication data are available on our websites.

2

Abstract

Africa is largely agrarian and the performance of agriculture shapes the performance of its

economies. It has long been argued that economic development in Africa is strongly conditioned

by politics. Recent changes in Africa’s political systems enables us to test this argument and, by

extension, broader claims about the impact of political institutions on economic development.

Building on a recent analysis of total factor productivity growth in African agriculture, we find that

the introduction of competitive presidential elections in the last decades of the 20th Century

appears to have altered political incentives, resulting in policy reforms that have enhanced the

performance of farmers.

3

1. Introduction

In the later decades of the 20th Century, political institutions in Africa changed. Prior to the late

1980s, open competition for national office was rare: politicians became heads of state either by

launching military coups or by consolidating their political backing within the ruling party.

Subsequently, most heads of state were instead chosen in elections contested by rival parties that

competed to capture political support from a majority of the national electorate.2 On average,

one third of Africa’s people work in farming and 70% of its population resides in rural settings.

The late-century introduction of electoral competition thus led to the enfranchisement of a rural

electorate.

In the decades after independence, agriculture – the largest single sector in most African countries

– virtually collapsed (World Bank 1981), foreshadowing and accelerating Africa’s subsequent

economic decline; its current revival has lent impetus to Africa’s economic recovery. It is our claim

that the reform of political institutions and the consequent enfranchisement of Africa’s farmers

influenced the performance of its rural sector, thereby shaping the continent’s economic

trajectory.

2 For reviews of this political transition, see Widner, J., Ed. (1994). Economic Change and Political Liberalization in

Sub-Saharan Africa. Baltimore MD, Johns Hopkins University Press; Bratton, M. and N. van de Walle (1997).

Democratic Experiments in Africa. Cambridge, Cambridge University Press; ; Jospeh, R., Ed. (1998). State, Conflict

and Democracy in Africa Boulder, Lynne Rienner; and Bates, R. (2009). Political Reform. The Political

Economy of Economic Growth in Africa, 1960-2000. B. J. Ndulu, S. O'Connell, R. Bates, P. Collier and C.

Saludo. Cambridge, Cambridge University Press.

4

Figure 1 documents the nature and magnitude of political change in Africa. Classifying political

systems along a 7-point scale that captures the level of electoral competition, the figure depicts

the striking movement towards competitive politics3. In the 1970s, the mean lay below 3; by the

21st century, it lay above 6, indicating a significant shift from authoritarian to competitive

electoral systems.

Figure 2 highlights the challenge to which this paper responds. It compares the rate of growth in

total factor productivity in the agricultural sectors of 34 states, 1961-2007, differentiating

between those whose political institutions did and did not allow for electoral competition when

choosing the head of state. On average, the figure suggests, countries with electoral competition

experienced a growth of total factor productivity of 1.04% in their agricultural sector, while the

average rate was 0.48% per year in countries without.4

This paper probes the relationship between political institutions and economic performance by

exploring the relationship between political reform and rural revival in Africa.

3 For details of this index (known as EIEC), consult the online Appendix.

4 Countries with scores of 6 or above on the EIEC scale (described below) were counted as possessing electoral

competition. The difference is significant at P-.0007 using a one-tailed t-statistic.

5

________________________________________________________________________________

Figures 1 and 2 Near Here

________________________________________________________________________________

2. The Literature

Our paper contributes to three literatures: The first addresses the impact of political reform in

Africa; the second, “urban bias” in the developing world; and the last, “the new institutionalism”.

The first literature is best exemplified by the recent papers by Stasavage (2005) and Kudamatsu

(2007). Working with data from 44 African countries, 1980-1996, Stasavage (2005) finds that

governments chosen in elections openly contested by rival political parties spend more on primary

education. Political reform led to higher levels and more geographically dispersed service

delivery, he contends. Whereas urban dwellers may have had access to secondary and tertiary

schooling, rural dwellers often lacked access even to primary schools. Stasavage therefore

interprets the expansion of primary education after the re-introduction of competitive elections as

a response to the needs – and demands -- of the rural electorate.

Working with household-level data from 28 African countries, Kudamatsu (2007) finds lower levels

of infant and neo-natal mortality for children born following the introduction of competitive

elections. As did Stasavage (2005), he attributes the change to improvements in service delivery,

as politicians respond to the need to secure votes from an enfranchised citizenry.

Note that (Stasavage 2005) relates institutional change to changes in educational policy, but not to

changes in educational achievement, whereas (Kudamatsu 2007) relates political change to

changes in health outcomes, but not to changes in health policy. By exploring the impact of

6

institutional change on both policy reform and economic performance, this article combines their

agendas.

Writing in the 1970s, Michael Lipton (Lipton 1977) exposed the manner in which public policies in

South Asia conferred benefits upon urban dwellers while imposing costs upon those living in the

rural areas. Pursuing this theme in Africa, (Bates 1981) noted the prevalence of similar policies

and argued that the ability of Africa’s governments to favor the urban areas depended upon their

ability to demobilize the rural electorate. This paper seeks to advance the study of urban bias by

observing the changes that resulted when that electorate was re-enfranchised.

Lastly, the “new institutional economics” now shapes the study of economic history (North,

Wallace et al. 2009) and development (Harriss, Hunter et al. 1995; Acemoglu and Robinson 2012).

Economic development, it argues, is promoted or retarded by the nature of the institutions within

which the economy inheres. Drawing on the evidence generated by recent changes in political

institutions Africa, this paper offers a test of this claim.

Section 3 lays out our basic argument. Sections 4 and 5 explore the relationship between

institutional reform policy choice, and productivity growth in agriculture. Section 6 concludes.

3. The General Argument

The relationship between political reform and economic change in developing countries can be

derived from well-established insights into the consumption behavior of poor persons and the

structure of their economies on the one hand and from the logic of collective action and party

competition on the other.

7

Engel’s law holds that as income rises, the proportion of income spent on food declines; the

income elasticity of food consumption is less than unity. From this micro-level regularity a macro-

level implication follows: that economic development implies structural change (Kuznets 1966;

Chenery and Taylor 1968; Anderson and Hayami 1986; Lindert 1991; Matsuyama 1992). When

people are poor, a large percentage of their total expenditure will be devoted to food; absent

foreign trade and significant economies of scale in farming, the rural sector therefore will be large.

But when people earn higher incomes, the percentage spent on food will be less and, absent a

comparative advantage in global markets, the rural sector will then comprise a smaller portion of

the economy.

Poor countries therefore exhibit a characteristic political-economic geography. The majority of

the population works in farming; it lies widely scattered, each member producing but an

infinitesimal percentage of the total agricultural output. A small portion of the population – often

less than 10% -- works in manufacturing and service provision and dwells in towns. Because

government policies often favor large investments and because of economies of scale in

manufacturing, urban firms are often few in number and large in size, and a significant percentage

of the urban dwellers therefore derive their incomes from a small number of employers (Little,

Scitovsky et al. 1970; Little 1982; for an African case, see Kaplinsky 1978). While those who farm

are thus dispersed, economically and geographically, those who earn their incomes in the urban

sector are not. Spatially, they are concentrated in a few settlements and economically they often

labor in enterprises sufficiently large to dominate their markets.

The political implications are immediate and ironic and follow from the logic of collective action

(Olson 1971, 1985): In countries with large agricultural populations, farmers are weak lobbyists.

8

Being small, village producers rationally refrain from expending effort in attempts to influence

agricultural prices; not so urban interests, which stand large in their markets. Being widely

scattered, farmers face high costs of organizing; concentrated in towns, urban interests find it less

expensive to do so. Urban interests therefore hold a relative advantage as lobbyists in less

developed economies. In so far as government policy is influenced by organized groups, in

countries with large agricultural sectors, it therefore tends to be adverse toward the interests of

farmers (Olson 1971 and 1985; Bates 1981).

The result is a choice of public policies that, taken together, constitute “urban bias,” or measures

that privilege the incomes of the urban sector at the expense of the rural. Under pressure from

urban interests, governments adopt trade policies that protect domestic markets for urban

manufacturers while leaving the market for agricultural products open to imports from abroad.

The overvaluation of currencies cheapens imports of foreign foodstuffs and lowers the earnings of

exporters of cash crops. Government regulations limit exports of raw materials, compelling

farmers to sell cotton, vegetables, fruits, and other products to local processors at prices below

those that they could secure were they to ship them to foreign buyers. In these and other ways

governments intervene so as to shift relative prices in favor of consumers and against the

producers of agricultural products.

Thus the standard account of urban bias. Central to this interpretation is a political assumption:

interests, it assumes, gain representation solely by lobbying. But what if we now introduce

competitive elections? Where representation is achieved through electoral channels and where

rural dwellers constitute a large segment of the voting population, then politicians have an

incentive to cater to the interests of farmers. The very factors that render farmers weak lobbyists

9

– that they are numerous and spatially dispersed – render them attractive to those competing for

an electoral majority (Varshney 1995). The search for political majorities should therefore

encourage politicians to resist the political pressures emanating from urban consumers and to

champion policies that cater to the interests of the countryside.

Many African economies conform to the conditions that underpin the above argument. Their

mean income in is less than $1,000 per annum (constant $US2000) and in most countries

agriculture remains the largest single industry, employing nearly a third of the labor force and

harboring nearly three quarters of the population. By the logic of the argument advanced thus

far, we should therefore expect to see the reintroduction of party competition and majoritarian

politics leading to the adoption of policies that strengthen the incentives for farming.

4. Initial Evidence

To explore this possibility, we advance two kinds of evidence. The first is bivariate and

addresses (1) the relationship between institutional reform and policy choice and (2) the

relationship between policy choice and economic performance. The second is multivariate and is

presented in the section that follows.

Political Reform and Public Policy

In Figure 3, an index of political institutions runs along the x-axis and measures of government

policy appear on the y-axis. The figure suggests that differences in political institutions bear a

10

significant relationship with differences in public policies5 and in the way expected, given the

argument advanced above.

________________________________________________________________________________

Figure 3 Near Here

________________________________________________________________________________

Institutions

As a measure of institutions, Figure 3 (following Figure 1) employs a scale known as EIEC

(Executive Index of Electoral Competition). Developed by Ferree and Singh (2002) and

subsequently amended and adopted by the World Bank for its Database of Political Institutions,

the measure indicates the level of competition attendant the choice of chief executive..6

In the regressions which follow, we recast this index to form a dummy variable that takes the

value 1 when the candidates from opposing parties campaigned for the presidency and 0

5 In each of the regressions that overlay the scatter plots in Figure 3, the coefficient on the measure of electoral

competition is significant at conventional levels of significance.

6 See Beck, T., G. Clarke, et al. (2001). "New Tools and New Tests in Comparative Political Economy: The Database of

Political Institutions." World Bank Economic Review. Bates, R. H., K. Ferree, et al. (1996). Toward the Systematic Study

of Transitions. Development Discussion Paper No. 256. Cambridge MA, Harvard Institute for International

Development..Ferree, K. and S. Singh (1999). Institutional Change and Economic Performance in Africa, 1970-1995.

Annual Meetings of the American Political Science Association, Atlanta.

11

otherwise.7;. We label the first set of governments as “competitive and the second as non-

competitive or, more loosely, authoritarian.8 We call this dummy variable ELECOMP67.

As a robustness check, we also employ the variable POLCOMP as a measure of political

competition. The variable is described in the online Appendix and discussed in greater detail in

(Jaggers and Marshall, 2000). Based on the descriptions of the variable that appear in the POLITY

codebook9, we consider observations that fall in the range 9 or above as “competitive” and those

that fall at 8 or below as “non-competitive” and refer to the variable as POLCOMP910.10

Public Policies

7 In practice, this means we assign a 1 to all country years when the EIEC index is 6 or greater and 0 otherwise. For

further details, see the online Appendix.

8 As discussed below, we explore the use of other cut points as well.

9 http://www.systemicpeace.org/inscr/p4manualv2010.pdf.

10 We have varied the cut-points to assess the robustness of our findings. Those based on POLCOMP remained

significant when we reduced the cutoff to 8. There are only 9 observations of POLCOMP = 10 in the sample,

precluding us from testing a POLCOMP dummy limited to 10s. Increasing the EIEC cutoff to 7 alone continued to

generate significant results when analyzing agricultural output. When addressing TFP growth or RRA, an EIEC dummy

limited to 7s retains the signs reported below, but the estimates are imprecise. The sample includes no observations

of EIEC equal to 4 or 5, precluding tests with a cutoff below our baseline of 6.

Some readers have challenged our use of POLCOMP, arguing that we should employ the POLITY score instead.

POLCOMP provides a measure of political competition, which is the specific focus of our hypothesis. In contrast,

POLITY provides a measure of democracy, and its value is therefore affected by other factors, such as the nature of

the limits on executive power.

12

Figure 3 contains data on roads, education, and agricultural research. Their relevance to the

fortunes of farmers requires little discussion. Not so the data on rural bias.

As a measure of sectoral bias, we employ the Relative Rate of Assistance (RRA), calculated by

Anderson (2010). The measure reflects the manner in which government intervention in markets

shifts relative prices between agricultural and non-agricultural commodities and is calculated as

the ratio of the impact policy interventions on the prices of goods made in the agricultural and

non-agricvultural sectors. across sectors. The imposition of an ad valorem tariff on imports of

manufactured goods, for example, would generate an increase in the domestic prices of

manufactured goods and trigger a decrease in the RRA, thus signaling a shift in relative prices

against farmers.

Economic Performance

Thus far we have characterized our measures of institutions and policies and the relationships

between them. We now describe our measures of the economic performance of the rural sector.

The first is the total value of agricultural output; the second, total factor productivity (TFP). The

first indicates whether, when correcting for changes in prices, farmers have altered their

production, as by hiring more labor, clearing more land, or otherwise channeling more resources

into farming. The second measure: TFP (our main focus) provides a more restrictive and

economically more meaningful measure of economic performance. TFP rises when output

increases even when the quantity and quality of the factors of production remain constant. When

measured by TFP, then, increases in output reflect the adoption of improved technologies and the

greater efficiency of producers. Given diminishing returns, it is the growth of productivity, not the

13

accumulation of productive factors, that in the long run leads to higher income. For that reason,

we assess whether policy change yields increases not just in output but also in TFP.

Our estimates for the growth of total factor productivity (TFP) are drawn from the work of Block

(2010) who combines data from 44 countries over 46 years (1961-2007) Block derives his

estimates from an aggregation of crop-specific outputs in each country based on commodity

prices specific to the countries included in the sample. From these data, he calculated Paasche

indices, applying to all years the prices from the final year to avoid estimates spuriously resulting

from increases in prices over time. 11

Policy Change and Economic Performance

The Figure 4 demonstrates the relationship between the our measure of urban bias (RRA) and

changes in TFP. The differences in the patterns of TFP growth rates when controlling for RRA

(versus the baseline specification which excludes RRA) suggest the magnitude of the impact of

urban bias. The difference in the mean rates of change in Total Factor Productivity in agriculture is

significant at greater than the .10-level.12

11

For details, consult the online Appendix.

12 Block (2010) first estimated the growth rate pattern of TFP, thereby creating baseline estimates (for the available

sample), and then re-estimated that result while including an additional explanatory variable (in this case, RRA). The

extent to which that added variable explains agricultural TFP growth (and the timing of its effect) is reflected in the

difference in the resulting TFP growth rate paths. He then calculated the resulting percentage difference in the mean

TFP growth rates over the entire period, with and without the additional explanatory variable. The resulting shares of

TFP growth explained by the added variables must be interpreted as an upper bounds, for reasons explained in Block

(2010).

14

________________________________________________________________________________

Figure 4 Near Here

________________________________________________________________________________

5. Multivariate Estimates

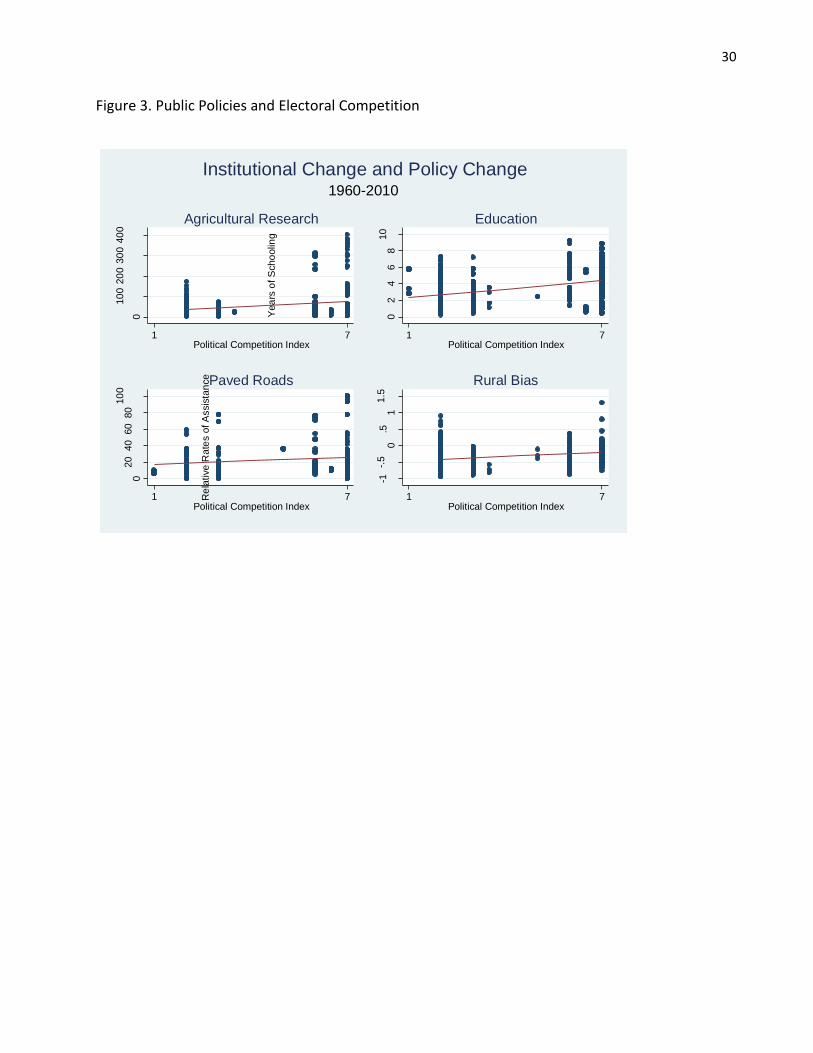
The data thus far suggest that countries governed by executives chosen through political

competition are more likely to choose policies that favor farmers and that these choices are

associated with differences in the performance of agriculture. Multivariate methods enable us to

sharpen and to deepen our analysis. After describing in greater detail our key dependent variable

– the rate of growth of agricultural TFP -- we apply such methods in an effort to explore the

relationship between political change and economic performance.

Political Reform and Economic Performance

To identify the impact of electoral competition on agricultural productivity growth, we employ a

difference-in-difference specification. Given that the treatment, institutional change, occurred at

different times in different countries, our model takes the form of a fixed effects regression with

individual year dummies:

( )

where is either agricultural output or the growth rate of agricultural productivity in country i in

year t, are time-invariant unobservable country effects, are year dummies, X is a vector of

observed covariates, is a dummy equal to one for each country-year observation in which

there is electoral competition, and δ provides a measure of the relationship between electoral

15

competition and the growth of agricultural TFP (which we assume to be a constant).13 is a

country-specific trend coefficient multiplying the time trend t, which provides a test of the

identifying assumption of common trends implicit in difference-in-difference specifications.14

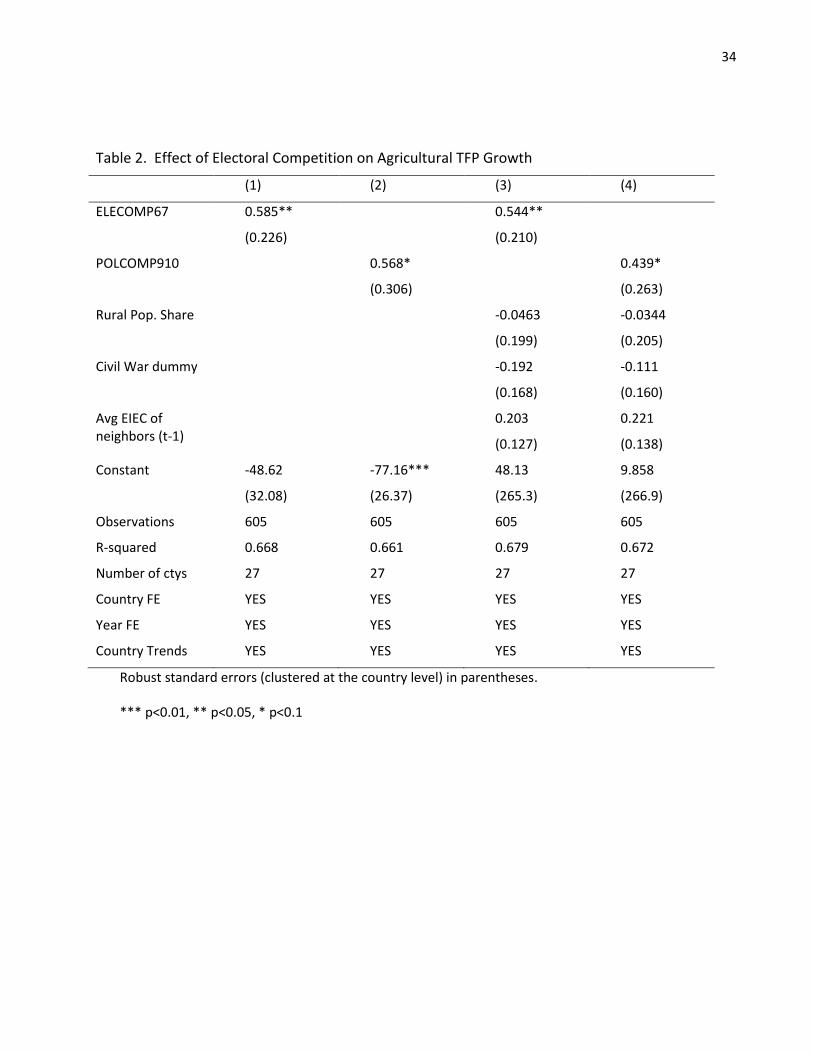
The results in Table 1 suggest that electoral competition is associated with increased agricultural

output on the order of 7 to 9 percent. Models 1 and 2 regress ELECOMP67 and POLCOMP910

against measures of agricultural output[RB1], while columns 3 and 4 demonstrate the robustness of

these relationshipsto the inclusion of additional covariates: civil conflict, the average level of

electoral competition in bordering states, and rural population share.15 Civil conflict was endemic

in late century Africa, with 40% of countries experiencing at least one year of civil war between

1960 and 2000. Noting their occurrence enables us to control for the possibility that political

competition affects TFP growth through its impact on political stability (Snyder and Mansfield

2000). If electoral competition were to generate strong political or economic forces, then their

impact could spill across political boundaries; by controlling for the lagged average of the degree

of electoral competition in each country’s neighbors, we control for this possibility as well. Lastly,

rural population share relates closely to the level of development, other correlates of which

themselves bear upon productive efficiency. By including a measure of the relative size of the 13 We adjust all standard errors for clustering at the country level, in keeping with the cautions advocated by

Bertrand, Duflo, and Mullainathan (2004) regarding serial correlation in difference-in-difference models.

14 The inclusion of country-specific trends reinforces the identifying assumption of our difference-in-differences

interpretation, and distinguishes our regressions from the otherwise similar specifications estimated by Stasavage

(2005).

15 All specifications include agricultural controls, as detailed in the table notes.

16

rural population, we thereby control for the impact of these unobserved variables. In addition, all

specifications include country-specific time trends to demonstrate the robustness of our

identifying assumptions.

________________________________________________________________________________

Table 1 Near Here

________________________________________________________________________________

Table 2 replicates this estimation strategy using agricultural TFP growth as the dependent variable.

Here, too, we find that electoral competition is associated with an acceleration of TFP growth of

approximately 0.5 percentage points. Note that this finding is consistent with the evidence

contained in Figure 2.

________________________________________________________________________________

Table 2 Near Here

________________________________________________________________________________

A troubling possibility is that the putative effect (agricultural TFP growth) precedes the supposed

treatment (political reform). To assess this possibility, we follow Angrist and Pischke (2009) who

invoke a form of Granger causality:

( ) ∑

The model allows for m lags (post-treatment effects) and q leads (anticipatory effect). Figure 5(A)

graphs the coefficient estimates of these post- and pre-treatment effects for m = q = 4 leads and

lags surrounding the year in which each country transitioned into a system of competitive

17

elections. The results indicate no significant anticipatory effect on changes in agricultural

productivity. The difference between the mean coefficients before and after political transition is

0.56 percentage points, a magnitude consistent with the estimates in Table 2.

________________________________________________________________________________

Figure 5 Near Here

________________________________________________________________________________

Political Reform and Policy Choice

Making use of the same difference-in-difference specification that we employed above,. Columns 1 and 2 in

Table 3 suggest a positive relationship between our indicators of electoral competition and our measure of

urban bias.16 The addition of country-specific trends in column 3 renders the coefficient of ELECOMP67

insignificant, however, although – as seen in column 4 -- rendering that of POLCOMP910 more precisely

estimated.

While we believe the risk of reverse causality (in the sense that RRA would cause electoral

competitiveness) is minimal, we remain keenly aware of the possible impact of excluded variables.

In particular, pressure from the donor community could plausibly account for the co-variation of

electoral competitiveness and policy support for domestic food producers. However, only in the

case of column 5 is the participation in an IMF agreement significantly related to a shift in relative

support for agriculture.

16

Recall: Positive changes in RRA indicate less urban bias, that is, more favorable policies toward agriculture.

18

There remains an additional concern, however: that agreements with the IMF may not be

randomly distributed across countries. In columns 7-8 we therefore estimate a two-stage model

in which we, as do others (e.g. Easterly 2005), instrument for IMF agreements using each country's

level of US military assistance and previous colonial status.17 As in the previous models,

POLCOMP910 remains positive and statistically significant, suggesting that electoral competition

improved incentives for African farmers. This conclusion is reflected, as well, in Figure 5(B), which

illustrates the increase in RRA in the years before and after a transition into a competitive

electoral system (indicated by POLCOMP910).

________________________________________________________________________________

Table 3 Near Here

________________________________________________________________________________

Insofar as our argument is valid, we would expect that the magnitude of the impact of electoral

competition should vary with the relative size of the rural electorate. This implication provides

additional opportunity for testing. In Table 4 we interact rural population share with indicators of

electoral competition, evaluating the partial derivatives at the 25th, 50th and 75th percentiles of the

sample distribution.18 In columns 1, 2, 4, and 6, the total effect of electoral competition on RRA 17

Easterly (2005) argues that US military assistance is indicative of the recipient as being a “friend of the donor,” and

thus a correlate of IMF agreements, while not affecting (in our case) agricultural price policy via any other channel.

The F-tests of excluded instruments on 2SLS versions of the regressions on columns 7 and 8 are 8.6 – suggesting the

possibility of weak instruments. This is of secondary concern, however, as our primary focus is on the effect of

electoral competition, rather than on the specific effect of IMF agreements.

18 These points correspond to population shares of approximately 60, 70 and 80 percent, respectively.

19

increases with the rural population share, with the effect at the 75th percentile approximately

three times greater than that found at the 25th percentile. This is the case with and without the

inclusion of country-specific trends, and while instrumenting for our indicator of IMF agreements.

Only in columns 7 and 8, where we both instrument for the IMF agreements and include country-

specific trends, does this interaction effect disappear.

________________________________________________________________________________

Table 4 Near Here

________________________________________________________________________________

Mediation Analysis

Thus far we have demonstrated that agricultural TFP growth is higher in settings with electoral

competition and that the effect operates at least in part through policy choices. To quantify the

magnitude of the effect, we apply mediation analysis (Imai, et.al. 2011), estimating three linear

regressions:

(6) )

)

)

where Y is the outcome variable (agricultural TFP growth), T is the treatment variable (electoral

competition), and M is the mediating variable (RRA), and X is a vector of control variables

(including rural population share and the civil war dummy).

Equation 6a can be thought of as corresponding to the specification underlying Table 2, in which

provides an estimate of the “total average treatment effect” (in Imai, et. al.’s terminology),

20

with Equation 6b corresponding to that underlying Table 3. Equation 6c closes this loop, allowing

us to decompose that total average treatment effect into the average direct effect of the

treatment on the outcome ( ), and the mediating effect, or the extent to which the treatment

variable operates through public policies. Note that the mediating effect and the direct effect sum

to the total effect. The mediating effect is estimated as or, equivalently, ( ).

Table 5 summarizes the results of our analysis. As before, we employ ELECOMP67 and

POLCOMP910 as treatment variables. The mediating variable is RRA. The exercise thus measures

the extent to which the effect of electoral competition on agricultural TFP growth operates

through the mediating effect of electoral competition on agricultural price policy (RRA) as opposed

to other channels. By including an interaction term between electoral competition and rural

population share, we are able further to determine whether these effects are a positive function

of rural population share (which we evaluate at the 25th, 50th, and 75th percentiles of its

distribution). Columns 1-3 introduce ELECOMP67 as the treatment variable. We find the total

treatment effect of electoral competition on TFP growth is on the order of 1.5 percentage points.

Note that while the total effect is a (slightly) declining function of rural population share, the

extent to which the effect of political reform on TFP growth is mediated by RRA increases with the

share of the rural population. At the 75th percentile of rural population share, nearly 14% of this

total treatment effect is mediated through RRA. When we use POLCOMP910 as the treatment

variable, these effects remain significant and increase in magnitude (columns 4 – 6). In this

21

instance, both the total treatment effect and the magnitude of the mediation effect are strongly

positive functions of rural population share.19

That the direct effect of changes in political institutions is greater than the effect that runs through

changes in policy suggests that the re-introduction of political competition affected rural

producers through multiple channels. These might have included policies which affected the

profitability of farming in ways other than relative prices, such as by increasing school enrolments,

building roads, and introducing new seed varieties, for example.20 Field reports suggest that with

democratization came other “non-policy” changes as well: a greater willingness to permit private

merchants to purchase agricultural commodities and to sell consumer goods to farmers; to let

non-governmental organizations operate in rural areas; and to allow freer communications, be it

by pamphleting or FM radio, thereby promoting the more rapid exposure of bottlenecks in the

provision of goods and services needed by farmers. Such sources of vitality, unleashed in rural

communities at the same time as was greater competition for the votes of farmers, may help to

account for the portions of the impact of political reform on the performance of farmers that our

analysis left unexplained.

19

Data limitations again impact on our analysis. The anomalous estimate of the mediation effect’s share of the total

treatment effect in column 4 is an artifact of the small and statistically insignificant point estimate of the total

treatment effect at the low level of rural population share.

20 Lack of data prevented us from exploring these policies in the same manner as we did RRA.

22

________________________________________________________________________________

Table 5 Near Here

________________________________________________________________________________

7. Conclusion

In the period of authoritarian politics, Africa’s leaders stood astride a narrow political base,

consisting of organized interests largely lodged in urban centers: the government and its

employees, the labor movement, and manufacturers with their attendant service industries. In

response to threats to their welfare, members of this coalition pressed for measures to lower the

prices of agricultural goods and policy makers responded as if finding credible threats of political

protests should they fail to do so. Following the reintroduction of electoral competition, political

leaders in many African countries found themselves in a new political environment: they now

faced an electorate that was largely rural. It is our argument that their desire for office led them

to alter their political strategies, resulting in adoption of economic policies more favorable to

farmers. And in response to these changes in policy, it would appear, production increased and

total factor productivity rose in rural Africa.21

21

Among the possible challenges to this interpretation, one stands out: that we wrongly assume that rural voters

engage in policy- or performance-based voting. We post our rejoinder to the online Appendix.

23

REFERENCES

Acemoglu, D. and J. A. Robinson (2012). Why Nations Fail: The Progons of Power, Prosperity, and

Poverty. New York, Crown Publishers.

Anderson, K. (2010). Distortions to Agricultural Incentives: A Global Perspective, 1955-2007.

London, Palgrave Macmillan.

Anderson, K. and Y. Hayami (1986). The Political Economy of Agricultural Protection. London, Allen

and Unwin.

Bates, R. (2009). Political Reform. The Political Economy of Economic Growth in Africa, 1960-2000.

B. J. Ndulu, S. O'Connell, R. Bates, P. Collier and C. Saludo. Cambridge, Cambridge University Press.

Bates, R. H. (1981). Markets and States in Tropical Africa. Berkeley and Los Angeles, University of

California Press.

Bates, R. H., K. Ferree, et al. (1996). Toward the Systematic Study of Transitions. Development

Discussion Paper No. 256. Cambridge MA, Harvard Institute for International Development.

Beck, T., G. Clarke, et al. (2001). "New Tools and New Tests in Comparative Political Economy: The

Database of Political Institutions." World Bank Economic Review.

(Block 2010)

Bratton, M. and N. van de Walle (1997). Democratic Experiments in Africa. Cambridge, Cambridge

University Press.

24

Chenery, H. B. and L. J. Taylor (1968). "Development Patterns: Among Countries and Over Time."

Review of Economics and Statistics(November): 391-416.

Easterly, W. (2005). "What did Structural Adjustment Adjust? The Association of Policies and

Growth with Repeated IMF and World Bank Adjustment Loans." Journal of Development

Economics 76: 1-21.

Ferree, K. and S. Singh (1999). Institutional Change and Economic Performance in Africa, 1970-

1995. Annual Meetings of the American Political Science Association, Atlanta.

Harriss, J., J. Hunter, et al., Eds. (1995). The New Institutional Economics and Third World

Development. London and New York, 1995.

Imai, K., L. Keele, et al. (2010). Unpacking the Black Box: Learning about Causal Mechanisms From

Experimental Observational Studies. Working Paper. Princeton, Department of Government.

Marshall, Monty G., and Keith Jaggers. 2002. Polity IV Dataset. [Computer file; version p4v2002]

College Park, MD: Center for International Development and Conflict Management, University of

Maryland

Joseph, R., Ed. (1998). State, Conflict and Democracy in Africa. Boulder, Lynne Rienner.

Kaplinsky, R., Ed. (1978). Readings on the Multinational Corporation in Kenya. New York, Oxford

University Press.

Krueger, A. O., M. Schiff, et al., Eds. (1992). The Political Economy of Agricultural Pricing Policies, 5

vols. Baltimore, Published for the World Bank by Johns Hopkins University Press.

25

Kudamatsu, M. (2007). Has Democratization Reduced Infant Mortality in Sub-Saharan Africa?

Evidence from Micro Data. SSRN Discussion Paper No. 685. Stockholm, Stockholm University -

Institute for International Economic Studies

Kuznets, S. (1966). Modern Economic Growth. New Haven and London, Yale University Press.

Lindert, P. H. (1991). Historical Patterns of Agricultural Policy. Agriculture and the State. P.

Timmer. Ithaca, Cornell University Press.

Lipton, M. (1977). Why poor people stay poor: A study of urban bias in world development.

London, Temple Smith.

Little, I. M. D., T. Scitovsky, et al. (1970). Industry and Trade in Some Developing Countries. Oxford,

Oxford University Press.

Little, I. M. D. (1982). Economic Development. New York, Basic Books.

Matsuyama, K. (1992). "Agricultural Productivity, Comparative Advantage, and Economic Growth."

Journal of Economic Theory 58: 317-334.

Ndulu, B. J. and S. O'Connell (2009). Policy Plus: African Growth Performance, 1960-2000. The

Political Economy of Economic Growth in Africa, 1960-2000. B. J. Ndulu, S. O'Connell, R. Bates, P.

Collier and C. Saludo. Cambridge, Cambridge University Press: 4-75.

Ndulu, B. J., S. A. O'Connell, et al. (2008). The Political Economy of Economic Growth in Africa,

1960-2000. New York, Cambridge University Press.

North, D., J. Wallace, et al. (2009). Violence and Social Orders: A Conceptual Framework for

Interpreting Human History. New York, Cambridge University Press.

26

North, D. C. (1981). Structure and Change in Economic History. New York, Norton.

North, D. C. and R. P. Thomas (1973). The Rise of the Western World. Cambridge, Cambridge

University Press.

Olson, M. (1971). The Logic of Collective Action. New York, Schoken Books.

Olson, M. (1985). "Space, Agriculture, and Organization." Journal of Agricultural Economics 67(5):

928-937.

Snyder, J. and E. Mansfield (2000). From Voting to Violence: Democratization and Nationalist

Conflict. New York, W.W.Norton.

Stasavage, D. (2005). "Democracy and Education Spending in Africa." American Journal of Political

Science 49(2): 343-358.

Varshney, A. (1995). Democracy, Development and the Countryside. Cambridge, Cambridge

University Press.

Widner, J., Ed. (1994). Economic Change and Political Liberalization in Sub-Saharan Africa.

Baltimore MD, Johns Hopkins University Press.

World Bank. (1981). Accelerated Development in Sub-Saharan Africa: An Agenda for Action.

Washington DC, The World Bank.

World Bank. (1986). Sub-Saharan Africa: From Crisis to Sustainable Development. Washington DC,

The World Bank.

World Bank. (1994). "Adjustment in Africa: Reforms, Results, and the Road Ahead." World Bank

Policy Research Bulletin 5(2).

27

28

Figure 1. Index of Political Competition

Source: World Bank, Database of Political Institutions (Beck and Clarke, 2001)

2.5

33.5

44.5

55.5

66.5

Avea

ge

Com

pe

tition

Sco

re

1975 1980 1985 1990 1995 2000 2005year

Average Political Competition by Year

29

Figure 2. Agricultural TFP Growth Profile for Country-Years With and Without Electoral

Competition

Source: (Block 2010)

w/ EIEC>=6

w/ EIEC<6

mean TFP growth rate= 1.04

mean TFP growth rate= 0.48

-10

12

3

Gro

wth

Rate

of A

gricu

ltura

l TF

P

1970 1980 1990 2000 2010year

30

Figure 3. Public Policies and Electoral Competition

0

10

020

030

040

0

Spe

nd

ing

on

Ag

ricultura

l R

esea

rch

1 7Political Competition Index

Agricultural Research

02

46

810

Yea

rs o

f S

cho

olin

g

1 7Political Competition Index

Education

020

40

60

80

10

0

Paved

Road

s

1 7Political Competition Index

Paved Roads-1

-.5

0.5

11.5

Re

lative

Rate

s o

f A

ssis

tan

ce

1 7Political Competition Index

Rural Bias

1960-2010

Institutional Change and Policy Change

31

Figure 4. The Effect of Relative Rate of Assistance on Agricultural TFP Growth

Baseline

including RRA

-10

12

Gro

wth

Ra

te o

f A

gricu

ltura

l T

FP

1960 1970 1980 1990 2000 2010year

semi-parametric regression

Agricultural TFP Growth, Controlling for RRA

32

Figure 5. Before & After Transition to Competitive Elections

(A)

(B)

Yrs BEFORE Transition Yrs AFTER Transition

Difference in means of before/after = 0.52(t = 3.14)

-1-.

50

.51

Pa

ram

ete

r e

stim

ate

-4 -3 -2 -1 0 1 2 3 4Leads/Lags

controlling for country trends, yr dummies

Before & After Transition to Electoral Competition

Agricultural TFP Growth (conditional mean)

Years Before Transition Years After Transition

Difference in means of before/after = 0.126(t = 1.98)-.

20

.2.4

.6

Pa

ram

ete

r e

stim

ate

-4 -2 0 2 4Lags/Leads

Before & After Transition to Electoral Competition

Relative Rate of Assistance (conditional mean)

33

Table 1. Effect of Electoral Competition on Agricultural Output

(1) (2) (3) (4)

VARIABLES log_agric output log_agric output log_agric output log_agric output

ELECOMP67a 0.0717** 0.0755**

(0.0287) (0.0293)

POLCOMP910b 0.0999** 0.0874*

(0.0459) (0.0478)

Rural Pop. Share -0.0357* -0.0341

(0.0199) (0.0215)

Civil War dummy 0.00884 0.0208

(0.0232) (0.0229)

Avg EIEC of neighbors (t-1)

0.00426 0.00527

(0.0120) (0.0131)

Constant 7.207 4.579 57.41* 53.11

(18.05) (17.89) (33.31) (35.47)

Observations 605 605 605 605

R-squared 0.716 0.716 0.729 0.727

Country FE YES YES YES YES

Year FE YES YES YES YES

Country Trends YES YES YES YES

Robust standard errors (clustered at country level) in parentheses *** p<0.01, ** p<0.05, * p<0.1 Notes: a ELECOMP67 is a dummy variable =1 if EIEC ≥6. b POLCOMP910 is a dummy variable =1 if POLCOMP ≥9. All specifications also include controls for rainfall, share of irrigated land, years schooling for the population, log of population, and log of arable land, and a full set of year dummies.

34

Table 2. Effect of Electoral Competition on Agricultural TFP Growth

(1) (2) (3) (4)

ELECOMP67 0.585** 0.544**

(0.226) (0.210)

POLCOMP910 0.568* 0.439*

(0.306) (0.263)

Rural Pop. Share -0.0463 -0.0344

(0.199) (0.205)

Civil War dummy -0.192 -0.111

(0.168) (0.160)

Avg EIEC of neighbors (t-1)

0.203 0.221

(0.127) (0.138)

Constant -48.62 -77.16*** 48.13 9.858

(32.08) (26.37) (265.3) (266.9)

Observations 605 605 605 605

R-squared 0.668 0.661 0.679 0.672

Number of ctys 27 27 27 27

Country FE YES YES YES YES

Year FE YES YES YES YES

Country Trends YES YES YES YES

Robust standard errors (clustered at the country level) in parentheses.

*** p<0.01, ** p<0.05, * p<0.1

35

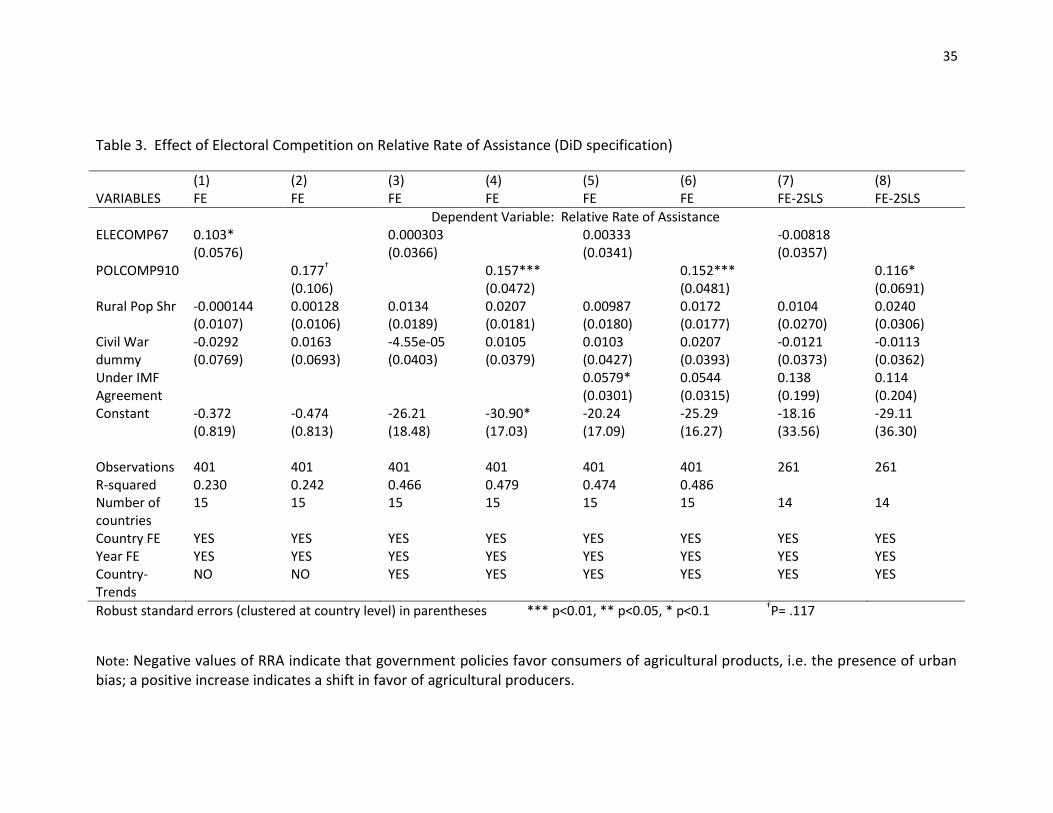
Table 3. Effect of Electoral Competition on Relative Rate of Assistance (DiD specification)

(1) (2) (3) (4) (5) (6) (7) (8) VARIABLES FE FE FE FE FE FE FE-2SLS FE-2SLS

Dependent Variable: Relative Rate of Assistance ELECOMP67 0.103* 0.000303 0.00333 -0.00818 (0.0576) (0.0366) (0.0341) (0.0357) POLCOMP910 0.177† 0.157*** 0.152*** 0.116* (0.106) (0.0472) (0.0481) (0.0691) Rural Pop Shr -0.000144 0.00128 0.0134 0.0207 0.00987 0.0172 0.0104 0.0240 (0.0107) (0.0106) (0.0189) (0.0181) (0.0180) (0.0177) (0.0270) (0.0306) Civil War dummy

-0.0292 0.0163 -4.55e-05 0.0105 0.0103 0.0207 -0.0121 -0.0113 (0.0769) (0.0693) (0.0403) (0.0379) (0.0427) (0.0393) (0.0373) (0.0362)

Under IMF Agreement

0.0579* 0.0544 0.138 0.114 (0.0301) (0.0315) (0.199) (0.204)

Constant -0.372 -0.474 -26.21 -30.90* -20.24 -25.29 -18.16 -29.11 (0.819) (0.813) (18.48) (17.03) (17.09) (16.27) (33.56) (36.30) Observations 401 401 401 401 401 401 261 261 R-squared 0.230 0.242 0.466 0.479 0.474 0.486 Number of countries

15 15 15 15 15 15 14 14

Country FE YES YES YES YES YES YES YES YES Year FE YES YES YES YES YES YES YES YES Country-Trends

NO NO YES YES YES YES YES YES

Robust standard errors (clustered at country level) in parentheses *** p<0.01, ** p<0.05, * p<0.1 †P= .117

Note: Negative values of RRA indicate that government policies favor consumers of agricultural products, i.e. the presence of urban bias; a positive increase indicates a shift in favor of agricultural producers.

36

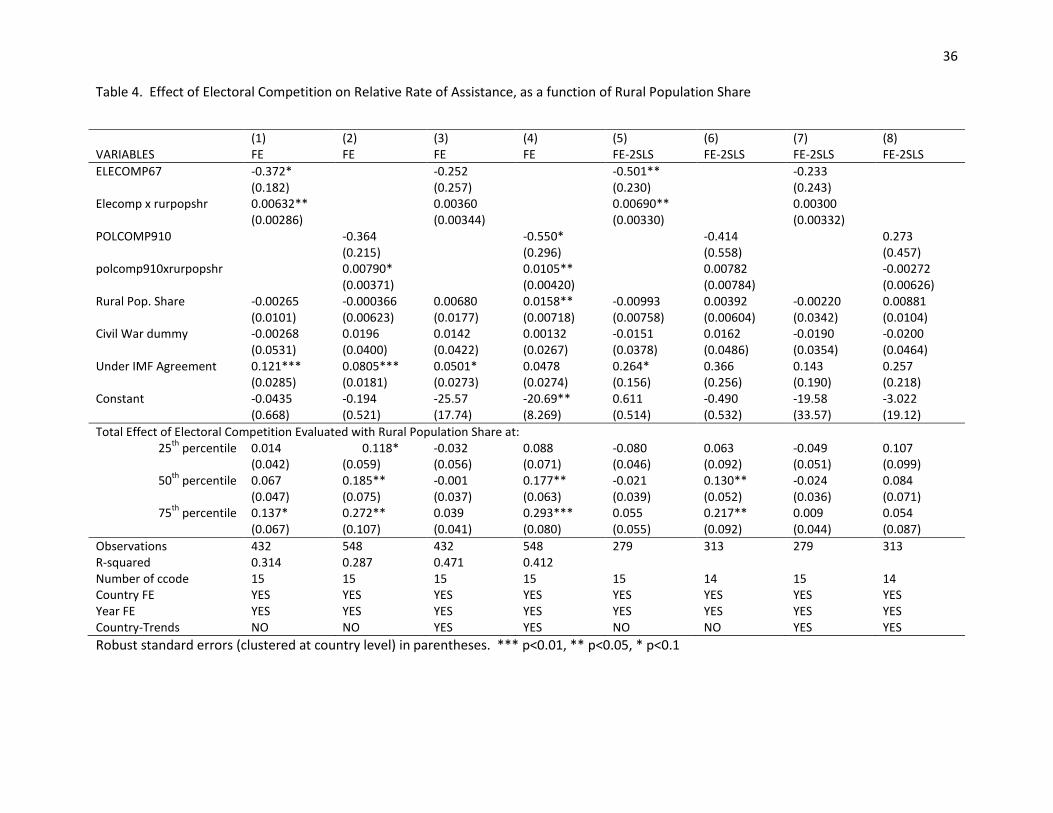
Table 4. Effect of Electoral Competition on Relative Rate of Assistance, as a function of Rural Population Share

(1) (2) (3) (4) (5) (6) (7) (8) VARIABLES FE FE FE FE FE-2SLS FE-2SLS FE-2SLS FE-2SLS

ELECOMP67 -0.372* -0.252 -0.501** -0.233 (0.182) (0.257) (0.230) (0.243) Elecomp x rurpopshr 0.00632** 0.00360 0.00690** 0.00300 (0.00286) (0.00344) (0.00330) (0.00332) POLCOMP910 -0.364 -0.550* -0.414 0.273 (0.215) (0.296) (0.558) (0.457) polcomp910xrurpopshr 0.00790* 0.0105** 0.00782 -0.00272 (0.00371) (0.00420) (0.00784) (0.00626) Rural Pop. Share -0.00265 -0.000366 0.00680 0.0158** -0.00993 0.00392 -0.00220 0.00881 (0.0101) (0.00623) (0.0177) (0.00718) (0.00758) (0.00604) (0.0342) (0.0104) Civil War dummy -0.00268 0.0196 0.0142 0.00132 -0.0151 0.0162 -0.0190 -0.0200 (0.0531) (0.0400) (0.0422) (0.0267) (0.0378) (0.0486) (0.0354) (0.0464) Under IMF Agreement 0.121*** 0.0805*** 0.0501* 0.0478 0.264* 0.366 0.143 0.257 (0.0285) (0.0181) (0.0273) (0.0274) (0.156) (0.256) (0.190) (0.218) Constant -0.0435 -0.194 -25.57 -20.69** 0.611 -0.490 -19.58 -3.022 (0.668) (0.521) (17.74) (8.269) (0.514) (0.532) (33.57) (19.12)

Total Effect of Electoral Competition Evaluated with Rural Population Share at: 25

th percentile 0.014 0.118* -0.032 0.088 -0.080 0.063 -0.049 0.107

(0.042) (0.059) (0.056) (0.071) (0.046) (0.092) (0.051) (0.099) 50

th percentile 0.067 0.185** -0.001 0.177** -0.021 0.130** -0.024 0.084

(0.047) (0.075) (0.037) (0.063) (0.039) (0.052) (0.036) (0.071) 75

th percentile 0.137* 0.272** 0.039 0.293*** 0.055 0.217** 0.009 0.054

(0.067) (0.107) (0.041) (0.080) (0.055) (0.092) (0.044) (0.087)

Observations 432 548 432 548 279 313 279 313 R-squared 0.314 0.287 0.471 0.412 Number of ccode 15 15 15 15 15 14 15 14 Country FE YES YES YES YES YES YES YES YES Year FE YES YES YES YES YES YES YES YES Country-Trends NO NO YES YES NO NO YES YES

Robust standard errors (clustered at country level) in parentheses. *** p<0.01, ** p<0.05, * p<0.1

37

Table 5. Mediation Analysis (Treatment = electoral competition; Mediating variable = RRA)

(1) (2) (3) (4) (5) (6) Columns 1-3:

Treatment = ELECOMP Columns 4-6:

Treatment = POLCOMP910 Dep. Var: Ag TFP gr RRA Ag TFP gr Ag TFP gr RRA Ag TFP gr

ELECOMP67 2.401** -0.438*** 3.242*** (1.107) (0.158) (1.084) Elecomp x rurpopshr -0.0132 0.00664*** -0.0259* (0.0151) (0.00215) (0.0148) POLCOMP910 -11.39*** -1.00*** -9.17*** (1.92) (0.198) (1.95) Polcomp910xrurpopshr 0.187*** 0.0187*** 0.146*** (0.032) (0.003) (0.032) Relative Rate of Assistance

1.917*** 2.217*** (0.439) (0.530)

Rural Pop. Share -0.0831** -0.0176*** -0.0494 -0.0096 -0.005* 0.002 (0.0350) (0.00500) (0.0346) (0.029) (0.003) (0.029) Civil War dummy -0.127 -0.00116 -0.124 -0.231 0.034 -0.306 (0.231) (0.0329) (0.222) (0.243) (0.025) (0.238) Constant 5.569** 0.914*** 3.817* 0.628 0.138 0.321 (2.322) (0.331) (2.274) (2.465) (0.254) (2.405) Observations 277 277 277 373 373 373 R-squared 0.218 0.382 0.277 0.160 0.416 0.203 Number of countries 11 11 11 11 11 11

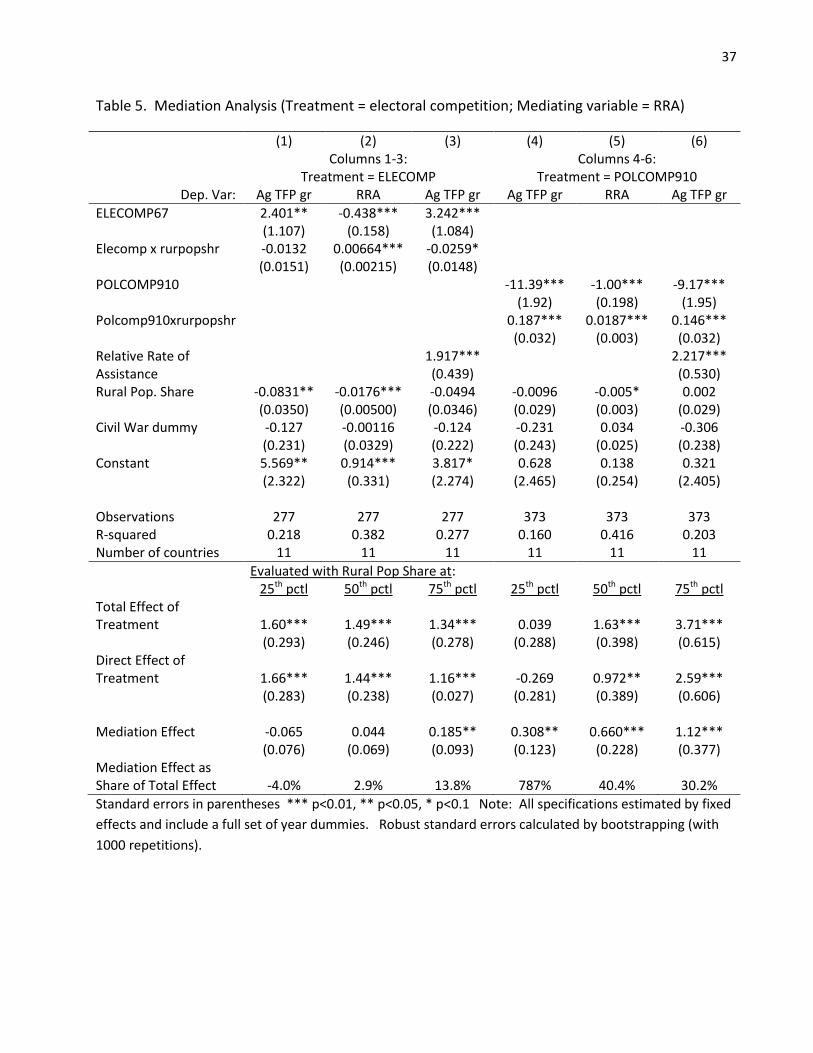
Evaluated with Rural Pop Share at: 25th pctl 50th pctl 75th pctl 25th pctl 50th pctl 75th pctl Total Effect of Treatment

1.60***

1.49***

1.34***

0.039

1.63***

3.71***

(0.293) (0.246) (0.278) (0.288) (0.398) (0.615) Direct Effect of Treatment

1.66***

1.44***

1.16***

-0.269

0.972**

2.59***

(0.283) (0.238) (0.027) (0.281) (0.389) (0.606) Mediation Effect -0.065 0.044 0.185** 0.308** 0.660*** 1.12*** (0.076) (0.069) (0.093) (0.123) (0.228) (0.377) Mediation Effect as Share of Total Effect

-4.0%

2.9%

13.8%

787%

40.4%

30.2%

Standard errors in parentheses *** p<0.01, ** p<0.05, * p<0.1 Note: All specifications estimated by fixed

effects and include a full set of year dummies. Robust standard errors calculated by bootstrapping (with

1000 repetitions).

38

Acemoglu, D. and J. A. Robinson (2012). Why Nations Fail: The Origins of Power, Prosperity, and Poverty. New York, Crown Publishers.

Bates, R. (2009). Political Reform. The Political Economy of Economic Growth in Africa, 1960-2000. B. J. Ndulu, S. O'Connell, R. Bates, P. Collier and C. Saludo. Cambridge, Cambridge University Press.

Bates, R. H. (1981). Markets and States in Tropical Africa. Berkeley and Los Angeles, University of California Press.

Bates, R. H., K. Ferree, et al. (1996). Toward the Systematic Study of Transitions. Development Discussion Paper No. 256. Cambridge MA, Harvard Institute for International Development.

Block, S. (2010). The Decline and Rise of Agricultural Productivity in Sub Saharan Africa Since 1961. Working Paper 16481. Cambridge MA, National Bureau of Economic Research.

Ferree, K. and S. Singh (1999). Institutional Change and Economic Performance in Africa, 1970-1995. Annual Meetings of the American Political Science Association, Atlanta.

Harriss, J., J. Hunter, et al., Eds. (1995). The New Institutional Economics and Third World Development. London and New York, 1995.

North, D., J. Wallace, et al. (2009). Violence and Social Orders: A Conceptual Framework for Interpreting Human History. New York, Cambridge University Press.


Recommended