52
Survey report December 2017 Reward management: focus on pay
Survey reportDecember 2017
Reward management: focus on pay
1 Reward management: focus on pay
The CIPD is the professional body for HR and people development. The not-for-profit organisation champions better work and working lives and has been setting the benchmark for excellence in people and organisation development for more than 100 years. It has more than 145,000 members across the world, provides thought leadership through independent research on the world of work, and offers professional training and accreditation for those working in HR and learning and development.
1 Reward management: focus on pay
Reward management: focus on paySurvey report
Foreword 2
Summary of key findings 5
1 Base and variable pay 9
2 Transparency and equality 20
3 Pay and performance 34
Conclusions and implications for managerial practice 46
Background to the report and its construction 48
Contents
AcknowledgementsThis report was researched and written by Dr Marie Bailey, University of the West of England, Liz Marriott and Professor Stephen J. Perkins, Global Policy Institute, London.
We particularly acknowledge assistance from the following: Alexandra Arnold, University of Lucerne; Andrew Bates, GSK; Neal Blackshire, McDonald’s Corporation; Kelly Bol, QMUL; Duncan Brown, IES; Sophie Cooper, Civil Service; Debra Corey, Reward Gateway; Denis Crowe, Pilat; Sylvia Doyle, Reward First; Mark Goodlake, Astellas Pharma Europe; Laura Lattimore, BAE Systems; Don Mackinlay, DDM Rewards; Neil McCawley, Wolseley; Colin Miller, Kent County Council; Ian Muir, Keeldeep Associates; Jean-Pierre Noel, IHG; Steven Penford, Devon and Cornwall Police; Seth Russell, Co-op; Maria Strid, HSBC Holdings; Geoff White, University of Greenwich; and Clive Wright, Hyperion.
Thanks also go to all the professionals who invested time helping to inform the questionnaire, its completion and the resultant survey report.
2 Reward management: focus on pay 3 Reward management: focus on pay
This year’s CIPD Reward Management: Focus on pay survey report finds that HR and reward professionals face many challenges and difficult choices.
For instance, our research finds that market-related pay is now the most important factor in determining salary levels, indicating the impact of a competitive market for skills. However, the importance of market-based pay in progressing employees along their salary bands is not as crucial.
This suggests that while employers are prepared to pay ‘top dollar’ to attract individuals, they are reluctant to use market rates as a basis to increase the salary levels of all of their employees. Once someone has been recruited, their subsequent pay rises aren’t driven by what’s going on in the market, but by such things as their performance, competencies and skills.
Talent-based salary offers could cause employee relations problems in the future if existing staff find out that their new colleagues earn more than they do for doing a similar job. Potentially, this situation could come to light as organisations report on their gender pay gaps, and some of these remuneration decisions return to bite the reward structure on the backside.
For instance, how will the organisation respond if existing employees want their pay increased to the levels of their new colleagues? How will new workers feel knowing
that they are earning more than those who have been in their roles for a number of years? How will such individuals respond when they find that while they have been given a big boost in pay to attract them, their subsequent pay increases will be subdued in comparison?
These questions suggest that HR needs to ensure that short-term decisions to increase hiring salaries are principles-led and evidence-based so that such judgments don’t result in long-term negative consequences for how their organisation remunerates and recognises all of its employees – especially as pay decisions and outcomes become more open.
On this topic, our survey finds that many employers are being quite transparent when it comes to reward. While we are some way off from full disclosure, a significant proportion of employers are already willing to be open about the processes behind their pay decisions, while some are also willing to communicate to staff what have been the outcomes of these processes.
In part, this openness probably reflects the legal requirements on big employers to report pay gaps by gender and grade. For many it also makes business sense. For example, there’s not much point using pay to incentivise certain employee behaviours if you’re not going to be open about the potential outcome (how much you could earn) and the process (what you need to do, why, when, and so on). Pay disclosure also reflects societal concerns: employees
Foreword
‘...there’s not much point using pay to incentivise certain employee behaviours if you’re not going to be open about the potential outcome and the process.’
3 Reward management: focus on pay
increasingly expect openness and transparency in most aspects of their life, and expect their employer, within reason, to also be transparent.
Ten years’ ago, something like gender pay gap reporting would have been very time consuming for HR to comply with. Even if the information was accurate, reward and payroll professionals often wouldn’t have the tools that would allow them to collect, analyse and communicate the data.
However, reporting PAYE in real time and automatic workplace pension enrolment has meant that employers have had to ensure that their people data are accurate. In addition, improvements in new technology means that an organisation can more easily, quickly and cheaply analyse this information. However, does the will exist to invest in this new new technology?
Such disclosure initiatives as gender pay reporting present an opportunity for HR to make the case for investment in people management information systems. Not only will they be able to comply with the law, but they will also be able to better understand how, where and why employees create value. Not only will this knowledge help inform investment decisions in employees, but also allow a better understanding of how to share the value that staff have created with them.
While data is an important part of gender pay gap reporting, so too is the narrative around why the gaps exist and what, if anything,
can and should be done about them. The danger is that reward and payroll professionals spend so long analysing the size and causes of the gender pay gap, they have less time to think about what it means for the organisation in terms of a narrative explaining what these figures represent and what actions will need to be taken.
To misquote Nietzsche, if you gaze too long into a gender pay gap, eventually the gender pay gap gazes into you. Rather than being curious about what the data is saying and using the opportunity to become more inclusive in our approach to how we reward and recognise performance, we become scared about the size of the gap and see it as another risk to be managed and mitigated.
On the topic of employee performance, there is a debate about how it should be linked to pay. Our survey finds that performance-based reward is, despite the media hype, still widespread in the private sector. Not only that, the measures used in performance appraisals are still quite traditional.
Nearly all employers in our sample assess performance against individual goals, with most using it to inform a salary and/or a non-salary reward decision. The next most common approaches are to assess performance against: team goals; an absolute view of an individual’s performance; and an employee’s own self-assessment, though fewer organisations link the outcomes of these evaluations to salary and reward.
‘Our survey finds that performance-based reward is, despite the media hype, still widespread in the private sector. Not only that, the measures used are still quite traditional.’
4 Reward management: focus on pay 5 Reward management: focus on pay
By contrast, recent innovations of appraising employee performance such as peer assessment, 360-degree appraisal or external assessment are used rarely by our respondents. Even when they do form part of the employee appraisal process, there is a reluctance to use them when it comes to making pay and reward decisions.
Of course, whether it is appropriate to use these measures to reward employee behaviour is beyond the scope of this survey. To be effective, a performance-based reward scheme depends on how good HR is at defining, communicating, assessing and ascribing performance, as well as aligning it to the needs of the business and the concerns of its workforce.
This may be reflected in the finding that around a third of employers are planning to revise their existing performance management practices in the future. While the research finds an interest in moving towards a more holistic approach to assessing performance, there is little evidence that the relationship between pay, reward and performance is waning. Nor do we find support for the popular view that appraisals are now obsolete.
An interesting development among those employers that operate a collective performance-related reward scheme is the dramatic growth in the use of gainsharing, where employees receive a bonus linked to productivity improvements or the reduction in production costs at a group, sub-unit or team level. The UK’s productivity puzzle has hardly been out of the news over the past few
years, so it may be that employers are responding to this concern by looking at using reward to boost output or reduce production costs.
The success of such schemes rests on the organisation and its employees working collectively to explore and suggest opportunities to improve performance. This requires HR professionals to foster a high-trust culture in their workplace, where employees want to suggest ideas about what needs to be done and how as well as then doing what needs to be done.
Profit-sharing is another way of rewarding collective performance, and its popularity among those with group performance-related reward schemes has also increased since our previous survey, albeit by a smaller extent, to be the most common way of rewarding collective contribution.
Ending on a positive note, around two-thirds of respondents believe that the requirement for large employers to publish their gender pay gap will help reduce the gap, though most think it will help to ‘some extent’ rather than to a ‘large extent’. This finding indicates a recognition that employers are not passive agents when it comes to reducing the gender pay gap. However, it also indicates that part of the reason for the gap exists outside the workplace. The HR profession has an important role in helping change perspectives held both in and outside the world of work.
Charles CottonCIPD Senior Adviser for Performance and Reward
‘The UK’s productivity puzzle has hardly been out of the news over the past few years, so it may be that employers are responding to this concern by looking at using reward to boost output or reduce production costs.’
5 Reward management: focus on pay
This fourteenth annual survey of UK reward management is based on comprehensive responses received from 715 organisations, across private, public and third sectors. The main aim of the research is to provide readers with a benchmarking and information resource in respect of current and emerging practice in UK reward management. The following provides a summary of some of the key findings from the survey.
Base and variable pay policies• Over 40% of all employers
responding use individual arrangements such as spot salaries to manage base pay (Table 1). Narrow grades and pay spines remain common pay structures, and innovation such as broadbanding seems relatively modest at 25% (see Table 1).
• Market rates, whether or not underpinned by job evaluation, are considered the most important factor in determining base pay levels, cited by 70% of survey respondents. Ability to pay is cited by 35% of employers.
• The most common criteria to manage individual base pay progression are individual performance, competencies, skills and retaining potential. By contrast, ‘seniority’ or length of service is cited by around a quarter of employers – a similar level to the outcome negotiated with a union or works council.
• Almost as many employers claim they operate performance-related reward schemes (48%) as those saying they do not (52%).
.• Individual bonuses and merit pay rises are the most common individual performance-related reward schemes among organisations offering such schemes, while the most common group performance-related schemes are profit-sharing and gain-sharing (bonuses based on improvements in production costs or productivity). There remains a clear private/public sector distinction in UK reward management architecture, with individualised spot salaries more commonly applied by private sector employers, and length of service-related pay spines typically used by the public sector.
Transparency and equality• In respect of total cash earnings
and how organisations position themselves within their sector, two-thirds who declare awareness of it believe they sit at or close to the median (Table 2).
• While the finding is not markedly different compared with previous years, there is slight movement in the number perceiving themselves at the top or bottom of the market range, in favour of higher-level positioning, consistent perhaps with an anti-austerity turn, as our expert practitioners panel speculated when presented with the data.
• Only half the organisations responding to the survey collect pay dispersion data (that is, data on the spread or range of pay across the workforce) in comparison with competitors.
Summary of key findings
‘Almost as many employers claim they operate performance-related reward schemes (48%) as those saying they do not (52%).’

6 Reward management: focus on pay 7 Reward management: focus on pay
.• Among the half of respondents who do hold information on pay spread, some 40% claim that their position is broadly in line with competitors.
• The voluntary sector has the highest proportion claiming significantly narrower dispersion in comparison with their competitors, as do very large organisations.
• Around a third of organisations favour pay confidentiality over transparency, although this means that around two in three organisations claim to be open about pay levels and pay-setting – with 31% saying they favour ‘great transparency’. Compared with the previous survey findings, this represents
a greater openness about reward management; previously only half were in favour of transparency unless compelled by legislation. Very large organisations indicate the most openness and this was most pronounced in the public services sector. Organisations who declare their strategic
Table 1: Summary of findings – base and variable pay policies (%)
In this and subsequent tables, figures may not total 100%, either because of rounding or respondents being able to specify more than one response to a question.
Reward approaches % of respondents using
Base pay structures Individual rates/ranges/spot salaries 41
Narrow graded 35
Pay spines/service-related 34
Job family 30
Broadbanded 25
Base pay determination Market rates (with job evaluationi) 45
Ability to pay 35
Market rates (without job evaluation) 25
Collective bargaining 16
Base pay progression criteria Individual performance 74
Competencies 61
Skills 57
Employee potential/value/retention 53
Market rates 41
Length of service 26
Negotiated with union/works council 24
Employers offering a performance-related reward scheme 48
Individual performance-related schemes Individual bonuses 66*
Merit pay rises 58*
Combination schemes 43*
Sales commissions 43*
Individual awards for exceptional achievement 43*
Ad hoc/project-based schemes 23*
Piece rates 4*
Group performance-related schemes Profit-sharing 47*
Gain-sharing 41*
Group-based non-monetary recognition awards 38*
Goal-sharing 35*
*percentage of respondents indicating they operate a performance-related reward scheme
7 Reward management: focus on pay
business focus is defending market share are least likely to encourage discussion. While the margin is not high, those whose focus is innovating to increase productivity are more positive, but mainly in respect of sharing information on processes rather than outcomes.
• At the time of the survey, only 38% of organisations had undertaken a gender pay review (either an equal pay audit and/or a gender pay gap report). The public sector has conducted the highest number of reviews at 44%.
• The majority of reviews have taken place in organisations where there is an equal proportion of men and women.
• Of those who have carried out a review, just over half report no gender pay gap amongst managers. This lack of a reported gap rises to over 70% amongst non-managerial staff.
• A lack of women in senior roles is cited as the most common explanation for the gender pay gap.
• Around a third of respondents are unconvinced by the impact gender pay reporting will have on narrowing gender inequality in the workplace.
• Contrary to the prominence of market rates (with or without job evaluation) in determining salary levels, this factor is noticeable by its absence in most common combinations of pay progression drivers (see Table 1).
• The role of trade union or works council negotiations features strongly in the public and voluntary sectors, and in private sector manufacturing in relation to staff who are not managers or in professional grades, featuring as the sole criterion driving pay progression coming above any other single factor or combination of factors.
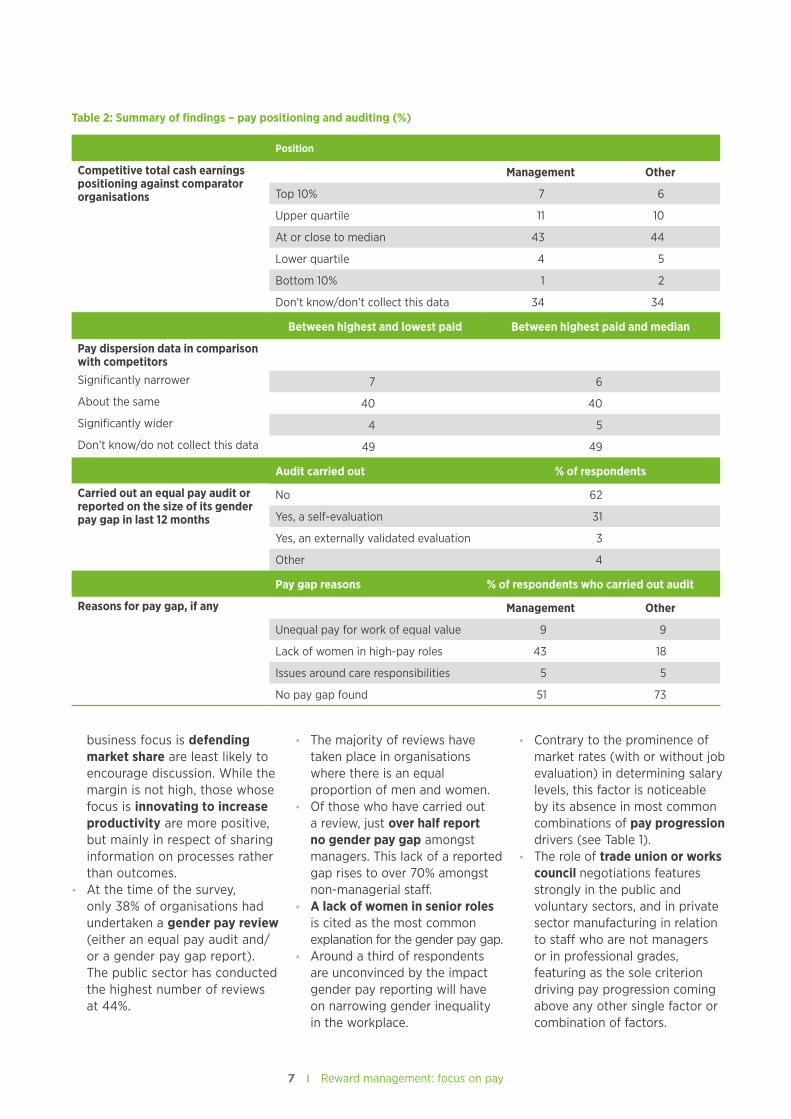
Table 2: Summary of findings – pay positioning and auditing (%)
Position
Competitive total cash earnings positioning against comparator organisations
Management Other
Top 10% 7 6
Upper quartile 11 10
At or close to median 43 44
Lower quartile 4 5
Bottom 10% 1 2
Don’t know/don’t collect this data 34 34
Between highest and lowest paid Between highest paid and median
Pay dispersion data in comparison with competitorsSignificantly narrower 7 6
About the same 40 40
Significantly wider 4 5
Don’t know/do not collect this data 49 49
Audit carried out % of respondents
Carried out an equal pay audit or reported on the size of its gender pay gap in last 12 months
No 62
Yes, a self-evaluation 31
Yes, an externally validated evaluation 3
Other 4
Pay gap reasons % of respondents who carried out audit
Reasons for pay gap, if any Management Other
Unequal pay for work of equal value 9 9
Lack of women in high-pay roles 43 18
Issues around care responsibilities 5 5
No pay gap found 51 73
8 Reward management: focus on pay 9 Reward management: focus on pay
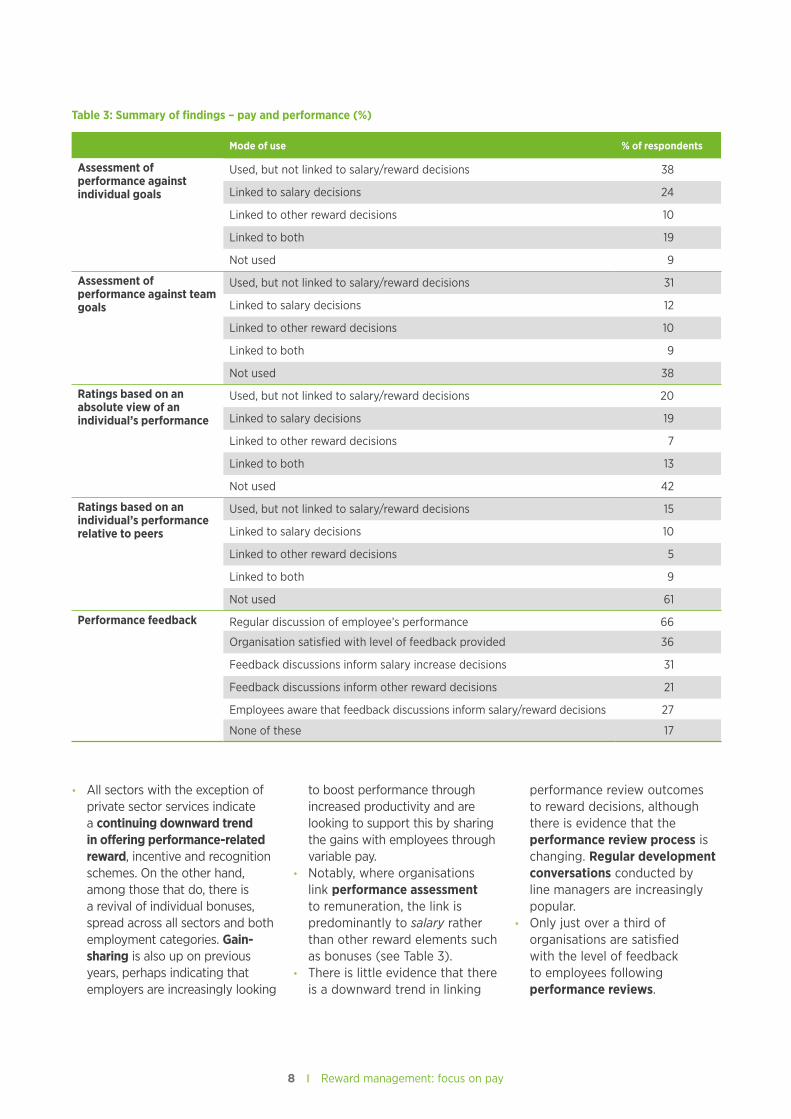
• All sectors with the exception of private sector services indicate a continuing downward trend in offering performance-related reward, incentive and recognition schemes. On the other hand, among those that do, there is a revival of individual bonuses, spread across all sectors and both employment categories. Gain-sharing is also up on previous years, perhaps indicating that employers are increasingly looking
to boost performance through increased productivity and are looking to support this by sharing the gains with employees through variable pay.
• Notably, where organisations link performance assessment to remuneration, the link is predominantly to salary rather than other reward elements such as bonuses (see Table 3).
• There is little evidence that there is a downward trend in linking
performance review outcomes to reward decisions, although there is evidence that the performance review process is changing. Regular development conversations conducted by line managers are increasingly popular.
• Only just over a third of organisations are satisfied with the level of feedback to employees following performance reviews.
Table 3: Summary of findings – pay and performance (%)
Mode of use % of respondents
Assessment of performance against individual goals
Used, but not linked to salary/reward decisions 38
Linked to salary decisions 24
Linked to other reward decisions 10
Linked to both 19
Not used 9
Assessment of performance against team goals
Used, but not linked to salary/reward decisions 31
Linked to salary decisions 12
Linked to other reward decisions 10
Linked to both 9
Not used 38
Ratings based on an absolute view of an individual’s performance
Used, but not linked to salary/reward decisions 20
Linked to salary decisions 19
Linked to other reward decisions 7
Linked to both 13
Not used 42
Ratings based on an individual’s performance relative to peers
Used, but not linked to salary/reward decisions 15
Linked to salary decisions 10
Linked to other reward decisions 5
Linked to both 9
Not used 61
Performance feedback Regular discussion of employee’s performance 66
Organisation satisfied with level of feedback provided 36
Feedback discussions inform salary increase decisions 31
Feedback discussions inform other reward decisions 21
Employees aware that feedback discussions inform salary/reward decisions 27
None of these 17
9 Reward management: focus on pay
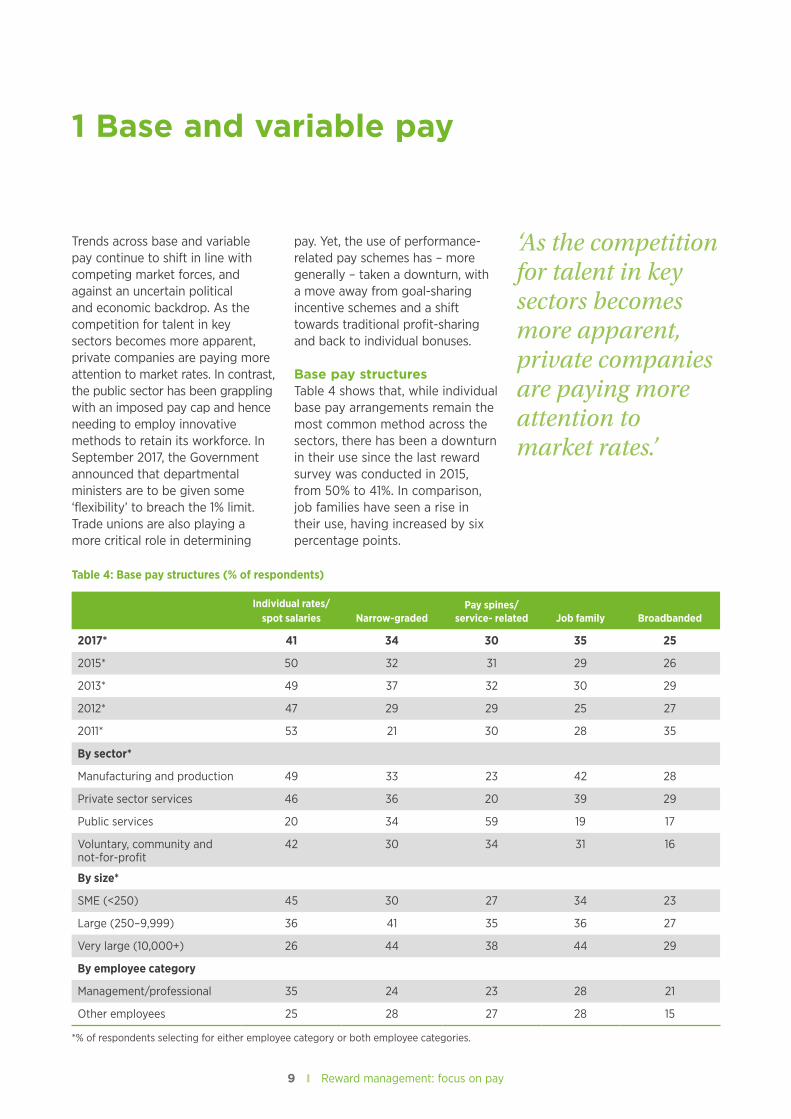
Trends across base and variable pay continue to shift in line with competing market forces, and against an uncertain political and economic backdrop. As the competition for talent in key sectors becomes more apparent, private companies are paying more attention to market rates. In contrast, the public sector has been grappling with an imposed pay cap and hence needing to employ innovative methods to retain its workforce. In September 2017, the Government announced that departmental ministers are to be given some ‘flexibility’ to breach the 1% limit. Trade unions are also playing a more critical role in determining
pay. Yet, the use of performance-related pay schemes has – more generally – taken a downturn, with a move away from goal-sharing incentive schemes and a shift towards traditional profit-sharing and back to individual bonuses.
Base pay structures Table 4 shows that, while individual base pay arrangements remain the most common method across the sectors, there has been a downturn in their use since the last reward survey was conducted in 2015, from 50% to 41%. In comparison, job families have seen a rise in their use, having increased by six percentage points.
1 Base and variable pay
‘As the competition for talent in key sectors becomes more apparent, private companies are paying more attention to market rates.’
Table 4: Base pay structures (% of respondents)
Individual rates/spot salaries Narrow-graded
Pay spines/ service- related Job family Broadbanded
2017* 41 34 30 35 25
2015* 50 32 31 29 26
2013* 49 37 32 30 29
2012* 47 29 29 25 27
2011* 53 21 30 28 35
By sector*
Manufacturing and production 49 33 23 42 28
Private sector services 46 36 20 39 29
Public services 20 34 59 19 17
Voluntary, community and not-for-profit
42 30 34 31 16
By size*
SME (<250) 45 30 27 34 23
Large (250–9,999) 36 41 35 36 27
Very large (10,000+) 26 44 38 44 29
By employee category
Management/professional 35 24 23 28 21
Other employees 25 28 27 28 15
*% of respondents selecting for either employee category or both employee categories.
10 Reward management: focus on pay 11 Reward management: focus on pay
This pattern is echoed across the data since 2011. While job families and narrow-graded pay have continued to rise, the use of individual and spot salaries, along with broadbanding, has fallen.
However, in 2017 there has, in general terms, been a levelling out of the type of base pay structures in place during the past two years. Contrary to previous survey evidence, narrow-graded pay and pay spines (or a column of pay points) have seen a slight increase in popularity, although broadbanding – which offers more flexibility in terms of scope – has seen a marginal decline. A broadbanded pay structure can be defined as the replacement of a multiplicity of short grades in favour of between four to five ‘bands’ into which individuals may be placed for career and salary management purposes, according to the CIPD’s textbook Reward Management: Alternatives, Consequences and Contexts (Perkins, White, and Jones, 2016).
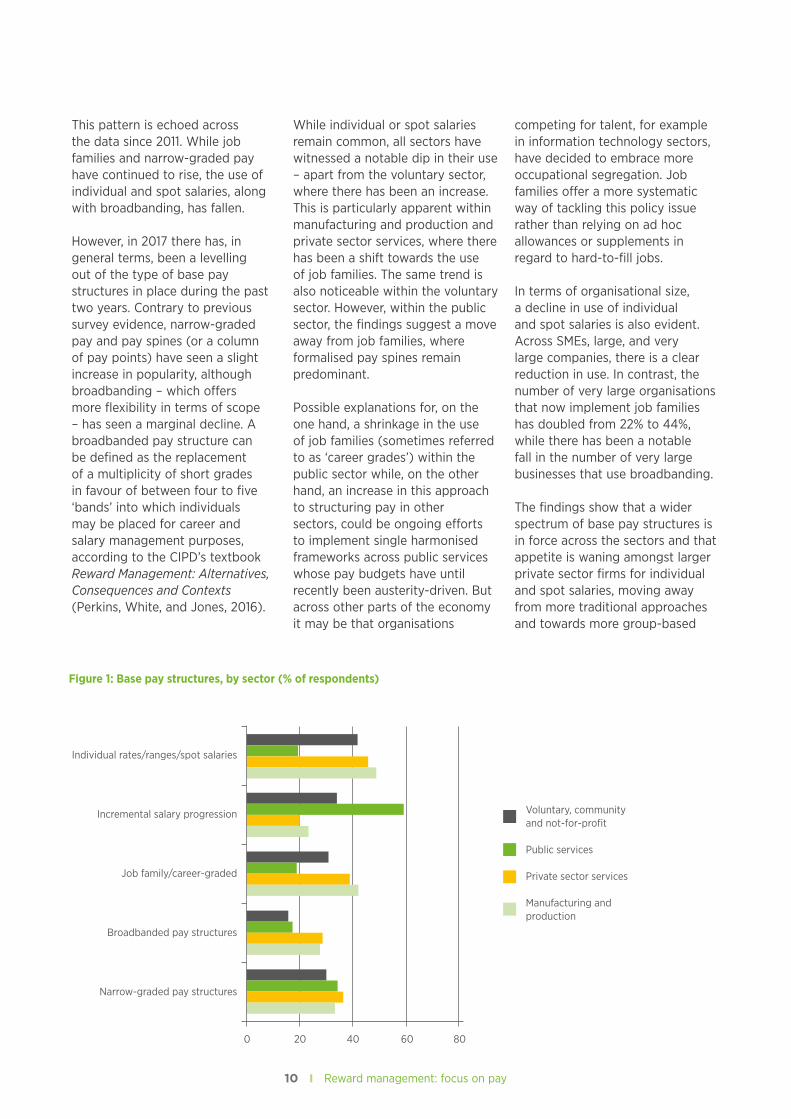
While individual or spot salaries remain common, all sectors have witnessed a notable dip in their use – apart from the voluntary sector, where there has been an increase. This is particularly apparent within manufacturing and production and private sector services, where there has been a shift towards the use of job families. The same trend is also noticeable within the voluntary sector. However, within the public sector, the findings suggest a move away from job families, where formalised pay spines remain predominant.
Possible explanations for, on the one hand, a shrinkage in the use of job families (sometimes referred to as ‘career grades’) within the public sector while, on the other hand, an increase in this approach to structuring pay in other sectors, could be ongoing efforts to implement single harmonised frameworks across public services whose pay budgets have until recently been austerity-driven. But across other parts of the economy it may be that organisations
competing for talent, for example in information technology sectors, have decided to embrace more occupational segregation. Job families offer a more systematic way of tackling this policy issue rather than relying on ad hoc allowances or supplements in regard to hard-to-fill jobs.
In terms of organisational size, a decline in use of individual and spot salaries is also evident. Across SMEs, large, and very large companies, there is a clear reduction in use. In contrast, the number of very large organisations that now implement job families has doubled from 22% to 44%, while there has been a notable fall in the number of very large businesses that use broadbanding.
The findings show that a wider spectrum of base pay structures is in force across the sectors and that appetite is waning amongst larger private sector firms for individual and spot salaries, moving away from more traditional approaches and towards more group-based
Individual rates/ranges/spot salaries
Incremental salary progression
Job family/career-graded
Broadbanded pay structures
Narrow-graded pay structures
Voluntary, community and not-for-profit
Public services
Private sector services
Manufacturing and production
0 20 40 60 80
Figure 1: Base pay structures, by sector (% of respondents)
11 Reward management: focus on pay
pay structures. It is anticipated that the debates will continue over pay-setting for public sector workers and, as the UK moves into a new political era, it will be interesting to track whether these shifts continue or revert.
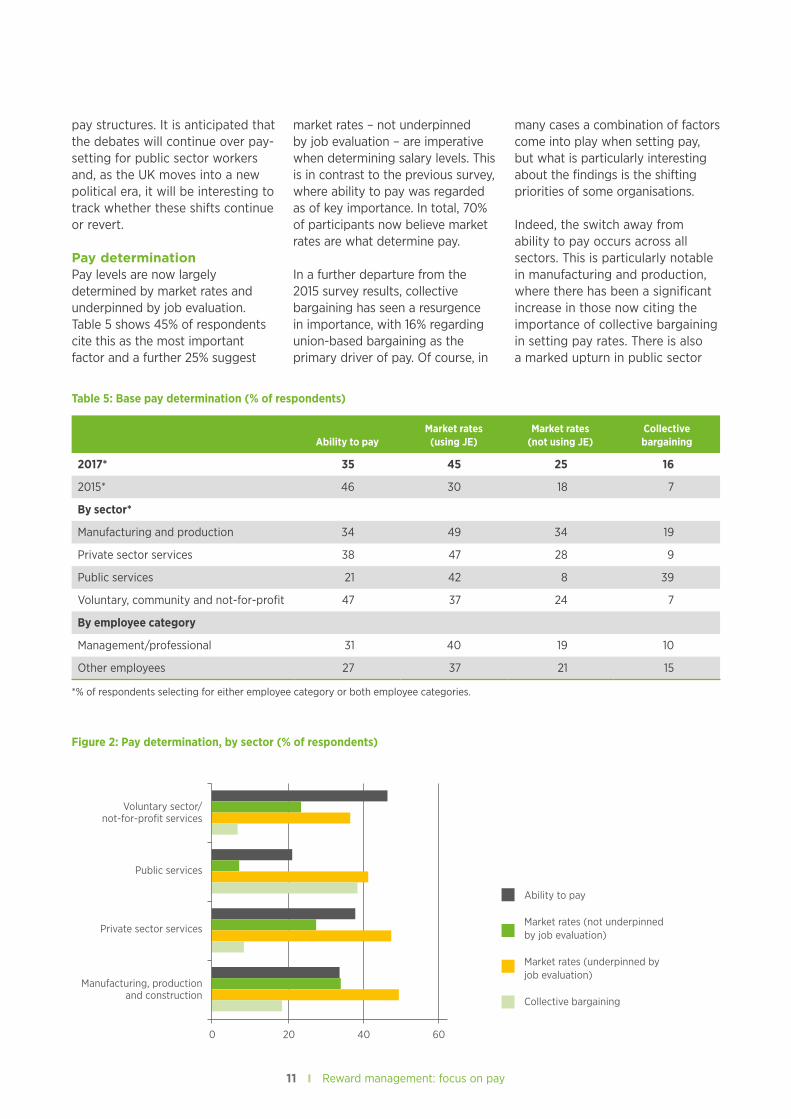
Pay determinationPay levels are now largely determined by market rates and underpinned by job evaluation. Table 5 shows 45% of respondents cite this as the most important factor and a further 25% suggest
market rates – not underpinned by job evaluation – are imperative when determining salary levels. This is in contrast to the previous survey, where ability to pay was regarded as of key importance. In total, 70% of participants now believe market rates are what determine pay.
In a further departure from the 2015 survey results, collective bargaining has seen a resurgence in importance, with 16% regarding union-based bargaining as the primary driver of pay. Of course, in
many cases a combination of factors come into play when setting pay, but what is particularly interesting about the findings is the shifting priorities of some organisations.
Indeed, the switch away from ability to pay occurs across all sectors. This is particularly notable in manufacturing and production, where there has been a significant increase in those now citing the importance of collective bargaining in setting pay rates. There is also a marked upturn in public sector
Voluntary sector/not-for-profit services
Public services
Private sector services
Manufacturing, production and construction
Ability to pay
Market rates (not underpinned by job evaluation)
Market rates (underpinned by job evaluation)
Collective bargaining
0 20 40 60
Figure 2: Pay determination, by sector (% of respondents)
Table 5: Base pay determination (% of respondents)
Ability to payMarket rates
(using JE)Market rates
(not using JE)Collective bargaining
2017* 35 45 25 16
2015* 46 30 18 7
By sector*
Manufacturing and production 34 49 34 19
Private sector services 38 47 28 9
Public services 21 42 8 39
Voluntary, community and not-for-profit 47 37 24 7
By employee category
Management/professional 31 40 19 10
Other employees 27 37 21 15
*% of respondents selecting for either employee category or both employee categories.
12 Reward management: focus on pay 13 Reward management: focus on pay
bargaining, with an increase from 24% to 39% seeing it as important. However, it should also be noted that against this backdrop, data from the Office for National Statistics shows the number trade union members as a percentage of the total workforce is as at its lowest proportion since 1995.
While organisations consider a range of factors, the popularity of market rates underpinned by job evaluation is largely explained by an increase in use amongst manufacturing and production and private sector services. Interestingly, the voluntary sector also has a greater awareness and consideration for market rates than it did in 2015. However, ability to pay is still the primary focus of this group.
There are clearly still constraints placed on UK plc when determining pay, but the findings demonstrate a definite shift in thinking when it comes to setting reward and remaining competitive is now of key importance. Discussion Point 1 shows expert practitioner panel reflections on what determines pay.
Discussion point 1: ‘What determines pay?’
Since the last CIPD Reward Management survey was conducted two years ago, there has been a notable shift in what determines pay within organisations. Previously, ‘ability to pay’ was cited as the most common factor when setting salaries. However, this year’s survey sees a change, as companies focus more on ‘market rates’. In total, 70% of respondents believe paying at the market rate, whether or not underpinned by job evaluation, is the most important consideration.
We asked our panel of senior reward practitioners for their views on this change in focus. For those representing the private sector, there is a sense that companies are moving away from the rhetoric of austerity. This reflects wider concerns currently being debated around the UK’s economic policies and questions over the use of austerity measures. The scarcity of talent is also cited for setting base pay at market levels. Those working in the sciences and technology sectors are aware that key skills and competences are critical to future growth and therefore it is imperative that organisations lock in these highly skilled individuals.
For the public sector it is a different story, and ‘ability to pay’ remains the key determinant, as they are constrained by the Government’s 1% pay cap. Panel members believe that finding new and innovative ways to attract and retain staff through the total reward and benefits matrix is crucial. Geographical location and local labour markets also play a key role in determining pay, particularly for those working in public services. However, efforts are being made to reduce pay discrepancies internally in a bid to create a more level playing field for those recruiting. Conversely, the private sector is more concerned with meeting the needs of the external, rather than the internal, market.
The survey also found that there has been a rise in the importance of collective bargaining and that union negotiations have increased over the last two years. Some panel members suggest this may reflect a shift towards adopting a less adversarial approach by organisations towards employment relations and a desire to pre-empt conflict. However for others, while pay negotiations form part of the pay-setting process, it is a combination of factors that ultimately determines reward. Indeed, rarely is pay determined on one single issue, and what emerged from the discussion is the number of variables and complexities reward experts grapple with when setting wages.
CIPD viewpointWith a shift in the importance of market rates in the way pay is set, to what extent are reward managers aware of the assumptions and methodologies underpinning the ‘market’ data that they use? To what extent do they factor in error rates before adopting outcomes – especially in those instances where there is no job evaluation used to structure overall assessment of contribution to be rewarded? Reward managers need to look critically at the data presented to them, with questions as to how it has been assembled and how relevant the findings are for their own organisations. They also need to make sure that the pay recommendations are applied in a rigorous and systematic manner across roles, accountability levels and job families.
13 Reward management: focus on pay
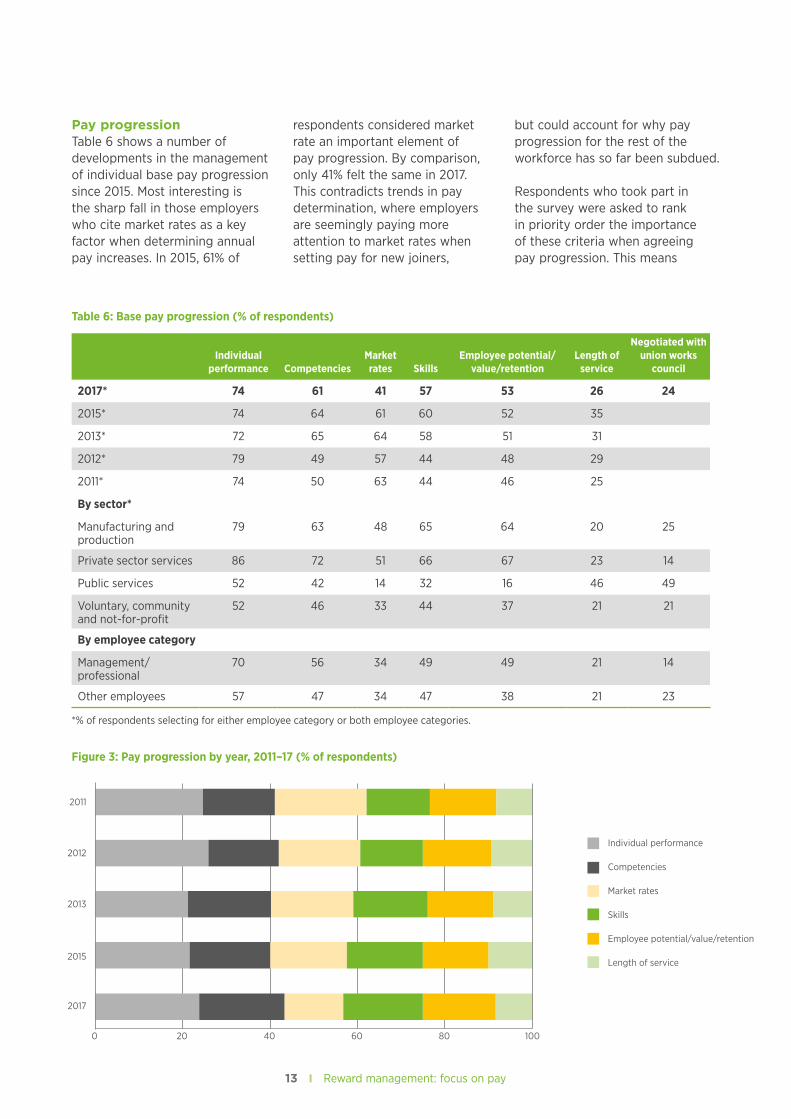
Pay progressionTable 6 shows a number of developments in the management of individual base pay progression since 2015. Most interesting is the sharp fall in those employers who cite market rates as a key factor when determining annual pay increases. In 2015, 61% of
respondents considered market rate an important element of pay progression. By comparison, only 41% felt the same in 2017. This contradicts trends in pay determination, where employers are seemingly paying more attention to market rates when setting pay for new joiners,
but could account for why pay progression for the rest of the workforce has so far been subdued.
Respondents who took part in the survey were asked to rank in priority order the importance of these criteria when agreeing pay progression. This means
Table 6: Base pay progression (% of respondents)
Individual performance Competencies
Marketrates Skills
Employee potential/value/retention
Length of service
Negotiated with union works
council
2017* 74 61 41 57 53 26 24
2015* 74 64 61 60 52 35
2013* 72 65 64 58 51 31
2012* 79 49 57 44 48 29
2011* 74 50 63 44 46 25
By sector*
Manufacturing and production
79 63 48 65 64 20 25
Private sector services 86 72 51 66 67 23 14
Public services 52 42 14 32 16 46 49
Voluntary, community and not-for-profit
52 46 33 44 37 21 21
By employee category
Management/ professional
70 56 34 49 49 21 14
Other employees 57 47 34 47 38 21 23
*% of respondents selecting for either employee category or both employee categories.
2011
2012
2013
2015
2017
Individual performance
Competencies
Market rates
Skills
Employee potential/value/retention
Length of service
0 20 40 60 80 100
Figure 3: Pay progression by year, 2011–17 (% of respondents)
14 Reward management: focus on pay 15 Reward management: focus on pay
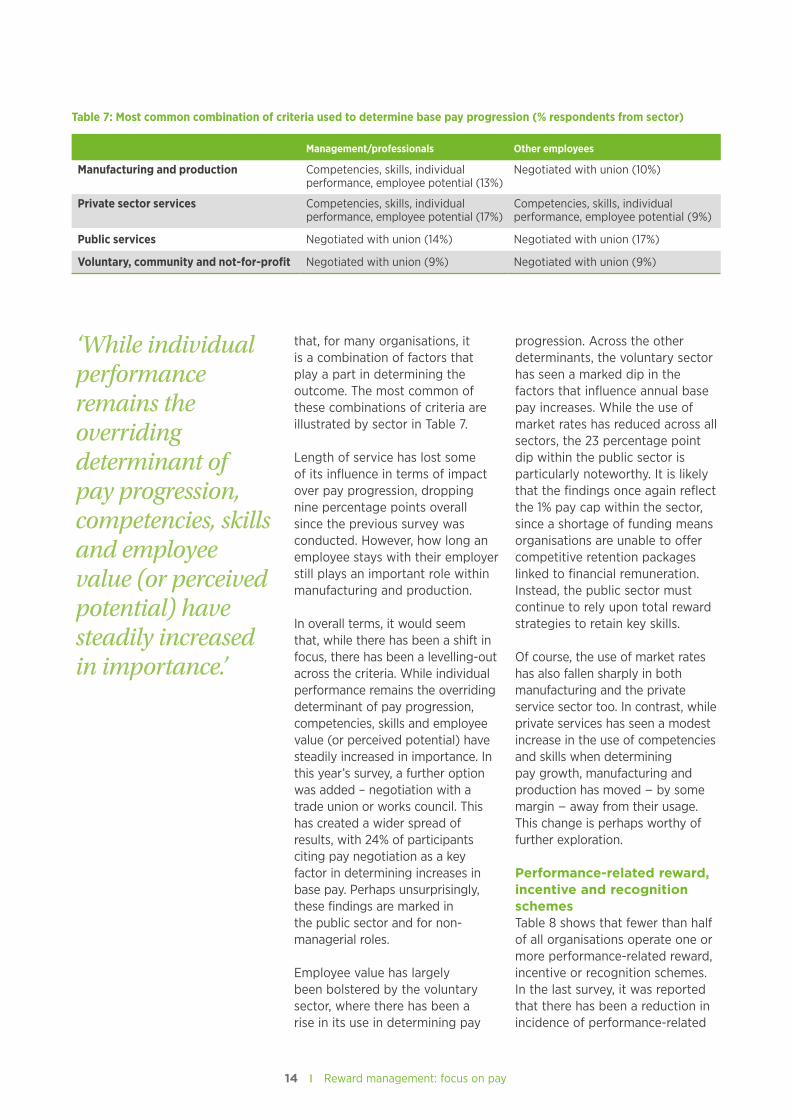
that, for many organisations, it is a combination of factors that play a part in determining the outcome. The most common of these combinations of criteria are illustrated by sector in Table 7.
Length of service has lost some of its influence in terms of impact over pay progression, dropping nine percentage points overall since the previous survey was conducted. However, how long an employee stays with their employer still plays an important role within manufacturing and production.
In overall terms, it would seem that, while there has been a shift in focus, there has been a levelling-out across the criteria. While individual performance remains the overriding determinant of pay progression, competencies, skills and employee value (or perceived potential) have steadily increased in importance. In this year’s survey, a further option was added – negotiation with a trade union or works council. This has created a wider spread of results, with 24% of participants citing pay negotiation as a key factor in determining increases in base pay. Perhaps unsurprisingly, these findings are marked in the public sector and for non-managerial roles.
Employee value has largely been bolstered by the voluntary sector, where there has been a rise in its use in determining pay
progression. Across the other determinants, the voluntary sector has seen a marked dip in the factors that influence annual base pay increases. While the use of market rates has reduced across all sectors, the 23 percentage point dip within the public sector is particularly noteworthy. It is likely that the findings once again reflect the 1% pay cap within the sector, since a shortage of funding means organisations are unable to offer competitive retention packages linked to financial remuneration. Instead, the public sector must continue to rely upon total reward strategies to retain key skills.
Of course, the use of market rates has also fallen sharply in both manufacturing and the private service sector too. In contrast, while private services has seen a modest increase in the use of competencies and skills when determining pay growth, manufacturing and production has moved – by some margin – away from their usage. This change is perhaps worthy of further exploration.
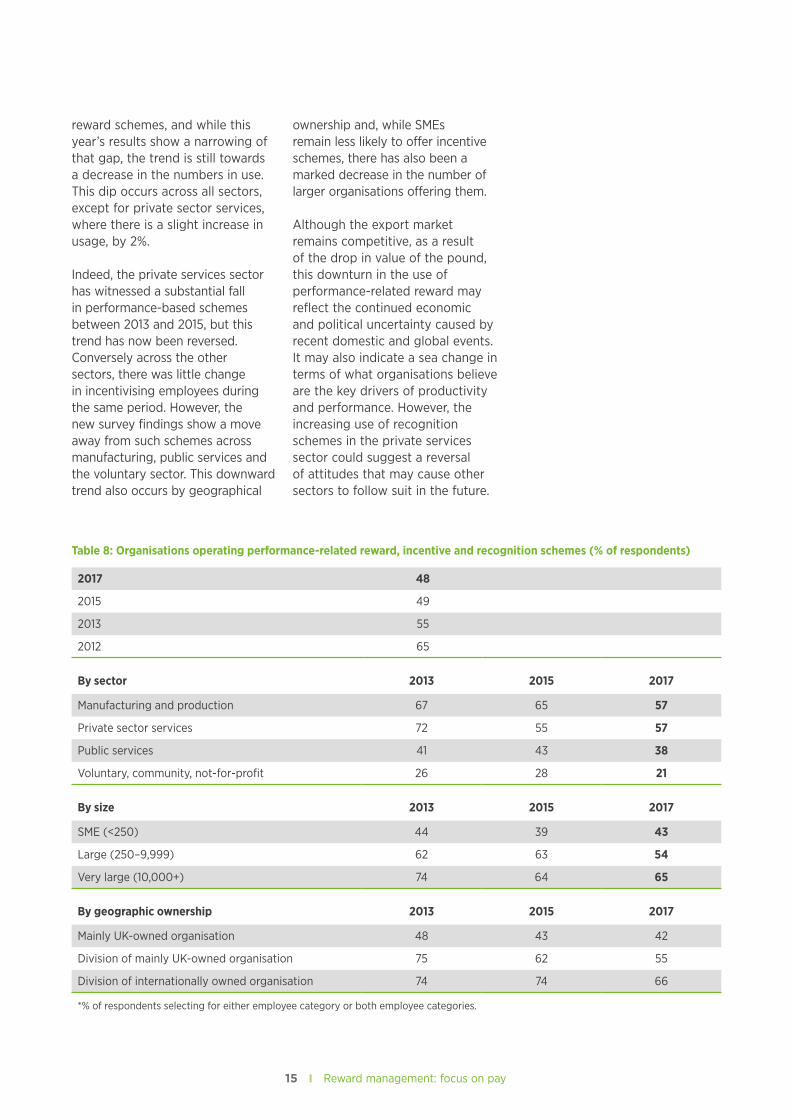
Performance-related reward, incentive and recognition schemesTable 8 shows that fewer than half of all organisations operate one or more performance-related reward, incentive or recognition schemes. In the last survey, it was reported that there has been a reduction in incidence of performance-related
Table 7: Most common combination of criteria used to determine base pay progression (% respondents from sector)
Management/professionals Other employees
Manufacturing and production Competencies, skills, individual performance, employee potential (13%)
Negotiated with union (10%)
Private sector services Competencies, skills, individual performance, employee potential (17%)
Competencies, skills, individual performance, employee potential (9%)
Public services Negotiated with union (14%) Negotiated with union (17%)
Voluntary, community and not-for-profit Negotiated with union (9%) Negotiated with union (9%)
‘While individual performance remains the overriding determinant of pay progression, competencies, skills and employee value (or perceived potential) have steadily increased in importance.’
15 Reward management: focus on pay
reward schemes, and while this year’s results show a narrowing of that gap, the trend is still towards a decrease in the numbers in use. This dip occurs across all sectors, except for private sector services, where there is a slight increase in usage, by 2%.
Indeed, the private services sector has witnessed a substantial fall in performance-based schemes between 2013 and 2015, but this trend has now been reversed. Conversely across the other sectors, there was little change in incentivising employees during the same period. However, the new survey findings show a move away from such schemes across manufacturing, public services and the voluntary sector. This downward trend also occurs by geographical
ownership and, while SMEs remain less likely to offer incentive schemes, there has also been a marked decrease in the number of larger organisations offering them.
Although the export market remains competitive, as a result of the drop in value of the pound, this downturn in the use of performance-related reward may reflect the continued economic and political uncertainty caused by recent domestic and global events. It may also indicate a sea change in terms of what organisations believe are the key drivers of productivity and performance. However, the increasing use of recognition schemes in the private services sector could suggest a reversal of attitudes that may cause other sectors to follow suit in the future.
Table 8: Organisations operating performance-related reward, incentive and recognition schemes (% of respondents)
2017 48
2015 49
2013 55
2012 65
By sector 2013 2015 2017
Manufacturing and production 67 65 57
Private sector services 72 55 57
Public services 41 43 38
Voluntary, community, not-for-profit 26 28 21
By size 2013 2015 2017
SME (<250) 44 39 43
Large (250–9,999) 62 63 54
Very large (10,000+) 74 64 65
By geographic ownership 2013 2015 2017
Mainly UK-owned organisation 48 43 42
Division of mainly UK-owned organisation 75 62 55
Division of internationally owned organisation 74 74 66
*% of respondents selecting for either employee category or both employee categories.
16 Reward management: focus on pay 17 Reward management: focus on pay
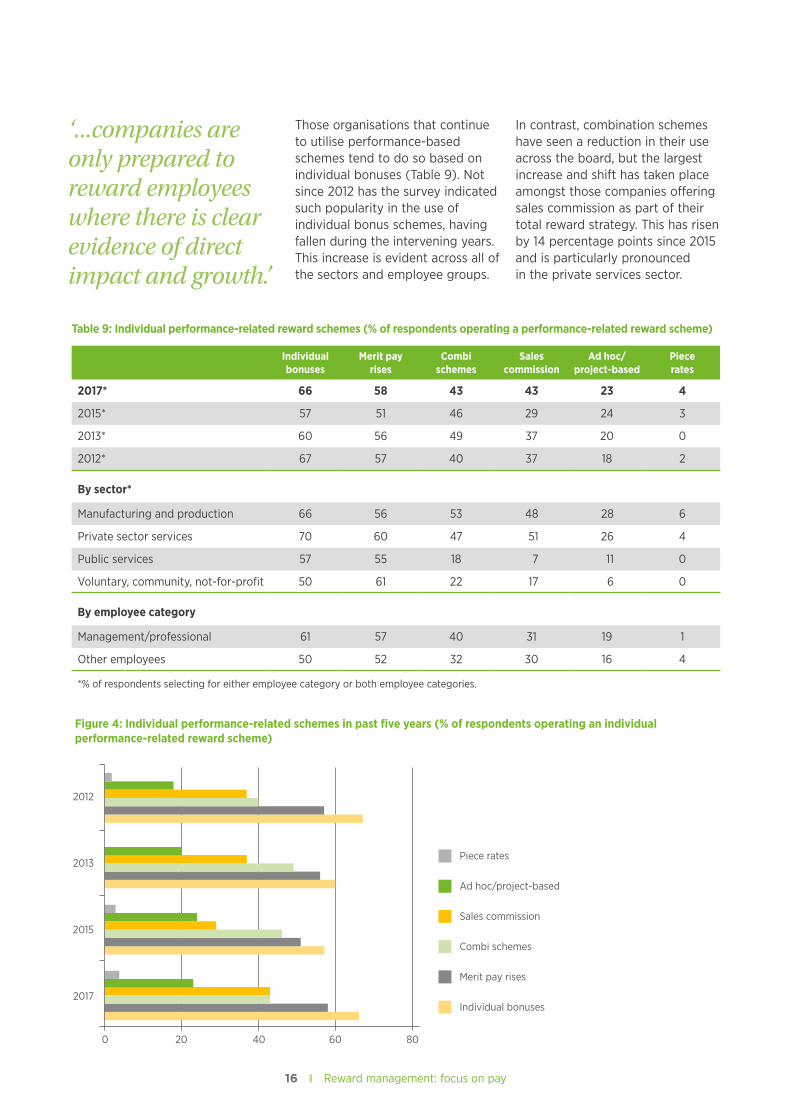
Those organisations that continue to utilise performance-based schemes tend to do so based on individual bonuses (Table 9). Not since 2012 has the survey indicated such popularity in the use of individual bonus schemes, having fallen during the intervening years. This increase is evident across all of the sectors and employee groups.
In contrast, combination schemes have seen a reduction in their use across the board, but the largest increase and shift has taken place amongst those companies offering sales commission as part of their total reward strategy. This has risen by 14 percentage points since 2015 and is particularly pronounced in the private services sector.
Table 9: Individual performance-related reward schemes (% of respondents operating a performance-related reward scheme)
Individual bonuses
Merit pay rises
Combi schemes
Sales commission
Ad hoc/ project-based
Piece rates
2017* 66 58 43 43 23 4
2015* 57 51 46 29 24 3
2013* 60 56 49 37 20 0
2012* 67 57 40 37 18 2
By sector*
Manufacturing and production 66 56 53 48 28 6
Private sector services 70 60 47 51 26 4
Public services 57 55 18 7 11 0
Voluntary, community, not-for-profit 50 61 22 17 6 0
By employee category
Management/professional 61 57 40 31 19 1
Other employees 50 52 32 30 16 4
*% of respondents selecting for either employee category or both employee categories.
2012
2013
2015
2017
Piece rates
Ad hoc/project-based
Sales commission
Combi schemes
Merit pay rises
Individual bonuses
0 20 40 60 80
Figure 4: Individual performance-related schemes in past five years (% of respondents operating an individual performance-related reward scheme)
‘...companies are only prepared to reward employees where there is clear evidence of direct impact and growth.’
17 Reward management: focus on pay
This possibly suggests a move by some towards creating a stronger link between quantifiable output and performance – an indication, perhaps, that companies are only prepared to reward employees where there is clear evidence of direct impact and growth.
Overall, the use of project-based and merit pay also remains constant across the bulk of sectors.
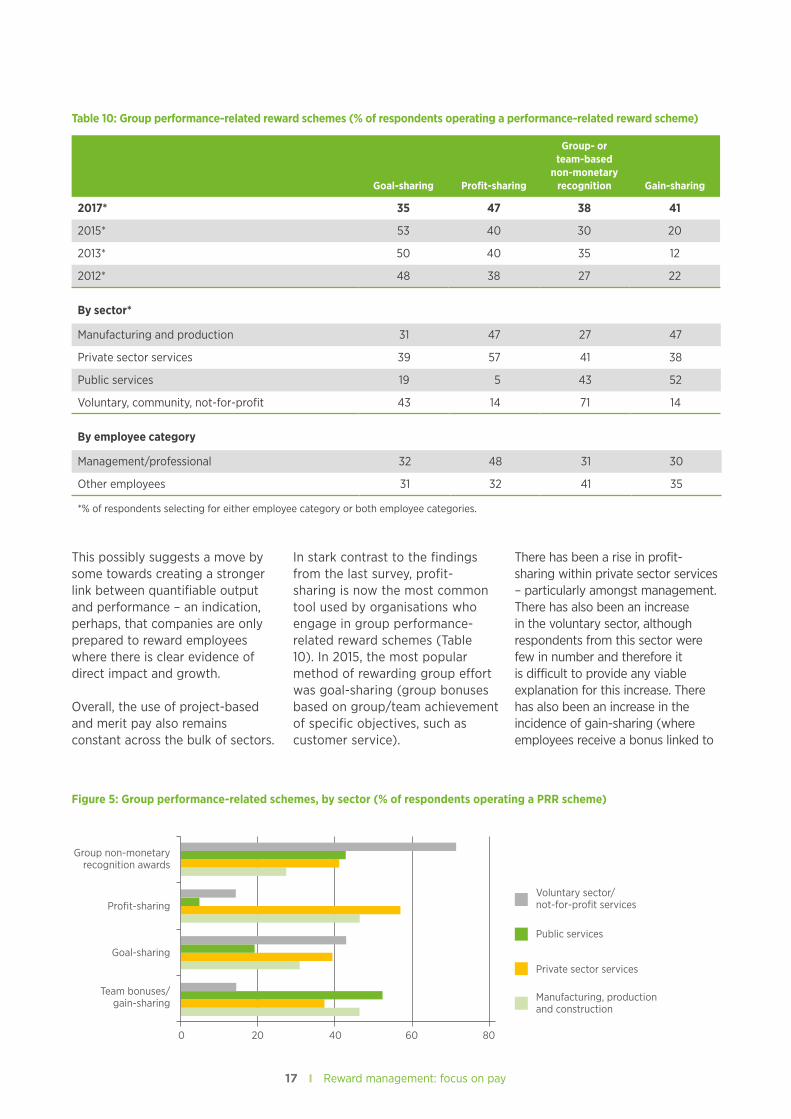
In stark contrast to the findings from the last survey, profit-sharing is now the most common tool used by organisations who engage in group performance-related reward schemes (Table 10). In 2015, the most popular method of rewarding group effort was goal-sharing (group bonuses based on group/team achievement of specific objectives, such as customer service).
There has been a rise in profit-sharing within private sector services – particularly amongst management. There has also been an increase in the voluntary sector, although respondents from this sector were few in number and therefore it is difficult to provide any viable explanation for this increase. There has also been an increase in the incidence of gain-sharing (where employees receive a bonus linked to
Group non-monetary recognition awards
Profit-sharing
Goal-sharing
Team bonuses/gain-sharing
Voluntary sector/not-for-profit services
Public services
Private sector services
Manufacturing, production and construction
0 20 40 60 80
Figure 5: Group performance-related schemes, by sector (% of respondents operating a PRR scheme)
Table 10: Group performance-related reward schemes (% of respondents operating a performance-related reward scheme)
Goal-sharing Profit-sharing
Group- or team-based
non-monetary recognition Gain-sharing
2017* 35 47 38 41
2015* 53 40 30 20
2013* 50 40 35 12
2012* 48 38 27 22
By sector*
Manufacturing and production 31 47 27 47
Private sector services 39 57 41 38
Public services 19 5 43 52
Voluntary, community, not-for-profit 43 14 71 14
By employee category
Management/professional 32 48 31 30
Other employees 31 32 41 35
*% of respondents selecting for either employee category or both employee categories.
18 Reward management: focus on pay 19 Reward management: focus on pay
the savings brought about by their improved productivity at a group, sub-unit or team level), perhaps indicating that talk about the UK’s productivity puzzle is beginning to influence reward practice. The
success of such schemes rests in part on the involvement of employees working collectively to explore and suggest opportunities to increase performance. This suggests a move among some employers towards
fostering a culture of trust in the workplace.
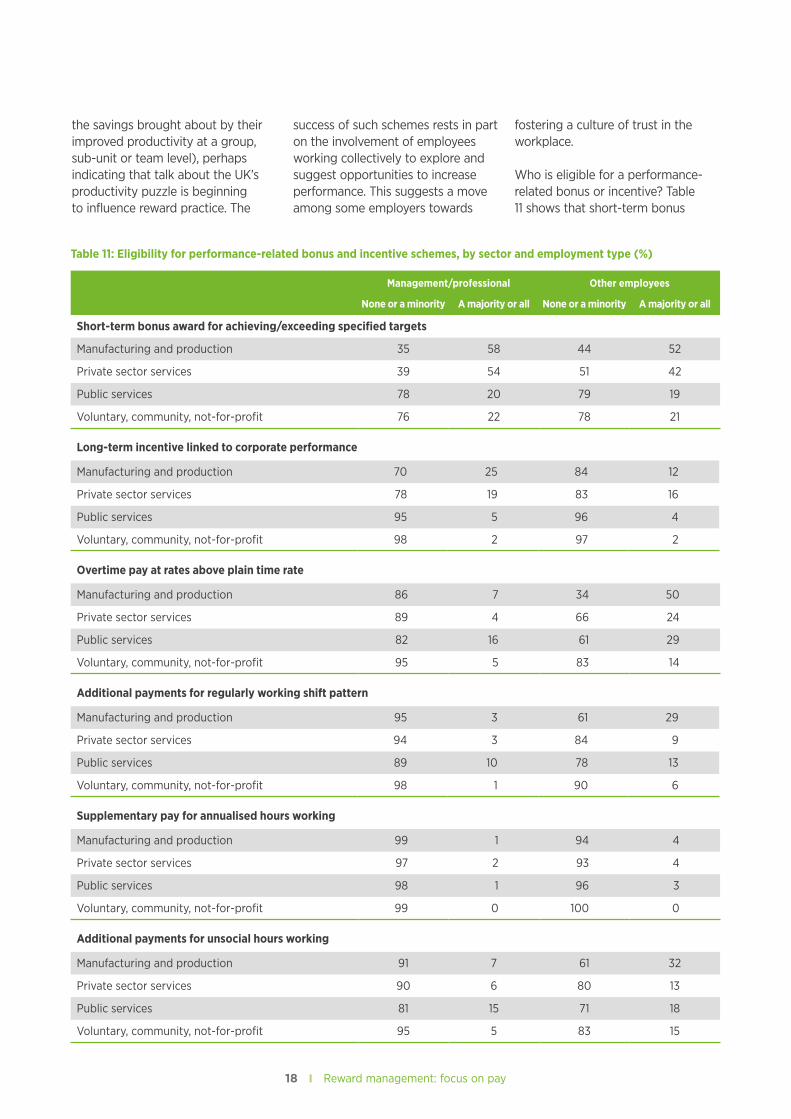
Who is eligible for a performance-related bonus or incentive? Table 11 shows that short-term bonus
Table 11: Eligibility for performance-related bonus and incentive schemes, by sector and employment type (%)
Management/professional Other employees
None or a minority A majority or all None or a minority A majority or all
Short-term bonus award for achieving/exceeding specified targets
Manufacturing and production 35 58 44 52
Private sector services 39 54 51 42
Public services 78 20 79 19
Voluntary, community, not-for-profit 76 22 78 21
Long-term incentive linked to corporate performance
Manufacturing and production 70 25 84 12
Private sector services 78 19 83 16
Public services 95 5 96 4
Voluntary, community, not-for-profit 98 2 97 2
Overtime pay at rates above plain time rate
Manufacturing and production 86 7 34 50
Private sector services 89 4 66 24
Public services 82 16 61 29
Voluntary, community, not-for-profit 95 5 83 14
Additional payments for regularly working shift pattern
Manufacturing and production 95 3 61 29
Private sector services 94 3 84 9
Public services 89 10 78 13
Voluntary, community, not-for-profit 98 1 90 6
Supplementary pay for annualised hours working
Manufacturing and production 99 1 94 4
Private sector services 97 2 93 4
Public services 98 1 96 3
Voluntary, community, not-for-profit 99 0 100 0
Additional payments for unsocial hours working
Manufacturing and production 91 7 61 32
Private sector services 90 6 80 13
Public services 81 15 71 18
Voluntary, community, not-for-profit 95 5 83 15
19 Reward management: focus on pay
awards for achieving/exceeding specified targets are most common in manufacturing and private sector services, and least common in the public and voluntary sectors, whether for management/professional or other employees. Long-term incentives linked to corporate performance is highest in manufacturing among management/professional staff. Manufacturing and private sector services are much more likely to offer these than public and voluntary sectors.
In terms of payments additional to salary and incentives, overtime pay at rates above plain time rate again is more common below managerial/professional staff levels.
It is noticeable that the public sector is by far the most likely to offer this to management/professional staff. Additional payments for regularly working shift patterns are very uncommon for management staff except in the public sector. Manufacturing is most likely to offer this to other employees. Supplementary pay for annualised hours working is very uncommon for all sectors and unknown in the voluntary sector. Additional payments for unsocial hours working for management/professional staff is most common in the public sector. For other employees, manufacturing is most likely to offer it, but again, the public sector is more likely to do so than private sector services.
‘...short-term bonus awards for achieving/exceeding specified targets are most common in manufacturing and private sector services.’
20 Reward management: focus on pay 21 Reward management: focus on pay
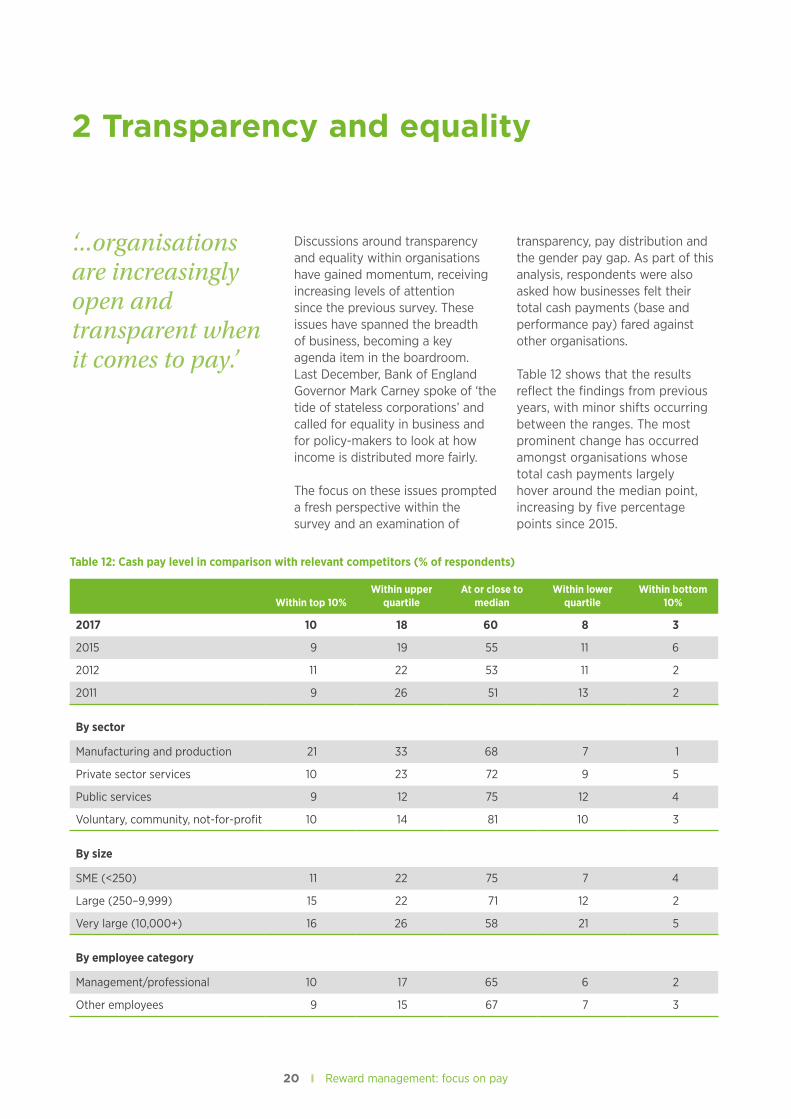
Discussions around transparency and equality within organisations have gained momentum, receiving increasing levels of attention since the previous survey. These issues have spanned the breadth of business, becoming a key agenda item in the boardroom. Last December, Bank of England Governor Mark Carney spoke of ‘the tide of stateless corporations’ and called for equality in business and for policy-makers to look at how income is distributed more fairly.
The focus on these issues prompted a fresh perspective within the survey and an examination of
transparency, pay distribution and the gender pay gap. As part of this analysis, respondents were also asked how businesses felt their total cash payments (base and performance pay) fared against other organisations.
Table 12 shows that the results reflect the findings from previous years, with minor shifts occurring between the ranges. The most prominent change has occurred amongst organisations whose total cash payments largely hover around the median point, increasing by five percentage points since 2015.
2 Transparency and equality
‘...organisations are increasingly open and transparent when it comes to pay.’
Table 12: Cash pay level in comparison with relevant competitors (% of respondents)
Within top 10%Within upper
quartileAt or close to
medianWithin lower
quartileWithin bottom
10%
2017 10 18 60 8 3
2015 9 19 55 11 6
2012 11 22 53 11 2
2011 9 26 51 13 2
By sector
Manufacturing and production 21 33 68 7 1
Private sector services 10 23 72 9 5
Public services 9 12 75 12 4
Voluntary, community, not-for-profit 10 14 81 10 3
By size
SME (<250) 11 22 75 7 4
Large (250–9,999) 15 22 71 12 2
Very large (10,000+) 16 26 58 21 5
By employee category
Management/professional 10 17 65 6 2
Other employees 9 15 67 7 3
21 Reward management: focus on pay
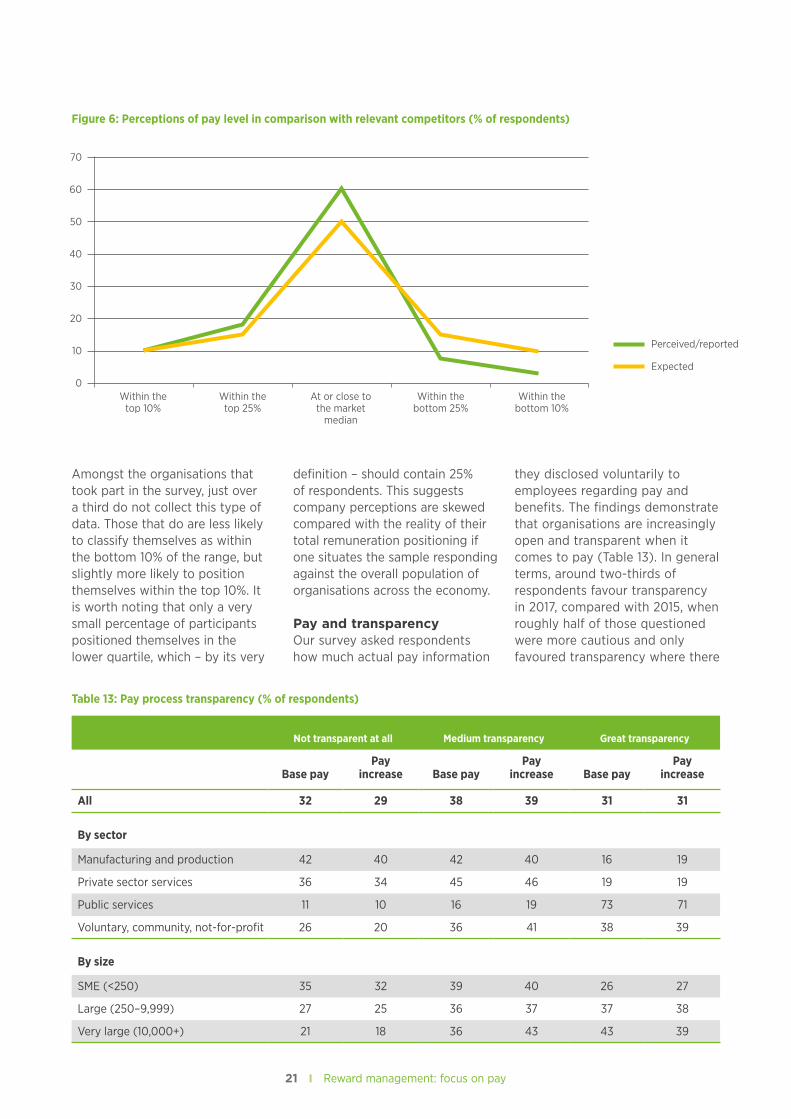
Amongst the organisations that took part in the survey, just over a third do not collect this type of data. Those that do are less likely to classify themselves as within the bottom 10% of the range, but slightly more likely to position themselves within the top 10%. It is worth noting that only a very small percentage of participants positioned themselves in the lower quartile, which – by its very
definition – should contain 25% of respondents. This suggests company perceptions are skewed compared with the reality of their total remuneration positioning if one situates the sample responding against the overall population of organisations across the economy.
Pay and transparencyOur survey asked respondents how much actual pay information
they disclosed voluntarily to employees regarding pay and benefits. The findings demonstrate that organisations are increasingly open and transparent when it comes to pay (Table 13). In general terms, around two-thirds of respondents favour transparency in 2017, compared with 2015, when roughly half of those questioned were more cautious and only favoured transparency where there
70
60
50
40
30
20
10
0Within the
top 10%Within the top 25%
At or close to the market
median
Within the bottom 25%
Within the bottom 10%
Perceived/reported
Expected
Figure 6: Perceptions of pay level in comparison with relevant competitors (% of respondents)
Table 13: Pay process transparency (% of respondents)
Not transparent at all Medium transparency Great transparency
Base payPay
increase Base payPay
increase Base payPay
increase
All 32 29 38 39 31 31
By sector
Manufacturing and production 42 40 42 40 16 19
Private sector services 36 34 45 46 19 19
Public services 11 10 16 19 73 71
Voluntary, community, not-for-profit 26 20 36 41 38 39
By size
SME (<250) 35 32 39 40 26 27
Large (250–9,999) 27 25 36 37 37 38
Very large (10,000+) 21 18 36 43 43 39
22 Reward management: focus on pay 23 Reward management: focus on pay
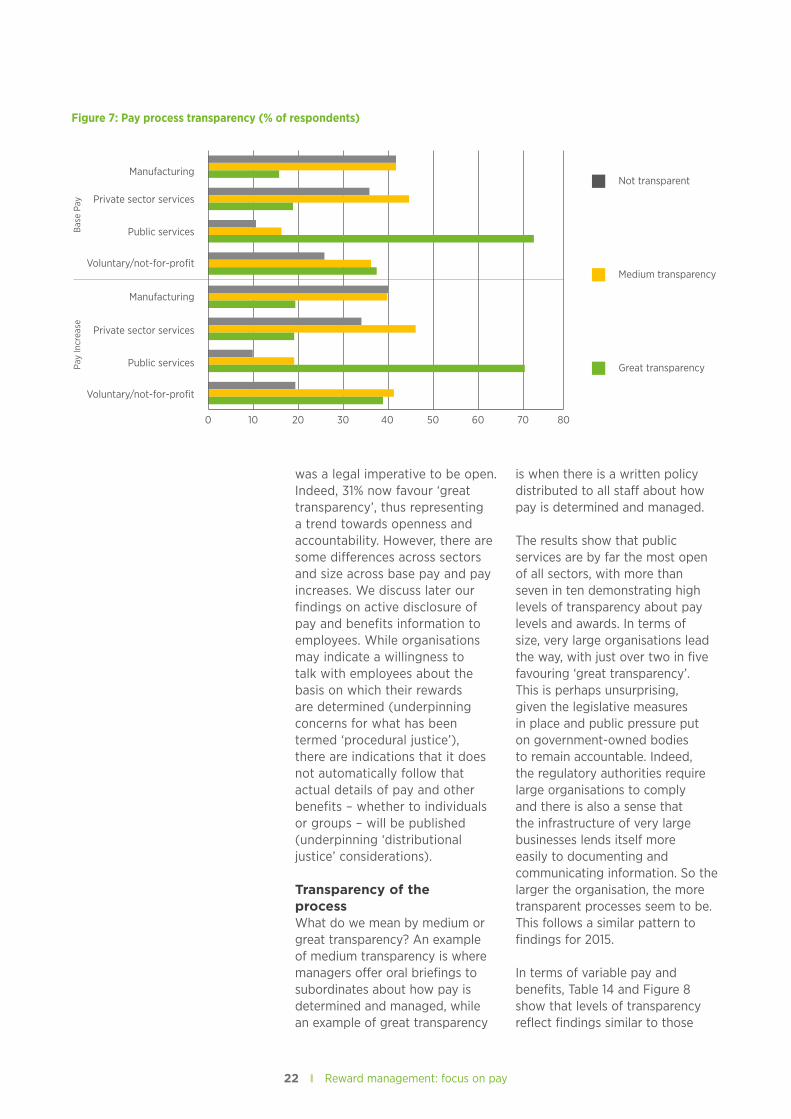
was a legal imperative to be open. Indeed, 31% now favour ‘great transparency’, thus representing a trend towards openness and accountability. However, there are some differences across sectors and size across base pay and pay increases. We discuss later our findings on active disclosure of pay and benefits information to employees. While organisations may indicate a willingness to talk with employees about the basis on which their rewards are determined (underpinning concerns for what has been termed ‘procedural justice’), there are indications that it does not automatically follow that actual details of pay and other benefits – whether to individuals or groups – will be published (underpinning ‘distributional justice’ considerations).
Transparency of the processWhat do we mean by medium or great transparency? An example of medium transparency is where managers offer oral briefings to subordinates about how pay is determined and managed, while an example of great transparency
is when there is a written policy distributed to all staff about how pay is determined and managed.
The results show that public services are by far the most open of all sectors, with more than seven in ten demonstrating high levels of transparency about pay levels and awards. In terms of size, very large organisations lead the way, with just over two in five favouring ‘great transparency’. This is perhaps unsurprising, given the legislative measures in place and public pressure put on government-owned bodies to remain accountable. Indeed, the regulatory authorities require large organisations to comply and there is also a sense that the infrastructure of very large businesses lends itself more easily to documenting and communicating information. So the larger the organisation, the more transparent processes seem to be. This follows a similar pattern to findings for 2015.
In terms of variable pay and benefits, Table 14 and Figure 8 show that levels of transparency reflect findings similar to those
Not transparent
Medium transparency
Great transparency
Bas
e Pa
y Private sector services
Public services
Voluntary/not-for-profit
Manufacturing
Pay
Incr
ease
Manufacturing
Private sector services
Public services
Voluntary/not-for-profit
0 10 20 30 40 50 60 70 80
Figure 7: Pay process transparency (% of respondents)
23 Reward management: focus on pay
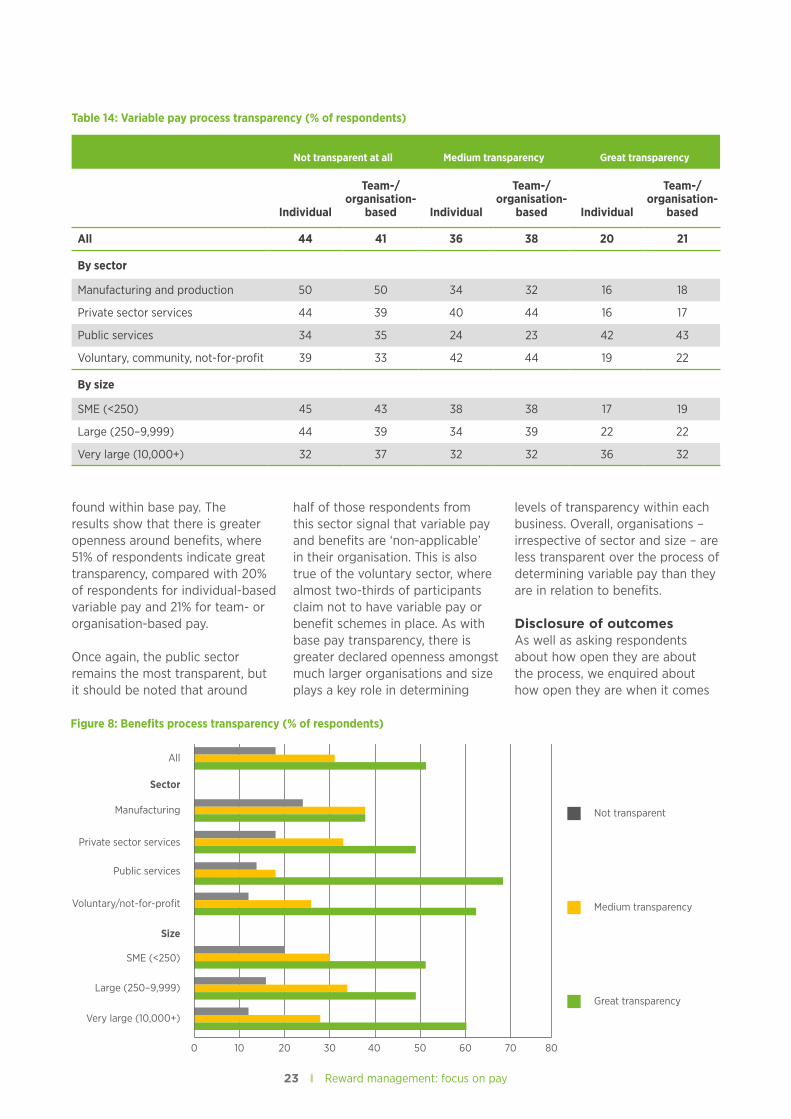
found within base pay. The results show that there is greater openness around benefits, where 51% of respondents indicate great transparency, compared with 20% of respondents for individual-based variable pay and 21% for team- or organisation-based pay.
Once again, the public sector remains the most transparent, but it should be noted that around
half of those respondents from this sector signal that variable pay and benefits are ‘non-applicable’ in their organisation. This is also true of the voluntary sector, where almost two-thirds of participants claim not to have variable pay or benefit schemes in place. As with base pay transparency, there is greater declared openness amongst much larger organisations and size plays a key role in determining
levels of transparency within each business. Overall, organisations – irrespective of sector and size – are less transparent over the process of determining variable pay than they are in relation to benefits.
Disclosure of outcomesAs well as asking respondents about how open they are about the process, we enquired about how open they are when it comes
Not transparent
Medium transparency
Great transparency
Private sector services
Public services
Voluntary/not-for-profit
Manufacturing
Sector
All
Size
SME (<250)
Large (250–9,999)
Very large (10,000+)
0 10 20 30 40 50 60 70 80
Figure 8: Benefits process transparency (% of respondents)
Table 14: Variable pay process transparency (% of respondents)
Not transparent at all Medium transparency Great transparency
Individual
Team-/organisation-
based Individual
Team-/organisation-
based Individual
Team-/organisation-
based
All 44 41 36 38 20 21
By sector
Manufacturing and production 50 50 34 32 16 18
Private sector services 44 39 40 44 16 17
Public services 34 35 24 23 42 43
Voluntary, community, not-for-profit 39 33 42 44 19 22
By size
SME (<250) 45 43 38 38 17 19
Large (250–9,999) 44 39 34 39 22 22
Very large (10,000+) 32 37 32 32 36 32
24 Reward management: focus on pay 25 Reward management: focus on pay
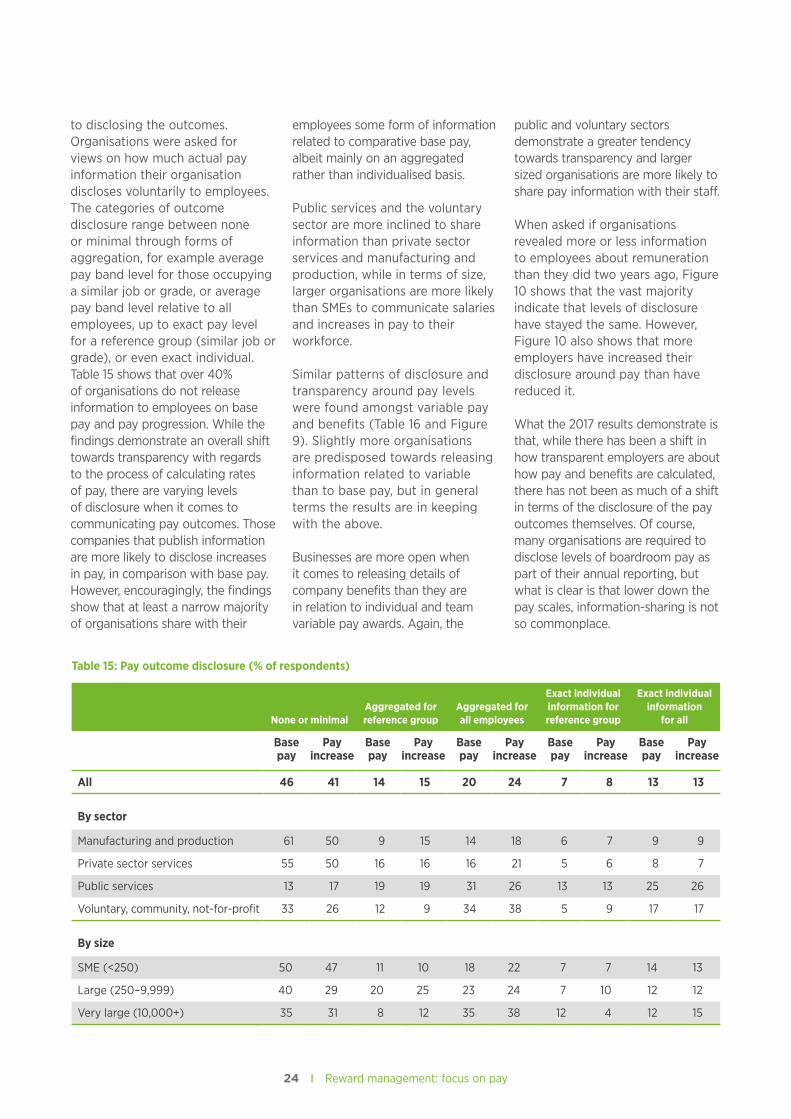
to disclosing the outcomes. Organisations were asked for views on how much actual pay information their organisation discloses voluntarily to employees. The categories of outcome disclosure range between none or minimal through forms of aggregation, for example average pay band level for those occupying a similar job or grade, or average pay band level relative to all employees, up to exact pay level for a reference group (similar job or grade), or even exact individual. Table 15 shows that over 40% of organisations do not release information to employees on base pay and pay progression. While the findings demonstrate an overall shift towards transparency with regards to the process of calculating rates of pay, there are varying levels of disclosure when it comes to communicating pay outcomes. Those companies that publish information are more likely to disclose increases in pay, in comparison with base pay. However, encouragingly, the findings show that at least a narrow majority of organisations share with their
employees some form of information related to comparative base pay, albeit mainly on an aggregated rather than individualised basis.
Public services and the voluntary sector are more inclined to share information than private sector services and manufacturing and production, while in terms of size, larger organisations are more likely than SMEs to communicate salaries and increases in pay to their workforce.
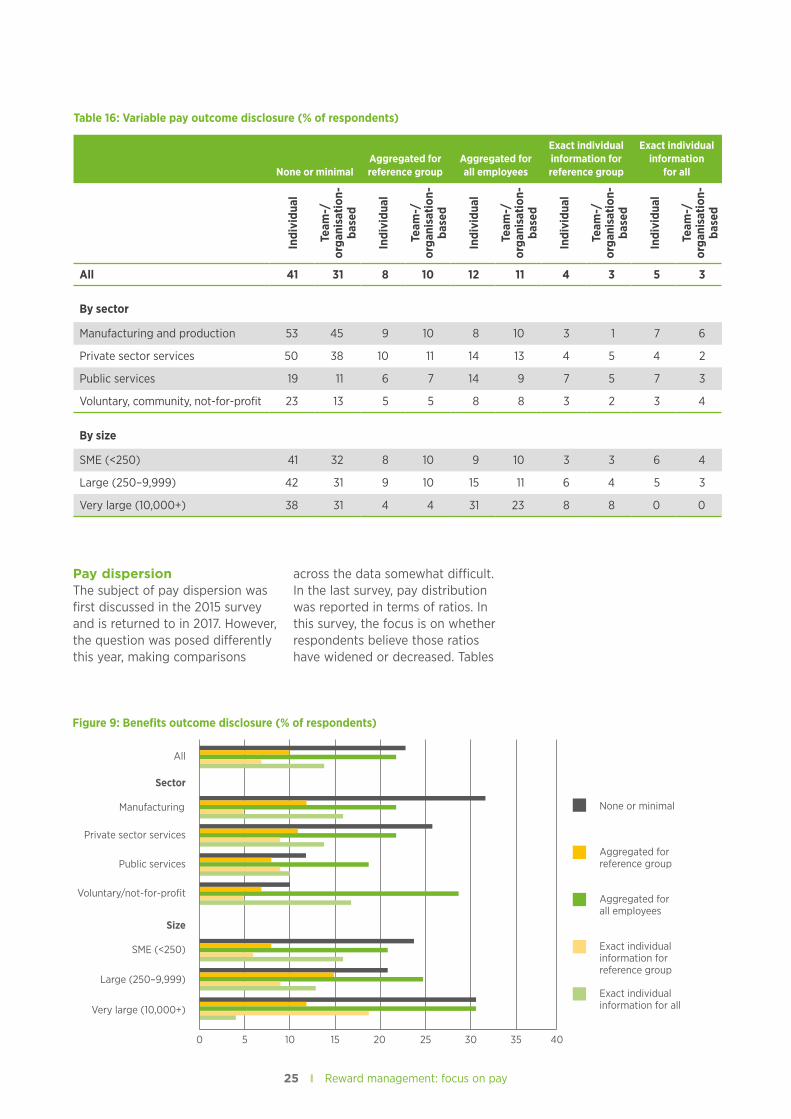
Similar patterns of disclosure and transparency around pay levels were found amongst variable pay and benefits (Table 16 and Figure 9). Slightly more organisations are predisposed towards releasing information related to variable than to base pay, but in general terms the results are in keeping with the above.
Businesses are more open when it comes to releasing details of company benefits than they are in relation to individual and team variable pay awards. Again, the
public and voluntary sectors demonstrate a greater tendency towards transparency and larger sized organisations are more likely to share pay information with their staff.
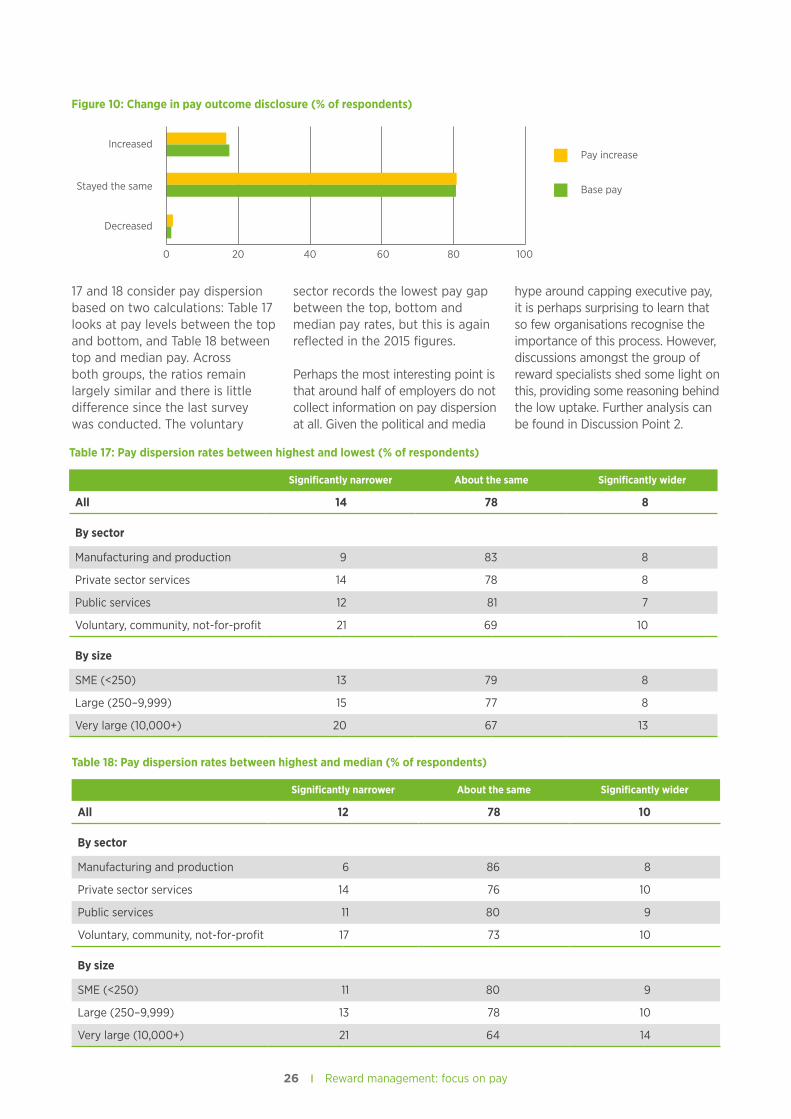
When asked if organisations revealed more or less information to employees about remuneration than they did two years ago, Figure 10 shows that the vast majority indicate that levels of disclosure have stayed the same. However, Figure 10 also shows that more employers have increased their disclosure around pay than have reduced it.
What the 2017 results demonstrate is that, while there has been a shift in how transparent employers are about how pay and benefits are calculated, there has not been as much of a shift in terms of the disclosure of the pay outcomes themselves. Of course, many organisations are required to disclose levels of boardroom pay as part of their annual reporting, but what is clear is that lower down the pay scales, information-sharing is not so commonplace.
Table 15: Pay outcome disclosure (% of respondents)
None or minimalAggregated for reference group
Aggregated for all employees
Exact individual information for reference group
Exact individual information
for all
Basepay
Pay increase
Basepay
Pay increase
Basepay
Pay increase
Basepay
Pay increase
Basepay
Pay increase
All 46 41 14 15 20 24 7 8 13 13
By sector
Manufacturing and production 61 50 9 15 14 18 6 7 9 9
Private sector services 55 50 16 16 16 21 5 6 8 7
Public services 13 17 19 19 31 26 13 13 25 26
Voluntary, community, not-for-profit 33 26 12 9 34 38 5 9 17 17
By size
SME (<250) 50 47 11 10 18 22 7 7 14 13
Large (250–9,999) 40 29 20 25 23 24 7 10 12 12
Very large (10,000+) 35 31 8 12 35 38 12 4 12 15
25 Reward management: focus on pay
Pay dispersionThe subject of pay dispersion was first discussed in the 2015 survey and is returned to in 2017. However, the question was posed differently this year, making comparisons
across the data somewhat difficult. In the last survey, pay distribution was reported in terms of ratios. In this survey, the focus is on whether respondents believe those ratios have widened or decreased. Tables
Table 16: Variable pay outcome disclosure (% of respondents)
None or minimalAggregated for reference group
Aggregated for all employees
Exact individual information for reference group
Exact individual information
for all
Indi
vidu
al
Team
-/or
gani
satio
n-
base
d
Indi
vidu
al
Team
-/or
gani
satio
n-
base
d
Indi
vidu
al
Team
-/or
gani
satio
n-
base
d
Indi
vidu
al
Team
-/or
gani
satio
n-
base
d
Indi
vidu
al
Team
-/or
gani
satio
n-
base
d
All 41 31 8 10 12 11 4 3 5 3
By sector
Manufacturing and production 53 45 9 10 8 10 3 1 7 6
Private sector services 50 38 10 11 14 13 4 5 4 2
Public services 19 11 6 7 14 9 7 5 7 3
Voluntary, community, not-for-profit 23 13 5 5 8 8 3 2 3 4
By size
SME (<250) 41 32 8 10 9 10 3 3 6 4
Large (250–9,999) 42 31 9 10 15 11 6 4 5 3
Very large (10,000+) 38 31 4 4 31 23 8 8 0 0
None or minimal
Aggregated forreference group
Aggregated forall employees
Exact individual information forreference group
Exact individual information for all
Private sector services
Public services
Voluntary/not-for-profit
Manufacturing
Sector
All
Size
SME (<250)
Large (250–9,999)
Very large (10,000+)
0 5 10 15 20 25 30 35 40
Figure 9: Benefits outcome disclosure (% of respondents)
26 Reward management: focus on pay 27 Reward management: focus on pay
17 and 18 consider pay dispersion based on two calculations: Table 17 looks at pay levels between the top and bottom, and Table 18 between top and median pay. Across both groups, the ratios remain largely similar and there is little difference since the last survey was conducted. The voluntary
sector records the lowest pay gap between the top, bottom and median pay rates, but this is again reflected in the 2015 figures.
Perhaps the most interesting point is that around half of employers do not collect information on pay dispersion at all. Given the political and media
hype around capping executive pay, it is perhaps surprising to learn that so few organisations recognise the importance of this process. However, discussions amongst the group of reward specialists shed some light on this, providing some reasoning behind the low uptake. Further analysis can be found in Discussion Point 2.
Pay increase
Base pay
Increased
Stayed the same
Decreased
0 20 40 60 80 100
Figure 10: Change in pay outcome disclosure (% of respondents)
Table 17: Pay dispersion rates between highest and lowest (% of respondents)
Significantly narrower About the same Significantly wider
All 14 78 8
By sector
Manufacturing and production 9 83 8
Private sector services 14 78 8
Public services 12 81 7
Voluntary, community, not-for-profit 21 69 10
By size
SME (<250) 13 79 8
Large (250–9,999) 15 77 8
Very large (10,000+) 20 67 13
Table 18: Pay dispersion rates between highest and median (% of respondents)
Significantly narrower About the same Significantly wider
All 12 78 10
By sector
Manufacturing and production 6 86 8
Private sector services 14 76 10
Public services 11 80 9
Voluntary, community, not-for-profit 17 73 10
By size
SME (<250) 11 80 9
Large (250–9,999) 13 78 10
Very large (10,000+) 21 64 14
27 Reward management: focus on pay
CIPD viewpointAn assessment of FTSE 100 CEO earnings co-produced by the CIPD and the High Pay Centre (Executive Pay: Review of FTSE 100 executive pay packages 2017) shows that rewards at the top have dropped by almost a fifth, but still remain very high. Given the Government’s call for serious action to tackle the problem of perceived excesses in executive pay compared with other categories of employee, if they are to remain credible corporate actors, reward managers need to work with remuneration committees to explore the context they face, the options that are available and the potential consequences of adopting these options. However, for remuneration committees to be able to make informed decisions, they need to rely on data. As this survey demonstrates, too often, organisations don’t have the information needed to be able to assess the opportunities and risks associated with their employees. Hopefully, such transparency and regulatory initiatives as gender pay gap reporting, publishing CEO pay ratios and General Data Protection Regulation requirements will encourage employers not only to invest in their people information systems so that they can capture accurate information, but also to listen to what the data are telling them, some of which may be unexpected.
Discussion point 2: Finding the balance between being ‘externally competitive and internally fair’
The findings show there are varying degrees of transparency across the sectors. From a global perspective, the view from within the group of reward specialists was that where works councils are in place, transparency is better. In the UK, there is judged to be more secrecy around pay and managers are less able to publicly justify their decision-making.
Unsurprisingly, the public sector remains by far the most transparent and this is reflected amongst the panel members. Where public sector organisations are legally required to be open and transparent, this causes no issues, providing policies are followed mechanistically. However, when organisations depart from policies, it can raise the level of complaints and grievances amongst staff members.
Amongst private sector panel members, SMEs are expected to be the least transparent. Not only is there more pressure for much larger firms to communicate both internally and externally, there are better and more sophisticated frameworks in place to do so. However, while there is consensus that businesses should be ‘externally competitive and internally fair’, some reward managers question the purpose and value in providing higher levels of transparency. In the financial services sector, for example, there is a sense that companies are being forced to pay more in response to these policies.
While only half of the organisations that took part in the study indicated that they report on pay dispersion, panel members again raise concerns over the validity of such a crude measuring tool. There are calls for clearer guidelines on what should be reported, as variations in measurement produce different outcomes. For some, it is seen as irrelevant and an unnecessary calculation. Understanding the pay differences between a senior executive and an average worker seems a meaningless exercise. This led to a discussion on the value of work and market rates and whether one role could satisfactorily be compared with another. However, one panel member whose organisation has engaged in measuring pay dispersion believes that calculating pay ratios is a useful mechanism for showing changes over time, rather than absolute amounts. This is an area to watch given the UK Government’s corporate governance announcement regarding pay ratios, in August 2017, as part of a self-declared ‘world-leading package of reforms … to increase boardroom accountability and enhance trust in business’.
28 Reward management: focus on pay 29 Reward management: focus on pay
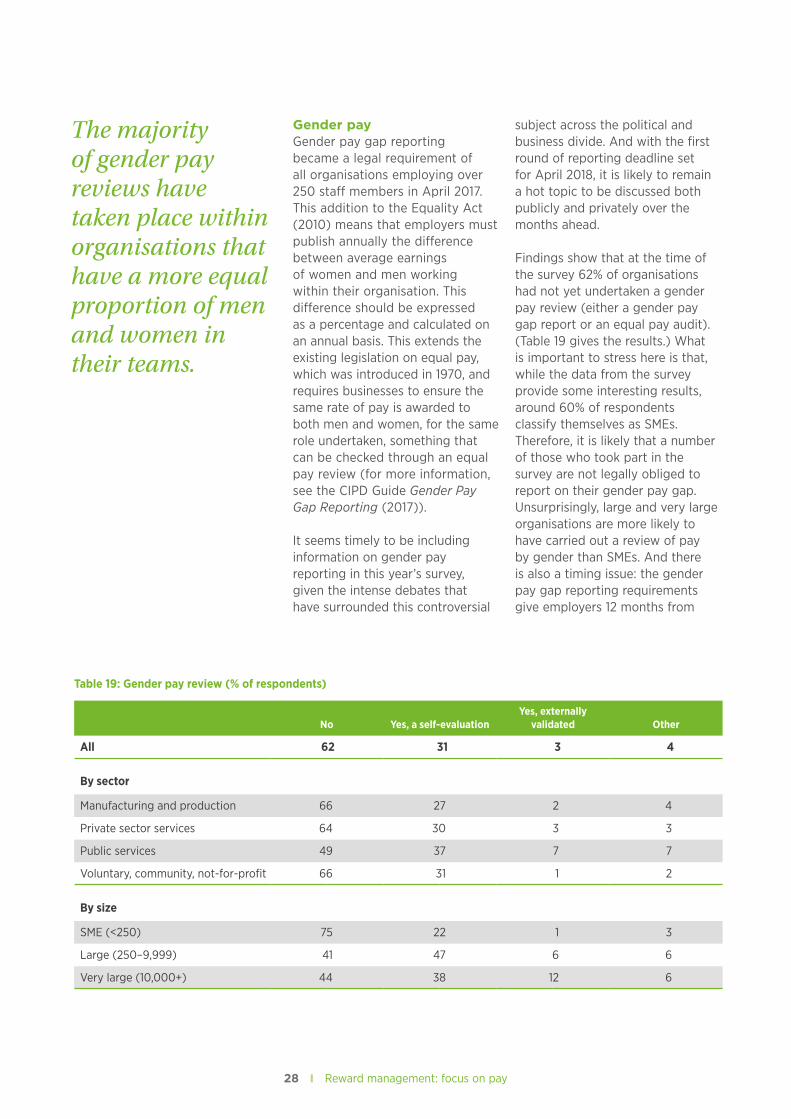
Table 19: Gender pay review (% of respondents)
No Yes, a self-evaluationYes, externally
validated Other
All 62 31 3 4
By sector
Manufacturing and production 66 27 2 4
Private sector services 64 30 3 3
Public services 49 37 7 7
Voluntary, community, not-for-profit 66 31 1 2
By size
SME (<250) 75 22 1 3
Large (250–9,999) 41 47 6 6
Very large (10,000+) 44 38 12 6
Gender payGender pay gap reporting became a legal requirement of all organisations employing over 250 staff members in April 2017. This addition to the Equality Act (2010) means that employers must publish annually the difference between average earnings of women and men working within their organisation. This difference should be expressed as a percentage and calculated on an annual basis. This extends the existing legislation on equal pay, which was introduced in 1970, and requires businesses to ensure the same rate of pay is awarded to both men and women, for the same role undertaken, something that can be checked through an equal pay review (for more information, see the CIPD Guide Gender Pay Gap Reporting (2017)).
It seems timely to be including information on gender pay reporting in this year’s survey, given the intense debates that have surrounded this controversial
subject across the political and business divide. And with the first round of reporting deadline set for April 2018, it is likely to remain a hot topic to be discussed both publicly and privately over the months ahead.
Findings show that at the time of the survey 62% of organisations had not yet undertaken a gender pay review (either a gender pay gap report or an equal pay audit). (Table 19 gives the results.) What is important to stress here is that, while the data from the survey provide some interesting results, around 60% of respondents classify themselves as SMEs. Therefore, it is likely that a number of those who took part in the survey are not legally obliged to report on their gender pay gap. Unsurprisingly, large and very large organisations are more likely to have carried out a review of pay by gender than SMEs. And there is also a timing issue: the gender pay gap reporting requirements give employers 12 months from
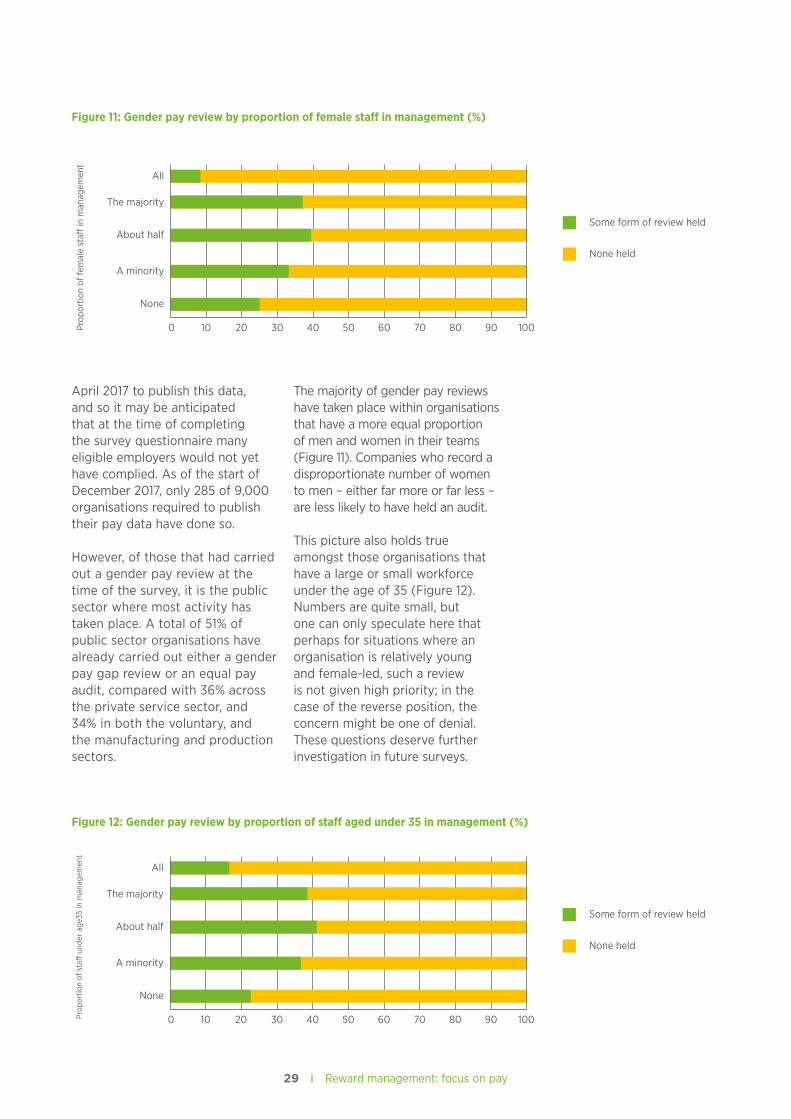
The majority of gender pay reviews have taken place within organisations that have a more equal proportion of men and women in their teams.
29 Reward management: focus on pay
April 2017 to publish this data, and so it may be anticipated that at the time of completing the survey questionnaire many eligible employers would not yet have complied. As of the start of December 2017, only 285 of 9,000 organisations required to publish their pay data have done so.
However, of those that had carried out a gender pay review at the time of the survey, it is the public sector where most activity has taken place. A total of 51% of public sector organisations have already carried out either a gender pay gap review or an equal pay audit, compared with 36% across the private service sector, and 34% in both the voluntary, and the manufacturing and production sectors.
The majority of gender pay reviews have taken place within organisations that have a more equal proportion of men and women in their teams (Figure 11). Companies who record a disproportionate number of women to men – either far more or far less – are less likely to have held an audit.
This picture also holds true amongst those organisations that have a large or small workforce under the age of 35 (Figure 12). Numbers are quite small, but one can only speculate here that perhaps for situations where an organisation is relatively young and female-led, such a review is not given high priority; in the case of the reverse position, the concern might be one of denial. These questions deserve further investigation in future surveys.
None held
Some form of review held
Prop
ortio
n of
fem
ale
sta�
in m
anag
emen
t
All
The majority
About half
A minority
None
0 10 20 30 40 50 60 70 80 90 100
Figure 11: Gender pay review by proportion of female staff in management (%)
None held
Some form of review held
Prop
ortio
n of
sta
� u
nder
age
35 in
man
agem
ent
All
The majority
About half
A minority
None
0 10 20 30 40 50 60 70 80 90 100
Figure 12: Gender pay review by proportion of staff aged under 35 in management (%)
30 Reward management: focus on pay 31 Reward management: focus on pay
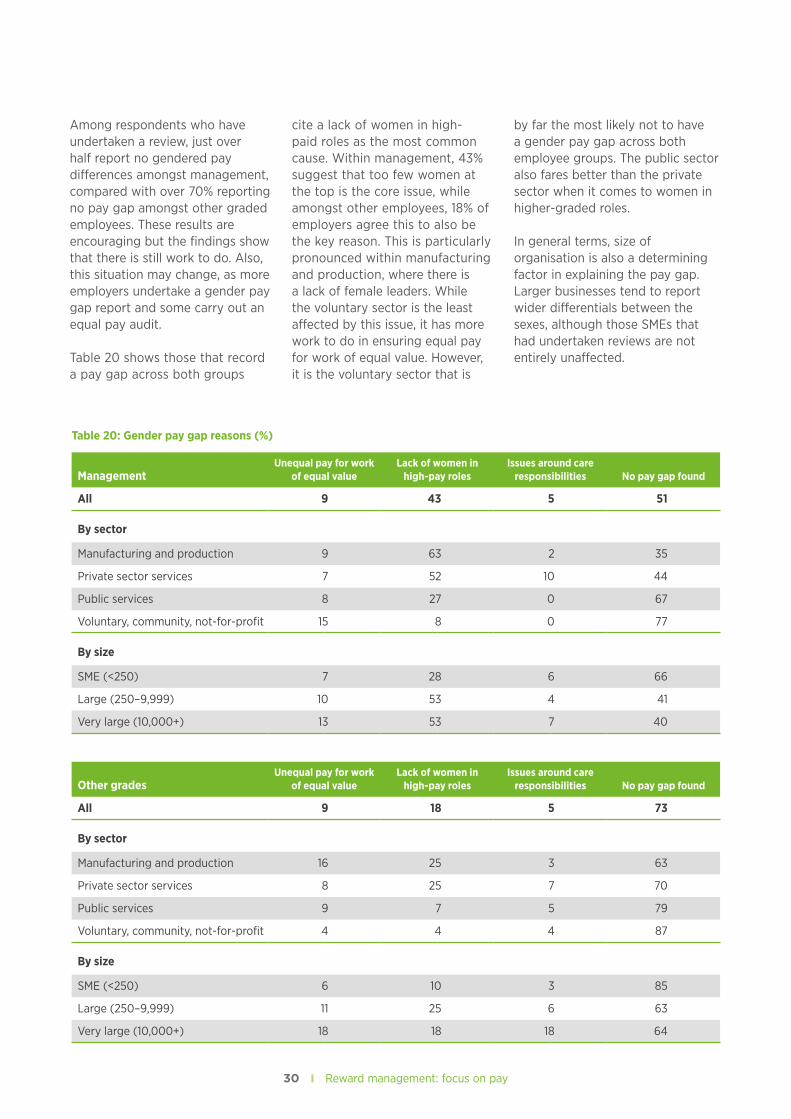
Among respondents who have undertaken a review, just over half report no gendered pay differences amongst management, compared with over 70% reporting no pay gap amongst other graded employees. These results are encouraging but the findings show that there is still work to do. Also, this situation may change, as more employers undertake a gender pay gap report and some carry out an equal pay audit.
Table 20 shows those that record a pay gap across both groups
cite a lack of women in high-paid roles as the most common cause. Within management, 43% suggest that too few women at the top is the core issue, while amongst other employees, 18% of employers agree this to also be the key reason. This is particularly pronounced within manufacturing and production, where there is a lack of female leaders. While the voluntary sector is the least affected by this issue, it has more work to do in ensuring equal pay for work of equal value. However, it is the voluntary sector that is
by far the most likely not to have a gender pay gap across both employee groups. The public sector also fares better than the private sector when it comes to women in higher-graded roles.
In general terms, size of organisation is also a determining factor in explaining the pay gap. Larger businesses tend to report wider differentials between the sexes, although those SMEs that had undertaken reviews are not entirely unaffected.
Table 20: Gender pay gap reasons (%)
Management Unequal pay for work
of equal valueLack of women in
high-pay rolesIssues around care
responsibilities No pay gap found
All 9 43 5 51
By sector
Manufacturing and production 9 63 2 35
Private sector services 7 52 10 44
Public services 8 27 0 67
Voluntary, community, not-for-profit 15 8 0 77
By size
SME (<250) 7 28 6 66
Large (250–9,999) 10 53 4 41
Very large (10,000+) 13 53 7 40
Other gradesUnequal pay for work
of equal valueLack of women in
high-pay rolesIssues around care
responsibilities No pay gap found
All 9 18 5 73
By sector
Manufacturing and production 16 25 3 63
Private sector services 8 25 7 70
Public services 9 7 5 79
Voluntary, community, not-for-profit 4 4 4 87
By size
SME (<250) 6 10 3 85
Large (250–9,999) 11 25 6 63
Very large (10,000+) 18 18 18 64
31 Reward management: focus on pay
Of particular interest is the low level of respondents who cite care responsibilities (child and/or elder care) as the reason behind gender pay differences. One might have predicted that this would feature more prominently, but overall, this makes up only 5% of the issue across both employee groups. Instead, the findings overwhelmingly show that, where there is a pay gap, it is the lack of female representation at the top that provides the explanation. Of course, the reason as to why there are not more females in high-paying roles, in part, may be due to inadequacies in the way employers accommodate the needs of those with care responsibilities. For organisations and policy-makers this suggests that attention should be given to structural factors and succession planning.
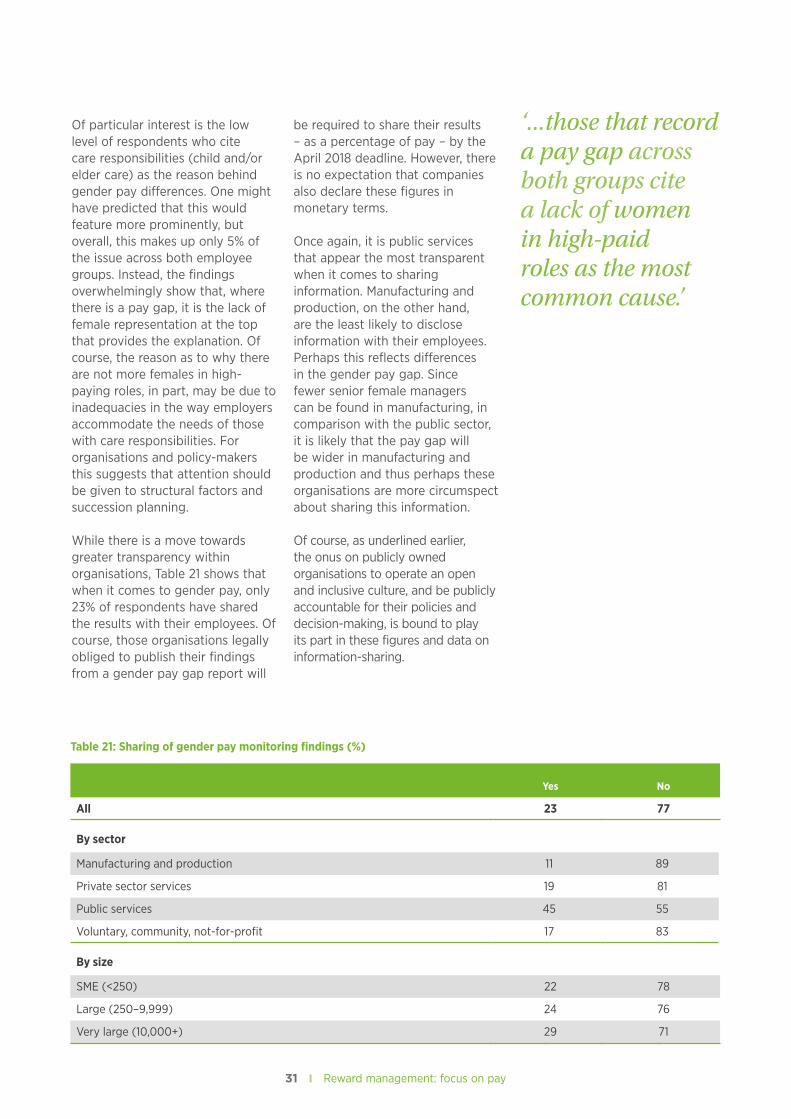
While there is a move towards greater transparency within organisations, Table 21 shows that when it comes to gender pay, only 23% of respondents have shared the results with their employees. Of course, those organisations legally obliged to publish their findings from a gender pay gap report will
be required to share their results – as a percentage of pay – by the April 2018 deadline. However, there is no expectation that companies also declare these figures in monetary terms.
Once again, it is public services that appear the most transparent when it comes to sharing information. Manufacturing and production, on the other hand, are the least likely to disclose information with their employees. Perhaps this reflects differences in the gender pay gap. Since fewer senior female managers can be found in manufacturing, in comparison with the public sector, it is likely that the pay gap will be wider in manufacturing and production and thus perhaps these organisations are more circumspect about sharing this information.
Of course, as underlined earlier, the onus on publicly owned organisations to operate an open and inclusive culture, and be publicly accountable for their policies and decision-making, is bound to play its part in these figures and data on information-sharing.
Table 21: Sharing of gender pay monitoring findings (%)
Yes No
All 23 77
By sector
Manufacturing and production 11 89
Private sector services 19 81
Public services 45 55
Voluntary, community, not-for-profit 17 83
By size
SME (<250) 22 78
Large (250–9,999) 24 76
Very large (10,000+) 29 71
‘...those that record a pay gap across both groups cite a lack of women in high-paid roles as the most common cause.’
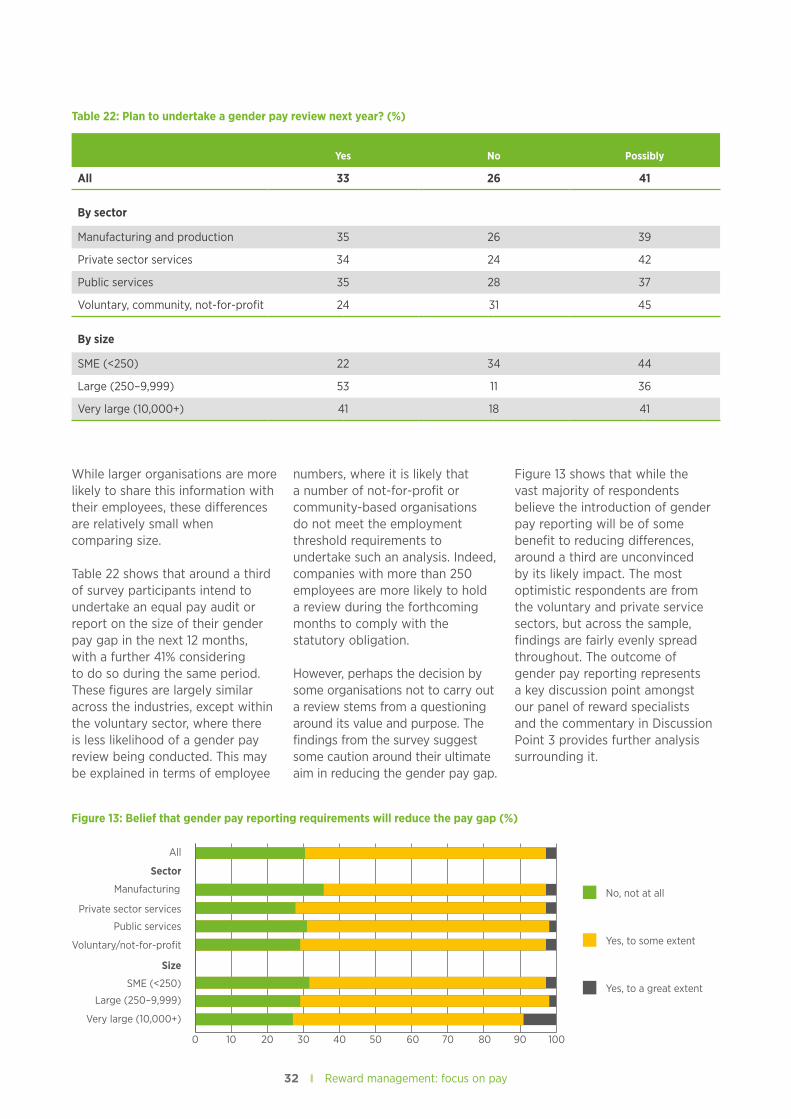
32 Reward management: focus on pay 33 Reward management: focus on pay
While larger organisations are more likely to share this information with their employees, these differences are relatively small when comparing size.
Table 22 shows that around a third of survey participants intend to undertake an equal pay audit or report on the size of their gender pay gap in the next 12 months, with a further 41% considering to do so during the same period. These figures are largely similar across the industries, except within the voluntary sector, where there is less likelihood of a gender pay review being conducted. This may be explained in terms of employee
numbers, where it is likely that a number of not-for-profit or community-based organisations do not meet the employment threshold requirements to undertake such an analysis. Indeed, companies with more than 250 employees are more likely to hold a review during the forthcoming months to comply with the statutory obligation.
However, perhaps the decision by some organisations not to carry out a review stems from a questioning around its value and purpose. The findings from the survey suggest some caution around their ultimate aim in reducing the gender pay gap.
Figure 13 shows that while the vast majority of respondents believe the introduction of gender pay reporting will be of some benefit to reducing differences, around a third are unconvinced by its likely impact. The most optimistic respondents are from the voluntary and private service sectors, but across the sample, findings are fairly evenly spread throughout. The outcome of gender pay reporting represents a key discussion point amongst our panel of reward specialists and the commentary in Discussion Point 3 provides further analysis surrounding it.
Table 22: Plan to undertake a gender pay review next year? (%)
Yes No Possibly
All 33 26 41
By sector
Manufacturing and production 35 26 39
Private sector services 34 24 42
Public services 35 28 37
Voluntary, community, not-for-profit 24 31 45
By size
SME (<250) 22 34 44
Large (250–9,999) 53 11 36
Very large (10,000+) 41 18 41
No, not at all
Yes, to some extent
Yes, to a great extent
Private sector services
Public services
Voluntary/not-for-profit
Manufacturing
Sector
All
Size
SME (<250)
Large (250–9,999)
Very large (10,000+)
0 10 20 30 40 50 60 70 80 90 100
Figure 13: Belief that gender pay reporting requirements will reduce the pay gap (%)
33 Reward management: focus on pay
CIPD viewpointFairness, inclusion and equal opportunity are at the heart of good work. Create a fair and inclusive workplace where employees have the opportunity to perform and this should flow through into higher employee motivation and performance. Gender pay gap reporting is an important way for employers to explore what their data are telling them and to explore the findings to see what actions they can reasonably take to reduce the gap to benefit themselves and their employees – for example, bringing in flexible working or reviewing the factors and weighting used in their job evaluation scheme. While many causes of the gender pay gap exist outside the workplace, organisations are not passive agents. For instance, they can lobby for improved career guidance and for more affordable, more available high-quality childcare, as well as volunteering to give talks at their local schools to challenge stereotypes about what’s considered men’s or women’s work. Similarly, carrying out an equal pay audit should help the organisation discover whether pay reflects corporate performance and rewards employee contribution, or reflects, unwittingly, prejudice and bias.
Discussion point 3: Gender pay gap – ‘casting a light into dark corners’
The survey highlights that the majority of respondents believe the introduction of gender pay gap reporting will bring about a change in the way organisations manage pay. Among the panel, there is hope that it is ‘a useful way of casting a light into dark corners of reward outcomes’, but it should not be used as a stick with which to beat organisations. By raising awareness of the gender pay gap, it is anticipated that more will be done to ensure women fill senior roles in the future – although they think that it is society at large that plays the most pivotal role in determining career choices for young women.
During the discussions the concept of relative work ‘value’ was explored. One panel member described how ‘soft’ skills – historically associated with female labour – are now as critical as the technical skills – normally regarded the domain of male colleagues – in determining job content and success. This means that the value of ‘soft’ skills is now increasing in reward terms and those who bring expertise in communication, team-building and development are moving up and commanding a higher pay rate.
There was also debate within the group on the need to broaden gender pay gap reporting to include race and age. However, there is a sense that there is still much work to be done to ensure the gender pay gap is accurately audited. Most organisations represented at the table are aiming to publish their findings in late 2017, offering some acknowledgement that some significant pay differences exist and the importance of getting the narrative right. How this information is managed and communicated to the wider public is also up for scrutiny and debate. In some cases, a co-ordinated effort is under way to ensure similar organisations publish their findings simultaneously to limit press intrusion and the singling out of individual organisations.
34 Reward management: focus on pay 35 Reward management: focus on pay
The relationship between pay and performance has had a long and established association within organisations across the UK. For some, pay and performance has been the fabric of their reward strategies upon which the employment relationship has been built. In this section, we focus on this relationship and whether patterns and trends are changing.
There has been much debate since the last reward survey was conducted over the role that performance reviews play in determining both base and variable pay; for example, an article in the October 2016 Harvard Business Review makes reference to a ‘revolution’ in an era marked by low inflation and restricted merit pay budgets. Calls to loosen the link between pay and performance have gathered momentum, downplaying transactional reward-facing approaches. Some employers have even abandoned performance appraisals altogether. The findings from the survey shed some light on these themes and explanations are drawn from the data.
Assessing performance The range of methods used to assess employee performance and how these are linked to remuneration are recorded within the survey data. Respondents were invited to list all methods in practice within their organisation and indicate how these were related to decisions around salary increase and/or other reward decisions (such as bonuses). Table 23 illustrates the types
of assessment in use and their relationship to remuneration. Overall, the data show that there is a greater tendency for organisations to link a performance assessment to salary rises (either solely or linked to both pay and other reward decisions) than to other reward decisions (either solely or linked to both salary rise and other reward decisions).
Table 23 shows that individual assessment is more commonly used in reward decision-making across the sectors. In terms of assessing performance against individual or team goals, 53% of organisations link individual assessments to reward, compared with 31% who use team-assessed performance measures. While 38% of respondents choose not to use team-oriented performance assessments at all, only 9% choose not to implement individual performance mechanisms whether or not feeding into reward decisions. Organisations are more likely to use individual rather than team-related reward assessments and this is most prevalent when determining salaries compared with determining other rewards.
When arriving at reward decisions, the use of team goals when assessing performance can be problematic. Basing individual remuneration on the achievements of the many can be difficult, and this may explain why this approach is not as popular as individual goal performance. However, team assessments sometimes form one aspect of a more complex range of measures, when reviewing base
3 Pay and performance
‘Organisations are more likely to use individual rather than team-related reward assessments.’
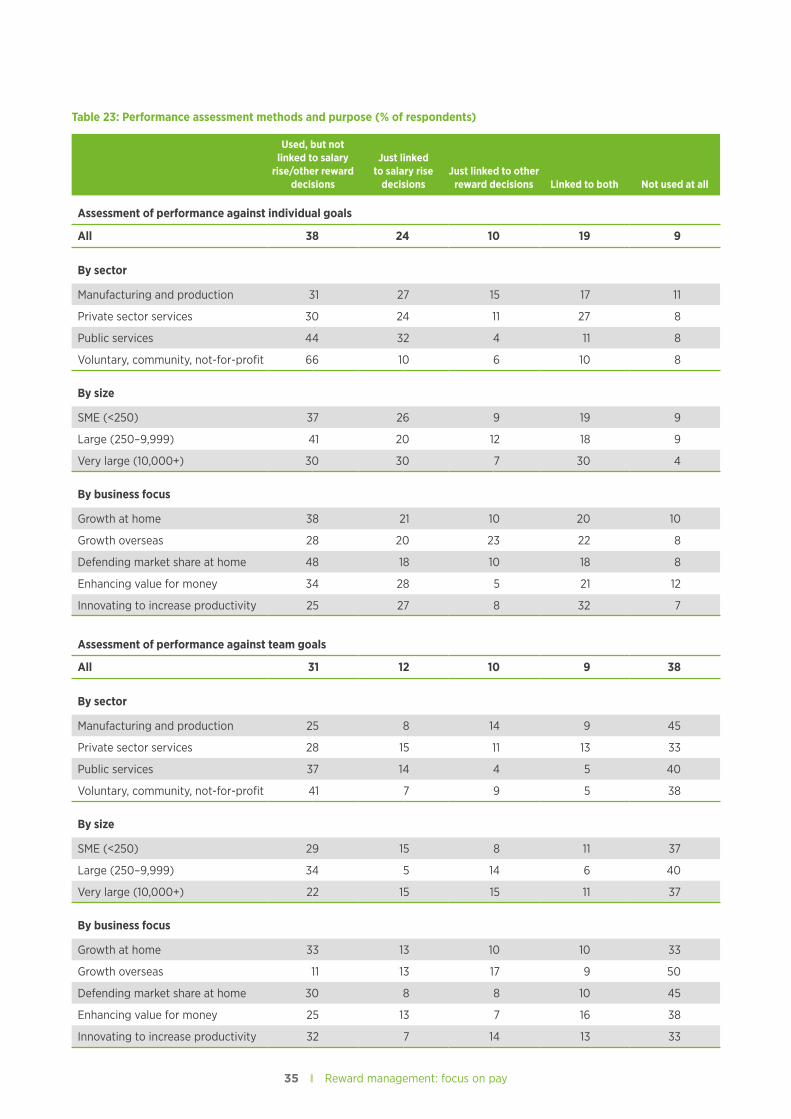
35 Reward management: focus on pay
Table 23: Performance assessment methods and purpose (% of respondents)
Used, but not linked to salary
rise/other reward decisions
Just linked to salary rise
decisionsJust linked to other
reward decisions Linked to both Not used at all
Assessment of performance against individual goals
All 38 24 10 19 9
By sector
Manufacturing and production 31 27 15 17 11
Private sector services 30 24 11 27 8
Public services 44 32 4 11 8
Voluntary, community, not-for-profit 66 10 6 10 8
By size
SME (<250) 37 26 9 19 9
Large (250–9,999) 41 20 12 18 9
Very large (10,000+) 30 30 7 30 4
By business focus
Growth at home 38 21 10 20 10
Growth overseas 28 20 23 22 8
Defending market share at home 48 18 10 18 8
Enhancing value for money 34 28 5 21 12
Innovating to increase productivity 25 27 8 32 7
Assessment of performance against team goals
All 31 12 10 9 38
By sector
Manufacturing and production 25 8 14 9 45
Private sector services 28 15 11 13 33
Public services 37 14 4 5 40
Voluntary, community, not-for-profit 41 7 9 5 38
By size
SME (<250) 29 15 8 11 37
Large (250–9,999) 34 5 14 6 40
Very large (10,000+) 22 15 15 11 37
By business focus
Growth at home 33 13 10 10 33
Growth overseas 11 13 17 9 50
Defending market share at home 30 8 8 10 45
Enhancing value for money 25 13 7 16 38
Innovating to increase productivity 32 7 14 13 33
36 Reward management: focus on pay 37 Reward management: focus on pay
pay and other forms of reward, and the findings show that, while the public and voluntary sectors are more likely to implement team goal assessments, these are not necessarily linked to salary or reward outcomes.
However, employers need individuals to work in teams. Knowledge, innovation and service-based work increasingly requires employees to work co-operatively. Therefore, remuneration linked to an assessment of performance against the achievement of collective goals may increase in popularity over time as our economy evolves, if we assume that this is an appropriate way of rewarding employee collaboration.
In relation to sector, voluntary sector employers are least likely to use either method when making salary and/or other reward decisions, while private sector service organisations are most likely to use assessments of individual and collective performance.
The strategic focus of an organisation can also play its part in determining the use and linking of performance measures to reward practices. The findings show that individual assessment is most likely to take place within organisations that are ‘defending market share at home’. However, this is not linked to pay and other reward decisions. Respondents most likely to link salary and/or other reward decisions (67%) to individual performance are those who are focused on ‘innovating to increase productivity’, while those less likely to do this (46%) are focused on ‘defending market share at home’. By contrast, those linking salary and/or other reward decisions to an assessment of collective performance are most likely to be (39%) those employers
adopting a business strategy focused on ‘growth overseas’, while those ‘defending market share at home’ are less likely (26%) to do it.
By size of organisation, very large organisations tend to use individual performance assessments more frequently and are most likely to link them to salary and/or other reward decisions (67%). When it comes to team assessment, both SMEs and very large respondents are most likely to use this approach, though very large employers are most likely (41%) to link this to decisions regarding salary and/or other reward decisions.
In comparison with the other individual performance measures discussed above, the use of ratings based on an absolute view of an individual’s performance, or their performance relative to peers, is less common, with 42% choosing not to use ratings for individuals, while 61% do not include ratings based on performance relative to peers (Table 24). Interestingly, while 59% use an absolute approach, they are more likely to be linked to salary and/or other reward decisions (39%) than team goals, where 62% use them but only 31% link them to salary and/or other reward decisions.
The findings are more nuanced when it comes to size of organisation. Very large organisations are more likely (48%) to consider ratings as part of their reward and salary package, in comparison with other sized businesses. The choice of business strategy seems not to play an obvious role in determining the use of method and whether it is or is not linked to pay and reward. Those whose focus is primarily on ‘innovating to increase productivity’ are more likely to base salary and/or other reward decisions on an absolute view of an individual’s performance (53%), while those
‘The strategic focus of an organisation can also play its part in determining the use and linking of performance measures to reward practices.’
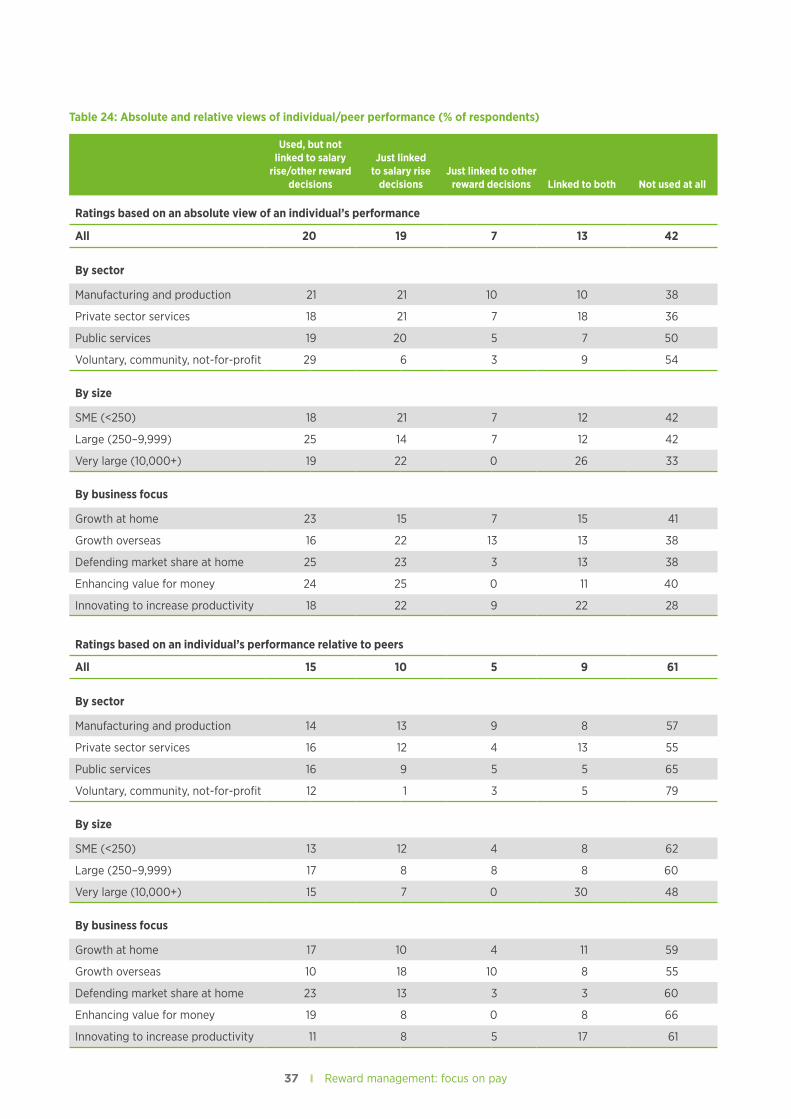
37 Reward management: focus on pay
Table 24: Absolute and relative views of individual/peer performance (% of respondents)
Used, but not linked to salary
rise/other reward decisions
Just linked to salary rise
decisionsJust linked to other
reward decisions Linked to both Not used at all
Ratings based on an absolute view of an individual’s performance
All 20 19 7 13 42
By sector
Manufacturing and production 21 21 10 10 38
Private sector services 18 21 7 18 36
Public services 19 20 5 7 50
Voluntary, community, not-for-profit 29 6 3 9 54
By size
SME (<250) 18 21 7 12 42
Large (250–9,999) 25 14 7 12 42
Very large (10,000+) 19 22 0 26 33
By business focus
Growth at home 23 15 7 15 41
Growth overseas 16 22 13 13 38
Defending market share at home 25 23 3 13 38
Enhancing value for money 24 25 0 11 40
Innovating to increase productivity 18 22 9 22 28
Ratings based on an individual’s performance relative to peers
All 15 10 5 9 61
By sector
Manufacturing and production 14 13 9 8 57
Private sector services 16 12 4 13 55
Public services 16 9 5 5 65
Voluntary, community, not-for-profit 12 1 3 5 79
By size
SME (<250) 13 12 4 8 62
Large (250–9,999) 17 8 8 8 60
Very large (10,000+) 15 7 0 30 48
By business focus
Growth at home 17 10 4 11 59
Growth overseas 10 18 10 8 55
Defending market share at home 23 13 3 3 60
Enhancing value for money 19 8 0 8 66
Innovating to increase productivity 11 8 5 17 61
38 Reward management: focus on pay 39 Reward management: focus on pay
with an approach focused on ‘growth overseas’ are most likely (30%) to base salary and/or other reward decisions on an individual’s performance relative to their peers. Our findings illustrate either a move away from ‘rank and yank’ practices and towards more sophisticated mechanisms of performance review used to help determine salaries and other reward decision-making, or that formally assessing a person’s performance in comparison with their peers was never widespread in the first place.
When it comes to assessing the take-up of what can be regarded as less traditional methods of assessing employees’ performance, Table 25 shows that their use is limited. Just 24% use peer assessment, while 27% have adopted 360-degree assessments. By contrast, 91% of respondents assess employee performance against individual goals.
Public and private sector services are most likely to use peer and 360-degree assessments as part of their performance review; however, in relative terms, a marginal number choose to link these methods to salary and/or other reward decisions. These performance measures are more commonly found within larger organisations, but it is only very large organisations that link them to both salary and/or other reward decisions.
From a strategic perspective, organisations that cite ‘innovating to increase productivity’ and ‘growth overseas’ as the key business objective are more inclined to link peer assessment to salary and/or other reward decisions. When it comes to 360-degree assessments, again it is those who are ‘innovating to increase productivity’ who are more likely to link it to salary and/or other reward decisions.
Given the level of attention 360-degree performance measures and peer reviews have received in published commentary, particularly in team environments, it is somewhat surprising to learn that they are less commonly used in practice. The time and the financial cost required to undertake 360-degree reviews clearly has some bearing on their usage and it is therefore to be anticipated that only large organisations can afford to implement them.
While 50% of organisations use self-assessment as part of their performance review process, 30% assess their employees via external assessors (Table 26, page 40). However, these measures play a much lesser role when it comes to determining remuneration, with just 15% of those who use self-assessment linking it to any kind of reward decision, while only 9% link pay or other reward outcomes to external assessment.
The voluntary sector is most likely to use self-assessment but not link this to remuneration. In contrast, within very large organisations, self-assessment linked to salary and/or reward decisions, is most common.
Those who cite ‘defending market share at home’ are most likely to use self-assessment, while those focused on ‘growth at home’ are most likely to use external assessment. However, those ‘innovating to increase productivity’ are most likely to link self-assessment and external assessment to remuneration decisions.
Overall, while both methods are relatively popular, on the whole they are less likely to be used to influence reward decisions.
‘Given the level of attention 360-degree performance measures and peer reviews have received in published commentary, particularly in team environments, it is somewhat surprising to learn that they are less commonly used in practice.’
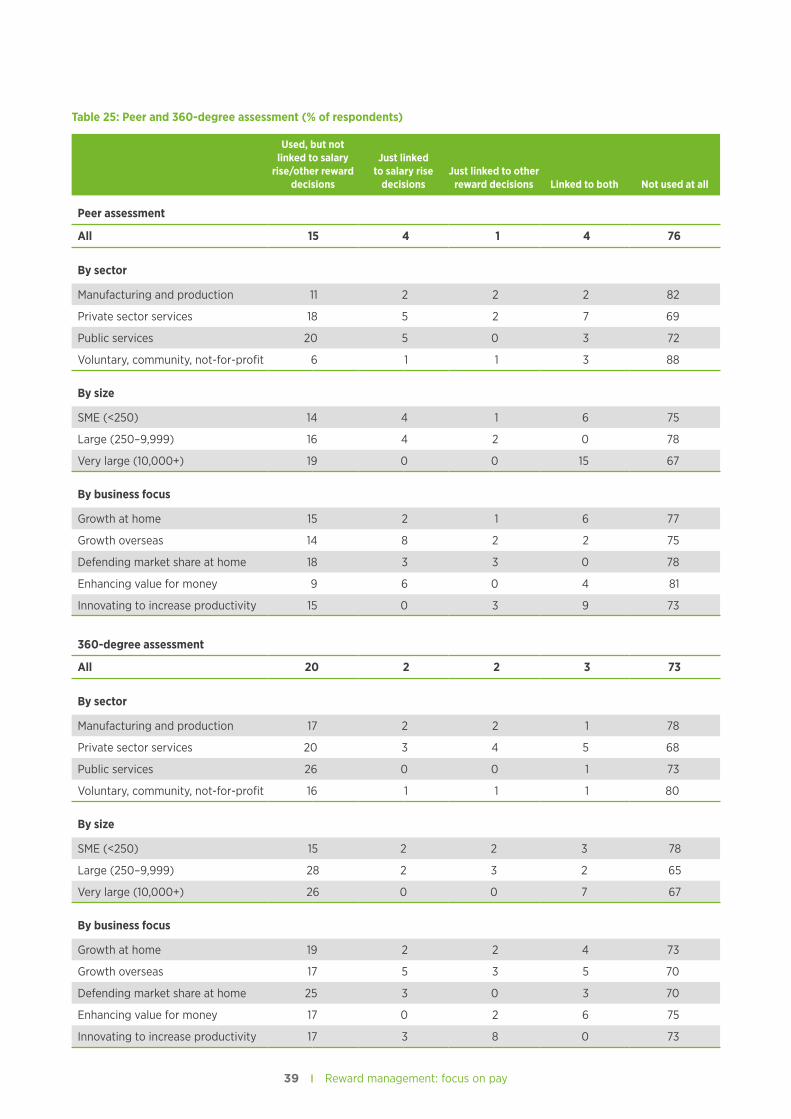
39 Reward management: focus on pay
Table 25: Peer and 360-degree assessment (% of respondents)
Used, but not linked to salary
rise/other reward decisions
Just linked to salary rise
decisionsJust linked to other
reward decisions Linked to both Not used at all
Peer assessment
All 15 4 1 4 76
By sector
Manufacturing and production 11 2 2 2 82
Private sector services 18 5 2 7 69
Public services 20 5 0 3 72
Voluntary, community, not-for-profit 6 1 1 3 88
By size
SME (<250) 14 4 1 6 75
Large (250–9,999) 16 4 2 0 78
Very large (10,000+) 19 0 0 15 67
By business focus
Growth at home 15 2 1 6 77
Growth overseas 14 8 2 2 75
Defending market share at home 18 3 3 0 78
Enhancing value for money 9 6 0 4 81
Innovating to increase productivity 15 0 3 9 73
360-degree assessment
All 20 2 2 3 73
By sector
Manufacturing and production 17 2 2 1 78
Private sector services 20 3 4 5 68
Public services 26 0 0 1 73
Voluntary, community, not-for-profit 16 1 1 1 80
By size
SME (<250) 15 2 2 3 78
Large (250–9,999) 28 2 3 2 65
Very large (10,000+) 26 0 0 7 67
By business focus
Growth at home 19 2 2 4 73
Growth overseas 17 5 3 5 70
Defending market share at home 25 3 0 3 70
Enhancing value for money 17 0 2 6 75
Innovating to increase productivity 17 3 8 0 73
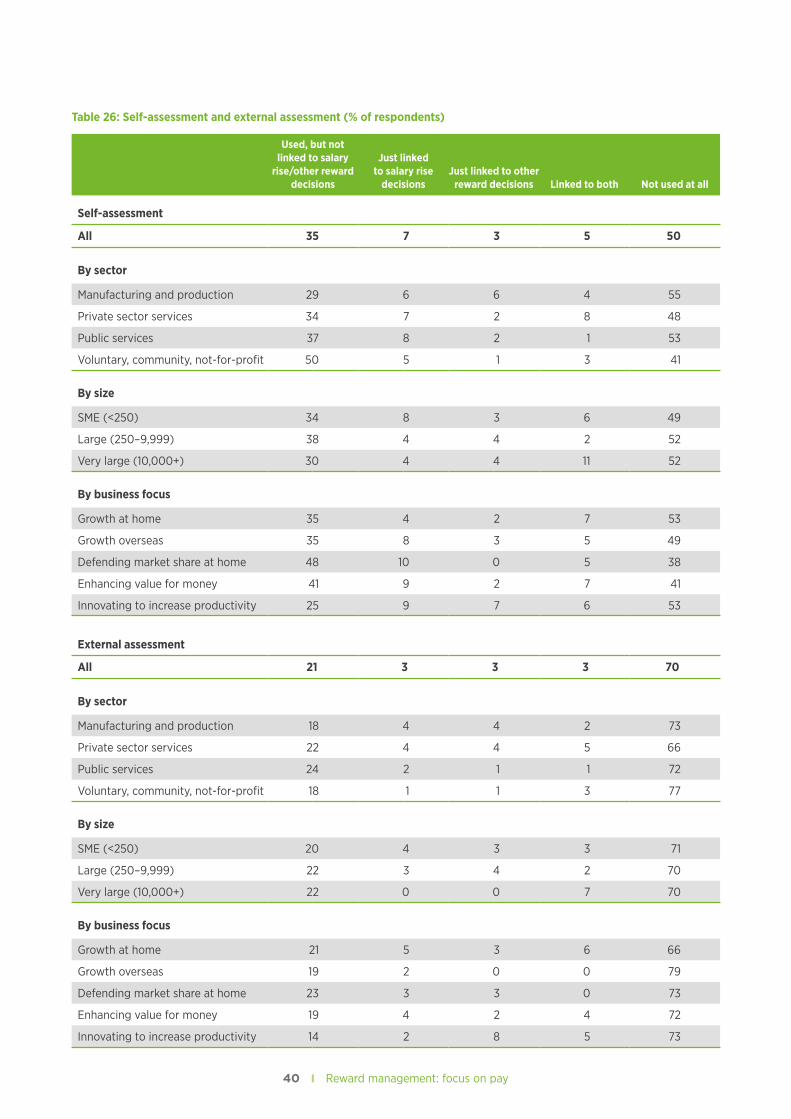
40 Reward management: focus on pay 41 Reward management: focus on pay
Table 26: Self-assessment and external assessment (% of respondents)
Used, but not linked to salary
rise/other reward decisions
Just linked to salary rise
decisionsJust linked to other
reward decisions Linked to both Not used at all
Self-assessment
All 35 7 3 5 50
By sector
Manufacturing and production 29 6 6 4 55
Private sector services 34 7 2 8 48
Public services 37 8 2 1 53
Voluntary, community, not-for-profit 50 5 1 3 41
By size
SME (<250) 34 8 3 6 49
Large (250–9,999) 38 4 4 2 52
Very large (10,000+) 30 4 4 11 52
By business focus
Growth at home 35 4 2 7 53
Growth overseas 35 8 3 5 49
Defending market share at home 48 10 0 5 38
Enhancing value for money 41 9 2 7 41
Innovating to increase productivity 25 9 7 6 53
External assessment
All 21 3 3 3 70
By sector
Manufacturing and production 18 4 4 2 73
Private sector services 22 4 4 5 66
Public services 24 2 1 1 72
Voluntary, community, not-for-profit 18 1 1 3 77
By size
SME (<250) 20 4 3 3 71
Large (250–9,999) 22 3 4 2 70
Very large (10,000+) 22 0 0 7 70
By business focus
Growth at home 21 5 3 6 66
Growth overseas 19 2 0 0 79
Defending market share at home 23 3 3 0 73
Enhancing value for money 19 4 2 4 72
Innovating to increase productivity 14 2 8 5 73
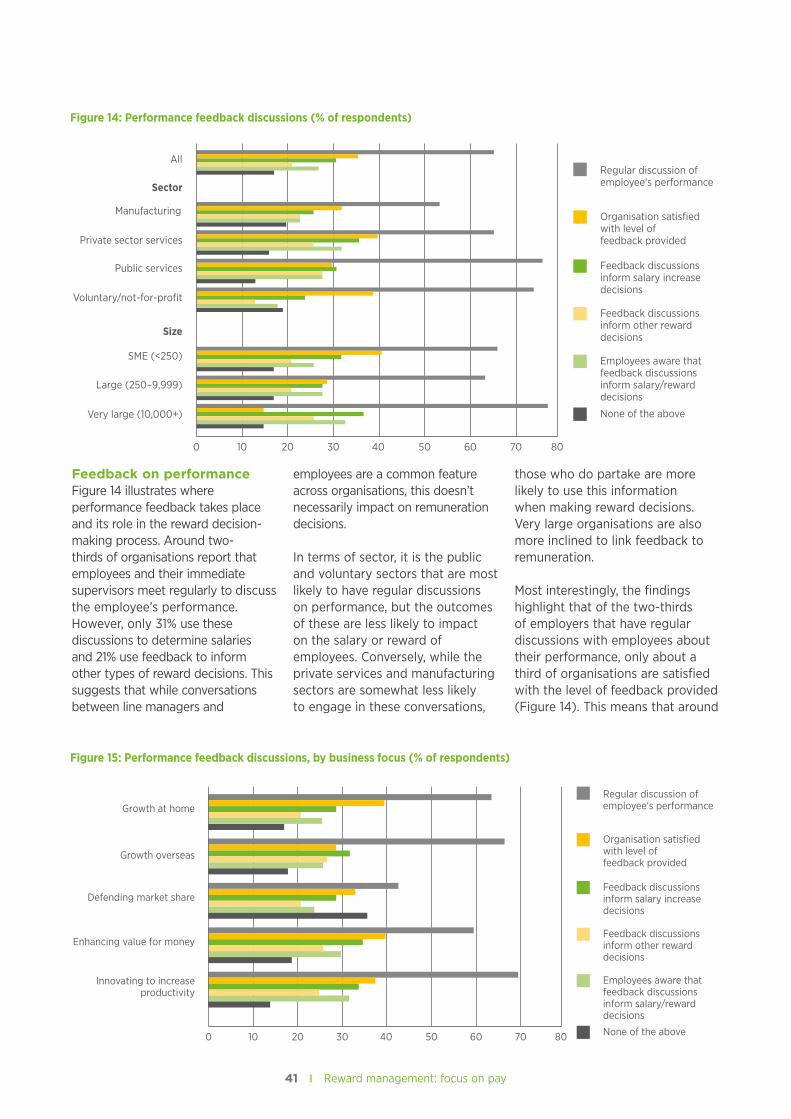
41 Reward management: focus on pay
Feedback on performance Figure 14 illustrates where performance feedback takes place and its role in the reward decision-making process. Around two-thirds of organisations report that employees and their immediate supervisors meet regularly to discuss the employee’s performance. However, only 31% use these discussions to determine salaries and 21% use feedback to inform other types of reward decisions. This suggests that while conversations between line managers and
employees are a common feature across organisations, this doesn’t necessarily impact on remuneration decisions.
In terms of sector, it is the public and voluntary sectors that are most likely to have regular discussions on performance, but the outcomes of these are less likely to impact on the salary or reward of employees. Conversely, while the private services and manufacturing sectors are somewhat less likely to engage in these conversations,
those who do partake are more likely to use this information when making reward decisions. Very large organisations are also more inclined to link feedback to remuneration.
Most interestingly, the findings highlight that of the two-thirds of employers that have regular discussions with employees about their performance, only about a third of organisations are satisfied with the level of feedback provided (Figure 14). This means that around
Regular discussion of employee's performance
Organisation satisfied with level of feedback provided
Feedback discussions inform salary increase decisions
Feedback discussions inform other reward decisions
Employees aware that feedback discussions inform salary/reward decisions
None of the above
Private sector services
Public services
Voluntary/not-for-profit
Manufacturing
Sector
All
Size
SME (<250)
Large (250–9,999)
Very large (10,000+)
0 10 20 30 40 50 60 70 80
Regular discussion of employee's performance
Organisation satisfied with level of feedback provided
Feedback discussions inform salary increase decisions
Feedback discussions inform other reward decisions
Employees aware that feedback discussions inform salary/reward decisions
None of the above
Growth at home
Growth overseas
Defending market share
Enhancing value for money
Innovating to increase productivity
0 10 20 30 40 50 60 70 80
Figure 14: Performance feedback discussions (% of respondents)
Figure 15: Performance feedback discussions, by business focus (% of respondents)
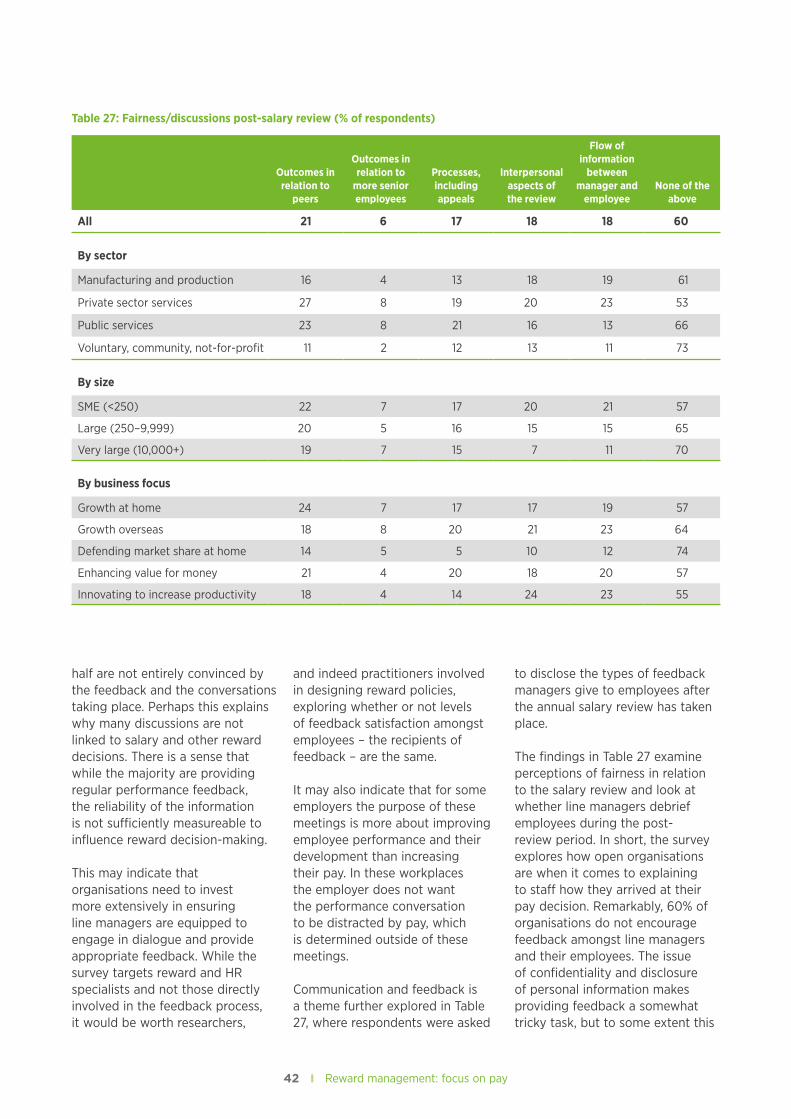
42 Reward management: focus on pay 43 Reward management: focus on pay
half are not entirely convinced by the feedback and the conversations taking place. Perhaps this explains why many discussions are not linked to salary and other reward decisions. There is a sense that while the majority are providing regular performance feedback, the reliability of the information is not sufficiently measureable to influence reward decision-making.
This may indicate that organisations need to invest more extensively in ensuring line managers are equipped to engage in dialogue and provide appropriate feedback. While the survey targets reward and HR specialists and not those directly involved in the feedback process, it would be worth researchers,
and indeed practitioners involved in designing reward policies, exploring whether or not levels of feedback satisfaction amongst employees – the recipients of feedback – are the same.
It may also indicate that for some employers the purpose of these meetings is more about improving employee performance and their development than increasing their pay. In these workplaces the employer does not want the performance conversation to be distracted by pay, which is determined outside of these meetings.
Communication and feedback is a theme further explored in Table 27, where respondents were asked
to disclose the types of feedback managers give to employees after the annual salary review has taken place.
The findings in Table 27 examine perceptions of fairness in relation to the salary review and look at whether line managers debrief employees during the post-review period. In short, the survey explores how open organisations are when it comes to explaining to staff how they arrived at their pay decision. Remarkably, 60% of organisations do not encourage feedback amongst line managers and their employees. The issue of confidentiality and disclosure of personal information makes providing feedback a somewhat tricky task, but to some extent this
Table 27: Fairness/discussions post-salary review (% of respondents)
Outcomes in relation to
peers
Outcomes in relation to
more senior employees
Processes, including appeals
Interpersonal aspects of the review
Flow of information
between manager and
employeeNone of the
above
All 21 6 17 18 18 60
By sector
Manufacturing and production 16 4 13 18 19 61
Private sector services 27 8 19 20 23 53
Public services 23 8 21 16 13 66
Voluntary, community, not-for-profit 11 2 12 13 11 73
By size
SME (<250) 22 7 17 20 21 57
Large (250–9,999) 20 5 16 15 15 65
Very large (10,000+) 19 7 15 7 11 70
By business focus
Growth at home 24 7 17 17 19 57
Growth overseas 18 8 20 21 23 64
Defending market share at home 14 5 5 10 12 74
Enhancing value for money 21 4 20 18 20 57
Innovating to increase productivity 18 4 14 24 23 55
43 Reward management: focus on pay
ties in with the survey findings on transparency. The most common form of discussion taking place is where outcomes are in relation to peers, with just 21% of organisations engaging in this type of conversation with staff. Perhaps unsurprisingly, only 6% of respondents discuss outcomes in relation to more senior employees.
Out of those organisations that do discuss reward outcomes, it is private sector services that are most likely to encourage these forms of conversations. While the public sector also engages in post-review discussions, they are more likely to discuss the processes in place, rather than the reward outcomes themselves, possibly reflecting the way that pay rises are determined in large parts of the public sector. Overall, it is the voluntary sector that remains the least likely group to engage in these types of conversations.
From a business strategic perspective, those organisations that focus on ‘defending market share at home’ are less inclined to promote discussion, while those whose focus is on ‘innovating to increase productivity’ are most likely to engage in this way. However, this group is most likely to focus on discussing ‘interpersonal aspects’ and ‘flow of information’ only.
When it comes to perception of fairness in relation to the salary review process, the findings show that size of organisation makes a difference. The smaller the respondent, the more likely they are to encourage dialogue between line managers and employees. This is in contrast to many of the other protocols examined in the survey, where, broadly speaking, it is larger organisations that tend to be more open and have more established lines of communication in place.
Future trends in managing performanceIt is difficult to make bold claims as to how the relationship between pay and performance compares over time, since this has not formed part of previous reward surveys, but this year’s findings provide some interesting insights into current practices and changes in the present.
As part of the survey, respondents were also asked to indicate if they were planning any changes to their existing performance management practices in the future. Figure 16 shows that around a third are anticipating some further developments.
The voluntary sector is most likely to experience change, with 44% of organisations planning some sort of review of current practices. The public sector remains the least likely to implement new measures, with only 31% anticipating any changes. In terms of organisational size, large and very large companies are most likely to foresee a new approach, although smaller businesses are also heading in a similar direction.
Those organisations whose focus lies in ‘innovating to increase productivity’ are more inclined to review their performance management frameworks, although business strategy appears not to substantially influence this decision.
Survey participants were requested to provide some indication of the likely changes they are looking to implement over the forthcoming period. In general terms, the qualitative findings reinforce much of the discussion that took place with our panel of reward specialists. Some organisations are moving away from annual and interim appraisals and towards implementing regular conversations and engagement with line
‘...organisations need to invest more extensively in ensuring line managers are equipped to engage in dialogue and provide appropriate feedback.’
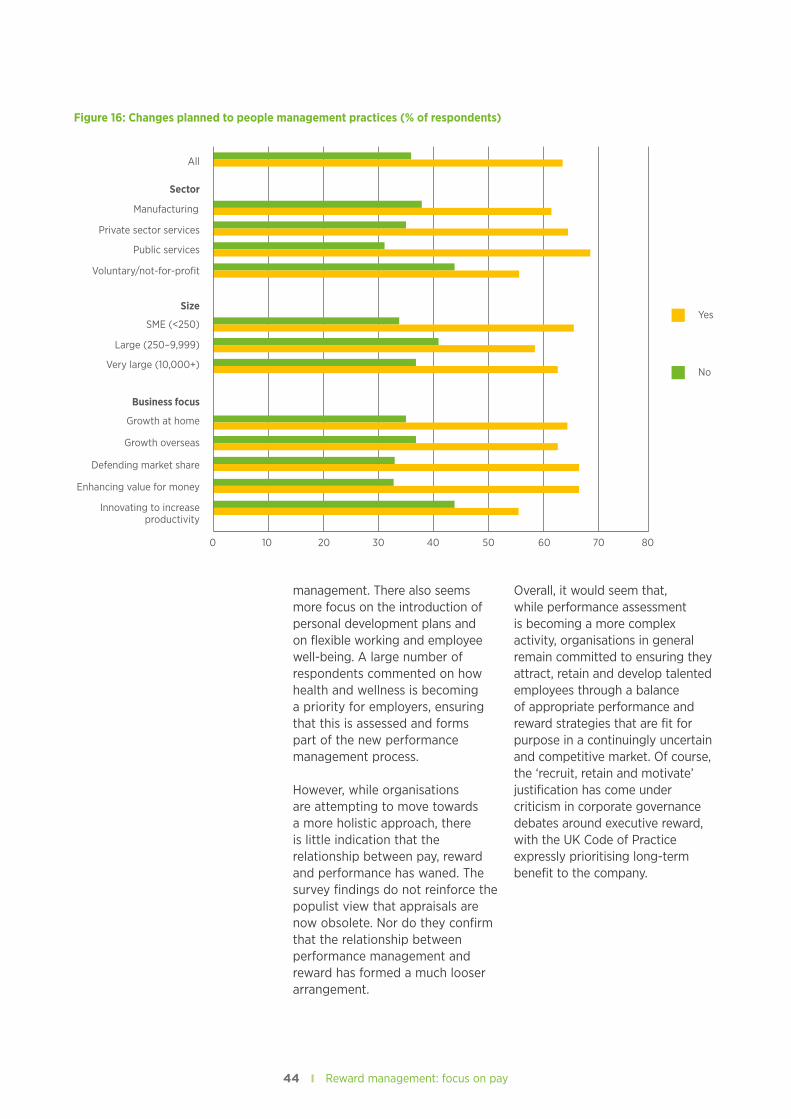
44 Reward management: focus on pay 45 Reward management: focus on pay
management. There also seems more focus on the introduction of personal development plans and on flexible working and employee well-being. A large number of respondents commented on how health and wellness is becoming a priority for employers, ensuring that this is assessed and forms part of the new performance management process.
However, while organisations are attempting to move towards a more holistic approach, there is little indication that the relationship between pay, reward and performance has waned. The survey findings do not reinforce the populist view that appraisals are now obsolete. Nor do they confirm that the relationship between performance management and reward has formed a much looser arrangement.
Overall, it would seem that, while performance assessment is becoming a more complex activity, organisations in general remain committed to ensuring they attract, retain and develop talented employees through a balance of appropriate performance and reward strategies that are fit for purpose in a continuingly uncertain and competitive market. Of course, the ‘recruit, retain and motivate’ justification has come under criticism in corporate governance debates around executive reward, with the UK Code of Practice expressly prioritising long-term benefit to the company.
Yes
No
Sector
All
Size
Business focus
Growth at home
Growth overseas
Defending market share
Enhancing value for money
Innovating to increase productivity
100 20 30 40 50 60 70 80
Private sector services
Public services
Voluntary/not-for-profit
Manufacturing
SME (<250)
Large (250–9,999)
Very large (10,000+)
Figure 16: Changes planned to people management practices (% of respondents)
45 Reward management: focus on pay
CIPD viewpointDespite the media hype about employers abandoning performance appraisals, this isn’t backed up by our survey findings. While our research finds that linking reward to performance is a minority pursuit among employers (48%), we also find that there are plenty of conversations going on within organisations about employee performance. Employers need to be explicit about these conversations, either to better link business aims with employee outcomes or from a transparency standpoint as to what they’re paying for, how and why. Without a clearly articulated basis for demonstrating what is paid and why, organisations become exposed to claims of unfair treatment. There is a further question: how are organisations using reward as a means to safeguard the people resource base of the future? Action is needed to clarify what processes are in place, piloted and quality-assured by reward managers, for assessing and then investing (via pay budgets) in potential to add future value. Action is also needed if, as it appears, managers are poorly skilled in giving direct, candid, confident feedback on the reward decisions they make. It’s not that managers may have difficulty holding ‘difficult’ conversations; it’s that many require a better understanding of how to have a congratulatory one.
Discussion point 4: Pay and performance: ‘moving grains of sand’
The reward survey picks up on the common theme of pay and performance and, in particular, the use and impact of performance reviews on pay progression and variable pay. Within the wider HR community, there has been much discussion of late on the value of performance ratings and their role in determining reward. Here, there were diverging viewpoints amongst the expert practitioner group.
For some specialists, performance reviews continue to attract criticism from line managers who believe that the return on investment – in terms of managerial effort to complete them versus the marginal increases in base pay – offers poor value for money and the process is akin to ‘moving grains of sand’. However, for others the process forms a necessary part of people management and the role of the performance review is increasing, not contracting.
Indeed, the data from the survey show that – despite the rhetoric surrounding appraisals – companies remain committed to conducting reviews rather than abandoning them. However, there are moves towards loosening the relationship between pay and performance. Some panellists commented that, in their own fields, organisations are still linking variable pay, but not base rate, to performance. There are also signs that organisations are moving away from individual performance ratings and the trend is towards more group-based incentive schemes and longer-term plans.
Perhaps the biggest change that the panel unpacked was around the performance process itself. In many cases, organisations are moving away from traditional annual and interim appraisals and towards more informal and more regular one-to-one conversations with line managers. This is regarded as a much more effective approach that helps boost good performance and manage poor performance. Panel members also saw this as a more appropriate mechanism for younger employees who prefer immediate feedback on their work.
Of course, this approach relies heavily on the softer skills of line management and panel members recognise the requirement for investment in managers by companies to achieve this. Once again, the importance of strong and effective line management is deemed essential for ensuring performance and pay is accurately aligned and employees are satisfied with the process.
46 Reward management: focus on pay 47 Reward management: focus on pay
In this section of the report, Professor Stephen Perkins draws together some of the key themes emerging from the survey data and reflects on the implications for reward management practice from an academic perspective.
Our 2015 report concluded with the following observation:
In short, the HR community involved in advising their organisations in managing reward has a significant role to play, provided its members display high levels of expertise linked with political nous.
That still remains the case and, if anything, the necessary interplay of expertise and ability to manage workplace politics in an area of organisational governance that continues to hit the headlines for controversial outcomes has become even more important, according to our survey respondents and our practitioner panellists. Questions continue to loom large around the degree of sophistication in design and application of reward strategies and processes, against a backdrop of economic uncertainty as Brexit unfolds, ongoing restrictions on public sector pay, tight ‘talent’ market conditions, questions around equity and openness, and calls from some quarters to revisit the pay-appraised performance ‘annual rain dance’.
When we considered initial findings in dialogue with senior members of the practitioner community, in summary, the following points emerged:
• Moving ‘beyond austerity’ raises a variety of procedural and processual challenges (such as dealing with the National Minimum Wage as well as finding money to attract and motivate talent), and maybe having scope where unions are involved to have more proactive partnership dialogue. Also, having to find savings elsewhere to rebalance reward investment to meet the demands of talent.
• Greater finesse in managing compliance with regulatory requirements, so as to avoid being consumed with ‘a number’ and instead to adopt a focus over time about tackling more substantive issues where disparity may exist (once the terminology is properly specified) across quite a wide demographic landscape (that is, beyond solely spotlighting gender).
• Directing necessary attention beyond putting the system mechanics into place when communicating and managing reward to address the underlying issues of management to secure intended outcomes (gaining positive returns on investment in doing so), especially when going beyond mechanistic judgement.
• Accepting and acting on an imperative to invest in ways that enhance management capacity so managers feel both competent and confident when having conversations with employees around performance, perhaps without the ‘crutch’ of ratings – keeping their ‘finger on the pulse’ continuously, not as a once-a-year ‘event’.
Conclusions and implications for managerial practice
‘The evidence suggests that, to address post-austerity contexts, more sophisticated reward management is being practised...’
47 Reward management: focus on pay
• Finally, recognising that if HR is to maximise its voice in policy-shaping as well as implementing reward management approaches, while not drawing specialists into a silo, nonetheless realising in resourcing the function that certain activities, for example in the digital space, may call for hybrids with HR specialist know-how, not just IT skills. Resource planning and recruitment into the HR function requires attention with this more holistic perspective in mind, as well as development of those with potential to broaden skill-sets appropriately.
How do we make sense of these findings? As academics, we are motivated to explore avenues in which theories can be applied – to assist understanding and, in turn, practice among managers such as those using this report. Two areas where we can bring theories to assist managers in practical ways can be described under the headlines of (1) ‘network exchange’, and (2) ‘organisational justice’. Grounded in earlier published thought, each has relevance to reward management. Design of the survey questionnaire and the follow-on expert practitioner panel facilitation took account of these in how we framed exploration of trends in equity/transparency and also performance management.
Because of space restrictions, we have chosen to locate the analysis and conclusions against each of these two theories in two online blog posts at www2.cipd.co.uk/community/blogs/b/reward_blog
CIPD viewpointOrganisations should widen the resource base from which HR specialists are drawn, to reflect increasing digitisation of activities relevant to managing reward and performance. This doesn’t simply involve outsourcing, but building cross-disciplinary teams capable of mining and interpreting the organisation’s data. HR professionals need to become more aware of questions to ask to verify what IT-enabled data processing appears to tell them, and IT-derived professionals become more aware of the people issues that the HR function is trying to explore. By being able to base decisions on evidence, HR will be better able to appreciate where the people risks and opportunities exist within the organisation.
Summing up reward management practice in 2017Overall, then, the latest survey findings, which focus on pay, inform another interesting review of the UK reward management scene. The evidence suggests that, to address post-austerity contexts, more sophisticated reward management is being practised with an eye to competing and adding value corporately by holding on to talented people, mindful of potential as well as current contribution levels. On the demographics front, possibly encouraged by bedding-in of regulation, there’s greater willingness to be transparent – although with restrictions on the degree to which this actively informs individuals with questions
about how their rewards compare with others in the organisation. There remains some scepticism too as to the likelihood that, for example, mandatory gender pay gap reports will soon eradicate structurally entrenched anomalies. A clear message is that if sophistication of practice in managing – and accounting for decision-making – around reward management not only for compliance but also competitive and operational imperatives is to be achieved, it will need capacity investment. Line managers will require support in developing greater capability in recognising and rewarding employee effort, especially when needing to step beyond the mechanistic application of policy. And the HR profession may need to revisit its strategic skill-sets, combining with other experts to create multi-functional specialist teams – still with both the technical and political skills – to support the ‘Brexiting’ economy through both economically sound and socially just outcomes.
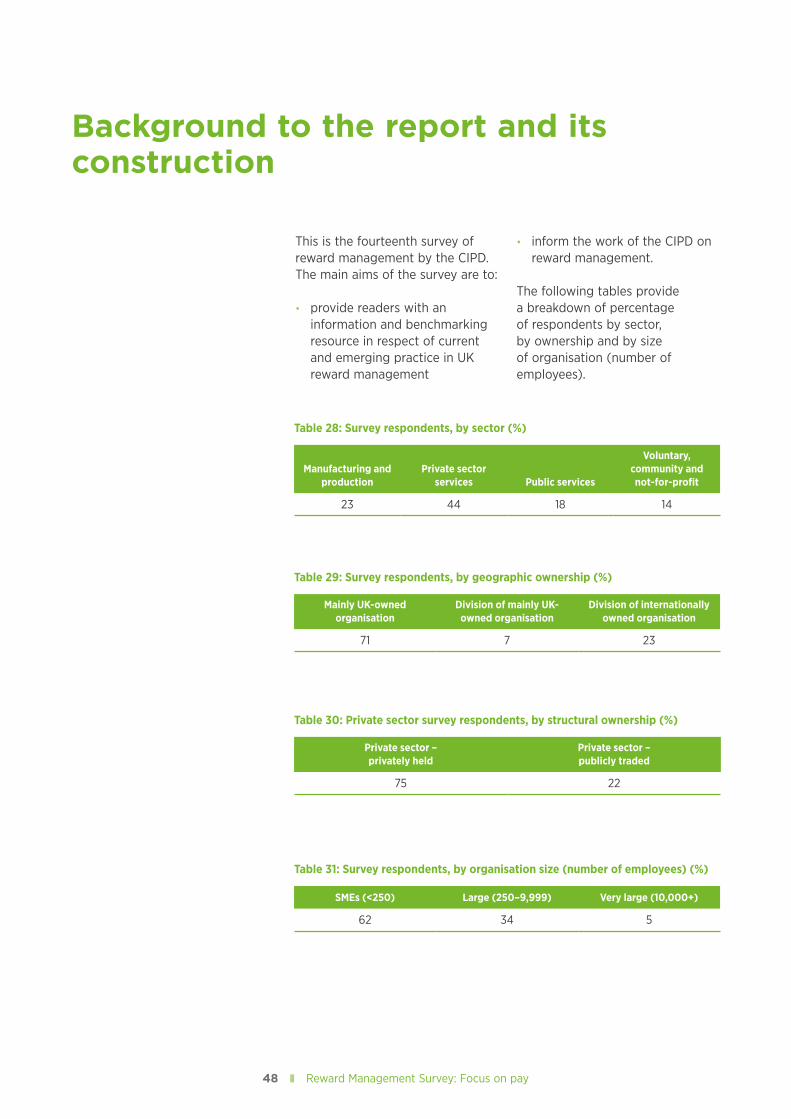
48 Reward Management Survey: Focus on pay 49 Reward Management Survey: Focus on pay
This is the fourteenth survey of reward management by the CIPD. The main aims of the survey are to:
• provide readers with an information and benchmarking resource in respect of current and emerging practice in UK reward management
• inform the work of the CIPD on reward management.
The following tables provide a breakdown of percentage of respondents by sector, by ownership and by size of organisation (number of employees).
Background to the report and its construction
Table 28: Survey respondents, by sector (%)
Manufacturing and production
Private sector services Public services
Voluntary, community and not-for-profit
23 44 18 14
Table 29: Survey respondents, by geographic ownership (%)
Mainly UK-owned organisation
Division of mainly UK-owned organisation
Division of internationally owned organisation
71 7 23
Table 31: Survey respondents, by organisation size (number of employees) (%)
SMEs (<250) Large (250–9,999) Very large (10,000+)
62 34 5
Table 30: Private sector survey respondents, by structural ownership (%)
Private sector – privately held
Private sector – publicly traded
75 22
49 Reward Management Survey: Focus on pay
Data collection for the research was carried out between the beginning of April and end of May 2017. The electronic questionnaire was emailed to senior reward/HR practitioners in the public, private and voluntary sectors. The number of respondents to this survey was 715, up by around a third compared with the 2015 report.
During 2016, while the CIPD undertook a major review of its survey series, with the Reward Management survey being in the vanguard of the process, an opportunity for widespread consultation was taken among the user community and other interested parties. Overwhelming support was given for the report’s continuation, while flagging to the research team the need for ever greater focus on trends exercising the minds of employee reward policy-makers and managers, the
strategic consequences arising, and empathy with the time available to busy corporate professionals to complete survey forms.
Accordingly, while retaining rigour and quality assurance, the 2017 questionnaire was rationalised – with a particular focus on practice trends in core aspects of reward management, and also to do a ‘deep dive’ into two areas of current interest: transparency and demography, and performance appraisal and pay – an area that is attracting attention internationally, leading us to collaborate with a Swiss-based research team in designing the questionnaire to explore these aspects of reward management.
We have, in the course of commenting on the findings from this 2017 survey dataset, made comparisons between the
present and previous rounds of analysis. This is done exercising a little interpretative licence. A necessary caveat is that given the nature of the survey and its completion, we do not have a fixed panel of respondents to the online questionnaire year after year. And of course make-up of the sample, with a high proportion of SME enterprises represented, also means readers are encouraged to pay attention to the corporate size as well as sector-based analytical results drawn out in the tables and accompanying commentary.
In addition to the input received during the development and piloting of the research questionnaire, an ‘expert practitioners roundtable’ was held, together with several follow-on in-depth interviews, to inform the narrative around the figures.

Chartered Institute of Personnel and Development151 The Broadway London SW19 1JQ United Kingdom T +44 (0)20 8612 6200 F +44 (0)20 8612 6201E [email protected] W cipd.co.uk Incorporated by Royal CharterRegistered as a charity in England and Wales (1079797) and Scotland (SC045154)
Issued: December 2017 Reference: 7622 © CIPD 2017


