162
rfield website lobal Evolution Timelin lobal models and databa The Sun and Solid Earth Atmosphere and Oceans Organisms and Ecosystems Molecules and Cells © Bob Field 2007
| Date post: | 22-Dec-2015 |
| Category: |
Documents |
| View: | 224 times |
| Download: | 0 times |

rfield website
Global Evolution Timeline
Global models and databaseThe Sun and Solid Earth
Atmosphere and Oceans
Organisms and Ecosystems
Molecules and Cells© Bob Field 2007

1. Develop a global evolution website that features a five billion year timeline of the natural history of planet Earth.
2. Develop global models and a database of system properties and processes for the OASES and the biosphere.
3. Develop exhibits, indoor and outdoor informal science education programs, and academic courses.
4. Organize global evolution study groups to develop the global evolution timeline, database, and models.

1. Global Evolution Website: The GEEP shall develop and maintain a website for use by middle school to graduate school students and educators and professionals as well as the general public. The website will highlight the nearly five billion year natural history of planet Earth timeline of globally important physical and biological events. The website will apply Dr. Sam Ham’s principles of thematic interpretation to the greatest story rarely told: the remarkable four billion year sequence of events that preceded the Cambrian Explosion. The website will also include major elements of the global evolution models and other educational resources described below.
2. Global Evolution Models and Database: The GEEP will develop a time dependent preliminary global evolution model (PGEM) based on these events and a database of system properties and processes. The model will characterize the evolving structure and energy flow of the oceans, atmosphere, solid Earth, Sun, molecules, cells, organisms, and ecosystems in nominal 100 million year time intervals. The model will include surface processes as well as deep terrestrial and non-terrestrial sources of energy and materials. This effort emphasizes secondary research and heuristic models that have educational value. The global evolution website shall include a user-friendly database of system properties and processes that clarify the interactions of energy and matter based on the PGEM.
3. Educational resources and programs: The GEEP shall develop, conduct, and evaluate academic courses and projects and informal science educational programs. The programs will be based on the natural history timeline and global evolution models described above. The projects may be held in indoor and/or outdoor venues and may include nature walks and talks as well as virtual, permanent, temporary, and traveling exhibits for museums, nature venues, schools, and libraries. The programs will also be based on the principles of thematic interpretation and may emphasize the origins and relationships between physical and biological systems. They may examine the impact of global change on the natural history of the California Coast as a lead-in to the five billion year natural history timeline. The interpretation should be geocentric not anthropocentric and emphasize deep time not current human issues, although the latter may be used to generate interest and improve understanding.
4. Global Evolution Study Group: The GEEP shall organize an informal cross-disciplinary Global Evolution Study Group under the direction of the professor of global evolution studies. The group will identify and sequence the major globally important physical and biological events in the nearly five billion year natural history of planet Earth. The group will develop a time dependent preliminary global evolution model (PGEM) based on these events and the underlying system properties and processes. The group will address the standard W5H questions (who what when where why and how) in plain English.
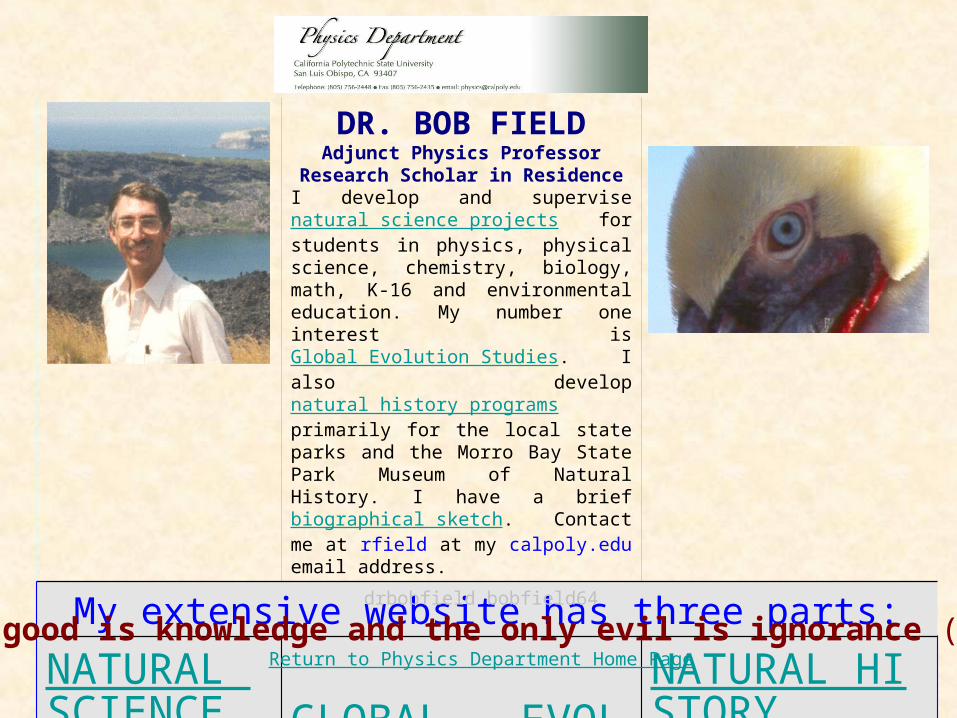
DR. BOB FIELDAdjunct Physics Professor
Research Scholar in ResidenceI develop and supervise natural science projects for students in physics, physical science, chemistry, biology, math, K-16 and environmental education. My number one interest is Global Evolution Studies. I also develop natural history programs primarily for the local state parks and the Morro Bay State Park Museum of Natural History. I have a brief biographical sketch. Contact me at rfield at my calpoly.edu email address.
My extensive website has three parts:
NATURAL SCIENCE
GLOBAL EVOLUTION
NATURAL HISTORY
drbobfield bobfield64
The only good is knowledge and the only evil is ignorance (Socrates)Return to Physics Department Home Page
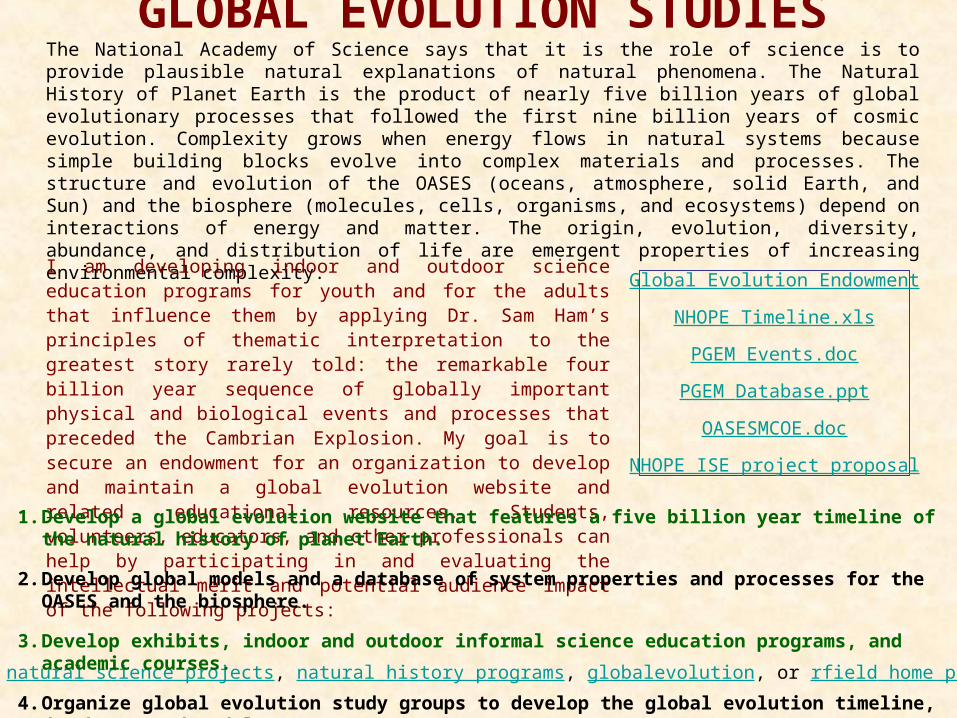
GLOBAL EVOLUTION STUDIESThe National Academy of Science says that it is the role of science is to provide plausible natural explanations of natural phenomena. The Natural History of Planet Earth is the product of nearly five billion years of global evolutionary processes that followed the first nine billion years of cosmic evolution. Complexity grows when energy flows in natural systems because simple building blocks evolve into complex materials and processes. The structure and evolution of the OASES (oceans, atmosphere, solid Earth, and Sun) and the biosphere (molecules, cells, organisms, and ecosystems) depend on interactions of energy and matter. The origin, evolution, diversity, abundance, and distribution of life are emergent properties of increasing environmental complexity.
go to natural science projects, natural history programs, globalevolution, or rfield home page
I am developing indoor and outdoor science education programs for youth and for the adults that influence them by applying Dr. Sam Ham’s principles of thematic interpretation to the greatest story rarely told: the remarkable four billion year sequence of globally important physical and biological events and processes that preceded the Cambrian Explosion. My goal is to secure an endowment for an organization to develop and maintain a global evolution website and related educational resources. Students, volunteers, educators, and other professionals can help by participating in and evaluating the intellectual merit and potential audience impact of the following projects:
1. Develop a global evolution website that features a five billion year timeline of the natural history of planet Earth.
2. Develop global models and a database of system properties and processes for the OASES and the biosphere.
3. Develop exhibits, indoor and outdoor informal science education programs, and academic courses.
4. Organize global evolution study groups to develop the global evolution timeline, database, and models.
Global Evolution Endowment
NHOPE Timeline.xls
PGEM Events.doc
PGEM Database.ppt
OASESMCOE.doc
NHOPE ISE project proposal

Natural History of the California Coast
core
lower mantle
upper mantle
oceanic lithosphere
oceaniccrust
oceans
biosphere
atmosphere
subcontinentallithosphere
sedimentslower crust
upper crust
impact
core
lower mantle
upper mantle
oceanic lithosphere
oceaniccrust
oceans
biosphere
atmosphere
subcontinentallithosphere
sedimentslower crust
upper crust
impact
Solar and Global Evolution Models
Sun
core
lower mantle
upper mantle
oceanic lithosphere
oceaniccrust
oceans
biosphere
atmosphere
subcontinentallithosphere
sedimentslower crust
upper crust
impact
core
lower mantle
upper mantle
oceanic lithosphere
oceaniccrust
oceans
biosphere
atmosphere
subcontinentallithosphere
sedimentslower crust
upper crust
impact
Solar and Global Evolution Models
Sun
click on any figure
Natural History of Planet EarthNatural History of Planet Earth
Global Evolution© Mike Baird

How do global changesimpact the California coast?
The Natural History of the California Coast poster
exhibition planned for the summer of 2009 may be seen by
90,000 visitors to the Hearst Castle National Geographic
Theater lobby. It illustrates the impact of global
evolutionary processes by relating local natural history to
global natural systems themes from Dr. Art Sussman’s
Guide to Planet Earth using Dr. Sam Ham’s principles of
thematic interpretation.

Plausible Natural History publicationsbirds, marine mammals, Monarch Butterflies, tide pools, kelp forests, coral reefs, lichen, algae, fungus, trees, wildflowers, mountains, molecules, cells, Planet Earth, The Facts of Life: From the Oceans to the Stars, etc.
Living Natural History programsMontana de Oro State Park, Museum of Natural History, Pismo State Beach, Elfin Forest, Morro Bay Estuary, Oso Flaco State Park, Lopez Lake, Big Sur, Point Lobos, Yosemite, Monterey Bay Aquarium, Wild Animal Park, Sea World, etc.
Shared Reading Program (PREFACE?)High Tide author Mark Lynas travels around the world to investigate local impacts of global warming

These eight guiding questions are common to all of our informal science education programs:
1. What do you see (observations and descriptions)?2. What are natural systems made out of (composition and
structure)?3. How do natural systems work (material properties and
interactions with energy)?4. How do natural systems change over time (evolutionary
processes)?5. Where do natural systems come from (origin and/or
formation from building blocks)?6. What are the relationships between the parts of a system
(interactions and/or common origins)?7. What are the relationships between natural systems
(interactions and/or common origins)?8. How do natural systems become more complex over time
(entropy decreases)?

I want to form an informal cross-disciplinary Global Evolution Study Group to
identify and sequence globally important physical and biological events in the
nearly five billion year natural history of the planet.
The group can also help develop a database of system properties and processes,
global evolution models, a global evolution website, natural history exhibits,
academic courses, and indoor and outdoor informal science education projects.
The Global Evolution Study Group will meet once or twice a month to define
questions and to share information that we collect from books, journals,
websites, and experts at museums and universities like UCSB, etc.
Students and faculty in physics, chemistry, biology, math, engineering,
education, and liberal arts are welcome to participate. Global evolution
involves the Sun, solid Earth, oceans, atmosphere, molecules, cells, organisms,
and ecosystems. If you have any interest in one or more of these subjects, send
an email to rfield at the email address at calpoly.edu.© Bob Field 2007
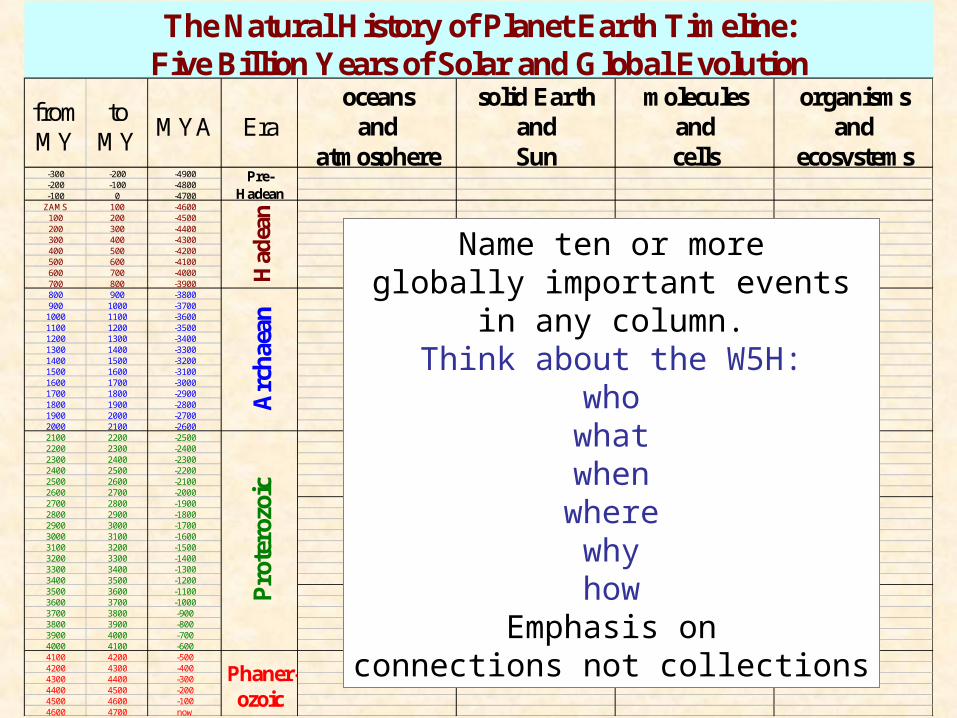
from MY
to MY
MYA Eraoceans
and atmosphere
solid Earth and Sun
molecules and cells
organisms and
ecosystems-300 -200 -4900-200 -100 -4800-100 0 -4700
ZAMS 100 -4600100 200 -4500200 300 -4400300 400 -4300400 500 -4200500 600 -4100600 700 -4000700 800 -3900800 900 -3800900 1000 -37001000 1100 -36001100 1200 -35001200 1300 -34001300 1400 -33001400 1500 -32001500 1600 -31001600 1700 -30001700 1800 -29001800 1900 -28001900 2000 -27002000 2100 -26002100 2200 -25002200 2300 -24002300 2400 -23002400 2500 -22002500 2600 -21002600 2700 -20002700 2800 -19002800 2900 -18002900 3000 -17003000 3100 -16003100 3200 -15003200 3300 -14003300 3400 -13003400 3500 -12003500 3600 -11003600 3700 -10003700 3800 -9003800 3900 -8003900 4000 -7004000 4100 -6004100 4200 -5004200 4300 -4004300 4400 -3004400 4500 -2004500 4600 -1004600 4700 now
Phaner- ozoic
Pro
tero
zoic
The Natural History of Planet Earth Timeline: Five Billion Years of Solar and Global Evolution
Had
ean
Pre-Hadean
Arc
hae
anName ten or more
globally important eventsin any column.
Think about the W5H:whowhatwhenwherewhyhow
Emphasis onconnections not collections

What do we know about the natural history of planet Earth?
Our planet formed from dust left over when a massive cloud of cold dilute gas and dust condensed to form the Sun 4.6 billion years ago. The Moon formed from remnants of a collision between Orpheus and the Earth after the Great Iron Catastrophe formed the Earth's core. Our planet's surface was initially too hot to form a crust. Four billion years ago, the Earth was still heavily bombarded by a flux of extraterrestrial objects. Continents did not exist when the Earth first formed but grew over time.
Most of the water on Earth is in liquid oceans, but much of it has at times been buried in the land, vaporized into the atmosphere, or frozen solid. Life existed before DNA, proteins, chlorophyll, and rhodopsin evolved. The solar flux incident on the top of the atmosphere has increased by 40% over the history of the Earth. During the Proterozoic Era, photosynthetic bacteria helped remove most of the carbon dioxide from the atmosphere and released oxygen which was toxic to most bacteria at the time.
Eukaryotes evolved by serial endosymbiosis several times. Eukaryotes are masters of multicellularity whereas bacteria are masters of metabolic diversity. Plants and animals are relatively recent evolutionary developments. Invertebrates ventured out of the seas before vertebrates invaded the land. Whales and other marine mammals are recent additions to the oceans. © Bob Field 2007

Geologic Time Scale
Geological Time Scale copyright 2005 - geology.com http://www.geology.com/ http://geology.com/time.htm

Era/Period/Epoch Time
(Myr ago)
Archaeozoic (Archean) era 5000-1500
Proterozoic era 1500-545
Paleozoic era
Cambrian period 545-505
Ordovician period 505-438
Silurian period 438-410
Devonian period 410-355
Carboniferous (Mississipian/Pennsylvanian) period 355-290
Permian period 290-250
Mesozoic era
Triassic period 250-205
Jurassic period 205-135
Cretaceous period 135-65
Cenozoic era"Recent Life"
Tertiary period
Paleocene epoch 65-55
Eocene epoch 55-38
Oligocene epoch 38-26
Miocene epoch 26-6
Pliocene epoch 6-1.8
Quarternary period
Pleistocene epoch 1.8-0.01
(Lower Paleolithic) 0.50-0.25
(Middle Paleolithic) 0.25-0.06
(Upper Paleolithic) 0.06-0.01
Holocene epoch 0.01-0www.talkorigins.org/origins/geo_timeline.html
Geological Timeline
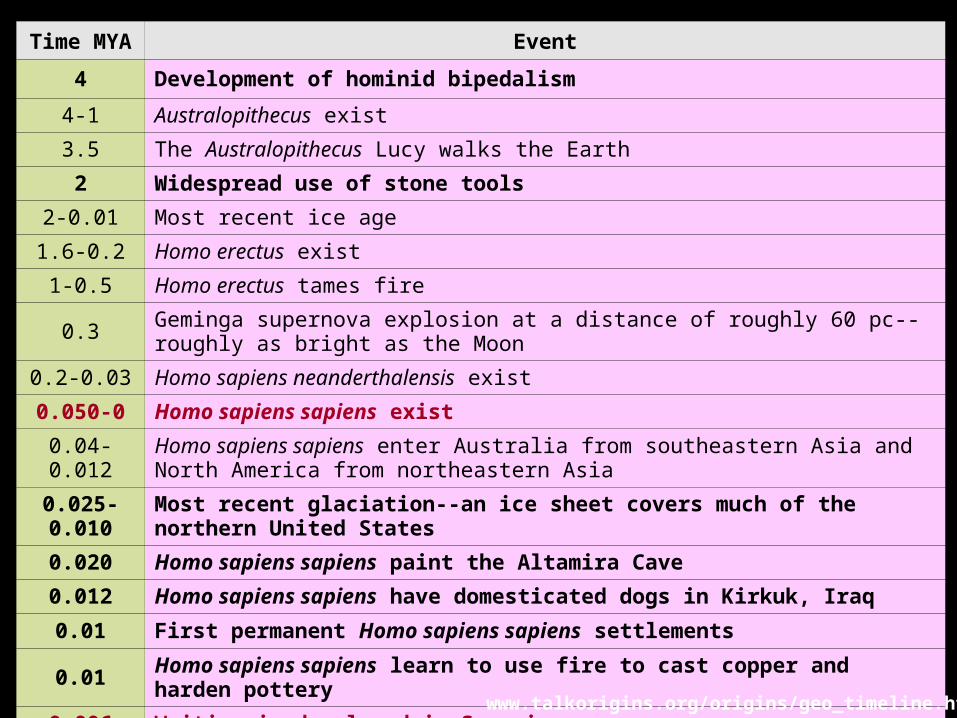
Time MYA Event
4 Development of hominid bipedalism
4-1 Australopithecus exist
3.5 The Australopithecus Lucy walks the Earth
2 Widespread use of stone tools
2-0.01 Most recent ice age
1.6-0.2 Homo erectus exist
1-0.5 Homo erectus tames fire
0.3Geminga supernova explosion at a distance of roughly 60 pc--roughly as bright as the Moon
0.2-0.03 Homo sapiens neanderthalensis exist
0.050-0 Homo sapiens sapiens exist
0.04-0.012Homo sapiens sapiens enter Australia from southeastern Asia and North America from northeastern Asia
0.025-0.010 Most recent glaciation--an ice sheet covers much of the northern United States
0.020 Homo sapiens sapiens paint the Altamira Cave
0.012 Homo sapiens sapiens have domesticated dogs in Kirkuk, Iraq
0.01 First permanent Homo sapiens sapiens settlements
0.01 Homo sapiens sapiens learn to use fire to cast copper and harden pottery
0.006 Writing is developed in Sumeria
www.talkorigins.org/origins/geo_timeline.html
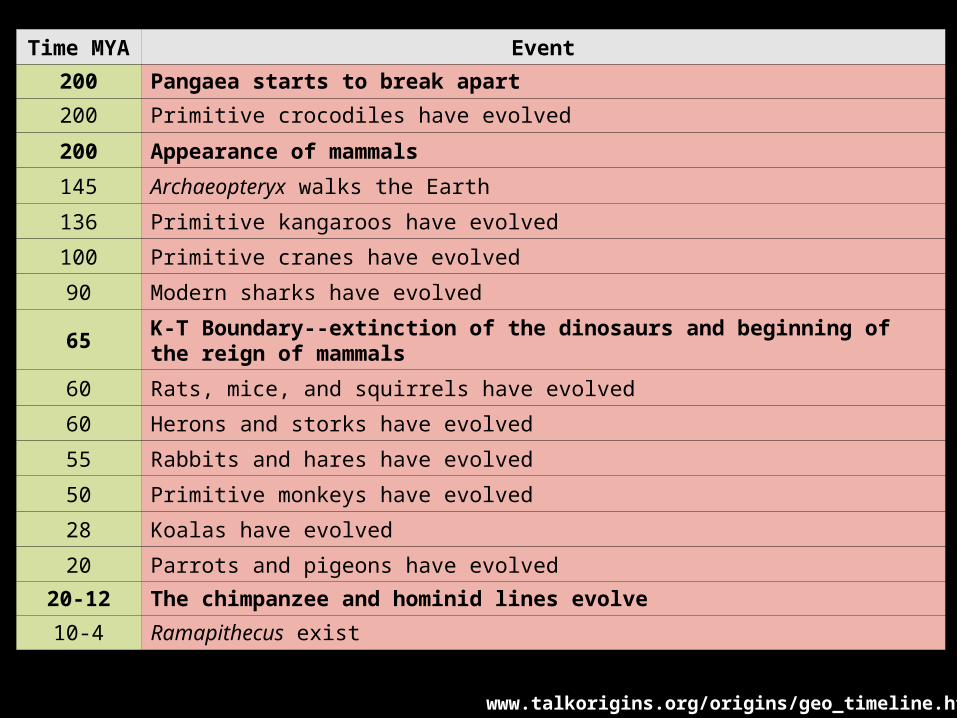
Time MYA Event
200 Pangaea starts to break apart
200 Primitive crocodiles have evolved
200 Appearance of mammals
145 Archaeopteryx walks the Earth
136 Primitive kangaroos have evolved
100 Primitive cranes have evolved
90 Modern sharks have evolved
65 K-T Boundary--extinction of the dinosaurs and beginning of the reign of mammals
60 Rats, mice, and squirrels have evolved
60 Herons and storks have evolved
55 Rabbits and hares have evolved
50 Primitive monkeys have evolved
28 Koalas have evolved
20 Parrots and pigeons have evolved
20-12 The chimpanzee and hominid lines evolve
10-4 Ramapithecus exist
www.talkorigins.org/origins/geo_timeline.html

Time MYA Event
545 Cambrian explosion of hard-bodied organisms
528-526 Fossilization of the Chengjiang site
517-515 Fossilization of the Burgess Shale
500-450 Rise of the fish--first vertebrates
430 Waxy coated algae begin to live on land
420 Millipedes have evolved--first land animals
375The Appalachian mountains are formed via a plate tectonic collision between North America, Africa, and Europe
375 Appearance of primitive sharks
350-300 Rise of the amphibians
350 Primitive insects have evolved
350 Primitive ferns evolve--first plants with roots
300-200 Rise of the reptiles
300 Winged insects have evolved
280 Beetles and weevils have evolved
250 Permian period mass extinction
230 Roaches and termites have evolved
225 Modern ferns have evolved
225 Bees have evolved
www.talkorigins.org/origins/geo_timeline.html

Time MYA Event
4600 Formation of the approximately homogeneous solid Earth by planetesimal accretion
4300Melting of the Earth due to radioactive and gravitational heating which leads to its differentiated interior structure as well as outgassing of molecules such as water, methane, ammonia, hydrogen, nitrogen, and carbon dioxide
4300Atmospheric water is photodissociated by ultraviolet light to give oxygen atoms which are incorporated into an ozone layer and hydrogen molecules which escape into space
4000 Bombardment of the Earth by planetesimals stops
3800 The Earth's crust solidifies--formation of the oldest rocks found on Earth
3800 Condensation of atmospheric water into oceans
3500-2800 Prokaryotic cell organisms develop
3500-2800Beginning of photosynthesis by blue-green algae which releases oxygen molecules into the atmosphere and steadily works to strengthen the ozone layer and change the Earth's chemically reducing atmosphere into a chemically oxidizing one
2400Rise in the concentration of oxygen molecules stops the deposition of uraninites (since they are soluble when combined with oxygen) and starts the deposition of banded iron formations
1600The last reserves of reduced iron are used up by the increasing atmospheric oxygen--last banded iron formations
1500 Eukaryotic cell organisms develop
1500-600 Rise of multicellular organisms
580-545 Fossils of Ediacaran organisms are made
www.talkorigins.org/origins/geo_timeline.html

Solar and Global Evolutionare parts of Cosmic Evolution
~ age (BY) generic structureaverage power density (W/kg)
12 galaxies 0.00005
10 stars 0.0002
5 planets 0.01
3 plants 0.1
0.01 animals 2
0.001 brains 15
0.0000001 society 50
table from Chaisson139image from Science Yearbook
when energy flows, complexity grows
core
lower mantle
upper mantle
oceanic lithosphere
oceaniccrust
oceans
biosphere
atmosphere
subcontinentallithosphere
sedimentslower crust
upper crust
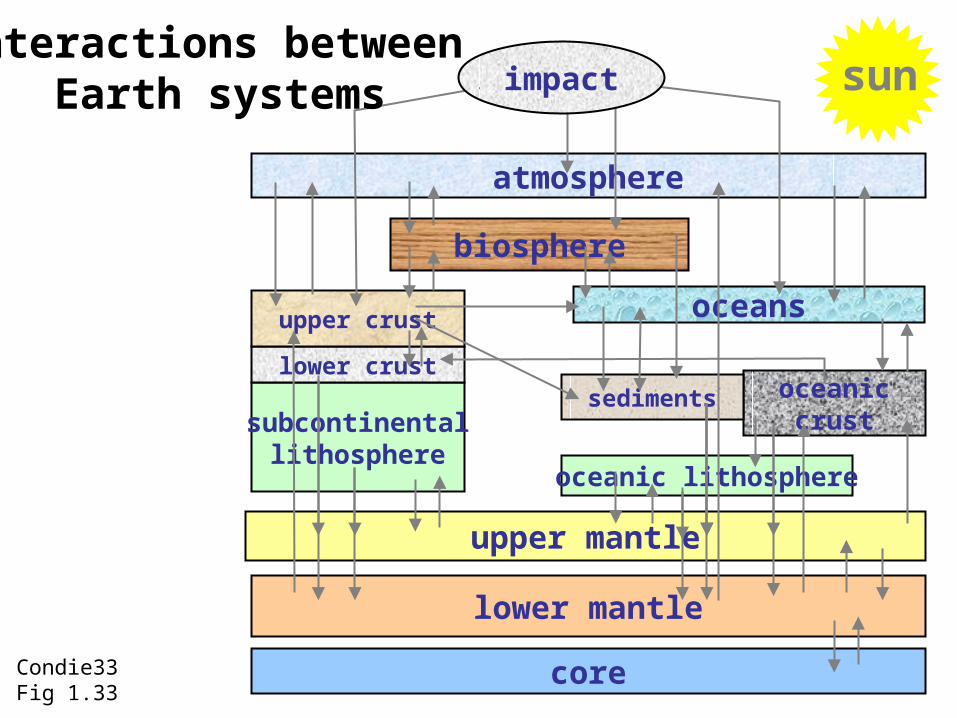
impactInteractions between
Earth systems
Condie33Fig 1.33
sun

C6 12
N7 14
O8 16
H1 1
He2 4Periodic Table of
Chemical Elements
92% ~8%
0.07%0.04%0.02%0.01%
Abundance in Universe in %0.1% }
Ne10 20
Na11 23
Mg12 24
Al13 27
Si14 28
P15 31
S16 32
Cl17 35
Ar18 40
K19 39
Ca20 40
Cr24 62
Mn25 55
Fe26 56
Ni28 59
0.02% everything else
Stars build big atoms from small ones
Sunlight is the productof “hydrogen burning”
and helium is the “spent fuel”
Sun creates energy as a waste product when it fuses
4 H1 → He4

The Suninternal structure and size of layersdensity, mass, gravity, pressure, volumetemperatureinternal energy distributionenergy sources: fusion energy, gravitational contractioncomposition – hydrogen, helium, “metals”, free electronsmaterial propertiesenergy transport: convection, conduction, radiationmass flow in convectionevolution of the Sun – composition ,density, temperature, fusion rate, luminosityformation of the Sun

convective zone
radiative zone
fusioncore
Hot and Heavy
Sun’sstructure
zonevolume
~r3 masstotal
energy
fusion core r < ¼ 1/64 1/2 2/3
radiative r < 0.7 1/3 1/2 1/3
convective r > 0.7 2/3 1/80 1/100

metals composition
C 0.002272
N 0.000697
O 0.006323
Ne 0.000129
Mg 0.000492
relative values used in our LANL solar evolution cases

relative volume
fusion core 16
radiative zone 343
convective zone 641
relative mass
fusion core 481radiative
zone 492
convective zone 27
relative heat flow
1000988
1000
0
200
400
600
800
1000
fusion core radiative zone convective zone
relative total energy
radiative zone 356
fusion core 637
convective zone 7
relative fusion power
convective zone 0
fusion core 988
radiative zone 12
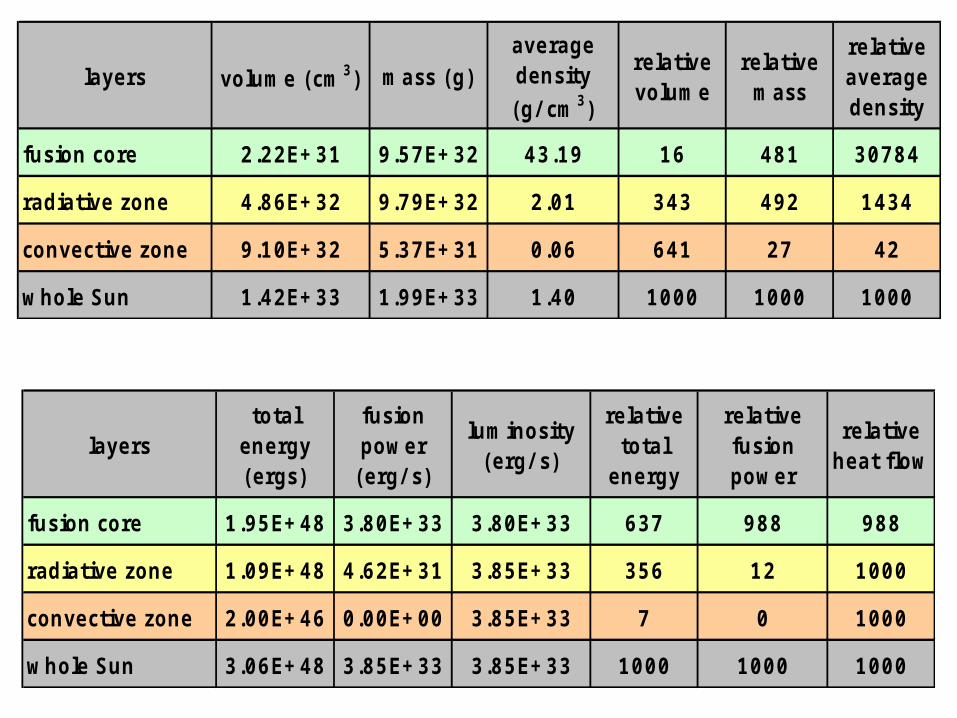
layers volume (cm3) mass (g)average density
(g/ cm3)
relative volume
relative mass
relative average density
fusion core 2.22E+31 9.57E+32 43.19 16 481 30784
radiative zone 4.86E+32 9.79E+32 2.01 343 492 1434
convective zone 9.10E+32 5.37E+31 0.06 641 27 42
whole Sun 1.42E+33 1.99E+33 1.40 1000 1000 1000
layerstotal
energy (ergs)
fusion power
(erg/ s)
luminosity (erg/ s)
relative total
energy
relative fusion power
relative heat flow
fusion core 1.95E+48 3.80E+33 3.80E+33 637 988 988
radiative zone 1.09E+48 4.62E+31 3.85E+33 356 12 1000
convective zone 2.00E+46 0.00E+00 3.85E+33 7 0 1000
whole Sun 3.06E+48 3.85E+33 3.85E+33 1000 1000 1000

Density (g/cm^3)
0
20
40
60
80
100
120
140
160
0E+00 1E+10 2E+10 3E+10 4E+10 5E+10 6E+10 7E+10
radius (cm)
Guzik - LANL solar evolution code

local gravity g (cm/s2)
0
50000
100000
150000
200000
250000
0E+00 1E+10 2E+10 3E+10 4E+10 5E+10 6E+10 7E+10
radius (cm)
loca
l gra
vity
g
Earth surface gravity g = 981 cm/s2
g(R) = GM(R)/R2
Guzik + Field

4BY Enclosed H and He Mass
0.0E+00
5.0E+32
1.0E+33
1.5E+33
0E+00 1E+10 2E+10 3E+10 4E+10 5E+10 6E+10 7E+10
radius (cm)
enclosed H mass (g)
enclosed He mass (g)
Guzik + Field

Ostlie & Carroll 275
5
4
3
2
1
0
-1
-24 5 6 7 8
log
K (
cm2 /
g)
log T (K)
-10 -8 -6
-2
0
-4
2
X=0.7Z=0.02
Rosseland mean opacitycurves are labeled by log density (g/cm-3)
Stellar Opacity

Luminosity Gradient
0E00
1E23
2E23
3E23
4E23
5E23
0E+00 1E+10 2E+10 3E+10 4E+10 5E+10 6E+10 7E+10
radius (cm)
Guzik + Field
dL/dR = 4πR2ρε

Solar Evolution
0.0
0.1
0.2
0.3
0.4
0.5
0.6
0.7
0.8
0.9
1.0
0E+00 1E+09 2E+09 3E+09 4E+09Time (years)
Re
lati
ve
Va
lue
T/Tsun
R/Rsun
L/Lsun
cycle 17
L = 4πR2·σT4
Guzik + Field

Luminosity vs. Radius
0E+00
1E+33
2E+33
3E+33
4E+33
5E+33
6E+33
7E+33
8E+33
0E+00 2E+10 4E+10 6E+10 8E+10
Radius (cm)
Lu
min
osi
ty (
erg
s)
4.5 BY Z=0.01
3 BY Z=0.01
1.5 BY Z=0.01
ZAMS Z=0.01
4.5 BY Z=0.02
3 BY Z=0.02
1.5 BY Z=0.02
ZAMS Z=0.02
Guzik Field Lopez x70y28z02 112005
metal content influences solar luminosity and lifetime

Luminosity vs. RadiusX=.70, Y=.28, Z=.02
0E+00
1E+33
2E+33
3E+33
4E+33
5E+33
6E+33
7E+33
0E+00 2E+10 4E+10 6E+10 8E+10
Radius (cm)
Lu
min
osi
ty (
erg
s/s)
9 BY
7.5 BY
6 BY
4.5 BY
3 BY
1.5 BY
ZAMS
Guzik Field Lopez x70y28z02 112005
luminosity increases as core hydrogen is depleted
surfa
ce ra
dius

H Mass Fraction (X) vs. RadiusX=.70, Y=.28, Z=.02
0.0
0.1
0.2
0.3
0.4
0.5
0.6
0.7
0E+00 2E+10 4E+10 6E+10 8E+10
Radius (cm)
X
ZAMS X
1.5 BY X
3 BY X
4.5 BY X
6 BY X
7.5 BY X
9 BY X
Guzik Field Lopez x70y28z02 112005
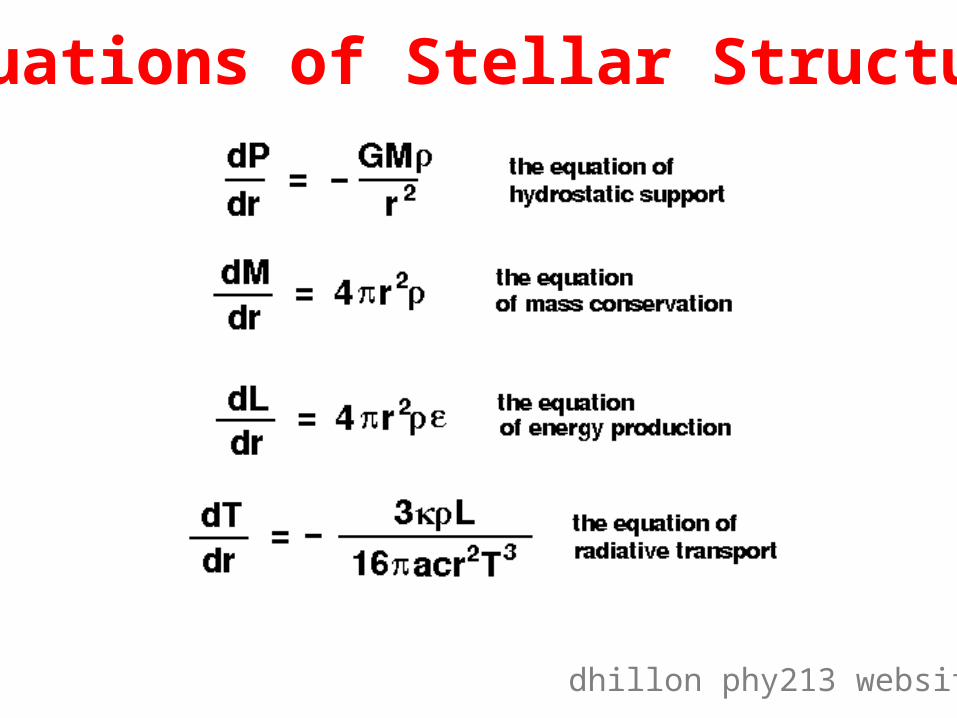
dhillon phy213 website
Equations of Stellar Structure

The Solid Earthsize of layersdensity, mass, gravity, pressure, volumecomposition – iron silicon oxygen magnesium nickel material propertiestemperaturethermal energy distributionheat flow sources
radioactive decay of U, Th, and Kheat loss as Earth coolsgravitational energy released as Earth coolslatent heat released as inner core freezes
energy transport: convection, conduction, radiationmass flow in convectionevolution of the Earth’s structureformation of the Earth

Zeroth order model of the Earth has three layers
core
mantle
core
mantle
crust
atmosphere

First order model of the Earth shows layersSeismic studies reveal density variations due to composition and phase differences.
ICB
CMB
inner core - conduction
outer core – convection?
lower mantle - convection
D” - conduction
upper mantle - convection
lithosphere - conduction
atmosphere - radiation
convection is powered by radiogenic heat sources and produces chemical evolution

Density (kg/m^3)
0
2000
4000
6000
8000
10000
12000
14000
0E+0 1E+6 2E+6 3E+6 4E+6 5E+6 6E+6 7E+6
radius (m)
Den
sity
(kg
/m^
3)
inner core R < 1221.5 km
outer core R < 3480 km
lower mantle R < 5701 km
D” R < 3630 km
upper mantle R < 6291 km
lithosphere R < 6371 km
ICB
CMB
Mantle
Core

Whole Earth Element Mass Percent
other5
Mg154
Si161
O297
Fe320
Cr5
Ni18
S6Ca
17
Al16
Fe
O
Si
Mg
Ni
Ca
Al
S
Cr
other
McDonough

Whole Earth, Crust, Mantle, Core Element Mass Percent
Fe85.5
O44
Si21
Mg22.8
Fe32.0
O29.7
Si16.1
Mg15.4
Ni5.2
Ca2.53
Al2.35
Fe6.26
Al8.41
Ca5.29
Fe7.07
O45.3Si
26.77
Mg3.2
Ni1.8
Ca1.7
Al1.6
Fe
O
Si
Mg
Ni
Ca
Al
S
Cr
Si6
Whole Earth CrustMantleCore

layers Fe O Si Mg Nicore 855 0 60 0 52mantle 63 440 210 228 2lithosphere 63 440 210 228 2whole Earth 320 297 161 154 18
layers Ca Al S Cr othercore 0 0 19 9 5mantle 25 24 0 3 6lithosphere 25 24 0 3 6whole Earth 17 16 6 5 5
zeroth order model - composition
Relative Mass Abundance of Elements on Earth
McDonough

Element Density (kg/m^3)
000E+00
2E+03
4E+03
6E+03
8E+03
10E+03
12E+03
14E+03
0E+0 1E+6 2E+6 3E+6 4E+6 5E+6 6E+6 7E+6
radius (m)
Ele
men
t D
ensi
ty (
kg/m
^3) boundaries
Fe
O
Si
Mg
Density (kg/m^3)
ICB
CMB Mantle
Core
based on McDonough

Major Elements in Crust and Mantle (%)(not counting oxygen)
0
5
10
15
20
25
30
Mg * Al * Si * Ca * Fe *
Elements
Maj
or
Ele
men
ts (
%) Crust
Upper Mantle
Lower Mantle
Crust + Mantle
Elements 2006-07-18 mfischer b revision

Temperature (K)
0
1000
2000
3000
4000
5000
6000
0E+0 1E+6 2E+6 3E+6 4E+6 5E+6 6E+6 7E+6
radius (m)
Tem
per
atu
re (
K)
boundaries
Temperature (K)
solidus temperature (K)
ICB
CMB
Liquid Outer CoreMantle
based on Stacey Appendix G
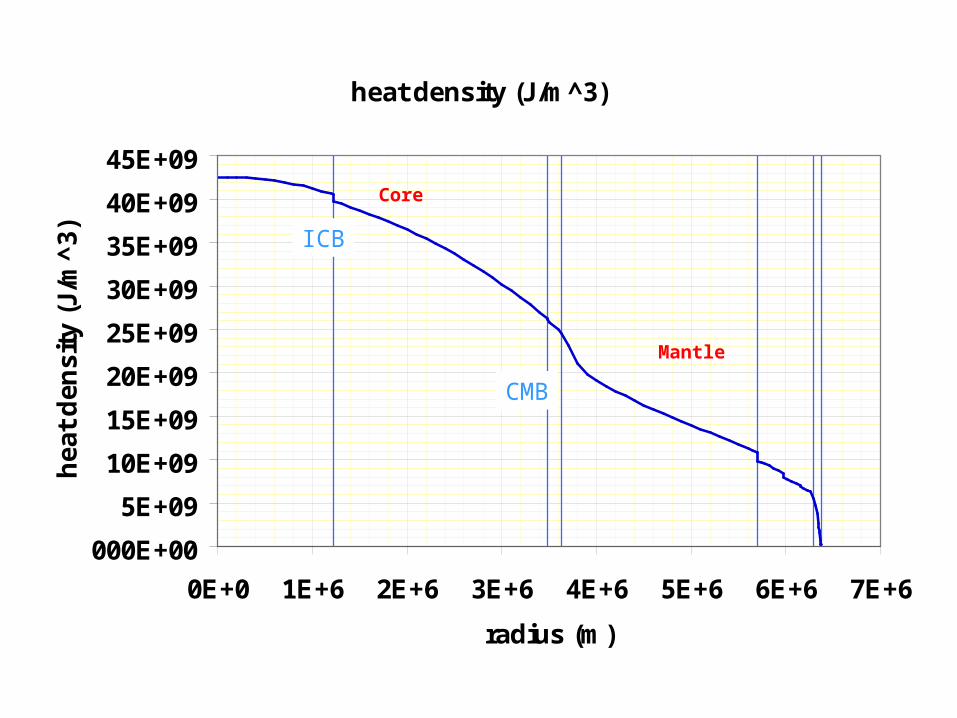
heat density (J/m^3)
000E+00
5E+09
10E+09
15E+09
20E+09
25E+09
30E+09
35E+09
40E+09
45E+09
0E+0 1E+6 2E+6 3E+6 4E+6 5E+6 6E+6 7E+6
radius (m)
hea
t d
ensi
ty (
J/m
^3) ICB
CMB
Mantle
Core

enclosed heat (J)
00E+0
2E+30
4E+30
6E+30
8E+30
10E+30
12E+30
14E+30
16E+30
18E+30
0E+0 1E+6 2E+6 3E+6 4E+6 5E+6 6E+6 7E+6
radius (m)
encl
ose
d h
eat
(J)
Mantle
Core

Stacey Table 6.4 Heat Loss Budget (TW)INCOME 8.2 Crust radioactivity19.9 Mantle radioactivity 1.2 Latent heat and gravitational energy released by core evolution 0.6 Gravitational energy of mantle differentiation 2.1 Gravitational energy released by thermal contraction
32 TW TOTAL
EXPENDITURE 8.2 Crust heat loss30.8 Mantle heat loss 3.0 Core heat loss
42 TW TOTAL
10 TW NET LOSS OF HEAT

radiogenic heat flow (W)
00E+0
5E+12
10E+12
15E+12
20E+12
25E+12
30E+12
0E+0 1E+6 2E+6 3E+6 4E+6 5E+6 6E+6 7E+6
radius (m)
rad
iog
enic
hea
t fl
ow
(W
)
CMB
19.9 TW in mantle 8.2 TW in crust……28.1 TW whole Earth
Mantle
Core
based on Stacey

latent heat flow (W)
000E+00
1E+12
2E+12
3E+12
4E+12
0E+0 1E+6 2E+6 3E+6 4E+6 5E+6 6E+6 7E+6
radius (m)
late
nt
hea
t fl
ow
(W
)
ICBMantleCore
based on Stacey
4 BY
3 BY
2 BY
1 BY

total heat flow (W)
00E+0
5E+12
10E+12
15E+12
20E+12
25E+12
30E+12
35E+12
40E+12
45E+12
0E+0 1E+6 2E+6 3E+6 4E+6 5E+6 6E+6 7E+6
radius (m)
tota
l hea
t fl
ow
(W
)
boundaries
current total heat flow (W)
radiogenic heat flow (W)
current lost heat flow (W)
current ΔGBE heat flow (W)
latent heat flow (W)
CMB
Mantle
Core
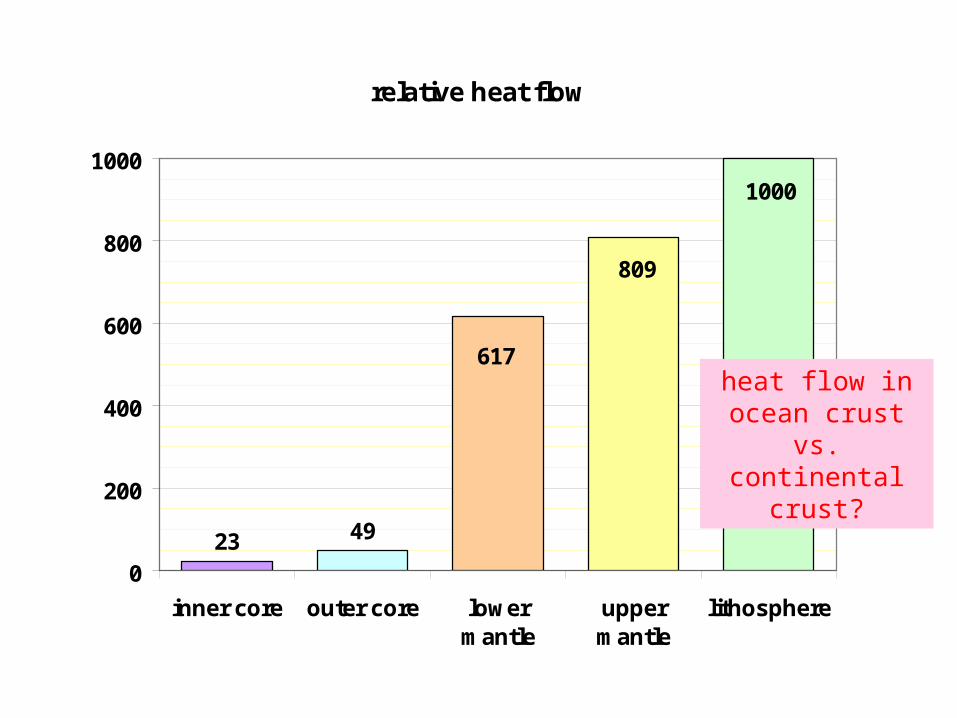
relative heat flow
23 49
1000
809
617
0
200
400
600
800
1000
inner core outer core lowermantle
uppermantle
lithosphere
heat flow inocean crust
vs.continental crust?

layersinternal
energy (J )
heat sources
(W)total heat flow (W)
relative internal energy
relative heat
sourcesrelative
heat flowinner core 3.15E+29 9.85E+11 9.85E+11 19 23 23outer core 5.35E+30 1.11E+12 2.10E+12 315 26 49lower mantle 9.12E+30 2.43E+13 2.64E+13 537 568 617upper mantle 2.09E+30 8.22E+12 3.46E+13 123 192 809lithosphere 1.20E+29 8.17E+12 4.28E+13 7 191 1000whole Earth 1.70E+31 4.28E+13 4.28E+13 1000 1000 1000continental crustocean crust
layersinternal
energy (J )
heat sources
(W)total heat flow (W)
relative internal energy
relative heat
sourcesrelative
heat flowcore 5.67E+30 2.10E+12 2.10E+12 333 49 49mantle 1.12E+31 3.25E+13 3.46E+13 659 760 809lithosphere 1.20E+29 8.17E+12 4.28E+13 7 191 1000whole Earth 1.70E+31 4.28E+13 4.28E+13 1000 1000 1000
first order model – composition and phase
zeroth order model - composition
Absolute and Relative Energy, Heat, and Heat Flow

relative internal energy
lithosphere7
lower mantle537
upper mantle123
outer core315
inner core19
relative mass
lithosphere21
lower mantle492
upper mantle162
outer core308
inner core17
relative volume
lower mantle554
upper mantle246
outer core156
lithosphere37
inner core7
relative total heat sources
lithosphere191
lower mantle568
upper mantle192
outer core26
inner core23
relative heat flow
23 49
1000
809
617
0
200
400
600
800
1000
inner core outer core lowermantle
uppermantle
lithosphere

layersvolume (m^3) mass (kg)
average density
(kg/ m^3)internal
energy (J )
heat sources
(W)total heat flow (W)
inner core 7.63E+18 9.83E+22 1.29E+04 3.15E+29 9.85E+11 9.85E+11outer core 1.69E+20 1.83E+24 1.08E+04 5.35E+30 1.11E+12 2.10E+12lower mantle 6.00E+20 2.92E+24 4.87E+03 9.12E+30 2.43E+13 2.64E+13upper mantle 2.67E+20 9.63E+23 3.61E+03 2.09E+30 8.22E+12 3.46E+13lithosphere 4.03E+19 1.25E+23 3.11E+03 1.20E+29 8.17E+12 4.28E+13whole Earth 1.08E+21 5.94E+24 5.48E+03 1.70E+31 4.28E+13 4.28E+13continental crustocean crust
layersvolume (m^3) mass (kg)
average density
(kg/ m^3)internal
energy (J )
heat sources
(W)total heat flow (W)
core 1.77E+20 1.93E+24 1.19E+04 5.67E+30 2.10E+12 2.10E+12mantle 8.66E+20 3.88E+24 4.24E+03 1.12E+31 3.25E+13 3.46E+13lithosphere 4.03E+19 1.25E+23 3.11E+03 1.20E+29 8.17E+12 4.28E+13whole Earth 1.08E+21 5.94E+24 5.48E+03 1.70E+31 4.28E+13 4.28E+13
first order model – composition and phase
zeroth order model - composition
Volume, Mass, Density, Energy, Heat, and Heat Flow

layersrelative volume
relative mass
relative internal energy
relative heat
sourcesrelative
heat flowinner core 7 17 19 23 23outer core 156 308 315 26 49lower mantle 554 492 537 568 617upper mantle 246 162 123 192 809lithosphere 37 21 7 191 1000whole Earth 1000 1000 1000 1000 1000continental crustocean crust
layersrelative volume
relative mass
relative internal energy
relative heat
sourcesrelative
heat flowcore 163 325 333 49 49mantle 800 654 659 760 809lithosphere 37 21 7 191 1000whole Earth 1000 1000 1000 1000 1000
first order model – composition and phase
zeroth order model - composition
Relative Volume, Mass, Energy, Heat, and Heat Flow

ru
ΔR
vmass
Δr
convection model for an ideal gasforce / area = viscosity x velocity gradient
constant P = (ρ-Δρ)k(T+ΔT)/mp
force = Δρ(πru2 ΔR)gR
cylinder area = 2πruΔR
Δρ(πru2 ΔR)gR/(2πruΔR) = η Δvmass/Δr
Δρ ru gR / 2 = η Δvmass/Δr
vmass = Δρ ru gR Δr / 2ηwhat if you have molten rocks?
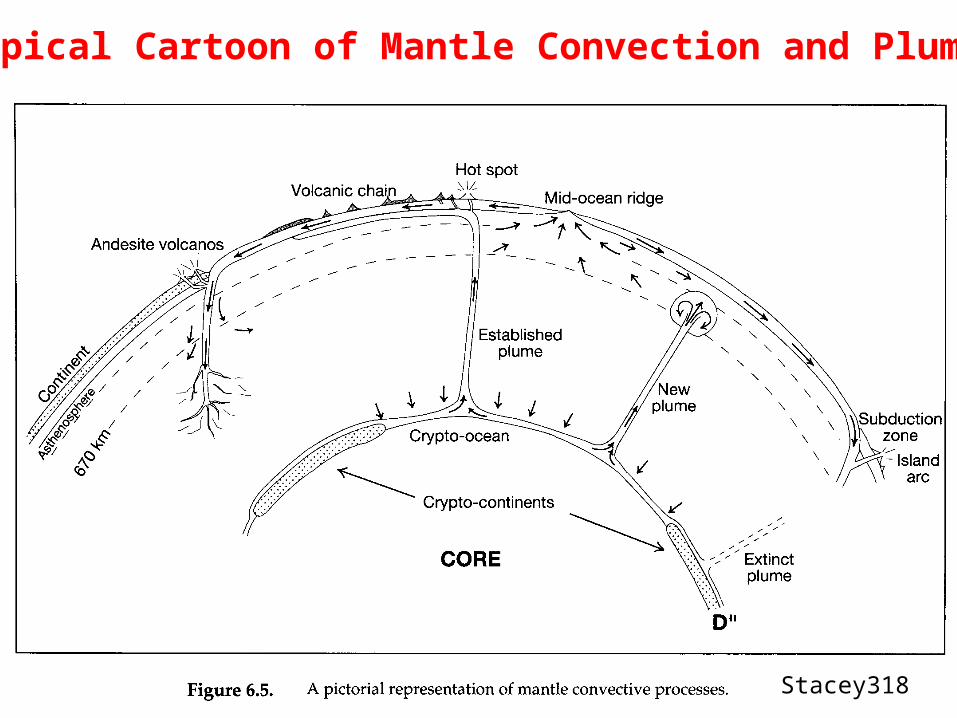
Stacey318
Typical Cartoon of Mantle Convection and Plumes
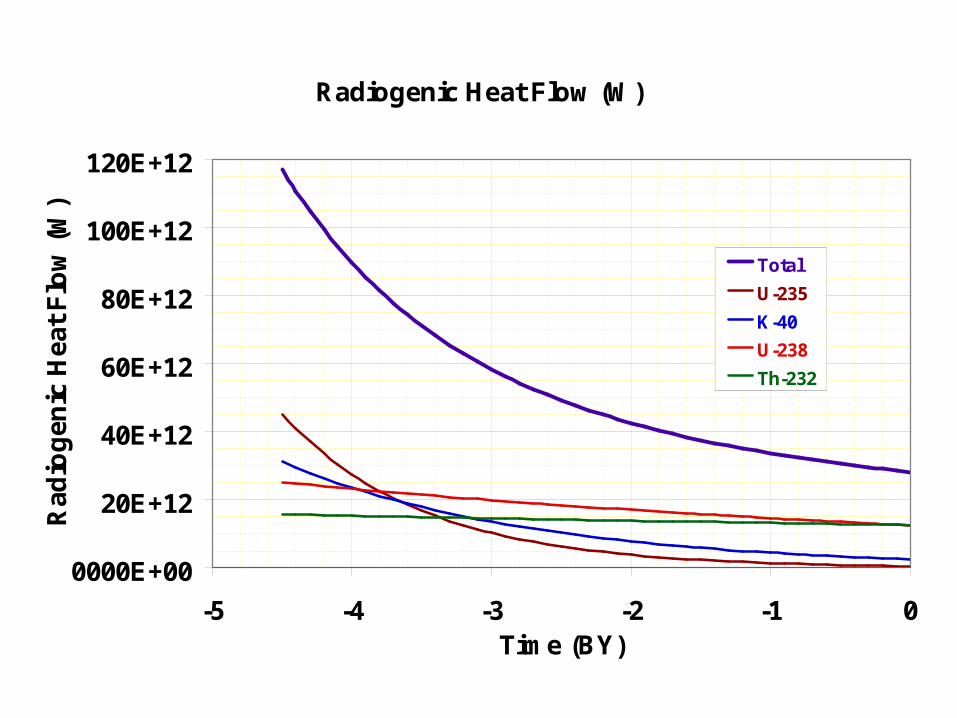
Radiogenic Heat Flow (W)
0000E+00
20E+12
40E+12
60E+12
80E+12
100E+12
120E+12
-5 -4 -3 -2 -1 0Time (BY)
Rad
iog
enic
Hea
t F
low
(W
)
Total
U-235
K-40
U-238
Th-232
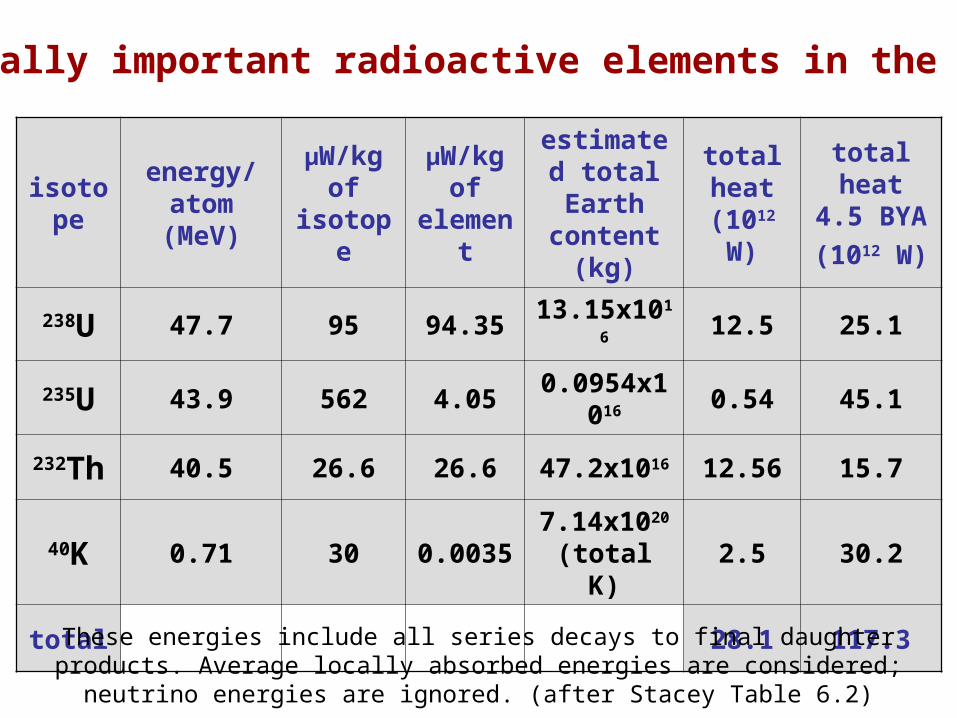
isotopeenergy/
atom (MeV)μW/kg of isotope
μW/kg of
element
estimated total Earth content (kg)
total heat
(1012 W)
total heat 4.5 BYA
(1012 W)
238U 47.7 95 94.35 13.15x10¹⁶ 12.5 25.1
235U 43.9 562 4.05 0.0954x10¹⁶ 0.54 45.1
232Th 40.5 26.6 26.6 47.2x10¹⁶ 12.56 15.7
40K 0.71 30 0.00357.14x1020 (total K)
2.5 30.2
total 28.1 117.3
Thermally important radioactive elements in the Earth
These energies include all series decays to final daughter products. Average locally absorbed energies are considered; neutrino energies are ignored. (after Stacey Table 6.2)

Temperature Evolution (K)
0
1000
2000
3000
4000
5000
6000
0E+00 1E+06 2E+06 3E+06 4E+06 5E+06 6E+06 7E+06Radius (m)
Te
mp
era
ture
(K
)
boundaries
4 BYA
2 BYA
0 BYA
assume temperature changes linearly with time
Mantle
Core

latent heat flow (W)
000E+00
1E+12
2E+12
3E+12
4E+12
0E+0 1E+6 2E+6 3E+6 4E+6 5E+6 6E+6 7E+6
radius (m)
late
nt
hea
t fl
ow
(W
)
ICBMantleCore
based on Stacey
now after 4 BY of freezing
2 BYA after 2 BY of freezing

before and after the Great Iron Catastropheenclosed GBE vs. volume
0.E+00
5.E+31
1.E+32
1.5E+32
2.E+32
2.5E+32
0.E+0 2.E+20 4.E+20 6.E+20 8.E+20 1.E+21 1.2E+21
volume (m3)
GB
E (
jou
les)
enclosed GBE (J)
"average density" enclosed GBE (J)
almost exactly
3GM2/5R

before and after the Great Iron Catastropheshell ΔT vs. volume
-40000
-20000
0
20000
40000
0.E+0 2.E+20 4.E+20 6.E+20 8.E+20 1.E+21 1.2E+21
volume (m3)
shel
l ΔT
(K
)
If iron accretes first, core is much hotter and mantle much cooler than if uniform composition
accretes. (if layers retain all GBE)
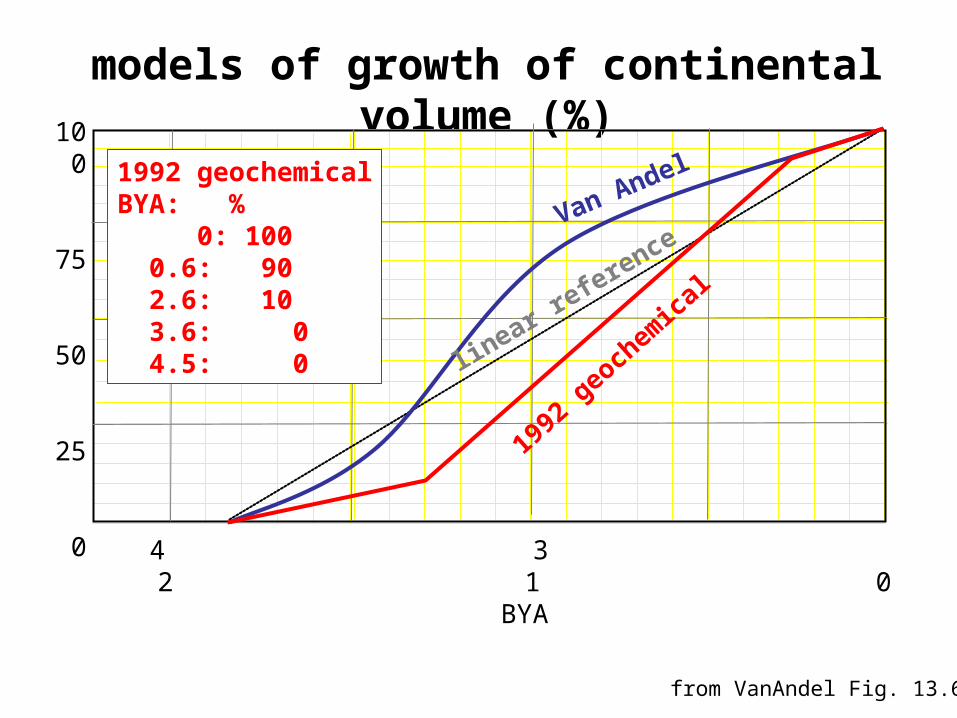
models of growth of continental volume (%)
4 3 2 1 0BYA
100
75
50
25
0
1992
geo
chem
ical
Van Andel
linear re
ference
1992 geochemicalBYA: % 0: 100 0.6: 90 2.6: 10 3.6: 0 4.5: 0
from VanAndel Fig. 13.6

The Atmospheresize of layersdensity, mass, gravity, pressure, volumecomposition – nitrogen oxygen water argon carbon dioxide aerosols material propertiestemperatureglobal energy budget and distribution – latitude season altitudeheat flow sources
absorbed sunlightEarth’s radiated energyair-sea interactions
energy transport: convection, conduction, radiationmass flow in convectionevolution of the atmosphere – composition structure density circulationorigin of the atmosphere

120
120
248
248
90902020
4848
surface
incidentshortwave flux
343
reflectedshortwave flux
21 69 16
outgoinglongwave flux
22 90 125
after Salby45, etc.
169 390 327 16 90
16
atmosphere
absorbedby clouds
absorbedby H2O, O3,
aerosols
reflectedby clouds
reflectedby surface
backscattered
by air
emittedby clouds
emittedby H2O, CO2,
aerosols
emitted bysurface
absorbedby clouds
absorbedby H2O, CO2,
aerosols
emittedby H2O, CO2,
aerosols
sensibleheatflux
latentheatflux
surface-atmosphereheat transfer
Average Global Energy Budget (W/m2)
169 + 327 = 496 surface 390 + 16 + 90 = 496
343 planet (21 + 69 + 16) + (22 + 90 + 125) = 343
(20 + 48) + (120 + 248 + 16 + 90) = 542 atmosphere (90 + 125) + 327 = 542
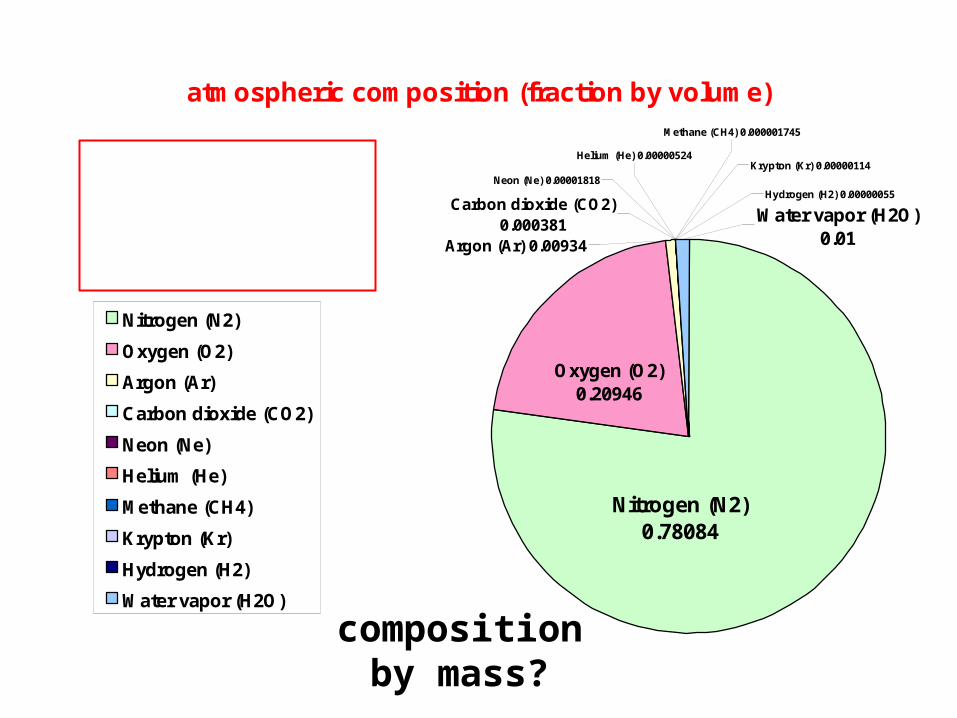
atmospheric composition (fraction by volume)
Water vapor (H2O) 0.01
Hydrogen (H2) 0.00000055
Oxygen (O2) 0.20946
Nitrogen (N2) 0.78084
Neon (Ne) 0.00001818
Krypton (Kr) 0.00000114
Carbon dioxide (CO2) 0.000381
Methane (CH4) 0.000001745
Argon (Ar) 0.00934
Helium (He) 0.00000524
Nitrogen (N2)
Oxygen (O2)
Argon (Ar)
Carbon dioxide (CO2)
Neon (Ne)
Helium (He)
Methane (CH4)
Krypton (Kr)
Hydrogen (H2)
Water vapor (H2O)
values are for dry airwater vapor is shown as
an additional 1% but varies enormously
compositionby mass?
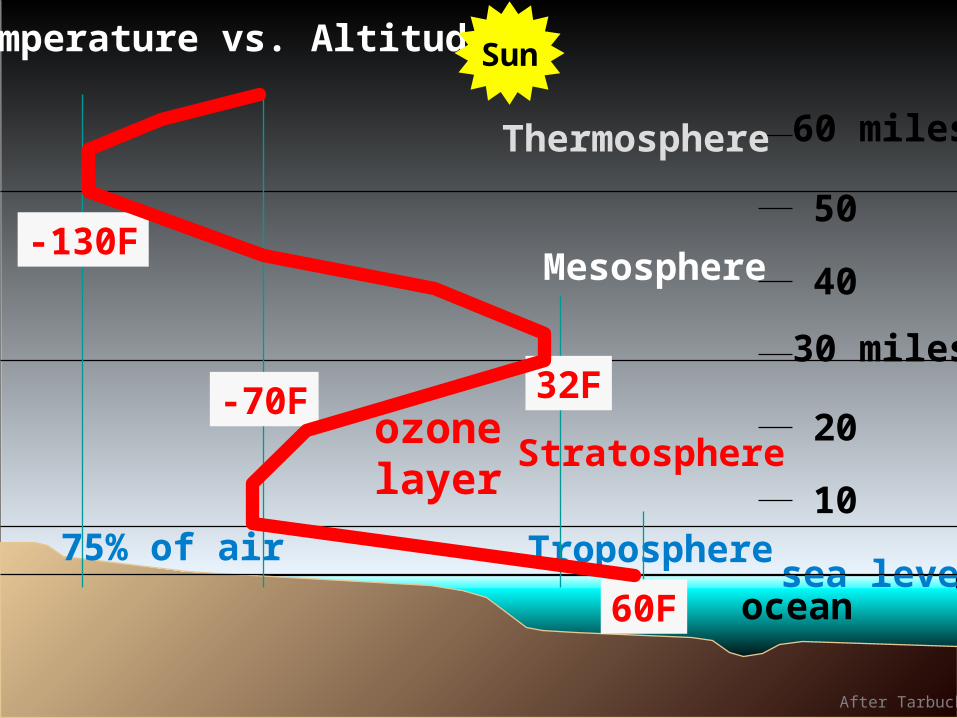
Temperatureof the atmosphere
ocean
60 miles
50
40
30 miles
20
10
sea level
Thermosphere
Mesosphere
Stratosphere
Troposphere75% of air
Temperature vs. Altitude Sun
-130F
-70F 32F
60F
ozonelayer
After Tarbuck

temperature (K)
0
100
200
300
400
0 20000 40000 60000 80000 100000 120000
altitude (m)

temperature (K)
200
210
220
230
240
250
260
270
280
290
300
0 2000 4000 6000 8000 10000
altitude (m)
~6.6 K per kilometer

Density (kg/m3)
1E-4
1E-3
1E-2
1E-1
1E+0
0 10000 20000 30000 40000 50000 60000 70000 80000altitude (m)
Den
sity
(kg
/m3)
density (kg/m3)
calculated density (kg/m3)
~10X decrease per 15-20 km ascent

Calculated Enclosed Mass (kg)
0E+00
1E+18
2E+18
3E+18
4E+18
5E+18
0 10000 20000 30000 40000 50000 60000 70000 80000altitude (m)
En
clo
sed
Mas
s (k
g)
half of the mass of the atmosphere
is below an altitude of 6 km and
is enclosed in a volume of
500 million km2 x 6 km
or 3 billion km3
or 3x10¹⁸ m3

0
0.02
0.04
0.06
0.08
0.1
0.12
24201612840
Equator
midnight midnightNoon
EquinoxSolar Flux vs. Time of Day
Tropicof
Cancer
Arctic Circle
North Pole
6 am 6 pm

12108642240
0.02
0.04
0.06
0.08
0.1
0.12
NoonMidnight 6 am14 16 18 20 22 24
Noon Midnight6 pm
Summer SolsticeSolar Flux vs. Time of Day
Equator
Tropicof
Cancer
Arctic Circle
North Pole

absorption by ozone, water, and CO2
scattering by N2, O2 and aerosols
0.3 0.5 1 1.5 2 2.5 30
500
1000
1500
2000
Wavelength
Inte
nsit
yvisible
window
UV Visible Infrared
sun is directly overheadno clouds
direct beam only
Spectrum of Sunlight observed on Earth

Ultraviolet Average Flux at 35N on Summer Solstice
0
10
20
30
40
50
cda cma dda dmaatmospheres
Flu
x (W
/m^
2)Absorption LossesScattering LossesFlux at Surface
Field - solar flux code

CO2 and H2O gasesabsorb far infrared
2 Blackbodies1 Greenhouse
atmosphere transparentto visible light
EarthFar Infrared
Energy
10 micron peakEarth is 300K
Sun
0.5 micron peakSun is 6000K
VisibleSolar
Energy

0 5 10 15 20 25 300
50
100
150
200
250
300
Blackbody Radiation
Wavelength
Inte
nsi
ty
373Kwaterboils
5800Ksolar energyabsorbedby Earth
255Katmosphere
273Kwater
freezes

288K Earth's surface
0 5 10 15 20 25 300
5
10
15
20
25
30
Greenhouse Gases Absorb Blackbody Radiation
Wavelength (microns)
Inte
nsi
ty
O3
CO2
H2O255K
atmosphere

Plants 15%
Soil20%
Sand40%
Average Visible Reflectancesof common substances
Sun
Clouds 50%
Snow 60%
Water8%

12108642240
0.02
0.04
0.06
0.08
0.1
0.12
NoonMidnight 6 am14 16 18 20 22 24
Noon Midnight6 pm
Energy Transfer in a Day
What is the hottest time
of day?
heatgain
oceanheat loss land
heat loss
desertheat loss

atmospheric circulationbottom heated
absorbed heat peaks at Equator
no rotation with rotation


368368 106106
6868
surface
incidentshortwave flux
343
reflectedshortwave flux
90 16
outgoinglongwave flux22 215
after Salby45, etc.
169 390 327 106
atmosphere
absorbed and reflected by
clouds, H2O, O3, aerosols
reflectedby surface
emitted bysurface
absorbed and emitted by
clouds, H2O, CO2, aerosols
latent and sensible heat
flux
surface-atmosphereheat transfer
Average Global Energy Budget (W/m2)
169 + 327 = 496 surface 390 + 106 = 496
343 planet (90 + 16) + (22 + 215) = 343
(68) + (368 + 106) = 542 atmosphere (215) + 327 = 542

HW2B OASES HW #2B ©Bob Field 2006
incident SW flux W/m2 343 use global average
gas SW reflection 0.262
gas SW absorption 0.198
gas LW absorption 0.944
surface SW reflection 0.086
surface SW absorption 0.914
surface latent and sensible heat 0.214
surface LW net absorption 0.786
gas SW absorption W/m2 68 only absorbs from above
gas LW absorption W/m2 368
gas W/m2 436 not counting non-radiative flux
surface SW absorption W/m2 169
surface LW absorption W/m2 327 +LH+SH 0.603
surface W/m2 496 fill in E14 !!!
radiating flux W/m2 390
latent and sensible heat W/m2 106
surface temperature K 288
bonus
gas temperature K 248planet temperature K 254
SW is short wavelength as in sunlight. LW is long wavelength as in infrared radiated by the Earth.
LW down welling fraction
from gas to Earth
Hint - Be sure to account for all fluxes absorbed from all sources (except C10).
fra
ctio
n o
f u
nit
y
Use the information in the diagram of a simplified global energy budget model to fill in C2 -C 9 and cell E14. Every row is a fraction of unity except the first row. C14 depends on E14.
Use physics and common sense to construct equations for C10, C11, C13, C14, C16, C17, and C18.
368368 106106
6868
surface
incidentshortwave flux
343
reflectedshortwave flux
90 16
outgoinglongwave flux22 215
after Salby45, etc.
169 390 327 106
atmosphere
absorbed and reflected by
clouds, H2O, O3, aerosols
reflectedby surface
emitted bysurface
absorbed and emitted by
clouds, H2O, CO2, aerosols
latent and sensible heat
flux
surface-atmosphereheat transfer
Average Global Energy Budget (W/m2)
169 + 327 = 496 surface 390 + 106 = 496
343 planet (90 + 16) + (22 + 215) = 343
(68) + (368 + 106) = 542 atmosphere (215) + 327 = 542
343 use global average
=90/343
=68/343
=368/390
=16/(169+16)
=1-C6
=106/(169+327)
=1-C8
=C4*C2 only absorbs from above
=C5*C16
=C10+C11
=C7*(1-C3-C4)*C2
=E14*(C12+C17) +LH+SH =327/(327+215)
=C13+C14 fill in E14 !!!
=C15-C17
=C8*C15
=(C16/0.0000000567)^0.25
=((C12+C17)*(1-$E$14)/0.0000000567)^0.25
=(((C12+C17)*(1-$E$14)+(C16-C11))/0.0000000567)^0.25
Use the information in the diagram of a simplified global energy budget model to fill in C2 -C 9 and cell E14. Every row is a fraction of unity except the first row. C14 depends on E14.
368368 106106
6868
surface
incidentshortwave flux
343
reflectedshortwave flux
90 16
outgoinglongwave flux22 215
after Salby45, etc.
169 390 327 106
atmosphere
absorbed and reflected by
clouds, H2O, O3, aerosols
reflectedby surface
emitted bysurface
absorbed and emitted by
clouds, H2O, CO2, aerosols
latent and sensible heat
flux
surface-atmosphereheat transfer
Average Global Energy Budget (W/m2)
169 + 327 = 496 surface 390 + 106 = 496
343 planet (90 + 16) + (22 + 215) = 343
(68) + (368 + 106) = 542 atmosphere (215) + 327 = 542

The Oceanssize of layersdensity, mass, gravity, pressure, volumecomposition – water salt dissolved gases and organics particulates organismsmaterial propertiestemperatureglobal energy budget and distribution – latitude season altitudeheat flow sources
absorbed sunlightair-sea interactions
energy transport: convection, conduction, radiationmass flow in convectionevolution of the ocean – salt ice evaporation flow patterns depth areaorigin of the ocean

Elemental composition of sea water (by mass)
Oxygen 85.7
Hydrogen 10.8
Chlorine 1.9
Sodium 1.05
Sulfur 0.0885
Magnesium 0.135
Carbon 0.0026
Bromine 0.0065
Potassium 0.038
Calcium 0.04
Oxygen
Hydrogen
Chlorine
Sodium
Magnesium
Sulfur
Calcium
Potassium
Bromine
Carbon
wikipedia

Gas
N2
O2
CO2
Dry Air
78%
21%
0.036%
Sea Water
12 ppm
7 ppm
90 ppm
Ratio of TotalAmount in Ocean
to Atmosphere
0.004
0.01
62
Abundance ofDissolved Gases
H2O 0.3% 97% 100,000

global average of 40 inches of precipitation per year
recycles 120,000 cubic miles of water
percolation
precipitation
27
vapor transport10
groundwater flow
return flow10
precipitation
94
After Stowe
oceans hold340 M cubic miles
units - 1000 cubic miles/year
evaporation & transpiration
17 evaporation
104

from Stowe
Sea Water & Fresh Water
Oceans hold 97.4% of Earth’s water with a sphere depth of 1.7 miles
Reservoir Fresh% Sphere Depth
Atmosphere 0.04 1 inch
Lakes 0.4 1 foot
Ground Water 25 60 feet
Polar Caps & Ice 75 180 feet

Reservoirvolume of water
(106 km³)Percent of total
Oceans 1370 97.25Ice caps & glaciers 29 2.05
Groundwater 9.5 0.68Lakes 0.125 0.01
Soil moisture 0.065 0.005Atmosphere 0.013 0.001
Streams & rivers 0.0017 0.0001Biosphere 0.0006 0.00004
1408.7047
volume of stored water500 million square km area x 3 km depth = 1.5x10⁹ km3
wikipedia
1.4x10⁹ km3 volume x 1000 kg/m3 x 109 m3/km3 = 1.4x10²¹ kg

ReservoirAverage residence
time (years)Oceans 3,200 yearsGlaciers 20 to 100 years
Seasonal snow cover 2 to 6 monthsSoil moisture 1 to 2 months
Groundwater: shallow 100 to 200 yearsGroundwater: deep 10,000 years
Lakes 50 to 100 yearsRivers 2 to 6 months
Atmosphere 9 days
Average reservoir residence times
wikipedia

Ocean and Atmosphere simplified heuristic models1. An Earthlike planet rotates on its axis. There is no atmosphere. The planet is dry except for an
ocean located on the Equator in a canal that is three kilometers deep and 3000 km wide (or less) and encircles the planet. Ignore any non-uniform heating effects from the Sun. I claim that the steady state solution is that the ocean water moves with the Earth so that an observer on Earth sees no currents in the ocean. True or False?
2. Would the same argument also apply if the entire featureless planet were covered with 3 km deep water? The equatorial bulge of the Earth due to its rotation will also appear in the global ocean so that the water depth would be 3 km at all latitudes. Since no water is flowing between latitudes, no Coriolis effects will appear even though water at different latitudes has different velocities but the same angular velocity. Therefore I claim that on a water covered planet, an observer would observe no currents in the ocean relative to the sea floor. True or False?
3. The same argument applies to the atmosphere of a featureless planet whether or not there is an ocean covering it. No winds appear as long as the planet is uniformly heated. If the ocean is top heated uniformly and the atmosphere is bottom heated uniformly, then the ocean will still have no currents, but the atmosphere will have a vertical air flow (thermals) that resembles Benard cells, but no Hadley cells between latitudes. True or False?
4. Do local perturbations produce transient flow patterns due to flow instabilities particularly in the lower viscosity atmosphere?
5. In the case of non-uniform heating, fluids flow between latitudes and the velocity differences between masses of air (and water) at different latitudes produce Coriolis effects. True or False?
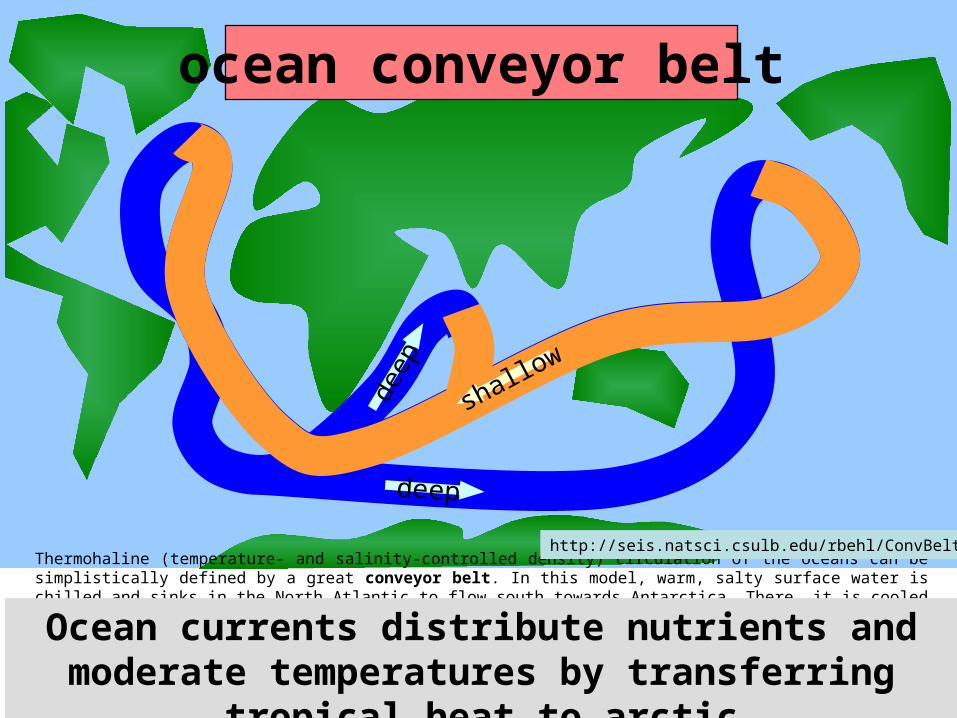
Thermohaline (temperature- and salinity-controlled density) circulation of the oceans can be simplistically defined by a great conveyor belt. In this model, warm, salty surface water is chilled and sinks in the North Atlantic to flow south towards Antarctica. There, it is cooled further to flow outward at the bottom of the oceans into the Atlantic, Indian, and Pacific basins. After upwelling primarily in the Pacific and Indian Oceans, the water returns as surface flow to the North Atlantic. While traveling deep in the ocean the originally nutrient-depleted water becomes increasingly enriched by organic matter decomposition in important nutrients (e.g., phosphate, nitrate, silicate) and dissolved CO2. Figure courtesy of Jim Kennett and Jeff Johnson, University of California Santa Barbara.
http://seis.natsci.csulb.edu/rbehl/ConvBelt.htm
ocean conveyor belt
deep
deep
shallow
Ocean currents distribute nutrients and moderate temperatures by transferring tropical heat to arctic

Keith Stowe, Exploring Ocean Science
surface currents are driven by winds which result from non-uniform heating of the globe

pelagic zone(water column)
benthic zone
(seafloor)Ocean Zonespelagic / benthic sediments
sedimentsplankton& nekton
Sun

photic zone(light)
aphotic zone(dark)
Ocean Zonesphotic / aphotic
Sun
V B G Y O R IRUV
10% 50' 0' 300' 40' 15' 2'

photic zone(light)
aphotic zone(dark)
pelagic zone(water column)
benthic zone
(seafloor)Ocean Zonespelagic / benthic
photic / aphotic
Sun

photic zone(light)
aphotic zone(dark)
neritic province(above continental shelf)
oceanic province(beyond continental shelf)
pelagic zone(water column)
benthic zone
(seafloor)Ocean Zonespelagic / benthic
photic / aphotic
neritic / oceanic
Nereus & 50 Nereid
Sun

space and Sun
atmospherewater world
“continental crust”oceanic crust
photic zone(light)
aphotic zone(dark)
pelagic zone(water column)
benthic zone(seafloor)
Sun

intertidalorlittoral zone
atmosphere
ocean
continental crust
oceanic crust
sediments
sediments
Sun

atmosphere
ocean
continental crust
sediments
sediments upwelling
Sun

blackbody radiation reduced by inverse square
distance
atmospheric absorption and scattering losses
reflection losses and refraction at air-sea surface
seawater absorption and scattering losses
horizontal receiving surface
stellar temperature
stellar radius
radius of planetary
orbit
wavelengths
polarizations
atmospheric composition: absorbers &
scatterers
flux above atmosphere
flux above sea surface
flux spectrum incident on horizontal surface
flux spectrum absorbed in last meter
flux spectrum scattered in last meter
flux reflected by air-sea interface
SolarSeaFlux Flow Chart
transmission angle
seawater composition: absorbers &
scatterers
incidence angle
seawater depth
©Bob Field 2003

300 350 400 450 500 550 600 650 700 750 8000.01
0.1
1
1010
0.01
0( )
0( ) 0( )
p 1( ) 0( ) 0( )( )
y 2( ) 0( ) 0( )( )
g 3( ) 0( ) 0( )( )
air ( ) air ( )
air ( ) air ( ) 0( ) 0( )( )
21
Field - solar sea flux code
absorption and scattering coefficients of air and water
actual curves of components depend on concentrations

300 350 400 450 500 550 600 650 700 750 8000
0.2
0.4
0.6
0.8
max
0
Tz z k 0 Hy ( )
21 Hx ( )
Field - solar sea flux code
transmitted sunlight in pure water vs. depth(0, 1, 3, 10, 30, 100 meters)

zone areas
1.0E+14
1.3E+14
2.1E+13
2.6E+14
3.1E+13 3.1E+13 1.8E+12
6.4E+13
0E+00
1E+14
2E+14
3E+14
torrid temperate frigid hemisphere
surface area (m2) disk area (m2)

zone temperatures
269250
195
255
361 353
287
361
0
50
100
150
200
250
300
350
400
torrid temperate frigid hemisphere
average temperature (K) noon peak temperature (K)
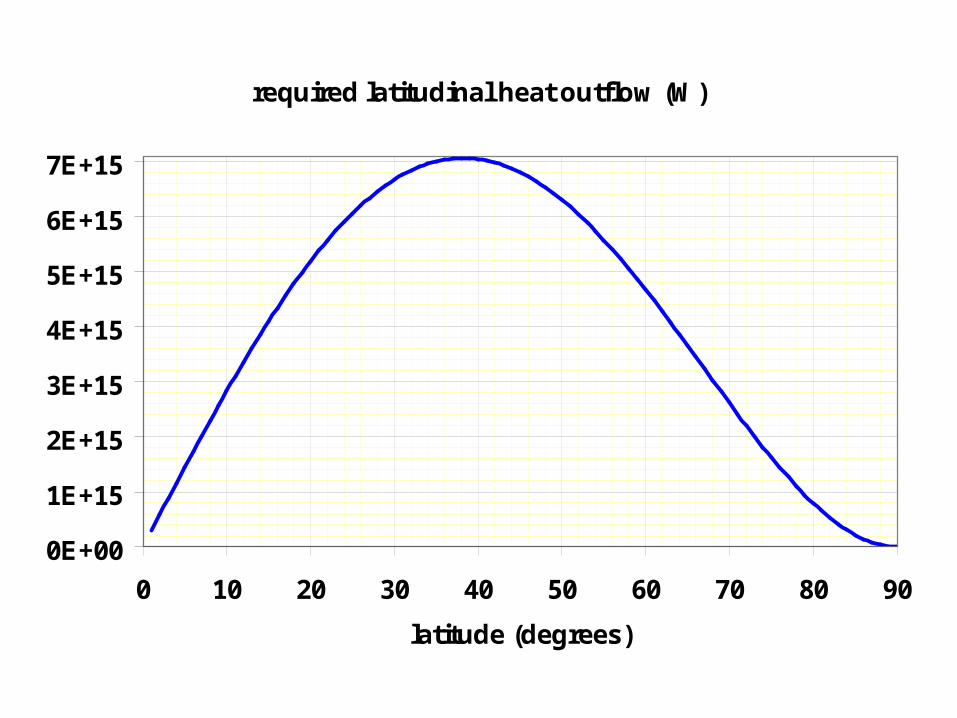
required latitudinal heat outflow (W)
0E+00
1E+15
2E+15
3E+15
4E+15
5E+15
6E+15
7E+15
0 10 20 30 40 50 60 70 80 90
latitude (degrees)

hypothetical air speed or water speed (m/s)
0.0
0.5
1.0
1.5
0 10 20 30 40 50 60 70 80 90
latitude (degrees)
air speed (m/s)
water speed (m/s)
waterdelta T = 10 K
10 m deep columndensity = 1000 kg/m3
specific heat = 4186 J/kg-K
airdelta T = 40 K
4000 m high columndensity = 1.228 kg/m3
specific heat = 1000 J/kg-K

water 1/mfp (1/m) vs. wavelength
1E-2
1E-1
1E+0
1E+1
1E+2
1E+3
1E+4
300 400 500 600 700 800 900 1000 1100 1200 1300 1400
wavelength (nm)

flux absorbed per meter vs. depth (m)
0
50
100
150
200
0 5 10 15 20 25 30
depth (m)
Flu
x ab
sorb
ed p
er m
eter
(W
/m3)

Organismsand
Ecosystems

ocean
sediments
sediments60 tons of organic matter in ocean is
dissolved organic molecules(yellow matter)
one ton of organic matter in ocean isparticulate
1700 pounds of particulate is detritus
240 pounds phytoplankton 60 pounds zooplankton
1 pound of large animals
after Stowe
Sun

ocean
sediments
sediments98.3% of all organic matter in ocean is
dissolved organic molecules = 2000 gC/m2
1.7% of all organic matter in ocean isparticulate = 35 gC/m2
86% of particulate is detritus = 30 gC/m2
12% is phytoplankton = 4 gC/m2
3% is zooplankton = 1 gC/m2
0.05% is large animals = 0.02 gC/m2
after Stowe
Sun
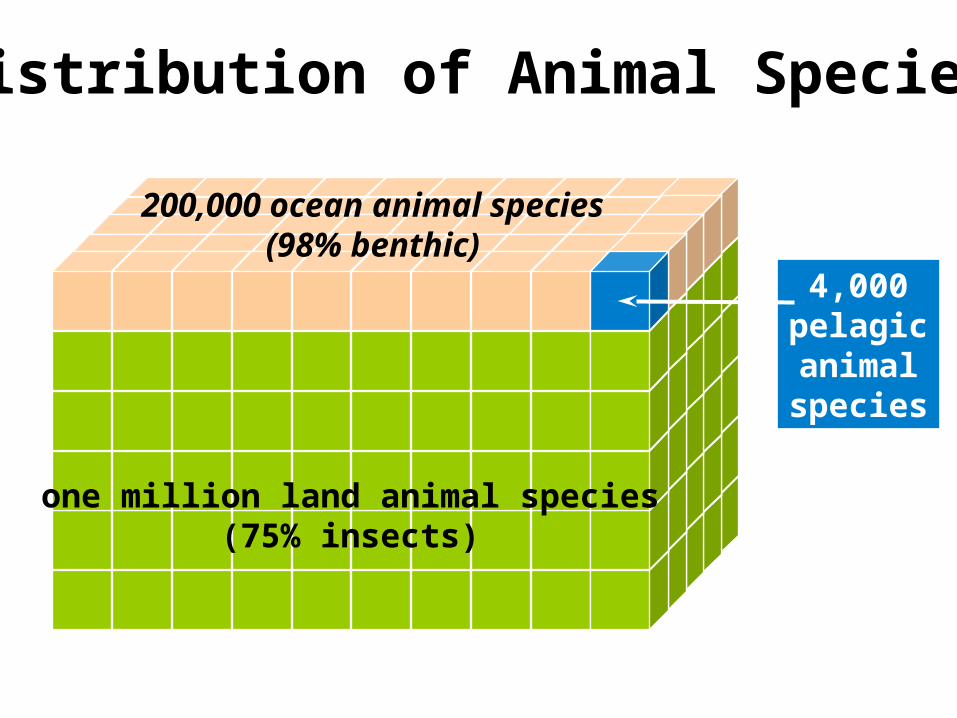
one million land animal species(75% insects)
4,000pelagicanimalspecies
200,000 ocean animal species(98% benthic)
Distribution of Animal Species

Plant Production
Upwelling
Coa
stal
wat
ers
OpenOcean
Land
after Keith Stowe, Exploring Ocean Science
The land is over three times more productive per square mile than the oceans.
There is more carbon production on land (25 billion tons per year)
than the much greater oceans (20 billion tons per year), even though the Earth is 72% ocean.
In the oceans, the coastal areas account for 18% of the plant production but only 10% of the area.
Upwelling areas account for 0.5% of the production but only 0.1% of the area.
Ocean Fish Production
Open Ocean
Coastal
Upwelling

Tjeerd van Andel, Science at Sea: Tales of an Old Ocean
0
50
100
150
200
Ocean FishProductivity/Area
Up
wel
ling
Coastalwaters
OpenOcean
0
25
50
75
100
125
150
175
200
Plant Productivity/AreaU
pw
ellin
g
Coastalwaters
OpenOcean
Land

from Stowe & Thurman
*before sinking below the photic zone
recycles per year
steps of bacterialdecompostion*
considerations
requirement
10
3
4
1
nitrogen
15
phosphorus
1
universe 200 1
oceans 6 1

Seasonal Abundance of Sunlight,Nutrients, Phytoplankton, Grazers
SunlightGrazers
Phytoplankton
Nutrients
Jan Feb March April May June July Aug Sept Oct Nov Dec
After Stowe 276

productivity (gC/m2/day)
continentalshelf
centralocean
high latitudes
Jan Feb Mar Apr May June July Aug Sep Oct Nov Dec
0.9
0.6
0.3
0
afte
r K
eith
Sto
we,
Exp
lori
ng
Oce
an S
cien
ce

temperate
continentalshelf
centralocean
Jan Feb Mar Apr May June July Aug Sep Oct Nov Dec
0.9
0.6
0.3
0
afte
r K
eith
Sto
we,
Exp
lori
ng
Oce
an S
cien
ce
productivity (gC/m2/day)

annual carbon cycle in the atmosphere
ocean
110
109
90
93
+1
+3billions of tons of carbon
Sun
7
-7

where is the carbon?(billions of metric tons)
ocean
Sun
from Biology of plants 5th Ed. by Raven et al. page 115
sediments20,000,000
deep ocean38,000,000
carbon dioxide gasin atmosphere 700
Dissolved organic matter ~2000humus2000
fossil fuels5000?
photosynthesis removes4 billion tons of carbonfrom atmosphere per year
dissolved gas 40,000

Moleculesand
Cells

What do cells do?
Store, exchange, and transform: matterenergy
information
Modern cells are chemical factories: complex, highly efficient, self-replicating.
Cells store and release energy to build up and break down biomolecules...
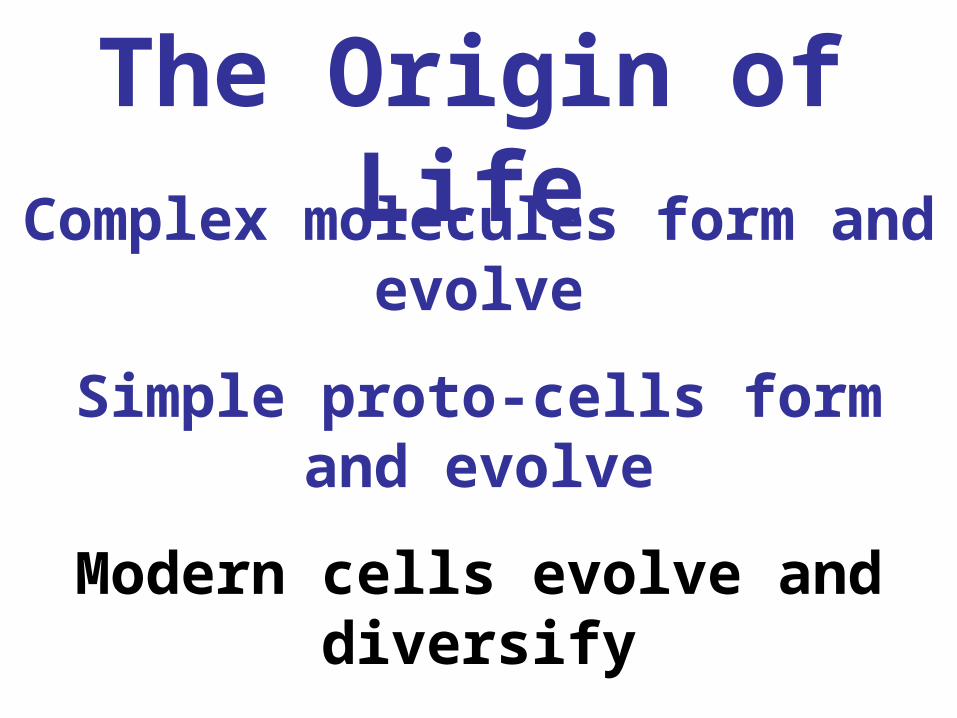
The Origin of Life
Complex molecules form and evolve
Simple proto-cells form and evolve
Modern cells evolve and diversify

All living things are related to a common ancestor
The cell is the building block of life.All cells are descended from cells.
The natural selection of molecules is the essence of the origin and evolution of life.
Trefil and HazenThe Sciences:
An Integrated Approach
5 kingdoms:bacteria
algaefungusplant
animal

What are the building blocks of molecules?
A, B, and C are all about 97% CHO
OC SH N P
Life’s Origin page 15by Walter Schopf A B C
Hydrogen 61 63 56
Oxygen 26 29 31
Carbon 10.5 6.4 10
Mammal
Nitrogen 2.4 1.4 2.7
Sulfur 0.13 0.06 0.3
Phosphorus 0.13 0.12 0.08
Calcium 0.23 - -
Bacteria Comet

H
H
O
O
O
O
P
N
NC H
H
H
H
C
O
O
SH
H
N
H
HH O ON
OO
H
H
O
O
OC SH N P
many common molecules are made from CHONSP
C
O
S

Methane can form new molecules O
H C H
H
H
O
methanolmethane
formaldehyde
formic acid biochemists give big names to
small molecules

OH C H
H
H
OH C H
H
H
C
H
H
C C C C C C C C C C CH N
CC CH N
C
H
H OH
H
H
H
C OC
CH N
CC NNC
H
N
H
N
CHONSP molecules are abundant in space:100 tons per year of IPDs land on Earth
(interplanetary dust particles) Cradle of Life pages 133-5 by William Schopf
C
H
H S
Organic molecules have many variations on a few themes

backbone of
phospholipid (H and O not shown)
CO, H2, PO4 are building blocks of phospholipids found in cell membranes
RC C C C C C C C
PiC C C C C
CC
C
fatty membrane spheresform naturally in meteors
C
H
O
HC
H
C
H O
C
H
H
OC
H
H
O
H
H
O
C
H
H
O
C
H
H O C
H
H O
C
H
H O
C
H
H O
C
H
H O C
H
H O
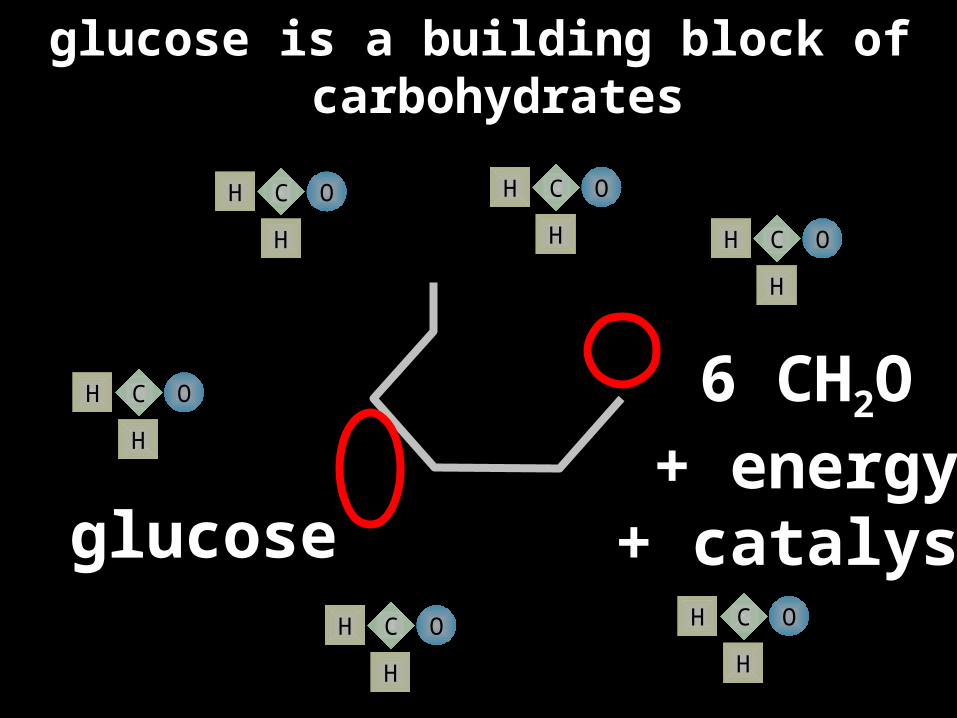
6 CH2O+ energy+ catalyst
C
O
C
H
O
C H
H
O
glucose is a building block of carbohydrates
glucose

C
H
O
HC
H
C
H O
C
H
H
OC
H
H
O
H
H
O
C
H
H
O
Sunlight
photosynthesis makes glucose from sunlight, carbon dioxide, and water
C
O H
H
O
O
6 H2O
H
H
O
H
H
O H
H
O
H
H
O H
H
O
C
O
O
C
O
O
C
O
O
C
O
O
C
O
O
6 CO26 O2glucose
C
O
C
H
O
C H
H
O
C
O
C
H
O
C H
H
O
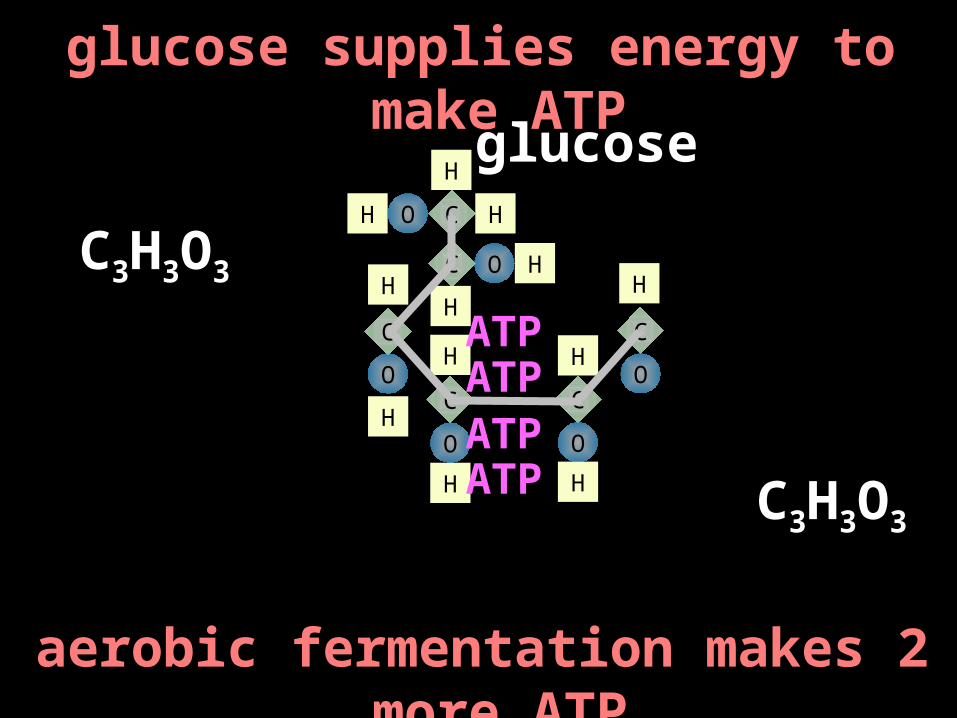
glucose supplies energy to make ATP
C3H3O3
C
H
O
HC
H
C
H O
C
H
H
OC
H
H
O
H
H
O
C
H
H
O
C3H3O3
glucose
ATP
ATP
aerobic fermentation makes 2 more ATP
ATP
ATP

C
H
O
HC
H
C
H O
C
H
H
OC
H
H
O
H
H
O
C
H
H
O
respiration liberates energy by oxidizing glucose into .... .
O
O
O
O
O
O
O
O
O
O
O
O
6 O2glucose

C
H
O
HC
H
C
H O
C
H
H
OC
H
H
O
H
H
O
C
H
H
O
respiration liberates energy by oxidizing glucose into carbon dioxide and water
C
O H
H
O
O
6 H2O
H
H
O
H
H
O H
H
O
H
H
O H
H
O
C
O
O
C
O
O
C
O
O
C
O
O
C
O
O
6 CO2
ATP ATP ATP ATPATP ATP ATP ATPATP ATP ATP ATPATP ATP ATP ATPATP ATP ATP ATPATP ATP ATP ATPATP ATP ATP ATPATP ATP ATP ATPATP ATP ATP ATP

C
H
O
H C
H
C
H O
C
H
H
OC
H
H O
H
H
O
C
H
H
O
C
H
H O C
H
H O
C
H
H O
C
H
H O
C
H
H O C
H
H O
6 CH2O+ energy+ catalyst
fructose is an isomer of glucose: table sugar forms by joining them

G G G G G G G
G F
simple sugar building blocks combine to form carbohydrates
when water is squeezed out
table sugar
cellulose
H2O
H2O H2O H2O H2O H2O H2O

C
H
H
O
C
H
H
O
C
H
H O
C
H
H
O
C
H
H
O
ribose is a building block of ATP, RNA..
C
H
H O C
H
H O
C
H
H O
C
H
H O
C
H
H O
5 CH2O+ energy+ catalyst
deoxyriboseribose

H
N
N NCN
C HC
H
C
H
CHN
CH N
CH N
nucleic acids are building blocks for energy and information in ATP, RNA...
CH N
CH N CH N
5 HCN+ energy+ catalyst
adenine

RPiPi Pi
Nucleotides are combinations of nucleic acids,
ribose sugar, and inorganic phosphate
A
PiPi Pi
RH2O
H2O
UGCT
D
triphosphates transport energy for transfer RNAs, membrane synthesis, and sugar synthesis.
monophosphates relay signals within a cell

nucleotide building blocks combine to form RNA and DNA
when water is squeezed out
R
A
Pi R
U
Pi R
C
Pi R
A
Pi R
G
Pi
H2O H2O H2O H2O
C
H
H
O
C
H
H
O
C
H
H O
C
H
H
O
C
H
H
O

OC
H
N
O
CH
H
H
H
CH N
amino acids are readily made fromsimple molecules by adding energy
C
H
H O
O
H
Hwater
formaldehyde
hydrogen cyanide
glycine

OC
H
N
O
CH
H
H
H
CH N
amino acids are readily made fromsimple molecules by adding energy
C
R
H O
O
H
Hwater
“R”-aldehydehydrogen cyanide
genericamino acid

OC SH N
amino acids are building blocks of proteins that function as enzymes and structures
OC
H
N
O
CH
H
H
H
C
OC
H
N
O
CH
H
H
H
H H
C
N
C
OC
H
N
O
CH H
H
H H
C
C
CC
CC
C
H
H
HH
HH
all 20 amino acids have the same backboneand all have H and OH on the ends

ribosomes synthesize proteins by translating mRNA to tRNAs that are attached to amino acids
21
A U G C A U G C G U A U G U U A C A G U C C G A C U A G G A U G A
3 4 5 6 7 8 9
A C UC C UG A UG C UC A GU G UC A AA U AC G CG U A
H2O H2OH2O H2O H2O H2O H2O H2O
after Trefil and HazenThe Sciences:
An Integrated Approach
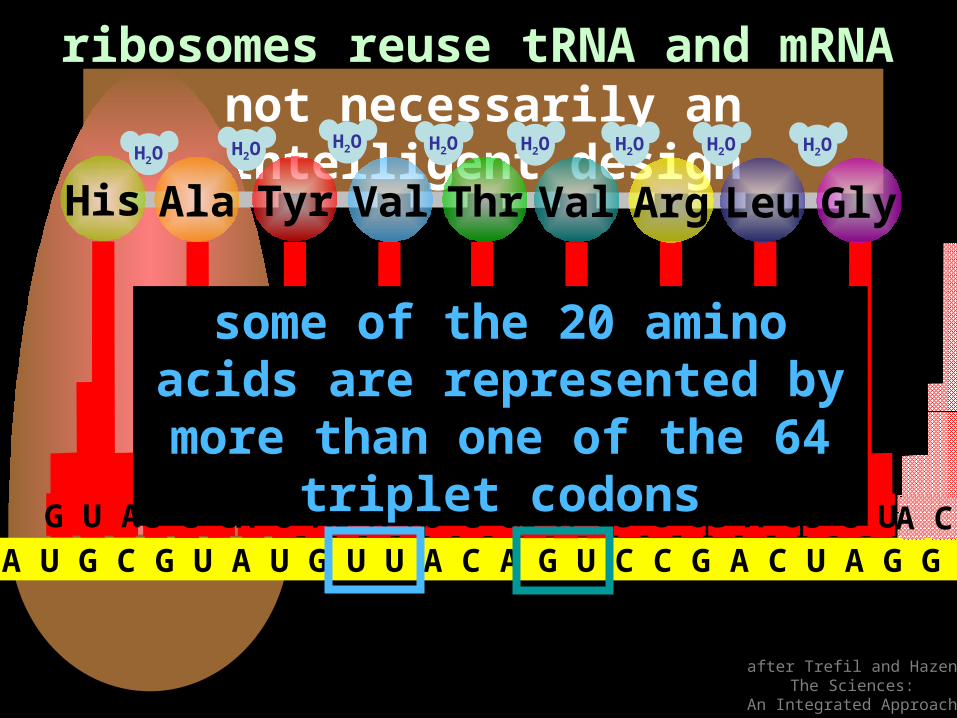
not necessarily an intelligent designribosomes reuse tRNA and mRNA
A U G C A U G C G U A U G U U A C A G U C C G A C U A G G A U G AA C UC C UG A UG C UC A GU G UC A AA U AC G CG U A
after Trefil and HazenThe Sciences:
An Integrated Approach
AlaHis Tyr Val Thr Val Arg Leu GlyH2O H2O
H2O H2O H2O H2O H2O H2O
some of the 20 amino acids are represented by more than one of
the 64 triplet codons

Catalysts are vital to many processes:Proteins help produce complex molecules
after Trefil and HazenThe Sciences:
An Integrated Approach
Modern cellular processes are highly regulated

DNA+RNA+Protein WorldRNA+Protein World
RNA World
Peptide (PNA) World?Thioester World?
Clay World?
Which self-replicating molecules came first?
no record of early biochemistry
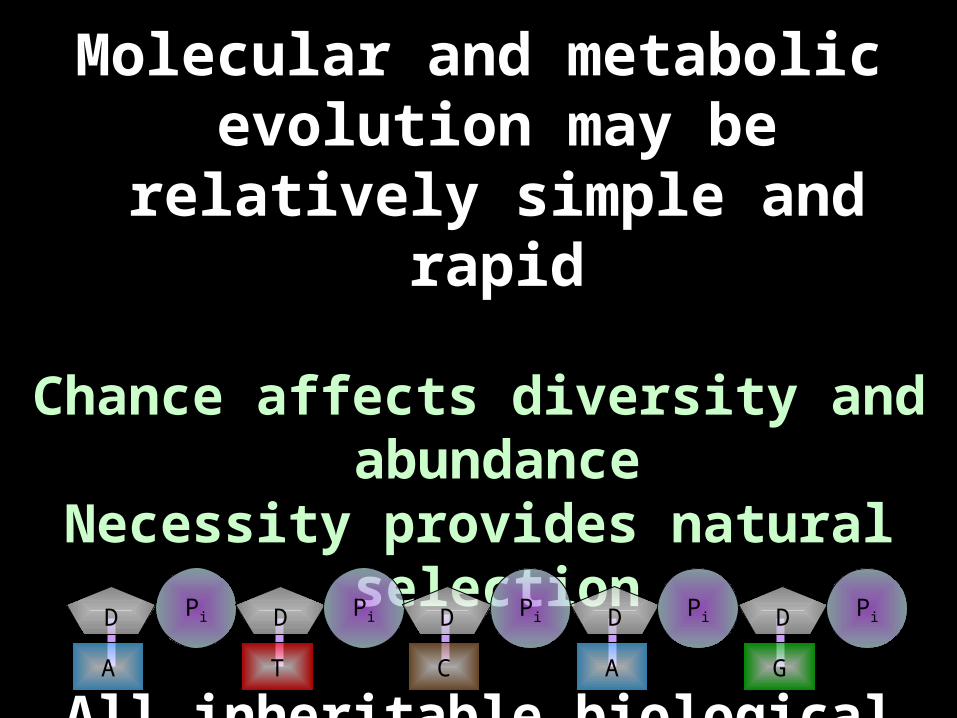
Molecular and metabolic evolution may be relatively simple and rapid
Chance affects diversity and abundanceNecessity provides natural selection
All inheritable biological changes are based on molecular evolution
D
A
Pi D
T
Pi D
C
Pi D
A
Pi D
G
Pi

mRNA provides the message to link amino acids into proteins
A U G C A U G C G U A U G U U A C A G U C C G A C U A G G A U G A
How does a computer “design” its own software?
AlaHis Tyr Val Thr Val Arg Leu Gly

1
52 321
A U G C A U G C G U A U G U U A C A G U C C G A C U A G G A U G A
How does information evolve?
21 3 4
2 3
21 3
21 3
4 5
duplication

4 5
1
52 321
A U G C A U G C G U A U G U U A C A G U C C G A C U A G G A U G A
How does information evolve?
21 3 4
2 321 3 21 3
deletion and insertion

AlaHis Tyr Val Thr Val Arg Leu Gly
D
A
Pi D
T
Pi D
C
Pi D
A
Pi D
G
Pi
RC C C C C C C C
Pi
C C C C CC
CC
C
HO
HCH
C
H O
C
H
H
OC
H
H
O
H
H
O
CH
HO
R
A
Pi Pi Pi
CN
C
OCH
N
O
CH H
H
H H
C
C
CC
C C
CH
H
HH
HH
21
A U G C A U G C G U A U G U U A C A G U C C G A C U A G G A U G AC G CG U A
The Facts of LifeAll cells come from other cells
All cells have membranes, proteins, carbs, & DNA
All cells use similar metabolic processes
All cells use the same genetic code for replication
All cells descended from a last common ancestor
The first cells came from non-cellular materials and were much simpler than any modern cells

http://www.its.caltech.edu/~atomic/snowcrystals/photos/photos.htm
Let me be crystal clear:
Complex patternsdo not require
intelligent designers!
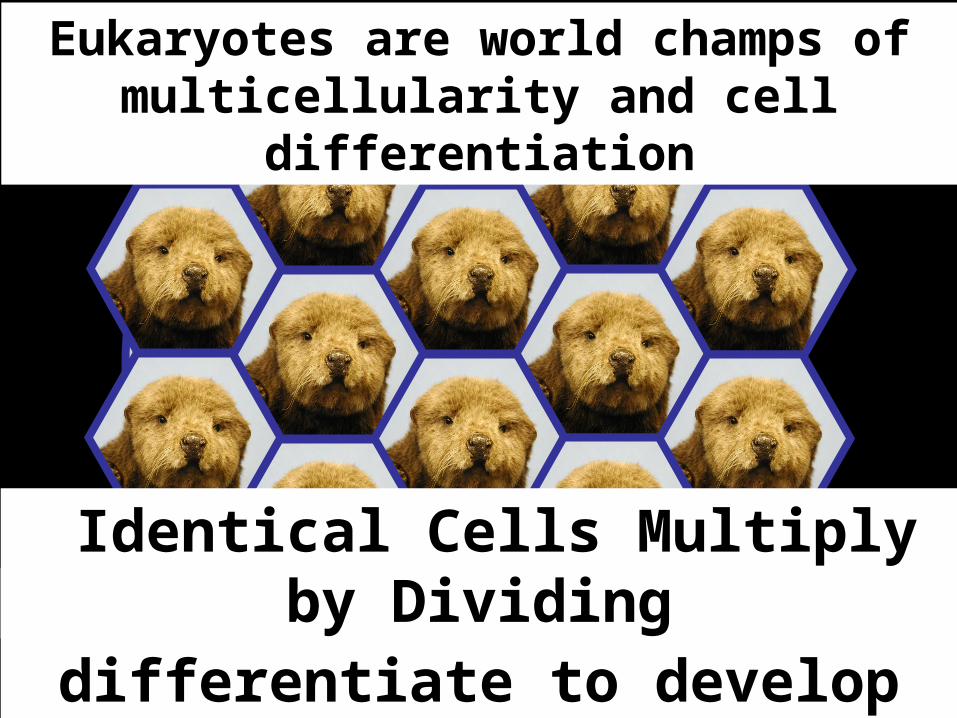
Eukaryotes are world champs of multicellularity and cell differentiation
Identical cells differentiate to develop into a multicellular organism
Identical Cells Multiply by Dividing

Last common ancestor appearsLCA branches into
archaebacteria, eubacteria, and eukaryote predecessors
metabolic processes diversifyautotrophs evolve
hot The first eukaryote grew 10,000 times larger than
other bacteria because its membrane lost its cell wall.
methane
hotter salt
sun
sulfur
bacteria
archaeaeucarya
LCA
lateral and vertical gene transfer proto
cell
protocells feed on moleculesreplication processes evolvemetabolic processes evolve

Eukary
a
ArchaeaBacteria
Eukarya
Multicellularity(the labeled branches)evolved independentlya number of times
A molecular phylogeny of the major groups of organisms, showing that multicellularity (the labeled branches) evolved independently a number of times. The tree is based on a small subunit of the ribosomal RNA. The rectangles indicate terrestrial groups.
Archaea
Bacteria
Animals
Fungi
Red algaeGreen algaePlants
Brown algaeDiatoms
CiliatesSorogena
MyxomycetesCellular slime molds
Foraminifera
MethanosarcinaMyxobacteria
Cyanobacteria
Actinomycetes
lastcommonancestor

2
8
32
128
2
4
8
16


