-Al77 458 THE RELATIONSHIP BETWEEN REENLISTMENT INTENTIONS AND 1/ RESERVE PARTICIPATION WIITHIN THE ARMED FORCES(U) NAVAL 6"P OSTGRADUATE SCHOOL MONTEREY CA T HAAKESTAD DEC 8 I UNCLASSIFIED F/C 5/9 NI. EOMOEEEE
Transcript
-Al77 458 THE RELATIONSHIP BETWEEN REENLISTMENT INTENTIONS AND 1/RESERVE PARTICIPATION WIITHIN THE ARMED FORCES(U) NAVAL
6"P OSTGRADUATE SCHOOL MONTEREY CA T HAAKESTAD DEC 8I UNCLASSIFIED F/C 5/9 NI.
EOMOEEEE
tuL.
W M2 llJ Illg51111 I 32 J 11202
111IL25~ .4± 11I.6
VICROCOPY RFSOLUTION TEST CHAl
~1 ,
I,, o- .o • oo
4KKp. .. ., . .
NAVAL POSTGRADUATE SCHOOL,n Monterey, California
JN .
DTICELECTE
MAR 0 51987 ~
THESIS °THE RELATIONSHIP BETWEEN REENLISTMENT
C" INTENTIONS AND RESERVE PARTICIPATION
WITHIN THE ARMED FORCES
LA by
Tor-Egil Haakestad
December 1986 -.
Thesis Advisor: G. W. Thomas
Approved for public release; distribution is unlimited 4J
6a NAME OF PERFORMING ORGANIATION 6b OFFICE SYMBOL 7a NAME OF MONITORING ORGANIZATION(it applicable)
Naval Postgraduate School j 54 Naval Postgraduate School6< ADDRESS iCIty State. and ZIP Code) 7b ADDRESS (Citry. State. and ZIP Code)
Monterey, California 93943-5000 Monterey, California 93943-5000
Sa NAME OF FUNDING, SPONSORING 8 b OF'ICE SYMBOL 9 PROCUREMENT INSTRUMENT IDENTIFICATION NUMBERORGANIZATION j(if applicable)
31: ADDRE SS(City. State, and ZIP Code) 10 SOURCE 0F FUNDING NUMBERS
PROGRAM IPROJECT TASK~ WORK ;,NiTELEMENT NO NO NO ACCESSON NO
rI,~~ue~cu~yCa~ifca~o)THE RELATIONSHIP BETWEEN REENLISTMENT INTENTIONSAND RESERVE PARTICIPATION WITHIN THE ARMED FORCES.
;ESOAATHRI Haakestad, Tor-Egil.3 0 REPORT 3b'ME COVERED 14 DATE OF REPORT (Yea, Month Day) 15 PAGE (O NT
Master's Thesis FROM TO 1986 December 626 S,.P--)EVTNTARY NOTATION
*COSATi CODES 19 SUBJECT TERMS (Continue on reverse if necessary and identify by block number)
ED GROUP SUBGCROUP Enlisted personnel, Affiliation, Career decisionsReenlistment , Reserve intentions,,,,
.3 .9SIRACT (Continue on reverse of necessary and identify by block number) - ,.1
'This thesis investigates the military affiliation intentions ofenlisted personnel in all four branches of service in their first orsecond term with less than a year remaining of their present active dutyr
obligation. The investigation is done in two sequences:
(1) reenlist/does not reenlist ("stayers" vs "leavers"), and forthose who plan to leave,
(2) join the reserves/do not join the reserves ("reservists" vs"fcivilians");
using the demographic, tenure, congnitive/affective, economic, and
employment alternatiie variables as explaining factors. The analysis isS*Q~3 J'0ON AVAILABILITY OF ABSTRACT 121 ABTACT SECURITY CLASSIFICATION
KI _NCASSIF'ED'tJNL'MITED 0 SAME AS RPT Q OTIC USERS Unclassified'2a '.A'.E 0F RESPONSSLE NDIV1OUAL 22b TELEPHONE (Include Area Code)72cO-CESMO
George W. Thomas 408-646-2161 54Te
00 FORM 1473, 84 MAR 83 APR editonmnay be used umrt.I ewI9Iusted SECURITY CLASSIFICATION 0% T,'S PAGEAll other editioris are obsolete UNCLASS I FIED
UNCLASSIFIED* SECUNITY CLASSIFICATION OF THIS PAGE (ftin Dae Ente4
19. Abstract. (cont)
' done by using the Probit probability model which calculates theprobabilities of each individual to reenlist/join the reserves,given specific characteristics. The results show that the
,* explanatory effect using the groups of variables mentioned,- above, is higher for the reenlistment decisions than for the
reserves decisions. ,
4.'
-..-
0
0
S N 0 102- LF. 0 14 6601
2 UNCLASSIFIED04 SECURITY CLAISIVICATION OF THIS PAGE(W"e Des. Entered)
Approved for public release; distribution is unlimited.
The relationship Between ReenlistmentIntentions and Reserve Participation
Within the Armed Forces
bvI
Tor-Egil HaakestadCivilian, HQDEFCOM Norway
B.S., Bedriftsoekonomisk Institutt, 1967
Submitted in partial fulfillment of the A-TIes lon For
requirements for the degree ofDTZC TABUnannounced
02 MASTER OF SCIENCE IN MANAGEMENT -i
By':,Dist rbuton/_____
'.from the Availability CodesAvail a1nd/or
NAVAL POSTGRADL'ATE SCHOOL IDist tSpecialDecember 1986 / _ .___
.1;
Author: - -, A t, 1,-.--/itiTor-EDistribktioa/
"f.WromgsTei thedvisori Cde
LMeSolnick, Second Re16er
W. R. Greer, Jr., Chair~nan.Department of Administrati e Science
', ~Kneale T..Marshall. ,__Dean of Information and
- This thesis investigates the military affiliation intentions of' enlisted personnel in
all four branches of' service in their first or second term with less than a year remaining
of' their present active duty obligation. The investigation is done in two sequences
SI) reenlist does not reenlist ("stayers" vs "leavers"), and for those who plan to"' leave
2) join the reserves do not join the reserves ("reservists" vs "civilians"),
using the demographic, tenure, cognitive affective, economic, and employment
alternative variables as explaining factors. The analysis is done by using the Probit-- * 'probability model which calculates the probabilities of each individual to reenlist join
the reserves, given specific characteristics. The results show that the explanatory effect
.- using the groups of variables mentioned above, is higher for the reenlistment decisions
11- than for the reserves decisions.
04
,G.
,0°
-"al
o. "
TABLE OF CONTENTS
IN T R O D U C iO N ............................................. 10
A . G E N E RA .L .............................................. 10
B. D A T A BA SE ............................................. 10
C. RESEARCH QUESTIONS ................................. I 1
D . M ETHO DO LOG Y ........................................ 11
E. LITERA TURE REVIEW .................................. 11
F. ORGANIZATION OF THE STUDY......................... 11
II. LITERATURE REVIEW-DATA REVIEW ........................ 13
A . G EN E R A L .............................................. 13
B. DEFINITIONS AND VIEWS OF TURNOVER ............... 14
C. VARIABLES AFFECTING TURNOVER .................... 15
1. Individual Demographic and Personal Factors .............. 16
SINCOME AND ECONOMIC INCENTIVE VARIABLES.................2S
-4. EMPLOYMENT ALTERNATIVE VARIABLES........................2)
* .TENTATIVE REENLISTMENT MODEL ............................. 41
-. 6. FINAL REENLISTMIENT MODEL ...... ............ 3
~7 . ACTUAL VS PREDICTED REENLISTMLNTS........................40
S. TENTATIVE RESERVE MODEL ................................... 43
9. FINAL RESERVE MODEL ............................... 44
1W. ACTFUAL VS PREDICTED RESERVES ............................... 47
017
LIST OF FIGURES
-. ! Probit Model ............................. .................... 30
I. INTRODUCTION
A. GENERAL
-\s the L.S. \rmed Forces shifted from a draft s stem to an All Volunteer I rce
in 19-3. the efforts to keep necessary quantity and quality of people atfiliated 'wAith the
military become crucial in obtaining the U.S national security objecti es. Because 0i
- the fact that the new system is an entirely volunteer s-, stem. military policy makers and
commnranders in each of the services have to watch closely what impact the policies andthe dav to day manaiement have on the enlistees affiliation wishes.
The effectiveness of the Armes Forces is depending upon the experience lex el andskills of - among others - the enlisted personnel. The nature of the duties in the \rmed
Forces are such that the high performance needed to obtain national security objectivescan be reached only if at least a great number of the enlisted have been in the servicesfor a substantial amount of time. Therefore the turnover within the mihtarv services
has to be closely watched.
This thesis investigates the affiliation intentions of active duty enlisted personnel
in all four services, serving in their first or second term of enlistment, and have 'ess
than one year left of their present obligations.
- B. DATA BASE
With manpower issues assuming an ever greater importance in Defence planningand budgeting. Rand Corporation conducted under Task Orders 79-V-1 and SO-V-I astudy, sponsored by the Office of Assistant Secretary of I)efence ( Manpower, Reserve
At-llres & Logistics). seeking to develop broad strategies and specific solutions fordealing % ith present and future manpower problems. In connection with this study a
0. major data collection efTort was made - the "1978 DoD Survey of Officers and Unlisted
Personnel' - which focused on the in-service population, i.e. the men and women onactive duty in all the four services. Since this study investigates the career deLisions ofenlistees close to their end of present enlistment contract, only the first part of this
survey - Form I - which emphasized on reenlistment career intentions was used.
This survev is the last major survey of that kind adminis'ered and - es en if this js
of some aLe - the information gathered are believed to still be valid, and will be used in
I-he research questions of this analysis will emphasize on the investigation Of
,h~civ of the demographic, tenure, cognitive affective, economic, and employment
iter:na:ve factors that have implications on an enlistees reenlistment intention and
.: ,cnten !cr joining the reserves. Further, the magnitude of each of the explanator',, u:r:pa ron trioe decisi:ons will also be examined. The reenlistment intentions and
t'e :ntentlon, o: joining the reserves are dichotomized - that is the intentions are
cr c:-ac: a .es no fashion. Chapter IV analyses the reenlistment decisions
NC'.er "s leavers- while Chapter V analyses the reserve intentions - 'reservists vsI:,, .:arls .
D. METHODOLOGY ..
SimL the model developed and analyzed are binary-choice models, the
;,Ct>dOu,)V to use had to be able to calculate the likelihood (probability) of
ecnl:': ent or joining the reserves) of an individual with given characteristics. Thepro 'a 'niy has to lie between () and I: a weighted least square method cannot be used
,ine there is no guarantee that the predicted value of the dependent variable will lie in
c- I nterval. .\ non-linear probability model - Probit - solves that problem and will'mc a'p!ieJ. The Probit model is associated with the cumulative normal probabilityI :.n.t on. ! .
E. LITERATURE REVIEW
[o dcvelop a conceptual frame work in which the turnover of enlisted personnel
,I'l :c viewed, the factors that former researchers have found important in explaining 0
,!,c turnoser phenomenon was explored. Those variables factors found in that
1I*crature .earch was used as the basis of the choicee and grouping of the candidate 7:,ahles farther analyzed to develop the final reenlistment and reserve models.
F. ORGANIZATION OF THE STUDY
I his study will in Chapter II give the literature review in detail and the data
re, e., including the definitions and views of turnover, the variables affecting turnoveranld by other researchers, and the useful grouping of the explanatory variables. At
" c o! , the chapter there is a description of the data base from which the data used
Ire ar;:eaed :am.'
'II••'°
] ] . .'
In the next chapter the dependent variable for each of the two models
investigated are discussed. So are also the independent explanatory variables finally
argued for to be included in the groups of candidate variables. The chapter conclude
with the description of the regression model used - Probit - and why the Ordinary
Least Square method are of no use.
Chapters IV and V describe the analysis of the reenlistment decisions and the
reserve decisions, respectively, including the model estimation and the results from
these analysis. An analysis of the models' prediction power follows at the end of each
of those chapters.
The final chapter - Chapter VI - summarize the conclusions commenting the the
different explanatory variables that affected both the reenlistment and reserve model.
and those who affected only one of the models. Some recommendations are given and
the chapter concludes with the suggestions for further areas of investigations research.
-- 1
04
.3
4 ..
.
- o.-
p" . *"
II. LITERATURE REVIEV/DATA REVIEW
A. GENERAL
The purpose of this literature review is to develop a conceptual framework in
which the turnover of military enlisted personnel can be viewed, and to describe the
factors that former researchers have found important in the explanation of the
turnover phenomena.Employee turnover has numerous potential negative consequences for an
organization such as:
• increased costs.
* demoralization,negative public relations,
* operational disruptions,
* strategic opportunity costs.* decreased employee social integration,
potential security problems.
In contrast positive consequences of turnover includes:* removal of undesirable employees,
-- voluntarv termination rather than unvoluntarv termination,
"* fresh thoughts and experience enter the organization,
advancement and promotion opportunities,
.' loss of dissatisfied workers can improve working environment.
Turnover has been the object for academic research for more than 70 years. As
indicated by Muchinsky & Morrow [Ref, 1] there have been more than 2000publications on the topic. Turnover has been researched from psychological, as well as
sociological and economic perspectives. Psychologists have predoninatly studied the
relationship between turnover and job satisfaction, personality, intelligence, aptitude.
.,*..-. and biograjbcal data. The impact of structural determinants on turnover has been
investigated primarily by sociologists and organizational theorists. Economists have
studied the relationship between turnover and such factors as the business cxcle and
Abelson & Baysinger [Ref. 21 indicate that trying to determine the extent of an
organization's turnover problem from its absolute turnover rate is inappropriate For a
number of reasons. First, some of the total turnover is due to involuntary turnover
like death, illness, or retirement. Generally , those separations are inappropriate for
the study of' turnover. Second, some employee separations involve employees the
organization would pref'er not to retain and is merely a convenient substitute for
termination.
Dalton et al. [Ref. 3] divide voluntary turnover into controllable and
uncontrollable turnover. Since their study of turnover is conducted for the purpose of
finding areas for managerial discretion to control turnover, it is important to know
what kind of turnover the organization can do something about. Voluntary turnover
-_a caused by job dissatisfaction can be corrected, but people leave an organization for
other reasons as well, like further education, health matters, and family comnitment.
The 4 gration of those employees that the organization wants to keep is costly,
but it may' that the full organizational cost of retaining those employees may exceed
the values of the costs savings associated with preventing their separation. As Dalton
'Cited in Abelson & Baysinger, Ref 2.
-Cited in Abelson & Bavsinger, Ref 2.
14
i. . ., -.
, & Todor have noted "It may be far less expensive to cope with turnover than to
prevent it" (1979, p. 226). 3 The optimal turnover rate is the rate that minimize the sum
of the costs of turnover and the costs of reducing it. Mowday [Ref. 4] states that
researchers have often neglected the positive outcomes associated with employee
turnover, as suggested by several authors (Dalton and Tudor, 1982; Moblev, 1982:
,AN' Mowday, Porter. and Steers. 1982; Staw, 19S0). 4
C. VARIABLES AFFECTING TURNOVER
As reviewed in Muchinsky & Morrow [Ref 1], Porter and Steers (1973) 5
examined the relationship between met expectations and turnover. They found that
when an employee's prior expectations are met on the job, the person is less likely to
quit.
Further, Price (1975)6 provides an inventory of four turnover determinants which
have received empirical support. Those are pay, participation in primary groups.
communication, and centralization.
Muchinsky & Morrow [Ref. 1] suggest that turnover has three major sets of
determinants: individual, work-related, and economic opportunity. Empirical evidence
shows that the following variables are related to turnover.* Individual factors
Age. length of service, family size, vocational interest,inlelligefce, biographical indicies. aptitude, personality;
* Work-related factors
Recoenition and feedback, supervisory characteristics.experienced job satisfaction, role clarity, pay, promotion:
* Economic opportunity factors
.Employment level, average level of earnings, number ofjob vacancies.
As stressed by Muchinskv & Morrow [Ref. 1], turnover is not the end product
itself, but rather in turn has consequences for the individual, the organization , and
society. Further they state that surprising little attention has been devoted to the
consequenee of turnover.
-Cited in Dalton et al., Ref 3.4 C ited in Mowdav, Ref 4.5Cited in Muchinskv & Morrow, Ref 1.6Cited in Muchinskv & Morrow, Ref I.
15
%
04
Mobley et al. [Ref. 5] states that previous research reveals that age, tenure.
overall satisfaction, job content, intentions to remain on the job, and commitment are
consistently and negatively related to turnover, but those factors explain only about
200 o of the variance in turnover.
According to Viscusi [Ref. 6] who analyzed the sex differences in worker quitting
Blau and Kahn [Ref. 7] found that sex differences had impact on the quits in their
study of young workers.
A research summary by Moblev et al. [Ref 5] shows the following results:
1. Individual Demographic and Personal Factors*.' Age-
Age - a ne2ative relationship to turnover was .dicated thoughage alone contributes little to the understandingoF turnover behavior.
_ ,,,Tenure -Tu length of service is one of the best single
0, predlictors of turnover.
Sex-no significant impact has been shown in some studies,whileother found that females have higher quit probabilities.
Family responsiblities -marital status is associated with decreased turnover.~Education -
Educatisome studies show that higher education leads to lower
tenure, while other studies discovered no diffeirence.
2. Job Satisfaction
, There is a neeative relationship between overall satisfactionand turnover.
3. Organizational and Work Environment Factors* Pay and promotion -
.~ some studies show negative correlation between
.K. pay satisfaction and turnover, while other studiesclaim a lack of relationship between pay satisfaction4. and turnover.
Supervision -Some studies found a significant relationship
@4 between leadership and turnover.*"Peer group relations -
no significant results were reported.
Status -Some studies found a negative relationship between
.. perceived status and turnover.
16
OIl~.
4. Job Content Factors
Job content factors have been found to be signilicantlyrelated to turnover
5. External EnvironmentSThe availability of other jobs has great influence on turnover
6. Occupational Groupings
A studV found moderate support for the hypothesis that unskilledblue collar workers have higher turnover than white-collarworker,, that non-mana2ers have hieher turnover thanmanaeers. that non-gov'rnment emplovees have higherturno'er than government employees and that higherprofessionalisni is associated with higher turnover-
Muchinsk' [Ref. S] discusses the relationship between turnover and previous
unemployment. Previous studies show that people with substantial periods of prior
* unemployment are more likely to quit than those without this experience. When he
examined the relationship between organizational rewards and the retention of
previous unemployed employees" five factors emerged as important: type of pay
s\ stem. promotional opportunities, job type, type and degree of counseling, and type of
training.
lopkins [Ref 9[ has studied the importance of work and job satisfiction
within the public sector. She found that employees who are more satisfied with their
jobs tend to have jobs characterized by scope and depth, adequate resources. faivorable
perceptions of their supervisor, fairness of promotion, adequate working conditions,
job mobility, lack of discrimination, are not union members, and the job environment
consists of satisfied co-workers.
Another way of looking at turnover is exemplified by Krackhardt and Porter
[Ref. 10], who asked "What effect does turnover in an organization have on the
attitudes of those who remain in the organization?" One of' their findings was that the
closer the lpoyee was to those who left, the more commited he or she became to the
job. The hypothesized reasoning is that increased promotion opportunities, increasing
job satisfaction justify their own decision to stay. In addition benefits could arise for
those who staved if those who left did not carried their share of the work load. But
this is a very little researched area of turnover, so no definite conclusions can he
Caldwell and 0 Reilly I I I Ref. I II state that 'omnsense and emipirical
research sugge-st that when individuals use acc~urate infbrmnation as a basis f'or dcLision
*niaking, they make better decisions'. I he%' Claim1 that ac-curacy of' information has c
important effects upon job choices. I hus, if' individuals make job choices with
artificiallY high expectations of whatc the\- %%ill experience Onl the ;ob. lower saitisfaction
and hi,_her turnover are more likely than with realistic e\pec:tationis. I he% report I Ircent studies ( Reilly. Brown. Blood, and \falaresta. I 9,S I )' that ,how that tuirrno er
was sieznificantlv lower than expected across stUdies f-or inidividuals, who had rece;'. cd
realistic job preview inf'ormation.
Tl-i studies refeCred to up to this point have dealt with turnover in general and
have niot investiEzated findinis within a militar-N ensironmient. \I otowidlo anid Iawton
Ref'. 1 21 conducted a Study using a sample of91 A W *rmy soldiers wkho wkere %whin o
mionths of'the expiration of' their first tour of' serv ice and who had not vet Lcenuni-tted
thesevestoa reenlistment dectision. [hey used the sariables perception. satishicton
e\xpectantc", reenlist), expectancy (leave) anid intention to explain subsequent
*reenaistmient decision,;. -1heir model wats based on theories by /ajonc (19S0). /alonc&
thait there was pos;ittve relationship between reenlistment and intention, perception.
satishCiction. and expectancies . the explanatorv effect was greatest with intention -sqar 44 onpre t llte tersariables together i R-sqUare =.1 26).
Brinkerhofl & (i rismer mention in their discusIsionI ofthe Gates Comission
Re!. I 3that pay, draft miotivation, the extent of' moonlielhting, taste for nillitarv life.
educational tuition grants. Une1Mploynment, enlistment bonus and continuation bonus,
an tamning are important variables in examining accession, attrition, and retention
\ithin the Reserve I orces in an all-v olunteer env ironment. Thev found that:
pa% elasticity is lower within the Reserves than in the civilian labor miarket:
since people work fewer hours within the Reserves than durin12 a normalci%,ili~n moonlighting job, this miay imply that taste £ laysa rieFo nrsrvdecisions than in civilian moonihtiiiie iecisions: lagrilni eevthe Alrect Of' decfinin2 unenlplo\ mient is miore difficult to predict for theResrves than for the r Iolr rr s.
1'Cd In(aldxsell & ()Reily II. Ref I I.
%~ ~ :ted :n \Iotawidlo & I A'~kton,. Ref 12
I S
04.
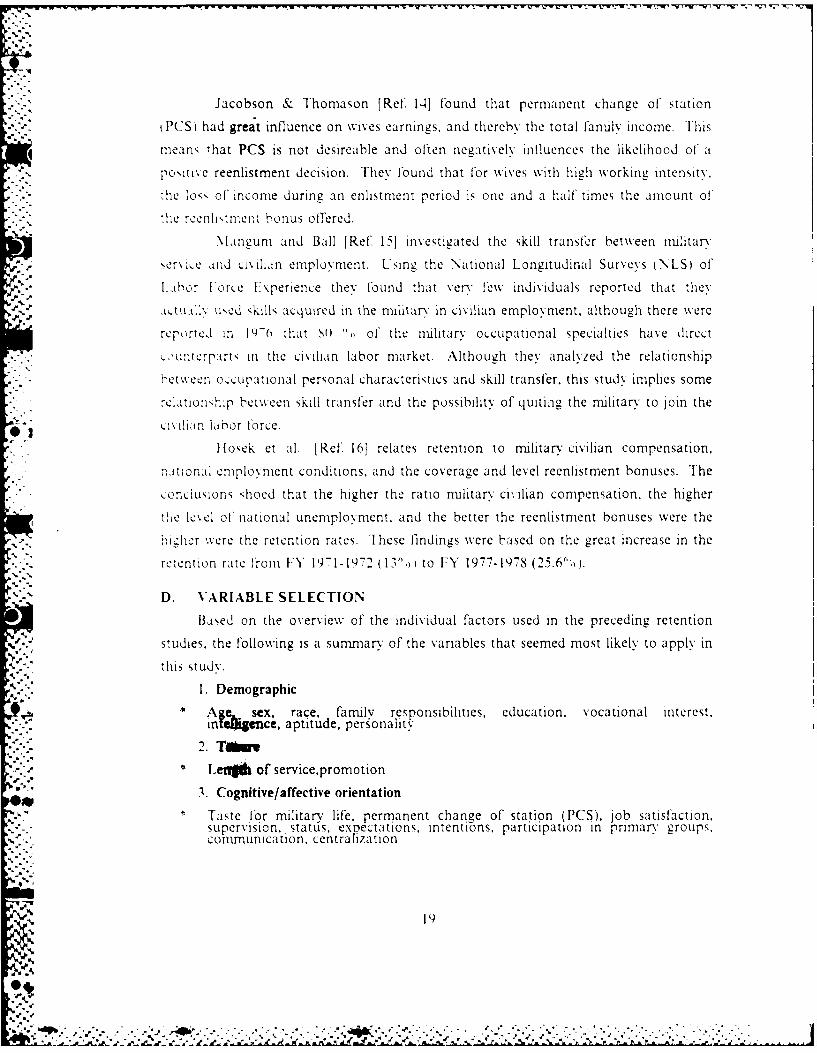
Jacobson & Thomason [Ref. 141 found that permanent change of station
.PCS) had great influence on wives earnings, and therebv the total fanilv income. This
I means that PCS is not desireable and often negatively influences the likelihood of a
poi,,itie reenlistment decision. They found that lor wives with high working intensity,
-- the lo,;, of income during an enlistment period is one and a half times the amount of
She reenl~tm-ent bonus offered.
Ilangum and Ball [Ref. 151 investigated the skill transfer between military
.erxe and civilidn employment. Using the National Longitudinal Surveys (NLSt of
i .bor Forte fi\perience theyx found that very few individuals reported that they
.v,_A1,,e ',kills acquired in the military in civilian employment, although there were
reprorted in 19-6 that Y "o of the military occupational specialties have direct
c)Lintcrparts in the civilian labor market. Although they analyzed the relationship
between occupational personal characteristics and skill transfer, this study implies some
-clationship between skill transfer and the possibility of quiting the military to join the
' 2 civilian labor force.
.losek et al. [Ret' 16] relates retention to military civilian compensation,
nAtionai employment conditions, and the coverage and level reenlistment bonuses. The
cenciusions shoed that the higher the ratio military civilian compensation, the higher
the lcvel of national unemployment, and the better the reenlistment bonuses were the
-i,:her were the retention rates. These findings were based on the great increase in the
retention rate from FY 1971-1972 (1 to FY 1977-1978 (25.6",).
D. VARIABLE SELECTION
Based on the overview of' the individual factors used in the preceding retention
studies, the following is a summary of the variables that seemed most likely to apply in
Taste for military life, permanent change of station (PCS), job satisfaction,supervision, status, expectations, intentions, participation in primary groups.communication, centralization
4. Income and economic incentives* pay, extent of' moonlighting, educational tuition grants, bonuses.
military, civilian pay ratio
5. Perception of employment alternatives* Employment level, number of job vacancies, skill transfer, mlitary civilian pay
ratio
The variables selected for analysis in this thesis will be more extensively described in
the next chapter.
E. DATA REVIEW
Ihe data used for this study are from the "197S DoD Survey of Officers and
Enlisted Personnel". The survey was conducted as a part of Rand Corporation's
Manpower. Mobilization, and Readiness Program. sponsored by the OffIlce of the
Assistant Secretary of Defense (Manpower. Reserve Affaires & Logistics). The
purpose of' the survey was to provide the Office of the Secretary of Defense and the
military services with data for policy fbrmulation and research. It was one of three
survexv conducted by Rand to examine manpower issues such as enlistment decisions,
career orientation, and attitudes of military members to policies that affect them and
their 'anulies.
The survey was fielded in late January 1979 to a world-wide sample of
approximately 93,000 men and women in all four services. The data collection was
completed in June 1979, and 57.540 people had returned the questionnaires. When the
.ample stratification was designed, supplementary samples were constructed for females
and blacks to ensure statistically significant samples of blacks and females for special
analysis. Hence, for this sample as a whole, females and blacks are overrepresented.
The survey consisted of four questionnaires: two for enlisted personnel and two
for officers. Form I for enlisted and Form 3 for officers emphasized economic and
labor force factors and was oriented towards military family income, labor force
participation, reenlistment decision making and military compensation. Form 2 for
enlisted and Form 4 for officers dealt with various aspect of military life, and theimpact of socifc personnel policies such as alternative recruitment systems.
J., JSince this study examines the career decisions of enlisted personnel close to theend of their present contract. Form I - 1978 DoD Survey of Enlisted Personnel -which
emphasized reenlistment decisions, is used. Form I has the following ten subject areas:
Military background
,, Reenlistment career intentions
20
04d..
Military work experience
•..Individual characteristics
Current housing arrangements
' Military compensation and benefits* Iilitarv retirement systems
Civilian labor force experience
Familv resources
Civilian job research
In addition to presenting the methodology to be used in this stud,,, the next chapter
will also discuss the factors used in the turnover model and the specific survey variablesused as measures of those factors.
21
."
IMI. METHODOLOGY
A. THE DEPENDENT VARIABLE
The decision the enlisted soldier faces at the end of his her contract period is
whether to
sign a new contract (reenlist) or
" quit and join the reserves or
quit and not join the reserves.
By understanding the factors which influence each of these decision options
policy makers and commanders can gain insight into how to keep a good individualaffiliated with the Armed Forces - whether in active duty or in the reserves - and thus
obtain necessary strengths (both quantitative as well as qualitative) within each of the
armed forces.
The likelihood of reenlistment at the end of the current term of service was one
of' the areas addressed in the 1978 officers and enlisted survey. Specifically, in Form 1
iQuestion 20) the respondent was asked:
Ilow likely are you to reenlist at the end of your current term of service?Assume that no Reenlistment Bonus Payments Will be riven. but that all otherspecial pays which you currently receive dre still available Mark one.
le en responses were possible, ranging from "no chance" to "certain":
' 'no chance" (0 in 10)
"very slight possibility" (1 in 10)
- "slight possibility" (2 in 10)
some possibility" (3 in 10)* "fair possibility" (4 in 10)
* "fai good possibility" (5 in 10)
" 'good possibility" (6 in 10)* "probable" (7 in 10)* "'erv probable" (8 in 10)* "almost sure" (9 in 10)
showed that the likelihood of reenlistment varied for all the f'our groups: less than
months", "3 months-less than 6 months", '6 months-less than 9 months, and 9
months-less than 12 months". Although the explanatory effect wVas small i R-
square= .01) and those in the 9-12 months group only represent 7.4" , of the totalnumber of respondents havino less than a \ear let of- current enlistme. it seems
KY,,ta~ral to use a cut olf at 12 months left of current enlistment.
Another restriction of the sample applied to the enlistment period in whiLch d
respondent was serving - question Q9. People who have made a positive reenlistmlent
decision several times (serving in their 3rd or higher enlistment period) are gome to
have tittle variation in tieir subsequent reenlistment intentions. A separate anal\sis
!,owed that there were no dilerences in the likelihood of reenlisting between people
servinz in their third or huher term. One of the main reasons for this study is to lind
cut what policy factors are related to the reenlistment intentions of soldiers.
Respondents serv:ne their 3rd or hieher enlistment period will be excluded !rom further
analv After this, point the enlisted soldier is likely to spend his career in the
I uintormed
B. EXPLANATORY VARIABLES (FACTORS)
As stated :n the literature review earlier studies indicate that turnover decisions
tre ikely to ,be explained by demographic, tenure, cognitive affective orientation,
mncome and economic incentives, and perception of employment alternatives factors.
\\ith that experience as a guideline the following factors and associated variables will
ti cn\e',::eated to find cut whether such variables are useful for explaining employmentdcis:on s
I he following candidate variables will be used in explaining the reenlistment jointhe Reserves decisions. (The exact variable question is cited in Appendix B)
1. Demographic Variables
Table I gives the list of candidate demographic variables and their value
codings. T1M include gender, ace at entry, race. marital status, number of
dependents;Ald educational improvement.
For Race, the grouping non-black' consists of' american
indians',hispanic .'oriental","white',and other'. A cross tabulation of race and
likelihood of reenlistment showed that the latter group show almost simiiar behavior'
,1
," -lnlC EN10 R.\PtlIC \(.\II\BI 1(S
I ( )u, vion I 'lle cotlitl,
Gender Q4() = femaleI = male
.\e at entrv Q-42 continuous
Race Q4-= non-blackRac"" I = black
Narital status Q4, 0 = not married= married
Num of dependents Q57 continuous
,duc improvement constructed continuous
-*3
in that question in contrast to black'. For the first enlistment period served "oriental"showed a 'behavior closer to black", but was not close to "black" "behavior" in thesecond enlistment period. Altogether, they were judged as belonging to the "non-
black group.
For current marital status, "Not married" is defined as "single","divorced", or-v:dowed while married' is defined as 'married", or "separated", since the latter
category is expected to behave more similarly to married than single respondents.
Educational improvement is computed as the difference between Q52 (years ofeducation today) and QSI (education at entr.y This is a continuous variable.
..lighschool education or GED certificate, Q53 was considered a candidatevariable but turned out that almost all respondents (more than 96'%) had a highschool
diploma or GED certificate. Therefore this variable was not included.
2. Teems Variables
The survey used in this study' contains only two tenure variables, QS - years of
service iYOS). and Q9 - number of enlistment periods served. The number of
cnlnrent periods is used in this decision and is explained above.
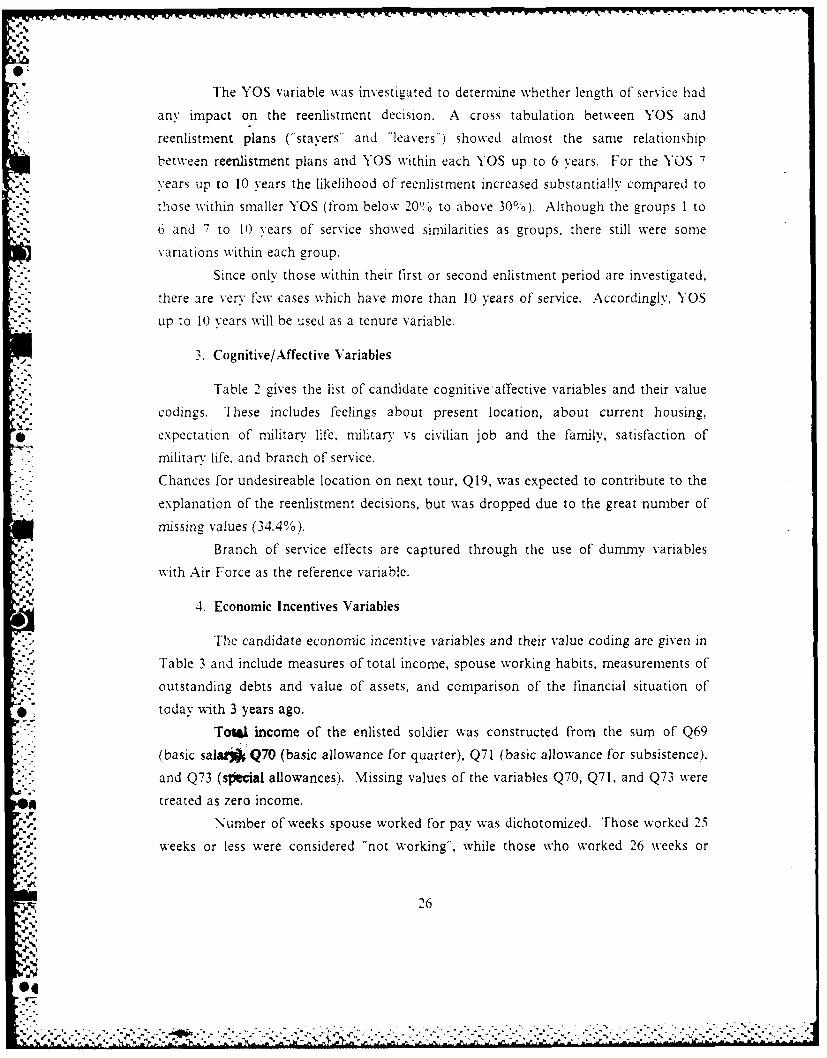
The YOS variable was investigated to determine whether length of service had
any impact on the reenlistment decision. A cross tabulation between YOS and
reenlistment plans ("stayers" and "leavers") showed almost the same relationship
between reenlistment plans and YOS within each YOS up to 6 years. For the YOS 7
years tip to 10 years the likelihood of reenlistment increased substantially compared to- those within smaller YOS (from below 20% to above 30%'). Although the groups I to
4- 6 and 7 to 10 years of service showed similarities as groups, there still were some
variations within each group.
Since only those within their first or second enlistment period are investigated,
-<'.. there are very few cases which have more than 10 years of service. Accordingly, YOS
up to 10 %ears will be used as a tenure variable.
3. Cognitive/Affective Variables
Table 2 gives the list of candidate cognitive affective variables and their value
"- codings. These includes feelings about present location, about current housing,
expectation of military life, military vs civilian job and the family, satisfaction of
military life. and branch of service.
Chances for undesireable location on next tour, Q19, was expected to contribute to the
explanation of the reenlistment decisions, but was dropped due to the great number of
missing values (34.4%).
Branch of service effects are captured through the use of dummy variables
with Air Force as the reference variable.
4. Economic Incentives Variables
The candidate economic incentive variables and their value coding are given in
Table 3 and include measures of total income, spouse working habits, measurements of
outstanding debts and value of assets, and comparison of the financial situation of
* today with 3 years ago.
ToWL income of the enlisted soldier was constructed from the sum of Q69
(basic salat* Q70 (basic allowance for quarter), Q71 (basic allowance for subsistence),
and Q73 (slecial allowances). Missing values of the variables Q70, Q71, and Q73 were
,O4 treated as zero income.
Number of weeks spouse worked for pay was dichotomized. Those worked 25
weeks or less were considered "not working", while those who worked 26 weeks or
),lilitar, life as Q I0WA continuouse\pected I stronilv acree
2= aeree "-3 = n.ither agree
nor disagre4 = disagree
= strongly disagree
Mv Cain better off QI04D continuouswith me in civ job 1 = stroneI aeree
2= aree3 =nither agzree
nor disaizree4= disagree5 strongly disagree
Satisfied with Q 105 continuousnulitarv life I = very dissatisfied
"= ver satisfied
Service Army 0= not in the ArmyI = in the Army
Service Navy 0= not in the NavvI = in the Navy
Service MC 0= not in the MCI = in the MC
Service AF reference variable
more were daifned as "working". The reason for creating a dichotomous variable isthat spousWP*orking more than half time have a greater attachment to the local labor
market than those working less than half time. Therefore, it is expected that a
reenlistment with permanent change of station will have a different impact on fanlieswhere non-rilitary spouse is working halt' time or more than on those where the
spouse is working less than full time.
a17
A I
TABLE 3
INCOME AND ECONOMIC INCENTIVE VARIABLES
V ariable Question 'alue coding
Total income constructed continuous
Spouse work Q89 0= do not work1 = work
Outstanding debts Q94 continuous
Value of assets Q95 continuous
Compoffin situat Q96 I = lot better2 = somewhat better3= about the same4= somewhat worse5 =lot worse
5. Employment Alternative Variables
The candidate variables for employment alternatives and their value coding
are given in Table -4 and include measures of civilian job offers, likelihood of finding a
civilian job, the use of military skills in a civilian job, civilian vs military job relations.
civilian vs military compensation, and military pay and inflation.
The effect of impressions of job characteristics of alternative civilian jobs was
measured by using question Q102 which consists of thirteen variables all dealing with
civilian vs military job comparisons.
Those answering "no idea" (variable value 6) on Q103 - Civilian vs military,compensation - were grouped with "about the same" (variable value 3).
C. REGRESSION
In the analysis, the four constructed variables "stayers", "leavers", "reservists",
and "civility. are used in a sequence of two dichotomous choices: "stayers" vs
"leavers" and for "leavers": "reservists" vs "civilians".Thus. the models are binary-choice models. These models assume that the
individual (in this study the enlisted soldier) are faced with two alternatives and thatthe decision made is dependent upon the characteristics of the individual [Ref. 17]. The
28
4'Id9-
... *',
TABLE 4
EMPLOYMENT ALTERNATIVE VARIABLES
'ariable Question Value coding
Civ job offers Q97 0 = noI = yes
Find civ job Q98 continuous, incv-I = no chance
10 = certain
Mll skill in civ QIOO continuousI = no chance10 = certain
Civ vs mil jobs Q102 I = civ a lot better2 = civ slightly better3 = about the same4 = civ slightly worse5 = civ a Fot worse
Civ vs rail comp Q103 1 = a lot more in mil2 = little more in mil
- 3 =about the same4 = little more in civ5 = a lot more in civ
-,Ill pay not keep Q 104C I = strongly agreeup with inflation 2 = agree
3 = neither agreenor disagree
4 = disagree5 = strongly disagree
dependent variable may be interpreted as the likelihood an individual soldier will
reenlist given his her specific individual characteristics. The likelihood (probability) has
to be between 0 and 1. A weighted least square method cannot be used since there is
Z , no guarantee that the predicted value of the dependent variable will lie in the 0- 1
interval. A mdel that solves that problem is the probit probability model.
-.a, The serious set of difficulties arises from the fact that predictions may lie
outside the (0,1) interval. A transformation of the original model in such a way that
predictions will lie in the (0,1) interval for all X is necessary. The use of the cumulative. probability function will provide a suitable transformation. The resulting probability
distribution might be represented as
P = F(a + bX) = F(Z) (eqn 3.1)
29
oV
". REPRODUCED AT GOVERNMENT EXPENSE
e" . The probit model is associated with the cumulative normal probability uction.
The general equation can be written
Z=a + bIXI + b2X2 . ..... +bnXn (eqn 3.2)
The probit analysis solves the problem of how to obtain estimates for the parameters
a and "b" while at the same time obtaining information about the underlying
unmeasured scale index Z. The probit model assume that Z is a normally distributed
random variable Z*. (The probability of reenlist: P(NY= ) = P(Z> Z*), while the
probability of not reenlist: P(Y= 0) = P(Z < = Z").) Since the probability is measured
by the area under the standard normal curve from - 00 to Z. the event investigated willbe more likely to occur the larger the value of the index Z.
.'.
Fir:,The probit model will be used to analyze these unique dichotomous choices.
First, the stay leave situation, and second, for those leaving, the choice of reserve
* participation.
Note that the slope of the Probit function is larger than that of the linear
probability function in the middle range, but smaller at the extremes of the interval
(-2.2). This is shown in Figure 3.1 below.
FiZ)
] It' odr O¢(pflwtDl't mod ~el
.4
Figure 3.1 Probit Model.
Outside the (-2 ,2) interval the linear probability model has a slope of 0. The shape of
€ .. the Probit function makes the values of the increments vary depending upon where on
•. the scale they are measured.
-30
IV. ANALYSIS OF REENLISTMlENT INTENTIONS
A. VARIABLE REDUCTIONThe nunber ofcandidate xariables presented earlier n this chapter. are too iany
to gi e a reasonably handling of the model (.-0 variables. lhe final subset of
independent variables needs to be small enough so that analksis is facilitated, N et large
enough so that adequate description is possible. F.en thouch one automatic selection
procedure will be applied, the entire selection process mus, be .ieed as pragmaticwith large doses of subjective judgement. There are number of possible criteria for
omitting candidate 'variables. As stated in [Ref. 18] an independent variable (!I maynot be fundamental to the problem, (2) may be subject to large measurement errors, (3)
may effectivelV duplicate another independent variable in the list, and or (4) ma% not
yield any information on management policy alternatives to effect the behavior of'
interest and may limit the detection of the effect of policy variables with which it may
have a strong relationship. There are also several other reasons for 'ishing to reduce
the number of variables to be used in the final model. A model with large number ofindependent variables is expensive to estimate. Further, regression models with a
limited number of independent variables are easier to analyze and understand. Finall..
the presence of many highly intercorrelated independent variables may add little to the
predictive power of the model. IHowever. some very important variables will bemaintained in the final model even if their explanatory power are low.
One of the methods described in [Ref. 181 is the "all-possible-regression selection
procedure". This method involves an examination of all possible regression modelsinvolving the potential independent variables and identifxing "good" subsets according
to some criterion. Those criteria could be:
• R-square
MSE (error sum of squared)
C (total mean squared error)
The intent is to find the point where adding more independent variables to the model is
not worthwhile because it leads to a very small increase in the explanatory power.
Each of those methods imply a tremendous computing time since the number of
all possible regression is calculated as 2 to the (P-I)-power, where P is the number of
31
04
.. o.................... . ...............
idependen t riales. Ilihatt nues thle al-osbereeso SCClLtion proedrC
not practical to use when the int i 11model L011! a 111 :rnore than H, a hbes,.
Another method could he to finrd tile best subsets, b% use of anl algotit,1m1
aJcrina to any of thos e Lriteria mentioned ahu\ e. Ilhis method searchIs for the 'nest
rnos-tne re~ression models contatning at speCtC Tnmber of'\ai~be ac:ordine to the
ri ~ ~ 11 tcrio ML Ise a; iid u uh les oMpulttiOnal el Fo)rt than1 1hen aL Ibe r
e ' A.adted Neter et ai JRef. I S do not recomnmend thIis Met hod When the r a u'iher Cf
:~deedet'.arablsare aIs higeh as -40 (thle numbher of! caindidate variables .I "r L,1 ses
-i1C -renmer of' independent vaiables the%- state that the stepwise regress ion
pr, ,d~ire Is~ probably, the most widely used and acceprted of' the automiatic search
met hod,. TIhe ;tepwise regression method develops a SequLence of' regression models, ajt
ealch step adding or deleting an independent variable. The criterion for adiding or
deletino an independent variable can be stated equilently In termsi, of' error sumi of
* squIares reduction. coeilicient of' partial correlation or F-statistic. I he S1PSSX ,oftware
packageZ uses the F-st'aLatistic as the criterion:
The si~nificance level used is .05 for entering a variable and .10 for deleteing a variable.
Fihe tolerance specification is .01 which provides no variable to be added to the model
which has a coefIlcient of' multiple deterination with the other vatriables already in the
mnodel whi1 ch ecds I - .()1 = .99.
B. MODEL ESTIMATION
A\ stpise regression run for reenlistment intentions using all the candidateC
variables entered the following independent variables in steps I to 1I:Iasat Io with m.Ilitar.y lf~eQ flo5
*2) fa m better off with mne I n civ job (Q10-41))
.i years of service (QS)-4) civ VS Mil job - chance of interestine wkork (Q 1 t21:
I muf pay benefits will not keep tip with inflation iQ 1ii4('
0 spcuse work foCr pa% iQs,)
cceings about Curren,, houISin1 IQ'
I rotai artount Of Outstandinig debts,014
'b C~~ 1044
1 gender (Q40
11 civ vs ril job - chance of promotion (Ql2G)
A limitation of the stepwie regression search approach is that it presumes there
is a best subset of independent variables and seeks to identify it. The 'best" subset is-own thcxe. Nevertheless. previous studies have shown some explanatory efTects of'
other candidate % ariables than those picked by the stepwise regression. Therefore, the
follokwng independent variables are added to those already picked:
n'iarita. status (Q.4I
age at ent"r (Q-42)* n'l li1e as expected (QIOJ).
branch of service (Arm,,
branch of service (Navy)
* branch of service ( ,lC)
The variables 'spouse work for pay" (QS9) and "marital status" (Q46) are highly
negatively correlated (-.S92, so one of them was dropped. The variable QS9 was
deleted because of the great number of cases in which the respondent did not have anspouse.
,lulticollinearitv was not observed between any of the other variables. All other
bivarlite correlation coefficients were below the .5 level. The probit analysis of the
tentative model with sixteen variables showed the regression coefficients and
siLgni:cance level given in Table 5.
Although two of the variables in the tentative model. "my fanly is better off
with me in a civilian job" (Q10-ID) and "satisfaction with military life" (QI05). were
siznificant at the .01 level, the nature of those questions did not add ver much to the
understanding of the reenlistment decisions. Previous studies [Ref. 191 and [Ref' 20]
ha'.e Ohown satisfaction with militar' life to be highly related to a set of otherexplanatory variables. Those variables were deleted f'rom the final model.
I-he q$loyment alternative variable "mil pay and benefits will not keep up with
inlation' (O*4C) does not relate to alternative employment decisions and the impact
uf the inflation on civilian pay. The way the question is asked contributes little to the
undcrt,indmng of reenlistment decisions. This variable was also deleted from the final
nmodel.
S.. 3
7S-0~
TABLE
TENTATIVE REENLISTMENT MODEL
F~iriable Poi
Gender (Q40) .062
Age at entry (Q42) .022 *
Race (Q-44) .218S
Marital status (Q46) .277 *.
Years of service (Q8) .14 2 *
Feeling curr housing (Q59) -.057
Ml life as expected (QIO4A) -.008
Mv famfly better off withm6 in civilian job (QI04D) .526 **
0Satisfied with muff life (Ql05) .392 *Branch of service (Army) .0'78
Branch of service (Navy) -.195
Branch of service (MVC) -.099
Tot outstandingz debts (Q94) .097
Civ v-,s mAff job - chanceFor interesting work (QlO2E) .172
Civ vs mui job - chancefor promnotion (QLO2G) .102 *
Mil pay and benefits will notkeep uO xith inflation (QIO4C) -.202
The number that this equation yields when entering values of the explanatory
variables is a value of the cumulative probability for the normal random variable (the
Z-value). To convert the Z-value to the probability of reenlist given the characteristics
entered, the cumulative normal distribution table has to be used. For example, a Z-
value of -1.0 gives the probability of .1587 (15.87%), while a Z-value of 0 gives .5
50'"Y,. The more negative (smaller) the Z-value is, the smaller is the probability of
* 1 reenlistment. The Z-value will almost always be between -3 (.001) and + 3 (.998).
Table 6 indicates that the smallest predicted reenlistment probability will be .0001
for an individual with the following characteristics:
male
i years at entry
non-blacknot married
I -ear of service
strongly disagree that military life was as expected
in the Army
no outstanding debts• expect a lot better chances for interesting work and promotion in civ job
* .Similarly, the largest predicted reenlistment probability will be .5263 for an
individual with the following characteristics:.-i" * fetllik
* 30 years at entry
Shlack
"nmarried
j10 years of'service,trongl agree that military life was as expected
. A2. - .
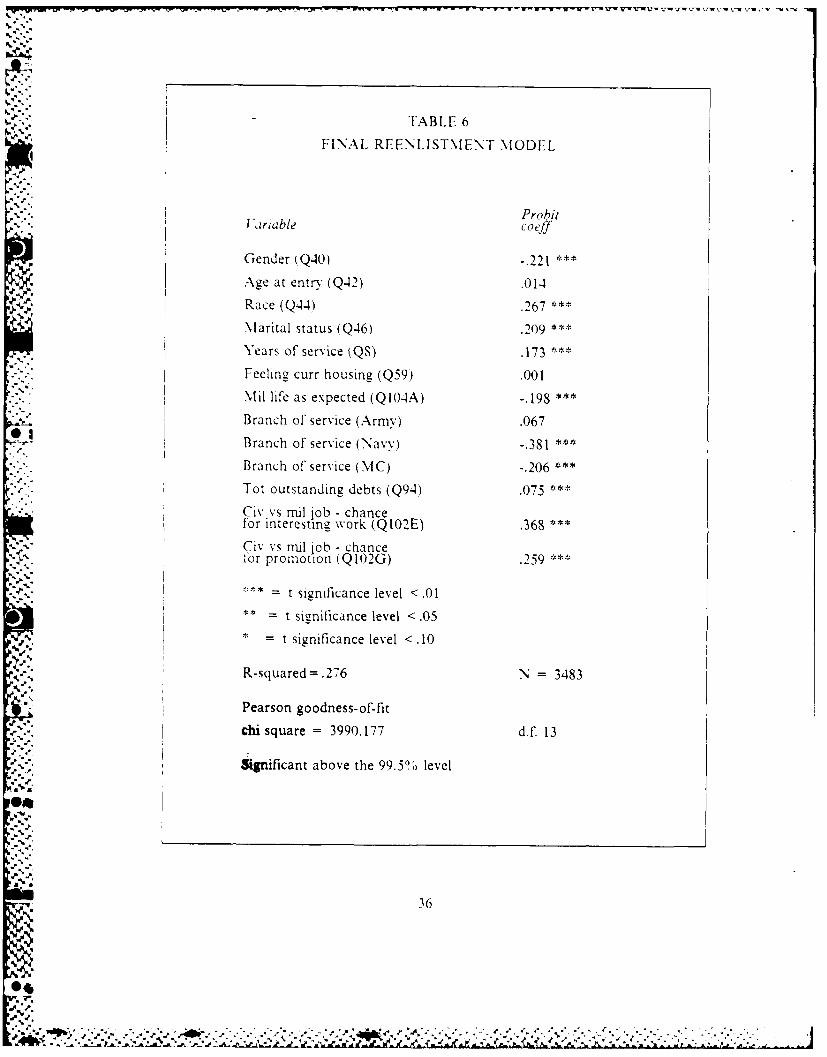
TABLE 6
FINAL REENLISTMENT MODF.L
.. ProbitI,.ariable co ef"
Gender (Q40)-.,21 ***
Age at entry (Q42) .014
Race (Q44) .267 *
Marital status (Q46) .209 *
Years of service QS) .173 ***
Feeling curr housing (Q59) .001Mil life as expected (QI04A) -. 198 ***
Branch of service (Army) .067* 1, " Branch of service (Navv) -.381 ***
Branch of service (MC) -.206 *
Tot outstanding debts (Q94) .075
Civ vs ril lob- chancefor interesting work (QlO2E) .368 ***
Civ vs mil job -chancelor promotion (QIO2G) .259 *
S* = t significance level <.01
= t signi icance level <.05.., = t significance level <.10
R-squared=.276 N = 3483
IPearson goodness-of-fit
,c..hi square = 3990.177 d.f. 13
Significant above the 99.5% level
-S. 36
Nt
i-
.%:in the Army
* great oitstanding debts
expect a lot worse chances for interesting work and promotion in (.iv job
In the following the results of the final model will be d:s(used in ;omc detal.
The variables are grouped as demographic, tenure, cognitive alCcrive. economIc. am.
:*'-" "-lovment alternative variables.
1. Demographic Variables
a. Gender
Males are less likely to reenlist than females. According to the probit analysis this
variable has a regression coefficient of -.221 and is significant at the .01 level. .\t the
midpoint value of each of the other variables the probability of reenlistment for females
is .26, while For males the probability dropped to .175, a change of 32 .7 , (Note that-alus are ..ed-or (Ntie otherthe percentage change will differ depending of what values are used for the other
variables)
b. Age at entry
Entrv age with a regression coefficient of .014 and a significant t> .30 has ven, little
impact on reenlistment decision.
c. Race
Blacks are more likely to reenlist than non-blacks. The regression coefficient was .207% and is sinificant at the .01 level. At the midpoint value of each of the other variables
the probability of reenlistment for non-blacks is .26. while For blacks it increased to
.32 - an increase of 26.1',.
d. Marital status
Not surprisgl, married people are more likely to reenlist than singles. The regression
coefficient was .209 and is significant at the .01 level. At the midpoint value of each ofthe other variables the probability of reenlistment ol non-married is .26, while forthe othe vaibe h rbblt
married it increased to .307, an increase of IS. I
oI..?.
37
-7,..%~ ......- A -: .~......-..* ~. -.-- - - . -
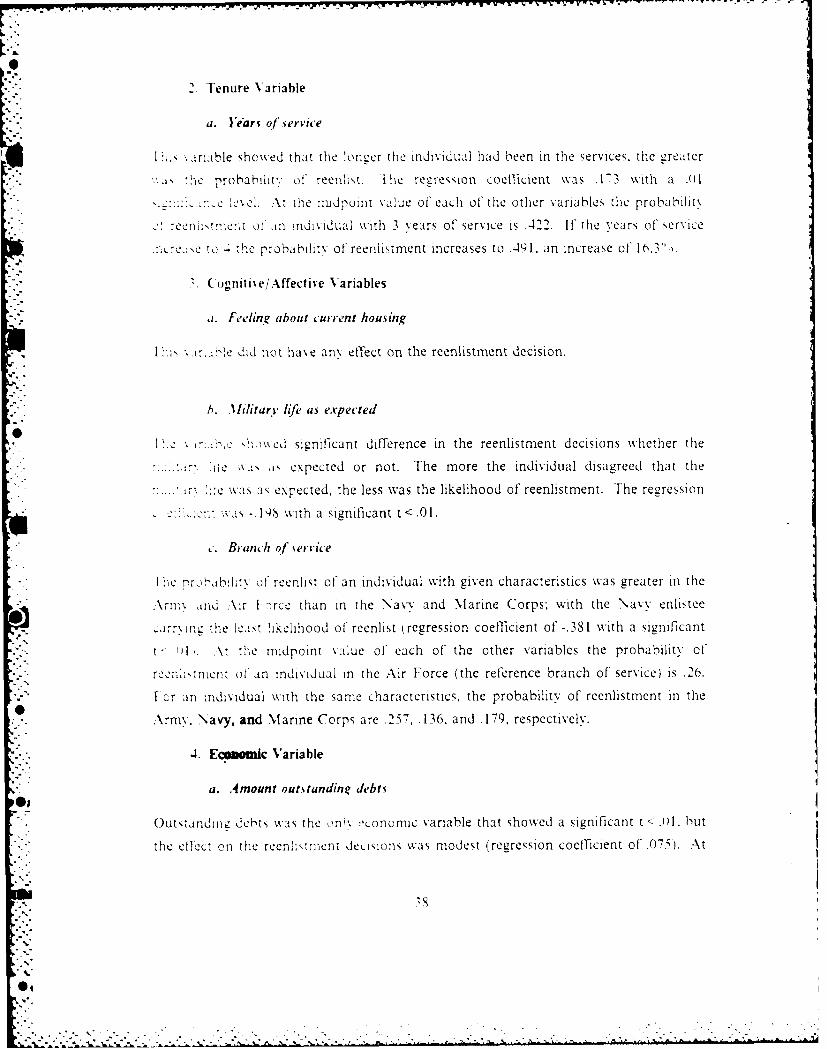
2.Tenure Variable
a. ears of *,rvice
_t''~rmable showved that the longer the individual had been in the services, the greater
'j he Tprobabiht'; of. reenlist. [hie reg7reson c oefficient was .173 with a .(Q
............. :.c' l. .\t the nidpoint valueC of' each of' the other variables the probability
rCel 01tm~. '1" lndiviIdUal with 3 years of service is .422. If' the years of' service
C:Cto 4 the probabiy of' reenlistment increases to .-41)1. an increase of' 16.3)n.
(ogniti eejAffective Variables
ij. Feelin, about current housing
I1-i "a i~li Jd not have any effect. on the reenlistment decision.
h. .11l*iiarY life' as exvpected
',c .i~ ".c ot ked significant difference in the reenlistment decisions whether the
.Ile A"".a expected or not. The more the indiviuldsgedta h
7 :::c as as expected, the less was the likelihood of reenlistment. The reeression
as-19S with a significant t < .01.
.. Branch of service
1 "he t'ai~~vof reenlist of' an individual with given characteristics was greater in the
Arnm, ind Air I orce than in the Navy and Marine Corps-, with the Nav-v enlistee
1:a1rM ing the eaist likelihood of' reenlist (regression coefficient of -.381 with a significant
A, the midpoint value of each of' the other variables the probability of'
rec.nktmnn of' an individual in the Air Force (the refeCrence branch of service) is .26.
I or an mudividual with the same c-haracteristics, the probability of reenlistment in the
0 Army.Navy, and Marine Corps are .25. .136. and .179, respectivey
4. Economic Variable
a. Amount outs tandinga debts
Outstzandirmi debts was the oni% "Lonom-ic variable that showed a significant t < .()I. but
the effect on the reenh:ment disnswas modest regression coefficient of .1)5). At
04
*.the midpoint value of' each of' the other _iarla !e t -, rrohiJt, of' reenlistment of an
I ndi%'dual with between S 2.(00 1n ad *lPla Nad eehsj31wieto r anl
::1li\ dual with outstandinz ulebt, of between cc, in > thle nl-OCbiiit of-
reenlitment increased to on) ~il :areate of . \ ct to nio-indersta rd, this does
* ~~not 1111,11 that I!,- mll: a~ir% 4io al'! Cl o f \ ci.ple to tkc on m1ore dcht".)
5. Ernplo~ment Alternative Variables
a. Civ vs mi/job chances /uir intere5 N'ia tork
The1 1es fvorable the indlij~ul x jewed the poscibilitles of' more Interesting work in a
L:i nian job tnall :11 a militir% jOh. the more ,ikely, Would tile individual reenlist. The
re-zrcs:on coeffbient was; .,( and is 1icnificant at the .()I level.
b. (iv vs mi/job -chances for promotion
*A '1, :\le 1 vorab-le \ 1cew of tile possibilities of' promotion in a civilian job compared to aLiar-, 1ob yields a higher probabiity of' reenlistment. The regression coefficient was
6. Validation of the Reenlistment Model
I o see h1ow valid the predictions made by this model were. a Probit model was
estimted fr a restricted tnumber of' cases using the same variables as the final
reenlitnient nmodel. In the r-estrii.ted model only the first 2500) cases (720% of 3483 -
the total number of' cases) were used. This model was then used to forecast the
reeahtnlent intentions for tile remainder of the sample.
~The predicted probabilities of' reenlistment for the last 983 cases (34S3-2500)wvere compUted using tile probit coefHicients developed for the restricted model. Thle
nlean predicted probability for tile restricted model was computed to be .1966. The
predicted probability mean value was used as the cut-off point fo--r reenlistnment intent.
(ases fo vc h rdce rbblt value was greater than or equal to .1966 wereprdicted to reenlist. Individuals hax ing rdce probability, values less than .1966
.verle predicted not to reenlis. I hie predicted reenlis trlent intentions were compared to
~tal renistlen fr ecilofthe~4l3 ases. hecomparisons are shown in -1 able 7.
-,e 'L
"p
TABLE 7
ACTUAL VS PREDICTED REENLISTMENTS
Predicted reenlistment
% NO YES
Actual NO 569 216
(72.5%) (27.500)
I reenlistment YES 45 153
(22.7%) (77.3%'0)
The model was consistent in its ability to correctly predict which individual
would reenlist (77.3°% correct) and which individual would not reenlist (72.5% correct).
Altogether, the model seems to predict right in 722 (569 + 153) out of 983 cases or
.As with reenlistment intentions the number of candidate 'ariables 4o xariablcs)
are too many to gie a reasonably handling of the reserve intention model. The same
reasoning and methodologv for reducing the number of candidate %ariables for the
reenlistment model will be used for the reserve model.
B. MODEL ESTIMATION
The stepwise regression procedure for reeniistment intentions using all fort%
candidate variables yielded the following thirteen independent variables-
1I satisfaction with militarv life Ql1();5)
race )Q-44i
civ v mil job - having a say Q 102B)
4 civ vs muljob - retirement benefits (Ql2C)
5) total income (TOIINC)
6) gender, Q4(I,.
7) branch of service - Navy
S) branch of service -Armr-
9) branch of service - MC
11l) spouse work for pay (QS9)
11 ci% vs mil job - imnediate superisors iQ ( A
121 faoi better oil with me in civ job Q1041))13) rml pay benefits will not keep up with inflation QI.-(14( "
Previous studies hae shown some explanator, effect, of other candidate sariables than
those picked by the stepwise regression. Iherefore, the followring independent .ariabies.
were added to those already picked:• ma"il status (Q-46)
" age at entrv (Q42-
S ail life as expected iQlh4.A
% cars of service iQS)The 'ariahles ,pouse work for pa ( ,,O amd rnartai .tatu,, IQ- are h.::hl\
negati vely correlated i-.S9ML so one of them kAa' dropped I he ariaHie QOxI %kas
'.1 An
4~ * 4 ~ -. . -. o .d
deleted because of the great number of' cases 111 which the res pondent d,,d not have in%
spouse.
\lulticollinearitv was not obs erved betwkeenan' A tTer, th1 ' ai ic All othercorrelation coefficients were below the .5 I 1.ci he r.)-:t rn~' n eritat: e
model wvith sixteen virlibles showecd [theicric .clc: cn ... c
cix en in Table S.
A [though the varialble Satistied with iniht'. Uc .. ie At
tenature of the queszion did niot add niuoh ,) e inc~ k:o~~e h re~crx c
~lci~ons Pevous studies I Ref. 1q]j and I Ref 2111 Lax e ",C!, I 1~~ i 1o whn'lt
le tc be related to a set of' the other expillnatorx1 .iriaheS I hie ir Li"e wasi' deltd
tonthc final reserv e model.
C. RESU LTS OF RESERVE INTENTIONS
I hie resUlts from thle probit anal% 5j5s of' the linal miodel can be viewed in Ifable 9.A,\ccordinelx. the probabilit'y of' joining the reserves c:an be derived from this
Pearson goodness-of-fitdf.=1chi square = 2727.949 f. 1
igriificance above the 99.5%/ level
44
04
!A7
b. Age at entry
This variable showed to have verv little impact on reserve decisions with a regression
coefficient of .028 and a significant t < .01.
c. Race
Blacks are more likely to join the reserves than non-blacks. The regression coefficient
was .364 with a significant t < .01. At the midpoint of each! of the other variables the
probability of an individual of joining the reserves is for non-blacks .268 .while for
blacks the probability of joining the reserves is .40, an increase of.40",.
d. Marital status
Married people are slightly more likely to join the reserves than singles. Tihe regression
coefficient wvs .1 I1 but the significance level was only t < .01.
2. Tenure Variable
a. Years of service
This variable had very little effect on the reserve decisions. The regression coefficient
was .013 with a significant t= .40.
3. Cognitive/Affective Variables
a. Military life as expected
The more the individual disagree that the the military lif'e was as expected, the less are
the probability that that individual will join the reserves.
b. My family better off with me in a civilian job
The more s individual disagree that the familv is better ofT with the individual in a
civilian jo % higher is the probability that the individual will join the reserves.
c. Branch of service
The probability of joining the reserves of an individual with given characteristics was
greatest in the Army closely followed by the Marine Corps and Navy. Regression
-45
0..
" .- V . ~ * ~ *-*-
coeflficierus of' .468,. 180, and .3(,. respectlx ei%. and are sienificant at the 1) 1 le\ el. I hie
reference variable -Air Force - had the indix idual with the iowest probability of joiinm
the reserves. At the midpoint of' each of the other x ariables the probability that ain
individual wll join the reserx es in the A\ir f orce is 11I 3, while the probabilities of
joinirn_, the reser\ e. inm the A\rm%, Marine ( orps., and Navy are .20'S. inS.ad .
respectivelY.
-4. Economic Variable
a. Total income
Total income wvas the onix economic V aria'Dle that showked MnV sI~nfilMIcae: the efeC~t
on the reserx e decisions wais modest (regreS~xii coefILIent Of' 0)14. .f~signif-icanc1e
of t> .
5. Employment Alternative Variables:7
a. Civ vs mu job - immediate .wpervi~ors
The less favorable the Individual viewed the innidate suLpcr, isors in a civilian job
than in a miUlitar- job, the more I kely Would the individual join the reserves. -1 hie
rearession codlicient was A ' S wvith a significant t 01<
b. ( iv vs mit job - having a saY
Like the last preceding variable, a less flivorable view of' the possibilities of' havineg a
saY in aI civilian job compared to a nulitar,, job yield a higher probability of joining the
reserves. The regression coelTicient was .144W with a significant t < .1.
c. iv vs, mit job - retirement benefitsi
*The better the individual vi ews the military retirement benefits compared to the cix ilian
retirement bmfits. the more likely are the individual to join the reserves. Th le
.r.,regression coefficient was .008 with a significant t Ad01
d. Military pay/benefits will not keep up wsith inflation
'The more an mrdix idual disagrees that rmlitar-v pay beniefits will keep up with inflation.
the more likely, will the lndix idual loin the reserves, (lie she has already dec Ided not to
reenlit) Ihle regression c-oeflicient was -0'wtasIicatt )I
A :1&
.. Validation of the Reserve Model
To see how valid the predictions made by this model were, a Probit model was
e,ttiniuted for a restricted number of cases using the same variables as the linal reserve
.Iodel. In the restricted model only the first 1,9)) cases (70",, of 2-25 - the total
nL"inrmer of cases) were used. This model was then used to forecast the reserve
- *r.entions lor the remainder of the sample.
I lhe predicted probabilities of joining the reserves For the last S25 cases
-.- &'7 " _2-19(,1 were computed using the probit coefficients developed for the restricted
J :-del. I lhe mean predicted probability for the restricted model was computed to be
I2'. I he predicted probability mean value was used as the cut-ofY point for reserve
intent. (a'se, "'or which the predicted probability value was greater than or equal to
2, were predicted to loin the reserves. Individuals having predicted probability
"a.ucs less than .269S were predicted not to join the reserves. The predicted reserve
:ntent ons were compared to 'actual" reserves for each of the 825 cases. The
01 ,ollparisons are shown in 'Table 10 below:
-TABLE 10
ACTUAL VS PREDICTED RESERVES
Predicted "reservists"
NO YES
-\ctual NO 36-4 235
(60.8%) (38.2%,)
reservists' YES 83 143
(36.70o) (03.3)
. lhe model was consistent in its ability to correctly predict which individual
kould join the reserves (63.3, correct) and which individual would not join the
reserves il.o", correct). Altogether, the model seems to predict right in 507 (364 +
1"3 cut A \2, .ises - or ol.", right.
47
" ' '',, . ' '- '
' ., a d JtA ..*. & o.%" ~. ~ ... A ~ . ... ~ ~ .-
V1. CONCLUSIONS AND RECOMIMENDATIONS
1. General
The R-squares for the final reenlistment model and final reserve model were
.2-6 and .092, respectively, which could imply that the conclusions derived from the
reenlistment model have a stronger empirical basis than those derived from the reserve
model. Because of the thct that the two models are not using the same dependent:- -variable, the R-squares cannot be directly compared. However. analysis of the
predictability of each model showed that the reenlistment model has a higher correct
prediction rate than the reserve model (75.5() and 62."o, respectively).,- The candidate variables used in creating the reenlistment model are the same
as those used in creating the reserve model. Therefore, the comparison of the factors
that affected the reenlistment decisions and the factors that affected the reserve
de.isions is done in two seque.'.ces:SThose varia ions.
"2..1 Those variables that had explanatory effect on both decisions.2) Those variables that only had explanatory effect on one of the decisions.
"Stayers" and "reservists" proved to have the following variables in common inexplaining their decision whether to reenlist or not and - when decided to leave the
-" armed forces - whether to join the reserves or not:
Scrender
age at entry
race
- - marital status
years of service* mlitary life as expected
branch of service
The following of the candidate variables showed only to have effects inexplaining the reenlistment decision
feeling about current housing@4
amount of outstanding debtsciv vs mil job - chances for interesting work
civ % s rml job - chances for promotion.
Oiiiuc the candidate variables
48
we. -"W,
total income* my family better off with me in a civilian job
Sciv vs mil job - immediate Supervisors* civ vs mil job - having a say
civ vs nail job - retirement benefits* rail pay and benefits will not keep up with inflation
showed only to have explanatory effects on the reserve decisions.
2 Effect of Common Variables
a. Gender
.his variable has significant effect on both affiliation decisions (significant t < .(I0), the
"* direction was the same, and the magnitude almost identical. The regression coefficients% for reenlistment decision and reserve decision were -.221 and -.277, respectielv. The
conclusion is that whether the decision is to reenlist or - if decided to leave after all - to
• join the reserves, the females have higher affiliation potentials than males. This implies
that the policy makers should consider recruiting more females to the armed torces in
the future, then both the reenlistment rate and the reserve participation rate should
increase. Note that performance efficiency or legal constraints have not been. i m estigated.
b. Age at entry
" It seems that within the age range represented in this sample, the age of in enlisted
person when entered the military services does not affect the subsequent deciionN of
reenlistment and or joining the reserves.
c. Race
* -For both affiliation decisions this study shows that blacks are stronger alliiated with
"*.... . the rnlita~Itn non-blacks (signil,.ant at the .01 level). The eflect of this -,riahlc Islarger in tvmerve decision than in the reenlistment decision.
d. Marital status
This studv shows that - at .01 significance level - that a married enlisted are more likely
. to reenlist than a single enlisted The same result was indicated for the reservc decision,
- but the significance was weaker (significant t < .10).
149.-_-
4.. .* **2...... . . . . . . . . . . . . . .
e. Yeurs of service
This variable shows only significant impact on the reenlistment decision. which means
that if more enlisted completed longer term contracts, the the reenlistment rate for first
and second termers would increase. When individuals finally leave the active duty, for
first ermers and second termers the number of years spent of active duty left behind
does not influence the reserve decision.
f. ,lilitary11 life as expected
The degree of met expectations of military life shows significant impact on both the
reenlistment and reserve decisions. The effect, though, is greatest for the reenlistment
decision. The conclusion to be drawn from this finding is that all the different
recruitment efforts - advertising, orientations etc. - should stress to make a correct an
-reevant picture of milItary life, and in return get individuals stronger affiliated with the*! military.
g. Branch o1 service
These variables were used to show the differences between each of the four services,
Army, Navy. Marine Corps. and Air Force. In the reenlistment decision the ranking of
the services according to where the enlisted are most likely to reenlist is:
I) Armv
2) Air Force
* 3 Marine Corps
4) Nav-y
The magnitude of the differences is substantial; the probability of an individual to
reenlist in the Army is about 500o higher than in the Nav, 330o higher than in the
Marine Corps, and 2%'O higher than in the Air Force.
la the reserve decision the ranking of the services according to where the
enlisted pgonel are most likely to join the reserves changes in the ranking of the Air
Force. The ranking is:
SI Arrny
2) .Marine Corps
3) Nav
4) Air Force
41o
V6 ZA %
The magnitude of the differences shows that the probability of an individual of joining
the reserves in the Army is about 50'o higher than in the Air Force, and 1210 and 91)
higher than in the Navy- and Marine Corps. respectively. Air Force enlisted personnel
seems to have much stronger active duty affiliation intentions than they do reserve
ailia'ion intentions relative to the other service branches.
S. Effect of Reenlistment Model Specific Variables
a. Amount of outstanding debts
This variable has significant effect on the reenlistment decision: the greater the
enlisted s Outstanding debts is, the greater is the likelihood of reenlistment. Enlisted
Personnel ,eem to view military employment as secure employment - more secure than
a civilian employment alternative offered. (A bit surprising that this variable did not
have any effect on the reserve decision showing the need for moonlighting).
b. Civilian vs military job - chances of interesting work
I he individuals view of chances for interesting work in a civilian job compared to a
niihtarv job has significant impact on its reenlistment decision. In fact this variable has
the ingle greatest effect on the reenlistment decision. This implies that job
.ca.-:2ent meaningul work for the individual should be strongly emphesized by the
mrnluarV cmployer commanding officer in order to increase retention.
c. Cirilian vs military job - chances for promotion
Like the preceding variable, chances for promotion has significant impact on
lternative employment decisions. Although the overall effect on the reenlistment
dccision is not as great as for the latter variable, it shows that an individual has tohave reasonable promotion opportunities if willing to retain within the military. 'When
the nilitary experiences low retention unsatisfactory promotion opportunities may
likelv be o= of the reasons for it.
4. Effects of Reserve Model Specific Variables
a. Total income
The higher the total income as an enlistee an individual have the higher is the
probability of that individual to join the reserves. More pay may indicate higher rank.
51
S.'p,
longer tenure, a faster promotion pace, or more special pay. [ihis variable needs more
examination to detect what combinations if effects are present. i Surprisingly, this
variable does not affect the reeniistment decision).
b. .1lv familt better off with me in a civilian job
Consdering that those indiNiduals investigated for their reserve intentions are those
,xho will riot reenlist, this variable shows quite a paradox. Those individuals that are
:1ost:1 0:lv to ion the reserves are those that strongly disagree to the postulate that theIJnilv is better off with the enlisted person in a civilian job. There should be more
likely to find that this variable either has no significant effect (the family with respect
to :his question was unrelated to the reserve intentions) or a negative significant
coel'cient (those who stronglv agreed to that postulate were most likely to join the
reserves . (T[his variable was deleted from the reenlistment model).
c. Civ vs mil job - im. supervisors, having a say, retirement benefits
AL\ these three variables showed that the more favorable the individual viewed those0 ree areas in the militar- compared to within civilian job, the more likely the
individual would ]oin the reserves. This indicates that for individuals who choose not
to continue active duty (despite the C ct that these variables were not important in the
reen,itment deCL:ion it may pay off in the long run if the nilitary can improve those
tre lind thereby increase the reserve potential.
d. .llilitarv pay and benefits will keep up with inflation
[his variable is not within control of' the military personnel policy makers, but shows
how inflation - or the expectation of' it - have some impact on the reserve decision.
For the reenlistment decision this variable was deleted.)
Recommendations
Based on the findings described in detail above, the military policy makers and
commanders should be aware of the following when tr-ying to increase the number of
people they want to keep afEliated with the armed forces - either in active duty or as P
reserves.
An increase in the number of' females in the services will also increase the
reenlistment rate and reserve participation. An increase in the number of blacks
enlisted will likely increase the reenlistment rate and reserve participation.
52
4" L
An increase in the proportion of married enlisted personnel will increase the
reenlistment rate and reserve participation. lven though married people are more
expensive in housing expenses and special allowances than single people, this additional
expense may be offset by those gains yielded from ;aved training and recruitment
\lhen recruiting enlisted personnel the true characteriltics of nilitarV lifeshould be stressed. so the enlisted experiences a ereat smilaritv between military life as
told and as experienced.
Two specific areas of the wcrk life were indicated as very important in the
reenlistment decision: -chances for interesting work and "chances for promotion".
Special attention should be placed on those ares in the future to secure satisfaction and
reenlistment of personnel. Likewise, areas of work life like "relations to immediate
su:pervisors, the feelin of having a say. and the retirement benefits" were shown to
be of major importance for those who plan to join the reserves.
6. Future Investigations/Research
Even if the R-squares obtained for the reenlistment model in this study are
relatively good when considered the kind of data used in the analysis, they indicate that
there is still much more to investigate to f'ullv understand the turnover problem within
the armed 'orces. In the following some future research are sug2ested.
The data base used For this study (the newest one available) was of some age.
:\rv conclusions could therefore be refused by claiming that the situation has changed
since the survev used took place. Therefore, some efforts should be made to obtain upto date information and have a simularly study taken place using those data. The
results should be compared to see what changes had occured and to find any trends of
anv importance. A new 1985 survey should be available later this year for such
comparisons and updating purposes.
As sMessed previously turnover has both potive and negative consequences.
lhere are cOsts of keeping people and there are costs involved when replacing people
that quit. AU losses are not of equal quality. Research should be undertaken with a
locus on the quality of personnel and flctars alecting their reenlistment decisions.
.\n additional area of future reearch is the applications of a trinomial logit
analsit s to the sinele di crete choice problem with the choices: I stay in active duty,
12 lea,.ve actis e duty and lom the rcer\es., and,11 leave the acti\ e duty and do not join
04
j" v
1,,° -
il%' %l
.4
the reserves. This modeling effort should be undertaken and the results compared x' ith
QS To the nearest year and month, how long have you been onactive duty? (If you had a break in service, count currenttime and time in previous tours.)
Q40 Are you male or female?
Q42 When you first entered active service, how old were you?
Q44 What do you consider to be your main racial or ethnic group'?
Q46 What are your marital status now?
Q57 How many people, including your spouse, are living withyou now dt your current location?
Q59 How do you feel about your current housing?
Q89 In 1978. how manv weeks did your spouse work for pay,either full or part-time, at a civilian job, not countingwork around the house? Include weeks that your spousewas on paid vacation and paid sick leave.
Q94 As of today, what is your estimate of total amount ofoutstanding debts thdt you may have? Exclude any mortgage.
Q95 What would you say is the total value of any savingsaccounts, checking accounts or cash, U.S. Savings Bonds,stocks or securities that you might have right nov?
Q96 Comaed to three years ago how is your financial situation?
Q97 In the past 12 months, did you receive any job offers fora civilian job which you cofld take if you'leave the service?
Q98 If you were to leave the service now and try to find acivilian job how likely would you be to find a goodcivilan ]oP:"",
QIO Suppose you were to leave the service now and try tofir,d a civilian job. I low likely would you be to fihd ac ilian job that uses the skills in x our'military careerfield?
57
S,
Q102 If you were to leave the service now and take a civilianjob, hw do you think that job would compare with yourpresent rmlitarv job in regard to the following workconditions?
A The immediate supervisors
B Having a say in what happens to me
C The retirement benefits
D The medical benefits
E The chances for interesting and challenging workF The wages or salariesG The chances for promotion
II The opportunities for training
I The people I work with
J The woik schedule and hours of work
K The job security
L -he equipment I would use on the job
NI The location of the job
Q103 Suppose you left the service now. How do you think thetotal militar' compensation you are receivirng now (pay andbenefits) would compare with the total com ensation (pay andbenetitsl you would receive in a civilian job.
Q 104 How much do you agree or disagree with each of thefollowing stateiients about military life?
A Life in the military is about what I expected it to be
C My military pay and benefits will not keep up with inflation
D My family would be better off if I took a civilian job
Q 105 Now. taking all things together how satisfied ordissatisfied are you with the military as a way of life?
?.4
58
O.,
LIST OF REF:EREN"CES
* I. NlMuchinskv P.\1. and Morrow. P.C., "A Niultid isciplinarn' MIodel of' VoIlntaryFinn oyee- Turnover,' Journal V'/ ocaional Behavior, Vol 17, pp. 2o3- 2t90.19S.'
2. Abelson. M.A. and Bavin~er B D "0 ntimal and Dvsf'unctional Turnover:Towards an OrganizatibonaF Levei 'iodei," AIcademy of' .Xanugement Review,Vol 9. No 2, pp. 33 1- 341, 198-4.
Dalton, D.R., et al., "Turnover Overstated. The Functional Taxonomv,-A-cademy. oJ Afanagernent Review, Vol 7, pp. 117-123. January 1982.
4. lcwday, R.T., "Strategies For Adapting To H Iizh Rates of' EnplovecTurnovdr," Human Research MXanagement, Vol 23, N6 4. pp. 365-3S0, 'iriter19S-4.
S. %lblevW.1I.. et al.. "Review and Conceptual Aknaly-sis of The E oeTurno(-er Process," PsYchological Bulletin, Vol S6, No ')'pp. 493-522, Fj19oe
'6. Viscusi W., "Sex Dfencsin Worker Quitting," Review of Economics and
- Blau F. and Kahn, L., "Race and Sex Differences in Quits by YoungWorkers," Zndustrial and Labor Relation Review, Vol 34. No 4,p.'5 -<19S1.
S. Muchinsky, P.M., Psychology A4pplied to W~ork, The Dorsey' Press, Chicago.I L. 19 S.
9. Hlopkins. A.H.. Work and Job Satisfaction in The Public Sector, Rowman &.'llanheld, Totowa, NJ, 1983.
10. Krankhardt D. and Porter, L.W.. "W~hen Friends Leave: A StructuralAnalsis oi The Relationship Between Turnover and Stayers Attitudes."
A1dministrative Science Quartery, Vol 30, pp. 242-261, 1985.
-. II. Caldwell, D.F. and O'Reillv III, C.A. "The Impact of' Information on JobCbMAM 'and Turnover"- 4cizdernv (f' .1tanagement Journal, Vol 28S. \o 4. pp.93A43, December 1995.
13. Brnkrhff J. ndGrsser DX~.."The Reserve Force inan All-VolunteerEnvironment," in The A-ll- Volunteer Force A-fiter a Decade, W. Bowman. R.Little, and Gi Siclia (e dsj. Perga _ annBrassey's International Del'encePublishers, New York, NY', 198~6.
59
AY
V%.
1-4. Jacobson, L.S. and Thomnaon. J L.-he Eff-ect of PCS .11oves )in .Xilaarv~IV1ve4_ Earn ings and Ilu.shwds R'tzmn CR C SS, Center f'or Naval Analysi ,Alexandria. % A. October- 1163.
15. Mangum, S. and Ball, D.Skill Transf'er and Nlilitarv Occupatonal Training,'Fhe Chang~in Labor Mkc.Stephen M. Ilills'(ed), tlxi ngton Books,Lexington,~ M', 11;S6.
It. Ilfosek. J R.. et al., Active Enlisted Supply: Prospect and Policy Options. " -le1,7- I ''limtccr F''rce AfItir a Decade, .' Bowman, R. Little.' and G. Siciliaeds., Perzanim-Brass~v s International Def'ence Publishers, New York, NY,
I-, Pindvck, R.S. and Ruhinf'eld. D-L.. Econometric .1lodels and EconomicFe'recasts. Second edition. NlcGraw-lliilI, New York. NY. 19S1.
IS nr Inc et..Aplied Linear Statistical .Xethod. Second edition, Richard D.Irwi Ic New N ork. \A 1985.
19. Bristow., E. S., Job Satisfizction and Race .mn YXiia ,Ofces S hss
Naval Postgzraduate School. Monterey, CA, Dt cernber 1985.
*221). Albiso J.. Fhe Ef?'ect of Race on Determinants oj'Job Satisfaction, M.S. Thesis,3 NaVal 'Postgraduate Schiool, Monterev, CA. December 19S5.
60)
%A.'. - -
INITIAL DISTRIBUTION LIST
No. CopiesD . Ieftence Techn ical Information Center 2( irnmcron Station:l\allidria, Virginia 22304-6145
2. 1lbrar-v. Code 0142 24 Ndx al Post uraduatc School
Nlortcrey, California 939-0-5002
3. Tor-L-2iI I IaakestadJcrpcfiretl 161314-4D1roehak, Norway
4. Professor Georee WV. Thomas, Code 54 Te 6IDcpdrtnlem of-Adrninistrative Scielices\d'~a a,t oradtiute School\lanterey, California )31)43-51)00
5. Prol'es~or Loren M. Solnick, Code 54 SbI4 I )cpartment at .Admimistrative Sciences
N i al lPoiiiradua tc SchoaolNlontcre)v, Califor nia 939 43.5' 100
61
- .-V*fW *- --:'lurrr -r. - g- - - - - -.4
.4
./4
IV.
N I;;. G ,." ," 4 -; .'-:- :;.:;-4-.--g ? ;.,- , :.,:;.-.-.:? -.-..-- ' -.;:-.,:;..;i:,.:;-": -,; - '