Page 1
C. Gallegos, J. M. Franco and P. Partal, Rheology Reviews 2004, pp 19 – 65.
© The British Society of Rheology, 2004 (http://www.bsr.org.uk) 19
RHEOLOGY OF FOOD DISPERSIONS
Críspulo Gallegos, José M. Franco and Pedro Partal
Departamento de Ingeniería Química. Universidad de Huelva, 21071 Huelva (SPAIN).
ABSTRACT
We review the viscous and viscoelastic behaviours of concentrated food
emulsions and plant food suspensions. Special attention has been given to the
influence that food processing exerts on the rheological characteristics of the above-
mentioned foodstuffs.
KEYWORDS: Viscosity; Viscoelasticity; Food; Dispersions; Processing.
1. INTRODUCTION
Traditionally, foods have been classified as hard solids, soft solids and liquids.
Some examples of these general physical categories are shown in Table 1.
GENERAL CATEGORY FOOD EXAMPLES
Hard solids Chocolate, biscuits, hard cheese
Soft solids Butter, ice-cream, tomato paste
Liquids Water, honey, ketchup, mayonnaise
Table 1. General categories of foods
Many foods of commercial importance, such as baby foods, mayonnaise, salad
dressings and plant food concentrates (orange, tomato, apple, etc) are concentrated
dispersions of solid (suspensions) or fluid (emulsions) matter in fluid media, which
may behave as soft solids or highly non-Newtonian liquids.
Rheology plays an important role in food manufacture and marketing [1], i.e.
design of handling systems, quality control and evaluation of sensory stimuli
associated with oral and non-oral evaluation of viscosity [2]. Starting with processing,
it is notorious that process variables determine the microstructure formed for a given
formulation, and hence its rheology. Often, processing is itself affected by the
rheology of the product, especially if it is very viscoelastic or very shear-thinning.
When the final product is formed its rheology should be measured in a precise manner,
Page 2
C. Gallegos, J. M. Franco and P. Partal, Rheology Reviews 2004, pp 19 – 65.
© The British Society of Rheology, 2004 (http://www.bsr.org.uk) 20
accounting for any wall effects and selecting, for instance, the appropriate range of
deformation rate for the particular application.
A suitable constitutive equation should be selected, then, to fit the rheometry
results. This step is still quite challenging for semisolids food products, taking into
account their dramatic shear-thinning response and the probable appearance of
instabilities in a significant range of shear rates [3]. This suitable constitutive equation
can be used to calculate flows in other geometries, i.e. process equipments, using
Computational Fluids Dynamics. Finally, the measured product rheology should also
be compared with the subjective consumer perception.
The aim of this paper is to review the state-of-the-art of the rheology of
selected semisolid foodstuffs (concentrated emulsions and suspensions), mainly
focused on their linear and non-linear viscoelastic characteristics.
2. RHEOLOGY OF FOOD EMULSIONS
An emulsion may be defined as a thermodynamically unstable heterogeneous
system formed by at least two liquids, that are at best only slightly soluble, in which
the internal phase is dispersed in the other in the form of small droplets, with
diameters higher than 0.1 µm [4, 5]. Food emulsions are governed by the same
principles than other emulsion systems. The only specific requirements for these
emulsions are that they must possess long-term stability (several months or years) and
they must contain only ingredients that are acceptable for human consumption [6]. A
great number of food products are presented in the form of oil-in-water (o/w)
emulsions, e.g. mayonnaise, salad dressing, coffee cream, cream liqueurs, soft drinks,
ice creams, etc, or water-in-oil (w/o) emulsions, such as butter, margarine or spreads
[7]. In some cases, it is possible to find multiple food emulsions, for instance water-in-
Figure 1. Important areas in the study of Food Rheology (reproduced
from [1]).
PROCESSING CONSTITUTIVE
EQUATION
COMPUTATIONAL
FLUID DYNAMICS
MICROSTRUCTURE RHEOMETRY CONSUMER
PERCEPTION
Page 3
C. Gallegos, J. M. Franco and P. Partal, Rheology Reviews 2004, pp 19 – 65.
© The British Society of Rheology, 2004 (http://www.bsr.org.uk) 21
oil-in-water (w/o/w), which usually are presented as reduced-calorie products since
this particular microstructure yields a drastic reduction of fat and energy content [8].
From a technological point of view, the rheology of food emulsions is
fundamental mainly due to its relationship with emulsion stability, the most important
factor to be considered in emulsion technology. Thus, a large number of structural
parameters that influence emulsion stability also affect rheology, a fact that makes
difficult a systematic understanding of the complex rheological response of
concentrated emulsions. In general, emulsion stability depends on droplet size
distribution, rheology of the continuous phase and inter-particle interactions [9], and
all of them affect the bulk rheology of the emulsion. In addition to this, all of them are
decisively influenced by processing conditions [10], such as energy input during
emulsification, residence time, application of thermal treatments, mixing efficiency,
etc.
During the last decade, a wide range of topics, related to emulsion rheology,
have been studied. Among them it can be mentioned viscosity and viscoelasticity
modelling, influence of composition, processing, thermal and high-pressure treatments
and its relation to stability and microstructure. The research developed on these topics
will be reviewed below.
2.1 Viscosity and viscoelasticity modelling.
Traditionally, most predictions of viscosity have been developed as a function
of the disperse phase volume fraction, φ. For dilute, monodisperse emulsions, steady
shear viscosity can be reasonably described by simulations of hard spheres (HS)
dispersions at small capillary numbers, when the droplets are not greatly deformed
[11]. However, as inter-droplet interactions depend on droplet size distribution, an
increasing polydispersity yields high deviations from monodisperse HS predictions.
Yaron and Gal-Or [12] and Choi and Schowalter [13] applied an equation that takes
into account inter-droplet interactions derived from a cell model approach. More
recently, Pal [14] showed that those models fail to describe emulsions containing milk
fat. A modified form of the Phan-Thien and Pham [15] equation for relatively
concentrated emulsions was satisfactorily applied to describe the viscosity of these
food emulsions (sets 8A-8D in figure 2):
( ) 2/5o
2/3r
r φK1K52
K5η2η
−−=
+
+ , ..........(1)
ηr being the relative viscosity and K the viscosity ratio (ratio of the dispersed-phase
viscosity to continuous-phase viscosity). In this model, it is assumed that emulsion is
unflocculated and the effective volume, Veff , of a single droplet is proportional to the
true volume of a single droplet in a factor, which takes into account the presence of the
surfactant on the interface (Veff = KoVo). The influence of the interfacial viscosity and
surface and bulk diffusion of surfactant was discussed in some detail by Danov [16].
However, most of food emulsions are usually highly concentrated, showing a marked
non-Newtonian behaviour. This behaviour has been related to droplet deformation,
flocculation or the non-Newtonian behaviour of the dispersed phase [17, 18].
Page 4
C. Gallegos, J. M. Franco and P. Partal, Rheology Reviews 2004, pp 19 – 65.
© The British Society of Rheology, 2004 (http://www.bsr.org.uk) 22
The general evolution of viscosity with shear rate (or shear stress) shows three
different regions, a constant viscosity, ηo , at low shear rates (or shear stress), a power-
law decrease in viscosity, and finally a constant viscosity, η∞ , at high shear rates,
characteristic of an unflocculated system. As Barnes [19] pointed out, each region of
shear rate (or shear stress) is associated to different applications (physical stability,
levelling, pouring, rubbing...) and also to important unit operations related to the
manufacture of an emulsion such as mixing [20] or pumping [21]. Wilkinson, Cross,
or Carreau models have been widely used to describe this behaviour [10, 18, 22, 23].
As shown in figure 3, the combined influence of both shear rate and disperse
fraction (also emulsifier concentration) on viscosity was modelled by applying a
superposition method which leads to a master flow curve in which the shift factor
affecting shear rate is a function of the oil weight fraction [24]. This master flow curve
may be fitted to any of the above-mentioned models, by including the influence of φ in
the different parameters.
Figure 2. Comparison between experimental data and Pal’s equation
(reproduced from reference [14]).
Page 5
C. Gallegos, J. M. Franco and P. Partal, Rheology Reviews 2004, pp 19 – 65.
© The British Society of Rheology, 2004 (http://www.bsr.org.uk) 23
Figure 3. Master flow curve for emulsions containing 1-10% wt.
sucrose ester and 55-85% wt. oil (reproduced from reference [24]).
0,1 1 10 100 10000,1
1
10
d1/2
b
2.5 4.8
2.4 5.0
2.1 5.3
.
Carreau model
η
(Pa
.s)
γ (s-1)
Figure 4. Viscous flow curves obtained from salad dressing-type
emulsions with identical composition but manufactured using different
processing conditions (adapted from reference [10]).
0.01 0.1 1 10 100 1000 100000.1
1
10
100
ηη ηηshi
fted
(P
a·s
)
.
Carreau model
aφφφφa
SEγγγγ (s-1)
Page 6
C. Gallegos, J. M. Franco and P. Partal, Rheology Reviews 2004, pp 19 – 65.
© The British Society of Rheology, 2004 (http://www.bsr.org.uk) 24
However, if the influence of φ on emulsion viscosity is considered, it is also
necessary to take into account the effect of droplet size distribution, DSD. Thus, for
instance, figure 4 shows three different flow curves obtained from salad dressing-type
emulsions with identical composition but different mean droplet size and
polydispersity, achieved by modifying processing variables. In this figure, d1/2 is the
median of DSD and b is a parameter that changes inversely to the polydispersity. As
can be seen, the lower mean droplet size and polydispersity, the higher viscosity is.
This is usually attributed to the fact that narrower droplet size distribution and lower
mean diameter yield stronger inter-particle interactions. On the other hand, Partal et al.
[24] have found a linear correlation between some rheological parameters (high-shear-
rate-limiting viscosity and flow index) and polydispersity.
Traditionally, the linear viscoelastic response of food emulsions was studied
through creep and recovery experiments [25-27]. Thus, for instance, Gladwell et al.,
[28] proposed a Kelvin-Voigt model with two characteristics retardation times to
describe the creep compliance of mayonnaise-type emulsions. However, the use of
small-amplitude, oscillatory shear (SAOS) experiments has been focusing special
interest. The mechanical spectrum may vary from the typical liquid-like behaviour for
unflocculated or weakly flocculated emulsions, either with G′′ > G′ in a wide range of
frequencies or showing a crossover between both dynamic functions, to the classical
gel-like behaviour for highly flocculated emulsions [19]. The frequency dependence is
mainly affected by inter-droplet interactions, disperse volume fraction and continuous
medium. Thus, for instance, as shown in figure 5, G′ and G′′ curves intersect for salad
dressing-type emulsions stabilized with 1% wt guar gum but show a well developed
plateau region when the thickener consists of 0.5% wt guar gum and 0.5% wt xanthan
gum [23]. If some of the structural parameters previously mentioned (i.e. disperse
volume fraction, viscosity of the continuous phase or emulsifier concentration) do not
affect qualitatively the mechanical spectrum, normalized dynamic functions can be
obtained by using the plateau modulus as normalization factor [29, 30].
In most cases, the linear viscoelastic behaviour can be phenomenologically
described according to the Maxwell generalized model [23, 31]. However, the Oldroyd
[32] and Palierne [33] models have been also applied on food emulsions [34, 35] if the
disperse phase volume fraction, the mechanical spectrum of each phase and the
equilibrium interfacial tension between phases are known. More recently, Pal [36] has
developed a set of equations for describing the shear modulus of concentrated
emulsions of two immiscible elastic liquids using a differential scheme. The models
were tested with food emulsions containing polysaccharides as thickening agents,
considering the continuous media as purely elastic liquids. However, as the same
author pointed out [37], the equations developed in this work could be also used to
describe the linear viscoelastic behaviour of emulsions subjected to sinusoidal stress or
strain, being the shear modulus now a complex quantity.
On the other hand, the linear relaxation spectrum, H(λ), has been occasionally
used to model the linear viscoelastic response of food emulsions. As well known, the
loss, G′′, and storage, G′, moduli and the linear relaxation modulus, G(t), are related to the
linear relaxation spectrum by means of the following equations:
Page 7
C. Gallegos, J. M. Franco and P. Partal, Rheology Reviews 2004, pp 19 – 65.
© The British Society of Rheology, 2004 (http://www.bsr.org.uk) 25
( ) ( ) ( )λlndλω1
λωλHGωG'
22
22
e ∫∞
∞− ++=
..........(2)
( ) ( ) ( )λlndλω1
λωλHωG"
22∫∞
∞− +=
..........(3)
( ) ( ) ( ){ } ( )∫∞
∞−−−+=−
λlndλ/t'texpλHGt'tG e
..........(4)
The calculation of the linear relaxation spectrum, H(λ), implies inverting any of
the Fredholm integral equations which relate it to the values of a given linear
viscoelasticity function. Such inversion is an ‘ill-posed’ problem, as small changes in
the rheological functions give rise to strong oscillations in the spectra [38-40], so that
unstable and even solutions without physical sense may be obtained. For that reason,
approximation methods [39] have been applied to perform such calculations by
simplifying the original problem [10, 29]. On the other hand, the Tikhonov regularization
method has been proposed as a powerful tool for solving the difficulties that arise with
0.1 1 10
0.1
1
10
100
G' G", 0.5% XG + 0.5% GG
G' G", 1% GG
From relaxation spectrum model
G',
G"
(Pa)
ω (s-1)
Figure 5. Storage (G´) and loss (G´´) moduli as a function of frequency
(ω) for 40 % w/w oil-in-water emulsions stabilized with 1% Tween 60
and different thickeners (reproduced from reference [23]).
Page 8
C. Gallegos, J. M. Franco and P. Partal, Rheology Reviews 2004, pp 19 – 65.
© The British Society of Rheology, 2004 (http://www.bsr.org.uk) 26
Fredholm equations, [41-43], which has also been applied to calculate the linear
relaxation spectrum of food emulsions [44, 45].
Franco et al. [10, 29] have used an empirical model, adapted from the one given
by de Rosa and Winter [46] for polymer melts, to successfully describe the three
experimental regions that appear in the linear relaxation spectra of these emulsions:
( ) , for p λλ minλ
n
pλλ
m
cλλ
AλH <<+=
( ) maxλ λpλ
c
pλλ
AλH <<=
for , ..........(5)
where λc and λp are the characteristic relaxation times for the onset of the plateau and
terminal regions, respectively, λmax and λmin are the reciprocal of the minimum and
maximum experimental frequencies attained, m, n and c are the power-law exponents
for the three different regions, and A is an empirical constant.
Madiedo and Gallegos [47] have proposed a different empirical model that
describes the three regions of the relaxation spectra of oil-in-water emulsions
stabilized by a mixture of two sucrose esters with different HLB values:
.
.......... (6)
In this model, m, n and p are, respectively, the slopes of the transition, plateau and
pseudo-terminal regions, λp is the pseudo-terminal relaxation time, and the parameters
α and β are given by the following relationships:
, moλn)(m
moH α
−= .......... (7)
, m)(noHn
noλ
1 β
−= .......... (8)
where Ho is the minimum value of the relaxation spectrum, which appears between the
transition and the plateau regions, and λo is the relaxation time that corresponds to this
minimum. This model was successfully applied to emulsions in which a smooth
transition between the plateau and terminal regions was obtained [30].
Continuous or discrete linear relaxation spectra have been used to model the
non-linear viscoelastic response of food emulsions. Thus, the Wagner constitutive
model [48], which involves the time-strain separability, has been used to predict the
transient and steady flow of commercial and model mayonnaise and salad dressings
(see figures 6 and 7) by introducing either the Maxwell generalized model [23, 49, 50]
or the continuous relaxation spectrum [44, 45, 51]. Thus, for instance, the Wagner
model in simple shear gives for the transient viscosity:
( ) p
pλλ1
nλβmλα λH
+
+=
Page 9
C. Gallegos, J. M. Franco and P. Partal, Rheology Reviews 2004, pp 19 – 65.
© The British Society of Rheology, 2004 (http://www.bsr.org.uk) 27
( ) ( ) ( ){ } ( ) ( ) t dλlnd)tγ(t,γh/λttexpλHγ
1γt,η
t′′′−−−= ∫ ∫∞−
∞
∞−
&& ..........(9)
in which the most common forms of the damping function used were the Wagner and
Soskey-Winter equations [48, 52].
In addition to this, the parameter values of these damping functions have been
correlated with protein concentration of salad dressing type-emulsions. An increase in
protein content resulted in higher values of both Wagner’s damping factor (k) and
Soskey-Winter’s parameter (a). In general, a marked strain softening was detected
which confirms the experimental observation that emulsion viscoelasticity is delicate,
as well as limited to smaller strain deformations than polymer systems [51].
2.2 Studies on wall slip.
The issue of wall slip requires special attention in relation to the understanding
of the behaviour of disperse systems under shear conditions. At present, it is accepted
that true slip at the wall does not occur during the flow of colloidal systems and, as
Barnes [53] has pointed out, the term “wall depletion” is the most accurate way to
10 -5 10 -4 10 -3 10 -2 10 -1 100 101 102 103
100
101
102
103
104
105
106
Experimental flow curveWagner model prediction
Shear rate (s -1)
η (
Pa
.s)
Figure 6. Prediction of steady viscous flow for an oil-in-water emulsion
containing 65% oil and 3% lupin protein (reproduced from reference
[51]).
Page 10
C. Gallegos, J. M. Franco and P. Partal, Rheology Reviews 2004, pp 19 – 65.
© The British Society of Rheology, 2004 (http://www.bsr.org.uk) 28
describe this phenomenon in which the non-slip boundary conditions are not violated.
Emulsions often show these effects due to the displacement of the dispersed phase
away from solid boundaries, as for instance the walls of the sensor systems in a
rheometer or the walls of pipes or tubes, giving a depleted layer of liquid, which then
acts as a lubricant. This leads to an apparent decrease in the measured bulk viscosity.
In the case of emulsions, the deformability of the droplets and creaming enhance this
effect. As has been detected in several food emulsions [53-55] wall slip phenomenon
is generally confined in a certain range of shear rates associated to constant values of
shear stress or, in other words, around a critical stress at which a sudden drop in
viscosity takes place. The use of roughened plates or the vane geometry has been
proposed as effective techniques for eliminating slip effects in emulsions [53, 55, 56].
However, in complex systems, such as food emulsions, this phenomenon is until now
not fully understood from a micro-structural point of view. Franco et al. [55]
demonstrated that wall slip effects are strongly dependent on the composition and type
of emulsion. Thus, for instance, a highly structured gel-like continuous phase dampens
these effects, in contrast to oil-in-water emulsions with relatively low disperse phase
volume fraction, in which creaming appears as a mechanism of instability. Sánchez et
al. [57] proposed an empirical method to quantify the extension of wall slip as a
function of several structural parameters such as disperse phase fraction, emulsifier
concentration and droplet size (influenced also by processing), according to the
differences found in the flow curves obtained with both serrated and smooth
geometries along the experimental range of shear rate or shear stress studied. More
recently, Bertola et al. [3] have related the slip phenomena to the yielding behaviour
and flow instabilities of emulsions. In addition to this, they demonstrated that slip does
not occurs when using rough surfaces by withdrawing the calculated shear rate due to
slip from the data obtained with smooth surfaces. Then, flow curves almost exactly
correspond to those obtained using rough surfaces.
Although wall slip under the flow of food emulsions is a generally accepted
phenomenon, some controversy appears in relation to the evidence of apparent wall
slip in SAOS experiments. Ma and Barbosa-Cánovas [58] and Plucinski et al. [54]
support the idea that no evidence of apparent wall slip in oscillatory shear is found for
mayonnaises. On the contrary, Goshawk et al. [59], which performed several tests with
different plate-plate separations, found that the values of the linear viscoelastic
functions, at a given frequency, decrease as the plate-plate separation decreases,
indicating that mayonnaise tested exhibits wall slip under SAOS, fact that is even
surprising for the authors. Pal [56] also detected that the oscillatory response of
emulsions is strongly influenced by slip effects not only quantitatively but also from a
qualitative point of view since, in some cases, a solid like behaviour was found using
the serrated plate geometry whereas a fluid-like response was obtained with smooth
cone-plate geometries for the same emulsion. In addition to this, the linear viscoelastic
range was clearly influenced by wall slip.
2.3 Effect of composition.
One of the main goals of emulsion technology is to find new alternatives for
improving the stability and the physical properties. This research is usually centred on
new surface-active agent suitable for replacing traditional egg and milk derivatives as
Page 11
C. Gallegos, J. M. Franco and P. Partal, Rheology Reviews 2004, pp 19 – 65.
© The British Society of Rheology, 2004 (http://www.bsr.org.uk) 29
emulsifier. Since the strength and nature of the interactions among droplets depend on
the type and concentration of the emulsifiers used, emulsion stability and,
consequently, the bulk rheology are also influenced [60]. Further stabilization may
arise from the presence of low concentrations of water-soluble polysaccharides,
hydrocolloids, which act as thickening or structuring agents in the continuous phase
[61]. The main function of these hydrocolloids is to reduce the mobility of oil droplets,
decreasing the extension of both flocculation and creaming processes.
Figure 7. Predictions of transient shear stress for selected sucrose
palmitate-stabilized emulsions (reproduced from reference [45])
Page 12
C. Gallegos, J. M. Franco and P. Partal, Rheology Reviews 2004, pp 19 – 65.
© The British Society of Rheology, 2004 (http://www.bsr.org.uk) 30
Hen egg yolk is known as a reference ingredient in many food emulsions, such
as mayonnaises or salad dressings, because it imparts desirable flavour, mouth-feel
and colour. However, a problem associated with egg yolk is its high cholesterol
content, which has been associated with a causative agent for heart disease. The use of
organic solvents has been proposed as an effective way of removing cholesterol from
egg yolk. Paraskevopoulou and Kiosseoglou [62] observed that extraction of yolk with
petroleum ether resulted in a yolk-protein concentrate with emulsifying properties
comparable to those of native egg yolk. In general, organic solvents, [63-65] remove
all the lipids, including cholesterol, as well as the phospholipids responsible for the
functional properties. On the other hand, a treatment with sub-critical or supercritical
CO2 offers a more attractive way of selectively extracting cholesterol from egg [66]. In
general, these authors concluded that viscoelasticity of low-cholesterol egg yolk-
stabilized emulsions is comparable to that of high cholesterol commercial
mayonnaises and higher than that shown by the control spray-dried yolk [63, 65]. A
more systematic study was developed by Moros et al., [67] in which the influence of
different levels of cholesterol removing on the resulting egg yolk-stabilized emulsion
was quantified. It was observed that the viscosity and the linear viscoelastic functions
of low-cholesterol egg yolk-stabilized emulsions significantly decrease with egg-yolk
cholesterol concentration for systems having a constant concentration of surface-active
components. Thus, for instance, a reduction of more than 50% in the values of the
plateau modulus was found for an emulsion stabilized by a highly cholesterol-reduced
egg yolk (i.e. 81% wt cholesterol removed). Nevertheless, a different evolution was
generally found in emulsions containing the same amount of cholesterol-reduced yolk.
The generalised initial increase in viscoelastic parameters was explained by an
increase in the concentration of surface-active components, as cholesterol and lipids
were removed, but, in the same manner, a conformational alteration of lipoproteins
induced by the cholesterol reduction seemed to affect emulsions predominantly using
the maximum cholesterol-reduced egg yolk, especially at high oil content and low egg
yolk concentrations (see figure 8).
Low-cholesterol products may be also achieved by replacing, total or partially,
egg yolk by vegetable proteins. The influence of composition and processing
conditions on the rheology of vegetable protein-stabilized emulsions have been widely
studied by different authors [22, 68-70]. Most remarkable is the effect of pH [70]. An
increase in the pH of the emulsion initially leads to an increase in emulsion viscosity
and viscoelastic functions, as well as to a decrease in the mean droplet size, closely
related to the lower diffusion rate of the protein to the oil-water interface due to a
higher denaturation degree of the protein at low pH. At pH close to the protein
isoelectric point, a singular rheological behaviour is found. Thus, high values of
emulsion viscosity and viscoelastic parameters than those expected from its droplet
size distribution were found, probably due to the formation of highly packed protein
film at the interface which leads to a high surface viscoelasticity. The further slight
decrease in the viscous and viscoelastic functions, at emulsion pH values above the
isoelectric point, must be related to a decrease in interfacial viscoelasticity.
The evolution of viscosity and plateau modulus with pH are shown in figure 9.
Page 13
C. Gallegos, J. M. Franco and P. Partal, Rheology Reviews 2004, pp 19 – 65.
© The British Society of Rheology, 2004 (http://www.bsr.org.uk) 31
Addition of a low-molecular-weight emulsifier may also yield an important
stabilizing effect. Although, as a general rule, simple non-ionic surfactants displace
proteins from the interface [71], some positive surfactant-protein interactions affecting
not only emulsion or foam stability, but also rheology, have been reported [72-78].
Several physical mechanisms are responsible of the final emulsion characteristics
mainly depending on the molar ratio of both kinds of emulsifiers. As Dickinson and
0 20 40 60 80 10010
2
103
b)egg yolk conc.
5%
4%
3%
GN
0 (
Pa
)
α cholesterol
(%)
102
103
a)
a)
egg yolk conc.
8%
7%
6%
5%
4%
3%
GN
0 (
Pa
)
Figure 8. Influence of the level of cholesterol extraction on the plateau
modulus for emulsions containing: (a) 70% wt oil, (b) 77.5% wt oil, and
different cholesterol-reduced egg yolk concentrations.
Page 14
C. Gallegos, J. M. Franco and P. Partal, Rheology Reviews 2004, pp 19 – 65.
© The British Society of Rheology, 2004 (http://www.bsr.org.uk) 32
Hong [76] explained, at low surfactant concentrations, the surfactant is not available
for disrupting the protein adsorbed layer or displacing protein from the interface,
because is involved in complexation with the protein, yielding an increase in G′ . This
fact was explained on the basis of an enhancement of the local packing density in the
adsorbed layer. However, increasing surfactant additions produce a dramatic decrease
in G′ . This linear viscoelasticity function may pass through a minimum and rise again,
due to hydrophobic interactions, or show a continuous decay due to an irreversible loss
of surface viscoelasticity, depending on the protein concentration. In addition to this,
the phase behaviour of the surfactant/water systems must be taken into account. Thus,
the formation of a liquid-crystalline, or a gel-like continuous phase, around oil droplets
results in enhanced stability and considerably increased rheological parameters [77,
79]. Demetriades and McClements [80] indicated also the importance of pH in protein-
surfactant interactions in emulsions stabilised by mixtures of sodium dodecyl sulfate
(SDS) and whey proteins. Above the isoelectric point of the proteins, as expected,
SDS binding enhances emulsions stability by increasing the electrostatic repulsion
among droplets. However, below the isoelectric point an extensive flocculation occurs,
which significantly increase the viscosity and decrease creaming stability.
On the other hand, the effect of using a mixture of different types of proteins in
the properties of oil-in-water emulsions is open to discussion. Several authors showed
that it might lead to a synergistic interaction, providing an improvement in the quality
of the final product [74], whereas other authors showed that it might lead to some
deterioration in performance, rather than an improvement. The origin of this
3,0 3,5 4,0 4,5 5,0 5,5 6,0 6,5 7,0 7,510
3
104
105
η0
.01 (
Pa
·s)
pH
10
100
1000
GN
o (Pa
)
Figure 9. Evolution of the steady-state viscosity at 0.01 s
-1 and the
plateau modulus with emulsion pH for pea protein-stabilized emulsions
(reproduced from reference [70]).
Page 15
C. Gallegos, J. M. Franco and P. Partal, Rheology Reviews 2004, pp 19 – 65.
© The British Society of Rheology, 2004 (http://www.bsr.org.uk) 33
deterioration may be a more disarranged organisation of both kinds of protein at the
interface [81-83], the manifestation of either thermodynamic incompatibility between
them [84] or competitive adsorption of these protein molecules at the interface [85,
86]. Systematic rheological studies carried out in this sense indicates that partial
replacement of egg yolk by milk or vegetable proteins as emulsifiers confers to the
emulsions lower values of viscosity and viscoelastic functions than those obtained
when egg yolk was the only emulsifier [86, 87]. However, at sufficiently high weight
ratios of pea protein/egg yolk the tendency was inverted, increasing the viscoelastic
functions as pea protein concentration increases.
Ionic strength also influences the stability and bulk rheology of food emulsions
(specially protein-stabilised), since it modifies the structure of the electrical double
layer surrounding the droplets. Thus, for instance, the apparent viscosity and the shear-
thinning character increase with CaCl2 concentration, indicative of droplet
flocculation; although this phenomenon is reduced by lowering pH [88]. The addition
of salt, in a SDS-stabilized emulsion enhances the shear-thinning behaviour but adding
small amounts of sodium caseinate bring about a gradual lowering of the low-stress
apparent viscosity. Further increases in caseinate content lead to a cuasi-Newtonian
behaviour. This fact was explained on the basis of a sequence of reversible
flocculation, non-reversible flocculation and, finally, breaking up of flocs structures as
caseinate content increases [89]. On the other hand, small amounts of ionic calcium
initially decreases the viscosity of caseinate-stabilised emulsions, but starting from a
critical calcium/caseinate molar ratio the viscosity increases, being much higher than
the calcium-free emulsion and inhibiting depletion-flocculation. The addition of a non-
ionic surfactant was found to have a synergistic effect but, in this case, a jump in the
low-stress viscosity and the onset of substantial shear-thinning was attributed to
emulsion destabilisation due to a surfactant-induced depletion flocculation [90].
In principle, the inclusion of a thickener agent increases emulsion stability and
viscosity. Usually, the higher polysaccharide concentration, the higher the values of
viscosity [91, 92] and viscoelastic functions [69] are. However, a thermodynamic
incompatibility may occur in some protein-stabilised emulsions with added
polysaccharides [93]. In addition to this, the use of mixtures of polysaccharides may
result in a synergistic rheological effect, for instance xanthan gum together with guar
gum, or a negative effect, as for instance adding xanthan gum to potato starch [23].
Finally, the presence of non-thickener polysaccharides as sucrose or glucose, used as
sweeteners, may also affect emulsion rheology. Dickinson and Merino [94] found that,
at high concentrations, the presence sugar leads to larger emulsion droplets, reduces
the gelation time and increases the elastic modulus in caseinate-stabilised emulsions.
Sugar was also found to affect large-deformation rheology, promoting strain-
weakening and a shorter linear regime.
2.4 Processing and technological aspects.
Emulsification is a complex unit operation in which many variables influence
the processing and the final rheological characteristics of the product. The
manufacture of emulsions usually requires the application of considerable mechanical
energy. The two critical steps are the consecutive disruption of droplets and their
Page 16
C. Gallegos, J. M. Franco and P. Partal, Rheology Reviews 2004, pp 19 – 65.
© The British Society of Rheology, 2004 (http://www.bsr.org.uk) 34
coalescence, both of which are favoured by an intense agitation. Consequently, the
improvement of the emulsification process requires the measurement of the droplet
size of the dispersed phase and its polydispersity. Moreover, the emulsification process
may be greatly affected by the viscous and viscoelastic properties of the continuous
phase at which the disperse phase is added.
One of the first studies on the influence of mechanical variables during
processing was reported by Franco et al., [10] for emulsions stabilized by a mixture of
macromolecular and low-molecular-weight emulsifier. Figure 10 shows the linear
relaxation spectra of emulsions prepared with a rotor-stator turbine as a function of
rotational speed and residence time. As can be observed the slope of the plateau region
increases with the processing mechanical variables, because of the development of a
three-dimensional network. This is also enhanced by a decrease in mean droplet size
and polydispersity of the emulsion, yielding stronger inter-droplet interactions. As a
result, stability against creaming was improved. Different results were obtained later
on for emulsions stabilized by a sucrose ester non-ionic surfactant [95], which forms a
gel-like structure in the continuous phase for a wide range of concentrations and
temperatures [43]. As was previously mentioned, an increase in agitation speed or
emulsification time also produces a decrease in droplet size and polydispersity.
However, in this case, an increase in the agitation speed produced a decrease in the
values of the dynamic viscoelasticity functions. The opposite effect was found by
10-2 10-1 100 101 102 103100
101
102
103
104
b
BSW-CW model
H (
λ)
(Pa)
λ (s)
Figure 10. Influence of emulsification time and agitation speed on the
relaxation time spectra of salad dressing emulsions: � 8000 rpm – 5 min,
� 8000 rpm - 3min, ∆ 5000 rpm – 5 min, ∇ 5000 rpm – 3 min. Adapted
from reference [10].
Page 17
C. Gallegos, J. M. Franco and P. Partal, Rheology Reviews 2004, pp 19 – 65.
© The British Society of Rheology, 2004 (http://www.bsr.org.uk) 35
increasing the emulsification time. Therefore, the viscoelastic properties of these
emulsions depend on the balance between the formation of a larger interfacial surface
and the breakdown of the gel-like structure of the continuous phase during processing.
The influence of mechanical processing variables on vegetable protein-
stabilised emulsions is mainly affected by droplet size [22]. An increase in
emulsification time and, specially, agitation speed produces a decrease in the Sauter
diameter and favours the development of an entanglement network, noticed by an
enhanced development of the plateau region in the mechanical spectrum and a
significant increase in the values of the dynamic functions (i.e. see figure 11). These
authors also found an increase in emulsion viscosity and other textural parameters like
firmness and adhesiveness.
Temperature is a crucial variable to be controlled during the processing of
protein-stabilised emulsions. For instance, an increase in the temperature during the
emulsification, induced by the application of a severe mechanical energy, must affect
the protein hydrophobicity [68] and, consequently, favours the inter-droplet
Figure 11. Evolution of the plateau modulus for lupin protein-stabilized
emulsions prepared with different emulsification times and
homogenization speeds (reproduced from reference [22]).
Page 18
C. Gallegos, J. M. Franco and P. Partal, Rheology Reviews 2004, pp 19 – 65.
© The British Society of Rheology, 2004 (http://www.bsr.org.uk) 36
interactions. On the other hand, an increase in temperature or heating time favours the
coalescence process, leading to larger droplet sizes and broader distributions, as found
for pea-protein stabilised emulsions [70]. However, a severe thermal treatment
previous to emulsification leads to more viscous emulsions. Thus, for instance, the
viscosity and the plateau modulus increases with temperature, specially up to a
temperature around 75º C and then remain almost constant, in spite of higher droplet
sizes, a fact that is related to the achievement of the protein extensive denaturation.
The application of high temperatures during the emulsification process produces
similar effects [10].
An even more severe previous thermal treatment on native egg yolk is the
spray-drying process, usually required to microbiologically preserve the final product,
or as the first step previous to a cholesterol extraction process [67, 96]. The rheology
of spray-dried yolk stabilized emulsions is dramatically different to that found with
native egg yolk-stabilised emulsions due to a significant denaturation of egg yolk
lipoproteins, which confers a marked gel-like behaviour and significantly higher
values of the linear viscoelastic functions to these egg product-stabilized emulsions
[97, 98].
The application of thermal treatments after emulsification may also have
significant influence on the rheological behaviour of protein-stabilised emulsions.
Dickinson and co-workers [75, 76, 99-102] have extensively studied, during the last
few years, the rheological properties of heat-set whey protein-stabilised emulsion gels
and the in situ gelation process through small-deformation oscillatory measurements.
In all cases, the fresh emulsion was a very low viscous liquid-like system and became
a gel network by increasing temperature. Thus, a crossover between G′ and G′′ was
noticed at a relatively high temperature. Chen and Dickinson [102] investigated the
effects of protein concentration and the volume fraction of oil phase on the viscoelastic
properties of heat-set whey protein emulsion gels. They conclude that protein
concentration is the main factor affecting gel strength. The dispersed oil droplets act as
space fillers but also help to build up the gel matrix structure through interactions
between protein molecules at the droplet surface and those in the gel matrix. The filler
effects of oil droplets on the rheology of heat-set egg yolk, soy and milk protein-
stabilised emulsion were respectively studied with some detail by Dickinson and Chen
[103], Anton et al., [104] and Kim et al. [105]. Although a simplified van der Poel´s
equation [106] to estimate the shear modulus of a particulate composite has been used
by the authors, the fitting fails due to both oil droplet flocculation and droplet
deformability.
This thermorheological behaviour was shown by emulsions with relatively low
volume fractions of oil phase. The improvement in the strength of highly concentrated
gel-like emulsions, by means of thermorheological treatments, was also studied by
Moros et al [107]. They show how highly flocculated egg yolk-stabilised emulsions, in
principle with a soft gel-like behaviour achieved during the emulsification process, are
susceptible to improve their gel-like behaviour by applying different thermal
treatments on fresh emulsions. Thus, for instance, the application of
upward/downward temperature cycles, setting the maximum temperature at 67º C,
avoids emulsion breakdown and yield significantly higher values of the rheological
Page 19
C. Gallegos, J. M. Franco and P. Partal, Rheology Reviews 2004, pp 19 – 65.
© The British Society of Rheology, 2004 (http://www.bsr.org.uk) 37
functions in comparison to those found with fresh emulsions, in spite of the thermal-
induced droplet coalescence observed.
As may be observed in figure 12, in the first region, which corresponds to a
temperature range comprised between 25 and 67º C, the evolution of G′ is typical of
that found during an upward temperature ramp, an initial decrease of the dynamic
functions up to around 45º C and a subsequent increase up to around 70º C, related to a
heat-induced rearrangement of the egg yolk lipoproteins located at the interface of oil
droplets. In the second region, where temperature is kept constant at 67º C for different
elapsed times, G′ shows a rapid increase and then levels off. If temperature is kept
constant at 67º C for 500 s (cycles B3 and B4) the values of G′ are significantly higher
than those obtained by cooling the sample immediately after the maximum
temperature was reached (cycle B1). On the contrary, when the sample was
maintained at 67º C for a much longer period of time, i.e. 1500 s (cycle B2), a slight
decrease in G′ is shown. These results were explained taking into account the
aggregation of denatured lipoproteins, mainly livetins and LDL. However, if the
sample is maintained at high temperature during an extended period (cycle B2) a
subsequent significant coalescence of oil droplets may be observed (i.e. d43 = 25.2 µm
after the application of cycle B2 versus d43 = 16.4 µm after the application of cycle
B3).
Finally, a further sample cooling produces a new increase in G′ , mainly due to
hydrogen bonding. On the contrary, the cooling rate seems not to affect the final value
of the linear viscoelastic functions, as may be deduced from the comparison of the
final values of G′ after the application of cycles B3 and B4 respectively. Afterwards,
the values of G′ do not change by keeping constant temperature at 25º C, which
0 1000 2000 3000 4000 50000
100
200
300
400
500
600
700
T
(ºC
)
G' (
Pa)
t (s)
20
30
40
50
60
70
cycle B1 G'
cycle B2 G'
cycle B3 G'
cycle B4 G'
Figure 12. Evolution of G′ with time, during the application of different
cycles of temperatures, for an emulsion containing 70% (w/w) oil and
5% (w/w) egg yolk (reproduced from reference [107]).
Page 20
C. Gallegos, J. M. Franco and P. Partal, Rheology Reviews 2004, pp 19 – 65.
© The British Society of Rheology, 2004 (http://www.bsr.org.uk) 38
indicates an irreversibility of the gel reinforcement process. However, absolute values
of G′ after the application of these thermal treatments were significantly lower as
compared to those found by others [102, 103, 108], results that were obtained with
milk protein-stabilized emulsions subjected to the same thermal treatments and
containing similar protein concentrations, even with much lower fraction of dispersed
phase, which indicates that egg yolk-stabilized emulsions are much less susceptible to
enhance gel strength than milk protein systems.
The reversibility of heat-induced gelation was studied by Dickinson and co-
workers, for caseinate-stabilised emulsions, through viscosimetry measurements [101,
109]. They showed that a thermo-reversible gelation in the temperature range of 30-
45º C occurs mainly depending on pH and calcium ion content. They divided the
emulsions, attending to the reversibility, in three categories (see figure 13): i) liquid-
like emulsions which remains liquid when heated, ii) liquid-like emulsions which
become gels when heated, exhibiting an increase in viscosity of, at least, one order of
magnitude and decreasing viscosity again when it was cooling back down, and iii)
emulsions that show already a gel-like behaviour when emerging from the
homogeniser, which present an increase in viscosity of several orders of magnitude on
heating above 30º C, without returning to low values on cooling back to ambient
temperature. They presented a sort of phase diagram showing the different behaviours
as a function of acid and calcium content. In addition to this, Chen and Dickinson
[108] studied the effect of different programs of temperature on the reversibility of
emulsions gels, attending to the evolution of the linear viscoelastic functions. As an
Figure 13. Examples of the three categories of emulsions attending to
the thermoreversibility of the rheological behaviour. Solid lines:
heating; dashed lines: back-cooling. �: category i), �: category ii),�:
category iii). Reproduced from reference [109].
Page 21
C. Gallegos, J. M. Franco and P. Partal, Rheology Reviews 2004, pp 19 – 65.
© The British Society of Rheology, 2004 (http://www.bsr.org.uk) 39
example, they concluded that the application of a program 45º C → 5º C → 45º C on
the emulsions leads to a temperature-reversible behaviour. G′ and G′′ increase on
cooling to 5º C and recover their original values on reheating to 45º C. On the
contrary, the program 5º C → 45º C → 5º C produces a non-reversible rheological
behaviour. Thus, they found G′ values around 10 times higher than values before the
application of the thermal treatment.
An alternative to heat treatments is the high-pressure technology. The
emulsifying and stabilising ability of some high-pressure treated vegetable and milk
proteins were found inferior to those shown by the native proteins, which was
attributed to an enhanced dissociation and/or aggregation through disulphide bridging
[110, 111]. However, the viscoelastic parameters, i.e. the complex modulus, of
emulsions prepared with severely pressure-treated (up to 800 MPa) β-lactoglobulin are
higher in a wide range of pH than those found with untreated systems, even more
when a thickener agent was included in the formulation, probably due to the
development of high-pressure-induced interdroplet macromolecular linkages [111]. In
any case, high-pressure processing seems to be a gentler processing operation in terms
of changes in droplet size and instability [112]. On the contrary, high-pressure
treatments prior to emulsification (600 and 400 MPa, respectively) on ovoalbumin
[113] or lupin protein [114] clearly improve the emulsifying efficiency and stabilizing
properties of emulsions. Concerning the rheological behaviour, Chapleau and de
Lamballerie-Anton [114] found that viscosity and G′ and G′′ values slightly increase
with pressure, although the viscoelastic behaviour, typical of flocculated emulsions,
was essentially the same.
The influence of processing variables may be also studied by means of an in
situ rheological monitoring of the emulsification process [115]. The in situ rheological
measurements were carried out in a small-scale semi-batch reactor, so called rheo-
reactor, equipped with a helical ribbon impeller adapted to a rheometer. An analytical
method based on the Couette analogy allows to quantify correctly the torque-rotational
speed to be transformed in the absolute rheological response, either under steady-state
flow or in oscillatory regime [116]. The rheo-reactor not only provided real-time
information during processing, but also allowed a complete rheological
characterization of the final product without any sampling. Edgar Chavez-Montes et
al. [115] followed-up in situ the processing of one of the most complex food systems
such as ice cream, consisting of an emulsion of milk-fat globules in a highly viscous
continuous phase containing sugars, proteins and stabilizers together with ice crystals
and air bubbles. Processing was divided in two crucial steps, foaming and subsequent
freezing of mixes. They found that rheology of the incipient product was mainly
influenced by the type and concentration of stabilisers. Figure 14 shows the evolution
of specific viscosity with time during the foaming step for different blends of
stabilisers and emulsifiers. In addition to this, a combination of two emulsifiers (i.e.
Tween 20 and mono-and diglycerides) was necessary to produce a desired partial
coalescence of fat globules, which is related to the melting resistance of ice creams.
Page 22
C. Gallegos, J. M. Franco and P. Partal, Rheology Reviews 2004, pp 19 – 65.
© The British Society of Rheology, 2004 (http://www.bsr.org.uk) 40
3. RHEOLOGY OF CONCENTRATED PLANT FOOD SUSPENSIONS
The viscous flow behaviour of many concentrated plant food dispersions has
been extensively studied during many years. It appears that most, if not all, of them
exhibit shear-thinning flow behaviour, although in many cases the minimum shear rate
applied was rather high. Consequently, the Ostwald-de-Waele model has been used
extensively for characterising the viscous flow properties of plant food dispersions,
although different authors have sustained that many plant food dispersions also exhibit
a yield stress. Power-law parameters and yield stress values for selected plant food
dispersions are shown in Table 2. Nevertheless, some comprehensive compilations of
these parameters can be found in the literature [117, 118].
Several important differences between plant food and non-food suspensions
should be mentioned [2]:
- the solid particles in food suspensions are not of simple shapes;
- they are flexible and have multimodal size distributions [131];
- the particles are hydrated and are in physical and chemical equilibrium
with the continuous medium;
- the continuous medium of a typical food suspension, usually called
serum, is an aqueous solution of sugars, organic acids, salts and pectic
substances;
Figure 14. Evolution of specific viscosity during foaming of mixes
stabilized with different thickeners and emulsifiers (reproduced from
reference [115]).
Page 23
C. Gallegos, J. M. Franco and P. Partal, Rheology Reviews 2004, pp 19 – 65.
© The British Society of Rheology, 2004 (http://www.bsr.org.uk) 41
- the chemical composition of the continuous medium depends on the
product, the cultivar and factors such as the extent of ripening.
The above mentioned characteristics can lead to significant inter-particle
interactions compared to viscous forces, resulting in different flow behaviour.
Product % Solids T (ºC) n K
(Nsn/m
2) 0τ
(Pa) Comment Reference
Apple Sauce 86.8 –
99.3 25
0.15 -
0.24 40.6 - 76.9
18.4 –
46.4
Three yield stress
mode: Casson.,
Herschel-Bulkley
ad Mizrahi-Berk
Qiu and Rao
(1988) [119]
Apple puree Three
samples
25 -
60 0.4 112 - 58 Power law model
Schaller et
al. (1970)
[120]
Apple sauce 12º Brix 25 0.297 -
0.399
7.38 -
19.95
Power law model
Viscosity/ ºBrix/
pectin relation
Rao et al.
(1986) [121]
Apricot puree 69 – 72 4.5 -
60
0.28 -
0.46 3.5 - 86.0
Variation of K and
n with T
Watson
(1968) [122]
Apricot puree Four
samples 22.5
0.59 -
0.79 0.82 - 1.65
8.04 –
22.11
Casson, Steiner and
author’s model
Thixotropic
Costell and
Duran
(1978)[123]
Banana puree 26.5 40 0.34 8.575 Power Law model García et al.
(1974) [124]
Banana puree 17.7 22 0.28 12.3 Power Law model
Rao et al.
(1974) [125]
Qiu and Rao
(1990) [126]
Blackcurrant
juice 35 - 64.5 5 - 60 1.0 2.4 - 500
Newtonian model
effect of
temperature and
composition
Ibarz et al.
(1992b)
[127]
Grape juice 55 – 68 -10 to
40
Newtonian model
temperature effects
Rao et al.
(1986) [128]
Lemon products 9.5 – 62 0.72 - 1 0.43 - 1.69 2.07
Power law and
Herschel Bulkley
models temperature
effects
Saenz and
Costell
(1987) [129]
Orange juice
concentrated 59 – 65 30
0.302 -
0.4 0.26 - 0.45
0.49 -
0.78
Mizrahi-Berk
model (Modified
Casson model)
Rao et al.,
(1984) [130]
Table 2. Power-law parameters and yield stress values of some plant food dispersions.
Page 24
C. Gallegos, J. M. Franco and P. Partal, Rheology Reviews 2004, pp 19 – 65.
© The British Society of Rheology, 2004 (http://www.bsr.org.uk) 42
In addition to this, the amount and the size distribution of the insoluble solid
matter in the plant food suspensions depend to some extent on the size of the screen
employed in the finishing operation during their manufacture [131]. Therefore, food
suspensions are complex materials whose characteristics with respect to the nature of
the insoluble solids, as well as those of the fluid media, must be determined prior to
experimentation. Consequently, to understand the role of the continuous and dispersed
media, the two media should be separated by centrifugation and their characteristics
studied separately.
Because of the compressible nature of plant food dispersions, the direct
determination of the magnitude of the volume fraction is difficult as it depends on the
centrifugal force employed in the separation of the phases. Therefore, standard
centrifugal forces must be employed for determining the pulp content of a given plant
food dispersion [132].
Very good examples of typical plant food dispersions are the wide variety of
industrial tomato products manufactured: tomato paste, puree and concentrate, tomato
ketchup and fried tomato sauce.
3.1 Viscous flow of tomato dispersions.
Tomato paste is a dispersion of solid particles (pulp) in aqueous media (serum)
[133] resulting from the concentration of tomato pulp, after the removal of skin and
seeds, and contains 24% or more natural soluble solids [134]. Tomato puree is the
term applied to lower concentrations of tomato paste (containing 8% to less than 24%
natural soluble solids). Tomato paste can be produced either by the cold break or by
the hot break process [135]. In a hot break process the chopped tomatoes are pumped
into a heat exchanger and immediately preheated to a temperature of at least 85º C, by
which the pectolytic enzymes polygalacturonase (PG) and pectin methyl-esterase
(PME), present in the tomatoes, are inactivated [136]. In a cold break process the
chopped tomatoes are preheated to temperatures of around 60º C. Then the pectolytic
enzymes retain a large part of their activity and are able to degrade the cell wall pectin
during subsequent processing. During pulping/finishing [137] the preheated tomato
pulp passes two or three sieves, with pore sizes normally ranging from 0.5 to 1.5 mm,
to remove skins and seeds. Subsequently, the resultant juice is concentrated, by
evaporation under partial vacuum, to tomato paste with a refractive index of 28-30º
Brix. A flow diagram of tomato paste processing is presented in figure 15.
One of the main quality attributes of tomato concentrate products is viscosity
[136]. The apparent viscosity of tomato concentrates is influenced by different factors:
tomato variety and maturity; water-insoluble (WIS) and water-soluble (WSS) solids
content; particle size distribution and particle shape; and processing variables [134].
Different empirical models have been used to characterize the flow behaviour of
tomato concentrate [132, 138]. Thus, tomato concentrate viscous behaviour has been
usually described by a power-law model [133, 139, 140] and this assumption has been
reported as satisfactory for engineering design purposes [141]. Values of the flow
index range from 0.18 to 0.26 for tomato concentrates [140, 142].
Page 25
C. Gallegos, J. M. Franco and P. Partal, Rheology Reviews 2004, pp 19 – 65.
© The British Society of Rheology, 2004 (http://www.bsr.org.uk) 43
Fito et al. [143] confirmed the shear thinning nature of concentrates and
measured both the flow and the consistency indexes as a function of temperature for
concentrates produced by both hot- and cold-break methods. The variation of the flow
index with temperature was not found to be significant. In contrast, Trifiro et al. [141]
found both the consistency index and the flow index to vary with temperature and
suggested the following relationships:
K = K0 a1000/T ..........(10)
n = n0 + 1000/T , ..........(11)
where K0, a, n0 and b are material specific constants and T is the absolute temperature.
The power law and temperature dependent values of K and n were then used to
estimate the pressure drop in continuous “tube-in-tube” heat exchangers, used for heat
TOMATO PASTE
PASTEURIZER
STAND-BY TANK
DOUBLE EFFECT
EVAPORATOR
STAND-BY TANK
PULPERS & FINISHERS
BREAK
(Cold or Hot)
DEAERATOR
CUTTER
INSPECTION
WASHING
UNLOAD
TOMATOES
Figure 15. Flow diagram of tomato paste processing.
Page 26
C. Gallegos, J. M. Franco and P. Partal, Rheology Reviews 2004, pp 19 – 65.
© The British Society of Rheology, 2004 (http://www.bsr.org.uk) 44
sterilization of tomato paste.
In addition to this, different models that include the yield stress as a fitting
parameter, such as the Herschel-Bulkley and the Casson models [133, 144] have been
also used to describe the viscous behaviour of tomato concentrates. In some cases, the
yield stress was obtained by using the vane method [145]. Rao et al. [146] reported
values of the flow index in the Herschel-Bulkley model ranging from 0.27 to 0.66,
depending on tomato variety. Dervisoglu and Kokini [147] fitted data from tomato
paste also to the Herschel-Bulkley model, and found yield stresses of the order of 45
Pa. The flow index was in broad agreement with other measured values.
A large number of papers have been published relating apparent viscosity, yield
stress and power-law parameters to solid concentration and particle size [133, 144,
146, 148-151] and to processing conditions, as well, such as breaking temperature,
finishing, concentration and homogenisation of tomato juice and tomato paste [131,
143, 145, 148, 152-153] . In fact, these processing conditions have an indirect effect on
the apparent viscosity and flow parameters, by influencing the physico-chemical
characteristics of the WIS particles, WIS concentration and serum viscosity.
Bhasin and Bains [154] sustained that neither the tomato variety nor the method
of juice extraction had any significant effect on the flow index values. In the same
way, Rao et al. [146] showed that the flow index was not significantly influenced by
solids concentration. Molwane and Gunjal [155] found lower values of the flow index
for hot-break than cold-break concentrates, although this index did no change
appreciably by increasing solids concentration or temperature.
Rao et al. [146] found that the consistency index increases as total solids of the
concentrates do. Both exponential and power type relations were found to be suitable
for describing the relationship between total solids and the consistency index:
K = a1 exp(b1 . total solids) ..........(12)
K = α (total solids)β ..........(13)
Table 3 shows the values of the power-law relationship between the
consistency index and solids concentration for selected plan food dispersions.
Rao and Cooley [157] proposed that the logarithm of the apparent yield stress
and total solids of tomato concentrates are related by a quadratic equation:
ln τ0 = a + b(TS) + c(TS)2 ..........(14)
On the contrary, Sharma et al. [144] have related the yield stress and the water
insoluble solids (WIS) using an exponential equation:
τ0 = a exp [b(WIS)] ..........(15)
In the same way, Xu et al. [153] found that the viscosity of tomato concentrates
was higher for hot-break than cold-break samples. Thus, they evaluated the rheological
properties of tomato paste produced from three varieties at breaking temperatures of
85, 96 and 107º C. Apparent viscosity depended both on tomato variety and process
temperature, with the highest viscosity achieved through use of the 107º C breaking
temperature.
Page 27
C. Gallegos, J. M. Franco and P. Partal, Rheology Reviews 2004, pp 19 – 65.
© The British Society of Rheology, 2004 (http://www.bsr.org.uk) 45
Tanglertpaibul and Rao [131] proposed the apparent viscosity at a shear rate of
100 s-1
as a suitable rheological characteristic for tomato concentrates. The apparent
viscosity was found to depend on the total solids concentration of tomato concentrates
raised to a power in the range of 2.0 to 2.5. A more detailed study [148] involved
separating serum from hot-break tomato juice by centrifugation and adding varying
levels of pulp to the serum, to determine if a simple relationship existed between
apparent viscosity and pulp content. Expressing the pulp content of the tomato
concentrate as a pulp/serum wet weight ratio (PS), the following relationship resulted:
η100 = ηserum + A(PS)B ..........(16)
ηserum = C + D pE ..........(17)
Dispersion α β Reference
Tomato juice 81.4 2.4 Harper and El Sahrigi
(1965) [156]
Tomato concentrate 0.022 2.35 Rao et al. (1981) [146]
Rao and Cooley (1983)
[157]
Tomato concentrate 0.03 2.37 Fito et al. (1983) [143]
Apple concentrate 2.8 10-15
7.5 Rao et al. (1984) [130]
Apple juice 2.2 10-15
7.6 Ibarz et al. (1987) [158]
Babaco concentrate 0.519 2.44 Castaldo et al. (1990) [159]
Banana juice 4.33 10-34
19.0 Khalil et al. (1989) [160]
Grape concentrate 6.9 10-15
7.43 Rao et al. (1984) [130]
Mango pulp 3.5 10-4
1.36 Manohar et al. (1990) [161]
Pear juice 9.3 10-11 4.9 Ibarz et al. (1987) [158]
Pear purée 3.6 10-3
3.0 Harper and Lebermann
(1962) [162]
Raspberry juice 0.1 6.4 Ibarz and Pagan (1987)
[163]
Blackcurrant juice 2.21 10-9 –
8.87 10-6
6.2 – 3.47 Ibarz et al. (1992) [127]
Table 3. Values of the parameters of the power-law relationship between the
consistency index and solids concentration for different plant food dispersions.
Page 28
C. Gallegos, J. M. Franco and P. Partal, Rheology Reviews 2004, pp 19 – 65.
© The British Society of Rheology, 2004 (http://www.bsr.org.uk) 46
The coefficient A indicates the contribution to viscosity of a unit amount of pulp and
the coefficient B reflects the influence of pulp content on viscosity of concentrates
from different tomato cultivars and/or processes. “p” is the pectin content expressed as
pectic substances wt % of serum.
Dale et al. [164] concerned with the specification of viscosity for use in reverse
osmosis system design, developed an empirical equation for the apparent viscosity of
tomato concentrates based on the mass fractions of protein, solids and fibre, and
absolute temperature.
Tanglertpaibul and Rao [131] used a carefully designed plan to compare the
apparent viscosities of pastes made by the traditional method of hot break juice
evaporation (JE) to those obtained by serum evaporation (SE) or reverse osmosis
(SRO). Although apparent viscosities of SRO and SE concentrates were not
significantly different at low concentrations, at higher concentrations the viscosity of
the less temperature-affected SRO pastes was higher. The apparent viscosities of
pastes made by evaporation of hot break tomato juice were always lower than those
obtained by centrifugation followed by either evaporation or reverse osmosis of the
separated serum and remixing. Therefore, there may be improvements in textural
properties realised through separation of tomato juice serum and preferably non-
thermal concentration, followed by recombination with pulp.
Particle size dramatically influences the consistency of tomato paste. As a
general rule, a decrease in particle size yields a larger interfacial area which results in
stronger inter-particle interactions and, consequently, higher viscosity values [133].
However, several authors have reported opposite results [151]. Thus, an increase in
particle size yielded larger tomato paste viscosity values [131, 140, 165] . For instance,
Yoo and Rao [166] found that the Casson viscosities of concentrates from tomato juice
using 0.84 mm screen were higher than those made using 0.69 mm finisher screen. It is
worth pointing out that tomato paste processing may change spheroidal particles into
elongated particles, due to a rupture of the cell wall structure, which offer a greater
resistance to flow [134].
Yoo and Rao [133] have related the relative viscosity (ηr) of tomato puree
samples to the pulp weight fraction of solids (P), in place of the volume fraction due to
the fact that tomato particles are deformable (see figure 16). With this aim, the Maron-
Pierce equation was used:
ηr = [1 − (P/A)]-2, ..........(18)
where A is an empirical parameter.
As Metzner [167] has pointed out for rigid particles, the value of A decreases as
the aspect ratio (length to diameter ratio) of the suspended particles increases.
Consequently, a stronger particle anisometry will result in a higher apparent viscosity.
Tomato particles have a rather irregular shape, caused by factors such as tearing of the
tissues during manufacture [133, 168]. As Yoo and Rao [133] have demonstrated, the
value of A decreases as the average particle size increases, due to a larger aspect ratio.
Page 29
C. Gallegos, J. M. Franco and P. Partal, Rheology Reviews 2004, pp 19 – 65.
© The British Society of Rheology, 2004 (http://www.bsr.org.uk) 47
3.2 Linear viscoelasticity of tomato products: influence of processing.
Much less work has been done on the characterization of the linear viscoelastic
properties of these tomato products [142, 145, 169], which are of a great importance in
relation to the characterisation of the microstructure of the tomato concentrate
products and, also, for the prediction of the viscous flow of these products through the
development of suitable non-linear viscoelasticity models. Thus, Rao and Cooley
[142] carried out oscillatory tests, in the linear viscoelastic range, on tomato paste
samples. They found that the Cox-Merz rule was not applicable, but sustained that the
steady and dynamic shear data conformed with the use of a shift factor on frequency.
The linear viscoelastic behaviour shown by tomato paste was similar to that
found for other concentrated suspension [170]. All of them showed a similar evolution
of the storage and loss moduli with frequency as may be observed in figures 17 and
18. Based on the above-mentioned linear viscoelastic properties, it was suggested that
they may be classified as weak gels [142]. Thus, the storage modulus values, G′ , were
always superior to the loss modulus values, G′′ , in the whole range of frequency
studied. Nevertheless, they showed a clear tendency to a crossover at low frequencies
(beginning of the terminal region of the relaxation spectrum) and also at high
frequencies.
Figure 16. Relative viscosity-pulp weight fraction data of two
particles sizes (TP4 = 0.71 mm and TP6 = 0.34 mm. Curves are
predictions by the modified Maron-Pierce equation). Reproduced from
reference [133].
Page 30
C. Gallegos, J. M. Franco and P. Partal, Rheology Reviews 2004, pp 19 – 65.
© The British Society of Rheology, 2004 (http://www.bsr.org.uk) 48
Nevertheless, most of the work carried out, up to now, has been focused on the
relationship between rheology and processing of tomato paste. Nevertheless, the
results obtained allowed to establish the influence that solids content and particle size
exert on the linear viscoelasticity properties of tomato paste. Thus, Sánchez et al. [171]
have studied the influence that some processing variables (sieve pore size and
breaking temperature) and tomato variety exert on the linear viscoelastic properties of
tomato paste. The study was carried out on tomato paste samples coming from
different tomato varieties (with different content in pectolytic enzymes
polygalacturonase and pectin methylesterase), manufactured at different temperatures
of breaking (65-85º C) and screen sizes (0.8-2.2 mm). Tomato varieties H-282 crtl and
1401-C were commercially available. Tomato variety H-282 F was a modification of
variety H-282 crtl, having a lower content in pectolytic enzyme polygalacturonase
(PG). On the other hand, variety 1401-J was a modification of variety 1401-C, based
on a significant reduction in the pectolytic enzyme pectin methylesterase (PME).
102
103
104
105
H-282 crtl
65ºC
G ́0.8 mm
G" 0.8 mm
G ́1.5 mm
G" 1.5 mm
G' 2.2 mm
G" 2.2 mm
G´,
G"/
(P
a)
H-282 crtl
85ºC
G' 0.8 mm
G" 0.8 mm
G' 1.5 mm
G" 1.5 mm
G' 2.2 mm
G" 2.2 mm
10-3
10-2
10-1
100
101
102
102
103
104
105
H-282 F
65ºC
G' 0.8 mm
G" 0.8 mm
G' 1.5 mm
G" 1.5 mm
G' 2.2 mm
G" 2.2 mm
G´,
G"/
(P
a)
ω / (rad/s)10
-310
-210
-110
010
110
210
3
H-282 F
85ºC
G' 0.8 mm
G" 0.8 mm
G' 1.5 mm
G" 1.5 mm
G' 2.2 mm
G" 2.2 mm
ω/ (rad/s)
Figure 17. Influence of finisher screen opening on evolution of storage
and loss moduli with frequency for different tomato paste samples
(reproduced from [171]).
Page 31
C. Gallegos, J. M. Franco and P. Partal, Rheology Reviews 2004, pp 19 – 65.
© The British Society of Rheology, 2004 (http://www.bsr.org.uk) 49
As other authors reported [148] with viscous flow measurements, contradictory
results concerning the influence of the finisher screen opening were found. Thus, they
reported maximum values of the apparent viscosity for tomato juices and concentrates
at an intermediate finisher screen opening. An increase in sieve pore size, for example,
from 0.8 up to 1.5 mm always yielded a tomato paste sample with higher WIS content.
The above-mentioned increase in screen opening also produced larger mean particle
size, d43, for samples processed at a breaking temperature of 65º C, but the values were
quite similar when the samples were processed at a breaking temperature of 85º C.
Nevertheless, the values of the linear viscoelasticity functions always showed a
significantly increase in the whole frequency range studied, at both breaking
temperatures (see figure 17). These results were explained, taking into account that the
consistency of tomato paste is dramatically influenced by the WIS content, which
always increased as screen opening did. Thus, different authors [133, 146, 148, 149,
172] have reported that viscosity shows a power law dependence of pulp or total solids
content of the concentrated tomato products, although some of them sustained that the
contribution of the disperse solids was much more important [140].
A further increase in screen size, from 1.5 to 2.2 mm generally yielded slightly
lower WIS content in the tomato paste samples. On the contrary, the values of the
volume diameter were larger. Consequently, two opposite variables influenced the
rheological results obtained. For example, the sample manufactured from variety H-
282 crtl, processed at 65º C and using 1.5 mm screen size showed higher values of the
linear viscoelasticity functions (see figure 17) than the sample processed at the same
temperature but using 2.2 mm screen size. In this case, the values of the volume
diameter were quite similar for both samples. Consequently, the influence of the WIS
content appears decisive. However, the samples manufactured from variety H-282 F,
10-3
10-2
10-1
100
101
102
103
102
103
104
105
Variety H-282 crtl
w (rad/s)
Screen size=2.2 mm
G´ 65ºC
G" 65ºC
G´ 85ºC
G" 85ºC
10-3
10-2
10-1
100
101
102
103
w (rad/s)
Variety H-282F
Screen size 2.2 mm
G' 65ºC
G" 65ºC
G' 85ºC
G" 85ºC
Figure 18. Influence of breaking temperature on evolution of storage
and loss moduli with frequency for different tomato paste samples.
Page 32
C. Gallegos, J. M. Franco and P. Partal, Rheology Reviews 2004, pp 19 – 65.
© The British Society of Rheology, 2004 (http://www.bsr.org.uk) 50
in the same conditions, showed different results. Thus, the values of the linear
viscoelasticity functions (figure 17) slightly increased with the finisher screen opening.
This was a consequence of a quite similar WIS content of both samples and an
apparent increase in volume diameter for the sample processed with the larger screen
size. Finally, the values of the linear viscoelasticity functions for the samples obtained
from variety H-282 crtl (see figure 17), processed at 85º C and using the above
mentioned screen sizes (1.5 and 2.2 mm) were very similar. At this breaking
temperature the volume diameter for the sample manufactured using 2.2 mm screen
size is larger than the one obtained with 1.5 mm screen opening. Consequently, the
influence of the WIS content, which decreases as screen size increases, is dampened by
this increase in particle size. This increase in particle size is even predominant when
the decrease in WIS content is less significant, as has been found in variety H-282 F
samples, yielding a slight increase in the linear viscoelasticity functions with screen
opening.
The influence of breaking temperature on the linear viscoelastic properties of
tomato paste depends on tomato variety. An increase in breaking temperature
generally results in tomato paste samples with a higher WIS content, due to both
inactivation of the pectic enzymes and more efficient extraction of pectic substances
[173]. The above-mentioned increase in temperature generally produces tomato paste
samples with smaller particle size.
For samples manufactured from tomato variety H-282 crtl and using the same
finisher screen opening, an increase in breaking temperature always produced higher
values of the linear viscoelasticity functions (figure 18). On the contrary, the influence
of breaking temperature on the linear viscoelastic characteristics of tomato paste
samples manufactured from tomato variety H-282 F was quite different. Thus, the
opposite influences of a higher WIS content and smaller particle size always yielded
very similar values of the linear viscoelasticity functions for samples processed using
the same screen size, as can be observed in figure 19, where the values of the plateau
modulus are plotted as a power-law function of particle size (µm) and water insoluble
solids content (% wt).
This power-law relationship did not work with tomato pastes from variety H-
282 crtl. Nevertheless, the plateau modulus values were progressively closer to those
obtained with tomato paste sample H-282 F, as breaking temperature was raised. It is
worth pointing out that tomato paste H-282 F had a reduced content in PG. This
reduction is reflected by a much reduced depolymerisation of the pectic substances
[174]. This explains the much larger WIS content of these samples, at the same
processing conditions. At a breaking temperature of 85º C, the influence of the
pectolytic enzymes is quite similar for both tomato varieties, due to a progressive
inactivation of both types of enzymes (PG and PME), which yielded a lower
difference in the values of the linear viscoelasticity functions.
Page 33
C. Gallegos, J. M. Franco and P. Partal, Rheology Reviews 2004, pp 19 – 65.
© The British Society of Rheology, 2004 (http://www.bsr.org.uk) 51
However, at 65º C, both enzymes are acting during the processing of the tomato
paste samples manufactured from tomato variety H-282 crtl. In this case, the main
effect of the pectin methyl-esterases is to decrease the esterification degree of the
pectin, which is transformed to pectic acid, highly insoluble in water. Nevertheless,
this decrease in the esterification degree of the pectins favours a further action of the
polygalacturonase, which transforms them in low-molecular weight soluble
compounds. In addition to this, it is worth pointing out the lower values of the linear
viscoelasticity functions of the samples manufactured at 65º C, taking into account
their WIS content and particle size values. These results were explained on the basis of
an extensive degradation of the wall cell structure, for tomato paste samples H-282
crtl, as a consequence of the polygalacturonase activity [174], and the consequent
reduction in their viscoelastic characteristics, due to the enhanced pectin
depolymerisation. Furthermore, the influence of the pectin methyl-esterase (decreasing
the esterification degree of the pectins) on the charge of the cell walls should be also
taken into account. Thus, for samples having a reduced content in PG, an increase in
the negative charge of the wall cells, due to the above-mentioned action, may enhance
cell to cell adhesion via calcium bridging, which would increase the viscoelastic
characteristics of the tomato paste samples.
The same authors [171] studied the evolution of the linear viscoelasticity
functions with frequency for tomato paste samples coming from tomato varieties
1401-C and 1401-J (reduced content in PME). The evolution with frequency of G′ and
G′′ was clearly dependent on tomato variety. Thus, the slopes of the storage and loss
20000 30000 40000 50000 60000
10000
15000
20000
25000
30000
35000
Variety H-282F
Variety H-282crtl (65ºC)
Variety H-282crtl (85ºC)G
N
o/ (P
a)
WIS1.5
*d4, 3
1.1
Figure 19. Plateau modulus values as a function of volume diameter
and water-insoluble solids content (WIS) for different tomato paste
samples (reproduced from reference [171]).
Page 34
C. Gallegos, J. M. Franco and P. Partal, Rheology Reviews 2004, pp 19 – 65.
© The British Society of Rheology, 2004 (http://www.bsr.org.uk) 52
moduli curves were higher for tomato paste samples manufactured using tomato
variety 1401-J, which had a reduced PME content. This lower content in PME also
yielded tomato serum viscosities much higher than those found in tomato serum from
variety 1401-C, and, also, a Maxwell-like linear viscoelastic behaviour. These results
were consistent with a significant increase in the concentration of water-soluble
pectins, due to the reduced content in PME, that results in a much higher esterification
degree of the tomato paste pectins and, consequently, in a lower pectic acid and WIS
content. This reduced WIS content explains the lower values of the linear
viscoelasticity functions found in tomato paste samples manufactured from tomato
variety 1401-J.
Tomatoes usually contain from 7 to 8.5% total solids, of which about 1% are
skins and seeds. The tomato skin consists of four or five layers of cells under a thin
cuticle. In all the vegetable cell walls, polysaccharides are the predominant
constituents. The general composition is considered to be approximately 30%
cellulose, 30% hemicellulose, 35% pectin and 5% proteins; in the later ripening stages,
lignine can also be found in great quantities [175]. As was previously mentioned,
during processing of tomato paste, tomato pulp is passed through juice extractors, step
that eliminates as residues (tomato slurry) 2-5% of the original tomato solids. Sánchez
et al. [176] have studied the influence that the addition of “treated tomato slurry” into
tomato juice exerts on the viscous flow and linear viscoelastic behaviour of the final
tomato paste. “Tomato slurry” designates a mixture of tomato pulp, skin, seeds and
10-3
10-2
10-1
100
101
102
103
102
103
104
105
G' Cold G" Cold
G' Hot 1.2 mm G" Hot 1.2 mm
G' Hot 2 mm G" Hot 2 mm
G´ Super Hot G" Super Hot
G´ Hot + Peel Slurry G" Hot + Peel Slurry
G',
G"
(Pa)
ω (rad/s)
Figure 20. Evolution of the storage and loss moduli with frequency for
different tomato paste samples, at 25º C (reproduced from reference
[176]).
Page 35
C. Gallegos, J. M. Franco and P. Partal, Rheology Reviews 2004, pp 19 – 65.
© The British Society of Rheology, 2004 (http://www.bsr.org.uk) 53
fibres originating from tomato cell walls and which are of a sufficient big size to be
rejected from standard tomato juice extractors [177]. Tomato paste samples with
addition of “treated tomato slurry” were manufactured using a breaking temperature of
80º C and a sieve screen size of 1.2 mm.
As may be observed in figure 20, the addition of tomato slurry produced a
significant increase in the linear viscoelasticity functions, as compared to the values
obtained with a tomato paste sample manufactured at the same breaking temperature
(80º C), but quite similar to those shown by a tomato paste sample manufactured at a
breaking temperature of 90º C (Super-hot sample). These results were explained taking
into account the influences that tomato paste WIS content and particle size exert on the
rheological parameters of the above-mentioned samples. Thus, the tomato paste
sample manufactured with tomato slurry had a higher WIS content than the other two
samples manufactured at the same breaking temperature (Hot 2.0 mm and Hot 1.2
mm), although lower particle size. On the contrary, the addition of “treated tomato
slurry” yielded tomato paste samples with similar WIS content to that obtained by
submitting a regular tomato juice (without tomato slurry addition) to a super-hot
process (breaking temperature of 90º C).
The addition of tomato slurry brings also about an increase in the lycopene
content of tomato paste, as a consequence of the larger lycopene content of the tomato
slurry. This fact yields an improvement of colour, as well as an increase in its potential
antioxidant and nutritional properties.
The results previously shown suggest that the addition of “treated tomato
slurry” may be of great interest for tomato paste production and very important from a
technical and economical point of view. Thus, it would be possible to reach the
standard specifications, i.e. viscosity, with lower breaking temperatures. This
reduction would not damage the product as during a super-hot tomato paste process,
obtaining a tomato paste with even better colour and nutritional value [177]. It is worth
pointing out that tomato paste with a higher consistency can lead to a significant cost
saving in the production of tomato-based finished products, both by reducing the
quantity of thickeners and/or the amount of tomato paste to be used in the recipe,
factors that have a dramatic influence on the final consistency of the product. These
advantages may be achieved without changing crucial processing parameters, i.e.
finisher screen opening, hot-break holding time and temperature.
Valencia et al. [178] have studied the influence that some tomato paste
processing variables (finisher screen opening and breaking temperature) and tomato
variety exert on the linear viscoelastic properties of tomato ketchup. They concluded
that an increase in screen size during tomato paste manufacture does not produce a
systematic influence on the rheological response of tomato ketchup, as could be
expected. On the contrary, the influence of tomato paste breaking temperature on the
linear viscoelasticity properties of tomato ketchup was very uniform. Thus, an increase
in the storage and loss moduli of tomato ketchup samples with tomato paste breaking
temperature was observed for samples processed using the same screen opening (see
figure 21). This increase in the linear viscoelasticity functions was related to the higher
WIS content of the tomato paste processed at 85º C and, in some cases, to a larger
particle size of the tomato ketchup samples. In addition to this, the lower values of the
linear viscoelasticity functions of the samples manufactured with tomato paste
Page 36
C. Gallegos, J. M. Franco and P. Partal, Rheology Reviews 2004, pp 19 – 65.
© The British Society of Rheology, 2004 (http://www.bsr.org.uk) 54
processed at 65º C were also related to a degradation of the cell wall structure of the
tomato, due to pectin depolymerisation caused by polygalacturonase activity [174].
10-3
10-2
10-1
100
101
102
103
101
102
103
104
Screen size: 2.2 mm
G' (3) made from H-282 65ºC
G" (3) made from H-282 65ºC
G' (6) made from H-282 85ºC
G" (6) made from H-282 85ºC
G',
G"
(Pa)
ω (rad/s)
101
102
103
104
Screen size: 0.8 mm
G' (1) made from H-282 65ºC
G" (1) made from H-282 65ºC
G' (4) made from H-282 85ºC
G" (4) made from H-282 85ºC
G',
G"
(Pa)
101
102
103
104
Screen size: 1.5 mm
G' (2) made from H-282 65ºC
G" (2) made from H-282 65ºC
G' (5) made from H-282 85ºC
G" (5) made from H-282 85ºC
G',
G"
(Pa)
Figure 21. Influence of tomato paste breaking temperature on the linear
viscoelasticity functions of tomato ketchup, at 25º C (reproduced from
reference [178]).
Page 37
C. Gallegos, J. M. Franco and P. Partal, Rheology Reviews 2004, pp 19 – 65.
© The British Society of Rheology, 2004 (http://www.bsr.org.uk) 55
Valencia et al. [179] have also studied the influence of the same variables on
the linear viscoelastic properties of tomato sauce products. It was observed that the
influence of the screen size, used during the manufacture of tomato paste, on the
rheological properties of the resulting tomato sauce samples was even more complex
than that found with tomato paste, due to the presence of a thickener (starch) in the
formulation. Thus, the particle size distribution curves for all the tomato sauce
products studied showed a bimodal distribution. On the other hand, an increase in the
linear viscoelasticity functions and plateau modulus with tomato paste breaking
temperature was again observed for samples processed using the same screen opening.
3.3 Non-linear viscoelasticity modelling of tomato products.
Valencia et al. [180] carried out also the characterization and modelling of the
non-linear rheological properties of tomato paste, manufactured under different
processing conditions (sieve pore size and breaking temperature). With this aim, flow
measurements, dynamic linear viscoelastic and linear and non-linear stress relaxation
tests were performed. Different geometries with smooth and serrated surfaces were
used to optimise the viscous flow measurements and avoid wall-depletion phenomena.
Figure 22A shows the evolution of the storage (G′ ) and the loss (G′′ ) moduli
with frequency, within the linear viscoelasticity range, for a selected tomato paste
sample (processed at 65º C and using 1.5 mm screen size). Figure 22B shows the
evolution of H(λ) obtained by the application of regularization methods [40, 42,43]. In
this case, the linear relaxation spectrum only has two regions: the plateau region, with
an almost nil slope, and the beginning of the transition region in the low relaxation
time range [181]. Figure 22A shows the recalculation of the dynamic linear
viscoelasticity functions, which indicates that the continuous relaxation spectrum
calculated by means of regularization techniques gives a good description of the linear
relaxation behaviour of these systems.
In order to obtain the damping function, h(γ), stress relaxation tests were
performed in the non-linear viscoelasticity range. Figure 22C shows the evolution of
the relaxation modulus with the elapsed time after shear, for a range of shear strains
inside and outside the linear viscoelasticity region. As may be seen in this figure, the
non-linear relaxation modulus, G(γ, t − t′ ) and the linear relaxation modulus, G(t − t′ ) undergo a continuous decrease within the time scale studied. The shape of G(γ, t − t′ ) is independent of the strain previously applied on the sample. Time-strain separability
for the non-linear viscoelasticity function was then assumed. As may be deduced, a
quite large structural destruction takes place due to shear in these systems.
The values of h(γ) versus strain together with the corresponding fits for a
tomato paste sample are shown in figure 22D. Three types of damping functions were
tested in order to obtain the best predictions of the Wagner model: the Wagner
damping function [48] containing only one empirical parameter, k, which quantifies
the level of non-linearity in the material:
( ) γ)k(exp γh −= ,
..........(19)
Page 38
C. Gallegos, J. M. Franco and P. Partal, Rheology Reviews 2004, pp 19 – 65.
© The British Society of Rheology, 2004 (http://www.bsr.org.uk) 56
10 -2 10 -1 100 101
103
104
10
G'G"From relaxation spectrum
ω (rad/s)
G',
G"
(Pa)
A) Frequency sweep
10-2 10-1 100 101
103
10
λ (s)
H(P
a)
B) Relaxation spectrum
10-1 100 101 102
101
102
103
104
10
1 %
5 %10 %
50 %
100 %
150 %
t(s)
G (
Pa)
C) Relaxation modulus
0 0.5 1 1.5
0
0.1
0.2
0.3
0.4
0.5
ExperimentalWagnerSoskey-WinterPapanastasiou
γ
h( γ
)
D) Damping function
10-7 10 -6 10 -5 10 -4 10 -3 10 -2 10 -1 100
102
103
104
105
106
107
10
Experimental dataSoskey-Winter functionWagner function
Shear rate (1/s)
η (
Pa·s
)
E) Steady-state flow viscosity
Figure 22. (A) Evolution of the storage and loss moduli with frequency
and recalculation from the linear relaxation spectrum. (B) Linear
relaxation spectrum. (C) Evolution of the linear and non-linear
relaxation moduli with the elapsed time after shear; (D) Values of
different damping functions. (E) Experimental and predicted values of
the steady-state viscosity, at 25º C, for a selected tomato paste sample
(H-282 F, breaking temperature: 65º C; screen opening: 1.5 mm).
Reproduced from [180].
Page 39
C. Gallegos, J. M. Franco and P. Partal, Rheology Reviews 2004, pp 19 – 65.
© The British Society of Rheology, 2004 (http://www.bsr.org.uk) 57
the Soskey-Winter equation [52], with two empirical parameters:
( ) γa1
1 γh
b,
+=
..........(20)
and the Papanastasiou damping function [182], with just one empirical parameter:
( ) . 2γα
α γh
+=
..........(21)
As can be seen in figure 22D, Soskey-Winter´s model provides a better fit than
the Wagner and the Papanastasiou model.
Figures 22E shows the experimental viscous flow curve for a tomato paste
sample. This behavior was predicted by using a non-linear viscoelasticity constitutive
equation, the Wagner model. Introducing the Soskey-Winter damping function, the
steady-state viscosity is then given by the following equation, which must be solved
numerically:
( ) ( )( )[ ]
( )∫ ∫∞
∞−
∞
∞− −+
−
−−
−=
dt'λlndt'tγa1
t'tγ
λ
t')(texp λH)γη(
b&
&& ..........(22)
As can be observed in figure 22E, the use of the Soskey-Winter damping
function provides the best predictions of the viscous flow curves. In general, the
viscous flow curves for all the tomato paste samples studied by these authors were
predicted with an acceptable accuracy, using a combination of the continuous linear
relaxation spectrum and the Soskey-Winter damping function.
The Soskey-Winter parameter “a” and the Wagner damping factor “k” slightly
increase as sieve pore size does. This evolution was related to a larger strain-softening
as tomato paste mean particle size increases. On the contrary, an increase in breaking
temperature produced a large decrease in both damping parameters. This indicates that
the microstructure of tomato paste samples processed at a breaking temperature of 85º
C is less strain-dependent.
4. CONCLUDING REMARKS
The rheology of concentrated food dispersions has been reviewed. As has been reflected, many structural factors influence the rheology of these complex foodstuffs.
In addition to this, a change in processing variables influences the above-mentioned
structural factors, leading to very different behaviours for the same formulation.
Although the linear viscoelasticity data obtained with these products are quite feasible,
special care has to be given to the measurement of the non-linear behaviour due to the
appearance of flow instabilities in a significant shear rate (or stress) range. Finally, it is worth pointing out that much more work is needed to understand the relationship
among rheology-microstructure-processing of food dispersions.
Page 40
C. Gallegos, J. M. Franco and P. Partal, Rheology Reviews 2004, pp 19 – 65.
© The British Society of Rheology, 2004 (http://www.bsr.org.uk) 58
REFERENCES
1. Barnes H A in “Industrial Food Processing: Experiments and Numerical
Simulation”, University of Plymouth, Institute of Non-Newtonian Fluid
Mechanics and British Society of Rheology, (2001).
2. Rao M A, Rev. Esp. Cienc. Tecnol. Aliment., 32 (1992) 3-17.
3. Bertola V, Bertrand F, Tabuteau H, Bonn D and Coussot P, J. Rheol., 47 (2003)
1211-1226.
4. Sherman P (ed.) “Emulsion Science”, Academic Press, London, (1968).
5. Becher P (ed.), “Encyclopedia of emulsion technology, II”, Marcel Dekker,
New York, (1985).
6. Dalgleish D G, in “Emulsions and Emulsion Stability”, (Editor: J Sjöblom),
Marcel Dekker, New York, (1996) 287.
7. Dickinson E “An Introduction to Food Colloids”. Oxford University Press,
Oxford, (1992).
8. De Cindio B and Cacace D, Int. J. Food Sci. Technol., 30 (1995) 505-514.
9. Rahalkar R R, in “Viscoelastic Properties of Food” (Editors: M A Rao and J F
Steffe), Elsevier, London, (1992) 317.
10. Franco J M, Guerrero A and Gallegos C, Rheol. Acta, 34 (1995) 513-524.
11. Mason T G, Bibette J and Weitz D A, J. Colloid Interface Sci., 179 (1996)
2051-2054.
12. Yaron I and Gal-Or B, Rheol. Acta, 11 (1972) 241-252.
13. Choi S J and Schowalter W R, Phys. Fluids, (1975) 420-427.
14. Pal R, J. Colloid Interface Sci., 231 (2000) 168-175.
15. Phan-Thien N and Pham D C, J. Non-Newtonian Fluid Mech., 72 (1997) 305-
318.
16. Danov K D, J. Colloid Interface Sci., 235 (2001) 144-149.
17. Lowenberg M and Hinch E J, J Fluid Mech., 321 (1996) 321-395.
18. Pal R, J. Rheol., 36 (1992) 1245-1259.
19. Barnes H A, Colloids and Surfaces A, (1994) 89-95.
20. Choplin L and Marchal P in “Proceedings of the 1st Symposisum International
on food rheology and structure” (Editor: E J Windhab), Zurich, (1997) 40.
21. Pal R, AIChE J., 39 (1993) 1754-1764.
22. Franco J M, Raymundo A, Sousa I and Gallegos C, J. Agric. Food Chem., 46
(1998) 3109-3115.
23. Quintana J M, Califano A N, Zaritzky N E, Partal P, and Franco J M, J Texture Stud., 33 (2002) 215-236.
Page 41
C. Gallegos, J. M. Franco and P. Partal, Rheology Reviews 2004, pp 19 – 65.
© The British Society of Rheology, 2004 (http://www.bsr.org.uk) 59
24. Partal P, Guerrero A, Berjano M, Muñoz J and Gallegos C, J Texture Stud., 25
(1994) 331-348.
25. Matsumoto S and Sherman P, J. Texture Stud., 12 (1981) 243-257.
26. Rivas H J and Sherman P, J. Texture Stud., 14 (1983) 251-265.
27. Rivas H J and Sherman P, J. Texture Stud., 14 (1983) 267-275.
28. Gladwell N, Rahalkar R R and Richmond P, J. Food Sci., 50 (1985) 1477-1481.
29. Franco J M, Berjano M and Gallegos C, J. Agric. Food Chem., 45 (1997) 713-
719.
30. Guerrero A, Partal P and Gallegos C, J. Rheol., 42 (1998) 1375-1388.
31. Quintana J M, Califano A N, Zaritzky N E and Partal P, Food Sci. Technol.
Int., (2002) 213-221.
32. Olroyd J G, Proc. R. Soc. London Ser. A, 218 (1953) 122-132.
33. Palierne J F, Rheol. Acta, 29 (1990) 204-214.
34. Pal R, AIChE J., 41 (1995) 783-794.
35. Capron I, Costeux S and Djabourov M, Rheol. Acta, 40 (2001) 441-456.
36. Pal R, Colloid Polym. Sci., 280 (2002) 616-623.
37. Pal R, J. Non-Newtonian Fluid Mech., 105 (2002) 21-33.
38. Groetsch C W, “The Theory of Tikhonov Regularization for Fredholm Equations of the First Kind”, Pitman, London, (1984).
39. Tschoegl N W, “The Phenomenological Theory of Linear Viscoelastic
Behavior”, Springer Verlag, Berlin, (1989).
40. Press W H, Teukosky S A, Vetterlingm W T and Flannery B P, “Numerical
Recipes in C”, Cambridge University Press, Cambridge, (1992).
41. Weese J, Comput. Phys. Commun., 77 (1993) 429-440.
42. Honerkamp J and Weese J, Rheol. Acta, 32 (1993) 65-73.
43. Madiedo J M, Ph. D. Thesis, University of Seville, Seville, (1996).
44. Bower C, Gallegos C, Mackley M R and Madiedo J M, Rheol. Acta, 38 (1999)
145-159.
45. Partal P, Guerrero A, Berjano M and Gallegos C, J. Food Eng., 41 (1999) 33-
41.
46. de Rosa M E and Winter H H, Rheol. Acta, 33 (1994) 220-237.
47. Madiedo J M and Gallegos C, Applied Rheol., 7 (1997), 161-167.
48. Wagner M H, Rheol. Acta, 5 (1976) 136-142.
49. Campanella O H and Peleg M, J. Rheol., 31 (1987) 439-452.
Page 42
C. Gallegos, J. M. Franco and P. Partal, Rheology Reviews 2004, pp 19 – 65.
© The British Society of Rheology, 2004 (http://www.bsr.org.uk) 60
50. Gallegos C, Berjano M, Guerrero A, Muñoz J and Flores V, J. Texture Stud.,
23 (1992) 153-168.
51. Gallegos C, Franco J M, Madiedo J M, Raymundo A, Sousa I in “Engineering
and Food for the 21st Century”, (Editors: J Welti-Chanes, G V Barbosa-
Cánovas and J M Aguilera), CRC Press, Boca Ratón, (2002) 415.
52. Soskey P R and Winter H H, J. Rheol., 28 (1984) 625-645.
53. Barnes H A, J. Non-Newtonian Fluid Mech., 56 (1995) 221-251.
54. Plucinski J, Gupta R K and Charkrabarti S, Rheol. Acta, 37 (1998) 256-269.
55. Franco J M, Gallegos C and Barnes H A, J. Food Eng., 36 (1998) 89-102.
56. Pal R, Colloids Surfaces A, 162 (2000) 55-66.
57. Sanchez M C, Valencia C, Franco J M and Gallegos C, J. Colloid Interface
Sci., 241 (2001) 226-232.
58. Ma L and Barbosa-Canovas G V, J. Food Eng., 25 (1995) 397-408.
59. Goshawk J A, Binding D M, Kell D B and Goodacre R, J. Rheol., 42 (1998)
1537-1553.
60. Dickinson E and Stainsby G “Colloids in Food”, Applied Science Publishers,
London, (1982).
61. Cao Y, Dickinson E and Wedlock D J, Food Hydrocolloids, 5 (1991) 443-454.
62. Paraskevopoulou K and Kiosseoglou V, J. Food Sci., 59 (1994) 766-768.
63. Paraskevopoulou K, Kiosseoglou V, Alevisopoulos S and Kasapis S, J. Texture
Stud., 28 (1997) 221-237.
64. Paraskevopoulou K, Kiosseoglou V and Pegiadou, S, J. Agric. Food Chem., 45
(1997) 3717-3722.
65. Paraskevopoulou K, Kiosseoglou V, Alevisopoulos S and Kasapis S, Colloids
Surfaces B, 12 (1999) 107-111.
66. Paraskevopoulou A, Panayiotou K and Kiosseoglou V, Food Hydrocolloids, 11
(1997) 385-391.
67. Moros J E, Franco J M and Gallegos C, J. Am. Oil Chem. Soc., 79 (2002) 837-
843.
68. Raymundo A, Franco J M, Gallegos C, Empis J and Sousa I, Nahrung, 42
(1998) 220-224.
69. Raymundo A, Franco J M, Empis J and Sousa I, J. Am. Oil Chem. Soc., 79
(2002) 783-790.
70. Franco J M, Partal P, Ruiz-Marquez D, Conde B and Gallegos C, J. Am. Oil
Chem. Soc., 77 (2000) 975-983.
71. Dickinson E, Ritzoulis C and Povey MJW, J. Colloid Interface Sci., 212 (1999)
466-73.
Page 43
C. Gallegos, J. M. Franco and P. Partal, Rheology Reviews 2004, pp 19 – 65.
© The British Society of Rheology, 2004 (http://www.bsr.org.uk) 61
72. Franco J M, Berjano M, Guerrero A, Muñoz J and Gallegos C, Food
Hydrocolloids, 9 (1995) 111-121.
73. Coke M, Wilde P J, Russell E J and Clark D C, J. Colloid Interface Sci., 138
(1990) 489-504.
74. Clark D C, Wilde P J, Wilson D R and Wustneck R, Food Hydrocolloids, 6
(1992) 173-186.
75. Dickinson E and Yamamoto Y, J. Food Sci., 61 (1996) 811-816.
76. Dickinson E and Hong S T, J. Agric. Food Chem., 43 (1995) 2560-2566.
77. Raymundo A, Franco J M, Partal P, Sousa I and Gallegos C, J. Surf. Deterg., 2
(1999) 545-551.
78. Fillery-Travis A, Mills ENC and Wilde P, Grasas y Aceites, 51 (2000) 50-55.
79. Holstborg J, Pedersen B V, Krog N and Olesen S K, Colloids Surfaces B, 12
(1999) 383-390.
80. Demetriades K and McClements D J, Colloids Surfaces A, 161 (2000) 391-400.
81. Castle J, Dickinson E, Murray A, Stainsby G, in “Gums and Stabilisers for the
Food Industry, IV”, (Editors: G O Phillips, D J Wedlock and P A Williams),
IRL Press, Oxford, (1988).
82. Dagorn-Scaviner C, Gueguen J and Lefebvre J, J. Food Sci., 52 (1987) 335-
341.
83. Dickinson E, Flint F O and Hunt J A, Food Hydrocolloids, 3 (1989) 389-397.
84. Polyakov V I, Grinberg V Ya and Tolstoguzov V B, Polym. Bull., 2 (1980)
757-760.
85. Dickinson E, Rolfe S E and Dalgleish D G, Int. J. Biol. Macromol., 12 (1990)
189-194.
86. Mine Y and Keeratiurai M, Colloids and Surfaces B, 18 (2000) 1-11.
87. Riscardo M A, Franco J M and Gallegos C, Food Sci. Technol. Int., 9 (2003)
53-63.
88. Kulmyrzaev A, Sivestre M P C and McClements D J, Food Res. Int., 33 (2000)
21-25.
89. Dickinson E and Ritzoulis C, J. Colloid Interface Sci., 224 (2000) 148-154.
90. Dickinson E, Radford S J and Golding M, Food Hydrocolloids, 17 (2003) 211-
220.
91. Ibanoglu E, J. Food Eng., 52 (2002) 273-277.
92. Singh H, Tamehana M, Hemar, Y and Munro P A, Food Hydrocolloids, 17
(2003) 539-548.
93. Reiffers-Magnani, C K, Cuq J L and Watzke H J, Food Hydrocolloids, 14
(2000) 521-530.
Page 44
C. Gallegos, J. M. Franco and P. Partal, Rheology Reviews 2004, pp 19 – 65.
© The British Society of Rheology, 2004 (http://www.bsr.org.uk) 62
94. Dickinson E and Merino L M, Food Hydrocolloids, 16 (2002) 321-331.
95. Gallegos C, Sanchez M C, Guerrero A, Franco J M, in “Rheology and Fluid
Mechanics of Nonlinear Materials ASME, 217” (Editor: D A Siginer and S G
Advani), New York, (1996) 177.
96. Bringe N A and Cheng J, Food Technol., 49 (1995) 94-106.
97. Guerrero A and Ball H R, J. Texture Stud., 25 (1994) 363-381.
98. Moros J E, Franco J M and Gallegos C, Int. J. Food Sci. Technol., 37 (2002)
297-307.
99. Dickinson E and Yamamoto Y, Food Hydrocolloids, 10 (1996) 301-307.
100. Dickinson E, Hong S T and Yamamoto Y, Neth. Milk Dairy J., 50 (1996) 199-
207.
101. Dickinson E and Casanova H, Food Hydrocolloids, 13 (1999) 285-289.
102. Chen J and Dickinson E, J. Texture Stud., 29 (1998) 285-304.
103. Chen J and Dickinson E, Colloids and Surfaces B, 12 (1999) 373-381.
104. Anton M, Le Denmat M, Beaumal V and Pliet P, Colloids and Surfaces B, 21
(2001) 137-147.
105. Kim K H, Renkema J M S and van Vliet T, Food Hydrocolloids, 15 (2001)
295-302.
106. Smith J C, J. Res. Nat. Bur. Stand., 79A (1975) 419-423.
107. Moros J E, Cordobes F, Franco J M and Gallegos C, Food Hydrocolloids, 17
(2003) 199-206.
108. Chen J and Dickinson E, Int. Dairy J., 10 (2000) 541-549.
109. Dickinson E and Eliot C, Colloids and Surfaces B, 29 (2003) 89-97.
110. Galazka V B, Dickinson E and Ledward D A, Food Hydrocolloids, 13 (1999)
425-435.
111. Dickinson E and James J D, Food Hydrocolloids, 14 (2000) 365-376.
112. Dickinson E and James J D, J. Agric. Food Chem., 46 (1998) 2565-2571.
113. Galazka V B, Dickinson E and Ledward D A, J. Sci. Food Agric., 80 (2000)
1219-1229.
114. Chapleau N and de Lamballerie-Anton, M, Food Hydrocolloids, 17 (2003) 273-
280.
115. Edgar Chavez-Montes B, Choplin L and Schaer E, Polym. Int., 52 (2003) 572-
575.
116. Ait-Kadi A, Marchal P, Choplin L, Chrissemant A S and Bousmina M, Can. J.
Chem. Eng., 80 (2002) 1166-1174.
Page 45
C. Gallegos, J. M. Franco and P. Partal, Rheology Reviews 2004, pp 19 – 65.
© The British Society of Rheology, 2004 (http://www.bsr.org.uk) 63
117. Steffe J F, Mohamed I O and Ford E W, in “Chemical and Physical Properties
of Foods”, (Editor: M R Okos), American Society of Agricultural Engineers,
St. Joseph, (1986) 1-13.
118. Holdssworth S D, Trans IchemE, 71 (1993) 139-179.
119. Qiu C G and Rao M A, J. Food Sci., 53 (1988) 1165-1170.
120. Schaller A, Leuprecht H and Theodoridis N, Confructa, 15 (1970) 72-87.
121. Rao M A, Cooley H J, Nogueira J N and McLellan M R, J. Food Sci., 51
(1986) 176-179.
122. Watson E L, Can. Agric. Eng., 10 (1968) 8-11.
123. Costell E and Duran L, Rev. Agroquim. Tecnol. Aliment., 18 (1978) 470-484.
124. García R, Rivera J and Rolz C, Proc. 4th Intern. Congress Food Sci. Technol., II
(1974) 18-26.
125. Rao M A, Palomino L N O and Bernhardt L W, J. Food Sci., 39 (1974) 160-
161.
126. Qiu C G and Rao M A, in “Engineering and Foods”, Vol. 1 (Editors: W E L
Spiess and H Schubert), Elsevier, London, (1990) 41-48.
127. Ibarz A, Pagan J and Sanz M, J. Food Eng., 15 (1992) 63-67.
128. Rao M A, Shallenberger R S and Cooley H J, in “Food Engineering and
Process Applications” (Editors: M le Maguer and P Jelen), Elsevier, London,
(1986) 23-31.
129. Sáenz E and Costell C, in “Engineering and Food”, Vol I (Editors: W E L
Spiess and H Schubert), Elsevier, London, (1990) 133-142.
130. Rao M A, Cooley H J and Vitali A A, Food Technol., 38 (1984) 113-118.
131. Tanglertpaibul T and Rao M A, J. Food Sci., 52 (1987) 141-145.
132. Rao M, Food Technol., 3 (1987) 85-88.
133. Yoo B and Rao M A, J. Texture Stud., 25 (1994) 421-436.
134. Hayes W A, Smith P G and Morris A E J, Crit. Rev. Food Sci. Nutr., 38 (1998)
537-564.
135. Moresi M and Liverotti C, J. Food Technol., 17 (1982) 177-192.
136. Thakur B R, Singh R K and Nelson P E, Food Rev. Int. 12 (1996) 375-401.
137. Morris CE, J. Food Eng., 63 (1991) 136-140.
138. Barret D M, Garcia E and Wayne J E, Crit. Rev. Food Sci., Nutr. 38 (1998)
173-258.
139. Filkova J, Lawal A, Koziskova B and Majumdar A S, J. Food Eng. 6 (1987)
143-151.
Page 46
C. Gallegos, J. M. Franco and P. Partal, Rheology Reviews 2004, pp 19 – 65.
© The British Society of Rheology, 2004 (http://www.bsr.org.uk) 64
140. Rao M A and Qui C G, in “Quality Factors of Fruits and Vegetables:
Chemistry and Technology” (Editor: J J Jen), America Chemical Society,
Washington, (1989) 149-171.
141. Trifiro A, Pagliari F and Gherardi S, J. Food Eng. 23 (1994) 233-248.
142. Rao M A and Cooley H J, J. Texture Stud. 23 (1992) 415-425.
143. Fito P J, Clemente G and Sanz F J, J. Food Eng. 2 (1983) 51-62.
144. Sharma S K, LeMaguer M, Liptay A and Poysa V, Food Res Int 29 (1996)
175-179.
145. Yoo B, Rao M A and Steffe J F, J. Texture Stud. 26 (1995) 1-10.
146. Rao M A, Bourne M C and Cooley H J, J Texture Stud 12 (1981) 521-538.
147. Dervisoglu M and Kokini J L, J. Food Sci. 51 (1986) 541-546.
148. Tanglertpaibul T and Rao M A, J. Food Sci. 52 (1987) 318-321.
149. Tanglertpaibul T and Rao M A, J. Food Sci. 52(1987) 1642-1645.
150. Beresovsky N, Kopelman I J and Mizrahi S, J. Food Proces. Pres. 19 (1995)
133-146.
151. Den Ouden F and Van Vliet T, J Food Sci 62(1997) 565-567.
152. Heutink R (1986) “Tomato juices and tomato juice concentrates: a study of
factors contributing to their gross viscosity”. Ph. D. Thesis Agricultural
University, Wageningen (1986).
153. Xu S-Y, Shoemaker C F and Luh B S, J. Food Sci. 51 (1986) 399-402.
154. Bhasin U R and Bains G S, J. Food Sci. Technol. 24 (1987) 247-253.
155. Molwane S D and Gunjal B B, J. Food Sci. Technol. 22 (1985) 353-357.
156. Harper J C and El Sahrigi A F, J. Food Sci. 30 (1965) 470-476.
157. Rao M A and Cooley H J, J. Food Process Eng. 6 (1983) 159-173.
158. Ibarz A, Vicente M and Graell J, J. Food Eng. 6 (1987) 257-267.
159. Castaldo D, Palmieri L, Lo Voi A and Constabile P, J. Texture Stud. 21 (1990)
253-264.
160. Khaili K E, Ramakrishna P, Nanjundaswamy A M and Patwardhan M V, J.
Food Eng. 10 (1989) 231-240.
161. Manohar B, Ramakrishna P and Ramteke R S, J. Texture Stud. 21 (1990) 179-
190.
162. Harper J C and Lebermann K W, Proc. 1st Intern. Congress Food Sci. Technol.
I (1962) 720-728.
163. Ibarz A and Pagan J, J. Food Eng. 6 (1987) 269-289.
164. Dale M C, Okos M R and Nelson P E, J. Food Sci. 47 (1982) 1853-1858.
Page 47
C. Gallegos, J. M. Franco and P. Partal, Rheology Reviews 2004, pp 19 – 65.
© The British Society of Rheology, 2004 (http://www.bsr.org.uk) 65
165. Noomhorm A and Tansakul A, J. Food Process Eng. 15 (1992) 229-239.
166. Yoo B and Rao M A, J. Food Sci. 60 (1995) 777-785.
167. Metzner AB, J. Rheol. 29 (1985) 739-775.
168. Den Ouden F W C and Van Vliet T in “Food Colloids and Polymers”,
(Editors: M A Rao and J F Steffe), The Royal Society of Chemistry, Cambridge
(1993) 285-288.
169. Yoo B and Rao M A, J. Texture Stud. 27 (1996) 451-459.
170. Mackley M R, Marshall R T J, Smeulders J and Zhao F D, Chem. Eng. Sci. 49
(1994) 2551-2556.
171. Sánchez, M C, Valencia C, Gallegos C, Ciruelos A and Latorre A, J. Sci. Food
Agric. 82 (2002) 990-997.
172. Tsai S C and Zammuri K, J. Rheol. 32 (1988) 737-750.
173. Thakur B R, Singh R K, Tieman D M and Kanda A K, J. Food Sci. 61 (1996)
85-88.
174. Errington N, Tucker G A and Mitchell J R, J. Sci. Food Agr. 6 (1998) 515-523.
175. Gould W A, “Tomato Production, Processing and Technology”. Publishing
CTI, Baltimore (1992).
176. Sánchez M C, Valencia C, Ciruelos A, Latorre A and Gallegos C, J. Food Sci.
68 (2003) 551-554.
177. Bueno J C and Latorre A, inventors. Societe des Produits Nestle SA, assignee.
EP 0 888718 A1 (1999).
178. Valencia C, Sánchez M C, Ciruelos A and Gallegos C, Food Sci. Technol.
Intern., 9 (2003) 53-63.
179. Valencia C, Sánchez M C, Ciruelos A, Latorre A, Franco J M and Gallegos C,
Eur. Food Res. Technol., 214 (2002) 394-399.
180. Valencia C, Sánchez M C, Ciruelos A, Latorre A, Madiedo J M and Gallegos
C, Food Res. Intern., 36 (2003) 911-919.
181. Ferry J D, “Viscoelastic Properties of Polymers”. Wiley, New York (1980).
182. Papanastasiou A C, Scriven L E and Macosko C W, J. Rheol. 27 (1983) 387-
410.
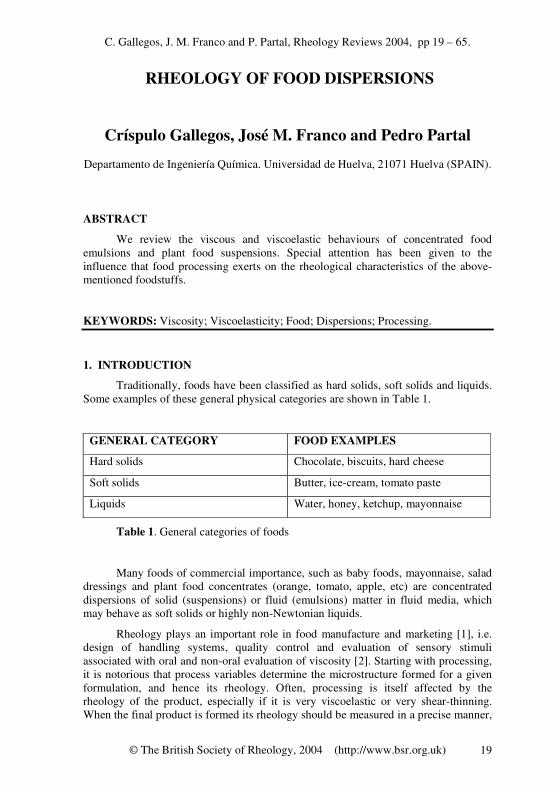
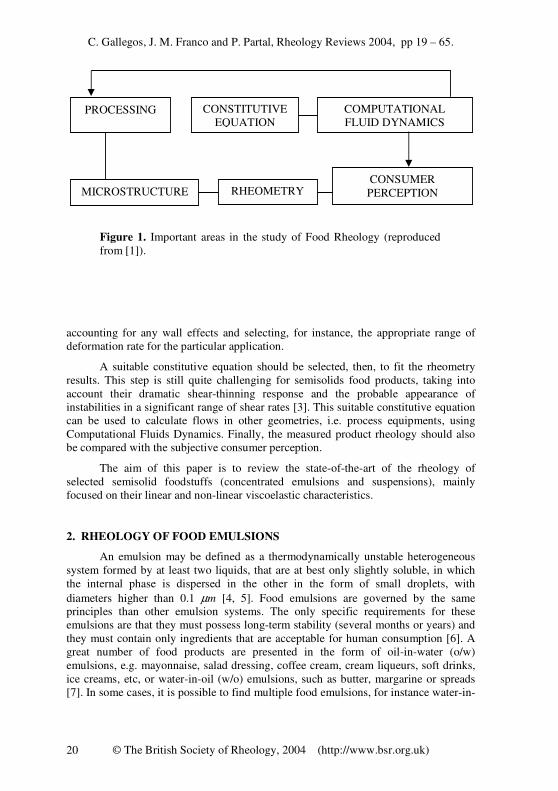

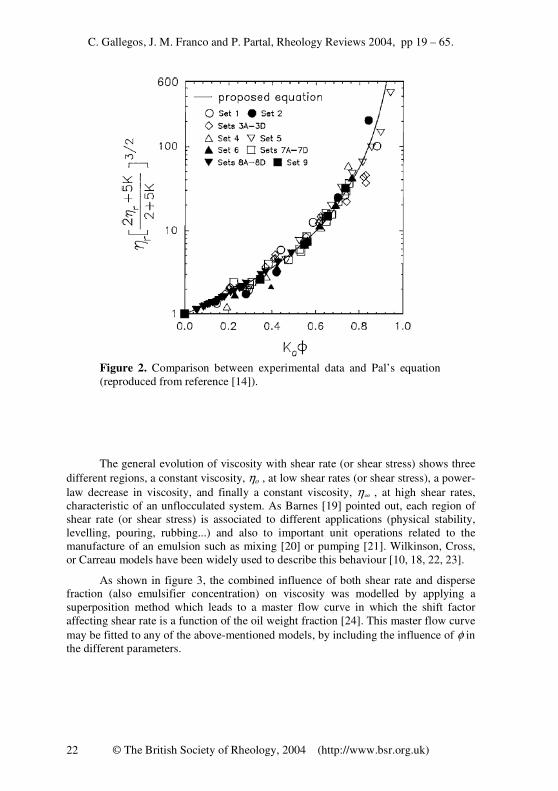


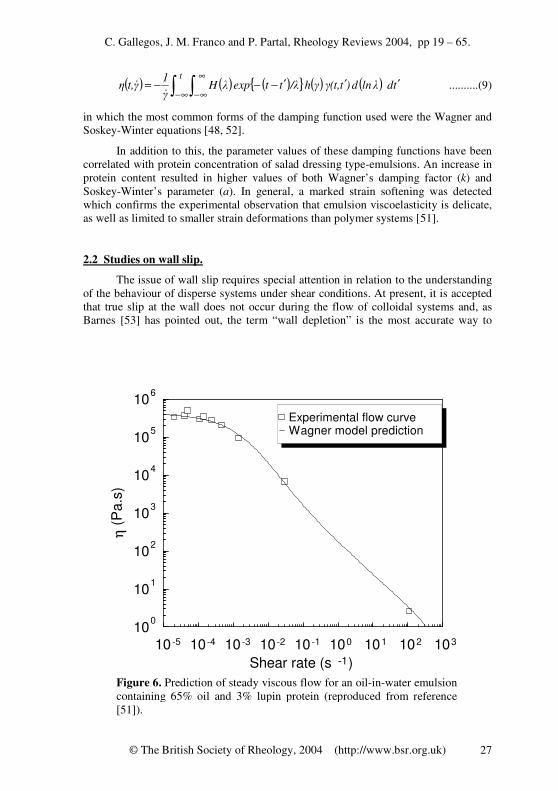


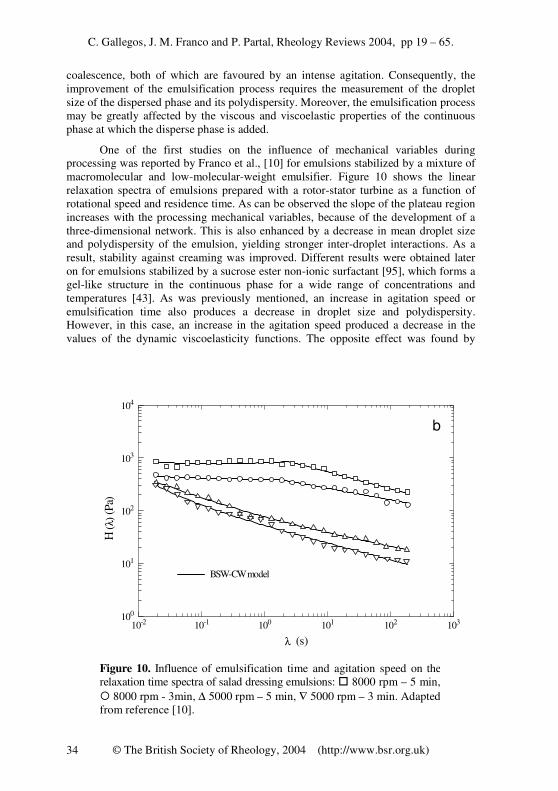
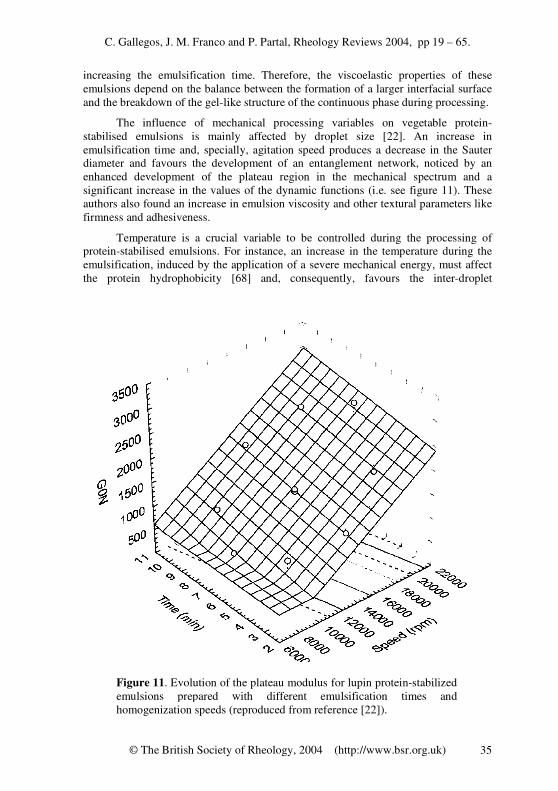


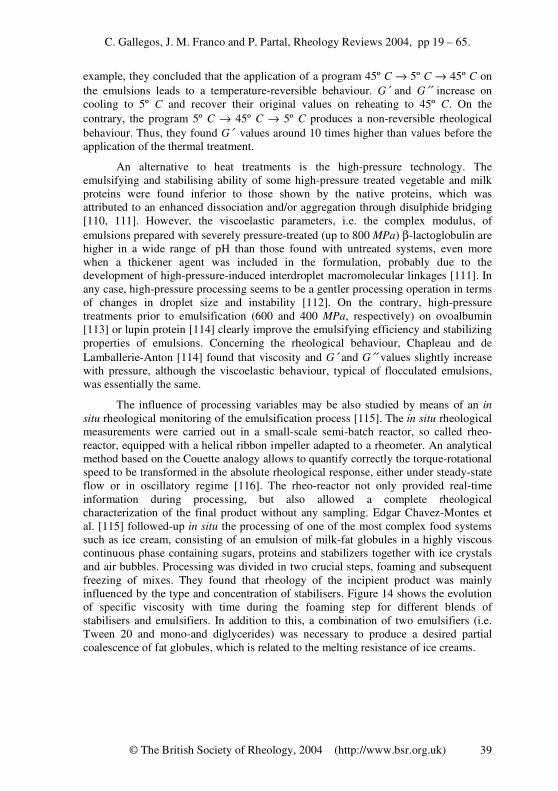
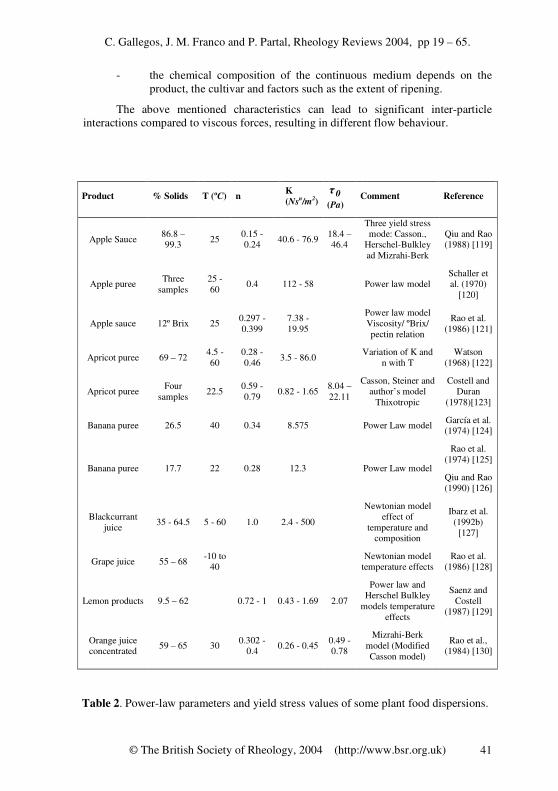


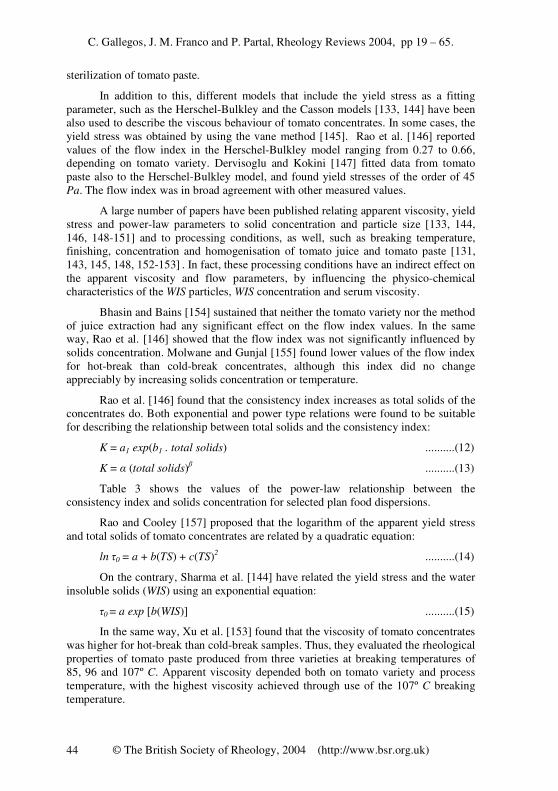


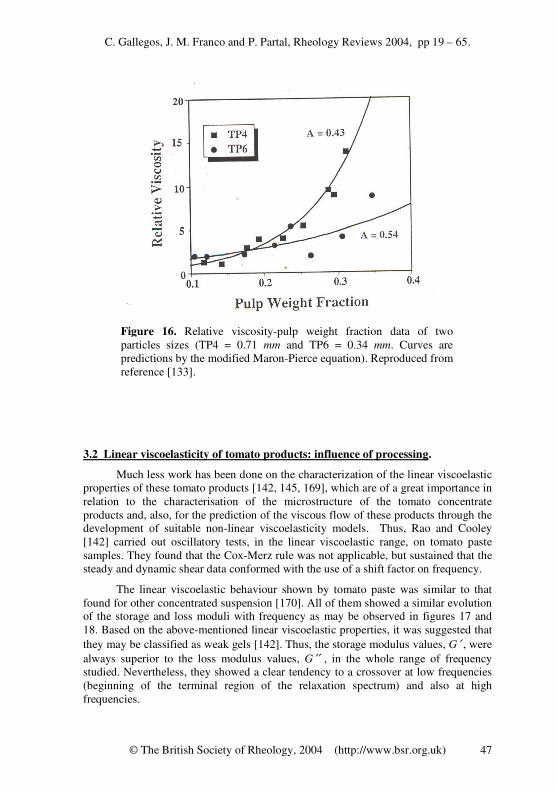
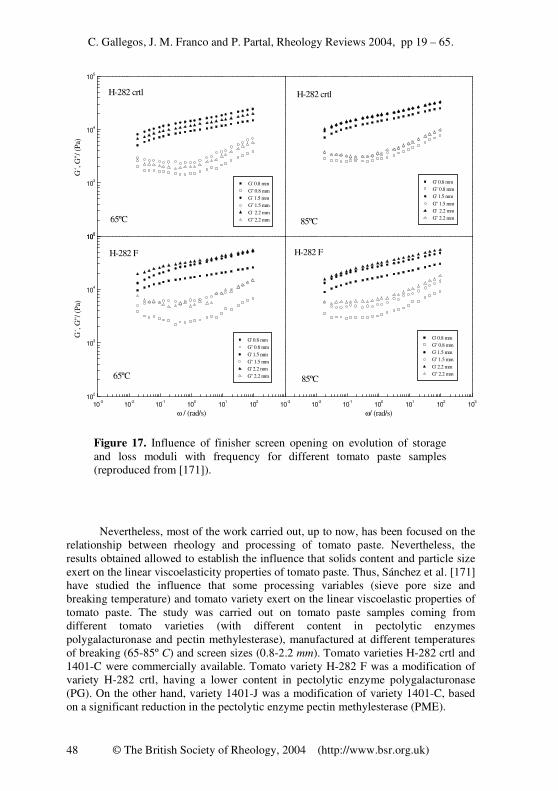
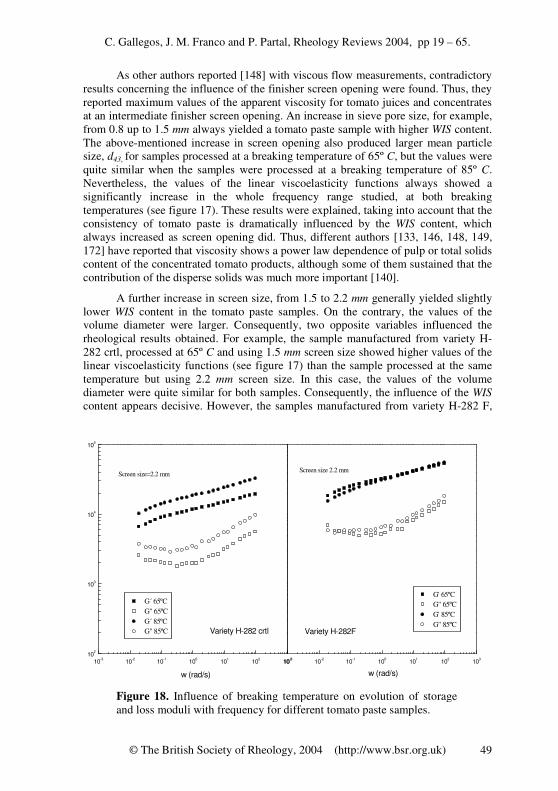

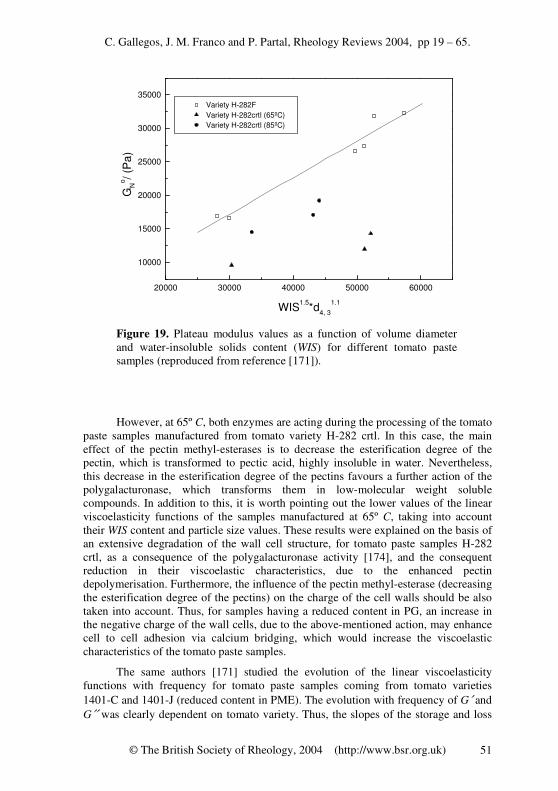
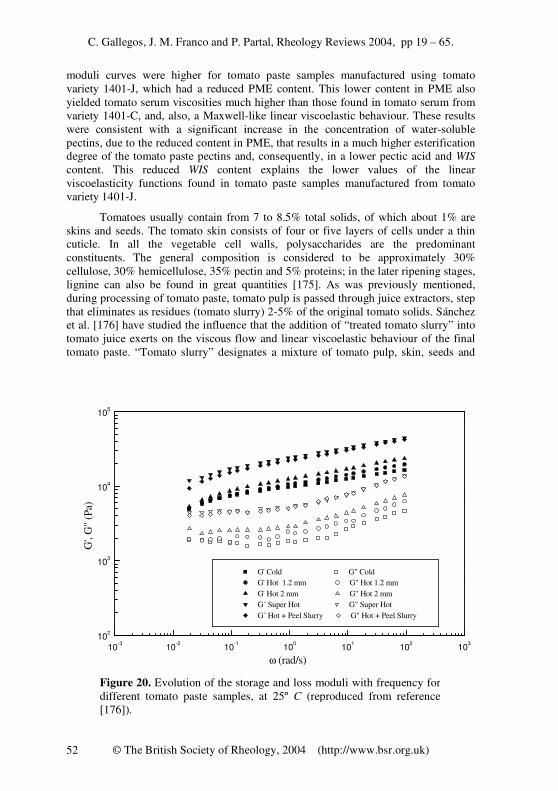


![Mata Ortiz Potters Map - The Renaissance of Mata Ortiz · Mata Ortiz Potters Map ... Elvira Bugarini 126 ... [2] Hector Gallegos 303 Hector Gallegos Jr. 300 Guadalupe Gallegos Garcia](https://static.documents.pub/doc/80x56/5b0e07e47f8b9aa31f8b78a9/mata-ortiz-potters-map-the-renaissance-of-mata-ortiz-potters-map-elvira-bugarini.jpg)
