RI SWPBIS Team Initiated Problem Solving and Data Based Decision Making RI SWPBIS Team Initiated Problem Solving and Data Based Decision Making Paul V. Sherlock Center on Disabilities Rhode Island College 600 Mt. Pleasant Avenue Providence RI 02908 401-456-8072 www.ripbis.org
Transcript
RI SWPBIS
Team Initiated Problem Solvingand Data Based Decision Making
RI SWPBIS
Team Initiated Problem Solvingand Data Based Decision Making
Total Number of Office Discipline Referrals as of January 10; Not SWIS
Average Number of Referrals as of January 10; SWIS
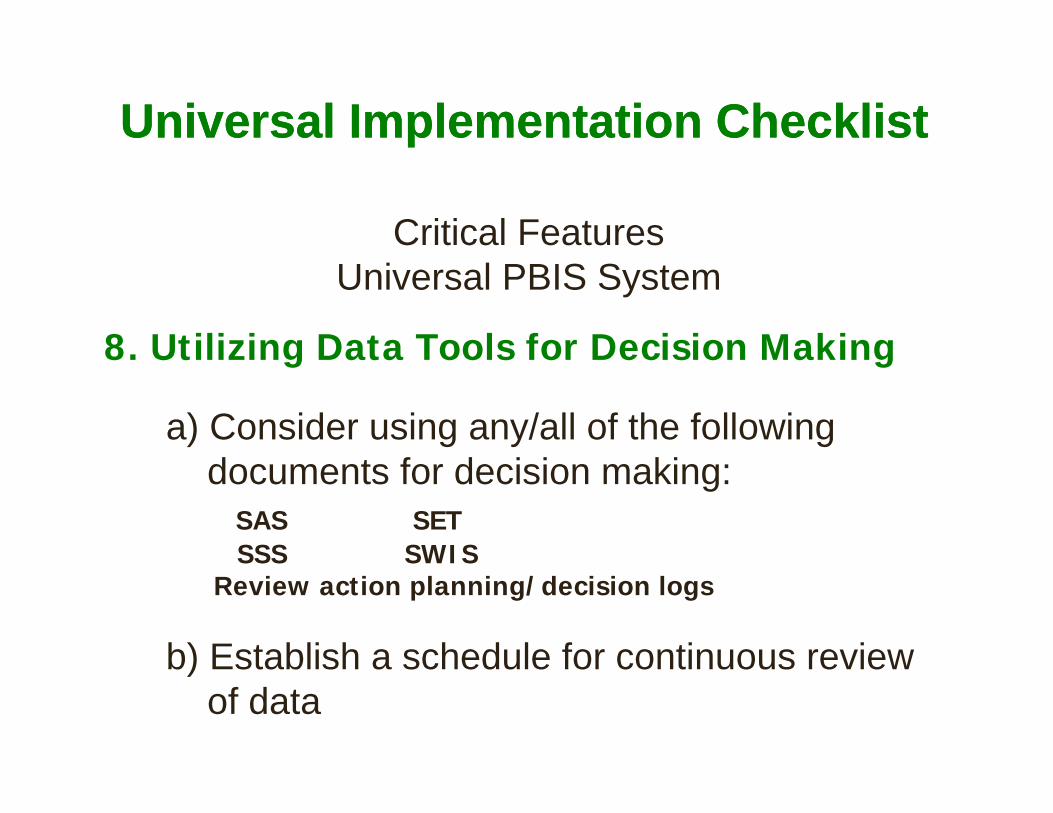
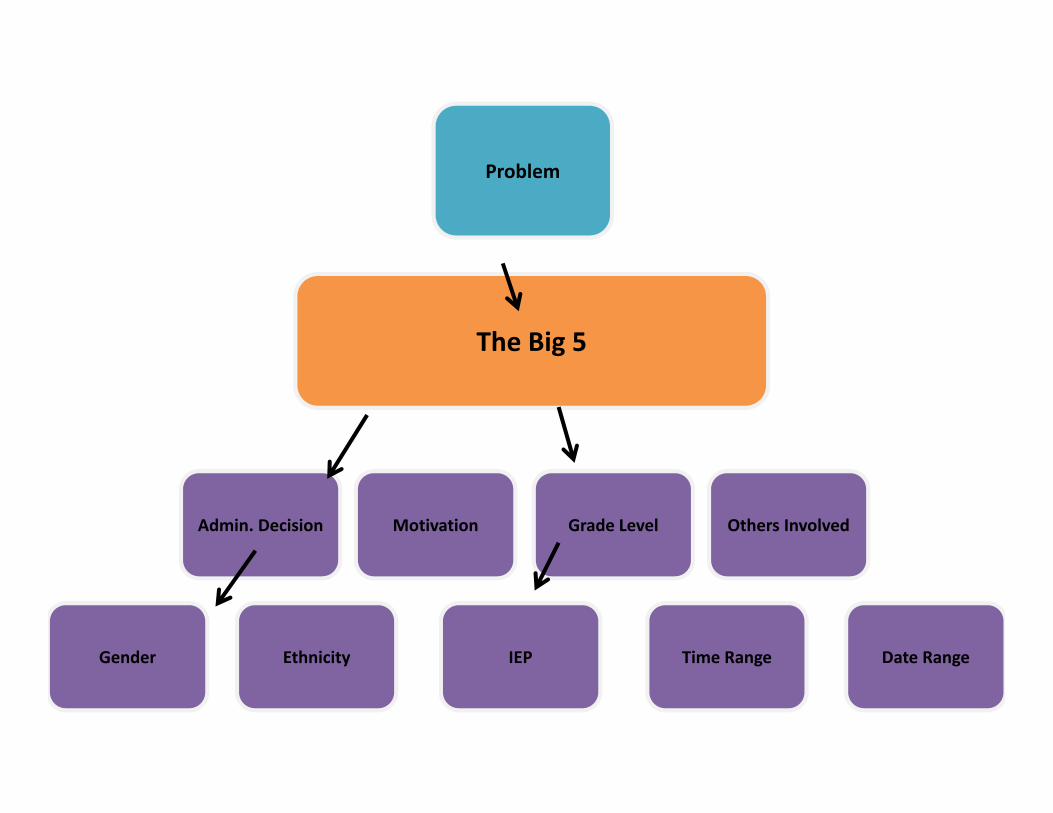
What behaviors are problematic?What behaviors are problematic?
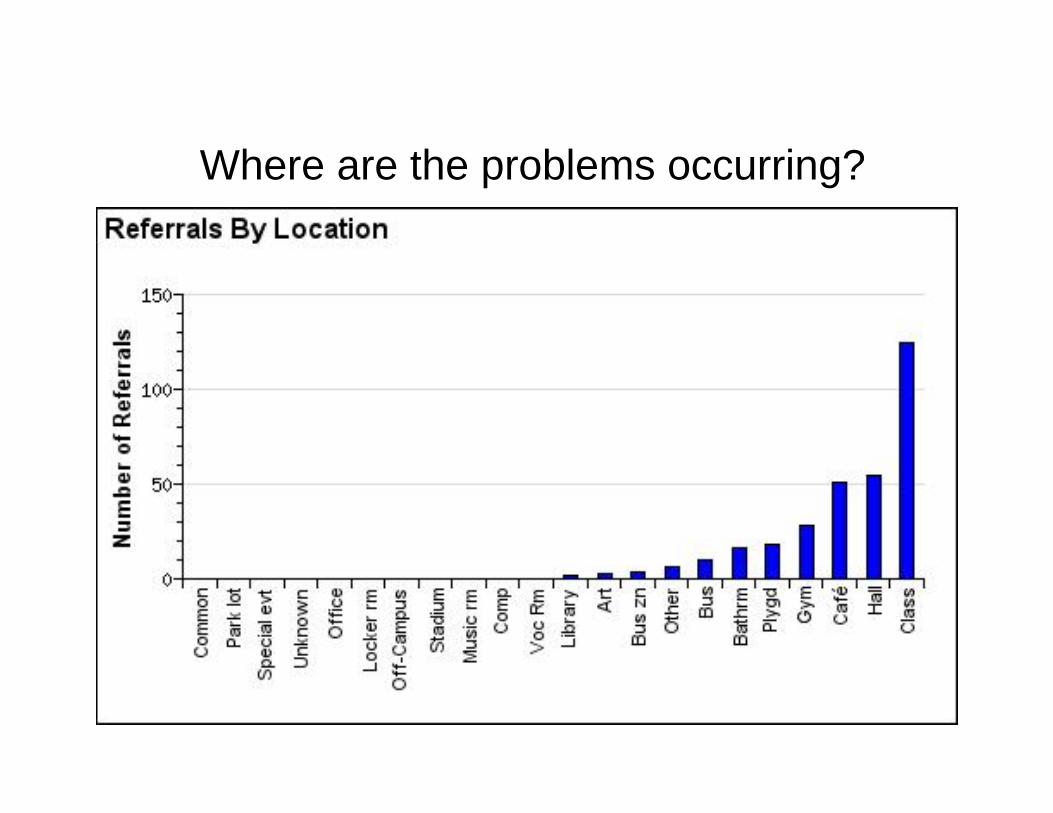
Where are the problems occurring?
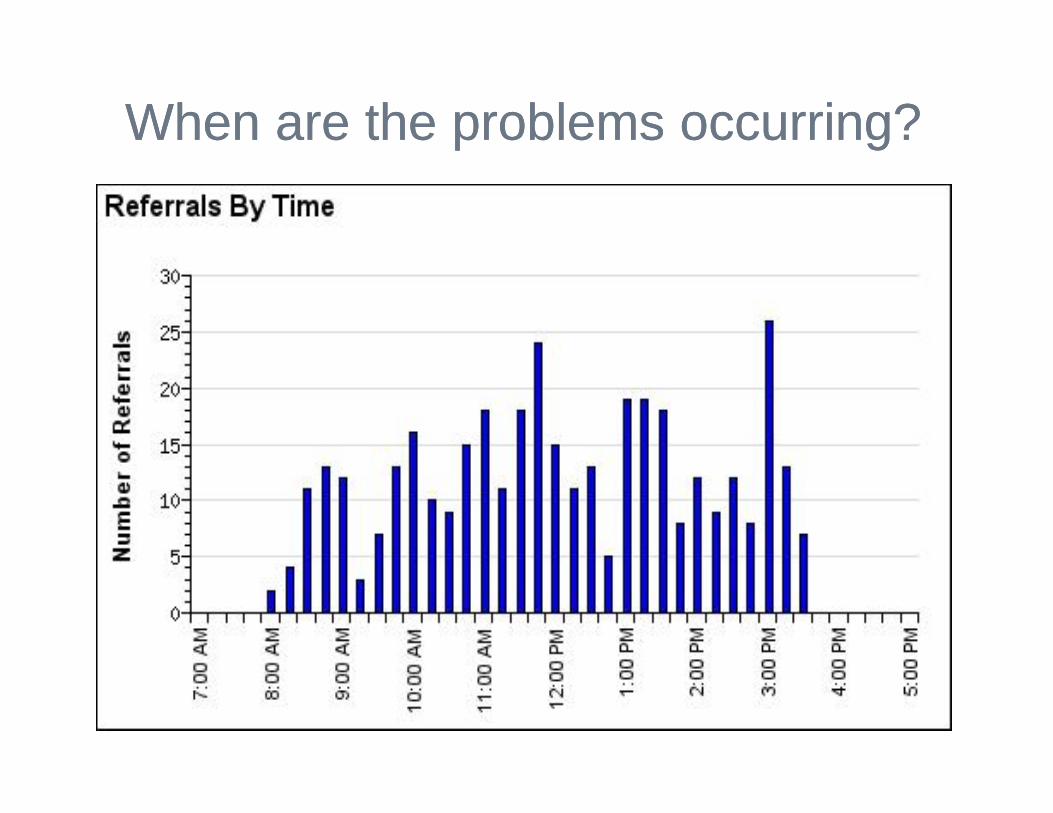
When are the problems occurring?When are the problems occurring?
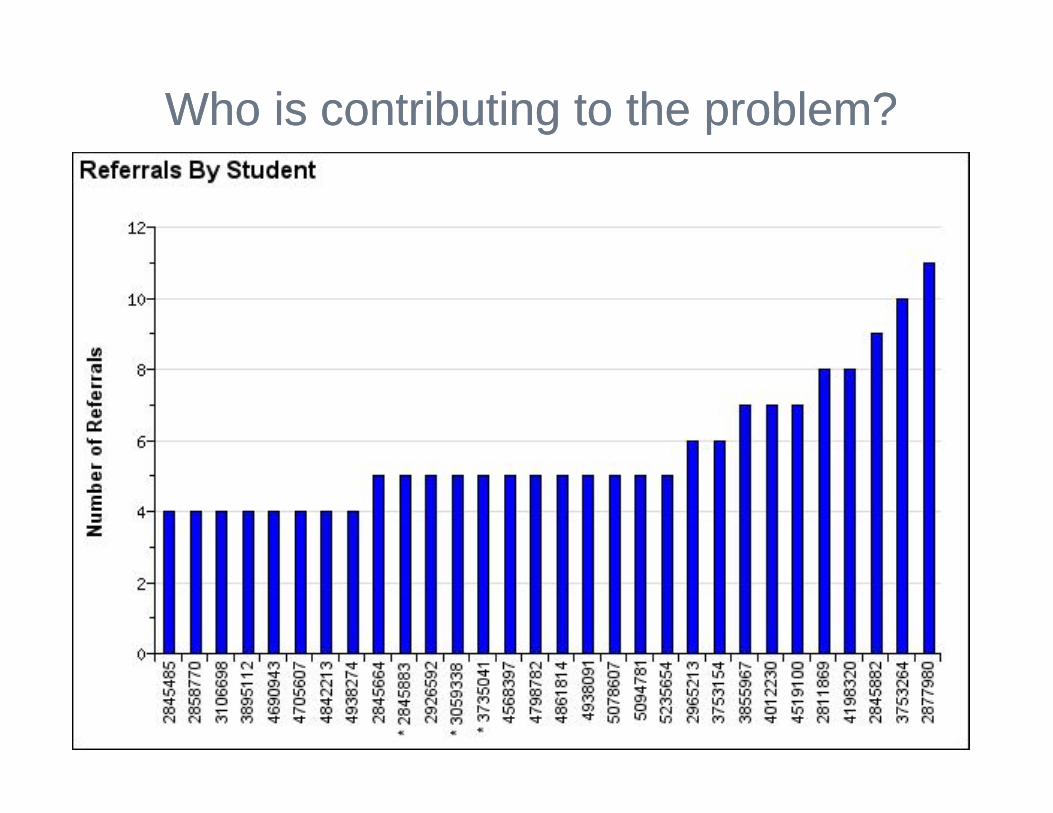
Who is contributing to the problem?Who is contributing to the problem?
Organizing SWIS Data for Decision-making
Organizing SWIS Data for Decision-making
• Universal Screening Tool
– Proportion of students with
• 0-1 Office Discipline Referrals (ODRs)
• 2-5 ODRs
• 6+ ODRs
• Progress Monitoring Tool
• Way to Compare data across time
– Prevent previous problem patterns
• Way to Define Problems with precision that lead to solvable problems
SWIS Can be used as a:
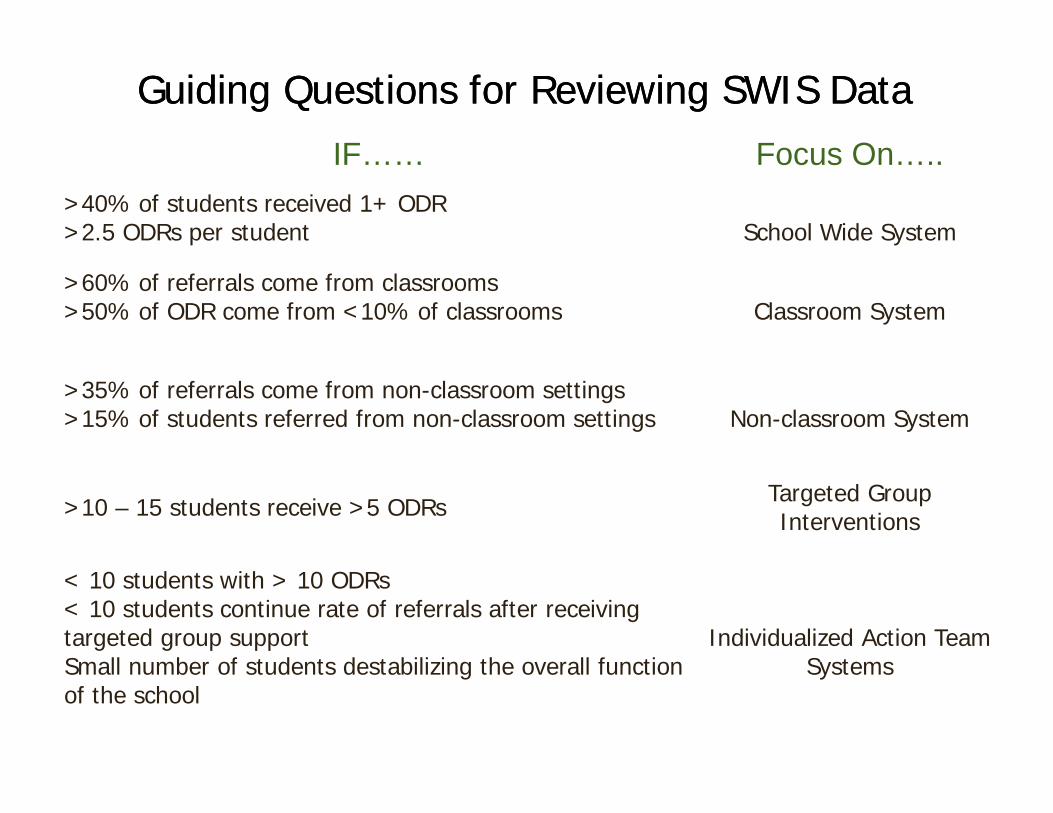
Guiding Questions for Reviewing SWIS DataGuiding Questions for Reviewing SWIS DataIF…… Focus On…..
>40% of students received 1+ ODR>2.5 ODRs per student School Wide System
>60% of referrals come from classrooms>50% of ODR come from <10% of classrooms Classroom System
>35% of referrals come from non-classroom settings>15% of students referred from non-classroom settings Non-classroom System
>10 – 15 students receive >5 ODRs Targeted Group Interventions
< 10 students with > 10 ODRs< 10 students continue rate of referrals after receiving targeted group supportSmall number of students destabilizing the overall function of the school
Individualized Action Team Systems
~80% of Students
~15%
~5%
0-1 office discipline referral
6+ office discipline referrals
2-5 office discipline referrals
Using office discipline referrals as a metric for universal screening of student social behavior
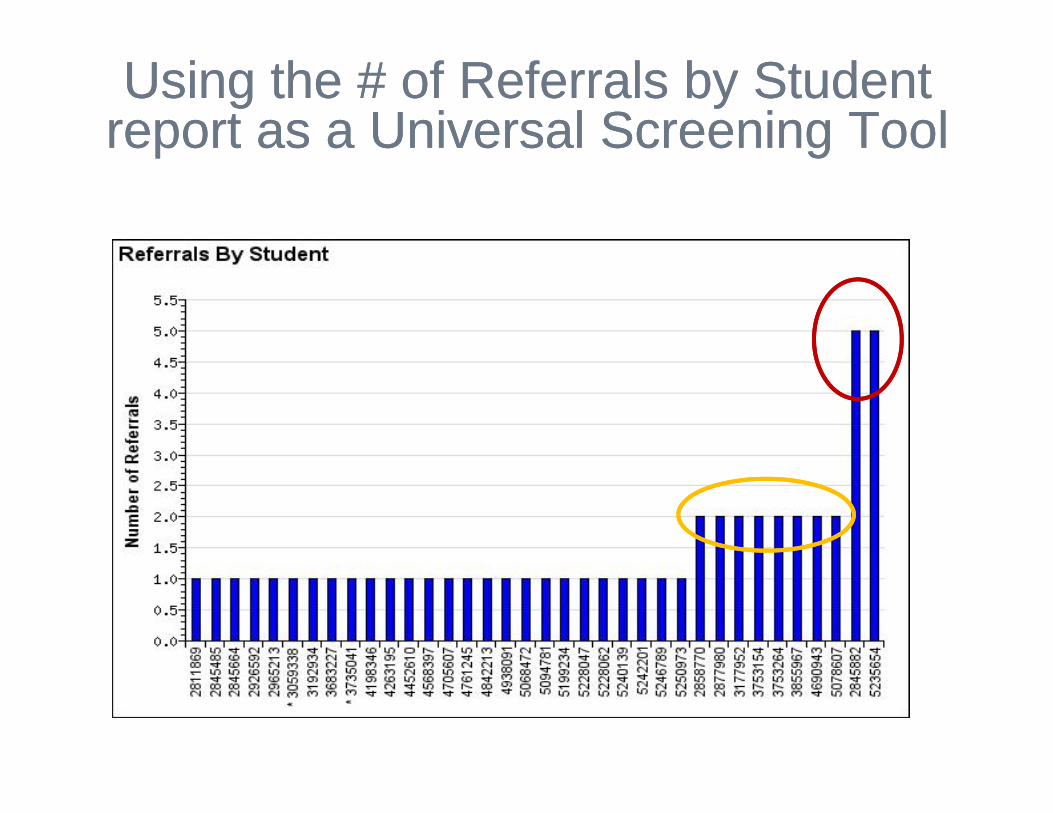
Using the # of Referrals by Student report as a Universal Screening ToolUsing the # of Referrals by Student
report as a Universal Screening Tool
Using ODRs to Identify ProblemsUsing ODRs to Identify Problems
• Build a picture for the pattern of office referrals in your school.
• Compare the picture with a national average
• Compare the picture with previous years
• Compare the picture with social standards of faculty, families, students.
Goal
•Identify problems empirically•Identify problems early
•Identify problems in a manner that leads to problem solving not just
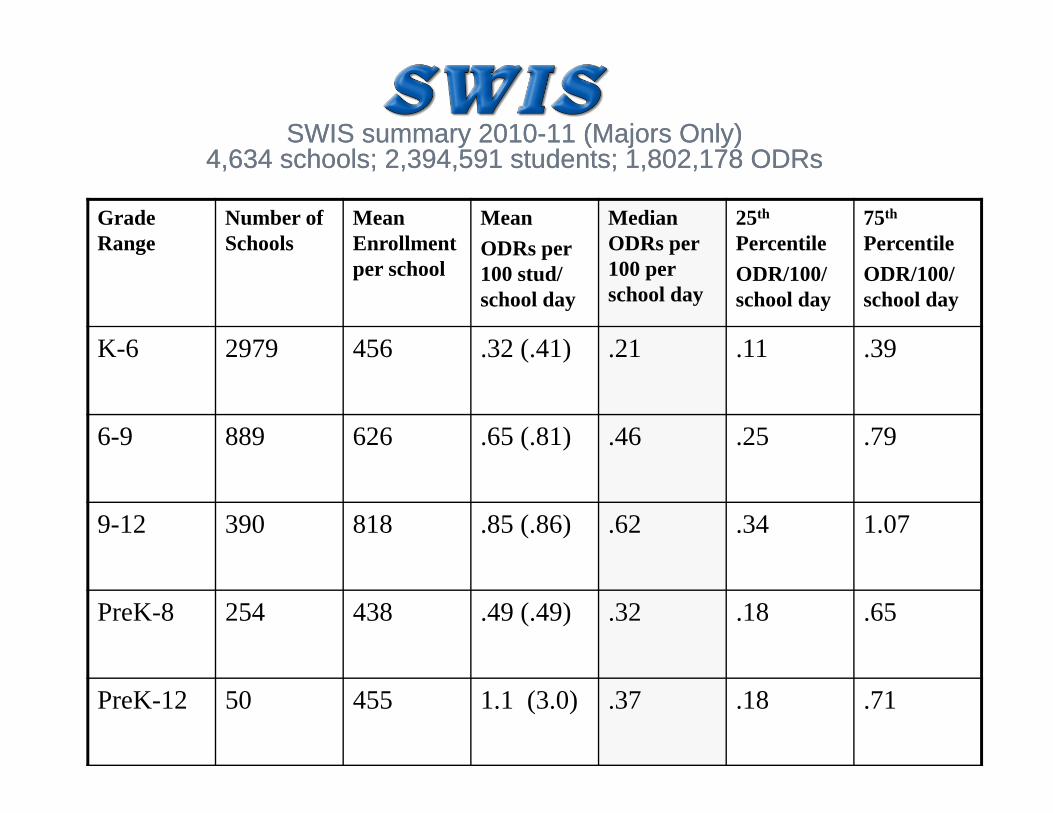
Elementary School 465 students (465/ 100 = 4.6 X .21= .96)
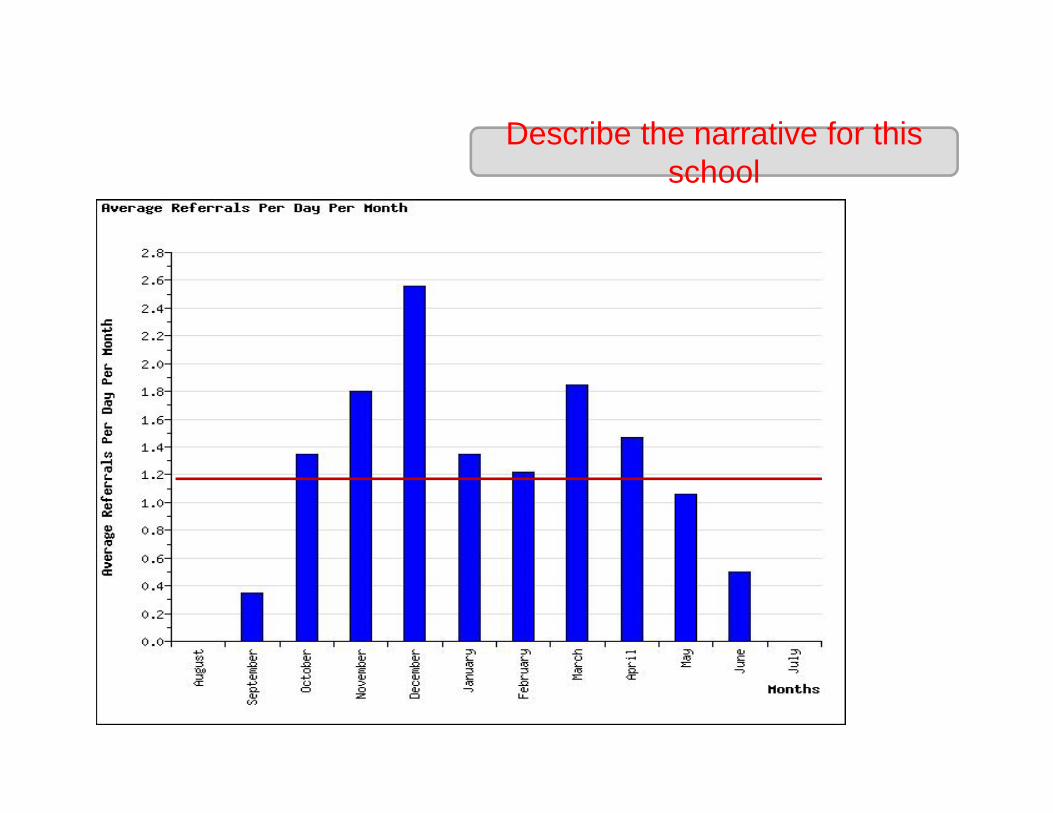
Our rate of problem
behavior has been above the
national average for schools our
size across 9 of 10 months this year. There has
been a decreasing trend since
Dec.
Elementary School 1000 Students (1000/100 =10 X .21= 2.1)
The rate of problem
behavior has been at or below the national
average for schools our
size across 6 of 10 months.
The past 4 months have been below the national
average
Middle School 765 students (765/100 = 7.6 X .46= 3.5)
The rate of problem
behavior has been at or below the national
average for schools our
size across 9 of 10 months.
The past 8 months have been below the national
average with a decreasing
trend
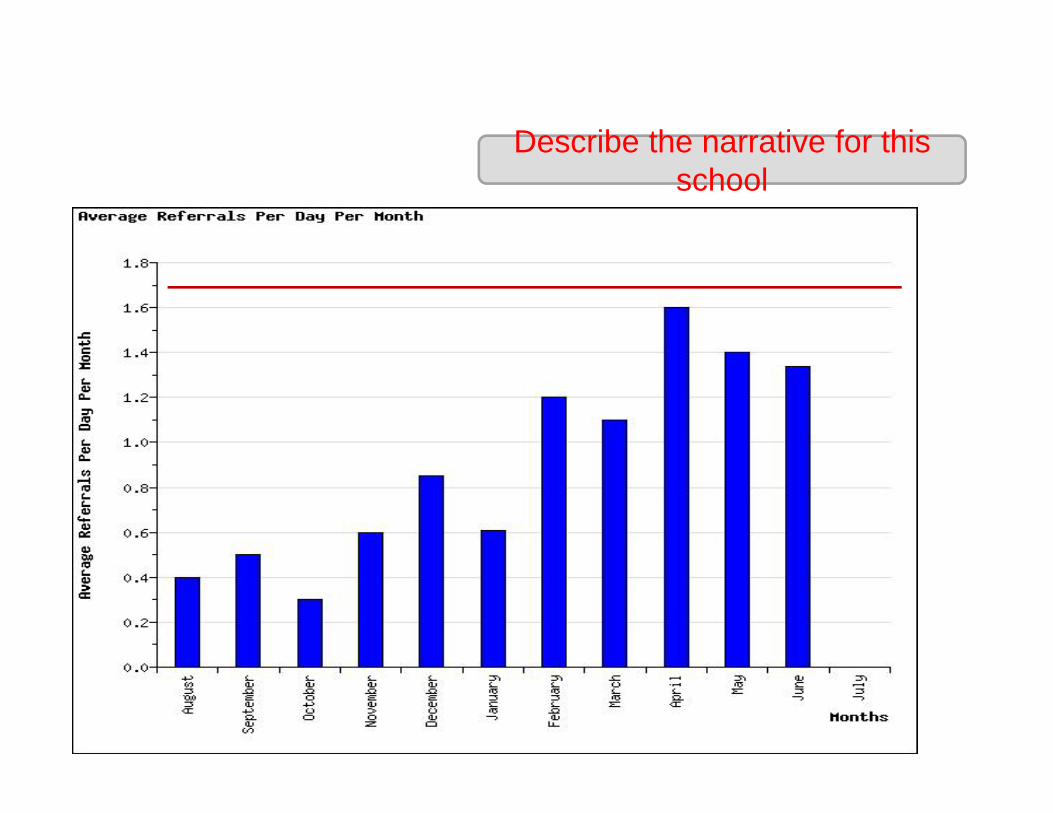
Describe the narrative for this school
Describe the narrative for this school
Describe the narrative for this school
Describe the narrative for this school
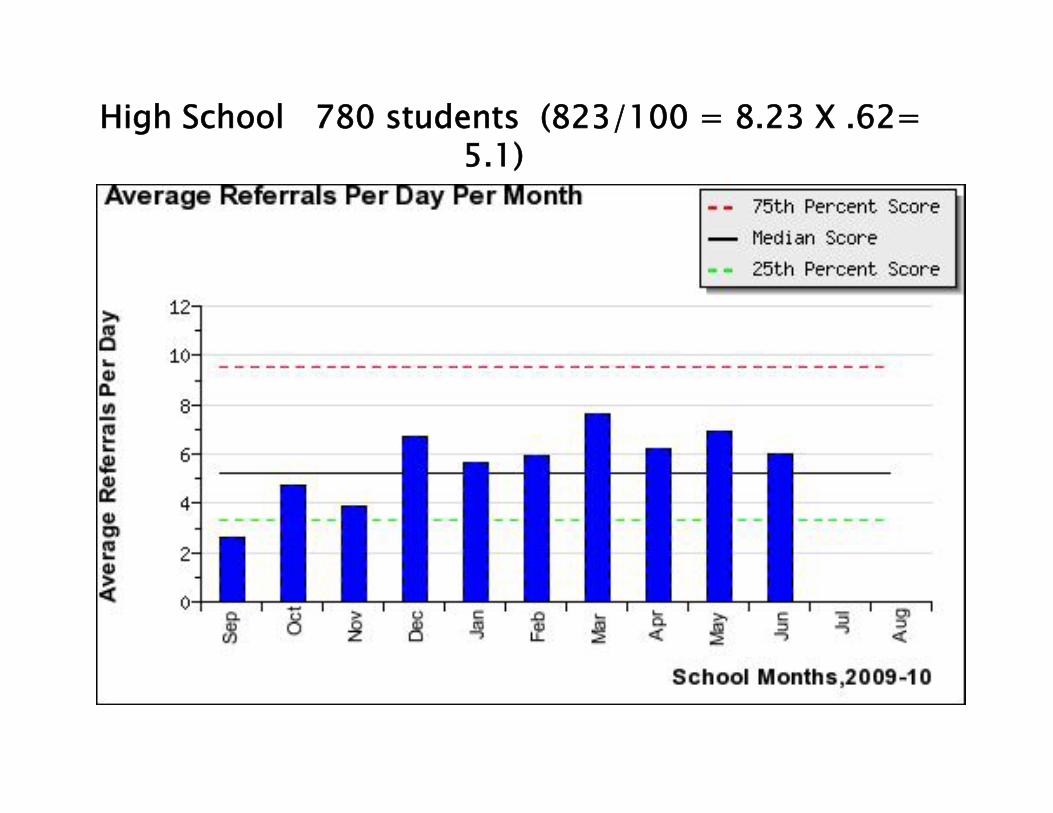
High School 780 students (823/100 = 8.23 X .62= 5.1)
Identification of Problem(for example...)
Identification of Problem(for example...)
• Our average Major ODRs per school day per month are higher than national average for a school of our enrollment size
• Our average ODRs per school day per month are higher this year than for corresponding months of previous year
• Our average ODRs per school day per month are showing an increasing trend
• Faculty, parents, and students say our ODR levels are too high
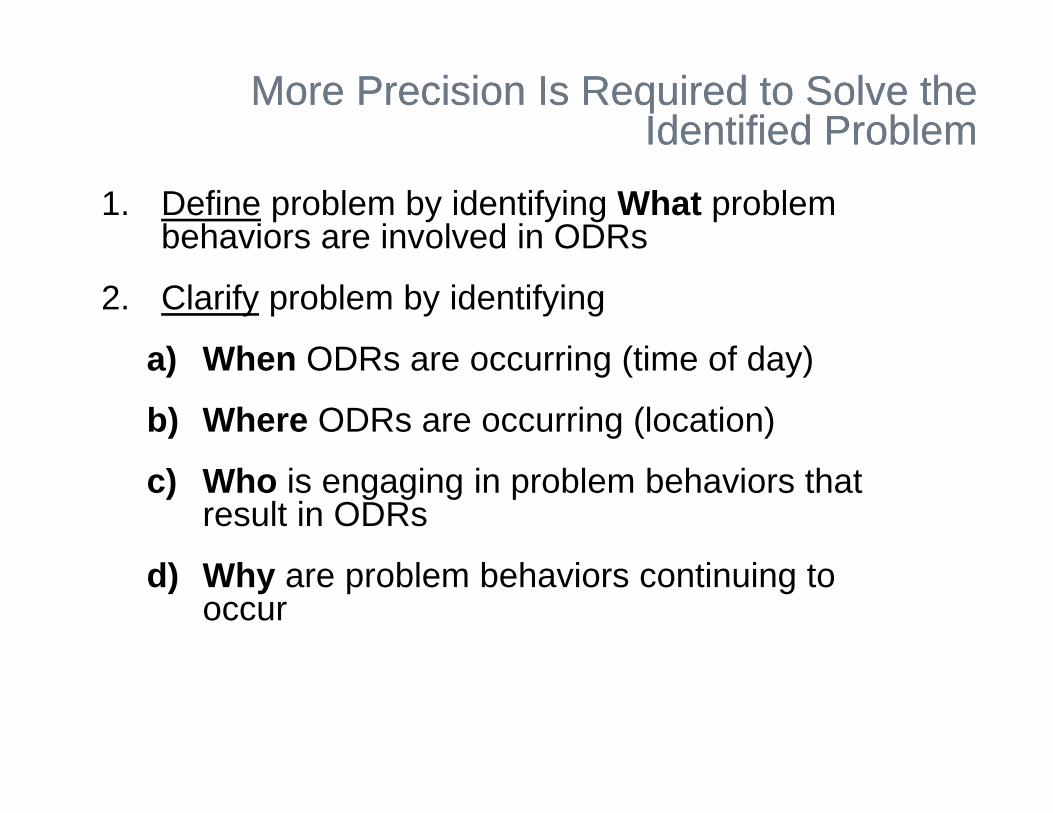
More Precision Is Required to Solve the Identified Problem
More Precision Is Required to Solve the Identified Problem
1. Define problem by identifying What problem behaviors are involved in ODRs
2. Clarify problem by identifying
a) When ODRs are occurring (time of day)
b) Where ODRs are occurring (location)
c) Who is engaging in problem behaviors that result in ODRs
d) Why are problem behaviors continuing to occur
Problem StatementsProblem Statements• Ultimately, you want to write a “problem
statement” that precisely specifies the problem you identified
• The more Ws (what, when, where, who… why) you incorporate into the problem statement, the more precise the problem statement will be
• The more precise the problem statement, the easier it will be to generate a solution that “fits” the problem
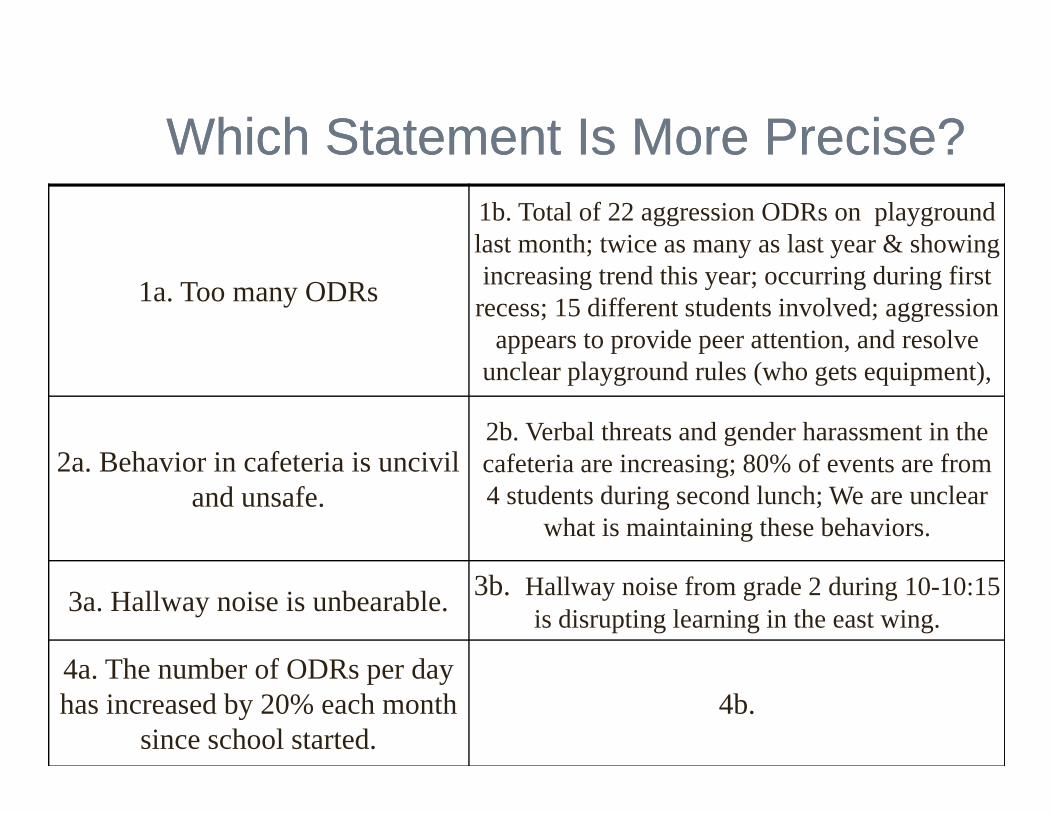
Which Statement Is More Precise?Which Statement Is More Precise?
1a. Too many ODRs
1b. Total of 22 aggression ODRs on playground last month; twice as many as last year & showing increasing trend this year; occurring during first
recess; 15 different students involved; aggression appears to provide peer attention, and resolve
unclear playground rules (who gets equipment),
2a. Behavior in cafeteria is uncivil and unsafe.
2b. Verbal threats and gender harassment in the cafeteria are increasing; 80% of events are from 4 students during second lunch; We are unclear
what is maintaining these behaviors.
3a. Hallway noise is unbearable. 3b. Hallway noise from grade 2 during 10-10:15 is disrupting learning in the east wing.
4a. The number of ODRs per day has increased by 20% each month
since school started.4b.
65
Which Statement Is More Precise?Which Statement Is More Precise?1a. Too many ODRs 1b. Too many instances of disrespect
2a. Too many ODRs between 1:00pm and 1:30pm 2b. Too many ODRs in the afternoon
3a. Too many ODRs occurring outside the classrooms 3b. Too many ODRs on the playground
4a. 25% of students have at least 2 ODRs 4b. Many students are experiencing ODRs
5a. Too many ODRs on the playground
5b. Total of 12 aggression ODRs on playground last month; twice as many as last year & showing increasing trend this year; occurring during first recess; 8 different students involved; aggression
appears to provide peer attention.
66
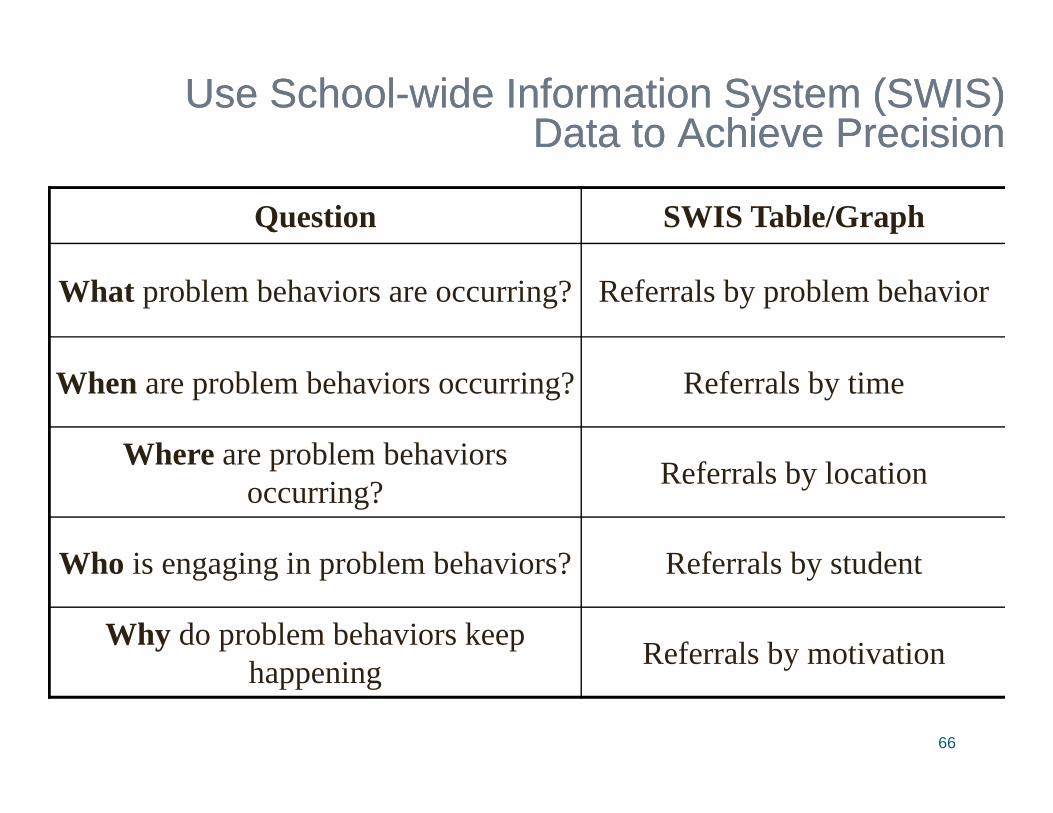
Use School-wide Information System (SWIS)Data to Achieve Precision
Use School-wide Information System (SWIS)Data to Achieve Precision
Question SWIS Table/Graph
What problem behaviors are occurring? Referrals by problem behavior
When are problem behaviors occurring? Referrals by time
Where are problem behaviors occurring? Referrals by location
Who is engaging in problem behaviors? Referrals by student
Why do problem behaviors keep happening Referrals by motivation
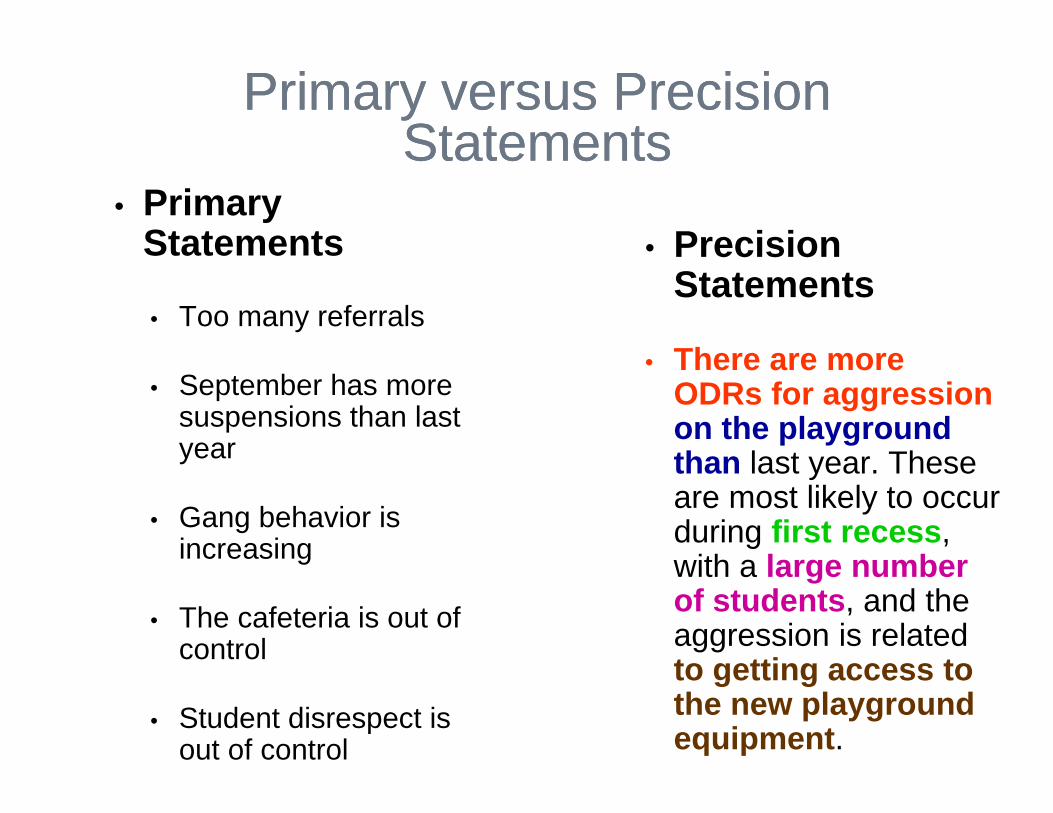
Primary versus Precision Statements
Primary versus Precision Statements
• Primary Statements
• Too many referrals
• September has more suspensions than last year
• Gang behavior is increasing
• The cafeteria is out of control
• Student disrespect is out of control
• Precision Statements
• There are more ODRs for aggression on the playground than last year. These are most likely to occur during first recess, with a large number of students, and the aggression is related to getting access to the new playground equipment.
Primary versus Precision Statements
Primary versus Precision Statements
• Primary Statements
• Too many referrals
• September has more suspensions than last year
• Gang behavior is increasing
• The cafeteria is out of control
• Student disrespect is out of control
• Precision Statements
• There are more ODRs for aggressionon the playground than last year. These are most likely to occur during first recess, with a large number of students, and the aggression is related to getting access to the new playground equipment.
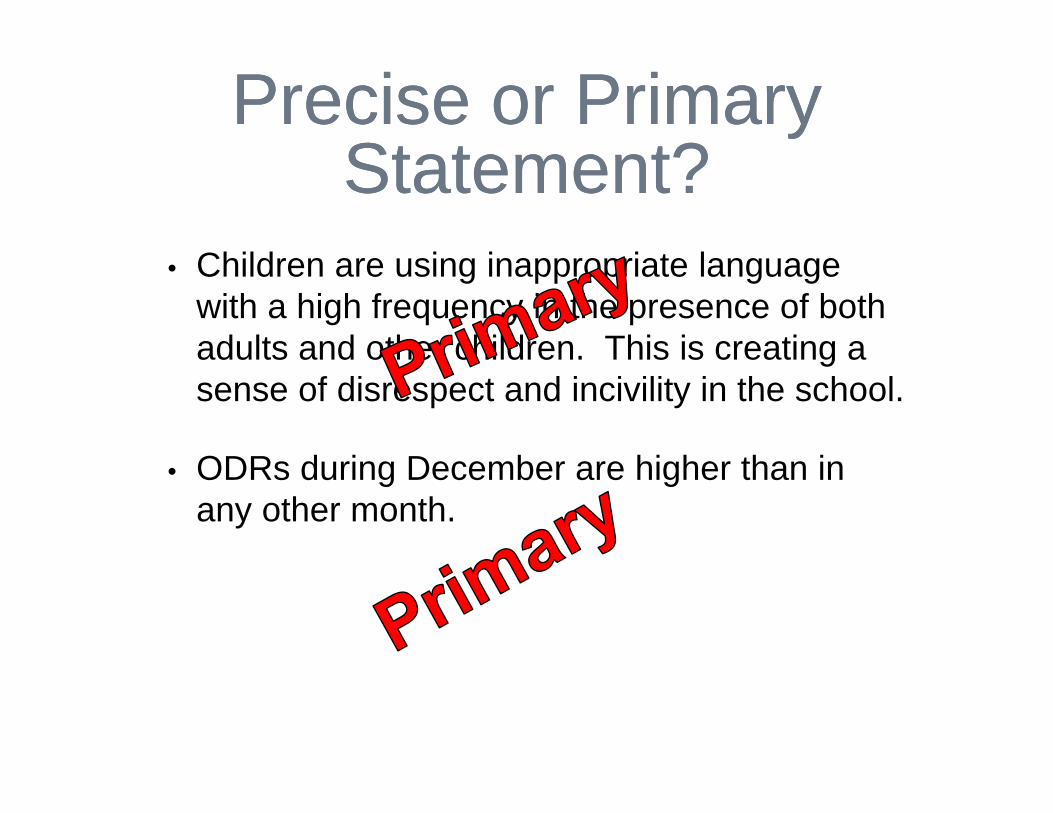
Precise or Primary Statement?
Precise or Primary Statement?
• Children are using inappropriate language with a high frequency in the presence of both adults and other children. This is creating a sense of disrespect and incivility in the school.
• ODRs during December are higher than in any other month.
Precise or Primary Statement?
Precise or Primary Statement?
• James D. is hitting others in the cafeteria during lunch, and his hitting is maintained by peer attention.
• Boys are engaging in sexual harassment.
• Three 5th grade boys are name calling and touching girls inappropriately during recess in an apparent attempt to obtain attention.
Precise or Primary Statement?
Precise or Primary Statement?
Minor disrespect and disruption are increasing over time, and are most likely during the last 15 minutes of our block periods when students are engaged in independent seat work. This pattern is most common in 7th and 8th grades, involves many students, and appears to be maintained by escape from work (but may also be maintained by peer attention… we are not sure).
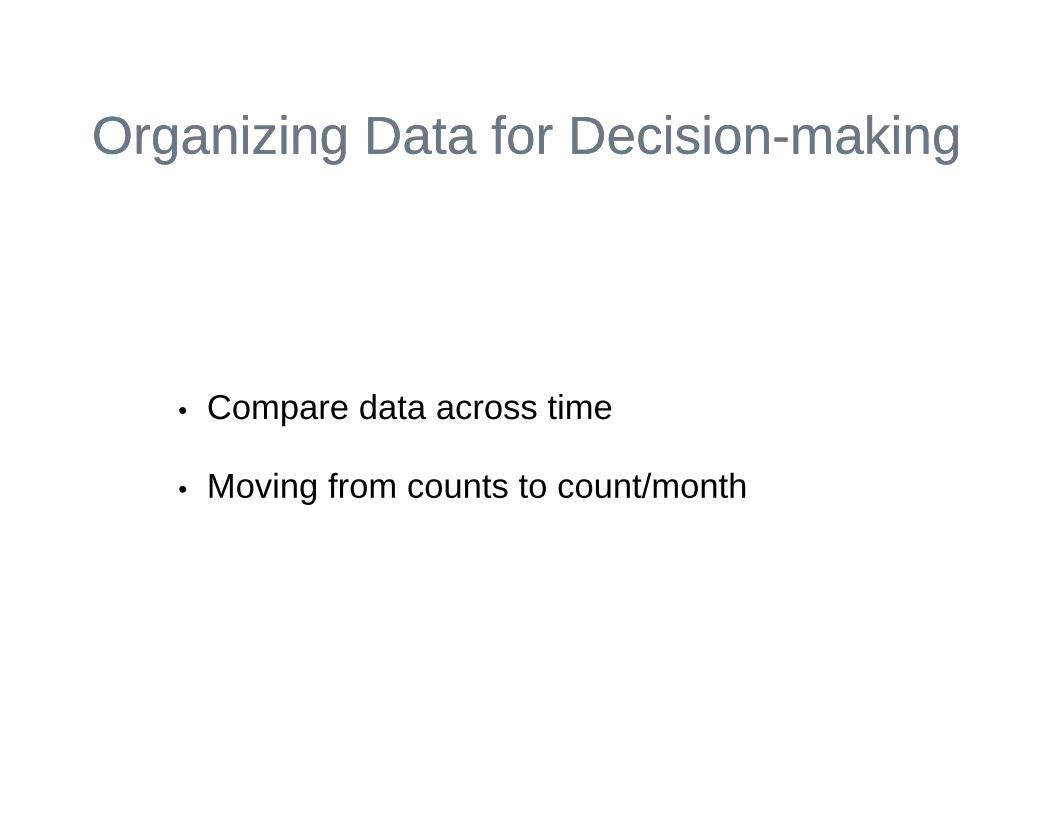
Organizing Data for Decision-makingOrganizing Data for Decision-making
• Compare data across time
• Moving from counts to count/month
Start with the ODR/Day/Month Graph
Start with the ODR/Day/Month Graph
• Use the information in the data to build a narrative that draws the team into problem solving.
• Be descriptive
• Link local data to national patterns
• Tie the data back to local conditions/events.
Using Data to Build Precision Problem Statements
Using Data to Build Precision Problem Statements
• Given that we know we have a problem
• What are the problem behaviors?
• Where are they occurring?
• When are they occurring?
• Who is involved?
• Why do they keep happening?
Questions to Ask About the Pattern of Problem BehaviorsQuestions to Ask About the
Pattern of Problem Behaviors1. Do we have one problem behavior situations or
more than one?
2. Do we have many problem behaviors or just a few problem behaviors?
3. Do we have clusters of problem behaviors?
4. What school wide expectations do we need to re-teach?
Data point toward asking the right questionsData point toward asking the right questions• If many referrals in class
• Which classes?
• Which students?
• What problem behaviors?
• When?
• If many referrals in cafeteria
• Which students?
• What times? (beginning or end of lunch period?)
• What problem behaviors?
Disrespect is our most frequent
problem behavior.We also have
incidents of fighting and harassment
What are next questions?
Who, When, Where, Why?
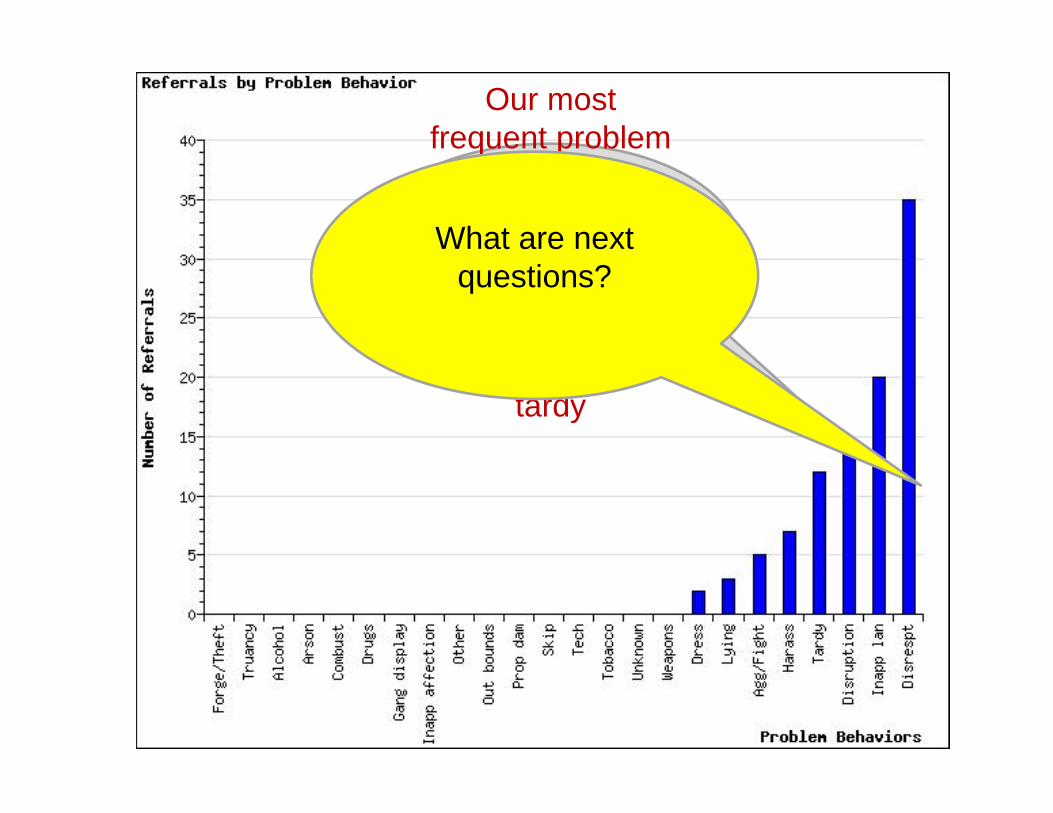
Our most frequent problem
behavior is disrespect, followed by
inappropriate language,
disruption and tardy
What are next questions?
We have many instances of disrespect,
aggression/fighting. technology
violations, tardy, harassment, lying,
skipping, and inappropriate
language
What are next questions?
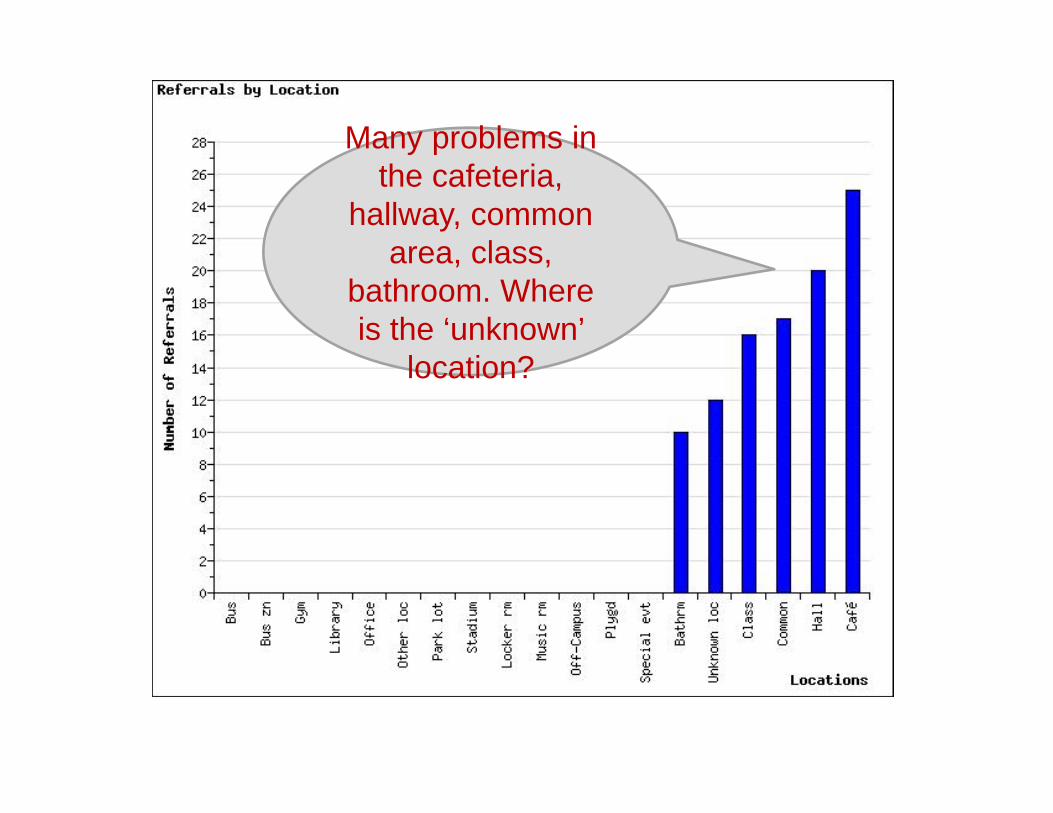
Questions to ask about Referrals by Location
Questions to ask about Referrals by Location
• Where are the problems occurring?
• Are there problems in many locations, clusters of locations, or one location?
Many problem behaviors in class
Many problem behaviors in unstructured settings (hall, playground, parking lot, bathroom)
More than one class of problems
Many problems in the cafeteria,
hallway, common area, class,
bathroom. Where is the ‘unknown’
location?
Questions to ask about Referrals by Time
Questions to ask about Referrals by Time
• When are the problem behaviors occurring?
• How do those times match with the daily activities?
• How does this information match up to Referrals by Location?
Most problems are occurring between 9:45-
10:45.
Other problematic
times are 8-8:45 and 11:30.
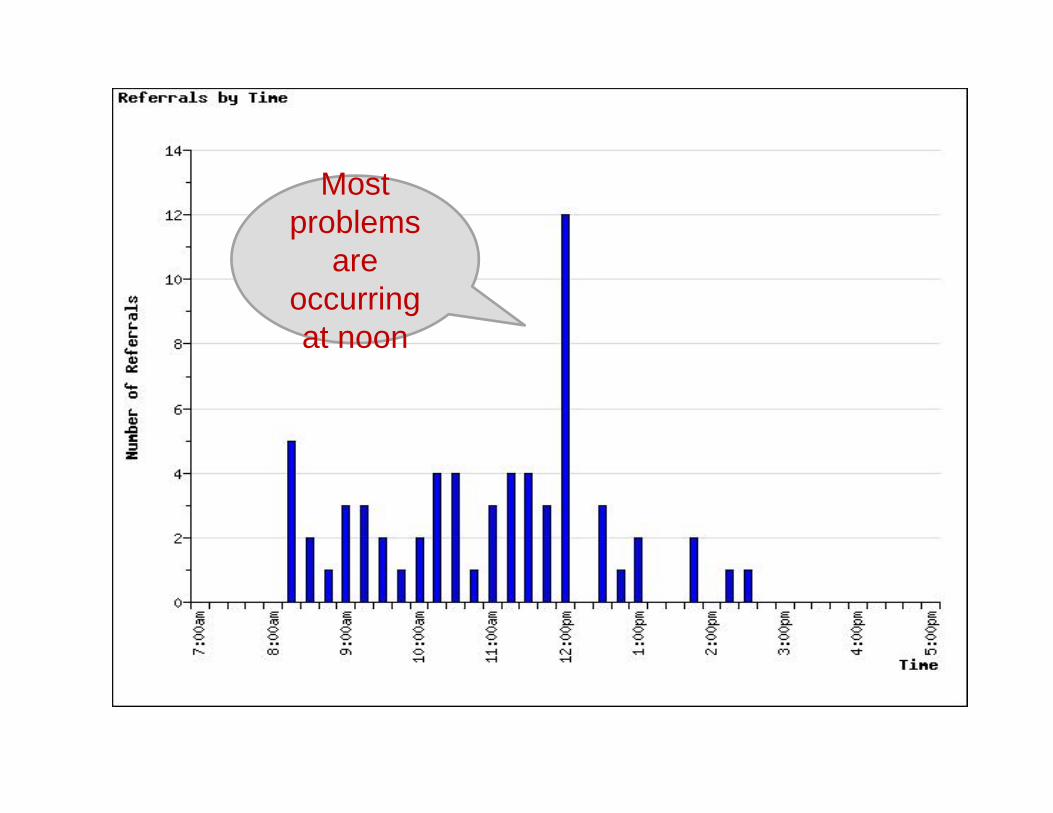
Most problems
are occurring at noon
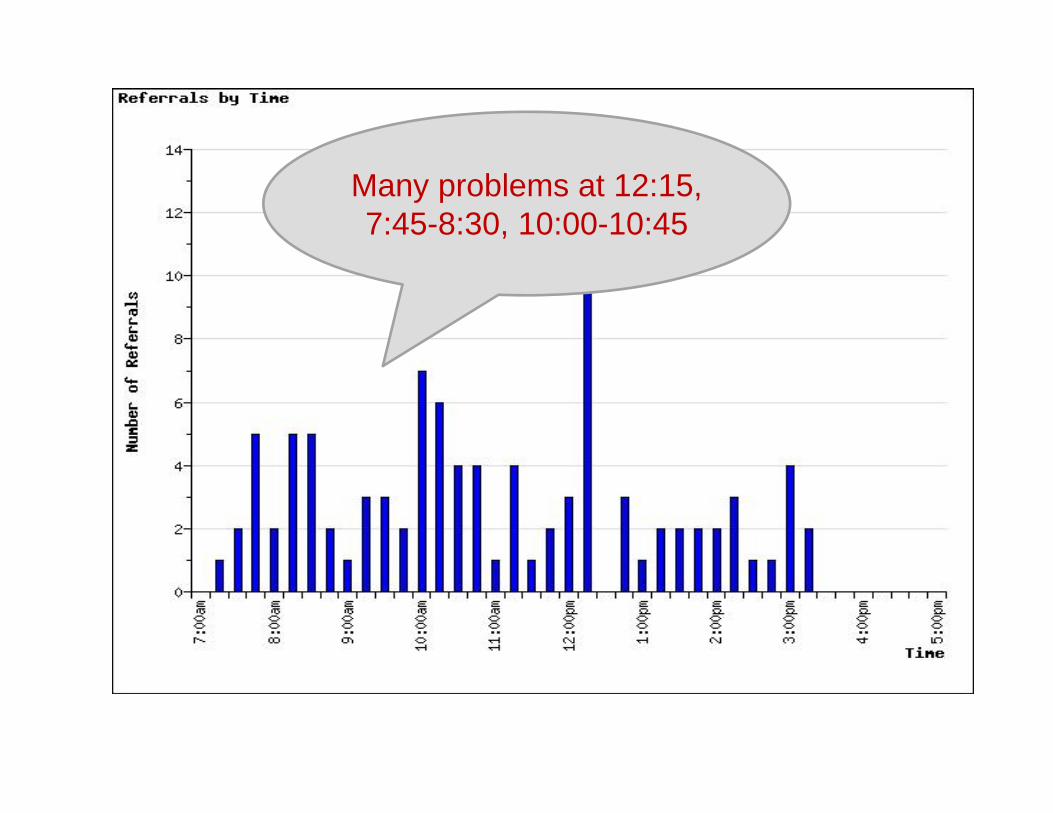
Many problems at 12:15, 7:45-8:30, 10:00-10:45
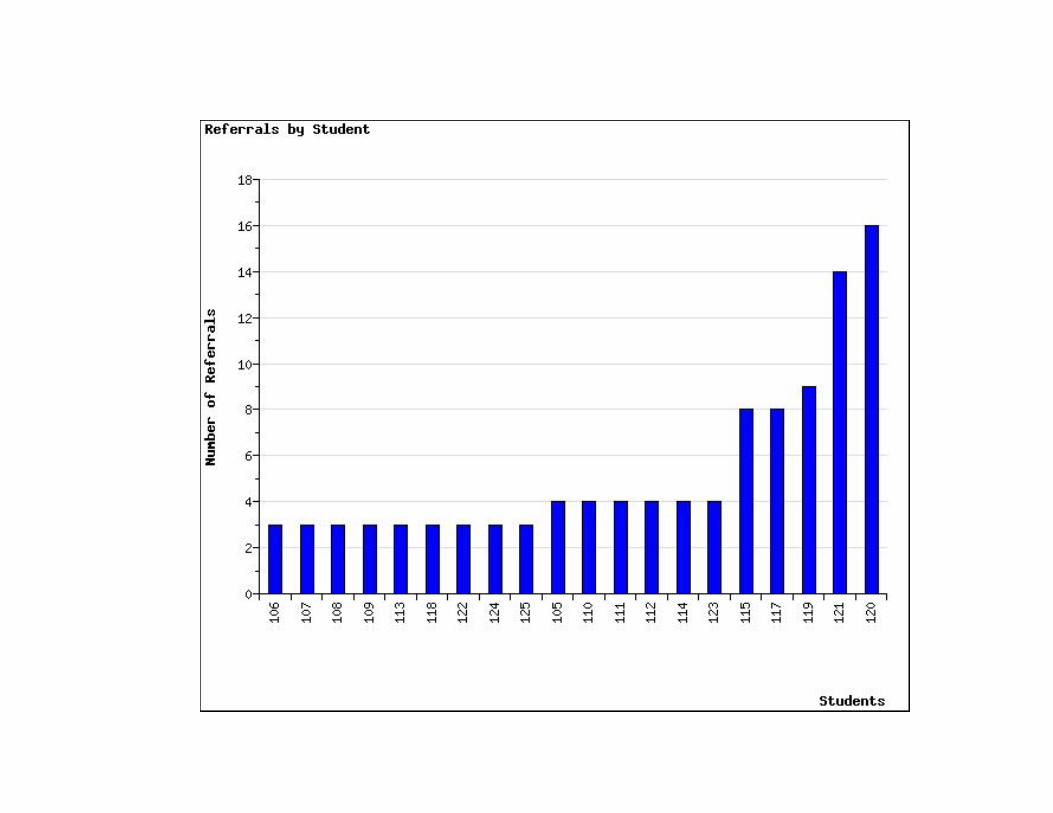
Questions to ask about Referrals by Student
Questions to ask about Referrals by Student
• What proportion of students has 0-1 ODR?
• What proportion of students has 2-5 ODRs?
• What proportion of students has 6+ ODRs?
• Do we have systems of support that increase student success?
Student # 121 needs individualized support.8 students are likely candidates for some
type of Tier II support.87% of our students have received 0-1
ODR
14 students are likely candidates for some
type of Tier II support. Student #119 needs
individualized support
We have 11 students who are
likely candidates for some type of Tier II
support93% of our students
have received no more than one ODR
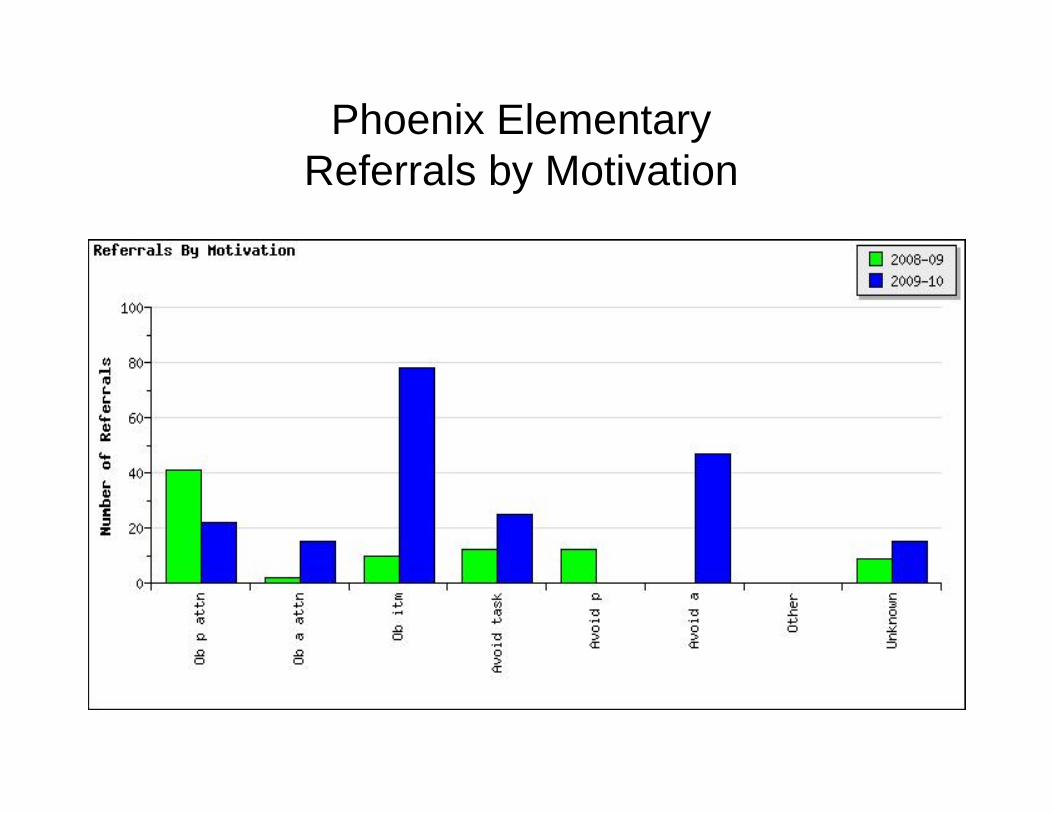
Questions to ask about Referrals by Perceived Motivation
Questions to ask about Referrals by Perceived Motivation
• What is perceived as maintaining the problem behavior?
• Are there one or more perceptions?
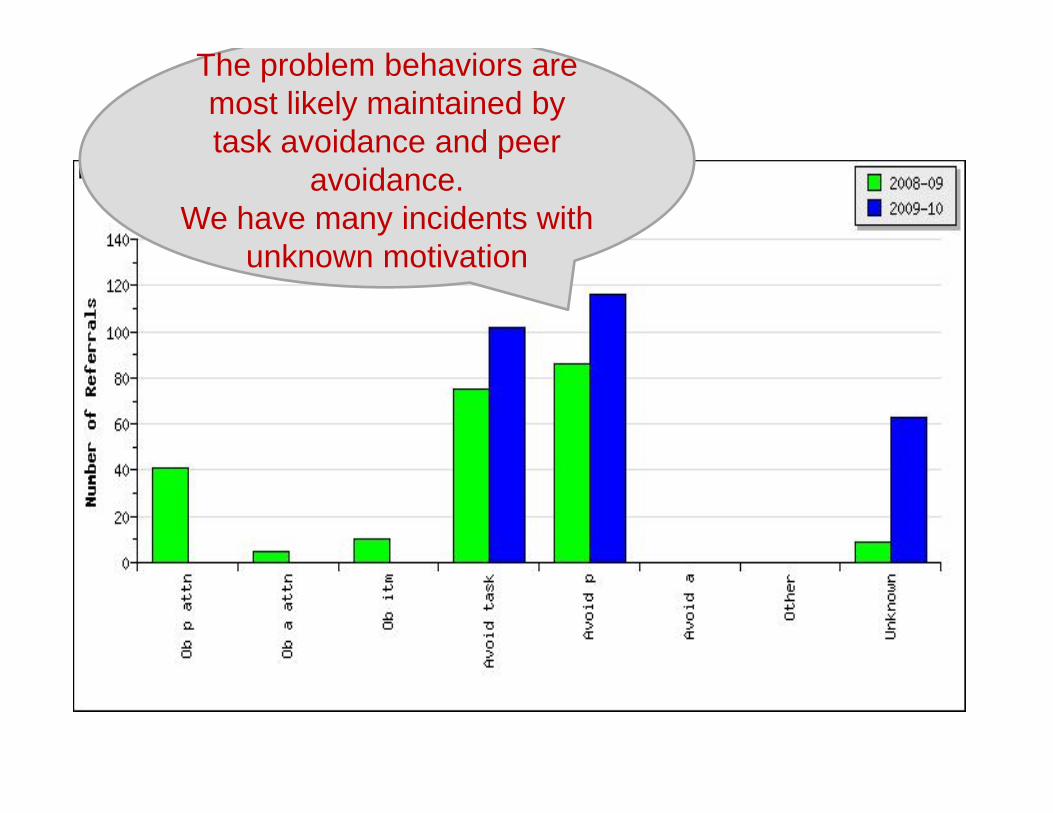
The problem behaviors are most likely maintained by task avoidance and peer
avoidance.We have many incidents with
unknown motivation
Problem behaviors appear to be maintained by peer
and adult attention
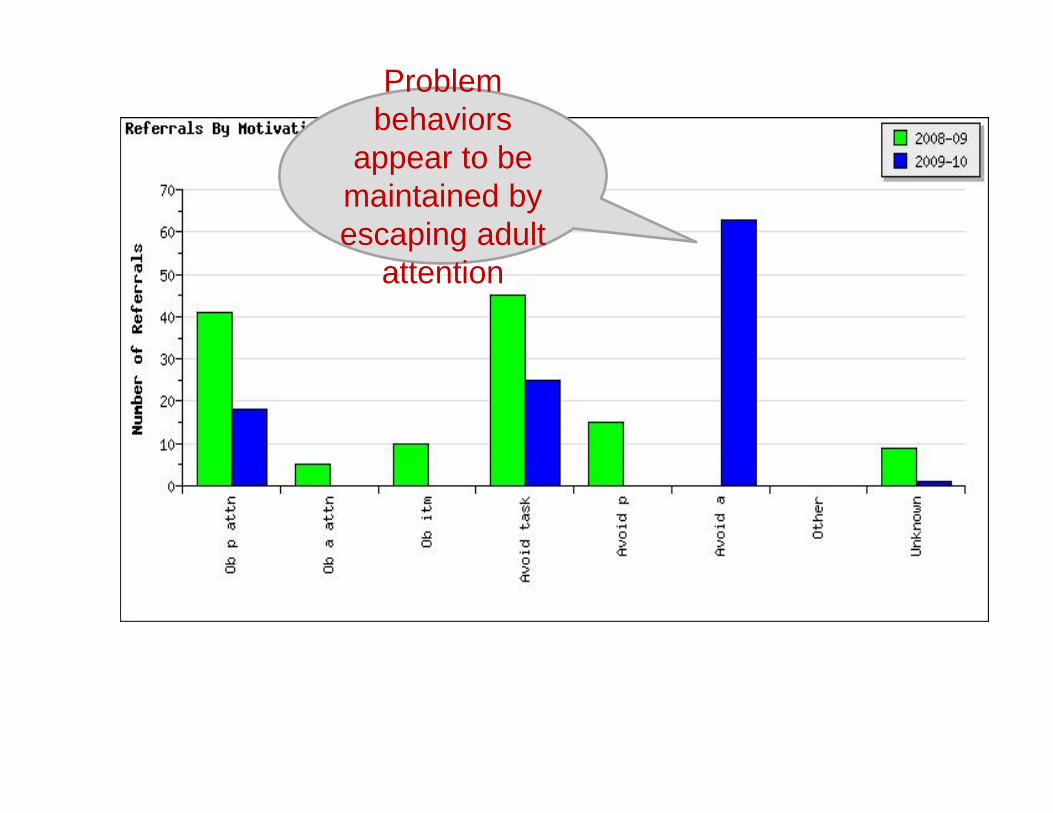
Problem behaviors
appear to be maintained by escaping adult
attention
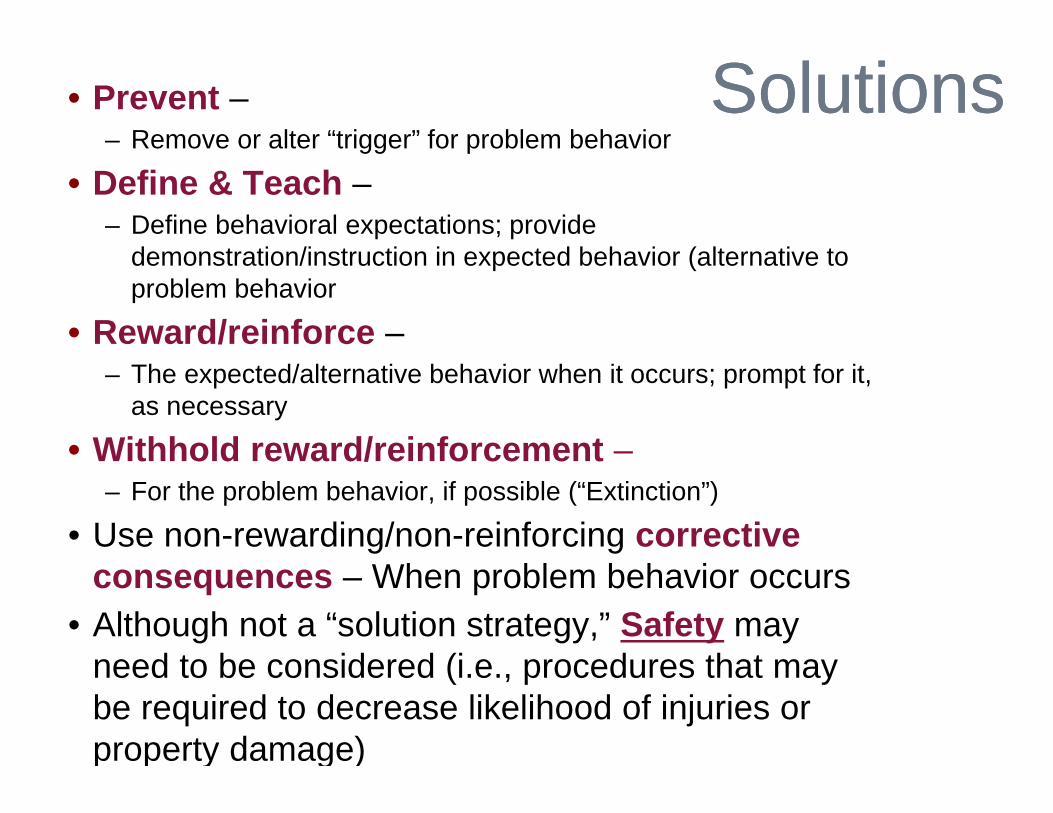
Solutions Solutions • Prevent –– Remove or alter “trigger” for problem behavior
• Define & Teach –– Define behavioral expectations; provide
demonstration/instruction in expected behavior (alternative to problem behavior
• Reward/reinforce –– The expected/alternative behavior when it occurs; prompt for it,
as necessary
• Withhold reward/reinforcement –– For the problem behavior, if possible (“Extinction”)
• Use non-rewarding/non-reinforcing correctiveconsequences – When problem behavior occurs
• Although not a “solution strategy,” Safety may need to be considered (i.e., procedures that may be required to decrease likelihood of injuries or property damage)
68
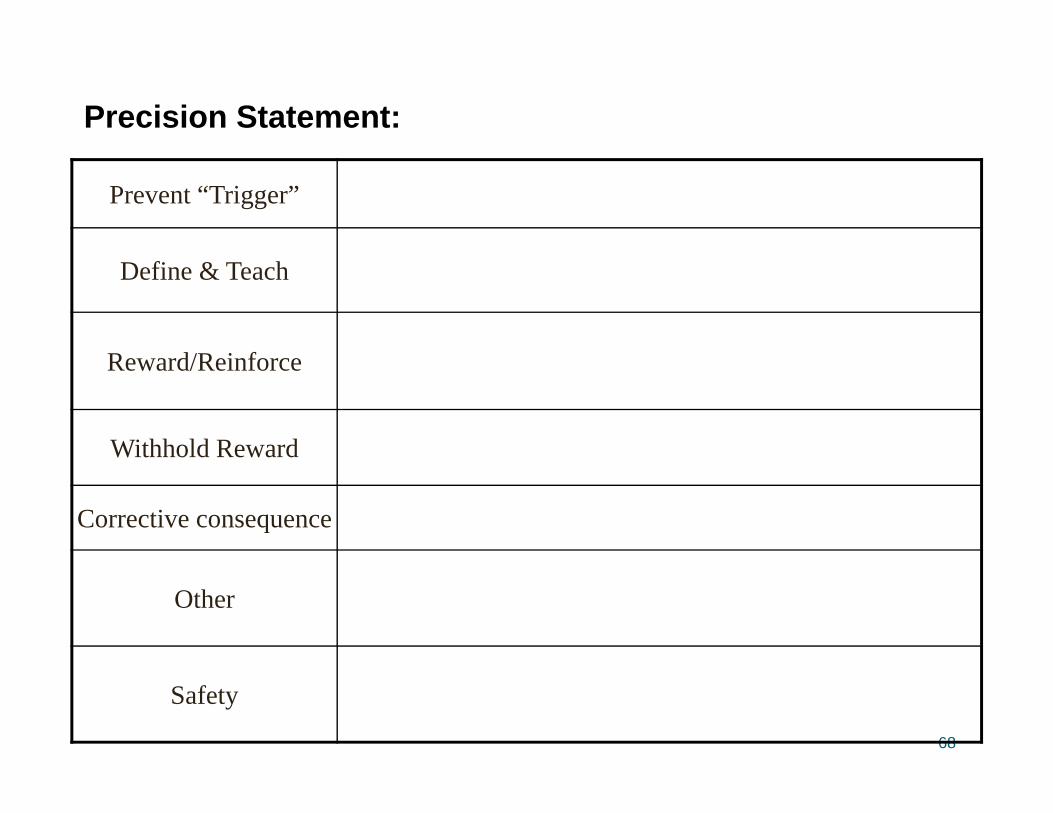
Prevent “Trigger”
Define & Teach
Reward/Reinforce
Withhold Reward
Corrective consequence
Other
Safety
Precision Statement:
Implementing SolutionsImplementing Solutions
• Who is going to do it?
• When will they do it?
• Minute Taker writes this information down,facilitator follows up at next meeting on status of implementation
Evaluating SolutionsEvaluating Solutions• Define the goal for solving the problem
• What will ‘it’ look like when you say it is not a problem
• Define how you will know that the solutions were implemented as planned (with fidelity)?
• How often will you conduct a status review?
• Define how you will know that the solutions had a positive effect on student achievement, social competence, and/or safety?
• How often will you monitor student progress?
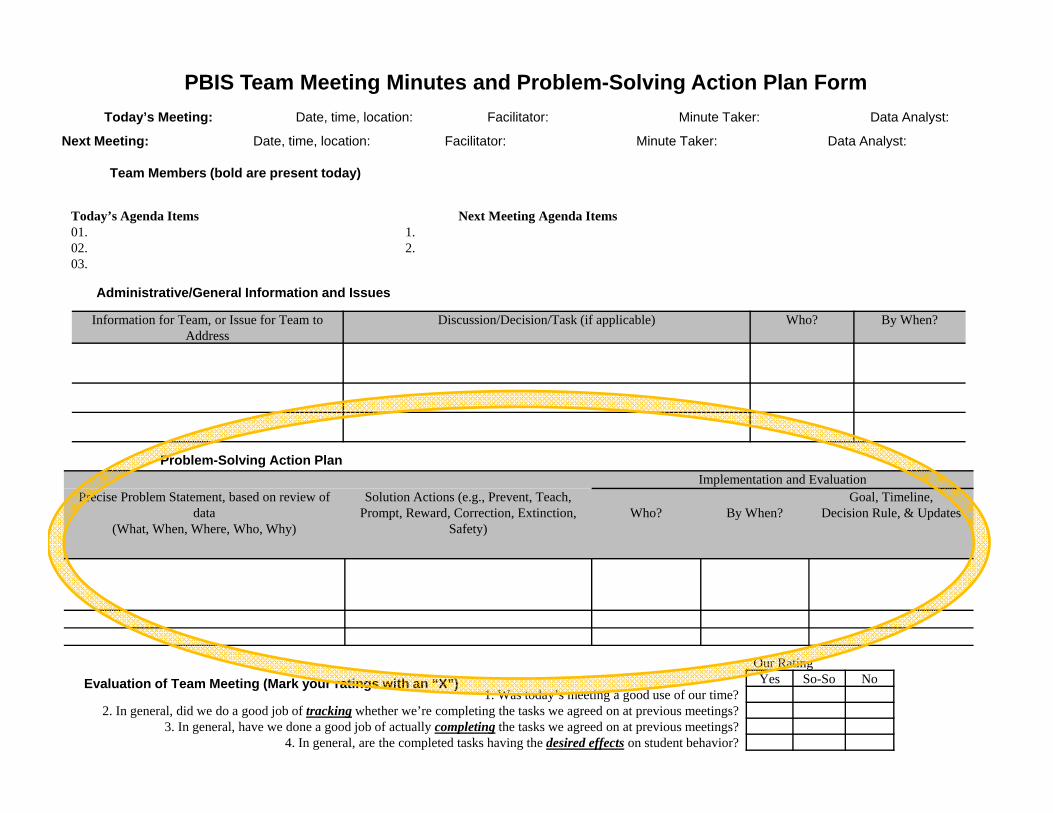
PBIS Team Meeting Minutes and Problem-Solving Action Plan FormToday’s Meeting: Date, time, location: Facilitator: Minute Taker: Data Analyst:
Next Meeting: Date, time, location: Facilitator: Minute Taker: Data Analyst:
Team Members (bold are present today)
Today’s Agenda Items Next Meeting Agenda Items01. 02. 03.
1.2.
Information for Team, or Issue for Team to Address
Discussion/Decision/Task (if applicable) Who? By When?
Administrative/General Information and Issues
Implementation and EvaluationPrecise Problem Statement, based on review of
1. Was today’s meeting a good use of our time?2. In general, did we do a good job of tracking whether we’re completing the tasks we agreed on at previous meetings?
3. In general, have we done a good job of actually completing the tasks we agreed on at previous meetings?4. In general, are the completed tasks having the desired effects on student behavior?
Evaluation of Team Meeting (Mark your ratings with an “X”)
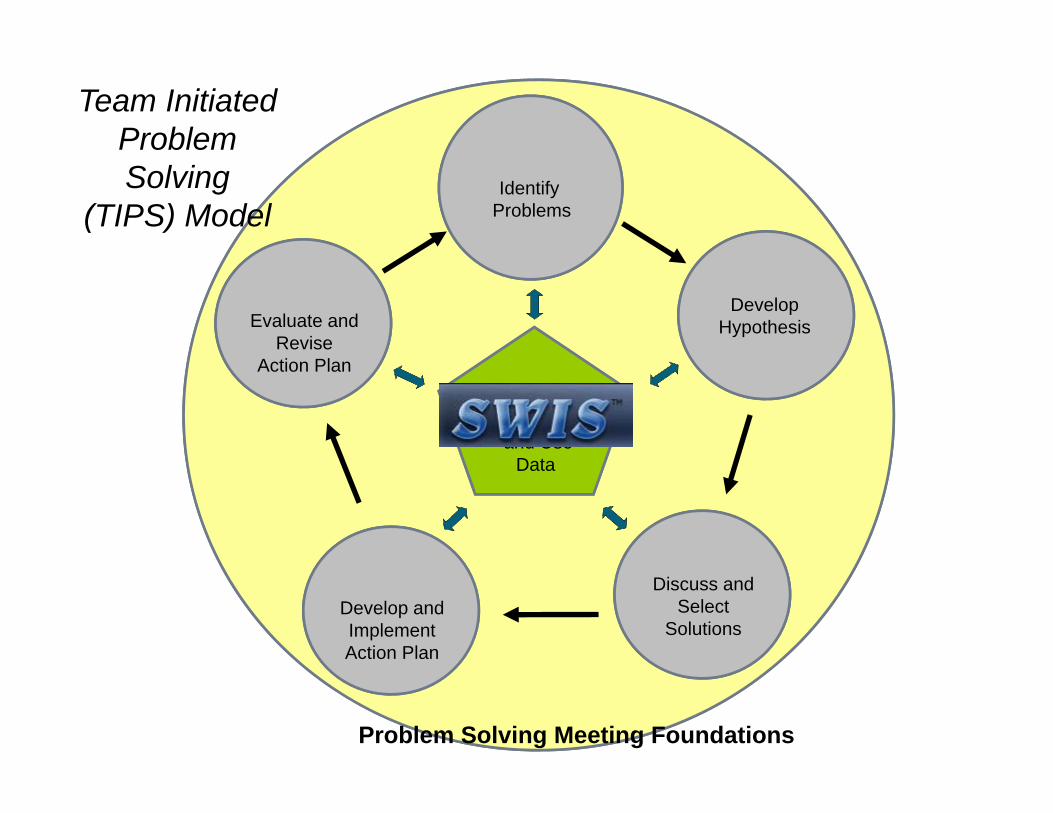
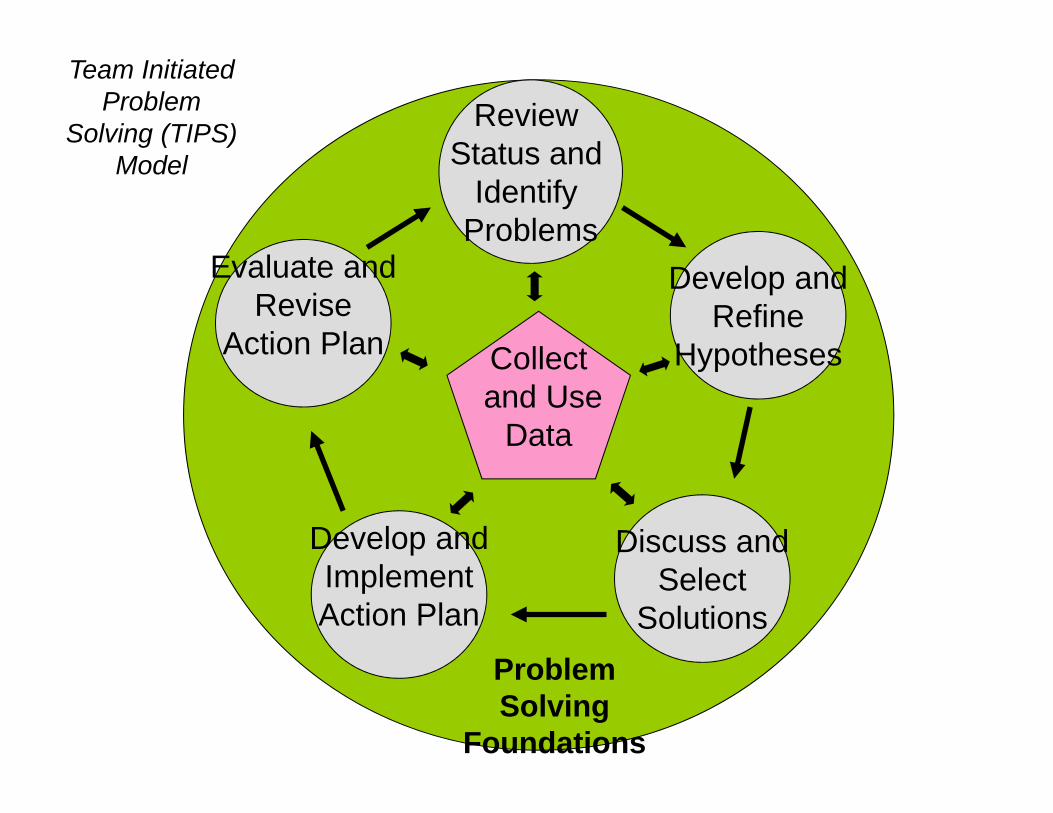
Collectand Use
Data
Review Status and
Identify Problems
Develop andRefine
Hypotheses
Discuss andSelect
Solutions
Develop andImplementAction Plan
Evaluate andRevise
Action Plan
Problem Solving
Foundations
Team Initiated Problem
Solving (TIPS) Model
Trevor Test Middle School
Trevor Test Middle School
565 students
Grades 6,7,8
0
5
10
15
20
Ave
Ref
erra
ls p
er D
ay
Sept Oct Nov Dec Jan Feb Mar Apr May Jun
School Months
Office Referrals per Day per MonthThis Year
0
10
20
30
40
50
Num
ber o
f Ref
erra
ls
Lang Achol Arson Bomb Combs Defian Disrupt Dress Agg/fgt Theft Harass Prop D Skip Tardy Tobac Vand Weap
Types of Problem Behavior
Referrals per Prob Behavior
0
20
40
60
80
Num
ber o
f Offi
ce R
efer
rals
Bath R Bus A Bus Caf Class Comm Gym Hall Libr Play G Spec Other
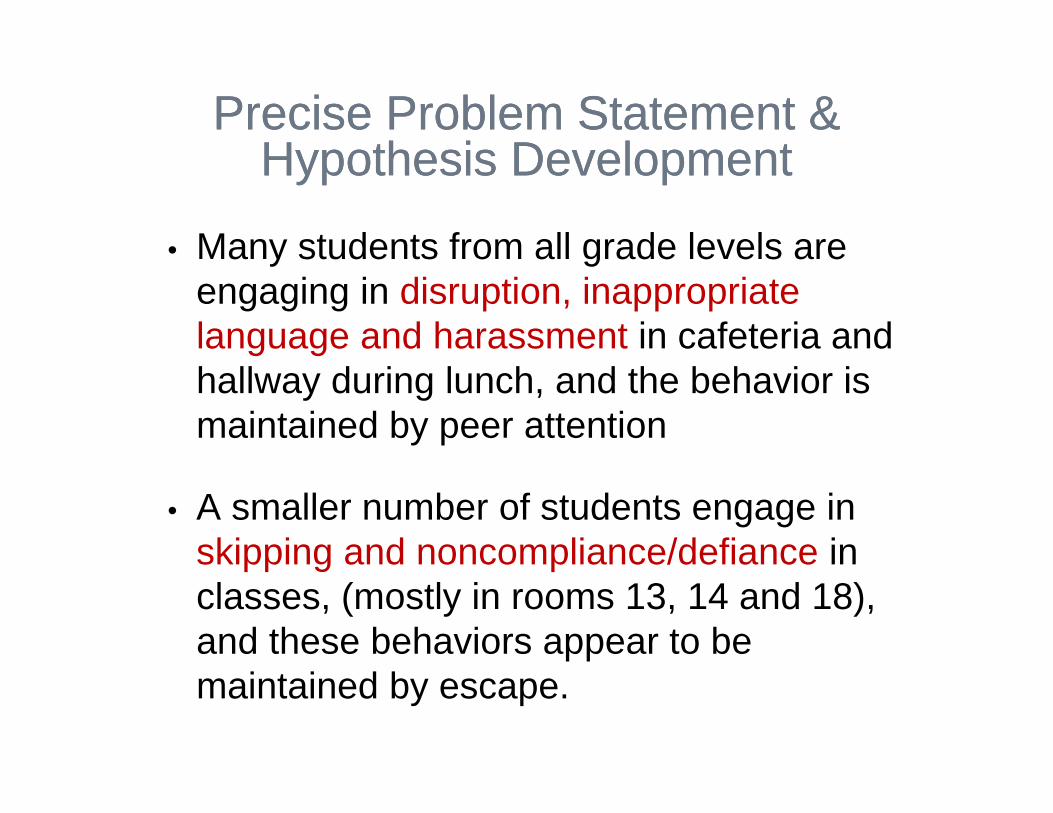
• Many students from all grade levels are engaging in disruption, inappropriate language and harassment in cafeteria and hallway during lunch, and the behavior is maintained by peer attention
• A smaller number of students engage in skipping and noncompliance/defiance in classes, (mostly in rooms 13, 14 and 18), and these behaviors appear to be maintained by escape.
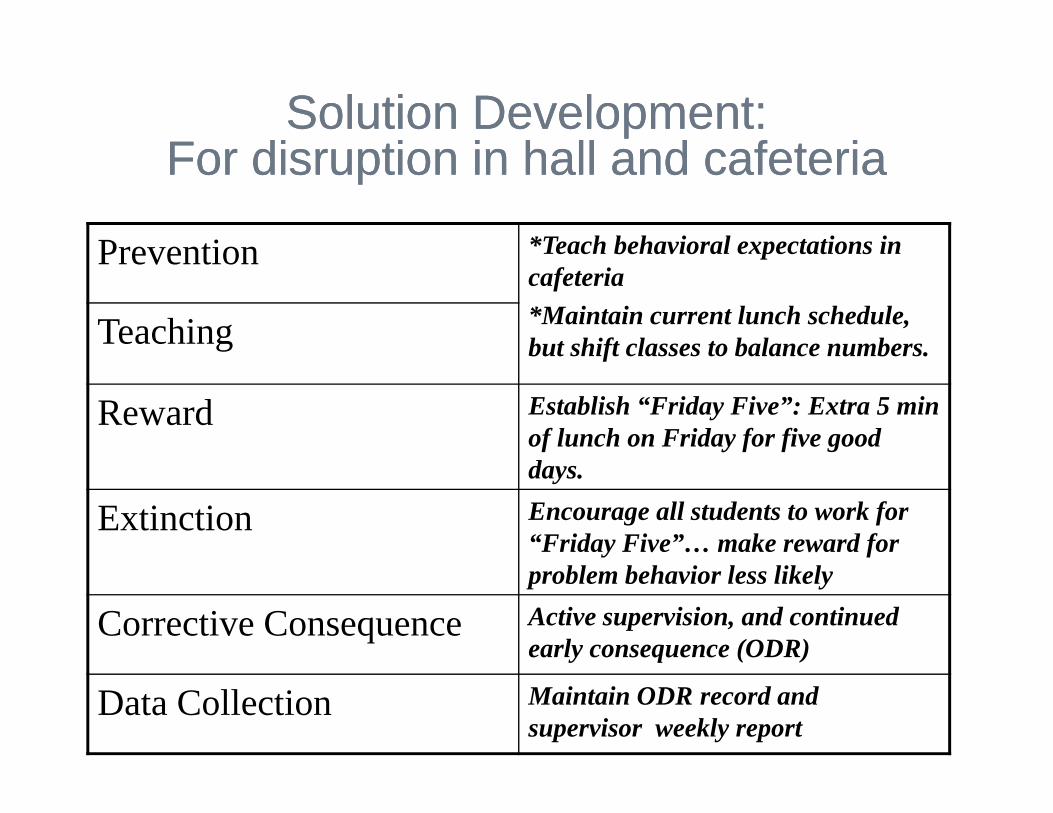
Solution Development:For disruption in hall and cafeteria
Solution Development:For disruption in hall and cafeteria
Prevention *Teach behavioral expectations in cafeteria*Maintain current lunch schedule, but shift classes to balance numbers.Teaching
Reward Establish “Friday Five”: Extra 5 min of lunch on Friday for five good days.
Extinction Encourage all students to work for “Friday Five”… make reward for problem behavior less likely
Corrective Consequence Active supervision, and continued early consequence (ODR)
Data Collection Maintain ODR record and supervisor weekly report
PBIS Team Meeting Minutes and Problem-Solving Action Plan FormToday’s Meeting: Date, time, location: Facilitator: Minute Taker: Data Analyst:
Next Meeting: Date, time, location: Facilitator: Minute Taker: Data Analyst:
Team Members (bold are present today)
Today’s Agenda Items Next Meeting Agenda Items01. 02. 03.
1.2.
Information for Team, or Issue for Team to Address
Discussion/Decision/Task (if applicable) Who? By When?
Administrative/General Information and Issues
Implementation and EvaluationPrecise Problem Statement, based on review of
1. Was today’s meeting a good use of our time?2. In general, did we do a good job of tracking whether we’re completing the tasks we agreed on at previous meetings?
3. In general, have we done a good job of actually completing the tasks we agreed on at previous meetings?4. In general, are the completed tasks having the desired effects on student behavior?
Evaluation of Team Meeting (Mark your ratings with an “X”)
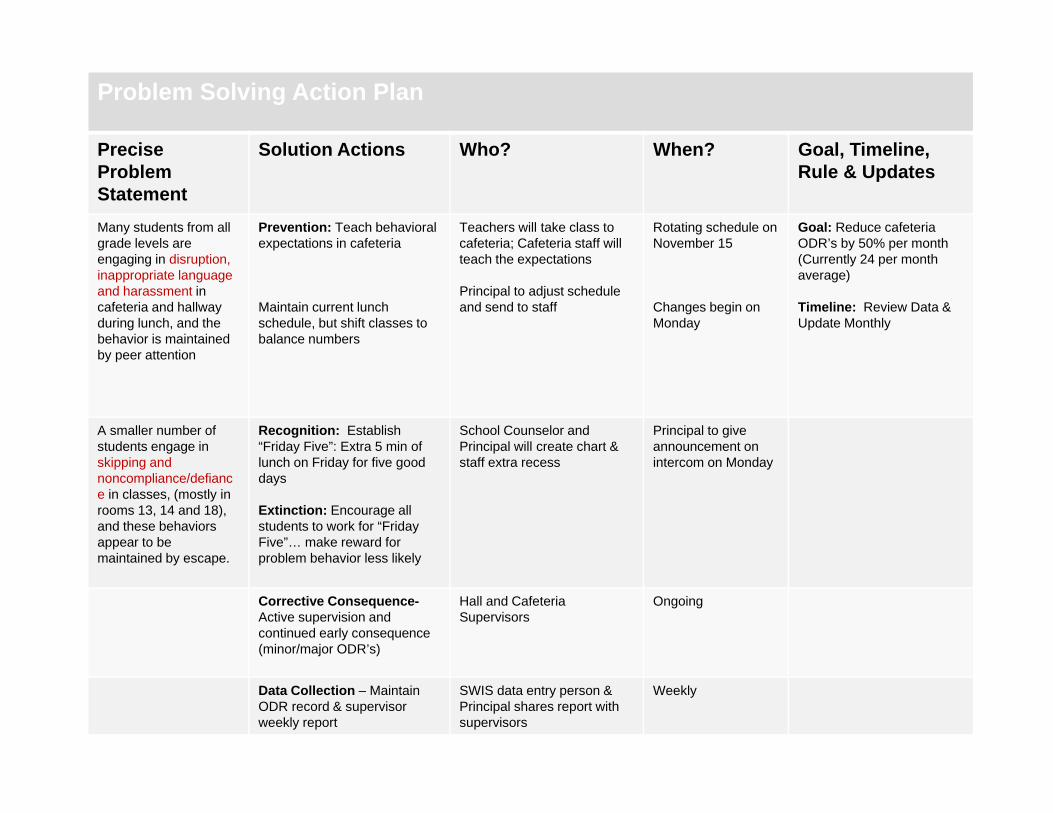
Many students from all grade levels are engaging in disruption, inappropriate language and harassment in cafeteria and hallway during lunch, and the behavior is maintained by peer attention
Prevention: Teach behavioral expectations in cafeteria
Maintain current lunch schedule, but shift classes to balance numbers
Teachers will take class to cafeteria; Cafeteria staff will teach the expectations
Principal to adjust schedule and send to staff
Rotating schedule on November 15
Changes begin on Monday
Goal: Reduce cafeteria ODR’s by 50% per month (Currently 24 per month average)
Timeline: Review Data & Update Monthly
A smaller number of students engage in skipping and noncompliance/defiance in classes, (mostly in rooms 13, 14 and 18), and these behaviors appear to be maintained by escape.
Recognition: Establish“Friday Five”: Extra 5 min of lunch on Friday for five good days
Extinction: Encourage all students to work for “Friday Five”… make reward for problem behavior less likely
School Counselor and Principal will create chart & staff extra recess
Principal to give announcement on intercom on Monday
Corrective Consequence-Active supervision and continued early consequence (minor/major ODR’s)
Hall and Cafeteria Supervisors
Ongoing
Data Collection – Maintain ODR record & supervisor weekly report
SWIS data entry person & Principal shares report with supervisors
Weekly
SimulationsSimulations
• Phoenix Elementary
PHOENIX ELEMENTARYPHOENIX ELEMENTARY265 Students K-5
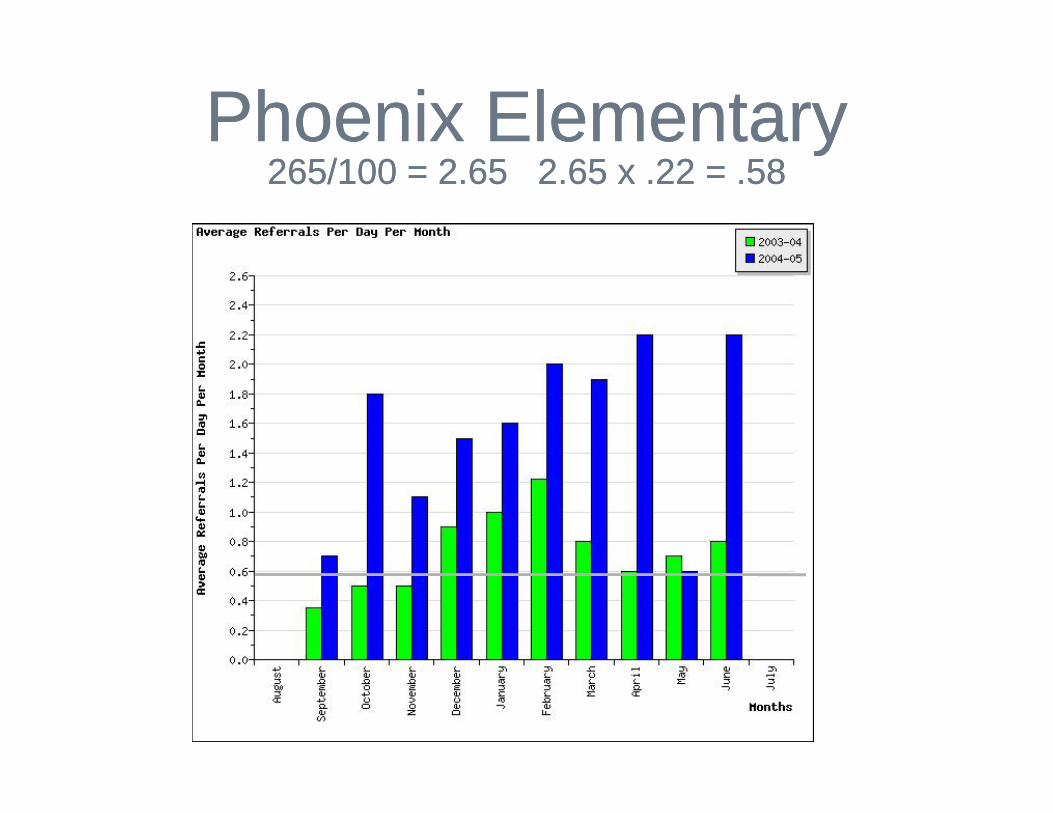
Phoenix Elementary265/100 = 2.65 2.65 x .22 = .58
Phoenix Elementary265/100 = 2.65 2.65 x .22 = .58
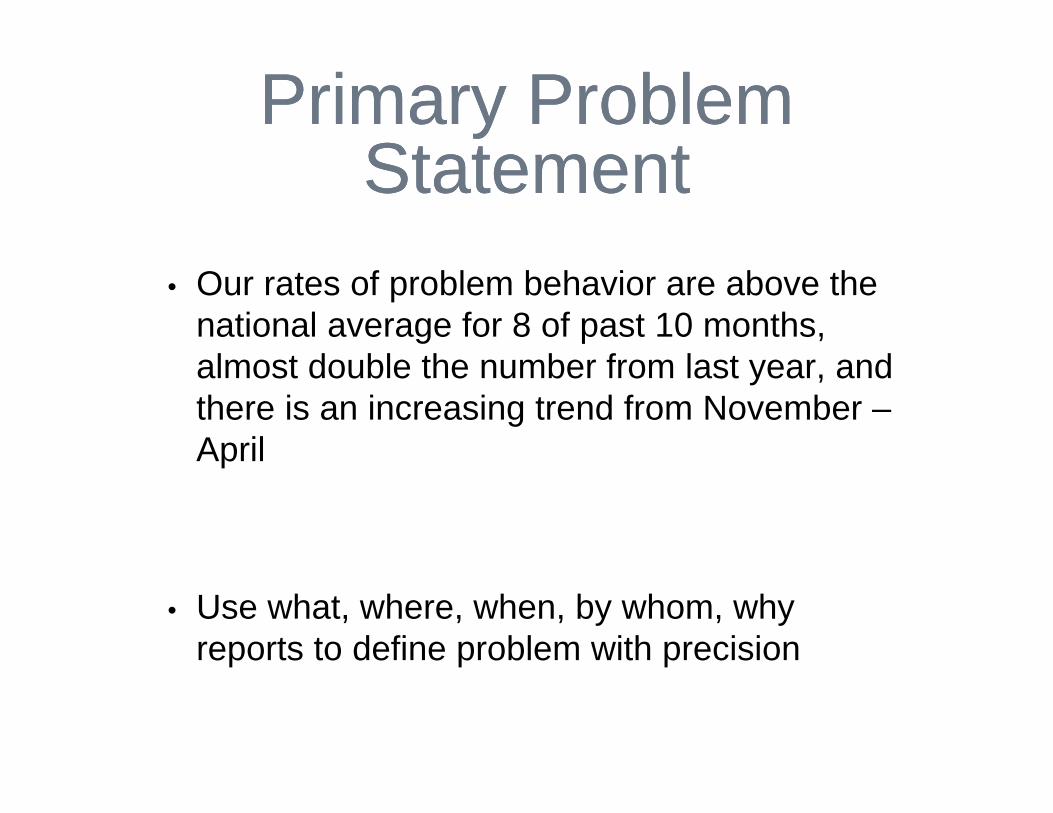
• Our rates of problem behavior are above the national average for 8 of past 10 months, almost double the number from last year, and there is an increasing trend from November –April
• Use what, where, when, by whom, why reports to define problem with precision
Primary Problem Statement
Primary Problem Statement
Phoenix Elementary Problem BehaviorsPhoenix Elementary Problem Behaviors
Phoenix ElementaryLocations
Phoenix ElementaryLocations
Year OneYear Two
Phoenix Elementary - TimePhoenix Elementary - Time
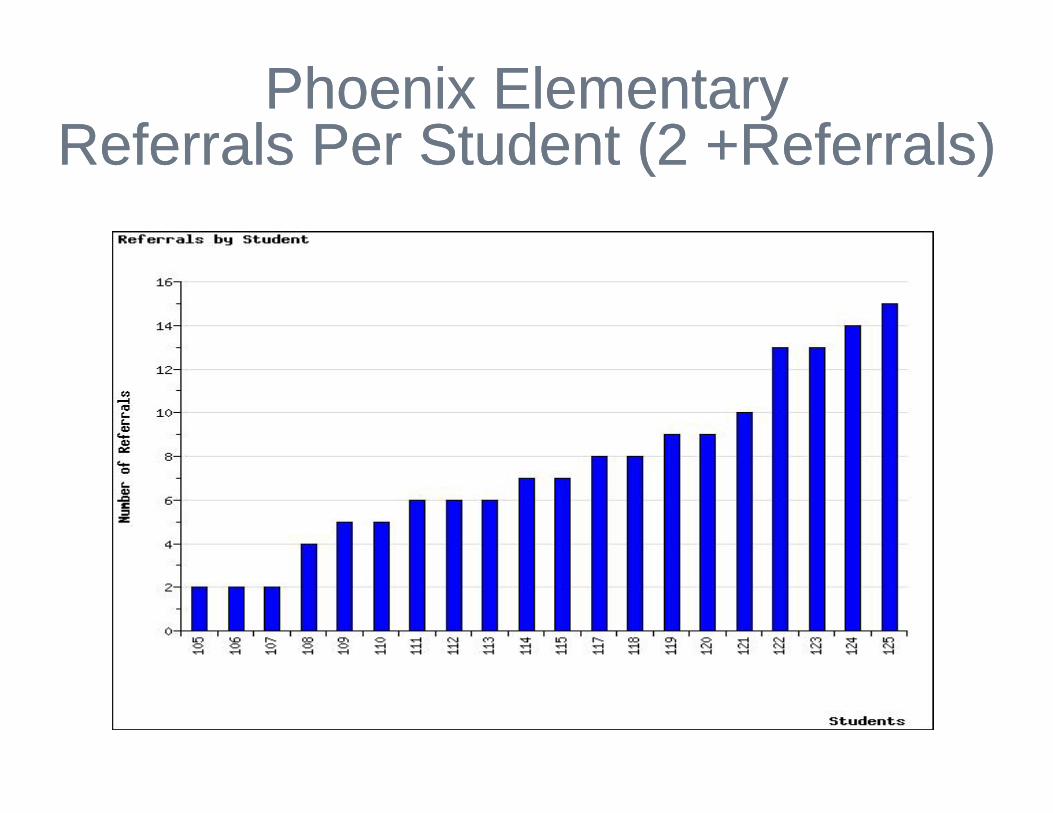
Phoenix ElementaryReferrals Per Student (2 +Referrals)
Phoenix ElementaryReferrals Per Student (2 +Referrals)
Phoenix ElementaryReferrals by Motivation
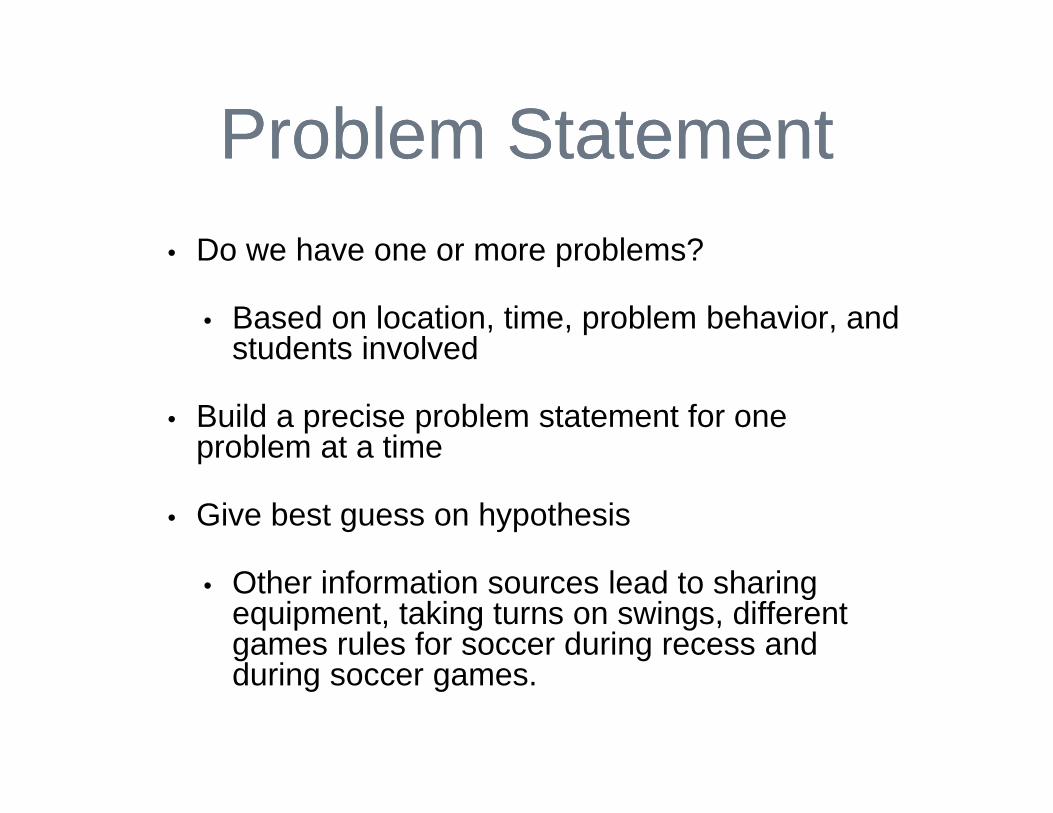
• Do we have one or more problems?
• Based on location, time, problem behavior, and students involved
• Build a precise problem statement for one problem at a time
• Give best guess on hypothesis
• Other information sources lead to sharing equipment, taking turns on swings, different games rules for soccer during recess and during soccer games.
Problem StatementProblem Statement
1. We have high rates of physical aggression, disrespect and inappropriate language on the playground at 10:00, 10:15, 12:15, 12:30, 1:45 & 2:00. Many students are involved and it appears that students are trying to get access to equipment/games.
2. We have lower rates of disruption and disrespect in classrooms throughout the day with many students, some of whom are also having problems on the playground. Problems are occurring with grades 3-5 students
Precision StatementsPrecision Statements
Solution Development problem statement & hypothesis: We have high rates of physical aggression, disrespect and inappropriate language on the playground at 10:00, 10:15, 12:15, 12:30, 1:45 & 2:00.
Many students are involved and it appears that students are trying to get access to equipment/games.
Solution Development problem statement & hypothesis: We have high rates of physical aggression, disrespect and inappropriate language on the playground at 10:00, 10:15, 12:15, 12:30, 1:45 & 2:00.
Many students are involved and it appears that students are trying to get access to equipment/games.
Prevention
Teaching
Reward
Extinction
Corrective Consequence
Safety
PBIS Team Meeting Minutes and Problem-Solving Action Plan FormToday’s Meeting: Date, time, location: Facilitator: Minute Taker: Data Analyst:
Next Meeting: Date, time, location: Facilitator: Minute Taker: Data Analyst:
Team Members (bold are present today)
Today’s Agenda Items Next Meeting Agenda Items01. 02. 03.
1.2.
Information for Team, or Issue for Team to Address
Discussion/Decision/Task (if applicable) Who? By When?
Administrative/General Information and Issues
Implementation and EvaluationPrecise Problem Statement, based on review of
1. Was today’s meeting a good use of our time?2. In general, did we do a good job of tracking whether we’re completing the tasks we agreed on at previous meetings?
3. In general, have we done a good job of actually completing the tasks we agreed on at previous meetings?4. In general, are the completed tasks having the desired effects on student behavior?
Evaluation of Team Meeting (Mark your ratings with an “X”)
Implementation and EvaluationPrecise Problem Statement, based on review of
We have high rates of physicalAggression disrespect andinappropriate language onthe playground at 10:00, 10:15,12:15,12:30,1:45 & 2:00. Manystudents are involved and itappears that students are tryingto get access toequipment/games.
Goal: decrease frequency of physical aggression, disrespect & inapp. Lang. on playground to no more than 6 per month by end of school year
Review SWIS reports monthly
Check in at staff meeting on implantation status (monthly)
We have lower rates of disruption& disrespect in classroomsthroughout the day with manystudents, some of whom are alsohaving problems on theplayground. Problems areoccurring with grades 3-5students
Goal: define at next meeting
Review SWIS reports monthly
Check in at staff meeting on implantation status (monthly)
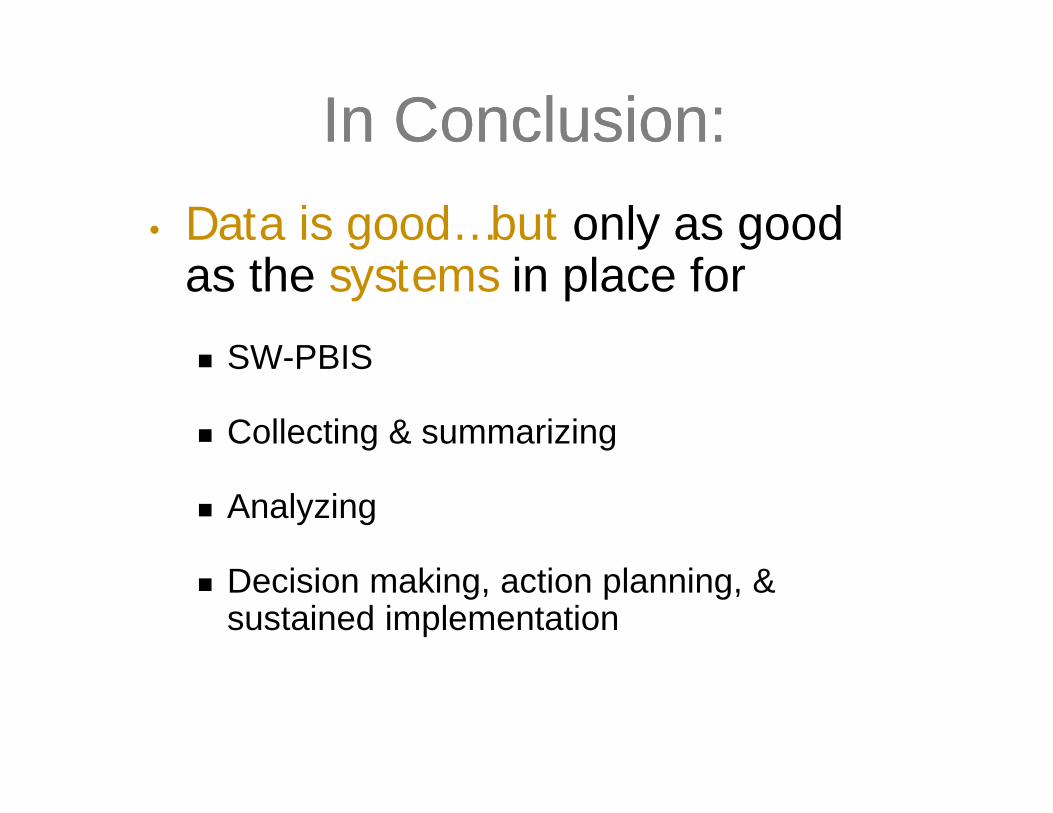
In Conclusion: In Conclusion: • Data is good…but only as good