27
TREND FOLLOWING Applied to Equities and ETFs March 2015 – New York Riccardo Ronco +44 20 7233 3245 [email protected]
| Date post: | 17-Aug-2015 |
| Category: |
Documents |
| Upload: | riccardo-ronco-cfte |
| View: | 45 times |
| Download: | 2 times |

TREND FOLLOWING
Applied to Equities and ETFs
March 2015 – New York
Riccardo Ronco +44 20 7233 3245 [email protected]

Riccardo Ronco, CFTe Biography
Riccardo Ronco +44 20 7233 3245 [email protected] 2
Riccardo Ronco is the head of technical analysis at Aviate Global in London. Mr. Ronco follows large- and mid-cap European and U.S. equities, paying attention to domestic and foreign equity indices, currencies, commodities, and interest rates. As a medium-term trend follower, his approach is strongly quantitative in nature; particular attention, however, is devoted to identifying reversal patterns characterized by excessive consensus among investors. Mr. Ronco brings more than 15 years of experience in trading, quantitative analysis, and teaching technical analysis in the United Kingdom and Italy. Prior to joining Aviate Global in April 2010, Mr. Ronco worked for Credit Agricole Indosuez, Banca Intesa Group, and Banca AntonVeneta (MontePaschi Group) and FBR Capital Markets. He is a frequent guest on CNBC Europe and other European media outlets. A member of the Society of Technical Analysts (STA) and the Market Technicians Association (MTA), Mr. Ronco was a speaker at the International Federation of Technical Analysts (IFTA) 1998 conference in Rome and Beijing (2011). His work is mentioned in the book Capital Market Revolution: The Future of Markets in an Online World by Patrick Young. Mr. Ronco received his degree (with honors) in economics from the University of Turin. He currently holds Chartered Market Technician (CMT) Level 1 and 2 diplomas.

Emotional = Irrational
Riccardo Ronco +44 20 7233 3245 [email protected] 4
•Investors tend to make emotional decisions about their money, chasing performance... •Investors are everything but rational: Hope, Greed, Fear, Despair “investing” cycle

Behavioral Basis for Trends
Riccardo Ronco +44 20 7233 3245 [email protected] 5
“Demystifying Managed Futures”, Hurst Ooi Pedersen
Fundamental Value
Trend starts (anchoring + under-reaction)
Trend continues (herding + over-reaction)
Trend ends (back to fundamentals)
People are prone to making SYSTEMATIC ERRORS in circumstances of uncertainty
Why Trend Following?
Riccardo Ronco +44 20 7233 3245 [email protected] 6
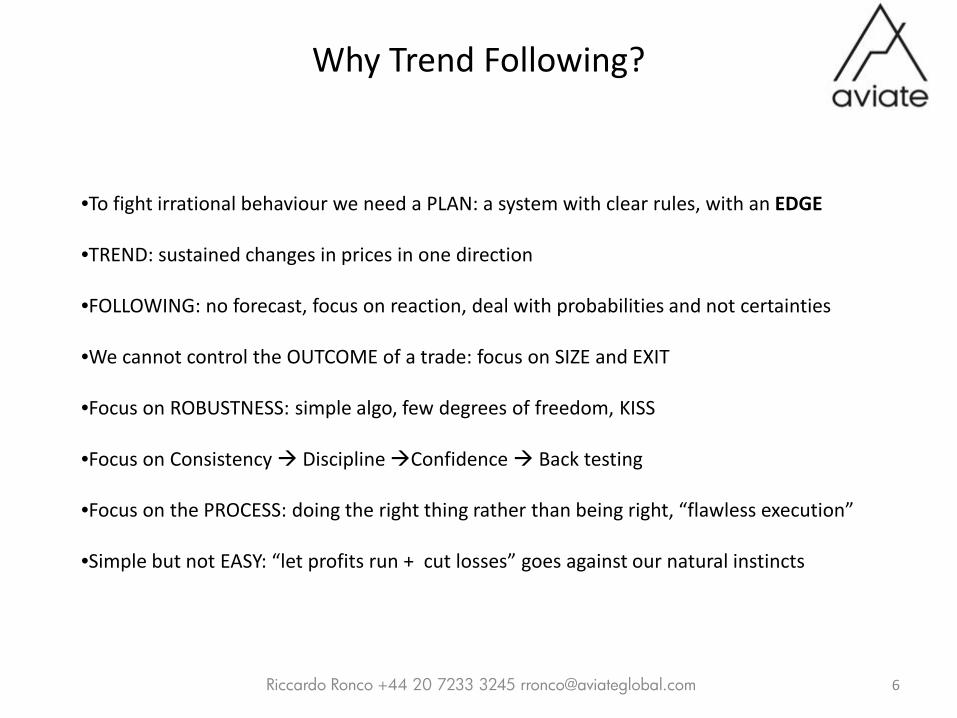
•To fight irrational behaviour we need a PLAN: a system with clear rules, with an EDGE
•TREND: sustained changes in prices in one direction
•FOLLOWING: no forecast, focus on reaction, deal with probabilities and not certainties
•We cannot control the OUTCOME of a trade: focus on SIZE and EXIT
•Focus on ROBUSTNESS: simple algo, few degrees of freedom, KISS
•Focus on Consistency Discipline Confidence Back testing
•Focus on the PROCESS: doing the right thing rather than being right, “flawless execution”
•Simple but not EASY: “let profits run + cut losses” goes against our natural instincts

From David Ricardo (1772-1823) to Ed Seykota
Riccardo Ronco +44 20 7233 3245 [email protected] 7
“The Great Metropolis”, Vol II, 1838, James Grant

Trend Following Wisdom
8 18 March 2015 Riccardo Ronco +44 20 7233 3245 [email protected]
"A loss never bothers me after I take it, I forget if overnight. But being wrong, not taking the loss - that is what does
damage to the pocket book and to the soul.“ Jesse Livermore
“After spending many years in Wall Street and after making and losing millions of dollars I want to tell you this: it never was my thinking that made the big money for me. It was always my sitting.”
Jesse Livermore

An Edge to avoid Outcome Bias
9 Riccardo Ronco +44 20 7233 3245 [email protected]
Expectation = (%W x AW) – (%L x AL) Where: %W = Winning Percent AW = Average Winner %L = Losing Percent or (1 - %W) AL = Average Loser For Expectation = 0 we have the “Breakeven Line” curve
Y = (1 – X) / X hyperbola Where: Y = AW / AL (a.k.a. WIN/LOSS ratio) X = %W

Expectancy Curve – Nick Radge
10 Riccardo Ronco +44 20 7233 3245 [email protected]
0
1
2
3
4
5
6
7
8
9
10
10% 15% 20% 25% 30% 35% 40% 45% 50% 55% 60% 65% 70% 75% 80% 85% 90% 95%
WIN %
WIN
/LO
SS R
ATI
O
Profitable
Unprofitable
Breakeven Line
NR 1 TF problem: DRAWDOWNS
11 Riccardo Ronco +44 20 7233 3245 [email protected]
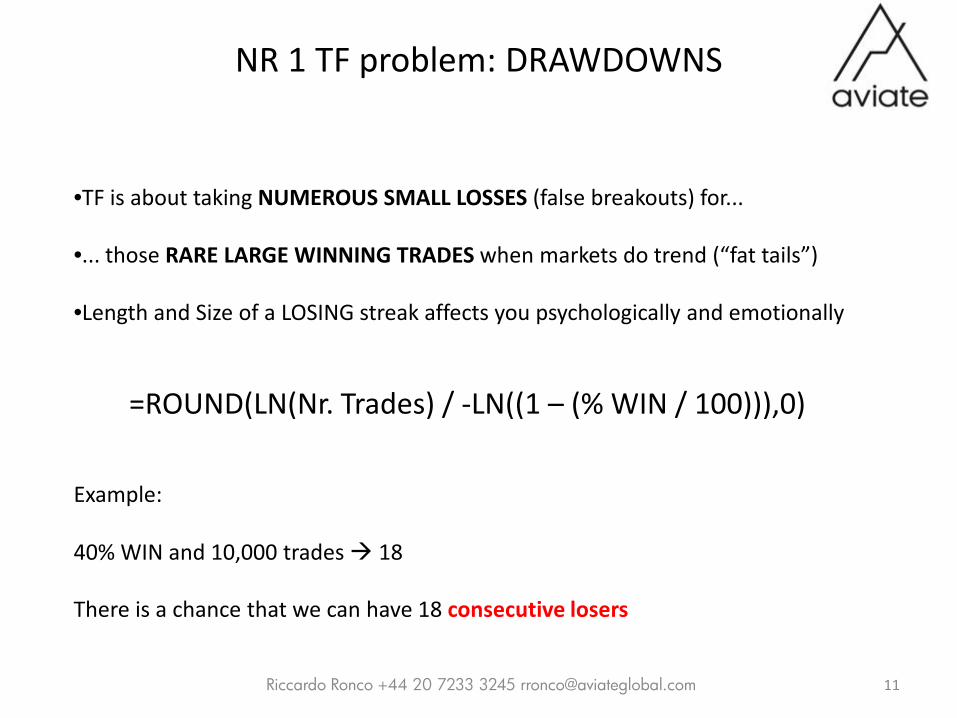
•TF is about taking NUMEROUS SMALL LOSSES (false breakouts) for...
•... those RARE LARGE WINNING TRADES when markets do trend (“fat tails”)
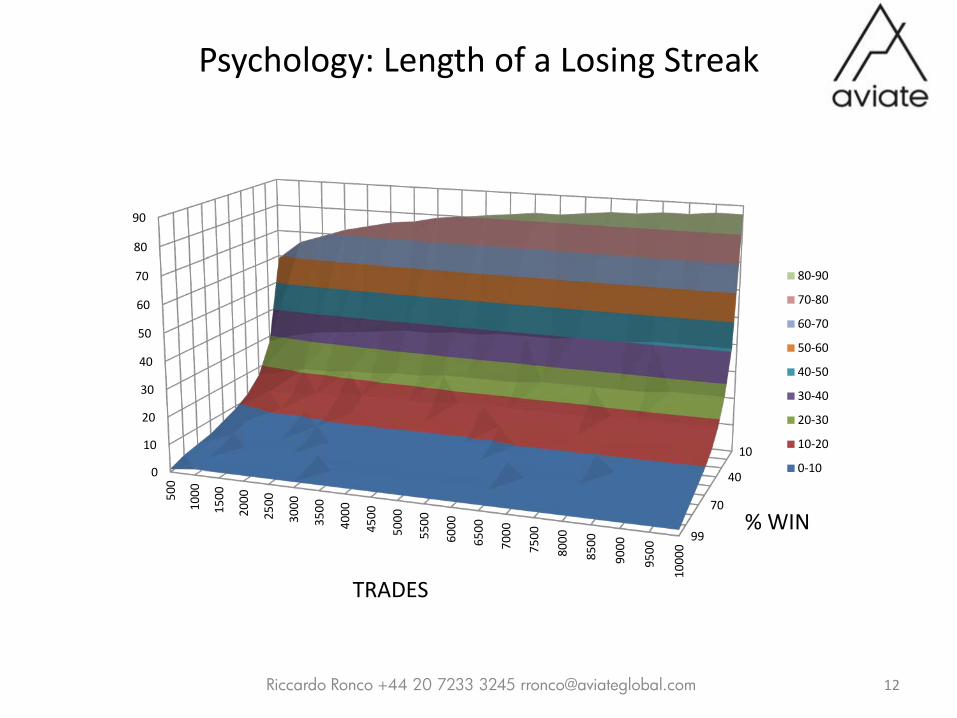
•Length and Size of a LOSING streak affects you psychologically and emotionally
=ROUND(LN(Nr. Trades) / -LN((1 – (% WIN / 100))),0) Example: 40% WIN and 10,000 trades 18 There is a chance that we can have 18 consecutive losers
Psychology: Length of a Losing Streak
12 Riccardo Ronco +44 20 7233 3245 [email protected]
10
40
70
99
0
10
20
30
40
50
60
70
80
90
500
1000
1500
2000
2500
3000
3500
4000
4500
5000
5500
6000
6500
7000
7500
8000
8500
9000
9500
1000
0
80-90
70-80
60-70
50-60
40-50
30-40
20-30
10-20
0-10
TRADES
% WIN
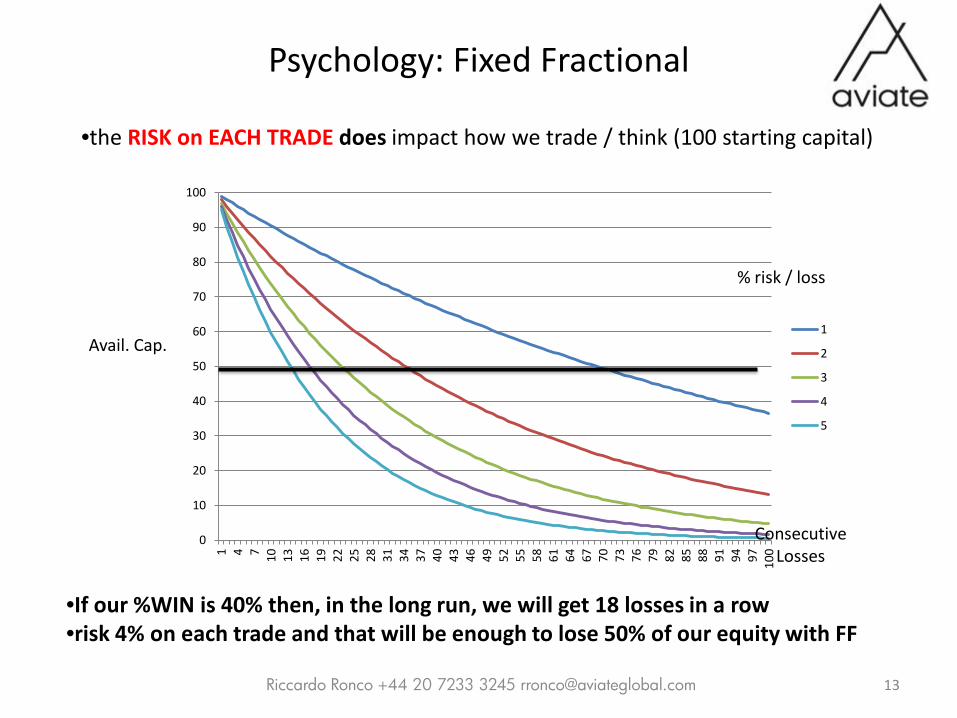
Psychology: Fixed Fractional
13 Riccardo Ronco +44 20 7233 3245 [email protected]
•the RISK on EACH TRADE does impact how we trade / think (100 starting capital)
0
10
20
30
40
50
60
70
80
90
100
1 4 7 10
13
16
19
22
25
28
31
34
37
40
43
46
49
52
55
58
61
64
67
70
73
76
79
82
85
88
91
94
97
100
1
2
3
4
5
Consecutive Losses
% risk / loss
•If our %WIN is 40% then, in the long run, we will get 18 losses in a row •risk 4% on each trade and that will be enough to lose 50% of our equity with FF
Avail. Cap.
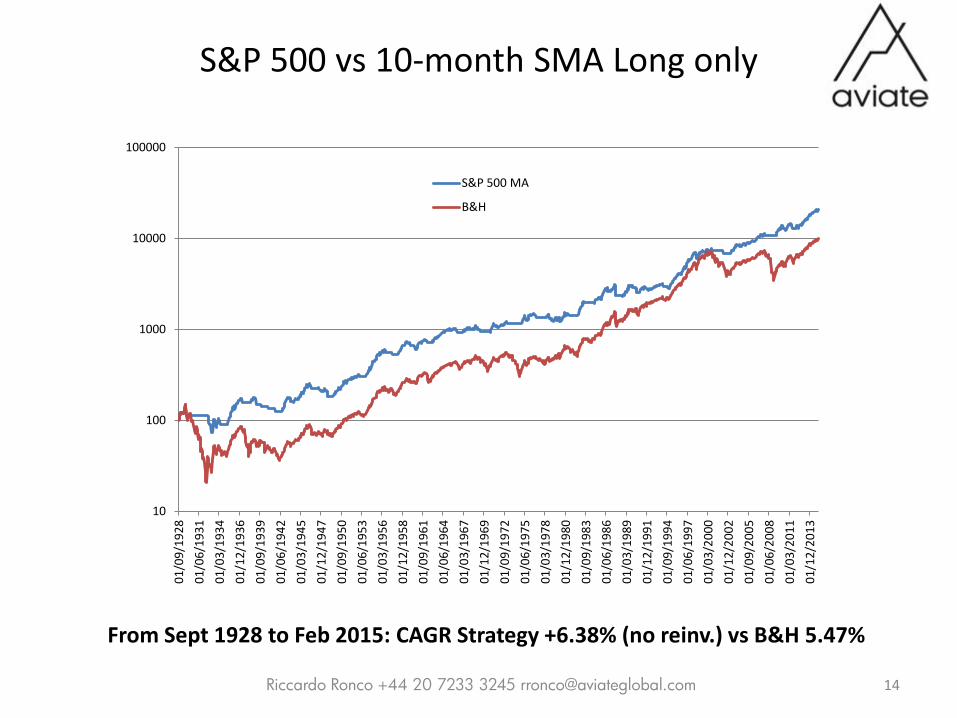
S&P 500 vs 10-month SMA Long only
Riccardo Ronco +44 20 7233 3245 [email protected] 14
From Sept 1928 to Feb 2015: CAGR Strategy +6.38% (no reinv.) vs B&H 5.47%
10
100
1000
10000
100000
01/0
9/19
28
01/0
6/19
31
01/0
3/19
34
01/1
2/19
36
01/0
9/19
39
01/0
6/19
42
01/0
3/19
45
01/1
2/19
47
01/0
9/19
50
01/0
6/19
53
01/0
3/19
56
01/1
2/19
58
01/0
9/19
61
01/0
6/19
64
01/0
3/19
67
01/1
2/19
69
01/0
9/19
72
01/0
6/19
75
01/0
3/19
78
01/1
2/19
80
01/0
9/19
83
01/0
6/19
86
01/0
3/19
89
01/1
2/19
91
01/0
9/19
94
01/0
6/19
97
01/0
3/20
00
01/1
2/20
02
01/0
9/20
05
01/0
6/20
08
01/0
3/20
11
01/1
2/20
13
S&P 500 MA
B&H
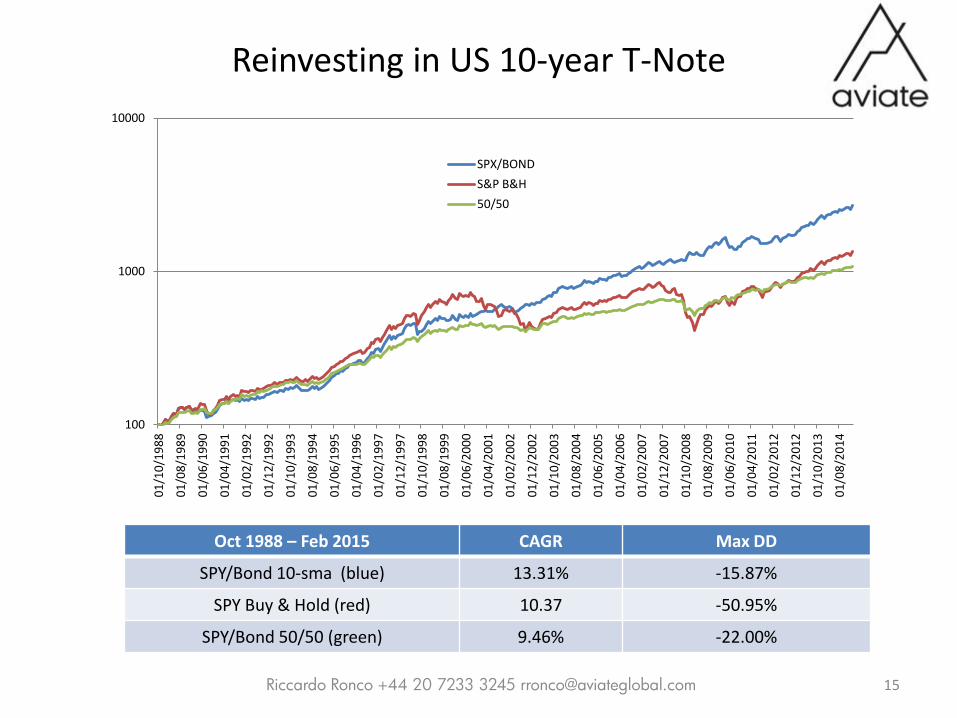
Reinvesting in US 10-year T-Note
Riccardo Ronco +44 20 7233 3245 [email protected] 15
100
1000
10000
01/1
0/19
88
01/0
8/19
89
01/0
6/19
90
01/0
4/19
91
01/0
2/19
92
01/1
2/19
92
01/1
0/19
93
01/0
8/19
94
01/0
6/19
95
01/0
4/19
96
01/0
2/19
97
01/1
2/19
97
01/1
0/19
98
01/0
8/19
99
01/0
6/20
00
01/0
4/20
01
01/0
2/20
02
01/1
2/20
02
01/1
0/20
03
01/0
8/20
04
01/0
6/20
05
01/0
4/20
06
01/0
2/20
07
01/1
2/20
07
01/1
0/20
08
01/0
8/20
09
01/0
6/20
10
01/0
4/20
11
01/0
2/20
12
01/1
2/20
12
01/1
0/20
13
01/0
8/20
14
SPX/BOND
S&P B&H
50/50
Oct 1988 – Feb 2015 CAGR Max DD
SPY/Bond 10-sma (blue) 13.31% -15.87%
SPY Buy & Hold (red) 10.37 -50.95%
SPY/Bond 50/50 (green) 9.46% -22.00%

So what is the “best” moving average?
16 Riccardo Ronco +44 20 7233 3245 [email protected]
No commissions, no taxes, no reinvestment when in cash
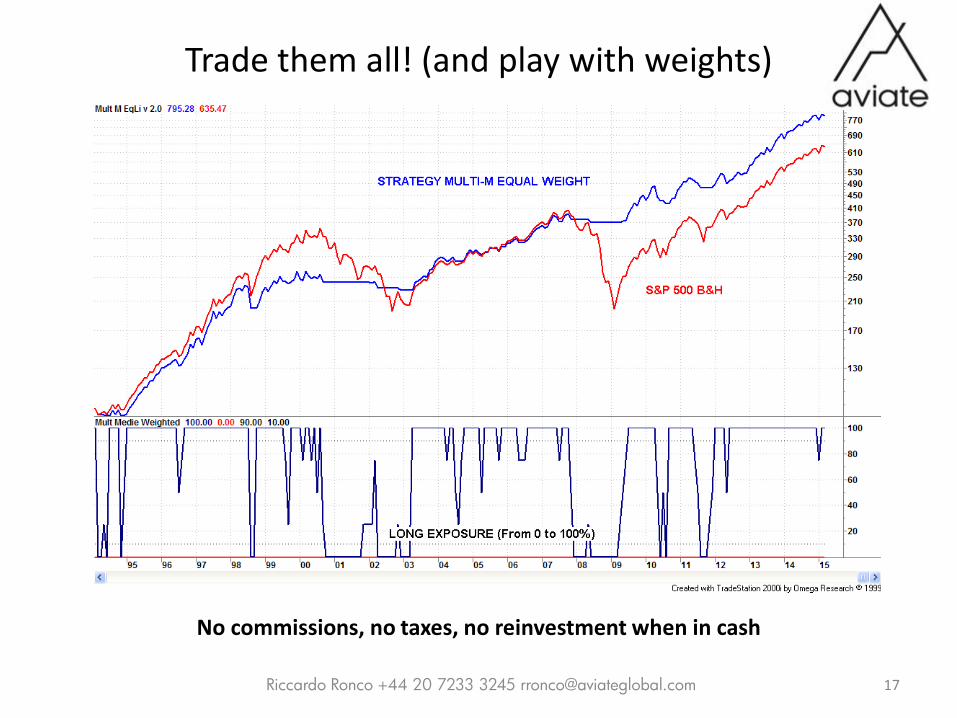
Trade them all! (and play with weights)
17 Riccardo Ronco +44 20 7233 3245 [email protected]
No commissions, no taxes, no reinvestment when in cash

From Bullish/Bearish to How MUCH Bullish...
18 Riccardo Ronco +44 20 7233 3245 [email protected]
No commissions, no taxes, no reinvestment when in cash

Mebane Faber: CTA-like using 10-month m.a.
19 Riccardo Ronco +44 20 7233 3245 [email protected] No commissions, no taxes, YES reinvestment when in cash (SHY)
100
1000
01/1
2/19
95
01/0
8/19
96
01/0
4/19
97
01/1
2/19
97
01/0
8/19
98
01/0
4/19
99
01/1
2/19
99
01/0
8/20
00
01/0
4/20
01
01/1
2/20
01
01/0
8/20
02
01/0
4/20
03
01/1
2/20
03
01/0
8/20
04
01/0
4/20
05
01/1
2/20
05
01/0
8/20
06
01/0
4/20
07
01/1
2/20
07
01/0
8/20
08
01/0
4/20
09
01/1
2/20
09
01/0
8/20
10
01/0
4/20
11
01/1
2/20
11
01/0
8/20
12
01/0
4/20
13
01/1
2/20
13
01/0
8/20
14
STRAT
SPX Multi Asset Classes Long Only
EW Diversification + Monthly Rebal. (2 “free lunches”)
S&P 500 TR
European Equities TR US 10-year T-Note TR
US REITs TR Commodities TR
Jan 1995 – Feb 2015 CAGR Ann. St.dev Mod Sharpe
Strategy (blue) 10.08% 6.53% 1.54
SPY (red) 8.52% 15.30% 0.56
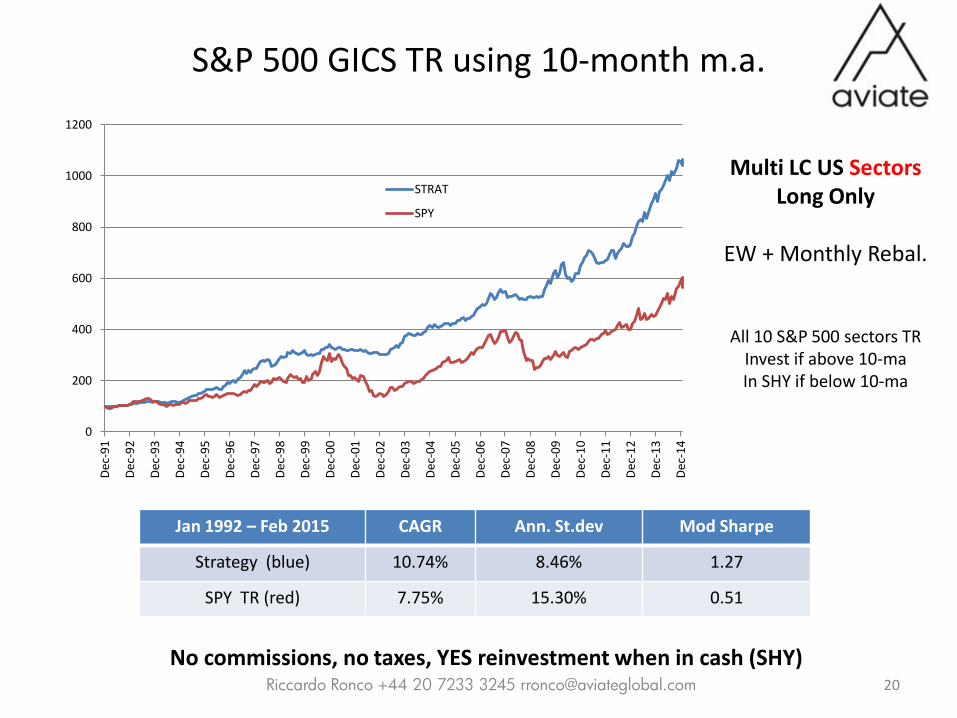
S&P 500 GICS TR using 10-month m.a.
20 Riccardo Ronco +44 20 7233 3245 [email protected] No commissions, no taxes, YES reinvestment when in cash (SHY)
Multi LC US Sectors Long Only
EW + Monthly Rebal.
All 10 S&P 500 sectors TR Invest if above 10-ma In SHY if below 10-ma
Jan 1992 – Feb 2015 CAGR Ann. St.dev Mod Sharpe
Strategy (blue) 10.74% 8.46% 1.27
SPY TR (red) 7.75% 15.30% 0.51
0
200
400
600
800
1000
1200
Dec
-91
Dec
-92
Dec
-93
Dec
-94
Dec
-95
Dec
-96
Dec
-97
Dec
-98
Dec
-99
Dec
-00
Dec
-01
Dec
-02
Dec
-03
Dec
-04
Dec
-05
Dec
-06
Dec
-07
Dec
-08
Dec
-09
Dec
-10
Dec
-11
Dec
-12
Dec
-13
Dec
-14
STRAT
SPY
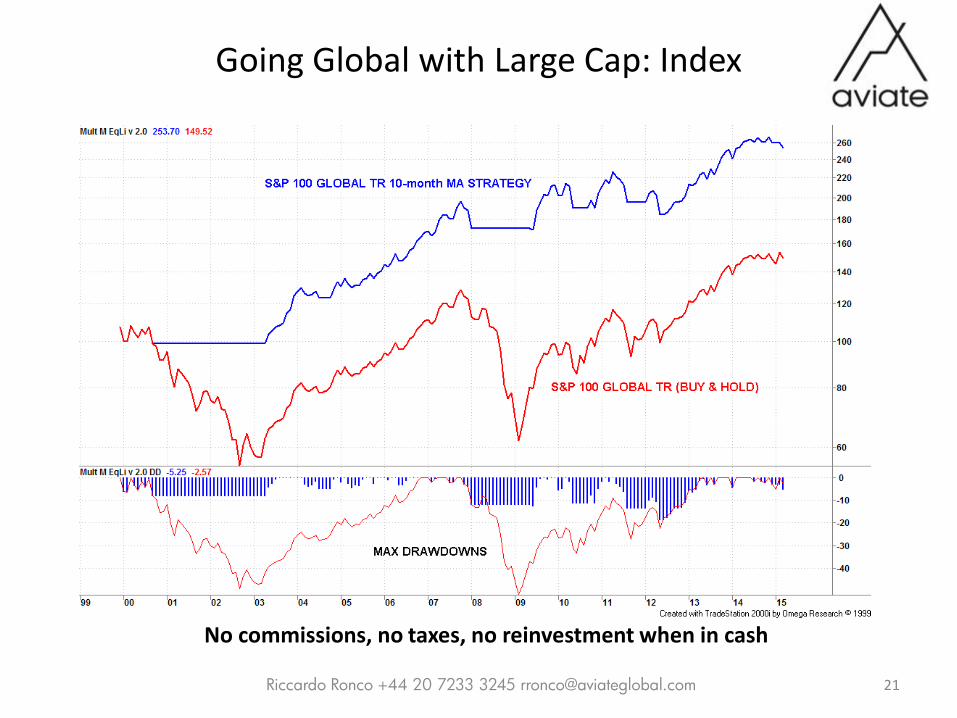
Going Global with Large Cap: Index
21 Riccardo Ronco +44 20 7233 3245 [email protected]
No commissions, no taxes, no reinvestment when in cash
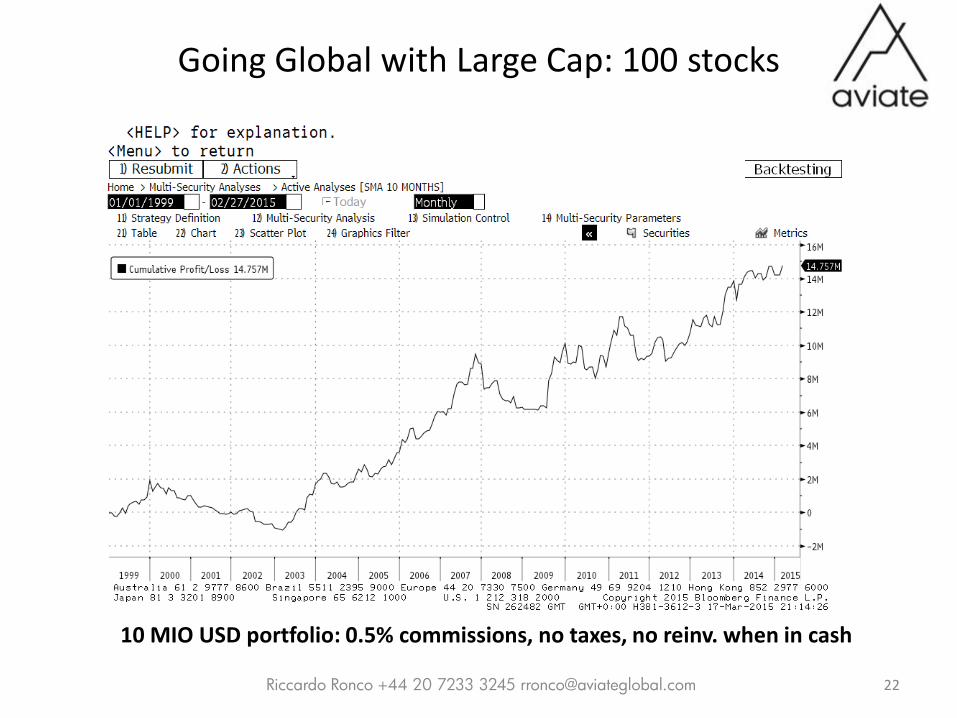
Going Global with Large Cap: 100 stocks
22 Riccardo Ronco +44 20 7233 3245 [email protected]
10 MIO USD portfolio: 0.5% commissions, no taxes, no reinv. when in cash

Bibliography
18 March 2015 Riccardo Ronco +44 20 7233 3245 [email protected] 23
Andreas Clenow - Following the Trend: Diversified Managed Futures Gary Antonacci – Dual Momentum Investing
Nick Radge – Unholy Grails: A New Road to Wealth
Michael W. Covel - Trend Following: Learn to Make Millions in Up or Down Markets
Michael W. Covel - The Complete Turtle trader: The Legend, the Lessons, the Results
Nick Radge - Unholy Grails - A New Road to Wealth
Curtis Faith - Way of the Turtle: The Secret Methods that Turned Ordinary People into Legendary Traders
Mebane T. Faber - The Ivy Portfolio: How to Invest Like the Top Endowments and Avoid Bear Markets
Anthony Garner - A Practical Guide to ETF Trading Systems: A Systematic Approach to Trading Exchange Traded Funds
Van K. Tharp - Trade Your Way to Financial Freedom
Edwin Lefevre – Reminiscences of a Stock Operator

Legenda
18 March 2015 Riccardo Ronco +44 20 7233 3245 [email protected] 25
Every week, for several different countries and asset, classes a given set of technical indicators is calculated on specific Equity, Equity sector and Commodity indices. First, we calculate our proprietary momentum indicator; we then rank the industry groups from best to worst, showing the results for the last six weeks (Friday’s closing prices are used in our calculations). We use the blue color for “Overweight,” the red color for “Underweight,” and no color for “Neutral.” We prefer to find buy ideas in the top third results of our ranking model, while short ideas are better suited for those indices in the bottom third. This table provide a quick, yet effective, way to see the dynamics of relative performances in these indices, showing investors’ preferences in the medium term. From an absolute performance point of view, we need to calculate instead the weekly MACD (Moving Average Convergence/Divergence) indicator and its nine-week moving average (the “signal line”). We technically define a bullish swing as one when the MACD is above its moving average and a bearish swing as one when the MACD is below its moving average. On the “Time” column, we count the number of weeks from one swing to the next to gauge the maturity of the current move. When comparing the MACD with its moving average and with the zero line, however, we can define four phases (Up, Advancing, Down, and Terminating). The idea is to divide price oscillations into clearly identifiable phases (as inspired by the work of Ian S. Notley) and adjust our risk/reward expectations according to these indications (see column “Action”, representing the number of weeks a particular index has spent in its bullish or bearish swing phase). The bullish swing includes the Up and Advancing phases. Up: The index has bottomed (possibly after showing positive divergences) and is breaking resistance levels. Investors should have a low-risk entry point here. The weekly MACD is below the zero line but above its signal line. Size should be small at the beginning, and the investor should allow prices to prove themselves. Advancing: Prices are trending nicely higher with moderate volatility. Approaching the top, we usually see volatility picking up and weekly (daily) ranges increasing. The weekly MACD is above both the zero line and its signal line. Buying dips can be a rewarding strategy. The bearish swing includes the Down and Terminating phases. Down (Declining): The index has built a top (or a congestion phase), and the weekly MACD has crossed from above its signal line. The MACD itself is still above the zero line here, and the implication is to lighten the position and to use each short-term pullback to reduce/sell the exposure (sell on rallies). Terminating: Prices are accelerating to the downside, and the weekly MACD is now below both zero and its signal line. Sharp rallies could be confusing, but sticking to the trend is the best strategy, and investors should generally avoid buying dips here. Volatility is sharply increasing. EM: Emerging Market.
Information about technical analysis
18 March 2015 Riccardo Ronco +44 20 7233 3245 [email protected] 26
This trading idea is based upon technical analysis, which involves the study of historical price and volume trading patterns and the potential direction of future trading based upon such information. There is no direct or implied guarantee of any particular outcome. This analysis is different from fundamental analysis and the conclusions reached may differ. Technical research does not represent a rating or coverage of any discussed issuer(s). Our daily charts for European and U.S. equities try to highlight in a quick and easy way information about the trend, the relative performance against its benchmark, price momentum and accumulation/distribution using volume. Our conviction is clearly a function of these elements and of the time frame used. To determine the trend we use the classic combination of two moving averages based on a 50 and 200 day length. The trend of the stock will move above and below these moving averages and we will look for buy (sell) ideas when price will be above (below) both of them or during mild pullbacks affecting only the 50-day moving averages. Given two or more signals on stocks in uptrend we use the relative strength versus its benchmark (usually the Eurostoxx 600 for European names and the S&P 500 for U.S. names) to discriminate which one offers the best opportunity for a given signal. Again we like stocks in uptrend with a bullish relative strength as buy candidates. Momentum (we use the classic MACD Moving Average Convergence Divergence Indicator) tells us where we are in the current phase of the trend. The MACD indicator represents the difference between two moving averages of 12 and 26 days. If this indicator is widening, it confirms the trend in prices is healthy and accelerating. A possible indication to reduce exposure in a stock that is in uptrend and outperforming is provided either by a short-term trend reversal toward the zero line of this indicator or by a negative divergence between prices and the MACD indicator. New highs in price that are not confirmed by new highs in the MACD, are leading indications that the pace of the trend is slowing down and a possible reversal is in the offing. Finally we consider volume in our work in two forms: raw volume represented by a vertical histogram (red for negative trading sessions, blue for positive ones) and the OBV indicator. Raw volume can indicate the underlying structure of buying and selling in the short-term: we like higher price on higher volume and lower prices on lower volume, indicating a positive feedback in investors’ mentality. Spikes in volume are usually associated with climaxes and a short-term reversal is usually the norm. The OBV indicator tries to help to answer the question whether the stock is under accumulation or distribution. The OBV indicator follows prices 95% of the time: we add (subtract) the volume of the day if the close is positive (or negative) to a running total. A stock that has been for 2-3 months in a tight trading range with an OBV indicator that is breaking higher (lower) provides a leading indication of accumulation (distribution) and helps the investor/trader to be prepare ahead of the breakout in prices. Aviate Global’s technical rating system has seven categories to differentiate short-, medium-, and long-term time horizons. If there is no rating listed for a stock, Aviate Global is neutral and has no opinion on the stock. Speculative Buy: A short-term buying opportunity lasting up to one month with projected upside of 10% or more. Buy: A medium-term buying opportunity lasting up to six months with projected upside of 25% or more. Strong Buy: A long-term buying opportunity lasting more than one year with return potential of 50% or more. Sell Short: A short-term selling opportunity lasting up to one month with projected downside of 10% or more. Take Profit: Immediate closing out of existing position at a profit. Sell/Reduce: Used for a stock with a deteriorating long-term technical outlook that is expected to have a very limited or negative return over the medium to long term. Stop Loss: Immediate closing out of existing position at a loss. Aviate Global’s technical ratings use specific return targets; returns are not guaranteed and are used for illustrative purposes only. Chart sources: Bloomberg and Aviate Global LLP.

18 March 2015 Riccardo Ronco +44 20 7233 3245 [email protected] 27
Global Disclaimer
Aviate Global LLP is authorised and regulated by the Financial Conduct Authority and is a member of the London Stock Exchange. Aviate Global LLP is registered in England and Wales No. OC324323. Aviate Global (US) LLP is a broker dealer registered with the U.S. Securities and Exchange Commission, is a member of the Financial Industry Regulatory Authority (FINRA), and the Securities Investor Protection Corporation (SIPC). Aviate Global (Asia) Limited (CE no. 1950254 and BBY489) is licensed by the Securities and Futures Commission (SFC) of Hong Kong. This note is circulated to you as a client of Aviate Global LLP. Please note that the views contained within may have been disclosed earlier today to some clients via Bloomberg. If you would like to receive our earlier Bloomberg message, please contact Paul Moran on +44 20 7233 3218. Aviate Global LLP generates high conviction trading and investment ideas for its clients. It does not carry out any proprietary trading or corporate advisory activities. Aviate Global’s publications are for the sole benefit of its clients. Unauthorised copying or distribution is prohibited. This report is a marketing communication, issued and approved for distribution in the United Kingdom by Aviate Global LLP. It has been prepared by Aviate Global LLP solely for the purpose of supplying information to the clients of Aviate Global LLP and/or its affiliate(s) to whom it is distributed and has not been prepared in accordance with the legal requirements designed to promote the independence of investment research. The report is not subject to any prohibition on dealing ahead of the dissemination of investment research, however it is company policy to prevent personal account dealing by employees until such time that the research has been disseminated. Aviate Global LLP does not deal with, or for Retail Clients (i.e. those who are not Per Se Professional Clients or an Eligible Counterparty as defined in the European Parliament and Council Directive on Markets in Financial Instruments). Aviate Global LLP is not covered by the Financial Services Compensation Scheme (FSCS). This report is not, and should not be construed as, a recommendation, solicitation or offer to buy or sell any securities or related financial products. This report does not constitute investment advice, does not constitute a personal recommendation and has been prepared without regard to the individual financial circumstances, needs or objectives of persons who receive it. NOTICE TO U.S. INVESTORS This report has not been prepared, reviewed or approved by Aviate Global (US) LLP, Aviate Global LLP’s affiliated U.S.-registered broker-dealer and a member of FINRA. This report is intended to be distributed by Aviate Global LLP in the United States solely to “major U.S. institutional investors” as defined by Rule 15a-6 of the Securities Exchange Act of 1934, as amended. For the avoidance of doubt, this report is not intended for individual or non-institutional investors and should not be distributed to any such individual or entity. Interested “major U.S. institutional investors” should contact Aviate Global, (US) LLP, our U.S. registered broker-dealer affiliate, or another U.S.-registered broker-dealer, to effect transactions in the securities that are the subject of this report. NOTICE TO HONG KONG INVESTORS This report may be delivered to you by Aviate Global (Asia) Limited (Company Registry no. 1950254) (Aviate Global (Asia)) but has not been prepared, reviewed or approved by Aviate Global (Asia). Aviate Global (Asia) is incorporated in Hong Kong and is licensed by the Securities and Futures Commission (SFC) of Hong Kong to conduct Type 1 (dealing in securities) and Type 4 (advising on securities) regulated activities pursuant to the Securities and Futures Ordnance of Hong Kong. Aviate Global (Asia) only deals with 'professional persons' (as defined by the SFO and its subsidiary legislation) and does not hold any client assets. In addition, conditions of Aviate Global (Asia)'s licence limit its dealing in securities activities in Hong Kong to communicating offers to effect the dealings in securities to Aviate Global LLP, in the name of the person from whom those offers are received. This report is not a recommendation, solicitation or offer from Aviate Global (Asia) to buy or sell any securities or related financial products. It was prepared by Aviate Global LLP solely for the purpose of supplying information without regard to the individual financial circumstances, needs or objectives of persons who receive it. NOTICE TO AUSTRALIAN INVESTORS Aviate Global LLP is registered as a foreign company in Australia (ARBN 165 830 937) under the Corporations Act 2001. Aviate Global LLP is relying on the Australian Securities and Investment Commission (ASIC) Class Order CO 03/1099 (Class Order) exemption for UK Financial Conduct Authority (FCA) regulated firms which exempts it from the requirement to hold an Australian financial services license under the Corporations Act 2001. To ensure compliance with the Class Order, Aviate Global LLP does not deal with, or for any clients who are not a “wholesale client” within the meaning by section 761G of the Corporations Act. Aviate Global LLP are authorised and regulated by the Financial Conduct Authority (FCA) under the laws and regulatory requirements of the United Kingdom which are different to Australia. Consequently any offer or other documentation that you receive from us in the course of us providing financial services to you will be prepared in accordance with those laws and regulatory requirements. The UK regulatory requirements refer to legislation, rules enacted pursuant to the legislation and any other relevant policies or documents issued by the FCA. This report has been prepared by Aviate Global LLP solely for the purpose of supplying information to the clients of Aviate Global LLP and/or its affiliate(s) to whom it is distributed. This report is not, and should not be construed as, a recommendation, solicitation or offer to buy or sell any securities or related financial products. This report does not constitute investment advice, does not constitute a personal recommendation and has been prepared without regard to the individual financial circumstances, needs or objectives of persons who receive it.