42
EXPERT GROUP on rice 28 June 2018 DG Agriculture and Rural Development European Commission Jeroen Smits Rice Market Officer
EXPERT GROUP
on rice
28 June 2018
DG Agriculture and Rural Development
European Commission
Jeroen Smits
Rice Market Officer
Contents: 1. INTRA TRADE 2. International and EU prices 3. EU Rice Imports 4. EU Rice Exports 5. TRQs
2

INTRA TRADE
3

Intra trade of rice (in milled eq. excl broken) into ITALY (source: EUROSTAT)
4
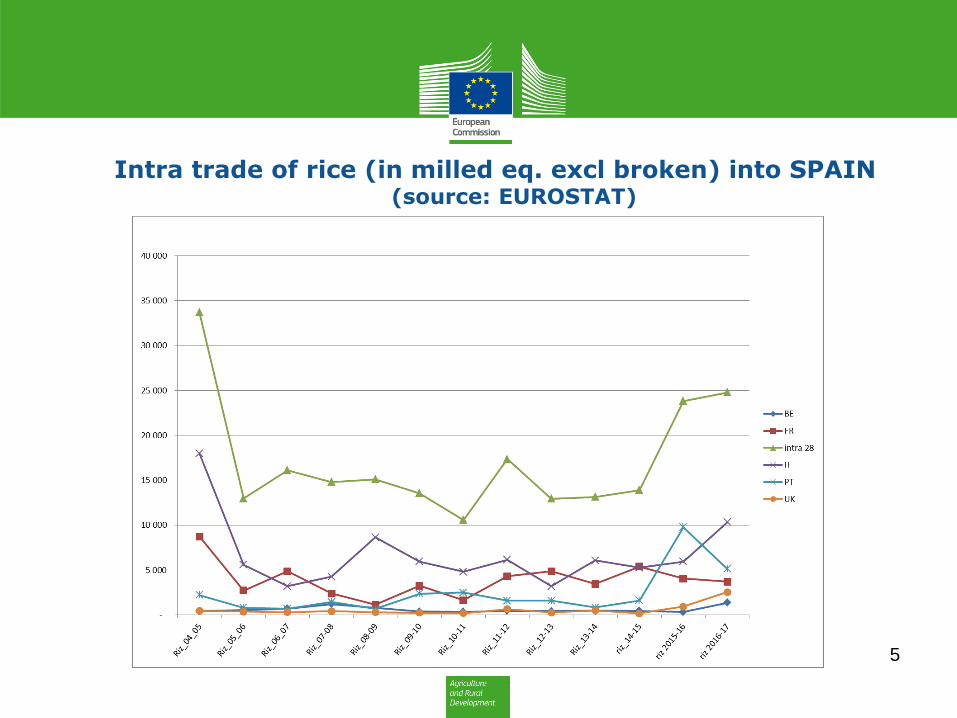
Intra trade of rice (in milled eq. excl broken) into SPAIN (source: EUROSTAT)
5
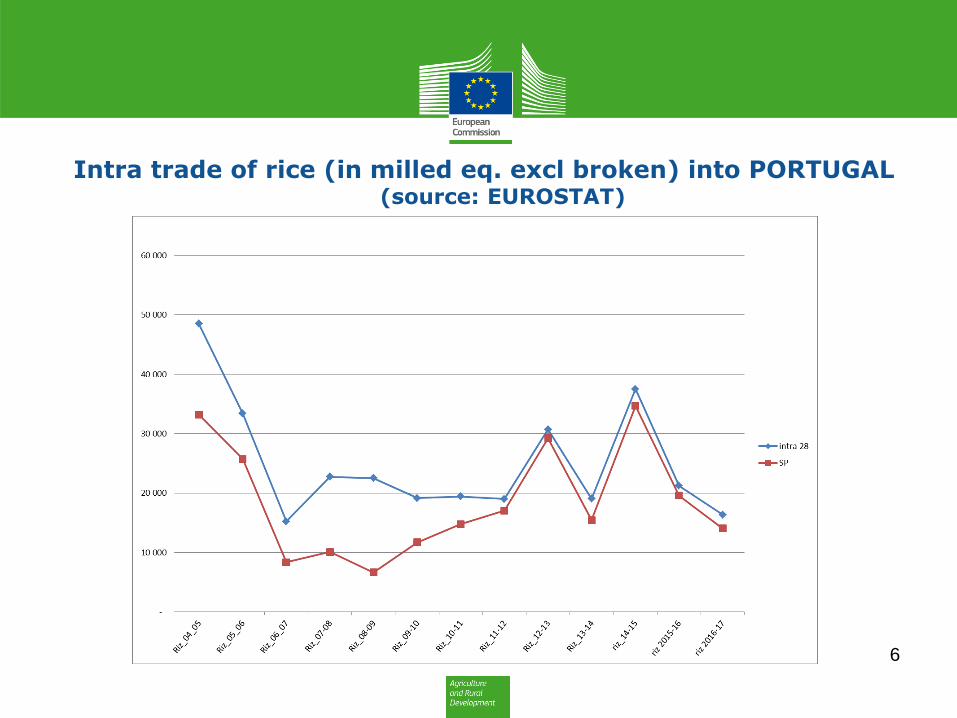
Intra trade of rice (in milled eq. excl broken) into PORTUGAL (source: EUROSTAT)
6
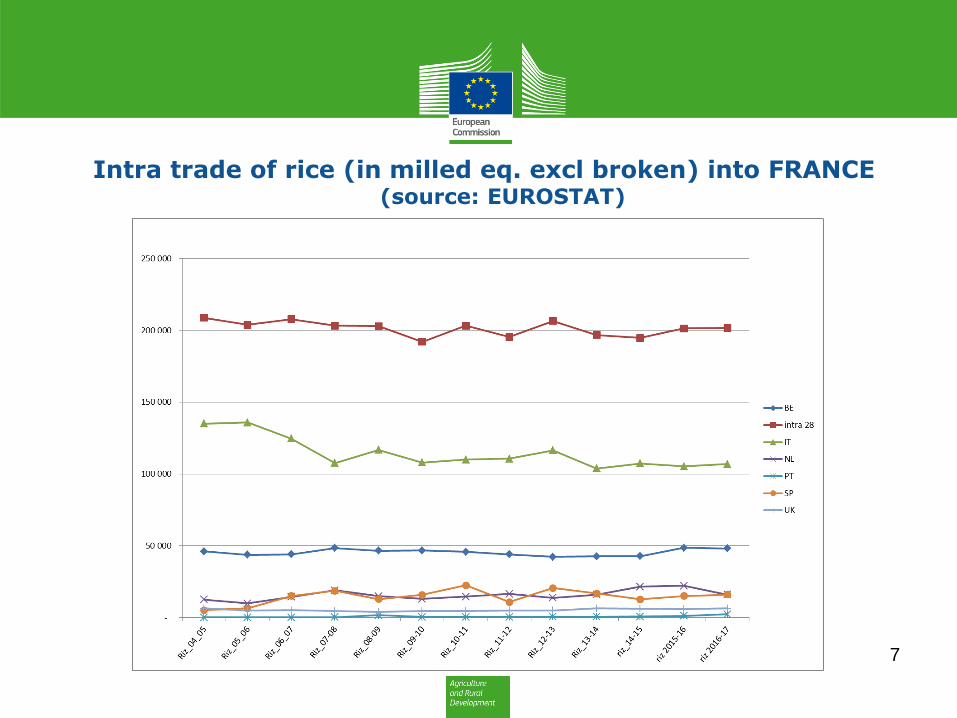
Intra trade of rice (in milled eq. excl broken) into FRANCE (source: EUROSTAT)
7
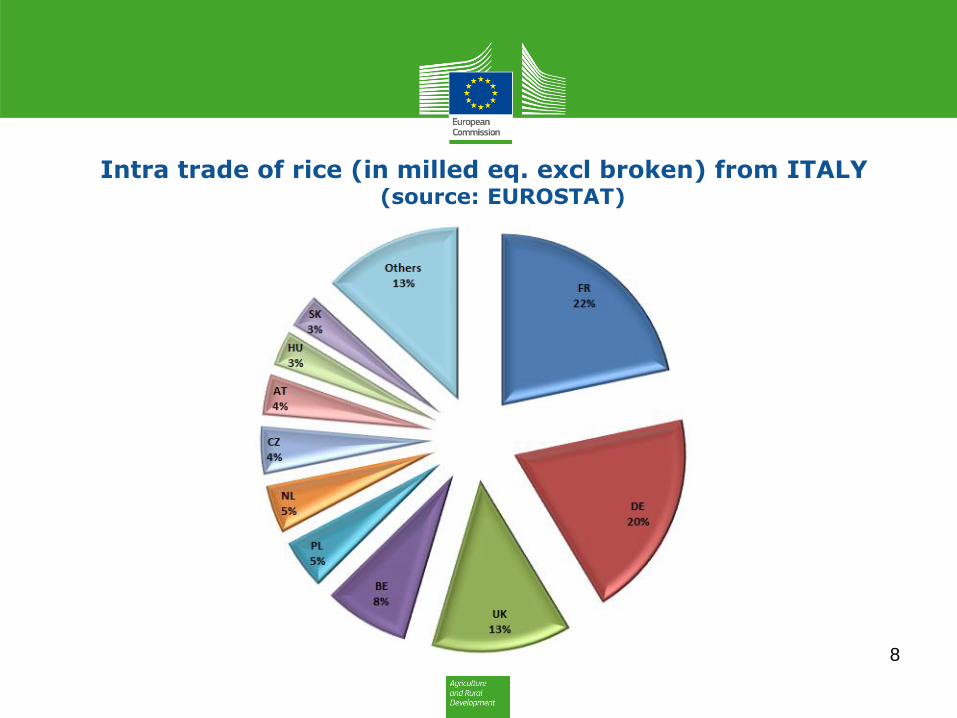
Intra trade of rice (in milled eq. excl broken) from ITALY (source: EUROSTAT)
8
International and EU prices
9
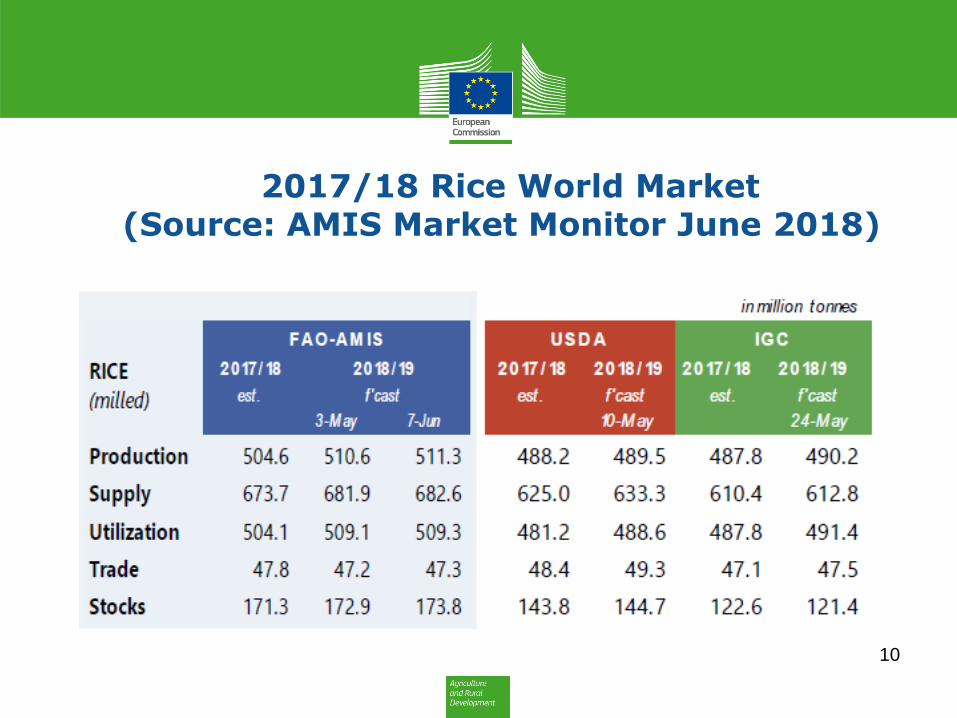
2017/18 Rice World Market (Source: AMIS Market Monitor June 2018)
10

International Rice Prices
11
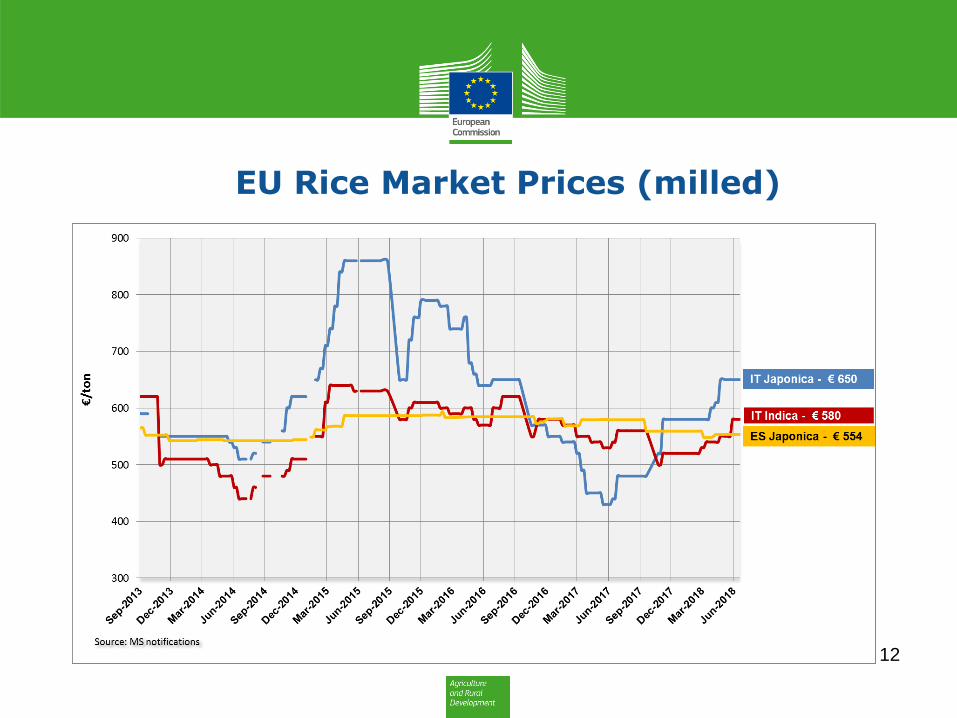
EU Rice Market Prices (milled)
12
EU Rice Imports: - Total rice imports - EBA rice imports - Imports of rice in packages < 20 kg - Basmati
13
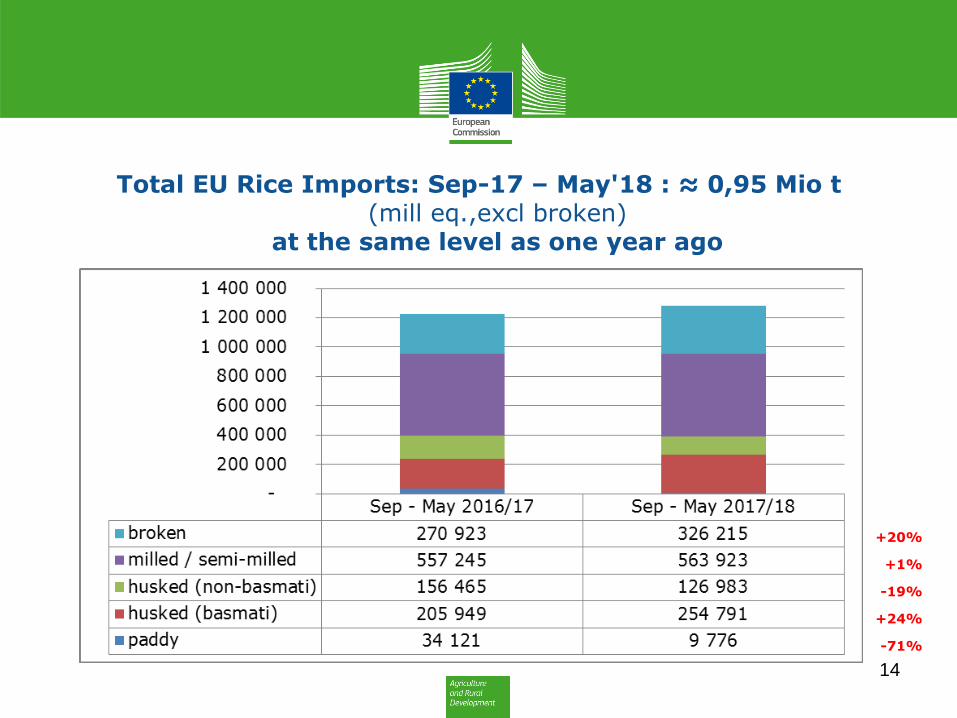
Total EU Rice Imports: Sep-17 – May'18 : ≈ 0,95 Mio t (mill eq.,excl broken)
at the same level as one year ago
+20%
+1%
-19%
+24%
-71%
14
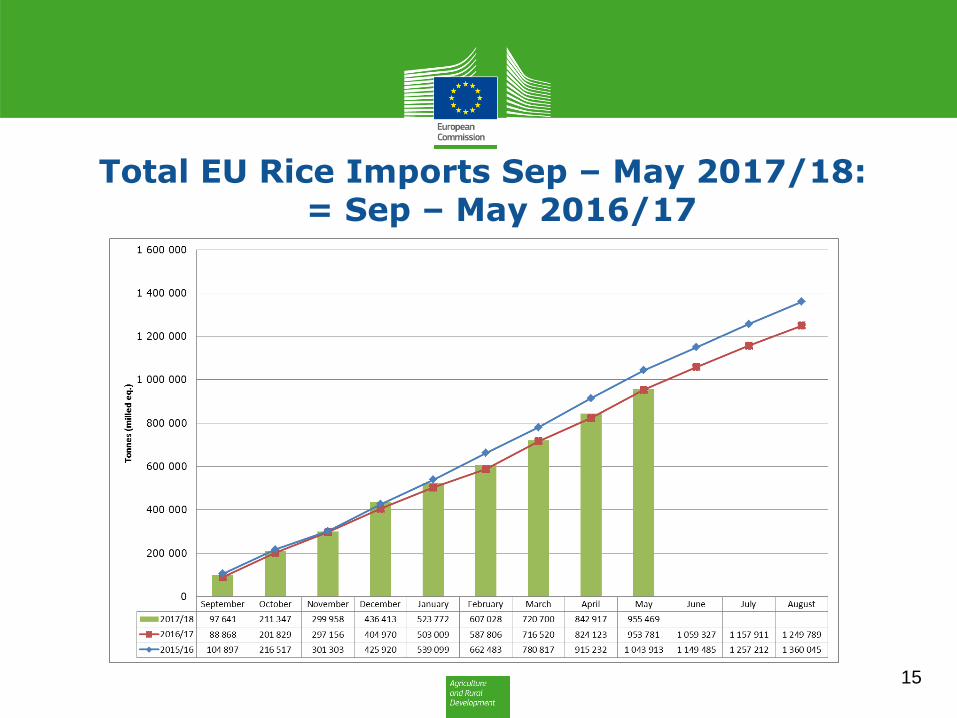
Total EU Rice Imports Sep – May 2017/18: = Sep – May 2016/17
15
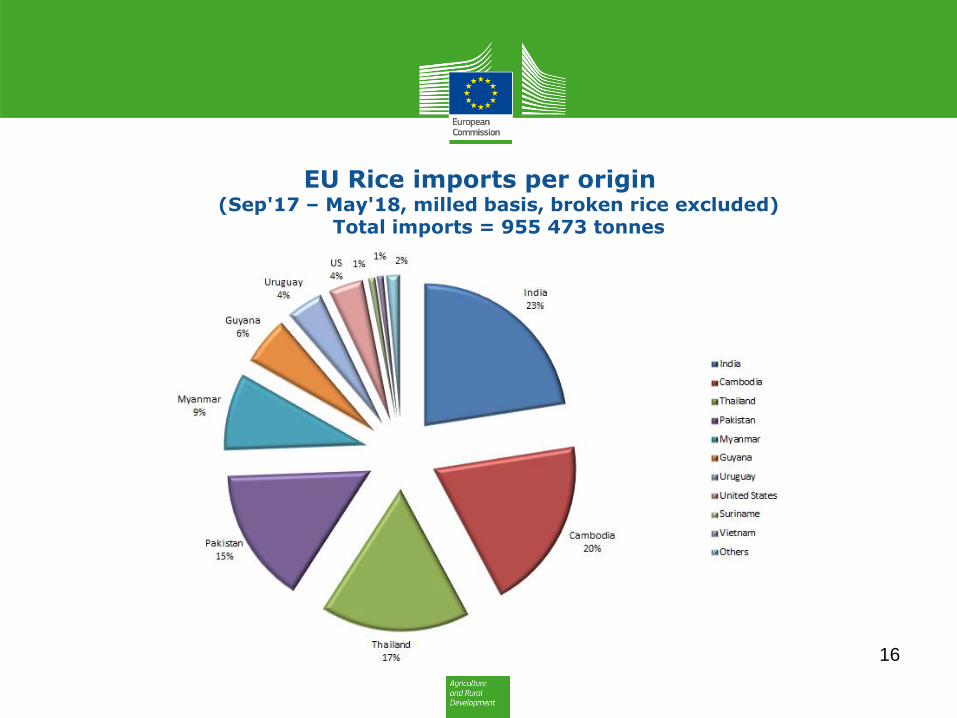
EU Rice imports per origin (Sep'17 – May'18, milled basis, broken rice excluded)
Total imports = 955 473 tonnes
16
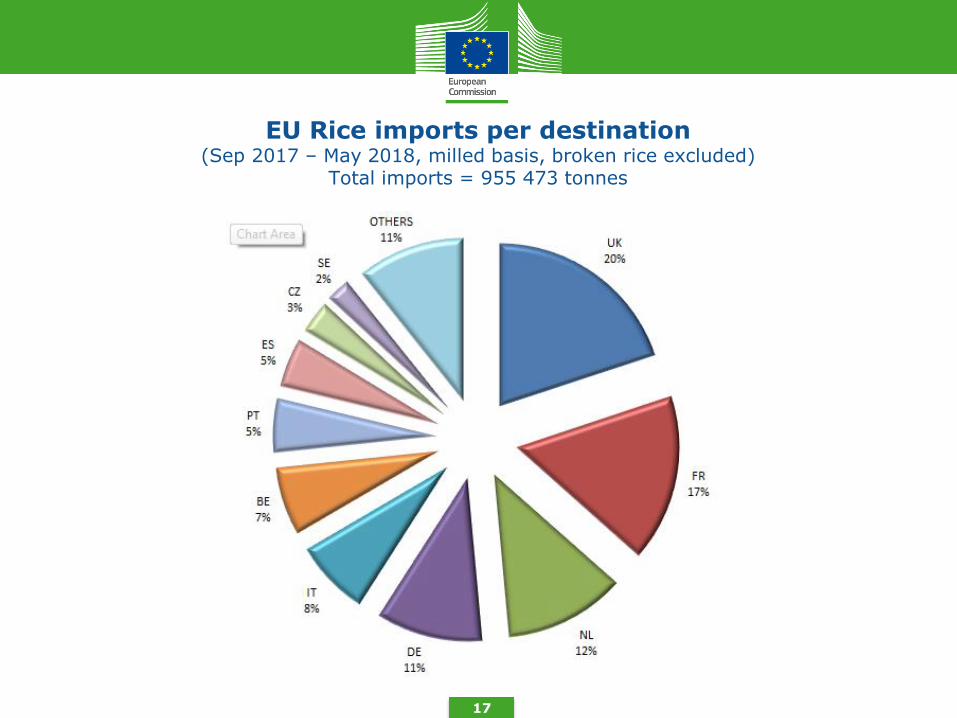
EU Rice imports per destination (Sep 2017 – May 2018, milled basis, broken rice excluded)
Total imports = 955 473 tonnes
17
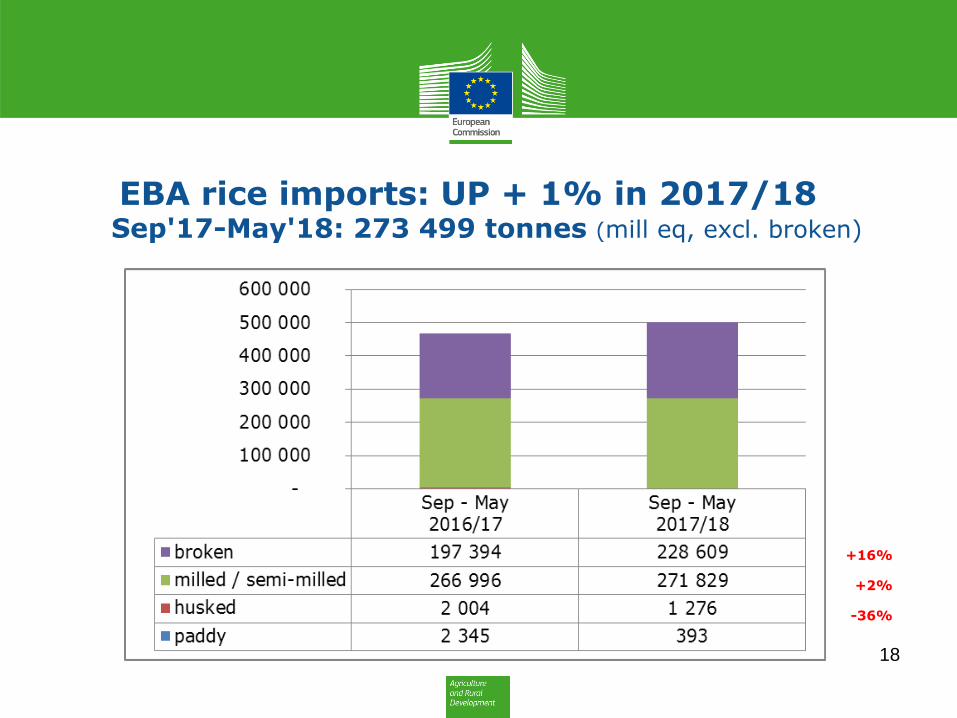
EBA rice imports: UP + 1% in 2017/18 Sep'17-May'18: 273 499 tonnes (mill eq, excl. broken)
+16%
+2%
-36%
18
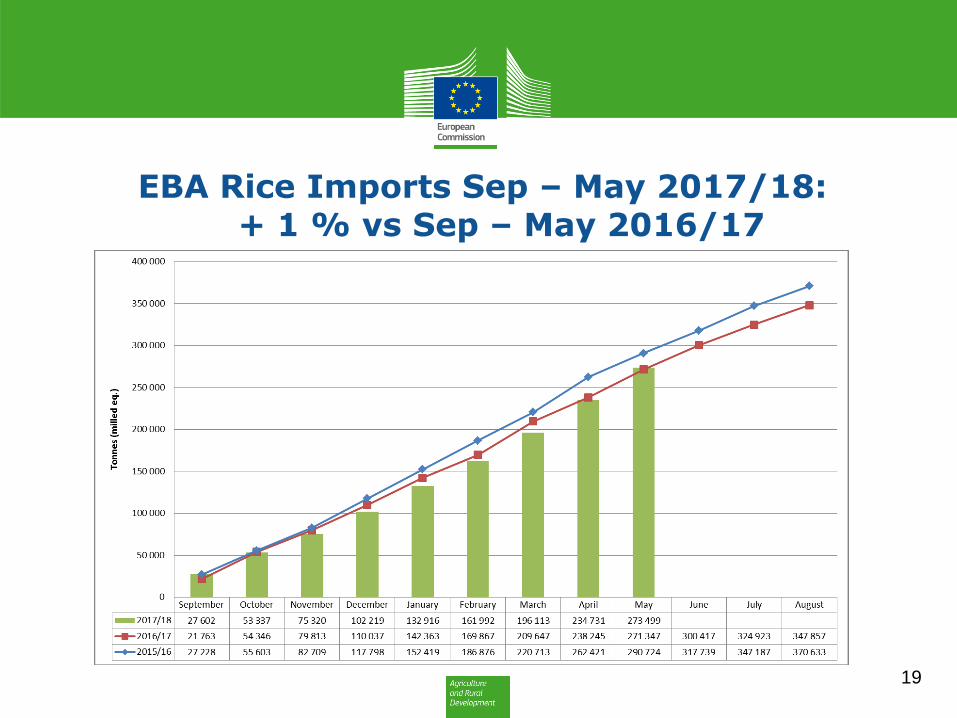
EBA Rice Imports Sep – May 2017/18: + 1 % vs Sep – May 2016/17
19
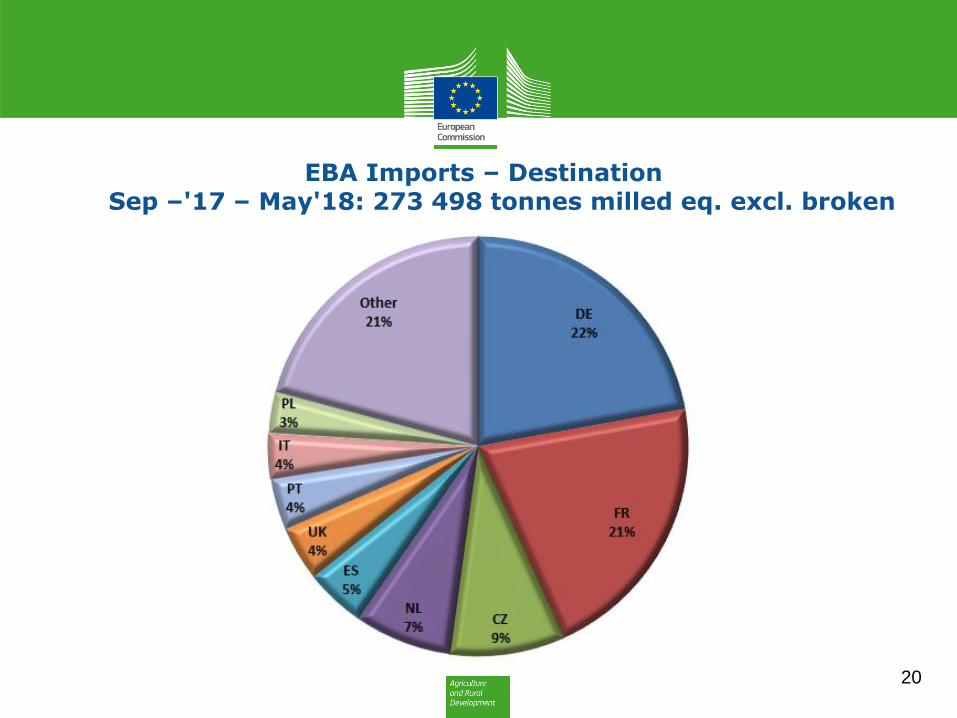
EBA Imports – Destination Sep –'17 – May'18: 273 498 tonnes milled eq. excl. broken
20
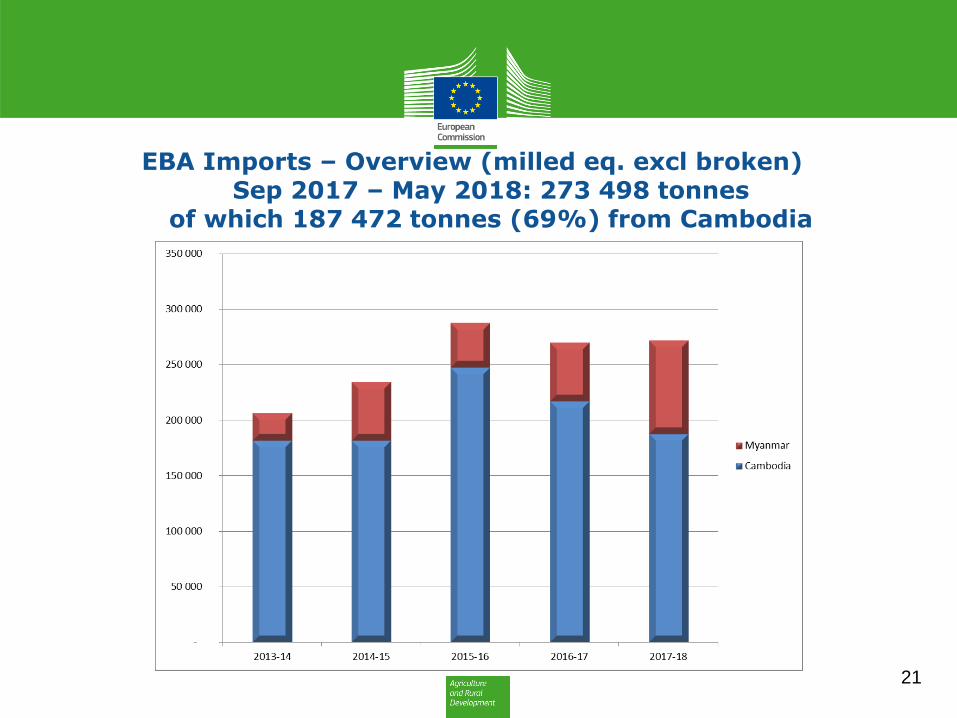
EBA Imports – Overview (milled eq. excl broken) Sep 2017 – May 2018: 273 498 tonnes
of which 187 472 tonnes (69%) from Cambodia
21
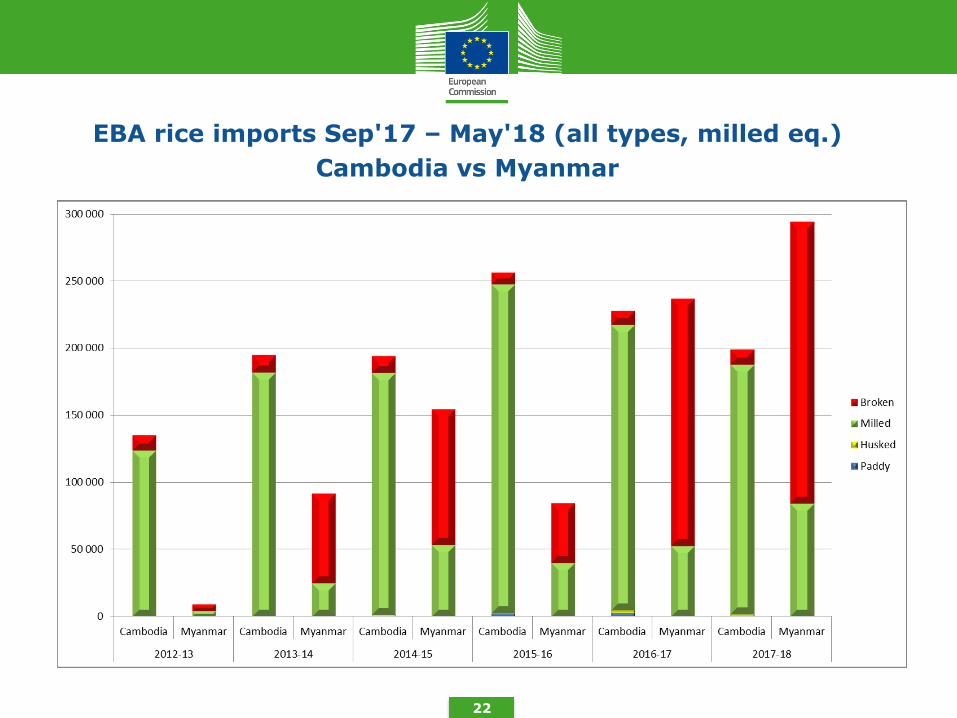
EBA rice imports Sep'17 – May'18 (all types, milled eq.)
Cambodia vs Myanmar
22
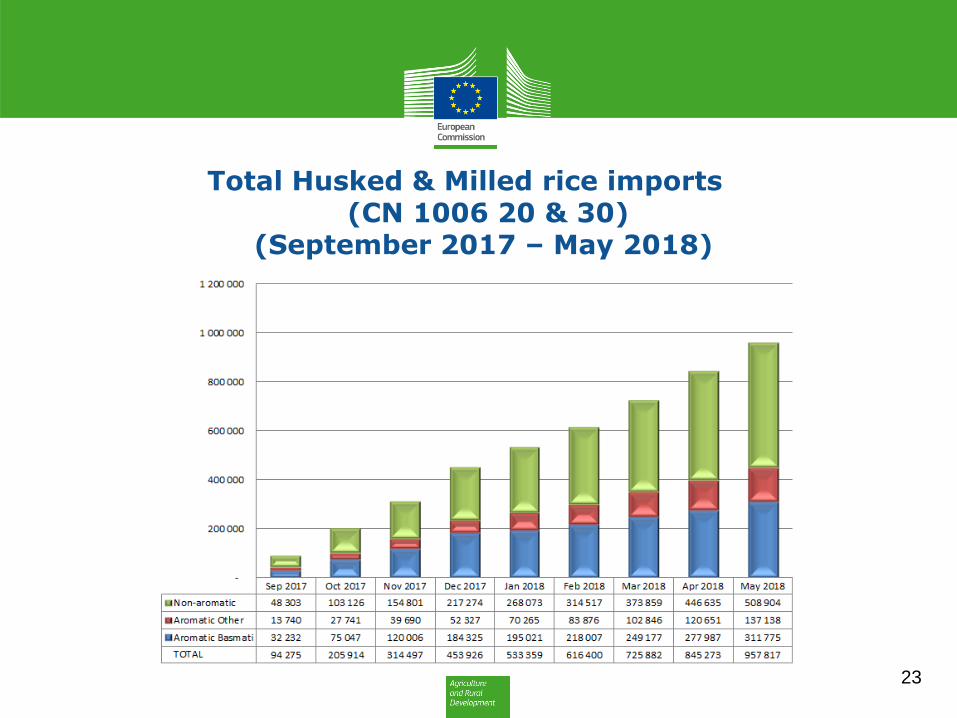
Total Husked & Milled rice imports (CN 1006 20 & 30)
(September 2017 – May 2018)
23
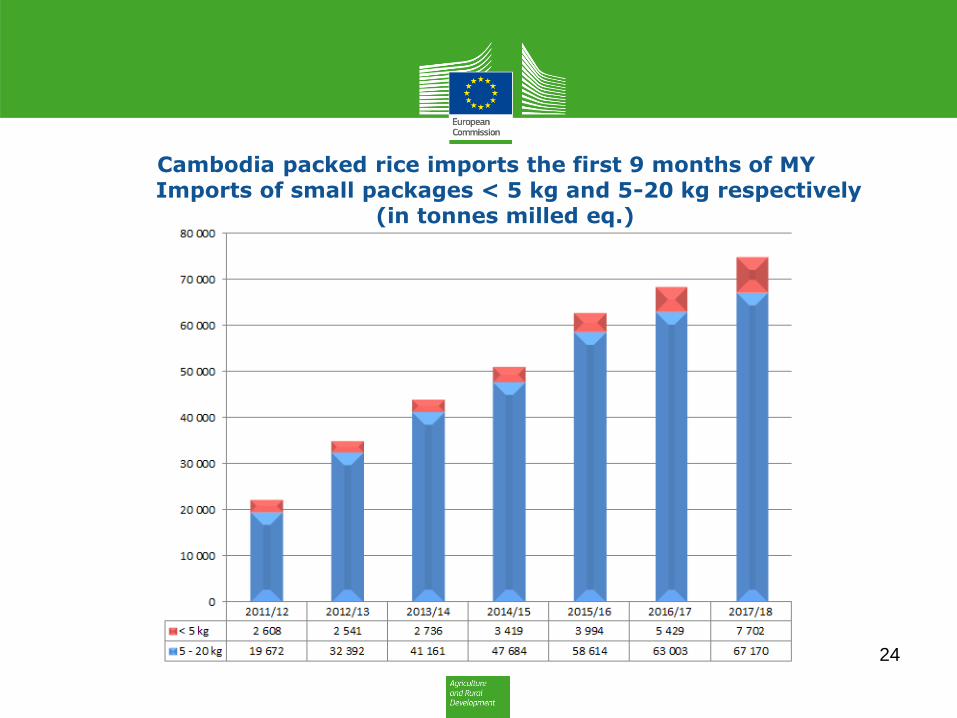
Cambodia packed rice imports the first 9 months of MY Imports of small packages < 5 kg and 5-20 kg respectively
(in tonnes milled eq.)
24
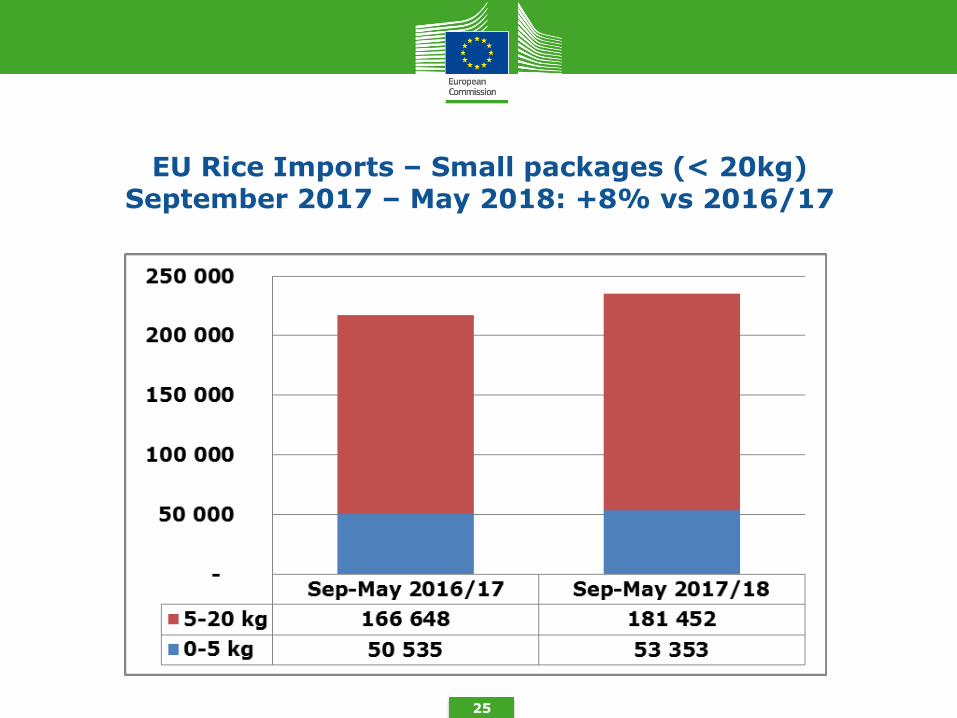
EU Rice Imports – Small packages (< 20kg) September 2017 – May 2018: +8% vs 2016/17
25
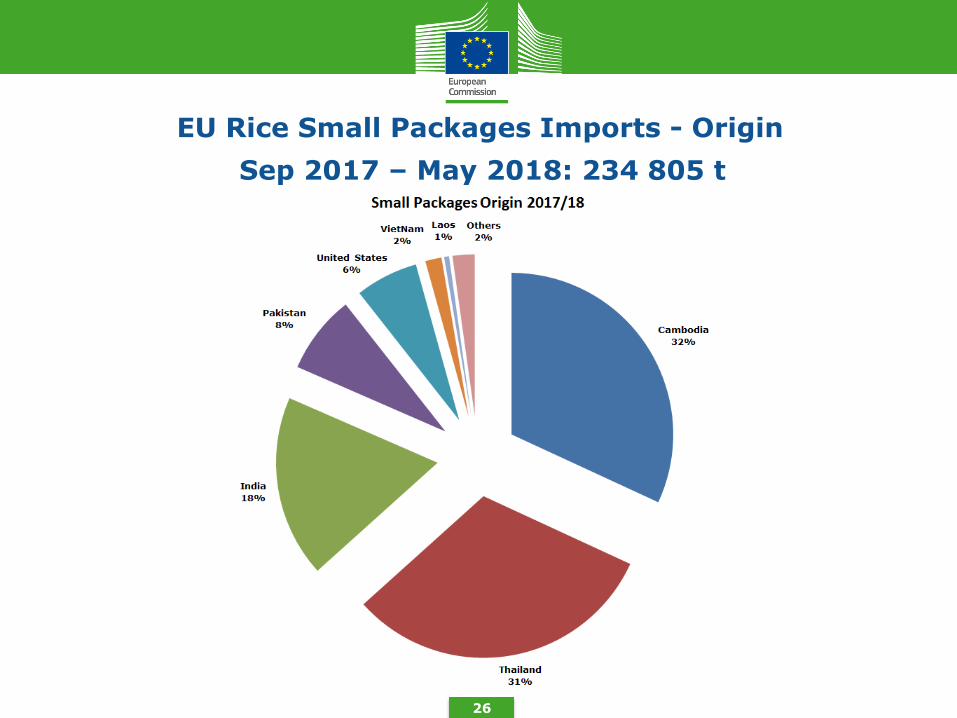
Sep 2017 – May 2018: 234 805 t
EU Rice Small Packages Imports - Origin
26
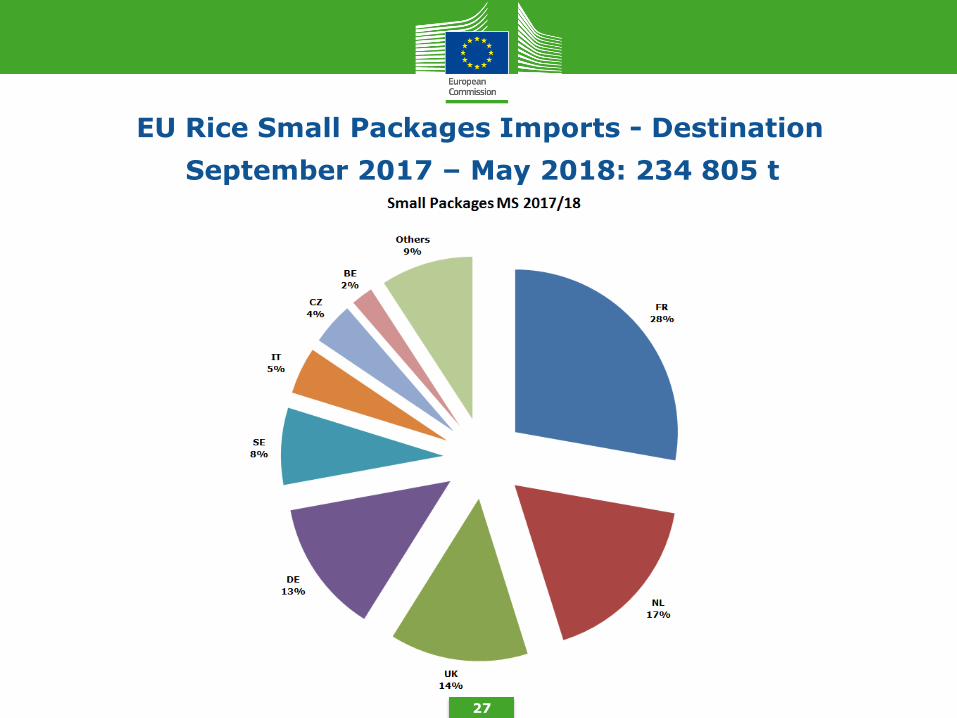
September 2017 – May 2018: 234 805 t
EU Rice Small Packages Imports - Destination
27
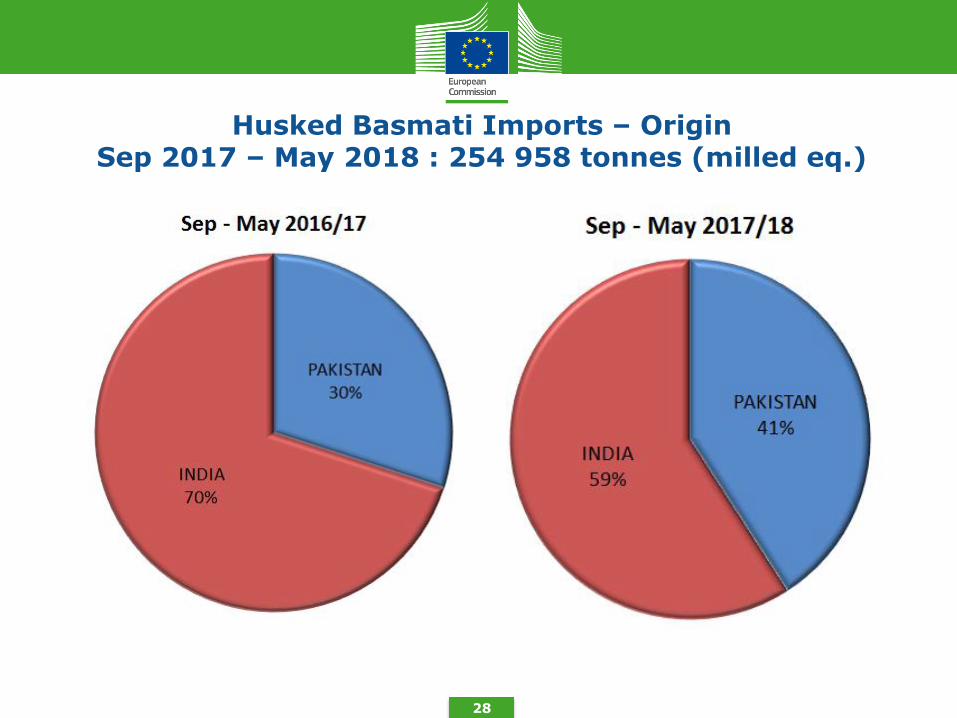
Husked Basmati Imports – Origin Sep 2017 – May 2018 : 254 958 tonnes (milled eq.)
28
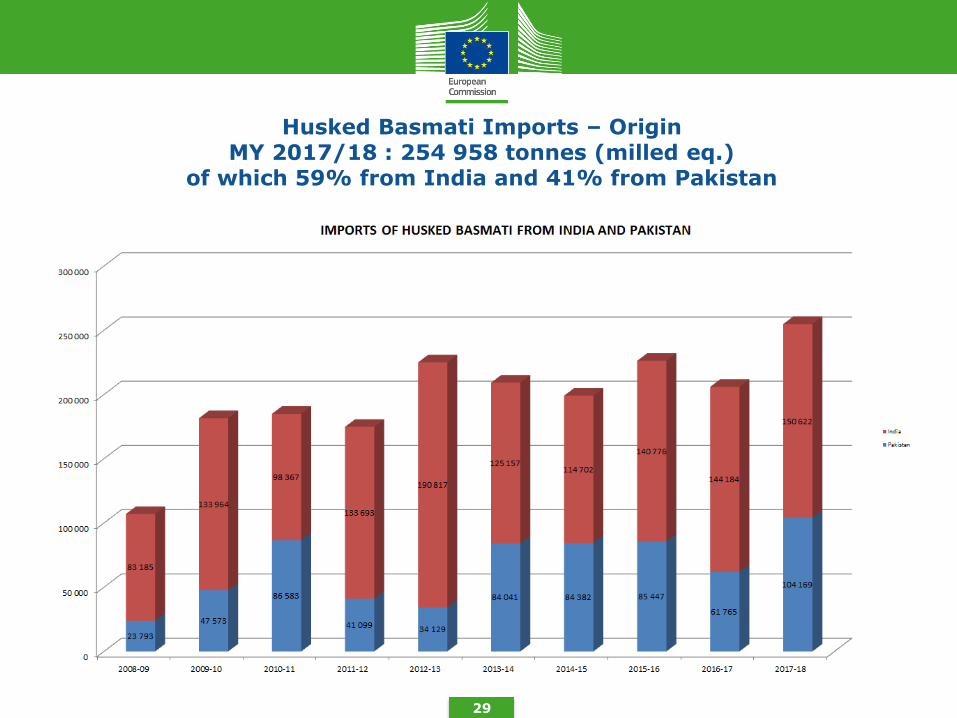
Husked Basmati Imports – Origin MY 2017/18 : 254 958 tonnes (milled eq.)
of which 59% from India and 41% from Pakistan
29
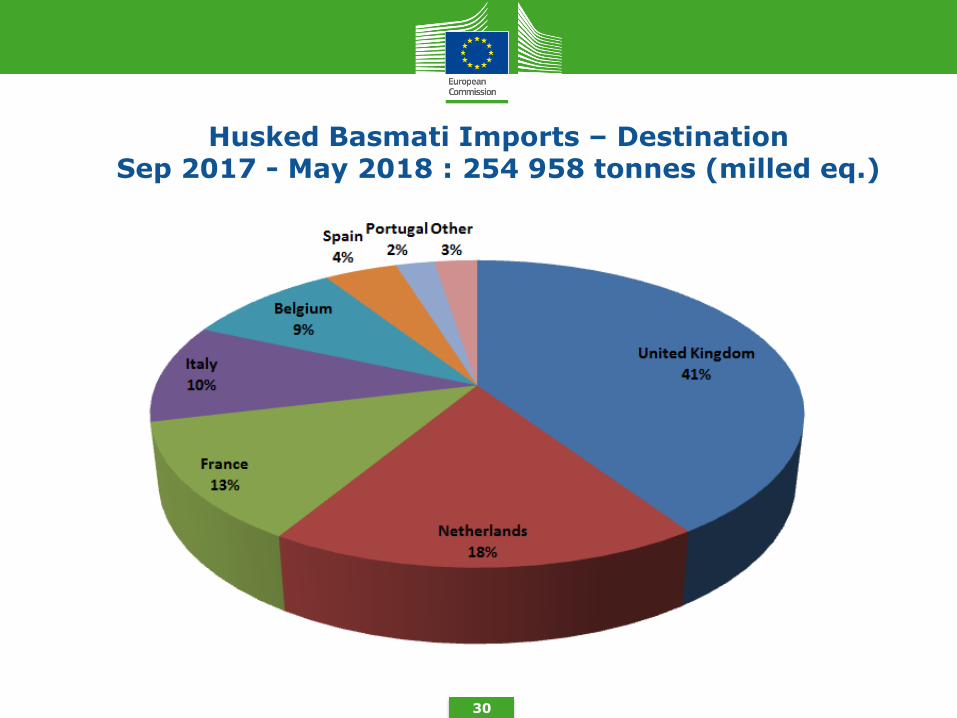
Husked Basmati Imports – Destination Sep 2017 - May 2018 : 254 958 tonnes (milled eq.)
30
EU Rice Exports
31
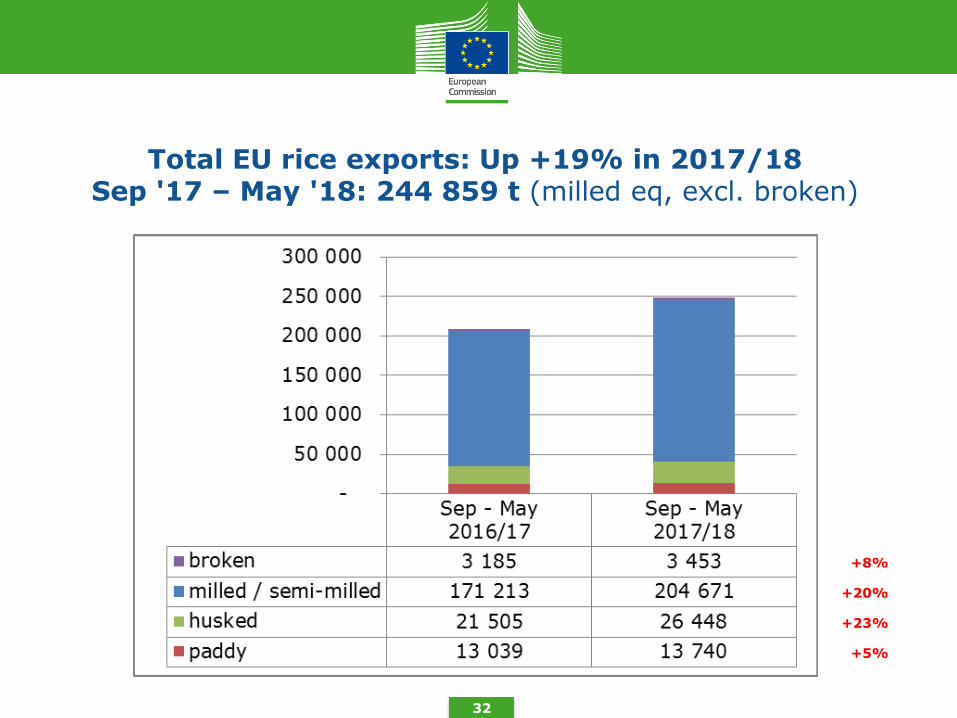
Total EU rice exports: Up +19% in 2017/18 Sep '17 – May '18: 244 859 t (milled eq, excl. broken)
+8%
+20%
+23%
+5%
32
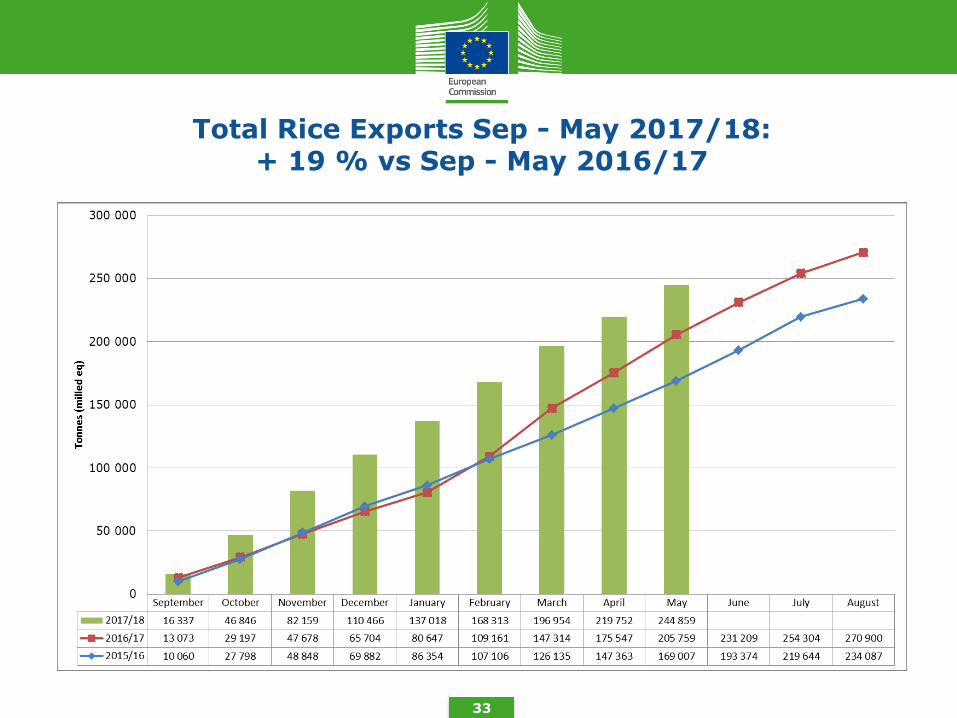
Total Rice Exports Sep - May 2017/18: + 19 % vs Sep - May 2016/17
33
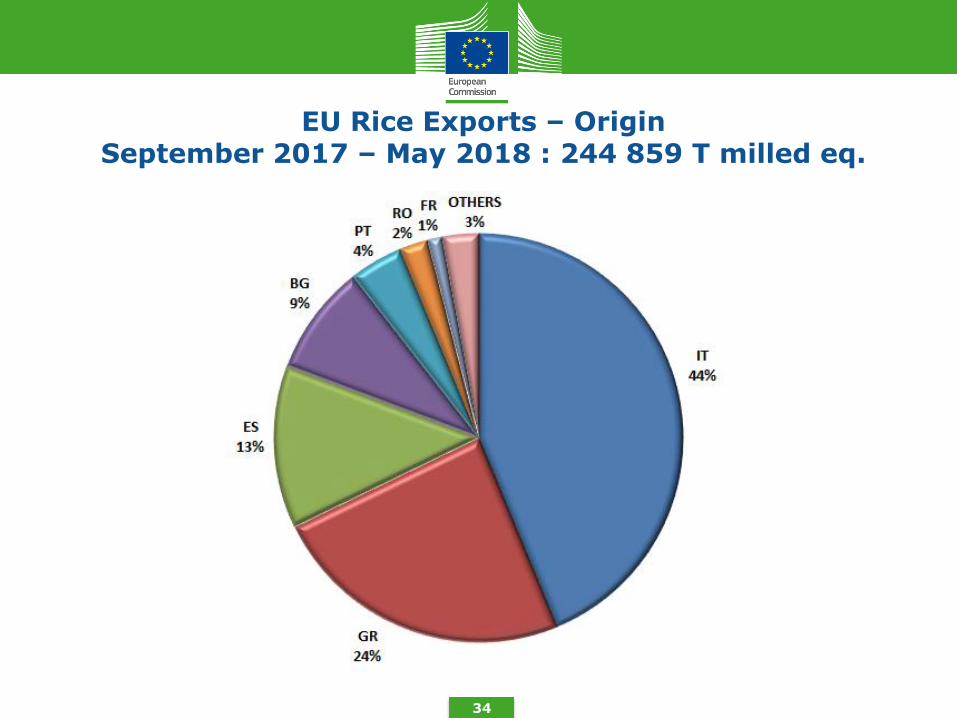
EU Rice Exports – Origin September 2017 – May 2018 : 244 859 T milled eq.
34
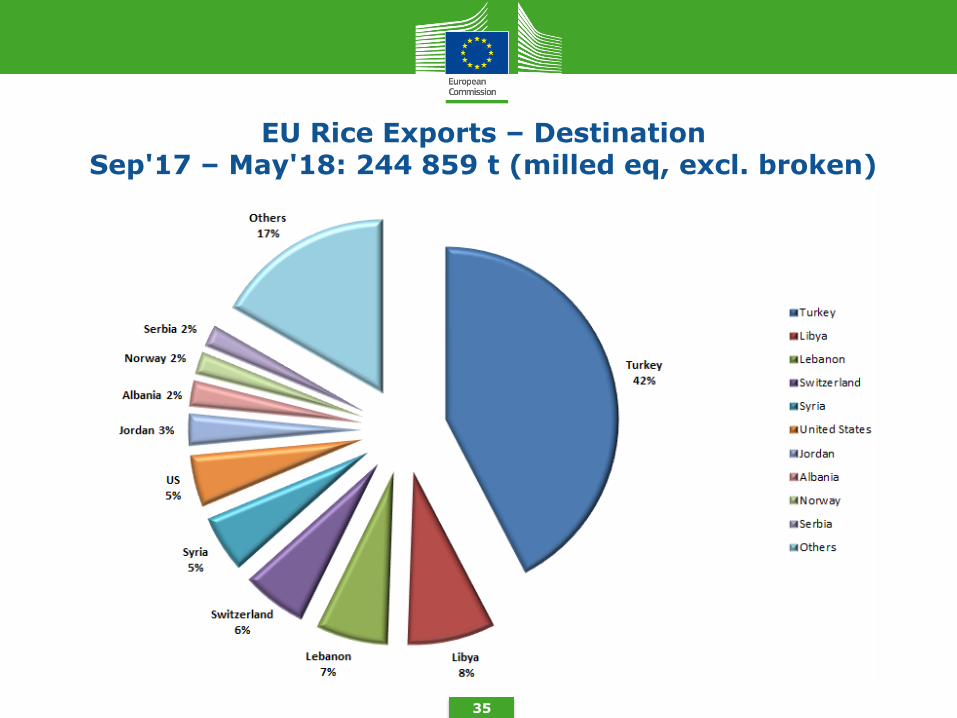
EU Rice Exports – Destination Sep'17 – May'18: 244 859 t (milled eq, excl. broken)
35

TRQ's
36
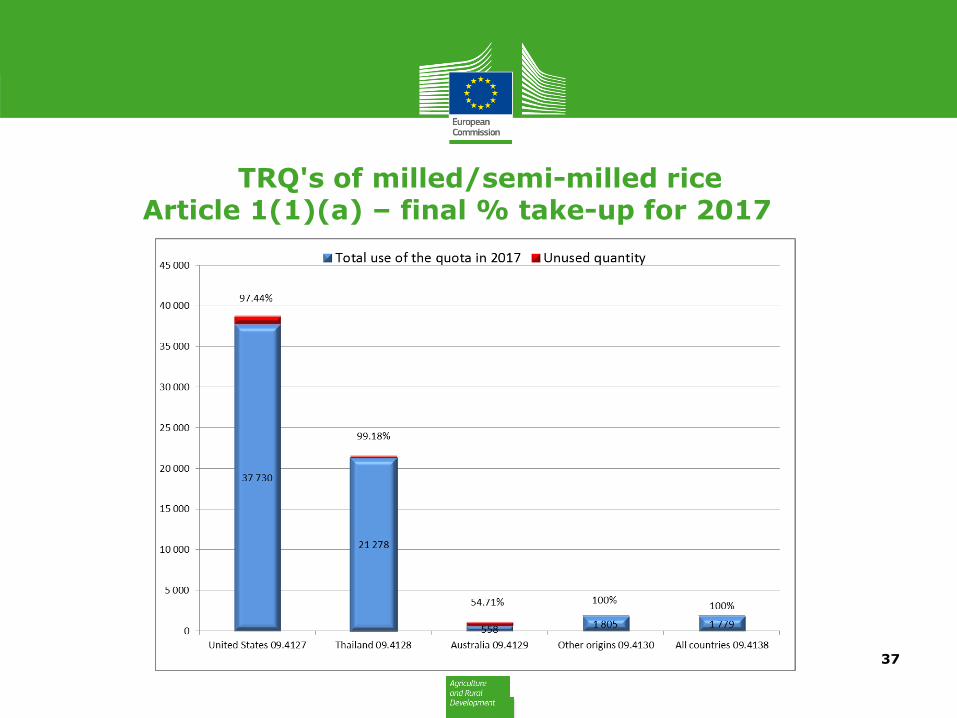
TRQ's of milled/semi-milled rice Article 1(1)(a) – final % take-up for 2017
37
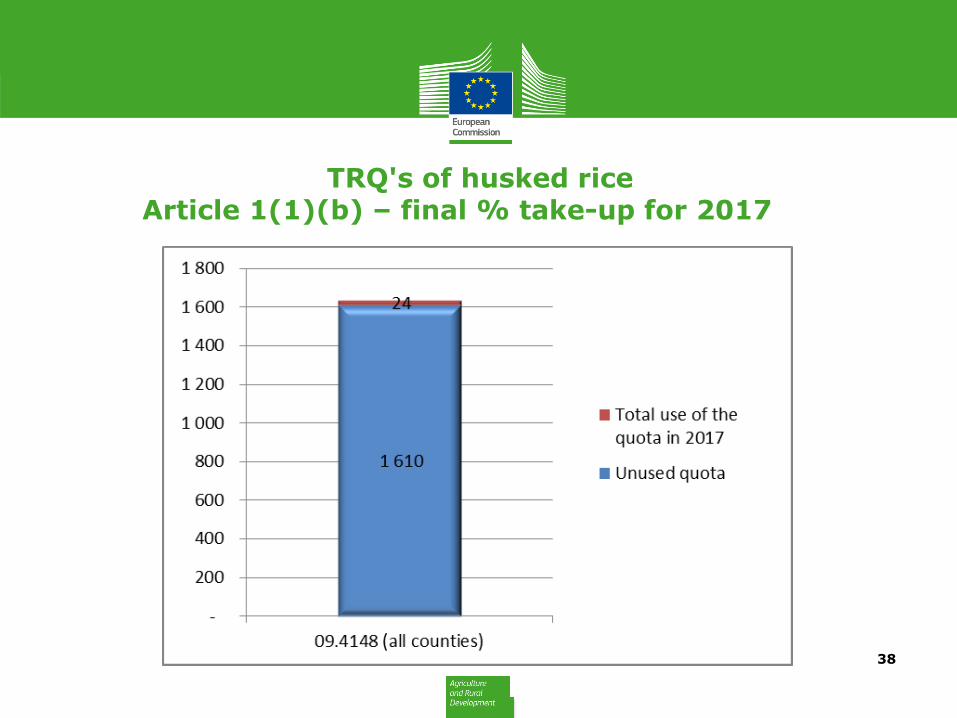
TRQ's of husked rice Article 1(1)(b) – final % take-up for 2017
38
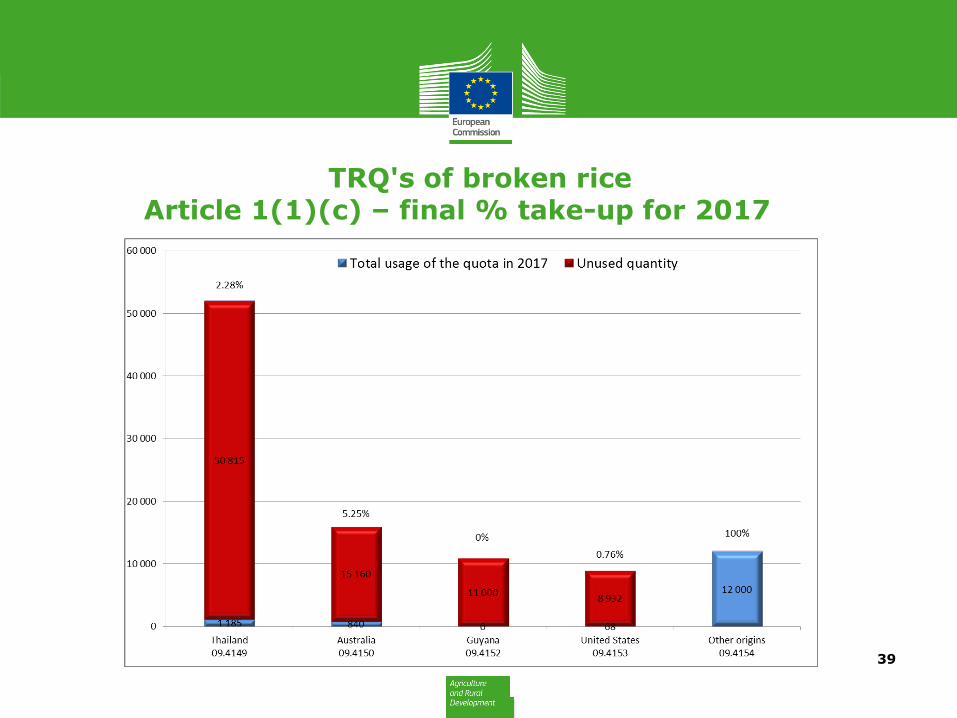
TRQ's of broken rice Article 1(1)(c) – final % take-up for 2017
39
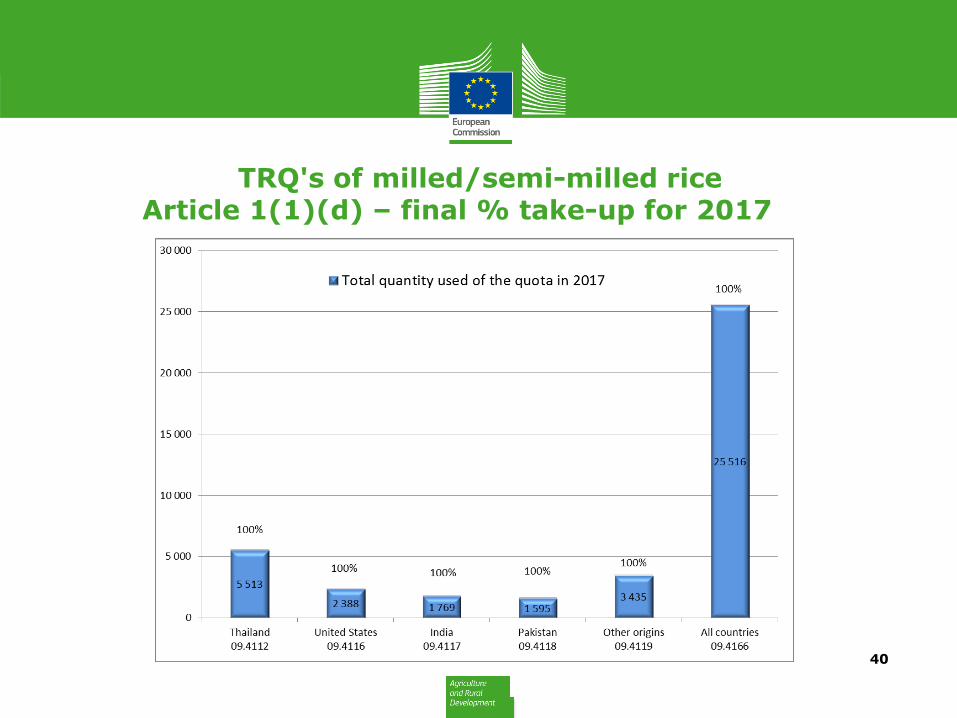
TRQ's of milled/semi-milled rice Article 1(1)(d) – final % take-up for 2017
40
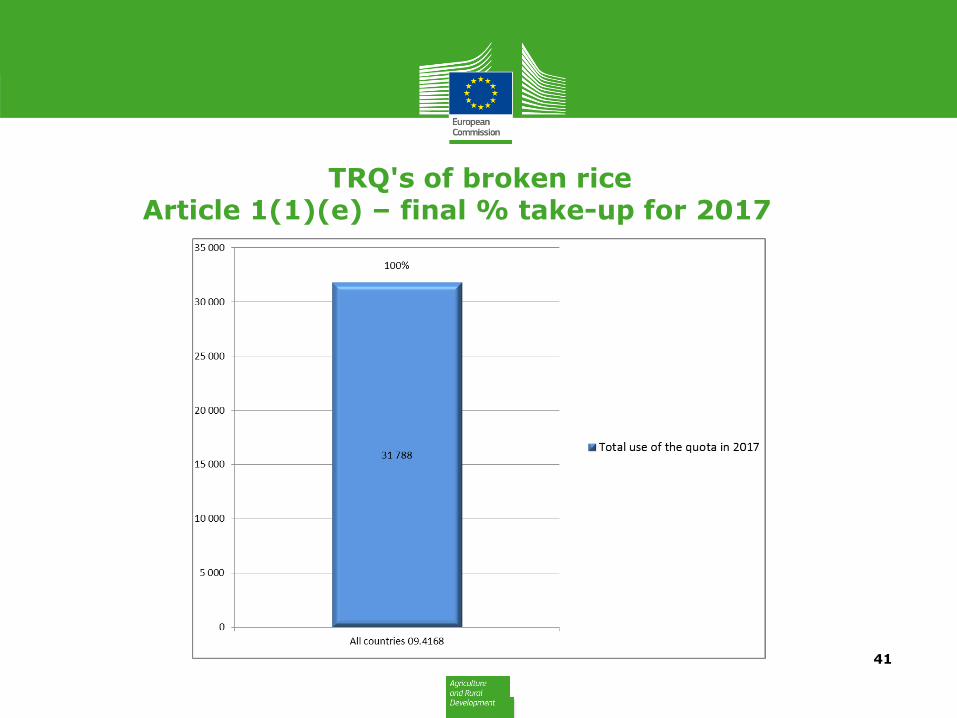
TRQ's of broken rice Article 1(1)(e) – final % take-up for 2017
41