13
RICHMOND, CA 94801 532 21ST ST

RICHMOND, CA 94801
532 21ST ST

Copyright © 2019 Transwestern. California Brokerage License #01263636. The following opinion is rendered to you with the disclosure and understanding that while Transwestern is experienced in marketing and evaluating commercial real estate, Transwestern employees do not hold
themselves out as professional appraisers of real property and are not licensed as such in any jurisdiction. This opinion is not, and should not be deemed as, an appraisal of the property. It may not be relied upon by any other person or entity for any purpose whatsoever. The addressee
is not authorized to divulge or disseminate this opinion, or the contents thereof, to any persons or entities other than its own employees, representatives, and contractors without the prior consent of Transwestern. All data is derived from sources deemed to be reliable but is
not guaranteed. The assumptions used in this analysis are based on market norms and are subject to change upon receipt of actual information from the Owner. This may change the Opinion of Value depending on the information provided.
TABLE OF CONTENTSTABLE OF CONTENTSThe Srinivasan Team 3
Property Overview 4
Rent Roll 5
Financial Summary 6
Sale Comparables 7
Market Snapshot 9
About Transwestern 11
THE
TE
AM
PR
OP
ER
TY
O
VE
RV
IEW
LOC
ATI
ON
O
VE
RV
IEW
FIN
AN
CIA
L
SUM
MA
RY
CO
MPA
RA
BLE
SM
AR
KE
T SN
AP
SHO
TA
BO
UT
US
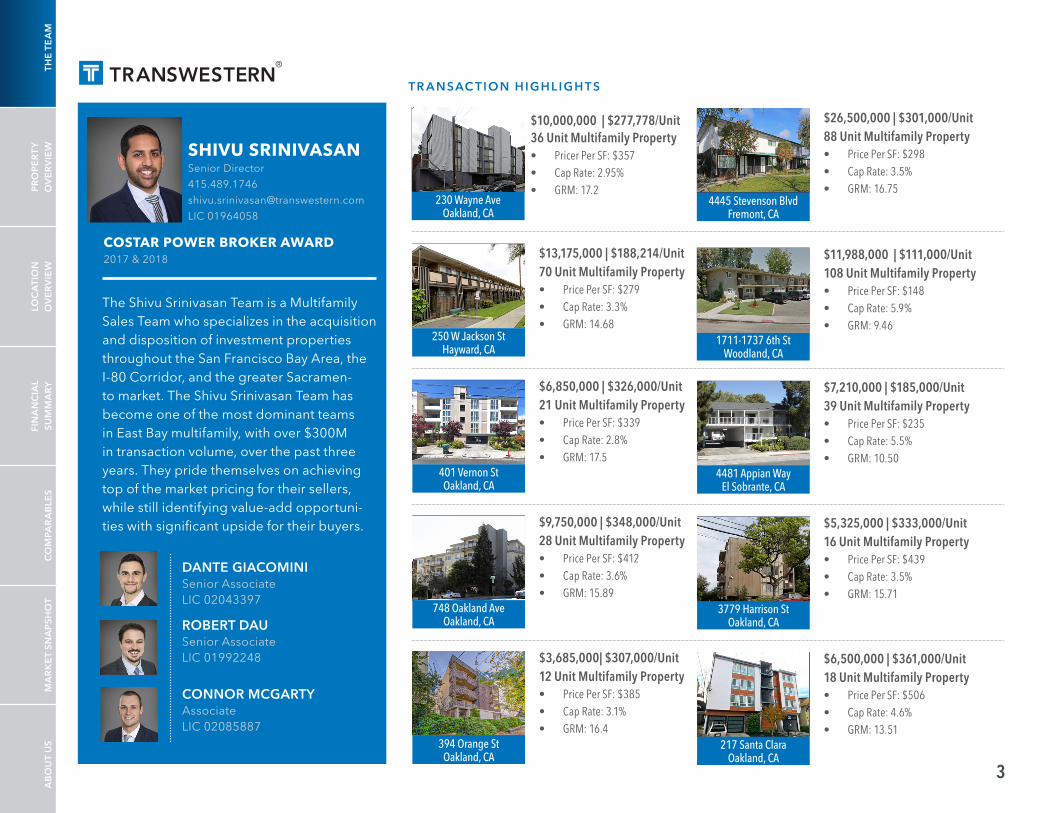
TR A NSAC TION H IGH LIGHT S
250 W Jackson St Hayward, CA
230 Wayne Ave Oakland, CA
4445 Stevenson Blvd Fremont, CA
1711-1737 6th St Woodland, CA
401 Vernon St Oakland, CA
748 Oakland Ave Oakland, CA
394 Orange St Oakland, CA
4481 Appian Way El Sobrante, CA
3779 Harrison St Oakland, CA
217 Santa Clara Oakland, CA
$10,000,000 | $277,778/Unit 36 Unit Multifamily Property• Pricer Per SF: $357• Cap Rate: 2.95%• GRM: 17.2
$11,988,000 | $111,000/Unit 108 Unit Multifamily Property• Price Per SF: $148• Cap Rate: 5.9%• GRM: 9.46
$6,850,000 | $326,000/Unit21 Unit Multifamily Property• Price Per SF: $339• Cap Rate: 2.8%• GRM: 17.5
$9,750,000 | $348,000/Unit28 Unit Multifamily Property• Price Per SF: $412• Cap Rate: 3.6%• GRM: 15.89
$3,685,000| $307,000/Unit12 Unit Multifamily Property• Price Per SF: $385• Cap Rate: 3.1%• GRM: 16.4
$7,210,000 | $185,000/Unit39 Unit Multifamily Property• Price Per SF: $235• Cap Rate: 5.5%• GRM: 10.50
$5,325,000 | $333,000/Unit16 Unit Multifamily Property• Price Per SF: $439• Cap Rate: 3.5%• GRM: 15.71
$6,500,000 | $361,000/Unit18 Unit Multifamily Property• Price Per SF: $506• Cap Rate: 4.6%• GRM: 13.51
$26,500,000 | $301,000/Unit 88 Unit Multifamily Property• Price Per SF: $298• Cap Rate: 3.5%• GRM: 16.75
$13,175,000 | $188,214/Unit 70 Unit Multifamily Property• Price Per SF: $279• Cap Rate: 3.3%• GRM: 14.68
SHIVU SRINIVASAN Senior Director
415.489.1746
LIC 01964058
The Shivu Srinivasan Team is a Multifamily Sales Team who specializes in the acquisition and disposition of investment properties throughout the San Francisco Bay Area, the I-80 Corridor, and the greater Sacramen-to market. The Shivu Srinivasan Team has become one of the most dominant teams in East Bay multifamily, with over $300M in transaction volume, over the past three years. They pride themselves on achieving top of the market pricing for their sellers, while still identifying value-add opportuni-ties with significant upside for their buyers.
DANTE GIACOMINISenior Associate LIC 02043397
ROBERT DAUSenior Associate LIC 01992248
CONNOR MCGARTYAssociate LIC 02085887
COSTAR POWER BROKER AWARD 2017 & 2018
3

PRICE ANALYSIS
Sales Price $1,450,000
Down 30% $435,000
PROPERTY OVERVIEW
APN 514-210-020-4
Units 5
Cost/Unit $290,000
Sqft 3,032
Cost/Sqft $478
Age 1990
Lot Size 5,650
CURRENT MARKET
GRM 11.85 9.67
CAP Rate 5.38% 7.19%
532 21ST STRICHMOND, CA 94801
4
PROPERTY OVERVIEWPROPERTY OVERVIEW
THE
TE
AM
PR
OP
ER
TY
O
VE
RV
IEW
LOC
ATI
ON
O
VE
RV
IEW
FIN
AN
CIA
L
SUM
MA
RY
CO
MPA
RA
BLE
SM
AR
KE
T SN
AP
SHO
TA
BO
UT
US

532 21ST STRICHMOND, CA 94801
5
UNIT # UNIT TYPE RENTS
Front House - 2BR/1BA $2,000 $2,500
2BR/1BA $1,800 $2,500
2BR/1BA $1,800 $2,500
2BR/1BA $2,100 $2,500
2BR/1BA $2,500 Vacant $2,500
Gross/month $10,200 $12,500Gross/annual $122,400 $150,000
RENT ROLLRENT ROLL
THE
TE
AM
PR
OP
ER
TY
O
VE
RV
IEW
LOC
ATI
ON
O
VE
RV
IEW
FIN
AN
CIA
L
SUM
MA
RY
CO
MPA
RA
BLE
SM
AR
KE
T SN
AP
SHO
TA
BO
UT
US

THE
TE
AM
PR
OP
ER
TY
O
VE
RV
IEW
LOC
ATI
ON
O
VE
RV
IEW
FIN
AN
CIA
L
SUM
MA
RY
CO
MPA
RA
BLE
SM
AR
KE
T SN
AP
SHO
TA
BO
UT
US
532 21ST STRICHMOND, CA 94801
FINANCIAL SUMMARYFINANCIAL SUMMARY
6
EXPENSESTax $20,562 1.42%
Special assessments $4,575 Actual
Garbage $3,419 Monthly extrapolated
Water $3,246 Monthly extrapolated
Maintenance $2,500 Estimate @ $500/unit
Pest control $1,140 Actual
Insurance $1,496 Actual
City of Richmond rental housing fee $1,000 Actual
Fire department permit to operate $118 Actual
Rental Property tax certificate $238 Actual
Annual Expenses $38,294 32.93%
INVESTMENT OVERVIEW CURRENT MARKETGSI $122,400 $150,000
Vacancy 5.0% 5.0%
Vacancy Loss $6,120 $7,500
GOI $116,280 $142,500.00
Expenses $38,294 $38,294
NOI $77,986 $104,206
Loan Payment -$54,694 -$54,693.64
Cash Flow $23,292 $49,512
Cash on Cash 5.35% 11.38%

THE
TE
AM
PR
OP
ER
TY
O
VE
RV
IEW
LOC
ATI
ON
O
VE
RV
IEW
FIN
AN
CIA
L
SUM
MA
RY
CO
MPA
RA
BLE
SM
AR
KE
T SN
AP
SHO
TA
BO
UT
US
532 21ST STRICHMOND, CA 94801
7

THE
TE
AM
PR
OP
ER
TY
O
VE
RV
IEW
LOC
ATI
ON
O
VE
RV
IEW
FIN
AN
CIA
L
SUM
MA
RY
CO
MPA
RA
BLE
SM
AR
KE
T SN
AP
SHO
TA
BO
UT
US
532 21ST STRICHMOND, CA 94801
8

THE
TE
AM
PR
OP
ER
TY
O
VE
RV
IEW
LOC
ATI
ON
O
VE
RV
IEW
FIN
AN
CIA
L
SUM
MA
RY
CO
MPA
RA
BLE
SM
AR
KE
T SN
AP
SHO
TA
BO
UT
US
532 21ST STRICHMOND, CA 94801
9

10The information provided herein was obtained from sources believed reliable; however, Transwestern makes no guarantees, warranties or representations as to the completeness or accuracy thereof. The presentation of this property is submitted subject to errors, omissions, change of price or conditions, prior sale or lease, or withdrawal without notice. Copyright © 2019 Transwestern.
532 21ST STRICHMOND, CA 94801
MARKET SNAPSHOTMARKET SNAPSHOT
Market Cap Rate
4.2%
4.4%
4.6%
4.8%
5.0%
5.2%
5.4%
5.6%
5.8%
6.0%
6.2%Forecast
11 12 13 14 15 16 17 18 19 20 21 22 23 24
© 2021 CoStar Realty Information Inc. 3/8/2021
Market Rent Per Unit & Rent Growth
$1.8K
$1.8K
$1.8K
$1.8K
$1.8K
$1.9K
$1.9K
$1.9K
Ren
tPer
Uni
t
$1.9K
$1.9K
$2K
$2K
-8%
-6%
-4%
-2%
0%
2%
4%
6%
8%
10%
12%
14%
Annu
alR
entG
row
th
Forecast
16 17 18 19 20 21 22 23 24
© 2021 CoStar Realty Information Inc. 3/8/2021
Absorption Units
(100)
(50)
0
50
100
150
200
250
Abso
rptio
nIn
Uni
ts
Forecast
16 17 18 19 20 21 22 23 24
© 2021 CoStar Realty Information Inc. 3/8/2021
Sales Volume & Market Sale Price Per Unit
$220K
$230K
$240K
$250K
$260K
$270K
$280K
$290K
$300K
Mar
ketS
ale
Pric
e/U
nit
$310K
$0
$20M
$40M
$60M
$80M
$100M
$120M
$140M
$160M
$180M
Sale
sVo
lum
e
Forecast
16 17 18 19 20 21 22 23 24
© 2021 CoStar Realty Information Inc. 3/8/2021
Absorption, Net Deliveries & Vacancy
(100)
(50)
0
50
100
150
200
250
300
350
Abso
rptio
n&
Net
Del
iverie
sIn
Uni
ts
3.5%
4.0%
4.5%
5.0%
5.5%
6.0%
6.5%
7.0%
7.5%
8.0%
Vaca
ncy
Rat
e
Forecast
11 12 13 14 15 16 17 18 19 20 21 22 23 24
© 2021 CoStar Realty Information Inc. 3/8/2021
Vacancy Rate
3.5%
4.0%
4.5%
5.0%
5.5%
6.0%
6.5%
7.0%
7.5%
8.0%Forecast
16 17 18 19 20 21 22 23 24
© 2021 CoStar Realty Information Inc. 3/8/2021
MARKET CAP RATE
MARKET RENT PER UNIT & RENT GROWTH
ABSORPTION UNITS
SALES VOLUME & MARKET SALE PRICE PER UNIT
ABSORPTION, NET DELIVERIES & VACANCY
MARKET CAP RATE
Source: CoStar & Transwestern
THE
TE
AM
PR
OP
ER
TY
O
VE
RV
IEW
LOC
ATI
ON
O
VE
RV
IEW
FIN
AN
CIA
L
SUM
MA
RY
CO
MPA
RA
BLE
SM
AR
KE
T SN
AP
SHO
TA
BO
UT
US

11The information provided herein was obtained from sources believed reliable; however, Transwestern makes no guarantees, warranties or representations as to the completeness or accuracy thereof. The presentation of this property is submitted subject to errors, omissions, change of price or conditions, prior sale or lease, or withdrawal without notice. Copyright © 2019 Transwestern.
532 21ST STRICHMOND, CA 94801
DEMOGRAPHICSDEMOGRAPHICS
THE
TE
AM
PR
OP
ER
TY
O
VE
RV
IEW
LOC
ATI
ON
O
VE
RV
IEW
FIN
AN
CIA
L
SUM
MA
RY
CO
MPA
RA
BLE
SM
AR
KE
T SN
AP
SHO
TA
BO
UT
US
POPULATION 1 MILE 3 MILES 5 MILES2019 Total Population 41,325 143,581 233,586
2024 Total Population 42,703 149,056 241,283
2019-2024 Population Growth 0.66% 0.75% 0.65%
INCOME 1 MILE 3 MILES 5 MILES2019 Median Household Income $47,193 $58,629 $75,239
2024 Median Household Income $55,048 $70,431 $86,766
2019 Average Household Income $63,276 $82,189 $104,768
2024 Average Household Income $75,550 $97,068 $122,771
2019 Per Capita Income $18,673 $27,675 $37,088
2024 Per Capita Income $22,225 $32,574 $43,291
2019 HOUSEHOLDS BY INCOME
Less than $15,000 15.2% 12.2% 9.5%
$15,000-$24,999 9.5% 8.1% 6.1%
$25,000-$34,999 11.2% 8.9% 7.5%
$35,000-$49,999 16.5% 13.5% 11.4%
$50,000-$74,999 17.5% 16.7% 15.3%
$75,000-$99,999 13.4% 13.8% 13.6%
$100,000-$149,999 11.3% 15.1% 16.6%
$150,000-$199,999 2.6% 5.2% 8.3%
$200,000+ 2.9% 6.4% 11.7%
2019 Median Household Disposable Income $47,193 $58,629 $75,239
HOUSEHOLDS 1 MILE 3 MILES 5 MILES2019 Total Households 12,216 48,363 82,587
2024 Total Households 12,587 50,042 84,963
2019-2024 Households Growth 0.60% 0.68% 0.57%
2019 Average Household Size 3.35 2.94 2.80
2019 Median Age 31.7 35.4 37.7

532 21ST STRICHMOND, CA 94801
The information provided herein was obtained from sources believed reliable; however, Transwestern makes no guarantees, warranties or representations as to the completeness or accuracy thereof. The presentation of this property is submitted subject to errors, omissions, change of price or conditions, prior sale or lease, or withdrawal without notice. Copyright © 2019 Transwestern. 12
5
Transwestern is one of the largest privately held full-service commercial real estate firms in the country.
Since its beginning in 1978, Transwestern has grown from a Houston development company, to a regional management services firm, to a full-service, national firm combining comprehensive national knowledge with outstanding local and regional market insights and highly effective execution capabilities.
ABOUT US
33OFFICESNATIONALLY
2,300+TEAM MEMBERS
219OFFICES WORLDWIDETHROUGH BNP PARIBAS
897PROJECTS TOTALING
$221.3MILLION SQUARE FEET
491TRANSACTIONSVALUED AT
$4.5BILLION
4,965TRANSACTIONSTOTALING
$57.3MILLION SQUARE FEETVALUED AT
$4.1BILLION
MANAGEMENT STATS CAPITAL MARKET STATSLEASING STATS
THE
TE
AM
PR
OP
ER
TY
O
VE
RV
IEW
LOC
ATI
ON
O
VE
RV
IEW
FIN
AN
CIA
L
SUM
MA
RY
CO
MPA
RA
BLE
SM
AR
KE
T SN
AP
SHO
TA
BO
UT
US

101 2nd St. Suite 300 | San Francisco, CA 94105
CA BROKERAGE LIC 01263636
www.transwestern.com
PRESENTED BY
SHIVU SRINIVASANSenior [email protected] LIC 01964058
DANTE GIACOMINISenior [email protected] LIC 02043397
ROBERT DAUSenior [email protected] LIC 01992248
CONNOR [email protected]# 02085887


