Page 1
Research Collection
Doctoral Thesis
Behavior of iodine species in oxidative processes during drinkingwater treatment
Author(s): Bichsel, Yves
Publication Date: 2000
Permanent Link: https://doi.org/10.3929/ethz-a-003861380
Rights / License: In Copyright - Non-Commercial Use Permitted
This page was generated automatically upon download from the ETH Zurich Research Collection. For moreinformation please consult the Terms of use.
ETH Library
Page 2
Diss. ETH No. 13429
Behavior of Iodine Species in
Oxidative Processes During
Drinking Water Treatment
A dissertation submitted to the
SWISS FEDERAL INSTITUTE OF TECHNOLOGY ZURICH
for the degree of
Doctor of Natural Sciences
presented by
YVES BICHSKL
Dipl. Chem. ETH
born December 30, 1971
citizen of Eggiwil
accepted on the recommendation of
Prof. Dr. Bernhard Wehrli, examiner
Prof. Dr. Willem H. Koppenol, co-examiner
Dr. Urs von Gunten, co-examiner
Dr. Auguste Bruchet, co-examiner
2000
Page 3
jBLJf £» M.ML M%>.
Mein herzlicher Dank geht an Urs von Gunten. der mich während der
vergangenen vier Jahre betreut hat. Auch in turbulenten Reorganisations¬
zeiten an der EAWAG hat er immer Zeit für meine Arbeit gehabt.
Ebensosehr danke ich meinen Kolleginnen und Kollegen aus der For¬
schungsgruppe für die gute Zusammenarbeit und Mithilfe für das Gelin¬
gen dieser Arbeit: Juan Acero. Silvio Canonica, Mike Elovitz, Hervé
Gallard, Edi Höhn, Suzanne M eitler, Yvonne Oliveras. Uli Pinkerneil,
Lisa Salhi, Konrad Stemmler. Weitere Personen an der EAWAG haben
mich in verschiedenster Hinsicht unterstützt: Urs Jans, Hans Kramer,
Hans-Ueh Laubscher. Hermann Mönch, Henning Raschke, Csaba
Reisinger, Winfried Suske, Monika Zemp.
Je voudrais remercier Auguste Bruchet de la Lyonnaise des Eaux pour
l'intérêt qu'il a apporté à mon travail et pour avoir accepté d'être co-
rapporteur de cette thèse. Je tiens à remercier également toute l'équipe du
CTRSEE pour le bon accueil qu'ils m'ont fail lors de mes visites au Pecq.
Enfin, je remercie la Lyonnaise des Eaux pour avoir soutenu ce projet
financièrement.
Ich danke Bernhard Wehrli. der meine Dissertation begleitet hat und das
Referat übernommen hat, sowie W.H. Koppenol für die Übernahme des
Korreferats.
Ich danke Jürg Hoigne für die Korrektur des 3. und 4. Kapitels sowie
Adrian Ammann für die Korrektur des 2. Kapitels.
Die (sonst nirgends erhältlichen) Standards für die Iod-Trihalomethane
wurden mir von F. Ventura, Societat General d'Aigües de Barcelona
(AGBAR), zur Verfügung gestellt.
Page 4
Meinen Eltern danke ich für die Unterstützung und Förderung während
meiner ganzen Ausbildungszeit.
Schliesslich danke ich meiner Frau, die mich im nicht-wissenschaftlichen
Teil der vergangenen vier Jahre begleitet und geliebt hat. Ich freue michO O CO
darauf, auch in Zukunft mit ihr durchs Leben zu gehen.
Page 5
Table of Contents
Summary 1
Zusammenfassung V
1. Introduction 1
LI Taste and Odor Problems in Drinking Water 1
Treatment
1.2 Aqueous Iodine Chemistry 7
1.3 Geochemistry of Iodine 14
1.4 Iodine Metabolism 18
1.5 Toxicological Aspects 21
1.(5 Iodine as a Drinking Water Disinfectant 22
2. Determination of Iodide and lodate by Ion
Chromatography with Postcolumn Reaction
and UV/Visible Detection i^
2.1 Introduction 25
2.2 Experimental Section 27
2.3 Results and Discussion 34
Page 6
3. Hypoiodous Acid: Kinetics of the Buffer-
Catalyzed Disproportionate!!41
3.1 Introduction 42
3.2 Experimental Section 44
3.3 Results and Discussion 47
3.4 Conclusions 58
4. Oxidation of Iodide and Hvpoiodous Acid int/ Jt
the Disinfection of Natural Waters 59
4.1 Introduction 60
4.2 Experimental Section 63
4.3 Results and Discussion 66
5. Formation of lodo-Trihalomethanes in
Natural and Model Waters 83
5.1 Introduction 84
5.2 Experimental Section 87
5.3 Results and Discussion 91
References i 19
Appendix A Overview of Equilibrium and Rate Constants 131
Appendix B l" and 10, in Natural and Treated Waters and 135
in Table Salts
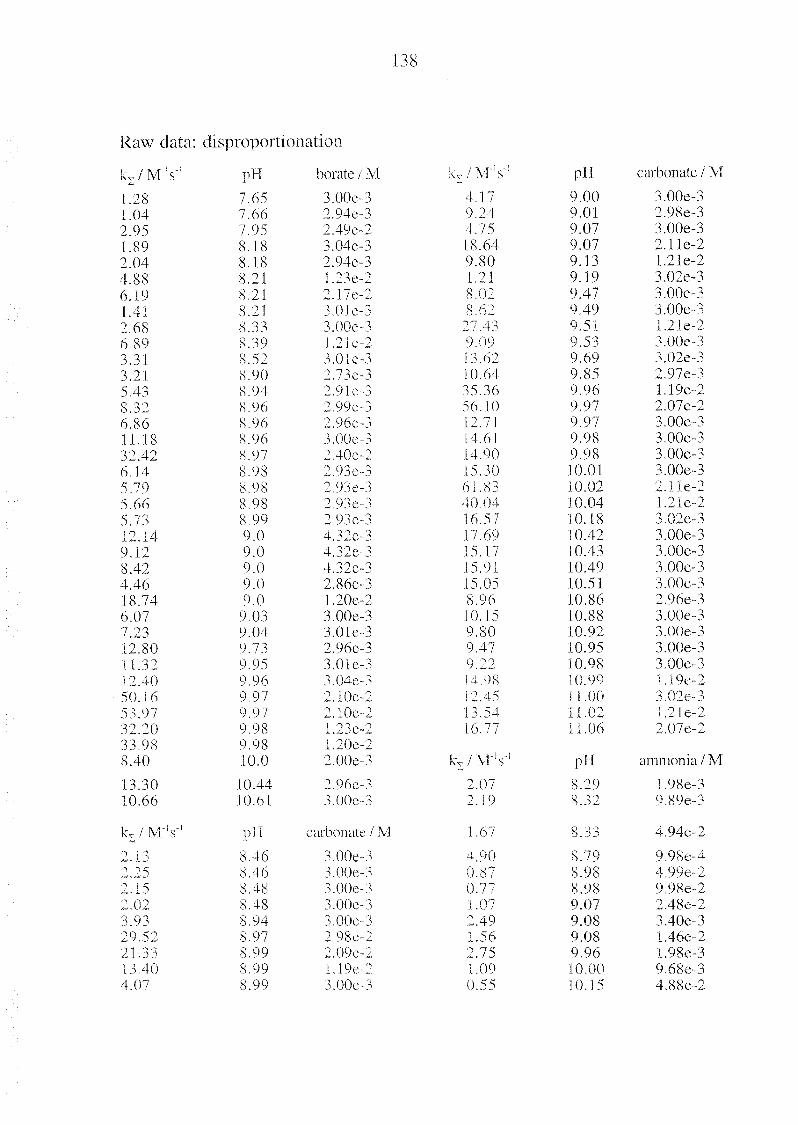
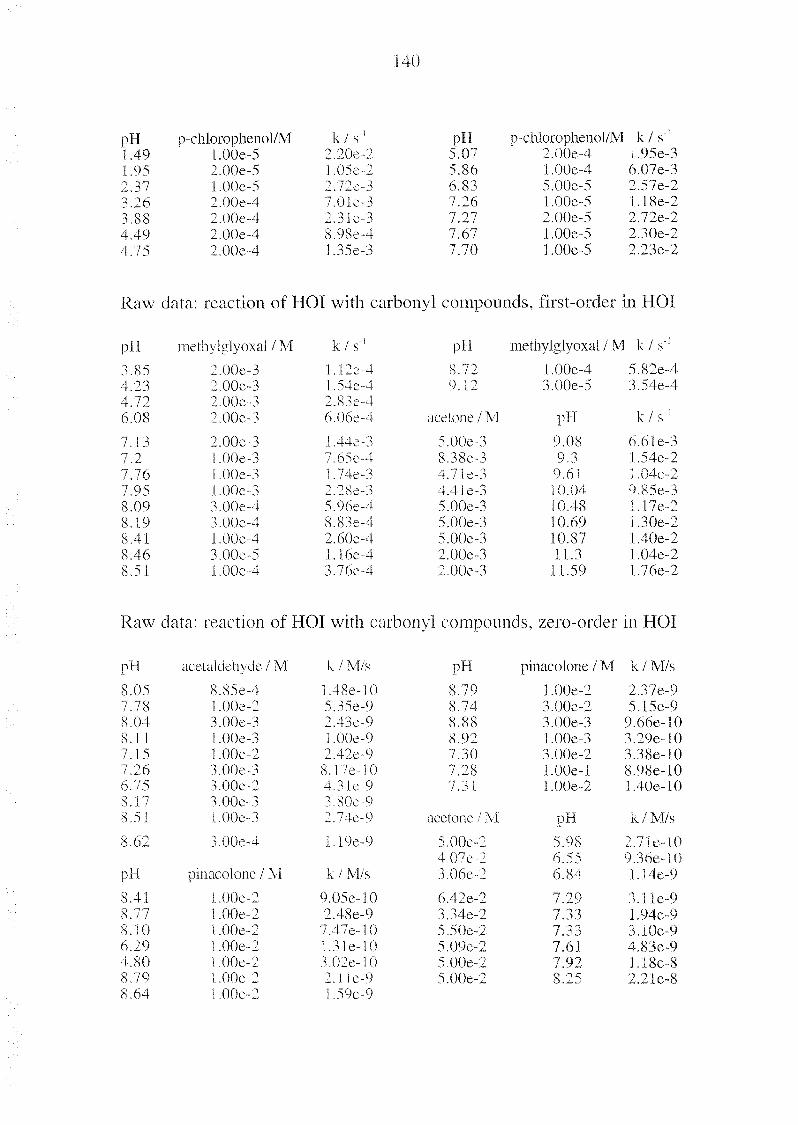
Appendix C Kinetic Raw Data 137
Curriculum Vitae
Page 7
I
Summary
lodo-trihalomethanes (I-THMs) are by-products of the oxidative treatment
of iodide-containing drmking waters. These compounds, especially iodo¬
form (CHI,), are undesired because they can be responsible for a bad taste
and odor. Naturally occurring precursors of T-THMs are iodide (I) and
natural organic matter (NOM). Several oxidants/disinfectants such as
ozone, chlorine, or chloramine oxidize 1" to hypoiodous acid (HOI) in a
fast reaction. Subsequently, HOI can react with NOM under formation of
1-THMs. Alternative sinks for HOI are its oxidation to iodate (I03~) or its
disproportionation, which leads to the formation of I and TO,".
To elucidate the potential of the formation of I-THMs during oxida¬
tive drinking water treatment, we investigated the reaction kinetics of
iodine species, especially HOI, with respect to the formation of iodine-
containing disinfection by-products.
Chapter 1 gives a general introduction into taste and odor problems,
iodine chemistry, geochemistry, metabolism, toxicity, and its use for wa¬
ter disinfection.
Chapter 2 deals with two new analytical methods for the determina¬
tion of the main inorganic iodine species, I and 10,. The methods consist
of an anion chromatography separation step followed by a postcolumn re¬
action and UV/vis detection. For the analysis of I. the interhalogen-
eompound IBr0 is formed by reaction of the analyte with hypobromite
(OBO and bromide (Br ). IBr," is detected at a wavelength of 249 nm.
This allows a detection limit of 0.1 ug Ï7L (0.8 iiM). For the analysis or
T03, triiodidc (I, ) is formed through reaction of the analyte with F and
H+. 1, is detected at a wavelength oi 288 nm. This leads to a detection
Page 8
II
limit of 0.1 pg IO7/L (0.6 nM). The detection limits for I" and IO-f allow
their determination in natural waters without sample pretreatment.
Chapter 3 reports kinetic data of the disproportionation of HOI, ac¬
cording to:
3 HOI -> 107 + 2 1 + 3 IT
This reaction was found to be catalyzed by anions such as borate, phos¬
phate, or carbonate. The half-life of HOI in natural waters due to the dis¬
proportionation lies between the two extremes of 4 days (50 ug/L HOI,
pH = 9,5 mM carbonate) and 3.5 years ( 1 ug/L HOI, pH = 6, no carbon¬
ate).
The oxidation kinetics of HOI and hypoiodite (OF) for the reaction
with ozone, chlorine, and chloraminc are described in chapter 4. Ozone
oxidizes both HOT and OT in fast reactions (k0^HOf = 3.6 x 10⁴ M"V;
k0,+01 = 1.6 x 10⁶ M 's '). These high rate constants lead to a HOI half-life
of < 4 s for typical ozonation conditions (0.25-2 mg/L 03, pH = 6-9).
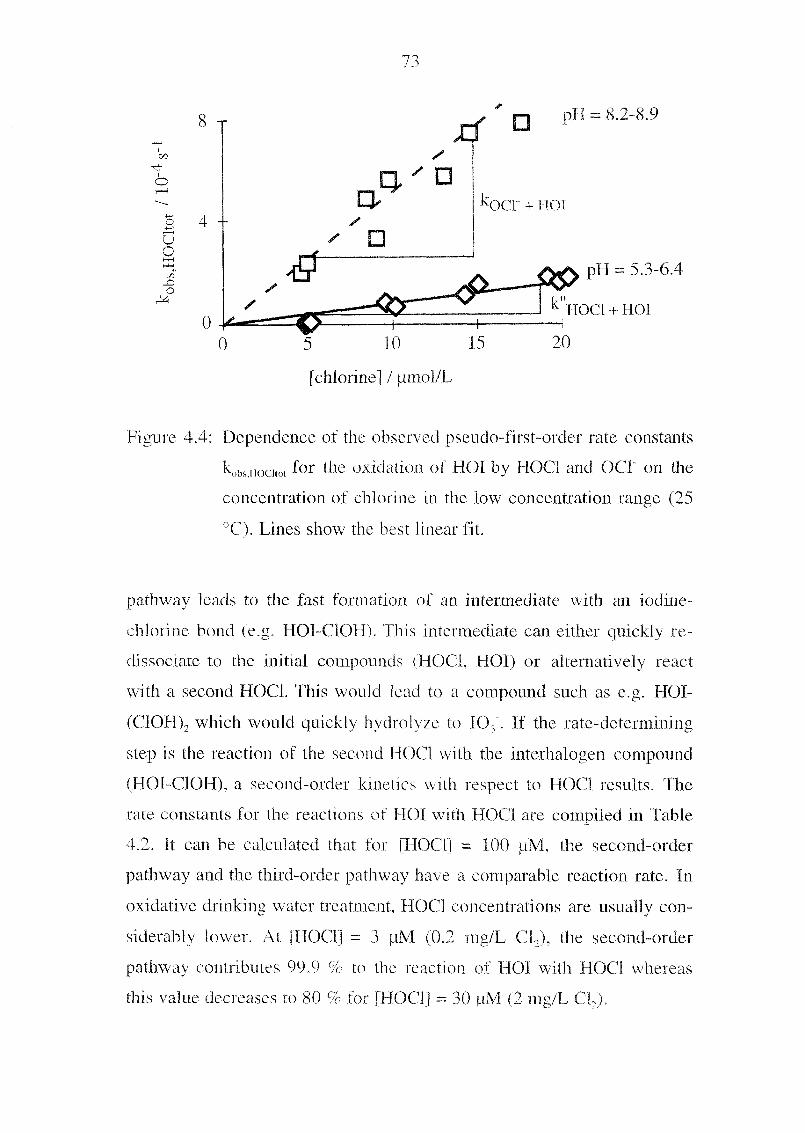
Chlorine species oxidize HOT by a combination of second- and third-order
reactions (k"n0CUH0I= 8.2 M"'s 7 k" }lon+IIOI= 8.3 x 10⁴ M"V; kocl +I10I=
52 M"'s l). Typical HOI half-lifes in chlorination processes are between
8 min (2 mg/L CI,, pH = 9) and 10 h (0.2 mg/L Cl2, pH = 6). The prod¬
uct of HOI oxidation by both ozone and chlorine is I03". Chloramine does
not oxidize HOI.
Finally, kinetics of HOI consumption as well as formation of T-THMs
and 105 were investigated both in model and in natural waters (chapter
5). Phenols and in a smaller extent a-methyl carbonyl compounds were
found to be reactive toward HOI and to yield CHL. For phenols, the rate
constants for the consumption of HOI varied over almost 9 orders of
magnitude from 1.5 M's1 to 7 x 10' M's'. For a-methyl carbonyl
Page 9
Ill
compounds, kinetics were either first-order in [HOI] (0.05 - 12 M 's ') or
zero-order in [HOI] (5 x 10⁹
- 4 x 10"6 «;"'). The normalized yield and
iormation rate of CHI, per cai bon decreased in the ordet resorcinol > a-
methyl carbonyl compounds > phenol. The formation of I-THMs was sig¬
nificantly slower than the consumption of HOI. Therefore, it can be hy¬
pothesized that the addition reaction of HOI is not rate-determining in the
formation of I-THMs but rather a final hydrolysis step.
In the ozonation of natural waters, no 1-THMs were detected and
more than 90% of I was transformed to 10,. Chlorine led to the forma¬
tion of both 10, and I-THMs. With increasing chlorine doses, the CHI,
formation decreased but the 107 formation as well as the formation of
mixed I-THMs such as CHCLT and of classical THMs such as chloroform
increased. In chloramination processes, I-THMs (especially CHI,) were
the main products. A comparison of reaction kinetics in model and in
natural waters shows that the I- fHM formation in natural waters can be
explained by the presence of phenolic entities in the NOM.
In conclusion, the formation of CHIA in drinking waters is in compe¬
tition with the oxidation of" HOI to 10," and the oxidation of THM-
precursor sites in the NOM. The disproportionation is too slow to have an
influence on the half-life of HOI. The oxidation of HOI to 10," is domi¬
nant in ozonation processes but can also be important in chlorination
processes. The oxidation of THM-precursors is only important in
chlorine-based processes where it leads to the formation of mixed I-THMs
rather than CHI,. In chloranimation, processes however, the two compet¬
ing reactions do not prevent the CHI,-formation. fhe probability of CH1,-
formation in oxidative processes during dnnkmg water disinfection there¬
fore increases in the order ozone < chlorine < chloraminc.
Page 11
V
Zusammenfassung
Tod-Trihalomethane (1-THM) können während der oxidativen Aufberei¬
tung von iodidhaltigen Trinkwässern als Desinfektionsnebenprodukte ge¬
bildet werden. Unter diesen Verbindungen ist vor allem Iodoform (CHI,)
unerwünscht, da es dem Trinkwasser einen Geruch und Geschmack geben
kann. Die natürlich vorkommenden Vorläufer der I-THM sind lodid (T)
und natürliches organisches Material (NOM). Verschiedene Oxidations-
und Desinfektionsmittel der Trhikwasseraufbereitung wie z.B. Ozon,
Chlor oder Chloramin oxidieren F in einer schnellen Reaktion zur unter-
iodigen Säure (HOI). HOI kann dann durch Reaktion mit dem NOM I-
THM bilden. In Konkurrenz dazu kann HOI aber auch zu Todat (IO,) oxi-
diert werden oder in einer Disproportionierung zu I und 10, reagieren.
Um die Bildung von I-THM charakterisieren zu können, haben wir
die Kinetik von Reaktionen verschiedener lod-Spczies, v.a. von HOI, in
Bezug auf die Bildung iodhaitiger Nebenprodukte in der oxidativen
Trinkwasseraufbereitung untersucht.
Kapitel i gibt eine Einführung in die Problematik von schlechtem
Geruch und Geschmack, in die wässrige Chemie von lod, dessen Geoche¬
mie, Metabolismus, Toxizität sowie Gebrauch als Desinfektionsmittel.
Im zweiten Kapitel werden zwei neue Analysenmethoden für die
Quantifizierung von F und IO," in natürlichen Wässern vorgestellt. Sie ba¬
sieren auf einer ionenchromatographisehen Trennung, der eine Nachsäu-
lenreaktion und eine UV/Vis-Detektion foleen. Für die Bestimmung von T
wird durch Reaktion mit Hypobromit (OBiA und Bromid (BF) die Inter-
lialogenverbindung !Br2 erzeugt. Durch deren Detektion bei einer Wel¬
lenlänge von 249 nm kann eine Nachweisgrenze von 0.1 ug/L I (0.8 nM)
erreicht werden. Für die Analyse von IO, wird durch Reaktion mit F und
Page 12
VI
H+ I, gebildet. Die Detektion von I," bei einer Wellenlänge von 288 nm
führt zu einer Nachweisgrenze von 0.1 ug/L IO, (0.6 nM).
Das dritte Kapitel dieser Arbeit geht auf die Kinetik der Dispropoi-
tionierung von HOI ein:
3 HOI -> 107 + 21 +3H*
Diese Reaktion wird durch Amonen (z.B. Borat, Phosphat, Carbonat)
katalysiert. Die FTalbwertszeit von HOI liegt im Bereich von 4 Tagen (50
ug/L HOI, pH = 9, 5 raM Carbonat) bis 3.5 Jahren (1 pg/L HOI, pH = 6,
ohne Carbonat).
Die Kinetik der Oxidation von HOI und Hypoiodit (OF) durch Ozon,
Chlor und Chloramin wird im Kapitel 4 beschrieben. Die Oxidation von
HOT und Ol durch Ozon läuft sehr schnell ab (k0,+fI0, = 3.6 x lO'M's';
k0,+0( = 1.6 x 10b M 's '). Die Halbwertszeit von HOI in einem typischen
Ozonungsprozess (0.25-2 mg/L 0„ pH = 6-9) ist < 4 s. Chlorspezies oxi-
dieren HOI in einer Kombination von Reaktionen zweiter und dritter
Ordnung (k"H001+ll0)= 8.2 M's1; k"-HOCM101 = 8.3 x 10⁴ M"2s '; kocl+HOI =
52 M 's '). Die Halbwertszeit von HOI in Anwesenheit von Chlor bewegt
sich zwischen 8 min (2 mg/L CF, pH = 9) und 10 h (0.2 mg/L Cl,, pH =
6). Das Produkt der Oxidation von HOI durch Ozon und Chlor ist IO,.
Chloramin reagiert nicht mit HOF
Im letzten Teil dieser Arbeit wurden die Kinetiken des HOI-Abbaus
sowie der Bildung von 1-THM und von IO, in Modell- und in natürlichen
Wässern untersucht (Kapitel 5). Phenole und in kleinerem Ausmass a-
Methylcarbonylverbindungen reagieren mit HOI und ergeben dabei CHI,.
Die gemessenen Geschwindigkeitskonstanten der Phenole mit HOT erstie-
cken sich über einen Bereich von fast 9 Grossenordnungen (1.5 M"ls'bis
7 x 10⁸ M"'s 7. Die Kinetik der Reaktion mit a-Methvlcarbonvlverbmdun-
Page 13
vu
gen kann sowohl erster Ordnung in IHOI] (0.05-12 M's ') als auch nullter
Ordnung in [HOI] (5 x 10"q - 4 x IO"6 s"1) sein. Die pro Kohlenstoff nor¬
mierte Ausbeute und Bildungsrate von CHI, nimmt in der Reihenfolge Re-
sorcin > a-Methylcarbonyle > Phenol ab. Die Kinetik des HOI-Abbaus
war signifikant schneller als die Kinetik der I-THM-Bildung. Dies deutet
darauf hin, dass nicht die Addition von HOI der geschwindigkeitsbestim¬
mende Schritt dieser Reaktion ist, sondern die abschliessende Hydrolyse.
In der Ozonung von natürlichen Wässern wurde der grösste Teil des
HOI zu 10, oxidiert. I-THM wurden keine nachgewiesen. In den Chlo¬
rungsexperimenten wurden verschiedene Mengen von IO," und I-THM ge¬
funden. Hohe Chlordosen führten zur vermehrten Bildung von IO," und
von klassischen Trihalomethanen wie z.B. Chloroform. Gleichzeitig wur¬
de die Bildung von CHI, abgeschwächt. Die höchsten CHI,~Konzentratio-
nen wurden bei der Anwendung von Chloramin gefunden. Der Vergleich
der Kinetiken in Modell- und in natürlichen Systemen zeigt, dass Phe¬
nolgruppen im NOM für die beobachteten Effekte verantwortlich sein
können.
Abschliessend lässt sich sagen, dass die Bildung von CHI, in der
Trinkwasseraufbereitung in Konkurrenz zur Oxidation von HOI zu IO,"
und zur Oxidation von THM-Vorläufergruppen im NOM steht. Die Dis-
proportionierung hat keinen Einfluss auf das Verhalten von HOI. Die
Oxidation von HOT zu 107 dominiert in Ozonungsprozessen, kann aber
auch in Chlorungsprozessen von Bedeutung sein. Die Oxidation der THM-
Vorläufcrgruppen ist in Anwesenheit von Chlor wichtig und führt zur
Bildung von gemischten 1-THM wie z.B. CHCF1 statt von CHI,. In Chlor-
aminpiozessen können die zwei Konkurrenzreaktionen die Bildung von
CHI, nicht verhindern. Die Wahrscheinlichkeit der Bildung von CHI,
während der oxidativen Trinkwasseraufbereitung nimmt somit in der Rei¬
henfolge Ozon < Chlor < Chloramin zu.
Page 14
1
1. Introduction
1.1 Taste and Odor Problems in Drinking Water
Treatment
Drinking water of a good quality has neither a taste nor an odor. How¬
ever, this goal is not easy to achieve. Since taste and odor can be caused
by minute amounts of impurities, it is often an analytical challenge to find
the link between undesired organoleptic attributes and the responsible
chemical compound. This is in general a prerequisite for the effective and
reliable control of the water quality. Furthermore, the appearance of taste
and odor problems is dependent on a large number of factors such as
changing raw water quality, treatment, and post-treatment conditions.
It is not easy to find a precise and reproducible measure for the pres¬
ence and the intensity of taste or odor. A tool which tries to meet these
criteria is the flavor profile analysis (FPA; Bartels et al., 1986). Accord¬
ing to this method, a number of panelists taste and smell the sample m a
standardized procedure. They describe the sample with descriptors such as
e.g. chlorinous. musty, or grassy and assign them an intensity. If they
disagree on a specific aspect of a water, a consensus is developed by dis¬
cussing the results.
The description of a taste can be reduced to the four fundamental
sensations sweet, sour, salty, and bitter. Such a reduction is not possible
for odors although a classification into 8 to 34 fundamental odors makes
sense for practical reasons (Amoore, 1986). Another possibility for the
classification of the odors is to define them b\ standard reference com¬
pounds. In such a way, earthy (geosmin), fruity (nonanal), musty
(2-methyJisoborneol), old grass (hexanalF almond (benzaidehyde).
Page 15
cucumber (nonenal). shoe polish (cumene) and other odors were stan¬
dardized.
In a survey of the American Water Works Association in 1996, 40 %
of the water utilities declared to be affected by taste and odor problems
(Suffet et al, 1996). Especially utilities treating surface waters were con¬
cerned. They report customer complaints because of bad tastes and odors
which are described as earthy, fislrv. chlorine, medicinal, sour, metallic,
and more. In average, water utilities spent 4.5 % of their total budget to
cope with these problems.
Organoleptic problems in drinking waters result from natural, in¬
dustrial, or treatment processes (Bartels et al, 1986). Compounds which
originate from natural processes such as algal metabolites are frequently
the reason for bad taste and odor. Examples arc geosmin, methyl-
isoborneol, or 2-isopropyl-3-methoxypyrazme. Geosmin is one of the
compounds with the lowest taste and odor threshold ever determined (10 -
20 ng/L; Young et al., 1996). One case of geosmin occurrence was re¬
ported in a drinking water derived from a river water in Philadelphia
where concentrations of up to 120 ng/L geosmin were detected in several
episodes which lasted 10 to 30 da\s (Burlingame et al, 1986). The reason
for the high geosmin concentrations was an unusual growth of algae as the
result of a drought. The removal of natural compounds with taste and
odor can occur by adsorption on activated carbon or by ozonation proc¬
esses (Burlingame et al., 1986; Anselme et al, 19897
Other sources of compounds which lead to bad taste and odor are
chemical pollutants which are present in the raw water and not removed
during treatment. Examples lor such compounds are benzaldehyde,
chlorobenzene. or benzothiazole (Bartels et al., 1986) Leaching of sub¬
stances from pipes or tubes during storage and distribution of the finished
drinking waters may also lead to raste and odor problems.
Page 16
3
Finally, chemical reactions which occur during water treatment (e.g.
disinfection) may lead to the formation of by-products with undesired or-
ganoleptical properties. In 1967, the drinking water in Zurich was con¬
taminated by phenol which was deliberately introduced into the lake
Zurich by a laundry company ( Nägel 1, 1969). Upon chlorination of this
water, chlorophenol was formed which resulted in bad taste and odor.
60'000 people were affected by this incident. Subsequently, the disinfec¬
tant was changed to ozone. However, this incident had the positive side-
effect that broad parts of the society became aware of the importance of
the protection of water resources.
Another group of compounds which can be formed during drinking
water treatment and which can result in taste and odor problems are the
iodo-trihalomethanes (I-THMs). Theii presence in oxidized drinking wa¬
ter has been discovered more than 20 years ago when developments in gas
chromatography first allowed a screening for organic water contaminants.
Several authors reported the presence of dichloroiodomethane (CHCFI) in
chlorinated drinking water (Bunn et al., 1975; Giger et al., 1976). During
a monitoring survey for organic micropollutants in the United Stares,
CHCFJ was found m 85 of 111 finished drinking waters (Brass et al.,
1977). Bunn et al. (1975) added halides to a raw water before chlorina¬
tion. By this means, they could form all 10 chloro-, bromo-, iodo-, and
mixed trihalomethanes and detect them by GC/MS. In the late 1980s, it
was discovered that l-THMs can be responsible for taste and odor prob¬
lems in the drinking water. Table 1.1 lists all FHMs together with their
taste and odor threshold concentrations. The taste and odor of CHI, was
described as medicinal or pharmaceutical (Flansson et al., 1987; Suez
Lyonnaise des Eaux, 1993). The taste of CHC1, was described as metallic
and sweet, its odor as chemical and antiseptic CYoung et al., 1996).
Page 17
4
Table 1.1 Trihalomethanes and Their Taste and Odor Threshold
Concentrations
Taste and odor threshold in rcf.
Chloroform CHCF 100 - 20C
Bromodichloromethane CHBrCF 5
Dibromochloromethane CFIBrXl
Bromoform CHBr, 5
Dichloroiodomelhane CFICU 6
Chlorodiiodomethane CHC1L 9
Dibromoiodomethane CHBrJ 3
Bromodiiodomethane CHBrF 0.1
Bromochloroiodomethane CHBrCll 5
Iodoform CHI, 0.03 - 1
a: Young et al., 1996; b: Khiari, 1999; c: Suez Lyonnaise des Eaux, 1993.
I-THMs can be formed through reaction of hypoiodous acid (HOD
with natural organic matter (NOM). HOI is usually not present in natural
waters but it is produced from naturally occurring iodide (I ) in oxidative
treatment steps by ozone, chlorine, or chloramine. In competition to the
addition to NOM, HOI can also disproportionate or be further oxidized by
disinfectants and thus transformed to lodate (10,7 Figure 1.1 shows a
representation of these reactions which lead to the formation of TO,, 1-
TFIMs, or other organic iodine-containing disinfection by-products.
Page 18
5
r
\fast oxidation byozone, chlorine,
cliloramine
HOI/OI
T- + IO3"
Figure 1.1: Fate of iodine during oxidative drinking water treatment
processes: IO7 and iodoorganic compounds as possible sinks.
To be able to predict the significance of the above mentioned reac¬
tions, rate constants for different reactions of HOI which are relevant for
drinking water practice were measured in laboratory systems. Chapter 3
gives an account of a study of the kinetics of the disproportionation of
HOI. The oxidation of HOI bv ozone, chlorine, and cliloramine was in-
vestigated in chapter 4. Finally, chapter 5 reports rate constants of reac¬
tions of HOI with model organic compounds and kinetic data of the for¬
mation of I-THMs and IO7 in natural waters under varying oxidation
conditions (ozone, chlorine, cliloramine). Analytical methods for the
monitoring of the inorganic species F and 10, 111 natural waters were also
developed (see chapter 2).
Cases of taste and odor problems in drinking water utilities related to
1-THMs have been reported in Australia, France, and the United States. A
strong medicinal taste appeared in the drinking water at Mundaring Weir
Lorg
reaction with NOM
further oxidation^ IO3'
by the disinfectant
disproportionate!
Page 19
6
(Australia) after the disinfection of the distribution system was changed
from chlorination to chloramination (Hansson et al., 1987). Several I-
TFIMs (CHI,, CHOL, CHBrJ, CHBrP, CHBrClI) were detected in the
chloraminated water. Due to the lack of analytical standards for the mixed
1-THMs, only CHI, could be quantified. Levels of up to 8 ug/L CHI, were
found after oxidation by 3 mg/L cliloramine (pH = 8; I" = 90 ug/L). How¬
ever. CFII, was only formed when ammonia was added before chlorine.
When ammonia was added 80 s after chlorine, the resulting CHF concen¬
tration was < 1 ug/L. Hence, the taste and odor problems were resolved
by reversing the order of addition of ammonia and chlorine.
In France, three cases of I-THM formation are reported by Bruchet
et al. (1989). In a chlorinated well water from the Paris region, CFICFI,
CHBrJ, and CHI, were detected. This water exhibited a strong medicinal
taste and odor. In another well water (90 ug/L F), formation of CHBrJ,
CHBrl2, and CHI, in an ozone-based treatment train led to a strong me¬
dicinal taste. However, the appearance of the 1-THMs was due to im¬
proper operation of the ozonation step. Chlorination of an ammonia-rich
ground water yielded CHI, when chlorine was dosed below the break¬
point. After the chlorination was replaced bv an ozonation, no similar epi¬
sodes were reported any more.
In the United States, medicinal taste and odor due to I-THMs was re¬
ported in a chloraminated water for years (Gittelman & Yohe, 1989). All
sixI-TFIMs could be detected in that water. The taste and odor problems
were significantly reduced by delaying the addition of ammonia by 5 mln
with respect to chlorine addition. A delay of 30 s did not improve the
situation.
Page 20
7
1.2 Aqueous Iodine Chemistry
Elemental iodine was discovered by Courtois in 1811 when he was pre¬
paring saltpeter from acidified seaweed ash to produce gunpowder for the
Napoleonic wars (Courtois, 1813). Gay-Lussac (1814) subsequently stud¬
ied some properties of the new element and named it 'ioeides' after the
Greek word for 'violet', which is the color of iodine vapor. In the fol¬
lowing section, the thermodynamics and kinetics of iodine in aqueous so¬
lutions are discussed.
1.2.1 Thermodynamics
The most common aqueous iodine species are listed in Table 1.2. Their
main reactions are presented in Table 1.3.
The first reaction in Table 1.3 (eq. f. 1) is the hydrolysis of elemental
iodine (12) to iodide (F) and hypoiodous acid (HOI). At high pH values,
HOI dissociates to form hypoiodite (OF) with a pKa of 10.4 (see chapter
3). At low pH, FLOE is formed through protonation of HOI (pKa = 1.4;
Bell & Gelles, 1951). The equilibrium concentrations of these species for
a total I2 concentration of 1 uM (250 ug/L) are shown in Fig. 1.2. At low
pH. L is the dominating species. At neutral and slightly basic pH, HOI and
F become important and at pH > 10. OF is formed from HOI. The rela¬
tive amount of FIOI and 01 increases with decreasing iodine concentra¬
tion. For total I2 < 100 nM (25 ug/L), [HOI] + [OT'l > [I2] for any pH > 5.
Page 21
Table 1.2: Aqueous Iodine Species11
chemical customary
formula name
TUPAC name (Leigh, 1990) oxidation
number
I Iodide lodide(J-) -I
h Iodine Dhodine 0
17 Triiodide Triiodide(l A -1/3
FLOU Dihydrogen oxoiodate(l+) +1
HOT Hypoiodous
acid
Hydrogen oxoiodate +1
OF Hypoiodite Oxoiodate(l-) +1
107 Todite Dioxoiodate(L) +111
mo, Iodic acid Hydrogen trioxoiodate +V
107 lodate Trioxoiodate(l-) +V
I04 Penodate Tetroxoiodatef 1A +VII
1
Throughout this work, the customan names irom the second column of Table 1.2 will
be used
Page 22
9
0 -+ 6 10
pH
14
Figure 1.2: pH-dependent speciation of iodine (total concentration 1 pM
F).
HOI can further react through a disproportionation to I03 and I (eq.
1.2). The equilibrium of this reaction, which was not considered in Fig.
1.2, lies to more than 99 % on the right-hand side for environmental con¬
ditions (pH > 6, total iodine < 2 pM (250 ug/L)). At low pFI, 107 can be
protonated to iodic acid (HI03) which has a pKa of 0.8 (Pelhybridge &
Priic. 1967). Penodate (I04") can be formed by an electrochemical oxida¬
tion of lOf on a PbO, anode (Greenwood & Earnshaw, 1984).
Analytical methods for the determination of aqueous iodine species
are reviewed and described in chapter 2 of this thesis.
Page 23
10
Table 1.3: Reactions of Aqueous Iodine Species
equation
F + ILO = HOI + T + H+
3 HOI = 10, + 2 F + 3 IT
F + I = 17
K ref. no.
5.44 x 10n
a Fl
6x IO"11 b 1.2
725 a 1.3
a: Burger & Liebhalskv. 1973; b: Sammet, 1905
t»~i
.2
5-4
I.Ot-
0.8-
0.6-
ö 04o
oo
0. 9
0
HOI
\
\
F
/
\ /
x /
\/
A/ \
/ \
/\
/\/
\
//
y V./\\
\
/
p3—+
:0-8 IO-ö 10-4 10-- 100
rr-i/M
Figure 1.3: Speciation of 1 uM HOI at pH = 7 for varving free I concen¬
trations.
Page 24
il
I2 is transformed to triiodide (I7) in presence of I (eq. 1.3). 12, HOI,
and OF are all transformed to Ï7 for [II = 0.1 M and pH < IF For pH =
7. the speciation of HOI is shown at different free [F] in Fig. 1.3. At |_I~~| <
10 6M, HOI is the dominating species. With increasing [T], the appear¬
ance of I2, If, and finally 142~ can be observed. I7 has a strong UV/Vis ab¬
sorption band with two maxima at 288 nm (e = 38'200 M"lcm"') and at
351 nm (e = 25'700 M 'cm '; see chapter 2).
In addition to F and l/\ other polyiodide anions such as I7 or Ifi2~
can be formed through reactions of [\ F. and I3" (Rainette & Sandford,
1965; Genser & Gonnick, 1973; Sano et al., 1984). Mixed interhalogen
compounds (e.g. ICI, IC127 I2CF, IBr. TBr7. I2Br ) can be formed from
HOI and F in the presence of CF and Br ( Margerum et ai., 1986; Wang et
al., 1989; Troy et al., 1991). Similarly to If, these compounds have high
absorption coefficients. The equilibrium constants for the formation of all
these species are shown in Table 1.4.
The standard reduction potentials for the aqueous iodine species at
pH = 0 and pFT = 14 are given in Fig. 1.4.
Appendix A gives an overview over all equilibrium constants which
are mentioned and used in this work.
Page 25
1 i^é
Table 1.4 Equilibrium Constants for the Formation of Poly-
iodide and Interhalogen Compounds at 25 °C.
equilibrium K
F, +1 =I42- 0.184
I3 + L = I, 9
2 1, =I6- 0.41
ICI, =1C1 + CF 0 013
I2 + C1- = LC1 1.7
ICI + H20 = HOI + CI + H+ 8.2x10'
IBr, = IBr + Bi 0.035
IBr = 1 +FBr 2 \ 10"
IBr + H00 = HOI + H+ + Br 2 4 x 10⁷
ionic
strength / M
0.023
0.5-1.0
0.5
1.0
1.0
0.5
réf.
d
d
ai Genser & Conmck, 1973; b: Rainette & Sandford, 1965; c: Sano et al.
1984; d: Wang et al., 1989; e: Margerum et al, 1986; f: Troy et al., 1991
Page 26
13
f1.194
0.536T
1.439 1.34T^
1.653T^
T. ^ i2 ^ HOÏ -* IO3- ^ IO4- pH = 0
t 0.987
0.485
fI-
Q-536x
0.4340?
t 0.26
0.15IO3- pH= 14
Figure 1.4: Standard reduction potentials in volts of various inorganic
iodine species, adapted from Greenwood & Earnshaw (1984).
1.2.2 Kinetics
Ilie kinetics of the equilibrium reaction 1.1 are very fast (see eq. 1.4). F
reacts with OIT and forms the intermediate LOH" (Lengyel et al., 1993).
This decays rapidly to HOI and I.The back reaction of eq. 1.1 is very
fast too. HOI reacts with T and yields LOH (Eigen & Kustin, 1962). This
has two possibilities to be transformed to F. It can either decompose to I,
and OH 01 react with H" and form F and HAF
F,
8x 10⁸ M-V1 x[OH"|He».
^
6.9xl05s-l-"<•
2.2xl0l°M-A-lx[H+
LOH-.3x fOV1
5x f09M-1s-JHOI + F (1.4)
The kinetics of reaction 1.2 are quite slow. Rate-determining steps
are the reactions HOI+01 and HOI+HOl. the latter being catalyzed by
Page 27
14
anions such as carbonate, borate, or phosphate. lodite (I02) is postulated
to be a minor, unstable intermediate which is quickly further oxidized to
IO7. Chapter 3 of this thesis presents a detailed study of the kinetics of re¬
action 1.2 (disproportionation of HOI). The back reaction of eq. 1.2 is re¬
ported to be first-order in I03, second-order in F, and second-order in H+
(k = 3.0 x 10⁸ M"V; Barton & Wright, 1968). Catalysis by anions such as
carboxylate and phosphate was also observed for the back reaction. The
kinetics of reaction 1.3 are very fast (k,^, = 6.2 x 10⁹ M"V, kn = 8.5 x
106s7 Turner et ai., 1972).
The above mentioned rate constants are also shown in the Appendix
A together with all the rate constants which were measured in this work.
1.3 Geochemistry of Iodine
Iodine is a minor element in the natural environment (see Table 1.5). Its
main geochemical reservoir is the sea. The dominant iodine species in
deep seawater is lOf which is the thermodynamicaily stable species. In the
sea, transformation of F to lOf may occur by bacterial processes but
probably not by chemical oxidation (Luther et al., 1995). In the surface
waters (< 100 m depth) however, 10, concentrations are reduced by 10 -
30 % and corresponding amounts of I appear (McTaggart et al., 1994;
Tian et al., 1996). The observed IO; reduction in the surface waters is
probably due to a biological process (Luther et al., 1995). Marine organ¬
isms such as phytoplankton and bacteria are known 1o take up TO, and to
release I (Moisan et ai.. 1994: Councell et ai., 1997). The major part of
ozone which is deposited onto the sea surface reacts with I (Garland &
Curtis, 1981). The reaction between O, and F is very fast and leads to
HOI which probably further reacts with natural organic matter.
Page 28
15
Marine algae, which contain up to 2 mg I/g dry weight, or phyto-
plankton release iodoorganic compounds such as Iodoform, bromodi-
iodomethane. dibromoiodomethane, bromochloroiodomethane, di-
iodomethane, chloroiodomethane, bromoiodomethane, methyl iodide,
ethyl iodide, Fbromo-2-iodoethane, 2-iodoethanol, 1-iodopropane, 2-
iodopropane, iodoacetone, 1-iodobutane. 2-iodobutane, and l-iodo-2-
mcthylpropane to the seawater (Moore, 1977; Gschwend et al., 1985;
Fuge & Johnson, 1986; Klick & Abrahamsson. 1992; Gribble, 1994;
Moore et al., 1996: Giese et al., 1999). The compound which was found
in the highest concentrations is CHJ (0.F10 ng/L in marine surface wa¬
ter; Lovelock, 1975; Moore & Tokarczyk, 1992; Reifenhäuser & Heu¬
mann, 1992).
Table 1.5: Iodine Concentrations in the Environment
(Whitehead, 1984; Fuge & Johnson, 1986)
Seawater 45 - 60 pg/F
Rainwater 0.5 - 5 pg/L
River and lake water 0.5 - 20 pg/L
Groundwater 1-100 pg/L
Oilfield brine 20 - 300 pg/L
Atmosphere 10 - 20 ng/nF
Igneous rocks 0.08 0.5 mg/kg
Sedimentary rocks 0.2- 10 mg/kg
Marine sediments 3 - 400 mg/kg
Soils 0.5 - 20 mg/kg
Page 29
16
CH7J and many other iodoalkanes are volatile compounds. Hence,
they may evaporate and be responsible for a transfer of iodine to the at¬
mosphere. There. CHJ has been found in concentrations of 0.05 - 5 ppt
(Yokouchi et al., 1997). Other processes such as the reaction of T with 03
or the light-induced oxidation of I might also contribute to the transfer of
iodine to the atmosphere by formation of volatile species (Miyake &
Tsunogai, 1963; Thompson & Zafiriou, 1983). All these processes lead to
an enhanced volatilization of iodine when compared to other elements
such as chlorine. The LCI ratio in sea-salt particles and in the atmosphere
is a factor of 500 - lO'OOO higher than in the seawater (Duce et al., 1963;
Cicerone, 1981; Sturges & Barrie, 1988).
Volatilized iodoalkanes are not stable because of the weakness of the
carbon-iodine bond. Their life-time in the sunlit atmosphere is less than
1 h (Mössingcr et al., 1998). Photolysis leads to I radicals which react
with (X to IO (Wayne et al., 1995). However, this reaction is not signifi¬
cant for the overall ozone destruction in the troposphere. The principal
iodine reservoir species are HOF IONO,, and FO, (Wayne et al., 1995).
In the stratosphere, iodine is present as IO during the day and as ION02
during the night. Recent articles report an IO concentration of < 0.5 pptv
in the stratosphere. The authors conclude that iodine does not contribute
to stratospheric ozone loss (Wennberg et al., 1997; Pundt et al., 1998).
Part of atmospheric iodine enters the cloud and rainwater. Iodine
concentrations m rainwater are usual!} m the range 0.5 - 5 pg/L but
sometimes concentrations of up to 20 pg/L were reported (Duce et al.,
1963; Fuge & Johnson, 1986; Campos et al., 1996). The fact that the sea is
the source of iodine is reflected by decreasing iodine concentrations in
continental rain with increasing distance from the sea (Fig. 1.5). T and
IO, usually occm at similar concentrations in rainwater. In river waters
however, the speciation is shifted toward 1 which accounts for about
Page 30
17
90 % of total iodine. Fhe total iodine concentration in surface waters is in
the same range as in rainwater (Wong, 1991).
• 5 0 -i 1 1 1 ! 1 1
0 200 400 600
distance from the sea / km
Figure 1.5: Iodine concentrations in the rain at different distances from
the sea (Krupp & Aumann. 1999).
Iodine concentrations in soils and rocks are quite low. The average
crustal abundance of 0.46 mg/kg is the lowest of the halogens with the ob¬
vious exception of astatine. For soil concentrations, the same gradient as
for rainwater can be observed: Iodine is enriched in soils near the sea
coast and depleted mside the continents (Fuge & Johnson, 1986). Soil
iodine is not mobile. It is reported to be associated with humic material or
with clay.
The geochemical cycle of iodine is hardly influenced by human ac¬
tivities. Anthropogenic iodine sources can be neglected compared to the
natural sources. Howevei, the release of radioactive iodine during acci¬
dents m nuclear power plants ma\ be of high significance even if iodine
Page 31
18
concentrations are very low. The main iodine isotope which was dis¬
charged to the environment at the Chernobyl site was mI (t[/2 = 8.02 d).
Rainwater concentrations of niI were as high as 7240 Bq/L (1.5 x IO"12
g/L) in Wiesbaden, Germany (Hoffmann et al., 1987). The same authors
found 300 Bq/L (6 x IO-11 g/L) m cow milk and 45.5 Bq/L (9.5 x 10_"
g/L) in mother's milk. In Switzerland, concentiations of up to 22 Bq/L
(4.6 x 10iS
g/L) were found in a ground water (Waber et al., 1987). In
the medicine, iodine-containing compounds are used as X-ray contrast
agents. These compounds are not degraded neither in the human body nor
in waste water treatment plants nor in the environment. They were found
at concentrations of up to 8 pg/L (4 pg/L I) in run-offs of waste water
treatment plants and up to 2.4 pg/L m ground water (Ternes et al., 1999).
The iodine-containing X-ray contrast agents were also detected in several
drinking waters.
1.4 Iodine Metabolism
Iodine supply through the nutrition is essential for humans, mammals,
birds, reptiles, amphibians, and fish (Alexander, 1984). The dietary
iodine requirement for adult human beings is 80 - 150 pg per day (WFIO,
1996). Upon ingestion, iodine is absorbed in the gastrointestinal tract and
actively transported into the thyroid. This 25-g gland is situated near the
throat and contains more than 80 c/c ol the total iodine (15-20 mg) in an
adult (Hetzel & Maberly, 1986). This is enough for about three months
supply. Two iodine-containing hormones, thyroxine (T7 and triiodothy¬
ronine (T,) are synthesized in the thvroid and released to the blood (see
Fig. 1.6). Receptor sites for 17 and 1, are present in cell-nuclei of the hy¬
pophysis, the liver, the kidney, the heart, and the central nervous system.
Page 32
19
In the fetus, neonate, and child, thyroid hormones exert a major influence
on cellular differentiation, growth, and development.
HO- O-• COOH
NFF
HO-
Th\ roxine (T4)
•o-
Triiodothyronine (T3)
COOH
NH'
Figure 1.6: Chemical structures of two iodine-containing hormones.
Insufficient iodine supply can evoke serious health problems. Main
iodine deficiency disorders in adults are goiter (swelling of the thyroid
gland) and impaired mental function such as apathy and cretinism (Hetze!
& Maberly, 1986; Delange et al., 1993). In children, iodine deficiency
leads to retarded physical and mental development what results in lifelong
disabilities. During pregnancy, iodine deficiency can lead to abortions and
stillbirths. These disorders are endemic. Regions with a low natural iodine
input from the sea such as central continental areas te.g. central Asia,
central Africa), mountainous regions (e.g. Himalayas, Andes, and Alps)
Page 33
20
and areas of high rainfall (e.g. India, Indonesia, Oceania) are especially
affected (Fuge, 1987). The link between the above mentioned health
problems and insufficient dietary iodine supply was already found in the
19lh century (Langer, 1960).
In 1922, iodine addition to the table salt was introduced in Switzer¬
land what led to a dramatic decrease ol the goitre prevalence. Today,
many countries apply this practice. The developed countries have been
quite successful in the battle against iodine deficiency disorders although
some problems still are present. Changing nutrition habits are a new
challenge for the achievement of a sufficient iodine supply of the whole
population. In developing countries, millions of people are still severely
affected by iodine deficiency disorders. Addition of iodine to foodstuff
requires a well-organized system. Furthermore, food supply is often
based on subsistence agriculture what complicates the systematic addition
of iodine. Other possibilities are the injection or ingestion of iodized oil.
A single administration of iodized oil provides enough iodine for several
years. Further hindrances of efficient iodine supply programs are social
factors such as skepticism against governmental actions or strong influ¬
ences of traditions. In Hotien (China) for example, people refused to use
iodized salt because they feared that the supplements contained contracep¬
tives (Xin-Min et al., 1997). In this case, iodine was added to the irriga¬
tion water. This resulted in a dramatically reduced children mortality by
50 % and in an increase m the number of sheep in the herds by 43 %.
These positive effects lasted for at least 3 years after a unique addition of
iodine to the irrigation water.
Page 34
21
1.5 Toxicological Aspects
As mentioned above, 10, is a possible by-product of disinfection of io¬
dide-containing drinking waters. Since both chlorate (CIO-, ) and bromate
(BrOf) are known to be toxic, the question of the toxicity of IO, has to
be raised (WHO, 1996). Ingested 10, was quickly reduced to F in vivo by
rats and rabbits as well as in vitro in whole blood and in glutathione solu¬
tions (Taurog et al., 1966). The m \ivo reduction occurred within less
than 3 min and took place whether 10, was administered orally or intra¬
venously. Rat whole blood reduced 150 mg/L 10, to I within 2 min. This
reaction also takes place in dogs. This is indicated by a study where ele¬
vated I levels in urine were found after the administration of 200 mg/kg
oflO, (Webster et al.. 1966).
Acute toxicity data show similar results for both F and 107- Oral
LD50 (lethal dose for 50 % of the population) m mice was 1000 mg/kg lor
IO, and 1600 mg/kg for I (Webster et al.. 1957). However, a consider¬
able difference between the two species was observed for intravenous in¬
jection. LDM) was 100 mg/kg for 10, and > 1200 mg/kg for I. Another
study compared the mutagenic effects of the different halogenates
(Eckhardt et al., 1981). While CIO." and BrOf showed mutagenic activity,
IO, had no such effect neither in the Ames test, nor in the micronucleus
test on mouse bone marrow, nor in the recessive-lethal test in Drosophila.
The absence of mutagenic activity for IO, was also demonstrated in an¬
other study (Andersen, 1995).
For human consumption, an intake ol 2 mg iodine per day is consid¬
ered to be excessive b\ some authors (WHO, 1996). However, in some
Japanese regions, daily iodine intakes of 50 - 80 mg through consumption
of seafood do not lead to health effects. The FAO (Food and Agriculture
Organization of the United Nations) and the WFIO (World Health Organi-
Page 35
zation) have set a provisional maximum tolerable daily intake of 1 mg/day
based on data of the effects of F.
The toxicity of T,F, and IO, to aquatic organisms (rainbow trout
and Daphnia magna) was tested by La\eroek et al. ( 1995). Rainbow trout
were most sensitive to F (LC50 (lethal concentration for 50 % of the
population) > 0.53 mg/L) and less sensitive to 10," (LQ0 > 220 mg/L) and
F (LQ0 > 860 mg/L). Daphnia magna were equally sensitive to I2 (LC50 >
0.17 mg/L) and I (LCS0 > 0.16 mg/L) and less sensitive to IO," (LC50 >
10.3 mg/L).
1.6 Iodine as a Drinking Water Disinfectant
Elemental iodine (12) is an effective and economic water disinfectant
(Gottardi, 1983). According to a manufacturer's instruction, a dose of 13
- 18 mg/L L should be used during 20 min to ensure bacterial disinfection
(Gerba et al., 1997). However, this was not sufficient for the complete in-
activation of Cryptosporidium parvum oocysts. In practice, iodine is ap¬
plied for drinking water disinfection during emergency situations such as
earthquakes or floods, or in remote areas by travelers, campers, or sol¬
diers. Another remote area is the space where NASA has used iodine as a
drinking water disinfectant since the Apollo missions m 1969 and will
continue to use it on the International Space Station (ISS; Atwater et al.,
1996).
Iodine is released to the water by anionic resins which are loaded
with polyiodide anions such as 1,". Fhe possibility to store these resins
during several months m a dry state has advantages over conventional
drinking water disinfectants such as ozone or chlorine which require an in
situ production or storage of aggressive chemicals. The drawbacks of
iodine are Us limited stability m water because of the disproportionation
Page 36
25
of HOI which leads to the inactive F and I03", its loss through volatiliza¬
tion, and the possible manifestation of bad taste and odor due to iodoform.
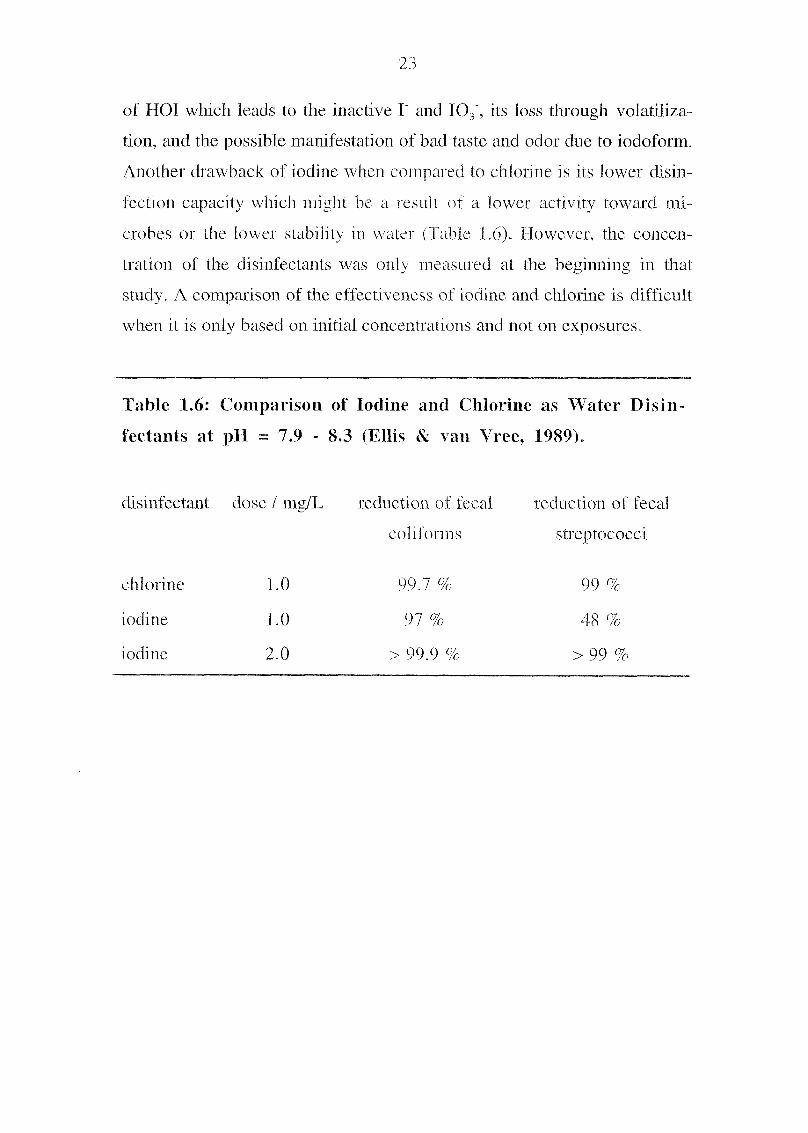
Another drawback of iodine when compared to chlorine is its lower disin¬
fection capacity which might be a result of a lower activity toward mi¬
crobes or the lower stability m water (Table 1.6). However, the concen¬
tration of the disinfectants was only measured at the beginning in that
study. A comparison of the effectiveness of iodine and chlorine is difficult
when it is only based on initial concentrations and not on exposures.
Table 1.6: Comparison of Iodine and Chlorine as Water Disin¬
fectants at pH = 7.9 - 8.3 (Ellis & van Vree, 1989).
disinfectant dose / mg/L
chlorine 1.0
iodine 1.0
iodine 2.0
reduction of fecal reduction of fecal
coliforms streptococci
99.7 % 99 %
97 % 48 %
> 99.9 OL >99 OL
Page 37
\
* V
v... As
„—***
Page 38
25
2. Determination of Iodide and
lodate by Ion Chromatography
with Postcolumn Reaction and
UV/Visible Detection
Y. Bichsel and U. von Gunten, Analytical Chemistry 71(1), 34-38 (1999).
Iodide and iodate can be determined by two new methods using anion-
exchange chromatography with postcolumn reaction and UV/visible detec¬
tion. Iodide is determined as IBr2" at 249 nm. lodate is determined as I," at
288 nm. The analyses can be run completely automatically and do not re¬
quire any sample pre-treatment. The detection limits are 0.1 pg/L (0.8
nM) for iodide and 0.1 pg/L (0.6 nM) for iodate. The methods have been
successfully applied to determine iodide and iodate in several mineral
waters and in drinking water as well as for the determination of iodide in
table salt.
2.1 Introduction
The need to determine iodide and iodate in environmental samples (> 0.5
pg/L) has arisen because iodine may play a role in taste and odor prob¬
lems in drinking water (Whitehead, 1984; Ftansson et al., 1987).
In the literature, many methods have been proposed for the determi¬
nation of the different iodine species in water One example is the iodide-
catalyzed oxidation of Jeuco crystal violet by N-chlorosuccinimide
(Lambert et ai.. 1975). This reaction is monitored spectrophotometncally.
Page 39
26
and its rate is dependent on the iodide concentration. The detection limit
in distilled water is 2 pg/L. However, in natural waters, the solutions be¬
come turbid and make measurements impossible. Another possibility for
the determination of iodide, iodine, and iodate is the formation of an iodi-
nated phenol in a preeolumn denvati/ation procedure and its detection
with GC/MS (Shin et al., 1996). This method has a detection limit of 0.5
pg/L for all three species but it requires an extensive sample pretreat-
liient.
There arc numerous methods for determination of iodide and iodate
with an ion-exchange Chromatograph}. Determination of iodide with an-
ion-exchange chromatography and electrochemical detection yielded a
detection limit of 10 pg/L (Han et al., 1987). However, after injection of
environmental samples, the sensitivity decreased dramatically. This effect
was probably due to matrix components which adsorbed to the electrode
surface during the measurement. Iodide can be determined with anion
chromatography and direct UV/visible detection after preconcentration of
a 6 inL sample which leads to a detection limit of 0.1 pg/L (Ito, 1997).
This method relies on a preconcentration step and may therefore be sus¬
ceptible to undesired matrix effects, e.g., overloading of the preconcen¬
tration column with matrix anions such as CI, S042", and HCO,. Iodate
can be determined by amon-exchange chromatography and postcolumn
reaction with UV/visible detection of Br, (detection limit 0.1 pg/L; Wein¬
berg & Yamada, 1998).
Our new methods are based on anion-exchange chromatography
with postcolumn reactions and UV/visible detection as well. Iodide and
iodate are determined under different chromatographic conditions:
(i) Iodide is determined as IBi\ which is formed after the ion chro¬
matographic (IC) separation step m a bromide-containing ehient. The
Page 40
-)-]
interhalogen compound is formed through addition of a basic hy-
pobromite solution with subsequent acidification:
F + OBr + Br + 2 FF = TBr: + ILO (2.1)
(ii) lodate is determined as F which is formed after the IC separa¬
tion step through addition of an iodide solution and subsequent acidifica¬
tion:
lOf + 8 I" + 6 H" = 3 F + 3 FFO(2-2)
The postcolumn reactions are quantitative and selective and allow
détermination of low quantities with minimal interferences of other ani¬
ons. The methods are not dependent on sophisticated or expensive labo¬
ratory equipment. They are simple, robust and well suited for routine
analysis.
2.2 Experimental Section
2.2.1 Apparatus
Figure 2.1 shows the general outline of the ion chromatography system.
The measurements were carried out on two systems, a Dionex DX-500
system (Dionex, Sunnyvale, CA) and a Sykam S1000 system (Gauting,
Germany). The postcolumn reagent was added by a Dionex PC 10 reagent
delivery module via a KEL-F mixing tee. The eluent was acidified by an
ASRS-I membrane-exchange suppressor (Dionex) run m the chemical
suppression mode. UV/visible detection was performed by a Spectroflow
773 absorbance detector (Kratos, Ramsey, NJ). The cluents and the post-
column reagents were kept under a helium atmosphere. For further de¬
tails of the apparatus see Table 2. F
Page 41
Table 2.1 General Conditions
sample loop volume
reaction coil volume
régénèrent
régénèrent flow rate
eluent flow rate
postcolumn reagent flow rate
iodide
eluent
guard column
analytical column
postcolumn reagent
detector wavelength
iodate
eluent
guard column
analytical column
postcolumn reagent
detector wavelength
for the Analyses
500 pL
750 pL (0.37 mm)
45()niMH,S0t
3 niL/min
1.5 mL/min
0.5 mL/min
60 mM NaBr, 1 mM NaOH
Dionex AG 1 F 4 mm i.d.
Dionex AS 11,4 mm i.d.
5 pM Br2, 2 mM NaOH
249 nm
40 mM B(OH),, 20 mM NaOH
Dionex AG 9, 4 mm i.d.
Dionex AS 9, 4 mm i.d.
250 mM KI
288 nm
Page 42
»ample
loop
HPLCpLimp
(eluent)
mixingtee
(onl
yiodate
analyis)
(onl
yiodide
anal
ysis
)
ICsepa
rati
oncolumns
""'""O
i.0000
lippi^^öui"~ÜWU
i
reactioncoil
post-column
-eagentpump
11
waste
H2SO4
suppressor a
waste
H2SO4
auto
samp
ler
UV/Vis-
detector
twaste
to
Figu
re2.1
:Outlineofthecomponentsoftheapparatus.Thesuppressorwasplaced
betweenthereaction
coiland
thedetectorfortheiodidean
alys
isandbetween
themixing
teeandthereactioncoilfortheiodate
analysis.
Page 43
30
2.2.2 Reagents
All reagents used were purchased from Fluka (Buchs, Switzerland) and
were of the highest purity grade. Especially for the iodate determination
it was very important to use the purest quality of KI (Fluka puriss. p.a.).
When using other products, impurities fed to a high threshold through re¬
duction of C to iodide. Water was double-distilled in a quartz apparatus.
Standard solutions of iodide were prepared daily, and standard solutions
of iodate were prepared weekly. No special safety or toxicity considera¬
tions apply for any of the chemicals used under these conditions.
2.2.3 Procedure
The general conditions for the analytical methods are summarized in Ta¬
ble 2.1.
Iodide. For the separation of iodide from the matrix, a Dionex AG
11 guard column with an AS 11 analytical column was used. The eluent
was basic and contained bromide as the eluting anion. The postcolumn
reagent was a basic solution of Bi\ present as Br and the active species
OBr. Between the reaction coil and the detector, the solution has been
acidified by pumping it through a membrane-exchange suppressor. The
suppressor was run in the chemical suppression mode with a sulfuric acid
solution. The retention time of iodide was 3.2 mm with a total running
time for a chroniatogram of 12 mm. This additional time was important
to allow a complete elution of all matrix anions. The absorbance was re¬
corded at 249 nm.
As described above, the interhalogen species IBiVis formed accord¬
ing to reaction 2.1 which can be expressed as a sequence of the following
reactions.
Page 44
3 1
F + OBr" = BF + OF (2.3)
OF + H+ = HOI (2.4)
HOI + H' + Br = IBr + FIX) (2.5 >
IBr + Br = 1Bi\ (2.6)
According to Weast (1984).Chia (1958). and Troy et al. (1991), the equi¬
librium constants are K2, = 2.1 x 1()7 K,t= 4.3 x IO10, K2, = 4.17 x IO6,
and R7(, = 286. Therefore, IBr. is the dominant species for pH < 5,
[HOI] < 10 pM and fBrJ > 40 mM. The postcolumn reagent had to be
basic to prevent the disproportionation of HOBr/OBr to bromide and
bromate. Bromate does not oxidize iodide fast enough under these condi¬
tions. However, the equilibria of reactions 2.4 and 2.5 are on the right
side at low pH values only. Therefore, the postcolumn reaction solution
was basic to stabilize OBr and the solution was acidified after the reaction
coil to shift the equilibria 2.4 and 2.5. Like many trihalogenide com¬
pounds, IBiVhas a strong UV absorption band {Xnux = 253 nm, e = 57'200
M Fern"'). Its UV/visible absorption spectrum is shown in Figure 2.2. A
detection wavelength of 249 nm has been chosen because the difference of
the absorption of IBi\ and the background component Br, is maximal
there. The postcolumn reagent component OBr forms Br, in the suppres¬
sed, Br, absorbs in the same wavelength range than IBr,.The chosen de¬
tection wavelength of 249 nm has the largest difference between the back¬
ground absorption of Bi\ and the signal of IBr.".
Page 45
32
0.6
0.4c
.2
5
_ocd
0.2
0
wavelength / nm
Figure 2.2: Absorption spectra of 10 pM If (solid line: Xmax = 288 nm, £
= 38'200 M"1 cm"1; Xm,x = 35 I nm. £ = 25'700 M"lcm"') and 10
pM IBr, (dashed line: Ainx = 253 nm, 8 = 57*200 M' cnF!);
cell path length 1 cm.
lodate. For the separation of iodate from other anionic species, a
Dionex AG 9 guard column and an AS 9 analytical column were used
with a borate eluent. The postcolumn reagent was an iodide solution. Be¬
tween the mixing tee and the reaction coil, a membrane-exchange suppres¬
sor was placed to acidify the eluent. The suppressor was run in the chemi¬
cal suppression mode with a sulfuric acid solution. If acid is directly
added to the iodide solution, I, is formed due to oxidation with oxygen
and the solution turns yellow, This leads to an increased background
noise. The retention time of iodate was 2.4 mm. At a running time of
4 min, the column was flushed with an eluent containing 250 mM B(OHF
250 300 350 400 450
Page 46
33
and 100 mM NaOH during 5 min to elute anions with high affinity to the
column. After this, a reequihbration with the weaker eluent was required
during 8 min. yielding a total running time of 17 min for environmental
samples and of 4 min for standards in distilled water (no flushing re¬
quired). The absorbance was recorded at 288 nm where 17 has the maxi¬
mal absorption (c = 38'200 M cm '). The UV/visible absorption spec¬
trum of triiodide in Figure 2.2 shows a second absorption band at 351 nm
with a molar absorption coefficient of 25" 700 L mol'cm '. Quantification
occurred via peak areas with an external calibration in double distilled
water or with internal calibration.
I7 is formed according to reaction 2.2 which can be expressed as a
sequence ol the following reaction steps.
IO, + 2 I" + 3 H" = 3 HOI (2.7)
HOI + I +Hl = L + H,0 (2.8)
L + r = l, (2.9)
The rate-limiting step for the formation of If is reaction 2.7. This reac¬
tion needs a low pH to allow a high reaction rate. Therefore, the suppres¬
sor was placed before the reaction coil for the iodate analysis. The
stoichiometry of reaction 2.7 results m a chemical enhancement of a fac¬
tor of 3. According to Palmer & Fietzke (1982), the equilibrium con¬
stants are K76 = 9.01 x 10", K2, = 2.07 x 10¹². and RAS = 736. Therefore,
F" is the dominant species for pH < 5. [HOI] < 1 111M and [T\ ~ 60 mM.
Page 47
34
2.3 Results and Discussion
2.3.1 Determination of Iodide
Optimization of the Postcolumn Reaction Conditions. The most
delicate step m the formation of IBt\ is reaction 2.3, the oxidation of
iodide to 01. Several oxidizing agents have been tested. According to re¬
action 2.7, iodate could be used for the oxidation of iodide. However, it
did not react fast enough to ensure a quantitative reaction at pFI > 1, since
the rate of HOI formation is first-order in iodate and second-order in
iodide (Barton & Wright, 1968). Cerium (IV) was tested as an oxidant
that results m a high background absorption at 249 nm and therefore in¬
terferes with the measurement. Hxdrogen peroxide oxidizes iodide to
HOI: however, the reaction is only fast enough with heptamolybdate ca¬
talysis. Since molybdate absorbs at 249 nm, the background absorption
was too high and yielded a high noise. Hxpobromite (OBr ) reacts with
iodide in a quantitative and fast reaction and does not increase the back¬
ground absorption significant!}.. Fheretore, it has been chosen as the oxi¬
dizing agent for the iodide analysis.
In preliminary tests, chloride was used instead of bromide for the
formation of the interhalogen species, 1CF", which has its maximum ab-
sorbance at 230 nm (e = 42'000 M'cm '; Wang et al., 1989). However,
the formation of ICI, is thermodynamically less favorable than IBr2.
Therefore, a higher chloride concentration of 300 mM is required in the
eluent. This leads to a shorter retention time of iodide and hinders a full
separation of iodide from matrix components.
Calibration and Detection Limit. The calibration graph was lin¬
ear between 0.2 pg/F and 100 pg/F iodide. The correlation coefficient
(R2) was 0.984 for the lowest measurable decade and 0.997 for the next
higher decade. The detection limit (S/N = 3) was 0.1 pg/L. This value lies
Page 48
35
below the lower end of the concentration range of natural waters. The
relative standard deviation (RSD) at 1 pg/L I was 12.8 % for 10 mea¬
surements.
Interferences. At concentrations of 10 g/L CI, I g/L NO., 80 mg/L
NO,. 10 g/L S04", or 5 g/L P07 -no interferences were observed. How¬
ever, we found an increased sensiti\u> for iodide in a river water with
> 4 mg/L DOC.
Iodide in Iodized Salt. To check for interferences with our
method, the iodide content was measured in solutions of two different ta¬
ble salts and cross-checked with results of the leuco crystal violet (LCV)
method (Lambert et al., 1975). We found good correspondences between
the two methods. For the first salt (furasel, Switzerland), we found 20 ± 2
mg/kg with our method and 17 ± 1 mg/kg with the LCV method. For the
other salt (Cérébos, France), we found 1 1 ± 2 mg/kg with our method and
14 ± I mg/kg with the LCV method. However, as discussed above, the
leuco crystal violet method can only be used for relatively clean solutions
where no interlcrence with DOM is expected. Figure 2.3 shows a chro¬
niatogram of a sample of 500 mg/L table salt (300 mg/L CI ) with an
iodide peak corresponding to a concentration of 10 pg/L. The chloride in
the sample did not lead to am interference. Within certain limits, the
iodide content determined in our studv by two different methods corre¬
sponds well with the declaration of the producer (Jurasel: 15 mg/kg,
Cérebos: 10-15 mg/kg).
Page 49
36
4
77
Ö
O
o
•s
0
0
retention time / minutes
Figure 2.3: Determination of iodide in a solution of 500 mg/L table salt
(Jurasel, Switzerland) containing 10 ps/L iodide.
2.3.2 Determination of lodate
Optimization of the Reaction Conditions. The iodide concentration
in the postcolumn reaction had to be optimized. At high concentrations (>
100 mM T), If is further transformed to F/\ and at low concentrations (<
50 mM I"), it dissociates to HOI or F and I (see eqs 2.8 and 2.9; Genser &
Connick, 1973). A low pH is important for the rate of the HOI formation
reaction (Barton & Wright, 1968). However, oxygen readily oxidizes
iodide at low pH. Therefore, the postcolumn reagent was a neutral iodide
solution and the acid was added through a membrane-exchange suppressor
before the reaction coil.
In testing the method for the determination of iodate, bromate, and
chlorite of Weinberg & Yamada (1998), we found several differences. As
Page 50
a reducing agent, we have replaced the toxic nitrite by the unproblematic
iodide. Due to this, the background absorption and therefore also the
noise were significantly reduced. In general, the concentrations in the
postcolumn reagent are much lower for this method. The setup of the ap¬
paratus is somewhat simpler because this method uses only one suppressor
for the acidification of the postcolumn reagent.
Calibration Graph and Detection Limits. The linearity of the
peak area versus analyte concentration holds for four orders of magni¬
tude, from 0.2 pg/L to 2 mg/L. Correlation coefficients (R2) for 0.2-2
pg/L are 0.987 and for 2-20 pg/L are 0.9998, respectively. The detection
limit (S/N = 3ï was 0.1 pg/L, This \alue is lower than the minimal iodate
concentrations usually found m natural waters. Ten measurements at 1
pg/L IO, gave a RSD of 6.0 %.
Interferences. At concentrations of 100 mg/L CF, 100 mg/L NO7,
2 mg/L NOF, 500 mg/L S042, or 500 mg/L P04\ no interferences were
observed. Solutions of 1 mg/L chlorite, chlorate, bromide, or bromate
gave no additional signal and did not alter the sensitivity to iodate. On
principle, all species that can oxidize iodide and therefore form 1, could
result in a signal. However, chlorate and bromate oxidize iodide only very
slowly under the conditions used here (pFl = 1.2).
2.3.3 The Speciation of Iodine in Natural Waters
Iodine Speciation during Drinking Water Ozonation. The specia¬
tion of iodine was analv/ed in a water that has been oxidativelv treated
with 4 mg/L of ozone. Ozone oxidizes iodide in an insiantaneous reaction
to iodate. In a lake water (Lake Zürich, Switzerland; pH = 7.8, 1.42 mM
hardness, 4 mg/L CI,15 mg/L SO/. 3.5 mg/L NO,, 1.4 mg/L DOC),
we found 3.7 pg/L 1 (29 nM) and 3.4 pg/L 10, (19 nM). After oxida¬
tion, the iodate concentration was 9.2 pg/L (53 nM) and we did not find
Page 51
38
iodide any more. This corresponds well to the sum of iodide and iodate in
the raw water. Iodide is therefore quantitatively oxidized to iodate in this
water.
I
<B
? 0.8
G
On"vf
77 0.6,„»-,
cdGÖ/J
00 0.4G^w
r~<
exH
OGO 0.2-Q
0
0 1 2 3
retention time / minutes
4
Figure 2.4: Determination of iodide in a mineral water (Henniez, Switzer¬
land; 0.4 pg/L F, 10 mg/L CF 13 mg/L S042", 18 mg/L NOf,
394 mg/L HC03")
Iodine Speciation in Alineral Waters. Table 2.2 shows the
iodide and iodate analyses of 16 mineral waters from central Europe.
Most mineral waters contain less than 5 pg/L inorganic iodine. The high¬
est concentration of 200 pg/L was found in Aqui which is an old water in
the marine molasse containing high levels of bromide and chloride in ad¬
dition to iodide. In this water, the iodine is present as iodide only. In
contrast, it is remarkable that some mineral waters do not contain any
iodide but 20 pg/L or even 100 pg/L iodate (Arkina. Cristalp). Such an
Page 52
39
<G
G
oo
oon
cdGbû
GOt—<
&O&o
X)
4 --
2
0
0 4
retention time / minutes
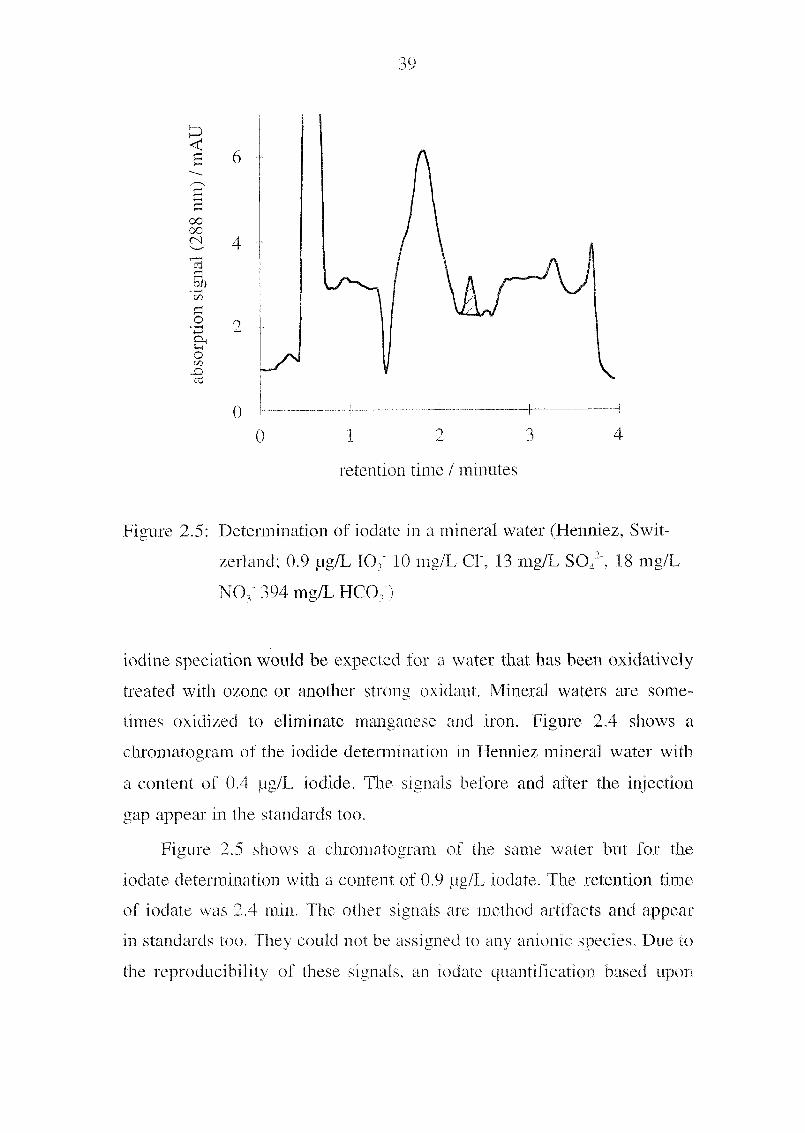
Figure 2.5: Determination of iodate in a mineral water (Henniez, Swit¬
zerland; 0.9 pg/L 107 10 mg/L Cl", 13 mg/L S042, 18 mg/L
NO, 394 mg/L HCOA
iodine speciation would be expected for a water that has been oxidatively
treated with ozone or another strong oxidant. Mineral waters are some¬
times oxidized to eliminate manganese and iron. Figure 2.4 shows a
chroniatogram ol the iodide determination in Henniez mineral water with
a content of 0.4 pg/L iodide. The signals before and after the injection
gap appear in the standards too.
Figure 2.5 shows a chroniatogram of the same water but for the
iodate determination with a content of 0.9 pg/F iodate. The retention time
of lodate was 2.4 min. The other signals are method artifacts and appear
in standards too. They could not be assigned to any anionic species. Due to
the reproducibility of these signals, an iodate quantification based upon
Page 53
40
this chromatogram is still possible. The general background noise of the
baseline is much smaller than the iodate peak in figure 2.5.
More results of analyses of iodide and iodate in natural waters and
table salts can be found m appendix B.
Table 2.2 Determination of Iodide and lodate in Several Mineral
Waters
content (pg/L)
mineral water iodide iodate
Alpina (Rothenbrunnen, Switzerland)
Aqui (Zürich. Switzerland)
Juvina (Deutschkreutz, Austria)
Rhäzünser (Rhäzüns, Switzerland)
Valser (Vais, Switzerland)
Zurzacher (Zurzach, Switzerland)
Aproz (Aproz, Switzerland)
Arkina (Yverdon, Switzerland)
Cristalp (Saxon, Switzerland)
Eptinger (Sissach, Switzerland)
Evian (FAian, France)
Henniez (Henniez, Switzerland)
Rocchetta (Gualdo Tadino, Italy)
San Clémente (Monte Tamaro, Switzerland)
San Pellegrino (San Pellegrino Tenne. Italy)
Vittei (Vittel. France)
37 O j
200 <0.3
43 3.4
43 1.0
7.2 <0.3
4.0 2.1
0.7 <0.3
0.5 22
0.6 99
1.1 < 0.3
0.8 F8
0.4 0.9
0.5 3.1
< 0.3 0.4
0.6 < 0.3
0.4 2.4
Page 54
41
3• Hypoiodous Acid: Kinetics of
the Buffer-Catalyzed Dispropor¬
tionation
Y. Bichsel and LJ. von Gunten, Water Research, in press.
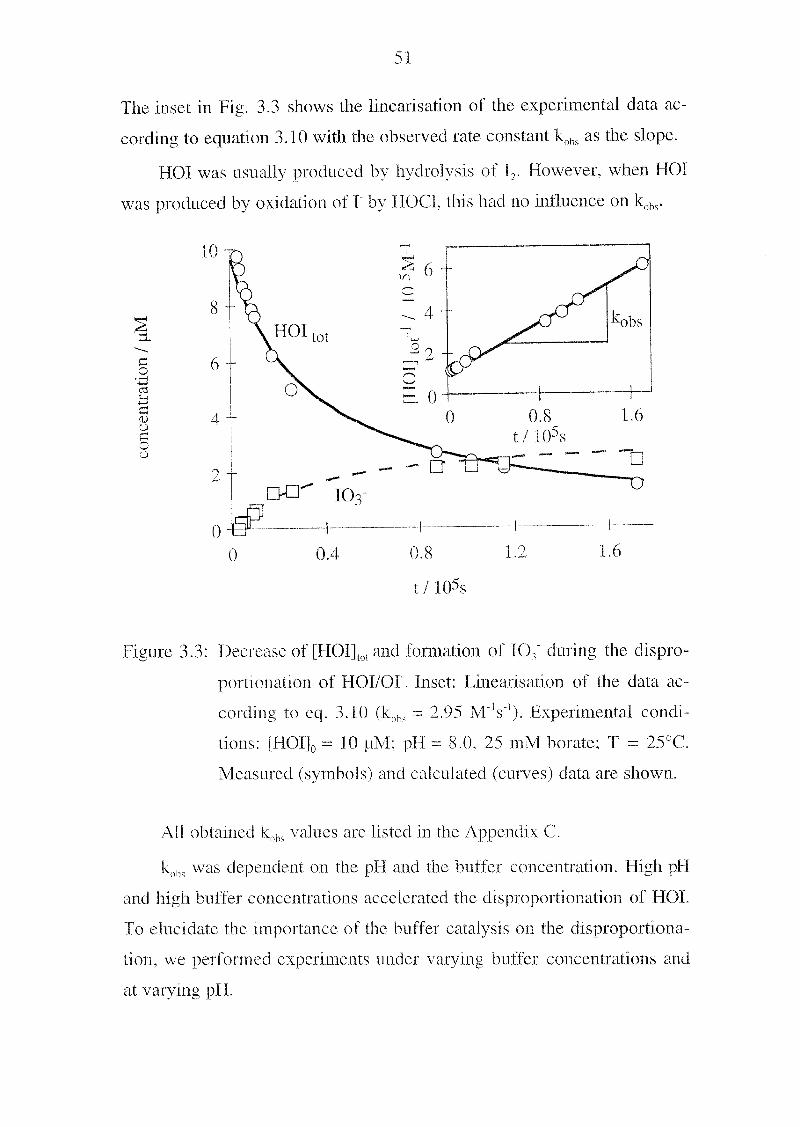
The reactivity of hypoiodous acid (HOD is an important factor for the
fate of iodine in oxidative drinking water treatment. The possible reac¬
tions of HOI are its disproportionation, its oxidation to iodate (107), or
the reaction with natural organic matter. The latter reaction may result in
the formation of iodoorganic compounds which are frequently responsi¬
ble for taste and odor problems. The acid dissociation constant (pKa) of
HOI has been determined spectro photometric ally as 10.4±0.1 (T = 25°C;
I = 50 mM). Kinetic constants and a new rate law for the disproportiona¬
tion of HOI as catalyzed by hydrogencarbonate, carbonate, and borate are
presented. In the pH range 7.6-11.1, the main uncatalyzed reactions are
HOI + HOI (k,2 = 0.3 M"7s ') and HOI + OT (k3, = 15 M 7s '). The buffer-
catalyzed reaction step was found to be second-order in HOI and first-
order in the buffer anion. The following rate constants were deduced:
HOI + HOI + HCO, : 50 M 2s '; HOI + HOI + CO,2: 5000 M V; HOI +
HOI + BfOHX : 1700 M2s '. All these rate constants result in half-lifes for
FIOI of 10-1000 days under typical drinking water conditions.
Page 55
4z.
3.1 Introduction
In the late eighties, it was observed that taste and odor problems in
drinking waters were frequently linked to the presence of iodoorganic
compounds (Hansson et al.. 1987; Brochet et al.. 1989). The identified
compounds were iodo-trihalomethanes (I-THMs) which can be formed in
a reaction of hypoiodous acid (HOI) with natural organic matter (NOM).
It has been estimated that I-THMs contribute to up to 25 % of the cases of
bad taste and odor in drinking waters in France (Suez Lyonnaise des
Eaux, 1993). The most problematic I-THM is iodoform (CHIT) with an
organoleptic threshold concentration of 0.03 - 1 pg/L (Bruehet et al.,
1989; Khiari, 1999). This concentration has to be compared to the total
iodine concentration in water resources which is usually in the range of
0.5 - 20 pg/F but which can exceed 50 pg/L in certain ground waters
near the sea coast or under special geological circumstances (Fuge &
Johnson, 1986; Wong, 1991). The most abundant iodine species in natural
waters are iodide (F) and iodate (TO, ) (Fuge & Johnson. 1986).
In oxidative drinking water treatment, F is first oxidized to HOI in
presence of ozone (Garland et al.. 1980), chlorine (Nagy et al., 1988),
and cliloramine (Kumar et al.. 1986) in a fast reaction. In a second step,
some of these disinfectants oxidize HOI to 10f. Ozone oxidizes I to IO7
within less than 4 s under typical drinking water treatment conditions (see
chapter 4). In chlorination processes, the oxidation of HOI to 10, is
slower and occurs within minutes to hours. Chioramme does not oxidize
HOI at all. Chlorine dioxide oxidizes T to 1 radicals which involves a dif¬
ferent chemistry than the other disinfectants (Fabian & Gordon. 1997).
The fate oi I radicals m drinking water is unknown.
HOI can also disproportionate to 10, and I or, as mentioned above,
react with NOM what may lead to iodoorganic compounds. All these
Page 56
43
reactions of HOI - its oxidation to IO7, its disproportionation to I03" and
I, and the reaction with NOM - are in kinetic competition. The relative
reaction rates of these reactions determine the fraction of iodine found as
10, and 101„. Whereas the oxidation of HOI is described in chapter 4 and
reaction kinetics of HOI with organic compounds are shown in chapter 5,
the present chapter focuses on the disproportionation.
The disproportionation of HOI can be described by the equilibrium:
3 HOI = 10 +2r + 3H' (3.1)
The equilibrium constant of this reaction is 6 x 10H(Sammet, 1905). At
pFI > 5, FIOI is therefore thermodynamically unstable since the equilib¬
rium is forced to the right side of eq. 3.1, However, the formation of the
reaction products 10, and I is kinetically controlled. The kinetics of this
reaction have been observed to be second-order in [HOF|lot, the sum of
fHOIl and [01] (Thomas et al„ 1980; Wren et al., 1986; Truesdale, 1997;
Urbansky et al., 1997). The reaction mechanism is generally described by
a series of reactions (eqs 3.2-3.4) with the rate-limiting step being eq. 3.2
or eq. 3.3.
HOI + HOI —^ I02" + F+2H+ (3.2)
HOI + OF —IV T02~ + F + H+ (3.3)
KV + HOI -^V ÏOF + F + H+ (3.4)
The overall reaction 3.1 is catalyzed by buffers such as phosphate,
borate, or acetate (Buxton & Sellers, 1985; Truesdale & Canosa-Mas,
1995; Urbansky et al., 1997). Because different interpretations for the
catalysis are given m the literature, it has been difficult to find consistent
rate constants for the catalyzed and uncatalyzed reaction steps. Therefore,
Page 57
'"rHh
the reported rate constants k32 at buffer concentrations of 0-150 mM vary
within a wide range of < 2 M V to 1000 M's '(Thomas et al., 1980;
Truesdale, 1997; Urbansky et al., 1997). The rate constants k3, were
found to be between 40 M 's 'and f(F M 's
'
(Wren et al., 1986; Truesdale
& Canosa-Mas, 1995). A value of 2200 M 2s 'was found for the catalysis
of the reaction HOI + HOI by borate buffer (Buxton & Sellers, 1985).
Because the disproportionation can either occur through the reaction
HOI + HOI (eq. 3.2) or HOI + Ol (eq. 3.3), the dissociation constant of
HOI is of particular importance. The pK, of HOI has previously been in¬
directly determined as 10.6±0.8 (Chia. 1958).
To assess the fate of HOI in natural waters, we investigated the ki¬
netics of the disproportionation of HOI as catalyzed by borate, hydrogen-
carbonate, and carbonate. Since the disproportionation strongly depends
on the acid-base speciation of HOI, we also redetermined the pKa of HOI.
3,2 Experimental Section
All experiments were performed in double-distilled water. pH measure¬
ments were carried out with a Ross electrode (ATI Orion, Boston, MA)
and a Metrohm 632 pH-meter (Metrohm, Herisau, Switzerland) which
was calibrated with standard buffer solutions (Merck; pH = 6.98, 8.95,
9.94, 11.88). Spectrophotometric measurements were performed on an
Uvikon 940 spectrophotometer (Kontron Instruments, Eching, Germany).
HOI is not a stable compound (disproportionation). It was freshly pro¬
duced directly in the reaction vessel through hydrolysis ot F or through
oxidation of I by HOG.
Page 58
45
3.2.1 Dissociation Constant of HOI
The pKa of HOI was determined spectrophotometrically by measuring the
pH-dependence of the UV-absorbanee at 220-250 nm (pH = 8.7-11.5,
25±2°C) in a flow-through cell. It was not possible to perform the meas¬
urements in a static cell because of the depletion of HOI/OF due to fast
disproportionation under the applied conditions. Buffered solutions of
OCF (0.2-1 mM) and I solutions (0.023-0.46 mM) were delivered with
two Dosimats (Metrohm, Hensau. Switzerland) and mixed in a mixing tee
prior to the photometric cell. HOI was formed by oxidation of 1 with
OCF (k = 4.4 x 10" M 's 'x fHT- Kumar et al., 1986) within 80 ps - 250
ms (half-life of 1 ). The residence times in the cell were 8 s (pathlength 50
mm) and 1.2 s (pathlength 5 mm). The concentration of the NaOCl stock
solution (Aldrich) was determined as 5.6% with direct photometry of
IÏOC1 at 233 nm (e = 100 MAcnU: Soulard et al., 1981F The buffer
(phosphate) concentration varied from 14 to 17 mM to yield a constant
ionic strength of 50 mM. [OC1 | was in excess relative to [I'j (molar ratio
[OCf]:fI 1= 1.1-9) to ensure the instantaneous oxidation of F to HOI
without transient F formation. However, the excess of OCf did not lead
to significant 103 formation within the residence time of the solution in
the flow-through cell (see chapter 4). The resulting pFl was measured at
the outlet of the flow-through cell.©
3.2.2 Disproportionation Kinetics of HOI
The disproportionation of HOI was investigated at (HOF]10 = [HOIj + [Ol ]
= 0.8-76 uM and at pH = 7.6-1 FL in 100 mF batch reactors at 25±2°C.
The desired [HOI]to((t=0) was achieved by adding an aqueous F solution
t~ l mM, standardized by photometry: e = 746 M"'cm at 460 nm; Aw-
trey & Connick. 1951) to a buffered solution (2-30 mM ol borate or car-
bonate/hydrogencarbonate). Under these conditions, F hydrolyzes
Page 59
46
immediately to HOI/OF and F (reaction 3.5). Because of the lower [HOI],
the disproportionation was, however, slower than for the conditions that
we applied to determine the pKv During the reaction time of the dispro¬
portionation ( 10 h - 50 h), aliquots of the solutions were withdrawn and
measured photometrically in excess of Kl (0.15 M) where HOI and OF
are quantitatively transformed to I,.
F + HOI + H+ ^^= I:+H20 (3.5)
12 + I- ^=^ l3- (3.6)
The equilibrium constants for reactions 3.5 and 3.6 are K55 = 1.84 x 10l2
and K3r,= 725, respectively (Burger & Liebhafsky, 1973). If was detected
at 351 nm in a 4 cm cell with a molar absorption coefficient of 25'700
M"'cnF' (see chapter 2) which allowed to measure [HOI](01 > i pM.
To prevent the presence of CO, in the reaction solution we purged
the solutions with N, prior to the beginning of the experiment and flushed
the head-space of the reaction vessels when taking samples during the re¬
action time. Uptake of C02 leads to carbonate and hydrogencarbonate in
fhe reaction solution which has a catalytic effect on the disproportiona¬
tion.
In one experiment, the formation of JOf was determined by
quenching the disproportionation by H202 (H202 + HOI = F + HF + FI20 +
02). I02 was measured by ion chromatography and postcolumn reaction
with a UV/vis-detection (see chapter 2). For the anion separation step, an
AG-S 9 column (Dionex) was used. The postcolumn reaction yields U by
reduction ot TO, to HOI followed by reactions 3.5 and 76. I, can be
measured by UV/vis-detection at 288 nm or 351 nm. The detection limit
for 107 in natural waters was 0.1 pg/F (0.6 nM).
Page 60
47
3.3 Results and Discussion
3.3.1 Dissociation Constant of HOI
Figure 3.1 shows five of the recorded spectra of HOI/OF between pH =
9.3 andpFI — 11.5 which have been corrected for the background absor¬
bance of phosphate and OCF. The molar absorption coefficients of HOI
and OF in the range of 250 to 220 nm increase from 150 to 1650 M^cm"1
for HOI and from 300 to 5100 M Van'
for OF. In our experiments, the
wavelength region for best measurements was limited due to interferences
by absorbance of HOCl and OCl since it was added in excess of I for the
production of HOI. Both HOCl and OCl absorb significantly at wave¬
lengths > 250 nm. The lower wavelength region was limited by the ab¬
sorbance of the buffer (phosphate) at X < 220 nm. An accurate data
evaluation was only possible at wa\elengths with no interferences and
maximum HOl/Ol absorption, i.e. in the range 220-225 nm.
The measured absorption AoK(/D i1^ the sum of the absorptions
Ajjqj(?l) and A (À,) which can be attributed to the two species HOI
and OT :
Aobs(^=AHoi(^) + Aor(^ = enoTavi4HOIl + eOT_a)-l-|Or]
(3.7)
K -l2^i_[L£L_i l3^[HOE
Taking the acid-base equilibrium of HOI (eq. 3.8) into account, the fol¬
lowing equation results:
^lk)-P dui<
l,P ,u
AotyA^
lH01|tot [H+j0F
'
I [HOIltot
Page 61
48
Equation 3.9 describes the relation between the dissociation constant Ka,
the observed absorbance Aobs (at a particular wavelength X), the total
iodine concentration [HOI]tol = fHOIl + [OT], the cell pathlength I, and the
molar absorption coefficients of the pure species eH0I and c_„
(at a par¬
ticular wavelength A,).
220 230 240 250
XI nm
Figure 3.1: UV absorbance spectra (200-250 nm) of 345 pM HOI/OF at
varying pFI values (9.3 - 11.5); pathlength 5 mm; Ï = 50 mM
(phosphate buffer): T = 25°C.
If the term on the left hand side of eq. 3.9 is plotted against the right
hand side, a linear representation with Ka as slope results (see Fig. 3.2).
According to Fig. 3.2 which shows the data measured at 220 nm, Ka can
be calculated as 4,0±0.7 x 10"" (pK, = 10.4±0.l). Fhe intercept is the
molar absorption coefficient of HOI at 220 nm, 8„01 (X = 220 nm). The
^Hoi O1 = -20 nm) determined by this procedure was 1650 M"'cm 7 How¬
ever, eq. 3.9 has the restriction that the error increases with increasing
Page 62
49
A h (X)pH when E^T^.(X)~ —
.Therefore, this equation was only ap-H Ol l-[HOIJtot
plied for the range of pH < 10.4. A slightly different equation which was
also derived from eq. 3.7 and 3.8 was used to interpret the data measured
at pH > 10.4. For this pH range, cOI- results as the intercept of the y-axis
(e _(A, = 220 nm) = 5100 M'cnF1) while Ka'is the slope (Ka = 4.2±0.8
x 10 "calculated from A0. at 220 nm).
BO
,—î
o
o
<
O
6000
4000
2000 --
0
0 5x 10 13 IO14
i(e,
[H]+ Ol
Aobs(220nm)WA,.9 _iUUk v
. -) / M -cm
l
[HOI1 tot
Figure 3.2: Determination of the pK, of HOI (T = 25°C, ionic strength
^0 mM): Linearisation of the absorbance data at 220 nm ac¬
cording to eq. 3.9 (K,= 4.0±0.7 x 10 "; r = 0.868. n=33).
Kn was calculated with both equations for Aob, at X = 220 nm, X =
222 mil, and A, = 225 nm and for [H011lot = 23-460 uM. The pK, was
10.4±0.1 at 25°C with an ionic strength of 50 mM and did neither vary
with the wavelength nor with [HOI)(ot. Within the errors given, both
Page 63
50
equations lead to the same pKa. The indicated error of pKa represents the
95% confidence interval.
Previously, Chia (1958) calculated a value of 10.6±0.8 with a com¬
bination of Potentiometrie and photometric methods. However, this value
was based on indirect measurements including the two equilibrium con¬
stants of eq. 3.5 and 3.6 which are not very well known. In another study,
a value of 10.0±0.3 was estimated from a limited spectrophotometric data
set at pH - 4.0, 9.0, and 14.3 (Paquette & Ford. 1985). The pKa deter¬
mined in our study is within the range of the previous values. However,
our direct measurements do not induce as many assumptions as the previ¬
ous determinations.
3.3.2 Disproportionation Kinetics of HOl/OF
The decrease of HOI/OF (initial concentration 0.8-76 pM) in buffered
solutions (pH = 7.6-11.1) was measured spectrophotometrically (after re¬
action of HOl/OF to I7). Figure 3.3 shows the measured (symbols) and
calculated (line) decrease of [H01Jrot together with the 107 formation in a
typical experiment (10 pM HOI, 25 mM borate at pFI = 8.0). IO7 which
is formed according to eq. 3.1 cannot exceed 1/3 of the initial [HOI]fot
(stoichiometric factor). The measured and calculated [I03"] (from HOI
decrease according to eq. 3.1) are in almost perfect agreement (see Fig.
3.3). This is an independent confirmation of the assumed mechanism (eqs
3.2-3.4) in which the intermediate 107 is rapidly oxidized to IO7.
The disproportionation ot HOI/OI was always found to be second-
order in [HOl]t0(. Hence, linear plots ir > 0.99) could be observed if 1 /
[H01|lol was plotted against the reaction time t according to:
Page 64
5\
The inset in Fig. 3.3 shows the linearisation of the experimental data ac¬
cording to equation 3.10 with the observed rate constant kobs as the slope.
HOI was usually produced by hydrolysis of I,. However, when HOI
was produced by oxidation of 1 by HOCl, this had no influence on kobs.
0 0.4 0.8 1.2 1.6
t/105s
Figure 3.3: Decrease of [HOl]lo( and formation of IO, during the dispro¬
portionation of HOl/OI. Inset: Linearisation of the data ac¬
cording to eq. 3.10 (koK = 2.95 M"!s '). Experimental condi¬
tions: [HOIlo = 10 pM; pH - 8.0, 25 mM borate; T = 25°C.
Measured (symbols) and calculated (curves) data are shown.
All obtained kDM values are listed in the Appendix C.
koK was dependent on the pH and the buffer concentration. High pH
and high buffer concentrations accelerated the disproportionation of HOI.
To elucidate the importance of the buffer catalysis on the disproportiona¬
tion, we performed experiments under varying buffer concentrations and
at varying pH.
ao
3
a4)o
aoo
Page 65
52
A buffer catalysis can occur via the acidic or the basic form of the
buffer or through both species. In principle, several reactions can be
catalyzed: HOI + IIOF HOT + OF, and 01" + OF. However, with the reac¬
tion OF + 01, we could not explain the pH-dependence of our experi¬
mental data. A reasonable fit of the data for borate and carbonate buffers
was only achieved for two different mechanistic scenarios which cannot
be distinguished from each other Iw our experiments. The first mecha¬
nism assumes that the basic form of the buffer is the active species and
that two HOI molecules participate in the reaction. The second mechanism
assumes that the protonated form of the buffer is the active species and
that a HOI and an 01 participate in the reaction. Chemical considerations
led us to the assumption that the first mechanism is more likely than the
second. We assume that the base interacts with the H-atom of HOI and
thereby increases the nucleophile character of the 1-atom. By this, the re¬
act!vitv towards another HOI is enhanced.
As a result of this assumption, the following rate law for the base-
catalyzed disproportionation can be postulated:
~i "Il T TT/""XT'! t
-V-L_-^- = TkobsrHoi]tol2 -k3.2[Hoir +H3!Hoi][or] +
^ dt />
+ kcat[base][HOI]2 (3.11)
The factor of 1/3 corresponds to the stoichiometric factor of FIOI in
equation 3.1. Figure 3.4 shows a plot of kob73 vs. [baselfHOI]2 / [HOI]tot2
for experiments with varying buffer concentrations (borate) and varying
pFl values (squares, for circles see below), fhe linearity of the plot shows
that the postulated eq. 3.11 is m agreement with experimental findings
The catalysis constant ka( corresponds to the slope of the straight line.
Page 66
53
E
CO
CO
X)
O44
0 4 6 !0
(B(OH)4~ |[HOI| 2 / IH0T1 tot2 ' niM
Figure 3.4: Experimental data and linear least-squares fit for the dispro¬
portionation of FIOI in presence of borate according to eq.
3.11. The linearity of the plot shows that the postulated eq.
3.11 is in agreement with experimental findings. (D): data
from this study; (•): data from Buxton & Sellers (1985);
katbo,a.c = l.7±0.6 x IO1 M~2s 'with r2 = 0.992 (n=29); Ex¬
perimental conditions: pH = 7.6-10.6; total borate concentra¬
tion = 2-25 mM; T = 25°C.
kMt values for B(OHf. HCO,. and CO," at 25°C are shown in Table
3.F The kcat values increase with increasing basicity ot the buffer anions.
k/-v^2-
>kT),^XJ,_
>ku„,,_.
An anion with a high basicitv, such as
CO^ B(OH)4 HC(F&
CO.,2, can interact more strongly with the H-atom of HOI than an anion
with a lower basicity, such as HCO,. The interaction of the base with the
proton m HOI leads to asymmetry (partial formation of 01 like com¬
pound) which results in taster reaction.
Page 67
54
Table 3.1 Rate Constants for the Disproportionation of
HOI/OF for Varying Reaction Conditions at 25 °C from This
Study.
Eq.no reaction rate constant [base] = 5 mM
(3.2) HOI + HOl(k„) 3±2xI0'MV
(3.3) HOl + OI (kv/J 15±1 M V
(3.12) HOI + FlOr + HC02 5±2xlO'M2s' 0.3±0.1M's'
(3.13) HOI + HOI + CO,2 5.0±0.5 x 1 (F Al 2s '25±3 M 's '
(3.14) H0I + H01 + B(0H)4 1.7±0.6 x KF M2s '
9±3M7'
Another compound which influenced the rate of the disproportiona¬
tion was NH//NFF,. However, in contrast to borate and carbonate, ammo¬
nia did not catalyze the reaction but an inhibition was observed. At pH =
9 0, ammonia concentrations of 10-25 mM reduced k)b, by 50-80 %. This
effect could be related to the fact that NFFis a nitrogen base and not an
oxygen base like the other bases which were investigated in this study.
According to the HSAB-concept (Hard and Soft Acids and Bases), nitro¬
gen bases are softer than oxygen bases (Pearson, 1969). HOI has a hard
part (H-atom) and a soft part (I-atom). Nitrogen bases might therefore
rather interact with the I-atom of HOI whereas oxygen bases might rather
interact with the H-atom. This difference could be a reason for the varia¬
tion of the behavior with respect to the catalysis of the disproportiona¬
tion.
The two rate constants for the uncatalyzed reactions HOI + HOI (eq.
F2) and HOI + Ol (eq. 3.3), k\, and k,„ were deduced from
Page 68
55
measurements at different pH-values and buffer concentrations by a re¬
gression analysis according to eq. 3.15. This equation was derived from
equations 3.8 and 3.11 under the restriction that [HOI]to( = [HOI] + [OF].
k0J3S[HOlJt0t"*ik,10ût h , v a /o 14TA
kcat base]=
k3 2 + k3 3——-
(p. f 5)
3[HOI]2 [H+]
Figure 3.5 shows a representation of eq. 3.15. The slope of the straight
line corresponds to k,v the y-axis intercept is k22. For the determination
of k32, only the points at pH < 9 (low K/[H+]) were used (see inset Fig.
3.5) since the reaction HOI + HOI only contributes significantly to the
total reaction at pH < 9. The values of k,2 and k^3 are reported in Table
3.1. Because of the higher asymmetry between nucleophile and electro-
phile in the reaction HOI + 01, k,-, is larger than k32. Therefore, a
maximum rate for the uncatalyzed reaction can be expected at pH = pKa -
10.4. A comparison of the rate constants for the catalyzed and the un¬
catalyzed reactions shows that at concentrations of 5 mM HCO,/CO,2" or
4 mM B(OHF at pH = 8, the rate of the catalyzed and of the uncatalyzed
reaction are ot the same order of magnitude (Table 3.1 ).
Compared to literature values, our k,, and k,, values are quite small.
This is due to the fact that in some previous calculations the catalytic ef¬
fect of the basic form of the buffer was not taken into consideration
(Thomas et al., 1980; Truesdale et al., 1994). This led to high k32 and k,3
values because the total disproportionation of both catalyzed and uncata¬
lyzed reactions was attributed to k,0 and k,,. Buxton and Sellers (1985)
howevei allowed for the catalytic effect of borate. Their raw data (pH =
9.1-9.7, 2-50 mM total borate) fit very well in our data set as is shown in
Fig. 3.4 by the circles. We have evaluated their raw data according to eq.
3.11 and have found a kirvalue of F4±0.3 x 10' M~s '
(r = 0.927). This
value is m agreement with our result (Table 3.1. eq. 3.14).
Page 69
56
CO
cd
42
o
A4
Ol
o
oX
o
A4
C-l
c
1—I
CO
D
D
4
Figure 3.5: Determination of the rate constants k32 and Iv,, for the un¬
catalyzed reactions HOI + HOI and HOI + OF according to
eq. 3.15. k„ is the slope of the main linear curve (r = 0.977,
n=15). The inset shows the points which were used for the
determination of k22 (y-axis intercept), C = 0.911 (n=14).
Experimental conditions: pH = 7.6-11.1; [HOIj,0, = 0.8-76
pM; carbonate and borate buffers (2 - 30 mM); T = 25°C.
3.3.3 Implications for Drinking Water Treatment
Tn oxidative drinking water treatment, HOI formed from the oxidation of
1 can have various fates which are kmetically determined. One possibility
is the formation of undesired iodoorganic compounds such as CH13 which
leads to a bad taste and odor of the drinking water. Our results allow to
estimate the life-time of HOI/OI if disproportionation is the main reac¬
tion pathway
Page 70
57
Table 3.2 Initial Half-life of HOI at Varying HOI Concentra¬
tions, pH, and Carbonate Concentrations.
F/2 / à
[HOI]/pg/F [carbonate]/ pH = 6 pH = 7 pH = 8 pH = 9
mM
1300 1300 1100 500
130 130 110 50
13 13 il 5.0
700 680 540 190
70 68 54 19
7.0 6.8 5.4 1.9
The initial half-life of HOI has been calculated for different condi¬
tions (Table 3.2). Because the disproportionation is second-order in
HOI/OI, the half-life of HOI depends strongly on its initial concentration.
A ten-fold increase of [HOI](t=0) results in a ten-fold decrease of the ini¬
tial half-life. An increase in the pFl from 6 to 9 leads to an increase in the
reaction rate because the speciation is shifted towards OF which reacts
faster than HOI. In presence ot carbonate, the reaction rate is further in¬
creased because of the catalysis of HCO, and CO77 According to Table
3.2, the initial half-life of HOI under drinking water relevant conditions
(1-10 pg/L HOI, pH = 6-8, 0-5 mM carbonate) is on the order of 50-
1300 d. The time for a 90 c/< removal of HOI is 9 times higher. Even un¬
der extreme conditions (100 pg/L HOI, pH = 9, 5 mM carbonate), the
initial half-life is ne\er lower than approximately 2 d. We can therefore
Page 71
58
conclude that the disproportionation of HOI/OF is too slow under drink¬
ing water conditions to be of importance for the fate ol HOF The fate of
FIOI during drinking water treatment and distribution will therefore be
determined by its reaction with NOM and its further oxidation to 107-
3.4 Conclusions
- The pK, of HOI was determined to be 10.4±0.i. Therefore, under
typical drinking water conditions. HOI is the major species, whereas OF
is only a minor species.
- The uncatalyzed disproportionation of HOI occurs through the re¬
actions HOI + HOI and HOI + OT at pH = 7.6 - IFF Bicarbonate, car¬
bonate, and borate catalyze the disproportionation. We postulate that the
catalysis is particularly important for the reaction HOI + FIOI.
- Although catalyzed by carbonate, the disproportionation of HOI is
slow under typical drinking water treatment conditions (pH = 6-8). The
initial half-life of HOI lies in the order of a few days to years. Therefore,
the life-time of HOf is not controlled by this reaction. During oxidative
drinking water treatment, the fate of HOI is determined either by its fur¬
ther oxidation by an oxidant or by the reaction with NOM. The competi¬
tion of these two reaction pathways determines the importance of the two
final products which are 107 or iodoorganic compounds.
Page 72
59
4. Oxidation of Iodide and Hypo¬
iodous Acid in the Disinfection
of Natural Waters
Y. Bichsel and U. von Gunten, Environmental Science & Technology
33(22). 4040-4045 (1999).
In aqueous oxidative processes with ozone (03), chlorine, or chloraminc,
naturally occurring iodide (I ) can easily be oxidized to hypoiodous acid
(HOI) which can react with natural organic matter (NOM) or be further
oxidized to iodate (lOf). Such processes can be of importance for the
geochemistry of iodine and for the fate of iodine in industrial processes
(drinking water treatment, aquacultures). Whereas IO7 is the desired sink
for iodine in drinking waters, iodoorganic compounds (especially iodo¬
form, CFIF7 are problematic due to their taste and odor.
To assess the sink for iodine during oxidation of natural waters, we
determined fhe kinetics of several oxidation reactions of HOI. Ozone,
chlorine, and cliloramine have been tested as potential oxidants. Ozone
oxidized both FIOI and hypoiodite (Ol) (k01|H0I = 3.6 x IO4 M~V, kœK)1„
= 1.6 x IO6 M"'s ') in a fast reaction. Chlorine species oxidized HOI by a
combination of second-order and third-order reactions OC^^,«^ = 8.2
M 's '; k"\J0CWTOI = 8.3 x 10* M"2s '; k0C1 +1I0t= 52 MAs 7. Monochlorami-
ne did not further oxidize HOI. The probability of the formation of iodo¬
organic compounds during drmking water disinfection therefore increa¬
ses in the order O, < CF < NH,C1. In aquacultures. î is transformed to
IO, withm seconds to minutes m the presence ot chlorine or ozone. In the
surface boundary laver of seawater. O, oxidizes I to HOI but not to IO,,
Page 73
60
4.1 Introduction
In seawater, iodine compounds can be found with typical surface concen¬
trations of 45-60 pg/L (Fuge & Johnson, 1986; Wong, 1991). From
there, biologically produced iodoorganic compounds (e.g. CHJ2; Klick &
Abrahamsson, 1992) are transferred to the atmosphere. Another possibil¬
ity for the release of iodine-containing compounds to the atmosphere is
the evaporation of HOI, a species which can be formed by the reaction of
I with O,, (Thompson & Zafiriou. 1983). An alternative pathway for HOI
is the reaction with NOM. Due to enhanced formation of volatile iodine-
containing compounds at the sea surface, the [I]:[CI] ratio increases by a
factor of 500-10'000 from seawater to the atmosphere (Duce et al., 1963;
Cicerone. 1981; Sturges & Barrie. 1988). From the atmosphere, the
iodine species rain out which leads to a partial transfer into the continen¬
tal water. The main species of iodine in freshwaters are F and IO7. The
total iodine concentration in water resources is usually in the range of
0.5-20 pg/L but it can exceed 50 pg/L in certain groundwaters near the
sea coast or under special geological circumstances (Fuge & Johnson,
1986; Wong, 1991).
During oxidation and disinfection processes, Ï is rapidly oxidized.
The oxidation kinetics of I" with several oxidants/disinfectants and the
product formation have been investigated earlier (Table 4.1). For typical
concentrations of disinfectants applied in drinking water treatment, the
half-life of F is in the order of milliseconds for ozonation and chlorina¬
tion and m the minute range in the presence of chloramine or C102. With
exception of CKF (formation of Fradicals), HOI is the first oxidation
product and determines the further fate of iodine compounds in oxidative
drinking water treatment. The fate of Fradicals which are formed In the
presence of chlorine dioxide is not known.
Page 74
61
Table 4.1 Rate Constants for the Oxidation of T" with Several
Oxidants / Disinfectants
rate constant product reference
03 2 x IO9 M"'s 'HOI Garland et ah, 1980
FIOC1 4.3 x IO8 MV1 HOI Nagy el ak. 1988
NFFCl 2.4 x IO10 x [Hf] M :s HOI Kumar et al., 1986
CIO, 1.87 x 10' M 's"1 k Fabian & Gordon, 1997
In the late 1980s, it was observed that taste and odor problems in
drinking waters were frequently linked to the presence of iodoorganic
compounds (llansson et ak, 1987; Bruchet et ak, 1989). The identified
compounds were iodo-trihalomethanes (I-THMs; in particular iodoform
CHI,) which can be formed via a reaction of HOI with NOM, the iodo¬
form reaction (Vollhardt & Schore. 1994). CHI, has an organoleptic
threshold concentration of 0.03 - 1 pg/F (Bruchet et al.. 1989; Khiari,
1999). It has been estimated that 1-THMs may be partly responsible for
up to 25 % of the cases of bad taste and odor in drinking waters in France
(Suez Lyonnaise des Eaux, 1993).
The formation of undesired iodoorganic compounds is in kinetic
competition with the disproportionation of FIOI/OI (see eqs 4.1 - 4.3) or
its further oxidation to IO7 b\ NfFCl, CF. or 0~. The sinks for these re¬
actions are iodoorganic compounds or 10, which both are so far not in¬
cluded m the guidelines for drmking water of the World Health
Organization (WHO. 1993). In contrast to bromate (BrO,"F TO, can
probably be considered as nontoxic because ingested IO, is quickly re¬
duced to I in vivo and m vitro by glutathione (Taurog et al., 1966). 1 is
Page 75
62
then taken up by the thyroid gland which produces iodine-containing
hormones (thyroxine and triiodothyronine).
The disproportionation of HOI is a reaction m which HOI (oxidation
state +1) reacts with itself leading to a reduced species (I, oxidation state
-I) and to an oxidized species (IO,, oxidation state +V). It can be de¬
scribed by a sequence of the two reactions 4.1 and 4.2 whereas reaction
4.1 is rate-determining:
HOI + HOI -» TO, + I + 2 FF (4.1)
HOI + I02 -> 107 + î + H4 (4.2)
The overall reaction can be described by reaction 4.3:
3 FIOI -a 10, + 2 I" + 3 FF (4.3)
The kinetics of this reaction are described in chapter 3. A catalysis by
anions such as borate, phosphate, or carbonate was observed. However,
the overall reaction was very slow under typical drinking water condi¬
tions. The half-life of HOI according to the disproportionation lies in the
range of 4 days (50 pg/L HOI. pH 9, 5 mM carbonate) to 3.5 years
( 1 pg/L HOF pH 6, no carbonate). Hence, 10, formation by this pathway
is of minor importance during drinking water treatment. The main sinks
for FTOI are its addition to functional groups of the NOM or its further
oxidation by a disinfectant.
Black et al. (1968) suggested that the product of the oxidation of
HOT/01 by 03 or HOCl is IO7. In contrast, they did not find 10-, as a
product of the reaction of HOI with NH:C1. The rate constant of the reac¬
tion of HOCl with HOI has been reported to be < 20 M^A1 (Lengyel et
al.. 1996).
In the present study, we investigated the kinetics of the oxidation of
HOI by O,, H0C1/0C1, and NH:Cl to assess the fate of HOI with respect
Page 76
63
to further oxidation to IO7. This reaction is in competition to the forma¬
tion of iodoorganic compounds. HOI is quickly produced from naturally
occurring 1 with all of these oxidants.
4.2 Experimental Section
All experiments were performed in double-distilled water. pH measure¬
ments were carried out with a Ross electrode (ATI Orion, Boston, MA)
and a Metrohm 632 pH-meter (Metrohm, Herisau, Switzerland) which
was calibrated with standard buffer solutions (Merck). Spectrophoto-met¬
rical measurements were performed on an Uvikon 940 spectrophotometer
(Kontron Instruments, Echmg. Germany),
Because HOI Is not stable 111 water, it has to be freshly produced di¬
rectly in the reaction vessel. Prior to each investigation, HOI was pro¬
duced by oxidation of F with O,, HOCl, or NH2C1 (for kinetics see Table
4.1). The concentration of the NaOCl stock solution (Aldrich) was deter¬
mined as 5.6% with direct photometry of HOCl at 230 nm (e = 100
M"'cm 7 Soulard et ak, 1981). According to eqs 4.1 - 4.3, HOI dispro-
portionates to form F and IO,. Under the conditions applied In this study
however, the disproportionation was negligible relative to the other proc¬
esses. This was confirmed by blank experiments.
1Ü, was analyzed with ion chromatography and postcolumn reaction
with UV/Vis-dctection as described in chapter 2. The method consists of
an anion Chromatograph with a AG/S 9 column (Dionex) with postcolumn
reaction to form 17 and the LV/Vis-detection of this species at 288 nm.
The detection limit (S/N = 3) in natural waters was 0.1 pg/L (0.6 nM).
IO7 solutions were stable for at least 7 days.
Page 77
64
4.2.1 Ozonation Kinetics
Ozone stock solutions were produced by continuously bubbling ozone-
containing oxygen through distilled water at 0 °C (Bader & Hoigné,
1981). The resulting 03 concentration was typically around 1 mM. The
kinetics of the oxidation of HOI/OF by O, were investigated in a continu¬
ous flow-through system at 25±2 °C. An O, solution (17-73 pM, pH =
3.5) and a buffered F solution (4-18 pM, pH = 3.0-9.7) were pumped by
two mechanically driven glass syringes (Dosimat 665, Metrohm, Herisau,
Switzerland) and mixed in a first mixing tee to pass a capillary tube. The
buffer concentration (phosphate) was 50 mM. At the end of the capillary
(observation point), a solution of indigo trisulfonatc (70 pM). malonic
acid (5 mM). and phosphoric acid (0.1 M) was added through a second
mixing tee to stop the reaction and at the same time detect the residual 03
by decoloration of indigo (Bader & Hoigné, 1981). fndigo reacts quanti¬
tatively and very quickly with 03. HOI also reacts with indigo but this re¬
action was quenched by addition of malonic acid. The reaction time for
the reaction 03 + HOT/OI was defined by the volume of the capillary tube
and the flux of the mixed solution and varied from 0.15 to 2.4 s. From
the decrease of [07, an observed rate constant was calculated according to
second-order kinetics. The pH was measured at the observation point. The
experimental setup was similar to the one applied by Hunt & Marinas
(1997).
4.2.2 Chlorination Kinetics
The kinetics of the oxidation of HOI by HOCl/OCl were investigated in
20-50 mL batch reactors under pseudo-first-order conditions
([HOCl/OCl 1 » (HOI]) at 10±2 °C and at 25±2 T. Chlorine (5-450 uM)
was added to I solutions (0.5-3 3 pM) at a molar ratio [HOCl/OCl ]:|1 I of
10:1 to 20:1. HOI was formed immediately after chlorine addition. The
Page 78
65
pH was varied from 5.3 to 8.9. The buffer concentration (phosphate) was
3-33 mM but at least 1000 times higher than [HOF|. Aliquots of the reac¬
tion solution were withdrawn after H) s - 10 h and added to an acidic
phenol solution ([phenol] = 3 x [HOCl|) to quench the reaction. Both HOI
and HOCl react quantitatively and quickly with phenol. The formation of
IO, was measured by ion chromatography (see chapter 2).
4.2.3 Oxidation by NH2C1
The kinetics of the oxidation of HOI by NFFC1 were investigated in 20
mL batch reactors under pseudo-first-order conditions (NH2C1 » HOI)
at 25±2 °C. I (0.1 pM) was added to solutions containing chlorine (5-
1000 pM) and ammonia (5-1000 pM) at a molar ratio [HOCl]:[NH/] = 1.
HOI was formed immediately after the addition of 1 (kinetics see Table
4.1). The pH was 7.2-8.5. The buffer concentration (phosphate) was 3-33
mM and was at least 1000 times higher than the [HOI]. Aliquots of the re¬
action solution were withdrawn after 1 - 50 h and added to an acidic sul¬
fite solution ([HSO^]:[NH2Cl] = 1.2-1.5) which quenched the reaction.
The acidification of the sulfite solution was needed to prevent the reduc¬
tion of TO, by sulfite (Rabai & Beck, 1988). The formation of IO-, was
measured by ion Chromatograph}' (see chapter 2). Blank experiments to
test the importance of the disproportionation were run under exactly the
same conditions but without adding ammonia and by adding just 0.1 pM
of chlorine to torm HOI.
Page 79
66
4.3 Results and Discussion
4.3.1 Stoichiometrv and Kinetics of the Oxidation of HOI and
OT by O,
HOT is formed very quickly by oxidation of F in ozonation processes (see
Table 4.1). It was previously shown and confirmed by us that the reaction
of O, with I did not produce free radicals that initiated a radical-type
chain reaction for accelerating the decomposition of aqueous O, (Hoigné
et ak, 1985). This means that no 0, is formed by an electron transfer
from F to O-,. That the oxidation of T occurs through an O-atom transfer
reaction is also indicated in the present study.
The stoichiometrv of the reaction of O, with T was determined at
different ratios of 10,|:[T] by measuring IO7 formation. For ratios
[0<J:[I] > 3:1, we found a complete oxidation of F to TO7 (pH 4 and 8.5).
The overall reaction of O, with I can therefore be formulated as:
3 O, + I = 10, + 3 02 (4.4)
A formation of penodate (IO7) which would result in a higher O,, con¬
sumption has not been observed. This is in agreement with previous
studies (Black et al., 1968; Hoigné et ak, 1985).
A straightforward formation of the halogenate ion as for iodine can¬
not be observed for all halogens. In current drinking water treatment,
BrO, is of particular interest due to its potential carcinogenicity. In this
case, Br is oxidized to OBr which is partly ieduced to Br.This leads to
a catalytic cycling between Br and OBr, during which O, is consumed
(Haag & Hoigné, 1983; von Gunten & Hoigné. 1994). Part of the OBr is
oxidized by O-, which leads to BrO-, formation in analogy to the behavior
of HOi/01. In contrast to HOI/01 which are both oxidized by 03, only
OBr further reacts with O,. Because of the slower kinetics, O, is not the
Page 80
67
only oxidant which is involved in Br07 formation during ozonation. A
significant part of the Br07 formation occurs by oxidation with hydroxyl
radicals (von Gunten & Hoigné. 1994).
The kinetics of the oxidation of 1101/01 by 03 have been determined
in the pH range 6.0 - 9.7 and for ratios [0,F|I] of 3.0 - 6.5 by measuring
the O, depletion in a flow-through apparatus. Blank experiments m ab¬
sence of I showed that O, was stable during the reaction time (t,;: > 18 s).
Observed rate constants kohs0. were determined by a second-order kinetics
approach (r > 0.9). Between pH 6.0 and pH 8.0, the kobsCn remained con¬
stant, whereas at pH > 8.0, a pH-dependent increase was observed (Fig.
4.1). This can be explained by assuming that the oxidation of HOI domi¬
nates the reaction at pH < 8.0 and that the oxidation of Ol becomes im¬
portant at higher pH-values. From kohs03 at pH < 8.0, the rate constant
km+1101 of the oxidation of HOI by O, can be calculated as 3.6± 1.0 x IO4
M 's '. The error indicates the standard deviation (n = 18). The rate con¬
stant k03+0I- for the reaction of Ol with O, can be calculated from the pH-
dependence of kobs>œ for pH > 8.0 if the pK, = 10.4 of HOI is considered
(chapter 3):
^bsœ = W.,roi + ko^r/(l+10pkn-pU) (4.5)
The inset of Fig. 4.1 shows the linearization of the data according to eq.
4.5. The slope of the resulting line is kœ+or = l.6±0.5 x IO6 MV. The
error indicates the standard deviation of the lineai regression (r = 0.937,
n = 16). The line in Fig. 4.! shows the fit according to eq 4.5 for the ob¬
served data of kobsOV Table 4.2 shows both rate constants for the reaction
of O, with FIOI and Ol. Compared to OBr (km+mr = 430 M'V1; Haag &
Hoigné, 1983) and OCl (k0,40C,- = 120 M 's l; Hoigné et ak, 1985), the
oxidation of Ol by O, is about four orders of magnitude faster. In con¬
trast to HOF both HOCl and HOBr cannot be oxidized by O, (Haag &
Hoignc, 1983: Hoigné et al., 1985),
Page 81
68
O
CDGO
4t
3 -
2
0
--
T 4]EX)
IT)
o_
i—i /
m
Q E
j? o<(
R2= 0.937D
ko3+or
8/
) 0.08 0.16
l/(l+lOPKa-pH)
--
& O O ^ J&ÄTO
1 1 1 1
6 8
pH
9 10
Figure 4.1: pH-dependence of the observed second-order rate constant
k0bsO, of the oxidation of HOI and Ol by O,. The inset shows
the linearization with linear regression according to eq 4.5.
The reactivity of O, toward different iodine species is important for
iodometric 03 gas-phase determination (Bablon et al., 1991). Usually, the
0,-containing gas is bubbled through a solution of 60-300 mM F at neu¬
tral pH. From Table 4.1, we can assume that the first oxidation step of I
leads immediately to HOI. The further consumption of O, by HOI is in
competition with the reaction of O, with I.Since the reaction of O, with
F is 5 orders of magnitude faster than with HOI and since [I"l » fHOI].
no further oxidation of HOI has to be expected. In addition, under these
conditions HOT quickly reacts with 1 to form F (4.4 x IO'2 M"V x [Hh];
Eigen & Kustin, 1962) which again hinders the further oxidation of HOI
by Ov
Page 82
69
Table 4.2 Rate Constants and Products for Oxidation of HOI
and Ol with O,, HOCl, OCl, and NH2C1 from This Study
product
M'V1 107
MV 107
MV 107
M'A1 107
M~V I03
M~V unknown
M'
s'
unknown
4.3.2 Stoichiometrv and Kinetics of the Oxidation of HOI by
HOCl and OCT.
The stoichiometrv ot the reaction of HOCl/OCl with F was investigated
at pH 5.3 - 8.7 and at a molar ratio of [F10Cl):[F] = 4:1. As mentioned
earlier, the first oxidation step from F to HOT occurs immediately. For
the further reaction, the formation of 10, was measured together with
the sum of [HOCl] + [OCT] + [HOI] which was measured as I, (m excess
of F) by spectrophotometry. H0C1/0C7 (3.0+0.1 mol) was consumed for
reaction 10 °C 25 °C
HOI + O, (k(miIO!) 3.6±i.0x
10*
OF + O, (k0V0D
HOI + HOC! + HOCl
* k iioctnioi'
1.6±0.5 x
IO6
8.3+0.8 x 8.3±0.8 x
10l IO4
5.6±1 0 8.2±0.8HOI + HOCl
\k HOcmiOF
HOI + OCl' (k0Cl.m01) 33±4 52±5
HOI + NRC1 <2xl0"3
01 + NTFCl (kNH2C1+01.) < 3
Page 83
70
every mol of F and yielded 0.99±0.02 mol of I03 according to reactions
4.6 and 4.7.
2 HOCl + HOI -> 10, +2CF + 3H+ (4.6)
2 OCl + HOI -> 10, + 2 CF + HF (4.7)
Therefore, it can be assumed that no stable intermediate and no 107 are
formed. 107 formation was already observed in an earlier investigation
(Black et ak, 1968).
0 2000 4000 6000
t / s
Figure 4.2: TO, formation from the oxidation ol HOI by HOCl/OCl". Er¬
ror bars show the standard deviation of the IO, determina¬
tion. The inset shows the linearization with linear regression
according to pseudo-first-order kinetics. kobsHOCItol can be cal¬
culated from the slope to be 5.3 x IO"4 s ]. Experimental con¬
ditions: [HOClllot = 15.3 pM; pH = 7.2; jHOI]0 = 1.4 pM: T =
24 V
Page 84
71
The kinetics of the reaction of hypochlorous acid (HOCl) and hypo¬
chlorite (OCT) with HOI/OF was investigated under pseudo-first-order
conditions in the pH range 5.3 - 8.9, at 10 °C as well as at 25 °C, and at
chlorine concentrations of 5 - 450 pM by measuring the rate of formation
of 107. The 107 formation in a typical experiment is shown in Fig. 4.2.
The observed rate constant kobU10C!lol for the oxidation of HOI by [HOCFj,ot
= [HOCl] + [OCr] was calculated as a pseudo-first-order rate constant
from the decrease of [HOI](t) (see inset Fig. 4.2). lHOT](t) was calculated
by subtracting the formed [IO,l(t) from the initial [HOI]0. Under our re¬
action conditions, the disproportionation of FIOI did not interfere and the
buffer concentration did not alter the reaction rate. The pKa of HOCl was
taken as 7.53 (Weast, 1984).
Figure 4.3 shows the dependence of kobsl!OChol on the HOC! concen¬
tration in the pH range 5.3-6.4. Because the observed rate constants did
not depend on the pH in this pH range, we concluded that OCl did not
play a role and HOCl was the kinetically dominant species. The reaction is
first-order in HOCl at low concentrations (5-20 pM; Fig. 4.4). At higher
HOC1 concentrations (100-450 pM), a term that is second-order in HOCl
must be considered. The oxidation kinetics of HOI by HOCl arc, there¬
fore, a result of two pathways, which both contribute to the overall reac¬
tion:
if-1 = koKCl WOl] = k•
HOCl+HOl I HOCl] [HOI1 +clt
^'"lIOCl+HOT LHOCl|2[HOI] (4.8)
The rate constant k*'il0C1+H01 of the second-order reaction was determined
by a linear regression m the concentration range of [HOC11 = 5-20 pM
^o„,hoci!o, vs. jHOCll) which yields k"H0(llM0, = 8.2±0,8 M'V (25 °C).
The error indicates the standard deviation of the linear regression tr =
Page 85
72
0.964, n = 14). This value is in agreement with an earlier study (Lengyel
et al., 1996). At this low [HOOF the third-order reaction can be ne¬
glected. For the calculation of the third-order rate constant k'"H0C1+H0I,
only experimental data for the range of 100-450 pM HOCl was used. Ac¬
cording to cq 4.8, k"'„ocn.no, was found as the slope of a plot of kob, HOCltol-
[HOCl] vs. [HOCH2 to be 8.3±0.8 x IO1 M"2s l(25 °C; standardk"
HOCt+HOI
deviation; r = 0.939, n = 13).
0 100 200 300
[chlorine] / umol/L
00
Figure 4.3: Dependence of the observed pseudo-first-order rate constants
k,obs HOClioi
for the oxidation of HOT by HOCl on the concentra¬
tion of chlorine (pH = 5.3-6.4; 25 °C).
The mixed order of the reaction kinetics of the oxidation of HOI by
HOCl can be explained by two hypothetical pathways. The differences re¬
sult from an addition of HOI to the O-atom or the CI-atom of HOCl. The
first case results m a new iodine-oxygen bond which leads to iodite (I02 ).
102 is quickly further oxidized to 107 by HOCl. Such a reaction mecha¬
nism would result in a first-order beha\ior in IHOCll. The second
Page 86
73
^
o
o
M
8 T 4r-% pH = 8.2-8.9
q,' ö
kocr + hot
5 10 15
[chlorine] / pmol/L
pFl = 5.3-6.4
HOCl + HOI
Figure 4.4: Dependence of the observed pseudo-first-order rate constants
kobsHoaiot for tne oxiclation of HOI by HOCl and OCF on the
concentration of chlorine in the low concentration range (25
°C). Lines show the best linear fit.
pathway leads to the fast formation of an intermediate with an iodine-
chlorine bond te.g. HOI-CIOH). This intermediate can either quickly re¬
çu ssociate to the initial compounds (HOCl, HOI) or alternatively react
with a second HOCl. This would lead to a compound such as e.g. HOF
(C10H)2 which would quickly hydrolyze to 107- If the rate-determining
step is the reaction of the second HOCl with the interhalogen compound
(HOFCIOH), a second-order kinetics with respect to HOCl results. The
rate constants for the reactions of HOI with HOCl are compiled in Table
4.2. It can be calculated that for [HOCl] = 100 pM, the second-order
pathway and the third-order pathway have a comparable reaction rate. In
oxidative drinking water treatment, HOCl concentrations are usually con¬
siderably lower, At [HOCl] = 3 pM (0.2 mg/L CF), the second-order
pathwaj contributes 99.9 % to the reaction of HOI with HOCl whereas
this value decreases to 80 9( for [HOCl] = 30 pM (2 mg/L CF).
Page 87
74
In the pH range 8.2 to 8.9, the reaction of HOCl/OCl" with HOI was
investigated in an OCl" concentration range of 5-20 pM. Since the ob¬
served pseudo-first-order rate constants did not depend on the pH in this
pH range, we concluded that OCl" and HOI were the kinetically dominat¬
ing species. The reaction of FIOI with OCl" was first-order in OCl" (see
Fig. 4.4). Table 4.2 shows the corresponding rate constants. At 25 °C, we
found k0C).+H0I = 52±5 M's"1. The error indicates the standard deviation of
the linear regression (r = 0.920, n = 9). The rate constants for the first-
order reactions of OCF are significantly higher than the rate constants for
HOCl. Under typical drinking water treatment conditions (3 - 30 pM or
0.2-2 mg/L CF), the reaction OCl + HOI is therefore dominant and con¬
tributes 60 % (pH = 7) to 99.5 Cr (pH = 9) to the overall FIOI oxidation
by chlorine.
All observed rate constants which were determined for the oxidation
of HOI/OF by O^ and chlorine are shown in the Appendix C.
4.3.3 Reaction of Ammonia and Monochloramine with HOI
In the presence of ammonia, the formation of haloamines during disin¬
fection is an important part of the aqueous chemistry of chlorine and
bromine (lohnson & Overby, L971; Wolfe et al., 1985). However, the
formation of iodamines in water has not been observed so far. To test the
formation of iodamines, we measured the UV-absorbance spectra between
200 nm and 250 nm of solutions containing an excess oi ammonia (0.01 -
3 M) relative to HOI (0.1-0.5 mM) at pH = 7.0 - 8.5 in a flow-through
apparatus (to avoid disproportionation). The residence time in the pho¬
tometry cell was 8 s. Because FIOI absorbs in the observed range, we ex¬
pected a change in the absorbance spectra if iodamine is formed. How¬
ever, the observed spectra did not differ trom the sum of the absorbance
spectra of the single components. These results are an indication that
Page 88
75
iodamines (NHxIVx: x = 0-2) are not formed in water under these condi¬
tions.
Monochloramine (NH2C1) is known to oxidize T to HOI in a rela¬
tively fast, pH-dependent reaction (Table 4.L). To determine the rate con¬
stant for further oxidation of HOI by NTFCl, we measured the
corresponding I07 formation in the pH range 7.2-8.5 in the presence of
0.005-1.0 mM of NH2C1 and 0.1 pM of HOI. Within the first 77 h of the
reaction, we detected [I03"1 which was less than 25% of the initial [HOI].
This observation is in agreement with an earlier report (Black et ak,
1968) and allows estimation of a maximum rate constant kNH2C)+H0I for the
reaction NH2C1 + HOI of 2 x 10" M 's 7 This constant applies if HOI was
the reactive species. However, Ol could as well be the reactive species. In
this case, the corresponding maximum rate constant kNH1cl+0I. for the reac¬
tion NH2C1 + OT would be 3 M ls \
4.3.4 Implications for Drinking Water Production
Ozonation. In a typical ozonation process, the half-life of HOI is very
short and varies between the extremes 0.19 s (2 mg/L 0„ pH 9) and 3.7 s
(0.25 mg/L O,. pH 6). During ozonation, formation of iodoorganic com¬
pounds can therefore only occur if it is an extremely fast reaction. CHF,
was reported to form within hours in a natural water (TOC 2.5 mg/L;
Karpel Vel Leitner et al., 1998). In this water, an ozonation would oxi¬
dize HOI much taster than CHI, was formed. In addition, since 03 is pres¬
ent in high excess. HOI would have to react very specifically with NOM
functional groups. Therefore, the formation of iodoorganic compounds in
ozonation processes is rather unlikely.
Chlorination. In chlorination processes, the half-life of FIOI Is
higher than m ozonation processes. At a concentration of 2 mg/L CF and
apH of 9. the half-life of HOT is 8 mm. At a concentration of 0.2 mg/L
Page 89
76
CF and a pH of 6, the half-life of HOI is 10 h. Therefore, the formation
of iodoorganic compounds, which has been observed to occur in a similar
time-range, seems to be possible especially at low pH and at low chlorine
concentrations (Karpel Vel Leitner et ak. 1998). However, the NOM-sites
which are reactive toward HOI may also be oxidized by HOCl in a com¬
peting reaction. Because HOCl is present in large excess relative to HOI
(2-4 orders of magnitude), a rate constant for HOI of I0:~10l fold the
corresponding HOCl rate constant would be required to have a 1:1 distri¬
bution of chlorinated and iodinated organic products. This restriction
considerably reduces the probability of the production of iodoorganic
compounds.
Chloramination. Chloramine is often the disinfectant of choice
for distribution systems because of its long-term stability and, on the
contrary to chlorine, its small production of disinfection by-products such
as trihalomethanes. With regard to the formation of iodoorganic com¬
pounds, the long half-life of HOI in chloramination processes is a new
constraint which has to be accounted for when selecting a disinfectant for
I -containing waters. In chloramination processes, the conditions for the
formation of undesired iodoorganic compounds are very favorable. Ac¬
cording to Fig. 4.5, T is first oxidized to HOI by NEFC1 which then can
further react with NOM in two different ways: In a reaction with NOM,,
it can add to the NOM with the formation of iodoorganic compounds.
The other possibility is a reduction of HOI back to T (NOM2). Since
MFC1 is in high excess relative to I, the latter can be oxidized to HOI
again and undergo the two reactions according to Fig. 4.5. The cyclic
character of this reaction pathway with iodoorganic compounds as a final
sink may lead to elevated levels of these undesired by-products.
Page 90
77
NH9Ci CF + NH
F HOI Iodoorganic compounds
NOM2,ov N0M:
Figure 4.5: Schematic representation of the formation of iodoorganic
compounds in chloramination processes.
In the literature, the formation of iodoorganic compounds has been
mainly observed during chlorammations (Hansson et ak, 1987; Karpel
Vel Lcitner et al., 1998). When chloramine was utilized, mainly CHI, was
formed whereas only low concentrations of the bromo- and chloro-
trihalomethanes (CHCI,, CHCFBr, CHClBr,, CHBi\) were observed.
When chlorine was used to treat the same waters, only bromo- and
chloro-tnhaloniethanes were observed but no CHI,. These findings can be
understood by our kinetic measurements. Elsewhere, it has been reported
that the formation of iodoorganic compounds is strongly dependent on the
order of addition of chlorine and ammonia m disinfection processes for
the distribution system (Hansson et al, 1987) When chlorine was added
first, no formation ot iodoform was observed. The lag-time between the
addition of chlorine and the addition of ammonia was 80 s, HOI cannot be
Page 91
78
completely oxidized to 107 within this short time. The formation of I-
THMs might be hindered due to reaction of HOCl with THM-precursor
sites in the NOM. If ammonia was added before HOCl, a formation of
iodoorganic compounds has been observed. In this case, HOCl reacted
immediately with ammonia to MLC1 which then can be treated as the
chloramination case.
Figure 4.6 schematically summarizes the fates of iodine during oxi¬
dative drinking water treatment. Whereas 10, is a desired sink for HOI,
iodoorganic compounds have to be avoided due to possible taste and odor
problems. From our study we conclude that 10, is only a major sink in
ozonation and part of chlorination processes. Oxidation of HOI by MFC1
is certaml> too slow to compete with HOI reactions with NOM. Dispro¬
portionation of HOI which is discussed m chapter 3 is so slow under
drinking water treatment conditions that it does not lead to significant
IO7 formation. Even at high ammonia concentrations, the formation of
iodamines was not observed. A summary of the half-life of HOI in the
presence of 0„ CF, or NH2C1 as well as the half-life of HOI with respect
to the disproportionation is shown m Fig. 4.7. The half-life of HOI has to
be related to the kinetics of formation of iodoorganic compounds which
occur in the order of hours (Karpel Vel Leitner et ak, 1998).
Page 92
79
Lorg
fast oxidation byozone, chlorine,
chloramine
HOI/01-
reaction with NOM
further oxidation ICH"by Otj and CF>
NH4+/NH3
NFIoCT disproportionation
^
1-+103"
10V
Figure 4.6: Fate of iodine during oxidative drinking water treatment
processes: IO7 and iodoorganic compounds as possible sinks.
Ozone Chlorine
-*w
Is lmin lh
Dispropo rti onati on
<** H
Chloramine
1 ^_
d yr
Figuie 4.7: Typical half-lives for HOI for different disinfectants and the
disproportionation under typical drmkmg watei treatment
conditions. Ozonation: 0.25-2 mg/L 0„ pH 6-9; chlorination:
0.2-2 mg/L CF, pH 6-9: chloramination: < 2 mg/L CF; dis¬
proportionation: 1-50 ng/L HOI, 0-5 mM carbonate, pH 6-9
(chapter 3). The oxidation processes transform I into
HOT/Ol within a typical time of less than I 111s for O-, and CF
and less than 15 mm for NTFCF
Page 93
80
4.3.5 Implications for Seawater Chemistry.
03 Deposition and I03" Formation. Our kinetic data of the reaction
O^ + HOI/OF may be significant for the iodine chemistry in the surface
boundary layer of seawater or for the dry deposition of O, to the sea. Es¬
timated concentrations in the surface boundary layer are 2 nM for HOI
and 200 nM for I (Thompson & Zafiriou. 1983). Under these conditions
and at pH = 8.1, the apparent first-order rate constant for the consump¬
tion of C by HOI/OF is IO"4 s"7 which has to be compared to the rate
constant for the consumption of O, by 1", which is 4 x 10² s"1 (Garland et
ak, 1980). The reaction of O, with HOI/OI accounts therefore to less
than 10"' °7c of O, consumption. The depletion of O-, and the formation of
HOI by the reaction O, + I is reported to be 6 x IO9 cm ~s'
(Thompson &
Zafiriou, 1983F This is the number of molecules which react per cur of
sea surface and per second. From this, by the reaction O, + HOI/OI, a
depletion of O, of 3000 em's 'and a 10," formation of 1500 cm"2s"' can be
calculated. Accounting for diffusion from the surface layer (D = 2x IO"5
enrs ') and setting the size of this laver to 30 um, this results in a steady-
state concentration of IO7 of 4 x 10"10 M. The influence of the reaction O-,
+ HOI/OI on the chemistry of the surface boundary layer or on the dry
deposition of Oq to the sea can therefore be neglected. The formation of
iodoorganic compounds is therefore possible through this mechanism.
Aquacultures. Oxidation ot seawater by 03 or CF is sometimes
applied for disease control in aquacultures (Chang et ak, 1998; Douillet &
Pickering. 1999). Suggested oxidation conditions are a residual concen¬
tration of 0.5 mg/L O, after 10 min. Under these conditions, the half-life
of HOf is < 1.5 s. For the use of chlorine, a dose of 5 mg/L is suggested.
In a chlorination, the half-life of HOI depends on the stability of chlorine
m the particular watei. For hypothetical hall-lifes of chlorine ot 1 mm,
10 mm. or 60 mm IO, formation from HOI oxidation may be 23 %.
Page 94
81
92%, or 100 %, respectively. ÏO7 is therefore formed in ozonation and in
chlorination processes. The extent of IO7 formation depends on the sta¬
bility of the disinfectant in a particular water. If chlorine is quickly con¬
sumed by other water constituents such as NOM or Br,the formation of
IO, is not complete and iodoorganic compounds may form. The high
concentration of I 111 the seawater (45-60 pg/L) compared to frcshwaters
(0.5-20 pg/L) has no influence on the oxidation as long as a sufficient ex¬
cess of the disinfectant is used.
Page 95
W^ x. \ AV
4** \ St f
\ -7
wV 7\ *•
t***i,\ *«>
Page 96
83
5. Formation of lodo-Trihalometh¬
anes in Natural and Model
-*>- -Tar- ~r j
Waters
Y. Bichsel andFJ. von Gunten. to be submitted to Environmental Science
& Technology.
The formation of iodo-trihalomethanes (FTHMs) such as iodoform
(CHI,) during oxidative treatment of iodide-containing drinking waters
can be responsible for taste and odor problems. FTHMs are formed by
reactions of hypoiodous acid (HOD with natural organic matter. HOI is
quickly formed from naturally occurring iodide (I) by oxidation with
ozone, chlorine, and chloramine. The kinetics of reactions of HOI with
organic model compounds as well as the resulting CHI, formation were
measured. Phenols and in a smaller extent a-methyl carbonyl compounds
were found to be reactive toward FIOI and also to yield CHE. For phe¬
nols, the rate constants for the consumption of HOI varied over almost 9
orders of magnitude from 1.5 M"s! to 7 x 10s M's"'. Resorcinol yielded
much more CHI, than phenol or a-methyl carbonyl compounds. The ki¬
netics of the formation of I-THMs were also measured in natural waters
which were oxidatively treated with ozone, chlorine, or chloramine.
When using ozone, no FTHMs were detected and most t was transformed
to IO,. Chlorine led to the formation ot both TO, and FTHMs. With in¬
creasing chlorine doses, the CHI, formation decreased but the IO," for¬
mation as well as the formation of classical THMs such as chloroform in¬
creased. In chloramination processes, FTHMs (especially CHI,) were the
mam products. The formation of I-THMs was significantly slower than
Page 97
84
the consumption of HOI. Therefore, it can be hypothesized that the addi¬
tion reaction of HOI is not rate-determining but rather a final hydrolysis
step. A comparison of kinetic results of model compounds with natural
waters shows that the CHI, formation in natural waters can be explained
by activated phenolic groups.
5.1 Introduction
About 25 years ago, the formation of trihalomethanes (THMs) during
drinking water chlorination was disco\ered (Kleopfer & Fairless, 1972;
Bellar et al., 1974; Rook, 1974). The four THMs which usually are found
and studied are chloroform (CFICF), bromodichloromethane (CHBrCF),
dibromochloromethane (CHBr,Cl). and bromoform (CHBr,). These com¬
pounds will be referred to as 'classical THMs' in this chapter. The discov¬
ery of these compounds had many consequences for drinking water
treatment. The potentially carcinogenic activity of these compounds led to
stringent drinking water standards of 100 pg/L for total THMs in the
E,U and 80 pg/L for total THMs m the U.S. (EU, 1998; USEPA. 1998).
Guideline values of the World Health Organization (WHO) are 100 pg/L
for CHBr, and CHBixCl, 60 pg/L for CHBrCF, and 200 pg/L for CHC1,
(WFIO, 1993).
In iodide-containing waters, the formation of six additional THMs,
the iodo-trihalomethanes (FTHMs), can occur through incorporation of
one ot more iodine atom into a THM. The resulting compounds are iodo¬
form (CHlp, chlorodiiodomethane (CHOL), bromodiiodomethane
(CHBrF), dichloroiodomethane (CHCFI), dibromoiodomethane (CHBrJ),
and bromochloroiodomethane (CHBrClI). In contrast to the classical
THMs, no adverse health effects have been attributed to I-THMs. How¬
ever, these compounds and especially CHI, were found to be responsible
Page 98
85
for the occurrence of bad taste and odor in drinking waters in the late
1980s (Hansson et ak, 1987; Bruchet et ak, 1989; Gittelman & Yohe,
1989). The organoleptic threshold concentration of CHI, lies between
0.03 and I pg/E which is the lowest value of alL I-TIIMs (Suez Lyonnaise
des Eaux, 1993; Khiari, 1999). Total iodine concentrations in water re¬
sources are usually in the range of 0.5-20 pg/L but can exceed 50 pg/L in
certain ground waters near the sea coast or under special geological cir¬
cumstances (Fuge & lohnson, 1986). Therefore, the formation of CHI,
above its organoleptic threshold concentration from naturally occurring
iodide (1 ) is possible during oxidative drinking water treatment.
In oxidative drinking water treatment, T is first oxidized to HOI in
presence of ozone (Garland et al., 1980), chlorine (Nagy et ak, 1988), or
chloramine (Kumar et ak, 1986) in a fast reaction. In a second step, some
of these oxidants/disinfectants oxidize HOI to iodate (IO,). The kinetics
of these reactions have been determined for ozone, chlorine, and
chloramine in an earlier study (chapter 4). In a typical ozonation (0.25-
2.0 mg/L Op, TO," is formed within less than 4 s. The oxidation of HOI
by chlorine is slower. The half-life of FIOI in a typical chlorination proc¬
ess (0.2-2 mg/L CF, pFl = 6-9) is 8 - 600 min. Chloramine does not oxi¬
dize HOI to 10,". Chlorine dioxide (C107) oxidizes F to Fradicals. This
involves a completely different chemistry than the other disinfectants
(Fabian & Gordon, 1997). The fate of Fradicals in drinking water is un¬
known.
An alternative sink for HOI is its dispioportionation. Thereby, HOI
(oxidation state +1) reacts with itself leading to a reduced species (I,oxi¬
dation state -f) and to an oxidized species (TO,", oxidation state +V). The
disproportionation can be described by reaction 5. F
3 HOI -> TO, +21 +7 IT (5.1)
Page 99
86
In an earlier study, we showed that this reaction is only of minor impor¬
tance in drinking waters (chapter 3).
To describe the reactivity of HOI, its pH-dependent speciation has to
be considered. The pK, of HOI is 10.4 (chapter 3). In the oxidation of
HOI by 0„ the reactivity of hypoiodite (OT) contributes more than 63 %
to the oxidation rate at pH = 9.0 although this species represents only 4 %
of the total HOI (chapter 4). At low pH, H2OF can be formed by proto-
nation of HOI (pKa = 1.4+0.3; Bell & Gelles, 1951: Burger & Liebhaf-
sky, 1973).
The formation of I-THMs from the reaction of HOT with natural or¬
ganic matter (NOM) is in kinetic competition with the oxidation of HOI
to IO, and the disproportionation of HOI. The present study focuses on
the kinetics of the reaction of HOI with organic compounds and on the
formation kinetics of I-THMs both in natural and model waters. The rela¬
tive reaction rates of the oxidation of HOI, the disproportionation, and
the addition to organic compounds determine the product distribution
between IO, and iodoorganic compounds such as I-THMs.
I-THMs were detected in several drinking waters, hi one case, a
change from chlorination to chloramination led to the formation of
5 pg/F CHI, from an F concentration of 50 pg/L (Hansson et ak, 1987).
In another water, up to 30 pg/L CHI, and only low concentrations of the
classical THMs were formed from 200 pg/L T when chloramine was
utilized (Karpel Vel Leitner et al., 1998). When chlorine was used to
treat the same water, only classical THMs were observed but no CHI,.
Another study reports the appearance of CHI, after the chlorination of a
water with a high I concentration (150-200 pg/L; Bruchet et ak, 1989).
The same study describes the formation of I-THMs in an ozonation dur¬
ing failure of the ozonation step (90 pg/L 1 ).
Page 100
87
5.2 Experimental Section
All chemicals were of the highest purity grade. With exception of pina-
colone which was redistilled, all chemicals were used without further pu¬
rification. HOI is not stable in water (disproportionation). Prior to ex¬
periments, it was freshly produced through oxidation of F by HOCl from
a NaOCl stock solution (Aldrich) of approximately 0.68 M. The exact
concentration could be determined in excess of T as 1, (£->88 nm= 38'200
M^'cm"1; chapter 2). pH measurements were carried out with a Ross elec¬
trode (ATI Orion, Boston, MA) and a Metrohm 632 pH-meter (Metrohm,
Herisau, Switzerland) which was calibrated with standard buffer solutions
(Merck). Spectrophotometric measurements were performed on an
Uvikon 940 spectrophotometer (Kontron Instruments, Eching, Germany).
5.2.1 Consumption of HOI by Organic Model Compounds
The kinetics of the consumption of HOI by organic model compounds was
measured in double-distilled water in 250 mL batch reactors and in a
continuous-flow apparatus under pseudo-first-order conditions ([model
compound] » fHOFJ) at 25±2 "C. HOI was prepared by mixing F and
OCl" in a volumetric flask and diluting it to a concentration of 1-4 pM.
Between pH 3 and 11, pH was controlled by 0.5 - 5 mM of phosphate
buffer. For pH < 3, only sulfuric acid was used to control the pH,
whereas for pH > 11, only NaOH was used lor this purpose. More ex¬
perimental details can be seen m Tables 5.1-5.3
The continuous-flow apparatus consisted of three mechanically
driven glass syringes (Dosimat 665, Metrohm, Herisau, Switzerland)
which pumped a solution of FIOI and phosphate, a solution of the model
compound, and an iodide solution (0.45 M KI). All three solutions were
pumped with the same flux of 5 mL/min. The HOI solution and the model
Page 101
88
compound solution were mixed in a first mixing tee. Thereafter, they
passed a capillary tube of well defined volume. The T solution was added
through a second mixing tee at the end of the capillary (observation
point). This experimental set-up was similar to the one applied by Hunt &
Marinas (1997). I" stopped the reaction and allowed at the same time to
detect the residual HOI in a 5 cm flow-through photometric cell by for¬
mation of I," (k,_ =5x 10" M 's ' (Eigen & Kustin, 1962), k,T_
=
1101+1°
Ï,+I
6.2 x 10l) M 's'(Turner et al., 1972); e„, nm= 25*700 M"1 cm '; chapter 2)
as shown m eq. 5.2.
HOI + 2 F + H' = 1, + H20 (5.2)
In drinking water systems with an excess of oxidant, reaction 5.2 is not
important because 1" is immediately oxidized to HOI or to ÏO7. The reac¬
tion time for the reaction of the model compound with HOI was defined
by the volume of the capillary tube and the flux of the mixed solution. It
varied from 0.8 to 2.7 s. The pH was measured at the observation point.
The decrease of HOI in the batch experiments was measured by
placing 25 mL aliquots of the reaction solution into a 10 cm photometric
cell together with 5 mL of l M KI. 1 stopped the reaction immediately by
quantitatively transforming HOI to 1," which was measured as described
above (eq. 5.2). This resulted in a detection limit for HOI of 0.4 pM.
5.2.2 Formation of CHI? in Model Solutions
The kinetics of the formation of CHI, in model solutions were investi¬
gated in nanopure water (Barnstead B-pure system) in batch reactors at
25±2 °C. The pFl was controlled by I mM phosphate buffers (pH = 7.0)
and 1 mM borate buffers (pH = 9.0). The initial concentration was 1 pM
model compound and 6 pM HOI. This excess of HOI allowed iodine-
addition over several steps which eventually led to CHI,. In addition, a
Page 102
89
residual HOI concentration could be guaranteed for the duration of the
experiment. The following parameters were analyzed during the reaction
time (32 h): HOI, CHI,, and IO,. HOI was analyzed by photometry as de¬
scribed above.
The analysis of the I-THMs was performed with liquid-liquid ex¬
traction into methyl tert-butyl ether (Fluka 'for residue analysis' >
99.8 %. Buchs. Switzerland) and GC/ECD according to Cancho et al.
(1999). Chromatographic separation was performed on a ÜB-5 column
(J&W). The following compounds were detected by this method: CHCFI
(limit of detection (LOD) 1.3 pg/L (S/N = 3)), CHBrOI (LOD 0.9 pg/L),
CHBr2l (LOD 0.6 pg/L), CHOL (LOD 0.3 pg/L), CHBrF (LOD 0.07
pg/L), and CHI, (LOD 0.1 pg/L). With exception of CHI,, I-THM stan¬
dards are not commercial^ available. For this study, standards were sup¬
plied by F. Ventura, Societat General d7/\igues de Barcelona (AGBAR).
IO, was analyzed with ion chromatography and postcolumn reaction
with UV/Vis-detection as described earlier (chapter 2). The method con¬
sists of an anion chromatographic separation with a Dionex AG/S 9 col¬
umn with postcolumn reaction to form I," and the UV/Vis-detection of
this species at 288 nm. The detection limit (S/N = 3) in natural waters was
0.1 pg/F (0.6 nM). The analysis of IO, allowed to quantify the amount of
HOI which had disproportionated by assuming that only this reaction
formed IO,". Thus, the consumption of HOI by the model compounds
could be calculated.
5.2.3 Formation of I-THMs and IO7 in Natural Waters
Two natural waters (from Seine river, France and lake Zurich, Switzer¬
land") were spiked with varying amounts of I and oxidatively treated with
chloramine, chlorine, or ozone at 25±2 °C. DOC was 1.3 mg/L m the
lake water and 3.5 mg/L m the river water. Fhe concentration of Br was
Page 103
90
30 pg/L in the river water and 15 pg/L in the lake water. Ammonia was
below 6 pg N/L. The pH was controlled by addition of 10 mM B(OH),
and adjusted to 6.2 or 8.0 by NaOH (I M, 10.8 M). The solution was
transferred to head-space free bottles immediately after the addition of
the oxidant. The following parameters were analyzed during the reaction
time (24 - 35 h): HOI, I-THMs, IO,, classical THMs, oxidant concentra¬
tion, pH. The FTHMs and IO, were analyzed as described above.
In these systems, it was not possible to analyze HOI by the photomet¬
ric method as described above. Oxidants such as chloramine, chlorine, or
ozone severely interfere in that method because they also oxidize I to 1,7
Therefore, FIOI was analyzed as iodophenol by HPLC. 20 pM of phenol
were added to an aliquot of the reaction solution to transform HOI to
iodophenol. Phenol reacts quickh and quantitatively with HOI (see be¬
low). Both p-iodophenol and o-iodophenol are formed in this reaction.
The two compounds were quantified relative to a p-iodophenol standard
solution by assuming that both iodophenol s had the same sensitivity. The
sum of them was calculated to determine the HOI concentration. The
chromatographic separation was done on a Nucleosil 103-5 C,8 column
(Macherey-Nagcl, Düren, Germany) with an eluent consisting of 65 %
methanol, 34.9 l/c water, and 0.1 7r acetic acid (retention times 5.5 min
for o-iodophenol and 6.5 min for p-iodophenol). FJV detection at 231 nm
yielded a detection limit of 2 nM I.
The four classical THMs (CHC1„ CHBrCF, CHBr2Ck CHBr,) were
analyzed by head-space GC/ECD. 5 mL of the reaction solution were
placed into 10 mL vials together with a double excess of sulfite to quench
the reactive chlorine and iodine species. Fhe vials were sealed with PTFE
seals. After heating the sample to 60 °C during 15 mm. 1000 pi of the
head-space were injected on a DB-5 column. Detection limits (S/N = F)
Page 104
91
were 0.06 pg/L (CHBrCFJ, 0.1 pg/L (CHBr2Cl), 0.3 pg/L (CHCl,), and
0.5 pg/L (CHBr,).
Oxidant concentrations were determined with the indigo method
(ozone; Bader & Hoigné. 1981) or with the ABTS method (chlorine,
chloramine; Pinkcrnell et ak, 1999).
5.3 Results and Discussion
5.3.1 Consumption of HOI and Formation of CHI, by Model
Compounds
A series of organic model compounds have been tested for their reactivity
toward HOI and the formation of CHI. in these reactions. The two main
classes which have been investigated arc phenols and a-methyl carbonyl
compounds. These compounds which are known to react with halogens
are present in substructures of NOM (Vollhardt & Schore, 1994).
Consumption of HOI by Phenols. The reaction kinetics of HOI
with six para-substituted phenols were investigated under pseudo-first-
order conditions ([phenol]>>[HOT]) in a batch and in a continuous-flow
system. Experimental details (pH, buffer concentrations, concentrations
of phenols, initial HOI concentrations, number of experiments) and the
calculated rate constants are shown in Table 5.1. The kinetics were always
first-order in phenol and first-order in HOI. The rate constants were de¬
termined by a least squares fit for eq. 5.3-5.5.
Page 105
Table5J
Rate
Constants
for
the
Reaction
ofPhenols
withHOI
compound
pKa
pH
mM
[phenol]
[HOI](t=0)
ncobservedrateconstants
/M
's
'
range
buffer
/pM
/pM
^k
k,
p-Methoxy-
1020'
314.7
110-20
1.1-3.5
11
5±lxl04
<100
7±2xl08
phenol
pCresol
10726'
25-4.9
0-1
10
0.8-2.6
84.0±F5xlOl
3±lxl02
7±3xi(F
Phenol
9.99'
3,18,6
2.5-5
10-500
1.7-5
27
5±2xl04
L0±03xl(V
2±lxlO(
p-Chloro-
9.43d
15-7.7
0-1
10-200
1.2-2.3
14
3±!xl(F
<5
F6±0
5xl(F
phenol
p-Iodo-
9.20'
05-82
0-1
10-200
0.8-5.0
16
4±lxl(F
20±8
F5±0.8xl(F
phenol
p-Cyano-
7.86b
1.9-8.4
0-1
10-
1.1-2.3
18
2±lxl02
1.5±0.5
4±2xl(F
phenol
1000
a;Dean.
1985;
b:
thiswork;
c:n=numberofkineticexperiments([HOIJ
vs.
t)
Page 106
93
H t Ol + (substituted)phenol 2—» products (5.3)
kFIOI + (substituted)phenol i—> products (5.4)
k-HOI + (substituted)phenolate —> products (5.5)
Figure 5.1 depicts the pH-dependence of the observed second-order
rate constants for a highly reactive phenol (p-methoxyphenol), a moder¬
ately reactive phenol (p-iodophenol), and a less reactive phenol (p-cyano-
phcnol). At low pH values, the reaction 1FOF + phenol is dominant (eq.
5.3). The results for p-iodophenol confirm the pK, value of 1.4±0.3 for
FFOF (see Fig. 5.1), At pH < 3.5. the observed second-order rate con¬
stant increases with decreasing pH due to the shift of HOI to H-,017 HXFF
is expected to have a higher reactivity as a result of its higher electro-
philic character. This increase stops at pH < 1, where the concentration of
H2OF does not further increase. However, the rate constant continues to
increase at pH < i for p-cyanophenol. Other unknown reactions might be
responsible for this behavior. At higher pH values (3.5 < pH < 5), the ob¬
served second-order rate constants go through a minimum. In this pH
range, reaction 5.4 involving HOI and the phenol becomes important for
p-cresol, phenol, p-iodophenol, and p-cyanophenol. For p-chlorophenol
and p-mcthoxyphenol, k4 could not be determined because reaction 5.4 is
always negligible compared to reactions 5.3 and 5.5. In these cases, it is
only possible to indicate a maximum value for kt. At high pH values (pH
> 5), the overall reaction is dominated by the phenolate (reaction 5.5).
This results in a ten-fold increase of the overall rate constant with every
pH unit until the pKa of the phenol is reached. All determined rate con¬
stants k„ k4. and k, are shown m Table 5.1. They cover a range of almost
9 orders of magnitude (1.5 to 7 x UF M 's 7
Page 107
ri
O
94
p-methoxyphenol
Figure 5.1: pFl-dependence of the observed second-order rate constant of
the reaction of HOI with some phenols. Symbols: experi¬
mental results, lines: calculated according to eq. 5.3-5.5.
A comparison of the rate constants for different phenols is shown in
Fig. 5.2. All determined rate constants are displayed against the Hammett
coefficients op of the substituents of the phenols (Johnson, 1980). These
coefficients describe the electron-w ithdrawing or donating effect of func¬
tional groups as substituents of aromatic systems at a certain position
(ortho. meta, or para). Fligh ap values can be found for electron-
withdrawing substituents such as the -CN group whereas low ex, values
are found for electron-donating substituents such as the -OCR, group. For
all three rate constants k,, kt. and k,, linearity can be observed with a
negative slope (Fig. 5.2). A negative slope is typical for reactions m
which the aromatic compound reacts as the nucleophile (Johnson, 1980).
The steepest line was found for reaction 5.5 what means that this reaction
is most susceptible to the influence of substituents. k, varied between 400
M 's '
(p-cyanophenol) and 7 x 1(F M"!s'
(p-cresol and p-methoxyphenol).
Page 108
95
For reaction 5.3, the rate constant increased only for the compounds with
Gp > 0 and remained constant for the two other compounds (see Fig. 5.2).
This effect might be the result of the change of the rate-determining step
in the reaction FFOF + phenol. For compounds with Gp > 0, the electron
density of the aromatic system influences the rate-determining step. For
the compounds with Gp < 0, the rate-determining step is probably not af¬
fected by the electron density of the aromatic system. For all compounds,
we found k, > k, > k4. The observation that k5 > k4 can be explained by
the increased nucleophilicity of the phenolate compared to the phenol.
The fact that k, > k4 can be explained by the increased electrophilicity of
H2OF compared to HOI.
Gp
Figure 5.2: Dependence of the calculated rate constants for the reaction
of HOI and H2OI+ with p-substituted phenols on the Hammett
coefficient Gp (Johnson, 1980). r = 0.966 ieq. 5.3). r2 =
0.965 (eq. 5.4), r = 0.966 (eq. 5.5)
Page 109
96
The reactions of HOI with substituted phenols are significantly faster
than the corresponding reactions of HOCl. p-Cresol reacts 2'000-20'000
times faster with HOI than with HOCl (k/1001 = 0.14 M~V; k,1,0C1 =
30'000 M 's"7 Gallard, 1999). The difference between HOCl and HOI is
smaller for the more electrophilic phenols such as p-cyanophenol (factor
4-60: k/I0CI = 0.025 MV: k,H0C1 = 90 M~V; Gallard. 1999). HOI can
therefore compete with HOCl for the reaction with phenols even if HOCl
is present in high excess relative to HOI.
Formation of CHI, from Phenols. The formation of CHI, was
measured atpH = 7.0 and 9.0 with an initial concentration of 6 pM HOI
and 1 pM phenol or resorcinol. Both compounds resulted in CHI, forma¬
tion but resorcinol yielded much more CHT, (normalized to HOI expo¬
sure) than phenol. For resorcinol, 4 to 7 % of the C atoms were incorpo¬
rated into CHF after 6 h. This corresponds to 0.25 to 0.4 mol CHI, per
mol resorcinol. The HOI consumption of both compounds occurred
mainly in the first 2 h and amounted to 2 mol FIOI per mol phenol and 5
mol HOI per mol resorcinol.
To be able to compare the results of the model solutions with natural
waters (see below), the CHI, yield q with respect to the exposure to HOI
(J|HOT]dt) and the initial DOC concentration (in mol/L C) was calculated
according to eq. 5.6. This yield is a measure for the concentration of
CHI, which was formed as a result of a certain HOI exposure on a certain
DOC concentration during the time t.
\CWl{\ iCFFh]q = .t—Lt-7-L—7 or — = 9 ) fH()Ildt (5-6)
J[HOI]dt[DOC] fDOCl
Figure 5.3 shows a representation of the experimental data expressed in
terms of eq. 5.6 where [CHF]/[DOC] is the iodoform formation normal¬
ized to carbon, q can be read as the slope ot a linear fit of the data. For
Page 110
u Q0.04
L
X
lakewater,pH
8
q=024M-]s~1
riverwater,pH
8;
qfÇQXBSM-V1
0.002
0.004
J[HO
I]dt
/Ms
CH3COCHO,pH9
D
CH3COClEvpH9
q=
0.07M~>s~
,u.
,w
,*
ii
CH^COCHO,pH
7;q=0.005
Vf
!s
phenol,pH7;
q^OümjVFV1
£__
__J^
4
0.2
0.3
J[HOI]dt/Ms
0.5
Figu
ie5
3.FormationofCHI3
inmodelandinnaturalwaters(datatransformedac
cord
ingtoeq.
5.6).Modelcompounds*
resoicmol(openci
rcles),acetone
(opensq
uare
s),m
ethy
lgly
oxal
(opendiamonds),andphenol
(opentriangles;
atpH=
7(d
ashe
dline
s)andpH=
9(s
olid
lines).Inset:Naturalwaters;Lake
Zurich.
1mg/LNH2C1
(full
triangles)
and0.5mg/LNH2C1
(fulldiamonds);Seine
rive
r,0.5mg/LNH2C1
(fullsq
uare
s):pH=
8
-J
Page 111
98
phenol (triangles), this value is lower than 0.002 M"!s 'at pH = 7. At pH =
9, no CHI, formation could be detected. For resorcinol (circles), it
reaches a maximum value of 1.1 M"V during the first 6 h (j[H01]dt <
0.05 Ms). This steep increase corresponds to a CHI, formation of e.g. 15
nM/h or 6 pg/E/h in a solution of 10 pg/L HOI and 1 mg/L resorcinol.
Consumption of HOI by a-Methyl Carbonyl Compounds.
Fhe consumption of HOI by a-methyl carbonyl compounds was investi¬
gated m batch reactors under pseudo-first-order conditions. Since 1822,
the reaction of iodine with these compounds is known as the 'iodoform
reaction' (Fuson & Bull, 1934). A reaction scheme for this is presented in
eq. 5.7:
9 °tR FIOI Û2 HOI (,]
/\ enolization >^v ^^/\
—- /\ ^-7^
R CH3 ^-^ R CH2 H2Ö R CH21 R OH
carbonyl enol iodocarbonylcompound compound + CHI3
According to eq. 5.7, HOI does not react directly with the carbonyl com¬
pound but only with the enol. The formation ot the enol (enolization) can
be catalyzed by several species: H+, H20, and OH". The halogenation of an
a-methyl carbonyl compound proceeds three times until the methyl group
is transformed into a triiodomethyl group. The triiodocarbonyl com¬
pound then hvdrolvzes with the formation of CHI, and the corresponding
acid (RCOOH)
For the lodination reaction, either the enolization or the addition of
HOI to the enol are rate-determining. If the enolization is rate-determin¬
ing, the overall reaction rate depends only on the carbonyl compound
concentration and the pH, but not on [HOI] and the rate law becomes
zero-order in HOI (eq. 5.8). In this case, the HOI concentration decreases
linearly with time. This can be seen in Fig. 5.4 (squares) which shows
Page 112
99
two possibilities for the HOI decrease by reaction with acetone. The other
case (circles) will be discussed below. It was demonstrated previously that
under certain conditions the enolization is the rate-determining step of the
halogenation of carbonyl compounds because the rate constants of iodina-
tion and bromination reactions were equal. This shows that the halogen
does not participate in the rate-determining step under the used conditions
(Dubois & Toullec, 1971).
pH=7.9
Figure 5.4: Decrease of HOI through reaction with acetone. Squares: pH
- 7.9, 50 mM acetone. [HOIRt = 0) = 3.9 pM; Circles: pH =
1 1.3. 2 mM acetone, [HOI](t = 0) = 2.2 pM; Lines are least-
squares fits.
At the pFl values investigated in this study, OH" and LLO are the main
catalvsts for the enolization.
— = FHo0lketonej + k [OH Hketone] (5.8^
Page 113
100
Experimental results for the reaction of HOI with acetaldehyde, pina-
coione, and acetone (at pH < 8.3) could be modeled with eq. 5.8. Acetate
(R = O") was also investigated but no reaction could be detected. The cal¬
culated rate constants are presented in Table 5.2. In Fig. 5.5, the experi¬
mental data (symbols) is shown together with the fitted pFl-dependence of
the observed first-order rate constant (lines). Acetaldehyde is the most
reactive of these compounds, pinacolone the least reactive. The electron-
withdrawing character of R determines the rate of reaction.
The observed rate constants for the experiments HOI + phenols and
a-methyl carbonyl compounds are presented in the Appendix C.
pHc6 7 8 9
10-5
10-6
</)
10-8
Figure 5.5. Observed first-order rate constants for the iodination of
three a-methyl carbonyl compounds. Symbols are experi¬
mental data, lines are fits according to eq. 5.8.
acetaldehyde(CH^CHO)
pinacolone
(CH3COC(CH3h)
Page 114
Table
5.2Rate
Constants
fortheReaction
ofa-Methyl
CarbonylCompounds
withHOI
compound
CH£OR
RpH
range
mM
[com
p.]
/[HOI](t=0)
na
observedrateconstants
buffer
mM
/pM
Acetaldehyde
H6.8-8.6
F2
0.3-10
2.2-2.9
Pinacolone
Acetate
Acetone
Acetone
Fbu
tyl
4.8-8.9
F2
1-100
2-4
10
klho
=9±lxï(ïssl
k=0.90±0.04MV
14
kH?0=
4±2xl0~9
s"1
k=0.037±0.002M
's
'
OH
O^
8.3-9.9
1100-1000
2.0-2.3
5kf
l7()
<2x10
'7s
k<3x10"M
's
OF
6.0-8.3
131-64
i7-5.5
A,-
i
CR
9.1-11.6
0-1
2.0-8.4
1.3-3.8
Methylgi
yoxal
CHO
3.9-9,1
F2
0.03-2
0.9-4.5
9kH;0=
1.3±0.4xl()ös
k_
=0.25±0.03M
V1
ÜH
9k6=2.5±1.0MV
k7=3±lxlO,MV
19
k,=6±2x
10~
M-'V';a=
0.4±0.1
a:n=numberofkineticex
periments([HOI]
vs.
t)
Page 115
102
From the ratio of k :kH9o> lt can De calculated that at pH = 7,
H20 and OH have the same catalytic effect on the iodination of the three
compounds acetaldehyde, pinacolone. and acetone. At higher pH values,
OH" is dominant. At lower pH values, H,0 is responsible for the major
part of the catalysis which means that the observed rate constant does not
depend on the pH. At even lower pH values, H+ influences the reaction
rate. However, this pH range was not investigated in the present study.
In the literature, a value of 0.52 M V (k^TT_) is given for the try-OH
droxide-catalyzed enolization of acetone (Bell & Longuet-Higgins, 1946).
This compares quite well with our findings (k = 0.25 M 's ').
When the pH increases, the rate of the iodination increases because
of enhanced OH catalysis. At a certain pH however, the enolization be¬
comes fast enough to be comparable to the addition of HOI to the enol. In
this case, both the enolization and the addition of HOI influence the over¬
all reaction rate. At even higher pH. the addition of HOI to the enol be¬
comes the rate-determmuig step and the reaction rate is first-order in
HOI. hi this case, the keto-enol equilibrium can be kmetically treated as a
fast pre-equilibrium. This has been observed for acetone at pH > 9.1.
Figure 5.4 shows an example for the iodination of acetone at pH = 11.3
where the first-order kinetics in HOI result in an exponential [FIOI] de¬
crease. From the dependence of the observed second-order rate constant
of HOI + acetone on the pH (9.1 < pH < I F6). it can be concluded that
two reactions significantly contribute to the overall decrease of HOI, HOI
+ enol and 01+ enolate (eq. 5.9).
dFHOI] .
rxj_Tn. 4 , , „M_Ir^TT_I1 n /cm
---L-j-—i=
k6[HOI]lacetone]+ k7LOI |[OH ][acetone! (5.9)
Page 116
103
Inclusion of either of the two reactions HOI + enolate or 01 + enol did
not reflect the pH-dependence of the observed second-order rate constant
correctly.
The pFl ranges for the two kinetic regimes which are given in this
study are not absolute. They depend on the ratio of [acetone] to [HOI]. At
high ratios [acetone]:[HOI], the HOI addition is more likely the rate-
determining step whereas at low (acetone]:[HOI] ratios, the enolization
tends to be rate-determining.
The kinetics of the reaction of HOI with methylglyoxal were also in¬
vestigated. However, the results could not be fitted with either of the two
equations 5.8 or 5.9. The reaction was first-order in HOI and in methyl¬
glyoxal. The observed rate constant increased by a factor of a = 0.4±0.l
when increasing the pH by one unit. The data was therefore fitted by
equation 5.10:
-^8lHOIllraethylglyoxal|lOH-r (5,0)
Formation of CHI3 from a-Methyl Carbonyl Compounds,
fhe formation of CHI, was measured at pFl = 7 and 9 with initial con¬
centrations of 6 pM HOI and 1 pM acetone or methylglyoxal. At pH = 7,
acetone yielded no CHI, and methylglyoxal resulted in a small CHI, for¬
mation. At pH = 9. higher CHI, concentrations were found. In Fig. 5.3,
the experimental data is plotted according to eq. 5.6. At pH = 9, the CHI,
formation yield q is m the range of 0.05 to 0.1 M !s for both acetone
(squares) and methylglyoxal (diamonds). At pH = 7. q is below 0.001 Ml
[s '
for acetone and about 0.005 M~'s 'for methylglyoxal. For acetone.
CHI, formation is about 25 % of the value which was expected from the
rate constant for HOI consumption. This difference could be due to a re¬
tardation of the overall reaction by the final hydrolysis ot tniodoacetone.
For methylglyoxal. the comparison between the rates of HOI consumption
Page 117
104
and CHI, formation is not possible. HOI consumption was first-order m
HOI whereas the formation of CHI, was zero-order in HOI. Therefore,
the rate-determining step which leads to CHI, is different from the step in
which HOI is consumed. The results of both acetone and methylglyoxal
give an indication that the hydrolysis is the rate-determining step in CHI,
formation.
Another experiment for the iodination ol acetone was performed at
pH = 9 in excess of acetone (1-1000 pM) over HOI (J pM). Under these
conditions, the initial HOI addition reacted according to a second-order
behavior with a rate constant of 1 M 's '. This experiment was performed
to get information about the ratio of the rate constants of the first, sec¬
ond, and third iodination step as well as the hydrolysis of triiodoacetone.
In general, carbon double bonds are more stable when they have more
substituents. The additional iodine-atom in iodoacetone would therefore
increase the stability of the enol of iodoacetone when compared to acetone
and acceferate the second iodination step. Our experimental results sup¬
port this reasoning. After 16 h reaction. CHI, was found even if acetone
was in a 1000-fold excess over HOI (see Fig. 5.6, circles). The highest
CHI, concentration (0.2 pM) was found for a 30-fold excess of acetone.
Fhe observed product pattern was also obtained by modeling the rate con¬
stant for the second iodination step. The calculated CHI, formation for
three values of this rate constant is shown in Fig. 5.6 (lines). Best fit re¬
sulted when assuming a rate constant of 30 M"7s'for the second iodina¬
tion step what is 30 times faster than the first lodmation step. The third
iodination step required a second-order rate constant of at least JO1 M 's '.
The hydrolysis ol triiodoacetone was at least 10l
s'to explain our re¬
sults. Such a rate constant can e.g. be found for the hydrolysis of an ester
such as CFI COOCH=CH, (Mabey & Mill, 1978).
Page 118
105
0.2
a 0.15il
S 0.1
CO
g 0.05 t ',
-"Yv kHOI+iodoacetone = 50 M"1 s
\
kHOï+iodoacetone = 30 M~ ls~
\
lc-1
101 102
[acetone ]/[HOI]
03
Figure 5.6: Formation of CHI, (circles) from acetone and HOI (1 pM) at
pH = 9. Lines: Model with varying rate constants for the re¬
action HOI + iodoacetone.
Consumption of HOI by Other Model Compounds. Besides
phenols and carbonyl compounds, other organic model compounds (allyl
alcohol, glucosamine, glycine, toluene, and oxalate) were tested for their
reactivity toward HOI. Only allyl alcohol and glucosamine showed a
measurable reactivity (Table 5.3). For the other compounds, the maxi¬
mum observed second-order rate constants are given.
The observed rate constant for the reaction of HOI with allyl alco¬
hol, an alkene. increased by a factor of 10 when the pH was decreased by
one unit. This behavior was explained by assuming that H2OF was the re¬
active iodine species although it was a minor species in the experiments
(pH = 6.2 - 8.2). The rate constant kQ for the reaction H:OF + allyl alco¬
hol was calculated to be 1.8 x 10 M 's '
(Table 5.3). The half-life for HOI
at pFl = 7 and a concentration of 1 mg/L of allyl alcohol is about 6 h.
Page 119
Table
5.3Rate
Constants
for
theReaction
ofModelCompounds
withHOI
compound
PK3
pFl
range
mM
butler
mM
[HOi]rt=0)/
pM
n1-
observedrateconstant«;
Allylalcohol
6.2-8.2
0.5-1
0.25-10
1.5-4.0
11
k9=L8±04xlfFM~,sl
Glucosamine
7.58"
5.5-9.2
13-50
1.8-2.5
11
k10=0.27±0.07M
's
'
kn=7±3xi03MV
Glycine
9.78h
6.1-9.0
0-1
2-1000
06-2
510
kuU<0
IM7'
Oxalate
1.25
,4.27b
6.0-8.1
110-200
1.722
7ko
K<0
iM
7'
Toluene
4.1-7.3
12-4
1.0
29
5ko
bs<
1M
's
'
a:
thi<
work:
b:Dean,
1985:
c:n=number
of
kineticexperiments([HOI]
vs
i)
Page 120
107
The observed second-order rate constant for the reaction of HOI
with glucosamine increased by a factor 10 per pH-unit at pH < 7.5. At pH
> 8.5, the rate constant did not depend on the pH any more. This pH-
dependence corresponds to the speciation of glucosamine which changes
at these pH values (pK\ = 7.58). Therefore, glucosamine and protonated
glucosamine both reacted with HOI. k10 in Table 5.3 is the rate constant
tor the reaction FIOI + glucosamine and k,, is the rate constant for the re¬
action HOI + protonated glucosamine.
5.3.2 Consumption of HOI and Formation of THMs and ÏO,"
During Disinfection of Natural Waters
Fhe kinetics of the consumption of HOI and of the formation of iodine-
containmg disinfection by-products (IO,, FTHMs) was measured during
the first 24 h of the oxidation of two natural waters (Lake Zurich. Swit¬
zerland and Seine river, France) spiked with I. The waters were treated
under varying conditions: the standard experiment was performed at pH
= 8.0, 0.5 mg/L CF, and 400 nM T (50 pg/L). Additional experiments
were performed m which one of these parameters was changed. Either
was the pFl reduced to 6.2, or the chlorine dose was increased to 1 mg/L
CF, or the I concentration was reduced to 80 nM (10 pg/L), or O, or
chloramine were used instead of chlorine.
Figure 5.7 shows the evolution of 10,. CHI,, total I in I-THMs, and
other organic 1 together with the decrease of FIOI and chlorine in the
standard experiment m lake water. For the calculation of the parameter 1
in THMs, the concentrations of the single FTHMs are multiplied with the
number of iodine atoms they contain. The concentration of other organic
I was calculated as the difference of the total iodine (50 pg/L. 400 nMï
and the sum of HOI, IO, and the T m THMs. HOI decreased very quickly.
More than 90 % had disappeared after 30 min. After I h. the 10, con-
Page 121
108
centration had reached the half of its final value. For the I in the THMs
and for CHI,, this time was longer (2 h). The comparison of the devel¬
opment of the concentrations of I in THMs and organic I which is not in
THMs shows that the sum of them remains constant during the whole ex¬
periment. This shows that the reaction of HOI with the NOM is finished
after a short time. After the fast initial iodination however, the I-TFTMs
and especially CHI, are not released immediately. As speculated above
(CFTI, formation from acetone), the hydrolysis of the trihalomethyl group
could be a slower, rate-determinins process in I-THM formation. The
formation of iodine-containing disinfection by-products is finished after
100 x
CH13
lin THMs
ora-not in THMs
io3-
Cl2 / pg/L
10 15
t/h
20
-a
z?
Figure 5.7: Consumption of HOI and chlorine together with the forma¬
tion of TO,, CHF, the sum of I in I-THMs, and l01g in a lake
water (400 nM I (50 pg/L), 15 pg/L Br, 1.3 mg/L DOC,
0.5 mg/L CF, pH = 8.0).
Page 122
109
10 h. After that time, approximately a third of the initial iodine yielded
10,7 Another third was incorporated into THMs and another third into
NOM but not into THMs. This distribution depends strongly on the oxi¬
dation conditions.
Figure 5.8 shows the final concentrations (24 h after the oxidant ad¬
dition) of IO,", CHF, the total iodine which was incorporated into THMs.
the total concentrations of the six I-THMs, and the total concentrations of
the four classical THMs. In the following, the results presented in Fig. 5.8
will be discussed together with results of some additional experiments:
Product distribution: IO7, I-THMs, and Other Iodoorganic
Compounds. Both 10, and I-THMs were formed in all experiments
with exception of the ozonation (Fig. 5.8, exp. E; no I-THMs). The high¬
est IO, concentrations were found in the ozonation (exp. E) and in a
chlorination (exp. B) where 90 % and 75 %, respectively of the F were
transformed to 10,". IO," formation increased with the chlorine dose (see
exp. A vs. B or F vs. G). The lowest TO," concentrations were found in
chloramination experiments (exp. C, D, H) where IO, formation ac¬
counted for less than 3 % of the total iodine.
The highest CHI, formation (16 nM CHI,) was observed when using
chloramine (exp. C). 47 nM I or 12 c/c of the initial I" (400 nM) were in¬
corporated into CHI,. CFIF, CHC1F. CHCF1, and CHBrClI were found in
several experiments but CHBr?l or CHBrF were never detected. The Br
concentration in the investigated waters was too low to lead to a signifi¬
cant incorporation of bromine into the THMs. CHBrClI was the only
bromine-containing I-THM which was detected with a maximum concen¬
tration of 24 11M in the chlorinated river water (exp. G).
The sum of 10," and I-THMs accounted tor 20 to 90 % of the total
iodine In the water. Since HOI had always disappeared after 24 h, iodine
which is not found m the 1-THMs or as IO, was present as iodoorganic
Page 123
c o 0)
(—1
o o
350t
300
250
200
J- i i
150
-
100
50 0
oxidantdose
/mg/L
oxidant
2
A 0.5
34
,2
4
B 1.0
CF
C 0.5
12
Ml
4
<3
23£_
R2
D 1.0
NH2C1
E 1.0
03
lakewater
4
5
F 0.5
4
1m
IO3-
2m
CHI3
3S
IinTHMs
4E=3ITHMs
5classicalTHMs
G 1.0
CF
12
5 n
H 0.5
NH9CI
riverwater
Figure
5.8:
Formationofdisinfectionby-productsintheoxidationofnaturalwaters(2
4h
afteradditionofthe
oxidant).pH=
8.0,
T=400nM
(50pg
/L).
The
concentrationsofthe
classicalTHMs
werenot
measuredintheexperimentsB-E.
Page 124
Ill
compounds other than I-THMs. Low amounts of these compounds (< 30
% of total iodine) were formed during ozonation and chlorination at high
dose (exp. B, E, G). Higher concentrations (> 60 % of total iodine) were
found in the chloramination experiments (exp. C, D, H). This effect can
be explained by the fact that HOI is the only halogenatiiig agent in a
chloramine-based oxidation. Since the NOM is m excess over HOI, many
THM-precursor sites are not fully halogenated in the chloramination.
Only in the presence of chlorine can the halogenation of the THM-precur¬
sor sites be completed and I-THMs released.
Chloramine vs. Free Chlorine. The smaller chemical reactivity
of chloramine compared to chlorine leads to two general differences in
the formation of iodme-containing disinfection by-products. Firstly,
chloramine is not capable to oxidize HOI to IO," whereas this reaction is
significant for chlorine (chapter 4). This explains the higher 10, forma¬
tion in chlorinations compared to chloraminations (Fig. 5.8). Hence, FTOI
has a higher life-time in chloramination processes which leads to an in¬
creased reaction time with NOM. Secondly, the competition between
chlorine and iodine for the incorporation into the THMs is much higher
in the presence of chlorine than in the presence of chloramine because of
the higher reactivity of HOCl compared to NH2C1. This shifts the product
distribution from CHI, in chloraminations to the mixed FTHMs in
chlorinations. Chloramination resulted in 16 nM CHI, and 34 nM mixed
I-THMs (exp. C). Finder the same conditions, chlorine induced the for¬
mation of 3 nM CHI, and 119 nM mixed FTHMs texp. A).
Chlorine Concentration. In the chlorinations at 0.5 mg/L, 4 %
(exp. F) and 26 % (exp. A) of the iodine were transformed to TO,, A
higher chlorine dose resulted in higher 10, production. In the chlorina¬
tions at I mg/L, 43 % (exp. G) and 75 % (exp. B) of the total iodine were
found as 10,. A lower 10, yield was found m the water with the higher
Page 125
112
DOC (river water). Because of the lower chlorine stability, less HOI can
be oxidized to IO,. In addition, the reaction of HOI with the NOM is
more important in the river water than in the lake water. The distribution
among the FTHMs was also affected by the chlorine dose. In the river
water, 8 nM CHI, and 54 nM mixed FTHMs were detected for 0.5 mg/L
CF (exp. F). At a chlorine dose of 1 mg/L. [CHI,J decreased to 1 nM and
the mixed I-THMs increased to 107 nM (exp. G). In the lake water,
chlorination with 0.5 mg/L resulted in 3 nM CHI, and 119 nM mixed I-
THMs (exp. A) whereas no CFII, but 46 nM mixed I-THMs were formed
for 1 mg/L of chlorine (exp. B). For the prevention of medicinal taste
and odor caused by CHI,, an increased chlorine dose can be a reasonable
solution. A drawback of that is the enhanced formation of the classical
THMs. The increase of the chlorine dose from 0.5 to 1 mg/L led to an in¬
crease in the classical THMs from 45 nM (5.8 pg/L) to 213 nM (29 pg/L)
in the river water (exp. F, G).
pH Dependence. A possibility to prevent the formation of both
classical and I-THMs is to decrease the pH. At pH = 6.2, CHI, formation
decreased by 75 - 85 % compared to pH = 8.0 and CHCl, formation de¬
creased by 30 - 40 % for the same chlorine dose and stability (data not
shown). In Fig. 5.3, the same effect can be observed for resorcinol,
methylglyoxal, and acetone. This could be due to a pH-dependent distri¬
bution of halogenated organic products. Reckhow & Singer (1984) show
that for increasing pH (5 < pH < 11), CHCl, tormation Increased but
formation of trichloroacetic acid decreased. This behavior was explained
by a competition of two reactions of the trichlorocarbonyl intermediate.
At low pH. oxygenation of the carbonyl group by HOCl and the resulting
formation of trichloroacetic acid is favored whereas at high pH, hydroly¬
sis by OFT leads to CHCF,
Page 126
113
I" Concentration. All the reported cases of CHI, formation in a
drinking water occurred at initial F concentrations > 50 pg/L. Therefore,
we used a concentration of 50 pg/L I" for most of our experiments. How¬
ever, such high I concentrations are an exception in natural waters. Usu¬
ally, they lie below 10 pg/L (Fuge & Johnson, 1986). To assess the sig¬
nificance of CHI, formation during chlorination at lower 1" concentra¬
tions, experiments with 10 pg/L T (80 nM) were conducted both in the
river and in the lake water (pH = 8.0. 0.5 mg/L Cl2). Mixed I-THMs, but
no CHI, could be detected tinder these conditions. At low T concentra¬
tions, the competition between HOI and FIOC1 for the NOM sites favors
HOCl. However, CFIC1T was found at concentrations of up to 26 nM what
accounts for 33 % of the total iodine. The percentage of total iodine
which is incorporated into THMs or present as IO," does not depend on
fhe initial T concentration. In contrast, the distribution of FTHMs is
shifted from highly iodinated THMs such as CHI, for high [I] to less io¬
dinated THMs such as CHCFI for low [Ï).
Ozonation. IO," was the only detected iodine-containing by-product
in the ozonation experiment (exp. E). However, not all the F was trans¬
formed to IO," despite of the fast oxidation of HOI by O, (iul < 4 s)
(chapter 4). Organic compounds which are highly reactive toward HOI
successfully competed with O,. Such competitors could be phenolic com¬
pounds which have a higher apparent rate constant with HOI than O,. To
test this hypothesis, we selected p-methoxyphenol at pH = 6.3 (O, + HOI:
3.6 x JO4 M"7, p-methoxyphenol + HOI: 7.6 x 10⁴ M"'s !). To compete
with O, which is in excess over the NOM, such a compound has to be pre¬
sent at quite high concentrations. If the p-methoxyphenol concentration is
7 times lower than |0,|, it can react with 25 % of the HOI and therefore
leduce îhe 10, formation to 75 °k of the initial [F], This was confirmed
experimentally (20 pM (F, 3 pM p-methoxyphenol, 0.4 pM I, pH = 6.3).
Only 85 % of the initial 1" was found as TO, under these conditions.
Page 127
114
Incorporation of Iodine and Chlorine into THMs. Because of
the big differences in initial concentrations between HOI (0.4 pM) and
HOCl (7 pM) in chlorination processes, it is necessary that iodine reacts
much faster with THM-precursors than chlorine to lead to I-THM forma¬
tion. As shown above, the reaction of HOI with phenols can be 4 to
20"000 times faster than the corresponding reaction of HOCl. This differ¬
ence in reactivity led to similar incorporation of iodine and chlorine into
THMs in the river water. In this experiment, /[HOClldt was about 15
times higher than J[HOF|dt. HOI therefore reacted about 15 times faster
than HOCl with the THM-precursor groups in the river water.
Apparent Rate Constant HOI + NOM. In the experiments with
chloramine as the oxidant, only the NOM reacted with HOI. The absence
of the oxidation of HOI by the oxidant allowed the quantification of the
kinetics of the reaction of HOI with the NOM. HOI consumption occurred
in two phases: an initial, fast (t < 5 min) followed by a second slower
process.
After 5 min, only 17 - 34 % of the initial F could be found as HOI in
the exp. C, D, and H. However, the I oxidation by chloramine was not
complete after 5 min (k,_+NH2C1 = 240 M"V; Kumar et al., 1986). At this
point of the reaction, only 40 % (exp. C and H) and 64 % (exp. D) of F
had been oxidized to HOT. Taking into account the incomplete HOI for¬
mation, the rate constants for HOI + NOM (on a C-atom base) in this ini¬
tial phase were determined as 10 - 90 M 's '
or 0.7 x 10"5 - 6 x 10°
s'
by
kinetic modeling. By comparison of these rate constants with the rate con¬
stants of HOI with model compounds at pH = 8 (phenols: 3 x 101 - 6 x 10s
M 7s"1, methylglyoxal: 0.8 MV, glucosamine 0.2 M"'s \ allyl alcohol:
0.04 M"'s"'. a-methyl carbonyl compounds: 6 x 10"'} - 5 x 10"7 s"1 on a C-
atom base), the observed rate constants in natural waters can only be
Page 128
115
explained by the presence of phenolic entities in the NOM but not by
other compounds.
In a second phase of the reaction (t > 5 min), HOI consumption was
much slower. Since the decrease of HOI was first-order, it was possible to
fit a rate constant for the reaction of HOI with the NOM. The value of
this rate constant was 3x10" Lmg 's'm the lake water and 10
"
Lmg"'s'
in the river water. The corresponding half-life of HOI was about 5 h for
both waters. On a C-atom base, the rate constants amount to 0.4 and 0.1
M's"'. These values describe the reaction of HOI with NOM, which leads
to iodoorganic compounds such as FTHMs (eq. 5.11).
HOI + NOM, = T-NOM (5.11)
HOI + NOM, = I + NOM2ox (5.12)
According to cq. 5.12, HOI can also be reduced to 1" by NOM,. However,
this reaction has no influence on the kinetics of the HOI decrease since the
formed 1 is quickly reoxidized to HOI by chloramine. The kinetic con¬
stants for the reaction of HOI with NOM can again be compared with ap¬
parent second-order rate constants of model compounds mentioned above.
If the NOM was composed of 12-50 9c of methylglyoxal, the observed
reaction in the natural water could be explained with this compound.
Since this percentage is very high, it is quite unlikely that carbonyl com¬
pounds contribute significantly to the HOI consumption and the resulting
I-THM formation in these waters. Here again, phenolic entities as part of
the NOM could account for the experimental results.
Yield of CHI, Formation. CHI, formation yield q according to
eq. 5.6 was also calculated for the natural waters (see inset Fig. 5.3).
Only the experiments with chloramine were taken into consideration
where CHI, formation was less competed by the formation of mixed I-
ITFMs. In the lake water, q reached a value ot > 0.12 M 's 'for 0.5 mg/L
Page 129
116
NH2C1 (diamonds in inset Fig. 5.3) and > 0.24 M 's 'for 1.0 mg/L NH2C1
(triangles in inset Fig. 5.3). Since the fast initial phase of the CHI, forma¬
tion (< 2 h) was not recorded in these experiments, q values can in reality
be even higher than that. However, they are higher than what has been
achieved with the model carbonyl compounds or with phenol. Only re¬
sorcinol yielded enough CHF to account tor the results from the lake
water. In the river water (squares in inset Fig. 5.3), q was 0.002 to 0.035
M 's '. The highest values were found at the beginning of the experiment.
The observed q values can principally be explained by methylglyoxal or
acetone, but only if they account for more than 35 % of the NOM. Since
this percentage is quite high, it is more likely that the phenolic groups in
the NOM account for the observed CHI, formation in the river water.
Conclusions. The experiments in natural waters show that the for¬
mation of I-THMs and especially CHI, is highly influenced by the disin¬
fectant. Whereas no I-THMs could be detected in the ozonation experi¬
ment, chlorine and chloramine induced the formation of these com¬
pounds. The main competition reaction to the formation of T-THMs is the
formation of 10,. This reaction is important in ozonation processes and
in chlorination processes at high doses. Chloraminc did not result hi IO,
formation. Since this competition reaction did not take place in chlorami¬
nation processes, CHI, formation occurred in significant amounts. In the
presence of chlorine, the incorporation of chlorine into THMs which re¬
sulted in formation of mixed FTHMs such as CHCFI was another compe¬
tition reaction to the formation of CHI,.
The kinetics of HOI consumption in naturals waters both in the ini¬
tial fast phase and in the second, slower phase can be explained by phenols
but not by carbonyl compounds. The comparison of the CFI1, formation
yields for natural and model waters further supports the hypothesis that
carbonyl compounds do not play a key role in CHF formation in
Page 130
117
oxidative drinking water treatment. Among the compounds which were
investigated in this study, only phenolic entities can explain both the ob¬
served consumption of HOI and the formation of CHI, in natural waters.
5.3.3 Oxidation Kinetics of 1-THMs by 0_, and OH*
The rate constants ot the reactions of FTHMs with molecular O, and OH-
radicals were determined. With these rate constants, it can be estimated to
what extent these compounds are removed in an ozonation or advanced
oxidation process.
To determine the rate constants of the reaction of O, with the
F FHMs. 73 pM (3.5 mg/L) O, was added to an acidic solution (pH = 3,
1.2 mM H,P04, 70 mM tert-butanol) of all six FTHMs (10 pg/L). tert.-
Butanol is a scavenger for OH-radicals and prevents the radical-induced
decay of O,. After 2 h, no degradation of the I-THMs could be observed.
The second-order rate constants of O, with the FTHMs were calculated as
< 2 M~'s '
(Table 5.4).
To determine the rate constants of the reaction of OH-radicals with
the I-THMs, 10 - 80 pM (0.5 - 4.0 mg/L) of O, were added to a basic (pH
= 11) solution of 10 pg/L of the I-THMs. Under these conditions, O, was
quickly transformed to OH-radicals. The initial step in this transforma¬
tion is the reaction of OH with O, which leads to the formation of 02 and
FIO,. This reacts with another O, to H02/02 and O,. 0~ reacts with O,
and yields O. and 0,. After protonation, O, decays to OH-radicals and
02. These reactions are described in more details by Hoignc (1998). The
decrease of I-THMs in the experiment was measured relative to p-
chlorobenzoic acid (pCBA) which does not react with molecular O, but
with OH-radicals. The rate constant for the reaction of OH-radicals with
pCBA is 5.0±0.8 x I0l) M 's '(Neta & Dorfman, 1968). The rate constants
for the I-THMs could be determined by decrease relative to pCBA. All
Page 131
118
six I-THMs reacted with approximately the same rate constant (see Table
5.4). Therefore, the degradation of I-THMs during ozonation processes
will be dominated by OH*.
Table 5.4 Rate Constants for the Reactions of I-THMs with
k03 /M-ls-[ k^IT. /M lsOtt
CHI <2 7±2 x J 09
CHCIF <: 8±2x IO9
CHBrF <2 7±1 X IO9
CHCFI <2 8±2x IO9
CHBr2I <2 7±lx IO9
CHBrClI <2 7±2 x IO9
5.3.4 Stability of CHI, in Model and Natural Waters
Hydrolysis of the carbon-iodine bond is a process which can possibly lead
to a removal of halogenated compounds. The half-life of CHI, in distilled
watei (pH = 6-9. I mM phosphate) in ambered bottles was found to be
higher than 100 d. In a natural water (Lake Zurich, pH = 8.2, 1.3 mg/L
DOC), a CHI, half-life of 21 d was found. The difference could possibly
be due to biological processes. In the literature, the half-life of CHJ has
been reported to be 113 d in distilled water and in sea water what com¬
pares well with our result in distilled water (Elliott & Rowland, 1995).
Hydrolysis occurs in the range of months and is therefore not a signifi¬
cant pathway toi the remoxal ot CHI, at drmkmg-watei relevant time
scales.
Page 132
119
References
Alexander, N.M. (1984). Iodine, in "Biochemistry of the Essential Ultratrace Elements*',
Ed.: E. Frieden. Plenum Press, New York; 33-53.
Amoore, J.E. (1986). The chemistry and physiology of odor sensitivity. Journal of the
American Water Works Association, 78(3): 70-76.
Andersen, F.A. (1995). Final report on the safety assessment of sodium iodate. Journal
of the American College of Toxicology, 14(3): 23F239.
Anselme, C, J.P. Duguet, and J. Mallevialle (1989). Treatment of earthy-musty tastes
and odors hx ozone, hydrogen peroxide, and GAC filtration. Proceedings of
AWWA Seminar on Identification and Treatment of Taste and Odor Compounds:
Los Angeles. California; 49-62.
Atwater, J.E., R.L. Sauer, and FR. Schult/ (1996). Numerical simulation of iodine spe¬
ciation in relation to water disinjection aboard manned spacecraft I. Equilibria.
Journal of Environmental Science and Health, A31(8): 1965-1979.
Awtrey, A.D. and R.E. Connick (1951). The absorption spectra of F, If, T, lOf, S4Orf ,
and S^Of. Heat ofthe reaction If = I2 + T. Journal of the American Chemical So¬
ciety. 73: 1842-1843.
Bablon, G., W,D. Bellamy, M.M. Bourbigot, F.B. Daniel, M, Doré, F. Erb, G. Gor¬
don, B. Fanglais, A. Laplanche, B. Legube, G. Martin, W..T. Masschelein, G.
Pacey, D.A. Reckhow, and C. Ventresque ( i 991). Fundamental aspects, in "'Ozone
in Water Treatment - Application and Engineering", Eds.: B. Fanglais, D.A. Reck-
how, and D.R. Brink; Lewis Publishers, Chelsea, Michigan; i F132.
Bader, H. and F Hoigné (1981). Determination of ozone m water by the indigo method.
Water Research. 15: 449-456.
Bartels, J.II.M., G.A. Burlingame, and l.H. Suffet (1986). Flavor profile analysis: taste
and odoi control of the future, journal of the American Water Works Association,
78(3). 50-55
Barton. A.F.M. and G.A. Wright (1968). Kinetics of the iodate-iodide reaction: catalysis
by carboxylate andphosphate ions. Journal of the Chemical Societv A, 2096-2103.
Bell, R.P. and H.C. Longuet-Higgms (1946). Kinetic; of the halogenation of acetone in
alkaline solutions. Journal of the Chemical Society, 636-638
Page 133
120
Bell, R.P. andE. Gelles (1951). The halogen cations in aqueous solution. Journal of the
Chemical Society, 2734-2740.
Bellar. T.A.. J.J. Lichtenberg, and R.C. Kroner (1974). The occurrence of organo-
halides m chlorinated chinking waters. Journal of the American Waterworks Asso¬
ciation. 66( 12): 703-706.
Black. A.P., W.C. Thomas Jr., R.N. Kinman. W.P. Bonner, M.A. Keirn, J.J. Smith
Jr., and A.A. Jabero (1968). Iodine for the disinfection of water. Journal of the
American Water Works Association. 60( J ): 69-83.
Brass, H.J., M.A. Feige, T. Halloran, J.W. Mello, and D. Munch (1977). The national
organic monitoring survey: samplings and analyses for purgeable organic com¬
pounds, in "Drinking Water Quality Enhancement through Source Protection", Ed.:
R.B. Poiasck; Ann Arbor Science Publishers. Ann Arbor, Michigan.
Bruchet, A., K. N'Guyen, J. M aHevi alle, and (7 Anselme (1989). Identification and be¬
haviour of iodinated halofarm medicinal odor. Proceedings of AWWA Seminar on
Identification and Treatment of Taste and Odor Compounds; Los Angeles, Califor¬
nia; 125-141.
Bunn, W.W., B.B. Haas, E.R. Deane, and R.D. Kleopfcr (1975). Formation of triha¬
lomethanes bv chlorination of surface water. Environmental Letters, 10(3): 205-
213.
Burger, J.D. and H.A. Liebhafsky (1973). Thermodynamic data for aqueous iodine so¬
lutions at various temperatures. Analytical Chemistry, 45(3): 600-602.
Burlingame, G.A., R.M. Dann, and G.L, Brock (1986). A case study of geosmin in
Philadelphia's water. Journal of the American Water Works Association, 78(3): 56-
6L
Buxton, G.V. and R.M. Sellers (1985). Radiation-induced redox reactions of iodine spe¬
cies in aqueous solution. Journal of the Chemical Society, Faraday Transactions,
81; 449-471.
Campos, M.L.A.M.. P.D. Nightingale, and F.D. Jickells (1996). A comparison of
methyl iodide emissions from seawater and wet depositional fluxes of iodine over
the southern North Sea. Tellus, 48B( 1): 106-114.
Cancho, B., F. Ventura, and M.T. Galceran (1999). Solid-phase microextraction for the
determination of iodinated trihalomethanes m drinking water. Journal of Chroma¬
tography \. 841(2)- 197-206.
Page 134
121
Chang, P.-S., L.-J. Chen, and Y.-C. Wang (1998). The effect of ultraviolet irradiation,
heat, pH, ozone, salinity and chemical disinfectants on the infectiviiy of white spot
syndrome baculovirus. Aquaculture, 166(1-2): L-IT.
Chia. Y. ( 1958). Chemistrx ol +1 iodine m alkaline solutions. Thesis, University of Cali¬
fornia, Bcrkele}.
Cicerone, R.J. (1981). Halogens in the atmosphere. Reviews of Geophysics and Space
Physics, 19(1): 123-139.
Councell, T.B., E.R. Landa, and D.R. Los ley (1997). Microbial reduction of iodate.
Water, Air, and Soil Pollution, 100(1-2): 99-106.
Courtois, B. (1813). Annales de Chimie Plwsique. 1/88: 304.
Dean. J.A., Ed. (1985). Lange's Handbook of Chemistry. 13th ed., McGraw-Hill, New
York.
Delange, F., J.T. Dunn, and D. Glinoer. Lds. (1993). Iodine deficiency in Europe: a
continuing concern. NATO AS! Series. Series A: Life Sciences Vol. 241. Plenum
Press, London
Douillet, P.A. and P.E. Pickering (1999). Seawater treatment for larval culture oj the fish
Sciaenops ocellatus Linnaeus (red drum). Aquaculture, 170(1): 113-126.
Duce. R.A.. J.T. Wasson, J.W. Winchester, and F. Burns ( 1963). Atmospheric iodine,
bromine, and chlorine. Journal ol Geophysical Research, 68( 13): 3943-3947.
Dubois. J.E. and J. Toullec (1971). Reactivity of the enols of saturated aliphatic ketones:
c/uasi-identitv of the rate constants for bromination and iodination. Tetrahedron
Letters, 37 ^373-3376.
Eckhardt, K.. L. Gocke, M.-T. King, and D. Wild (1981). Mutagenic activity of chlo¬
rate, bromate. and iodate. Mutation Research, 97: 185.
Eigen, M. and K. Kustm (1962). The kinetics of halogen hydrolysis. Journal of the
American Chemical Society, 84: 1355-1361.
Elliott. S. and P.S. Rowland (1995). Methyl halide hydrolysis rates in natural waters.
Journal ol Atmospheric Chemistry, 20. 229-236.
Ellis, K.V, and H.B R.J \an Vree ( 1989). Iodine used as a watei -disinfectant in turbid
waters. Water Reseaieh, 23(6): 671-676.
EL (European I moiL ( 1998). Richtlinie 98/SS/FG des Rates. Amtsblatt der
Europäischen Gemeinschaften.
Page 135
1 Ji_rf*W
Fabian, I. and G. Gordon (1997). The kinetics and mechanism of the chlorine dioxide-
iodide ion reaction. Inorganic Chemistry, 36(12): 2494-2497.
Fuge, R. and C.C. Johnson ( 1986). The geochemistry of iodine - a review. Environ¬
mental Geochemistry and Health. 8(2): 31-54.
Fuge, R. (1987). Iodine in the environment: its distribution and relationship to human
health. Trace Substances in Environmental Health, 21: 74-87.
Fuson, R.C. and B.A. Bull (1934). The haloform reaction. Chemical Reviews, 15: 275-
309.
Gallard, H. (1999). Personal communication.
Garland, J.A.. AAV. Elzerman, and S.A. Penkett (1980). The mechanism for drv depo¬
sition of ozone to seawater surfaces. Journal of Geophysical Research, 85(C12):
7488-7492.
Garland, J.A. and H. Curtis (1981). Emission of iodine from the sea surface in the pres¬
ence of ozone. Journal of Geophysical Research. 86(C4): 3183-3186.
Gay Lussac, J.L. (1814). Mémoire sur l'iode. Annales de Chimie Physique. 1/91: 5.
Genser, E.E. and R.E. Connick (1973). Exchange of iodide ion M'ith triiodidc ion studied
by nuclear magnetic resonance. Journal of Chemical Physics, 58: 990-996.
Gerba, C.P., D.C. Johnson, and M.N. Hasan (1997). Efficacy of iodine water purifica¬
tion tablets against Cryptosporidium oocysts and Giardia cysts. Wilderness and En¬
vironmental Medicine, 8: 96-100.
Giese, B., F. Laturnus, F.C. Adams, and C. Wiencke (1999). Release of volatile iodi¬
nated C,-C, hydrocarbons by marine macroalgae from various climate zones. Envi¬
ronmental Science & Technology 33(14): 2432-2439.
Giger, W., M. Reinhard, C. Schaffner, and F. Zürcher (1976). Analyses of organic con¬
stituents in water by high-resolution s>as chromatography in combination with spe¬
cific detection and computer-assisted mass spectrometry, in "Identification &
Analysis of Organic Pollutants m Water". Ed.. L.H. Keith: Ann Arbor Science.
Vtm Arbor, Michigan: 433-452.
Gittelman, T.S. and T.L. Yohe (1989). Treatment of the iodinated haloform medicinal
odors in drmking water. Proceedings of AWWA Seminar on Identification and
Treatment of Taste and Odor Compounds; Los Angeles, California; 105-123.
Page 136
A. jLjD
Gottardi. W. (1983). Iodine and iodine compounds, in "Disinfection, Sterilization, and
Preservation." 3 ed.; Ed.: S.S. Block; Lea & Febiger, Philadelphia, Pennsylva¬
nia; î83-196.
Greenwood, N.N. and A. Earnshaw (1984). Chemistry of the elements. Pcrgamon
Press, Oxford.
Gribble, G.W. (1994). The natural production of chlorinated compounds. Environmental
Science & Technology, 28(7): 3 J OA-319A.
Gschwend, P.M., FK. MacFarlane, and K.A. Newman (1985). Volatile halogenated
organic compounds released to seawater irom temperate marine macroalme. Sci¬
ence, 227- 1035-1035.
Haag, W.R. and F Hoigné (1983). Ozonation of bromide-containing waters: kinetics of
formation of hvpobrornous acut and bromate. Environmental Science & Technol¬
ogy, 17: 261-267.
Han, K.. W.F. Koch, and K.W. Pratt (1987). Improved procedure for the determination
of iodide bv ion chromatography with electrochemical detection. Analytical Chem¬
istry, 59: 7^ 1-736.
Hansson. R.C., M.J. Henderson, P. Jack, and R.D. Taylor (1987). Iodoform taste com¬
plaints in chloramination. Water Research. 21: 1265-1271.
Hetzel, B.S. and G.E. Maberly (1986). Iodine, m "Trace Elements in Human and Animal
Nutrition", Ed.: W. Mertz; Academic Press. London. 139-208.
Hoffmann, P., N. Pilz, K.H. Lieser, V. Ilmsuidter. and M. Griesbach (1987). Radionu¬
clides from the Chernobyl accident in the environment of Chattia, a region of the
FRG. Radiochimica Acta, 41 (4L 173-179,
Hoigne, F. H. Bader. W.R. Haag, and J. Staehelin (1985). Rate constants of reactions
ofozone with organic and inorganic compounds in water III. Inorganic compounds
and radicals. Water Research, 19(8): 993-1004.
Hoigné, J. (1998). Chemistry of aaueous ozone and transformation of pollutants by
ozonation and advanced oxidation processes, m "The Handbook of Environmental
Chemistry Vol. 5 Part C. QualiU and Treatment of Drinking Water II". Ed.: J.
Hrubcc; Springer-Vcrlaç, Berlin. 83-141.
Hunt, N.K. and B.J. Marinas (1997). Kinetics of Escherichia coli inactivation with
ozone. Water Reseatch. 31(6): 1355-1362.
Tto. K. (1997). Determination of iodide m seawater by ion chromatography. Analytical
Chemistry. 69: 3628-3632.
Page 137
124
Johnson, .I.D. and R. Overby (1971). Bromine and bromamine disinfection chemistry.
Journal of the Sanitary Engineering Division, 97(5): 617-628.
Johnson. CD. (1980). The Hammett equation. Cambridge Texts in Chemistry and Bio¬
chemistry, Cambridge University Press, Cambridge.
Karpel Vcl Leitner, N., J. Vessella, M. Doré, and B. Legube (1998). Chlorination and
formation of organoiodinated compounds: the important role of ammonia. Envi¬
ronmental Science & Technology. 32( 11 ): 1680-1685.
Khiari, D. (1999). Report American Water Works Association Research Foundation, in
pi ogress.
Kleopfer, R.D. and B.J. Fairless (1972). Characterization of organic components in a
municipal water supply. Environmental Science & Technology, 6(12): 1036-1037.
Klick, S. and K. Abrahamsson (1992), Biogenic volatile iodated hydrocarbons in the
ocean. Journal of Geophysical Research. 97(C8): 12683-12687.
Krupp. G. and D.C. Anmami ( 1999). The origin of iodine in soil I. Iodine in rainfall over
Germany. Chemie der Erde. 59( 1): 57-67
Kumar, K., R.A. Day, and D.W. Margerum ( 1986). Atom-transfer redox kinetics: gen¬
eral-acid-assisted oxidation of iodide bv ciiioramines and hypochlorite. Inorganic
Chemistry, 25(24): 4344-4350.
Lambert, J.L., G.L. Hatch, and B. Mosier ( 1975). Iodide and iodine determination in the
part.s-per-bilhon range with letic o crystal violet and N-chlorosuccinimide-
succinimide reagents. Analytical Chemistry. 47: 915-916.
Langer. P. (1960). History of goitre, m "Endemic Goitre"; World Health Organization,
Geneva: 9-25.
Laverock, M.J., M. Stephenson, and CR. Macdonald (1995). Toxicity of iodine, iodide,
and iodate to Daphnia magna and rainbow trout (Oncorhynchus mykiss). Archives
of Environmental Contamination and Toxicology, 29: 344-350.
Leigh, G.J., Ed. (1990). Nomenclature of inorganic chemistry: Recommendations.
Blackbcll Scientific Publications. Oxford.
Lengvei. L. I.R. Epstein, and K. Kustm (1993). Kinetics of iodine hydrolysis. Inorganic
Chemistry, 32(25): 5880-5882.
Lengyel, F, J. Li, K. Kustin. and LR. Epstein 11996). Rate constants tor reactions be¬
tween iodine- and chlorine-contaimng species: a detailed mechanism of the chlorine
dioxide/thlonte-todide reaction. Journal ot the American Chemical Society, 118:
^708-3719
Page 138
125
Lovelock, FE. (1975). Natural halocarbons in the air and in the sea. Nature, 256: 193-
194.
Luther III. G.W., J. Wu. and J.B. Cullen (1995). Redox chemistry of iodine in seawater
- frontier molecular orbital theory considerations, in "Aquatic Chemistry: Interfacial
and Interspecies Processes". Eds.: C.P. Huang, CR. O'Melia, and J.J. Morgan;
Advances in Chemistry Vol. 244; American Chemical Society, Washington DC;
135-155.
Mabcy, W. and T. Mill (1978). Critical review of hydrolysis of organic compounds in
water under environmental conditions. Journal of Physical Reference Data, 7(2):
383-415.
Margerum, D.W.. P.N. Dickson, J.C Nag), K. Kumar, C.P. Bowers, and K.D.
Fogclman (1986). Kinetics of the iodine monochloride reaction with iodide meas¬
ured by the pulsed-accelerated-flow method. Inorganic Chemistry. 25(27): 4900-
4904.
McTaggart, A.R., E.C.V. Butler. P.R. Haddad, and J.H. Middleton (1994). Iodide and
iodate concentrations m eastern Australian subtropical waters, with iodide by ion
chromatography. Marine Chemistry, 47: 159-172.
Miyakc, Y. and S. Tsunogai (1963). Evaporation of iodine from the ocean. Journal of
Geophysical Research, 68(13): 3989-3993.
Moisan, T.A., W.M. Dunstan, A. Udomkit, and G.T.F. Wong (1994). The uptake of
iodate by marine phytoplankton. Journal of Phycology, 30(4): 580-587.
Moore. R.E. ( 1977). Volatile compounds from marine algae. Accounts of Chemical Re¬
search, 10: 40-47.
VIoore, R.M. and R. Tokarczyk (1992). Chloro-iodomethane in N. Atlantic waters: a
potentially significant source of atmospheric iodine. Geophysical Research Letters,
19(17): 1779-1782.
Moore, R.M., VI. Webb, R. Tokarczyk, and R. Wevei (1996). Bromoperoxidase and
iodoperoxida.se enzymes and production ol halogenated methanes in marine diatom
cultures. Journal of Geophysical Research. 101 (C9): 20899-20908.
Mössinger, J.C. D.E. Shallcross. and R.A. Cox (1998). UV-Vis absorption cross-
sections and atmospheric lifetimes of CHJP\, CHJ: and CH0BrI. Journal of the
Chemical Society, Faraday Transactions. 94( 10): 1391-1396.
Nägch, K (1969). Auswirkungen des Phenolunfalles vom 20. September 1967 im
Wasserwerk der Stadt Zürich. Gas. Wasser, Abwasser, 49( 1 1): 372-377.
Page 139
126
Nagy, J.C, K. Kumar, and D.W. Margerum (1988). Non-metal redox kinetics: oxida¬
tion of iodide by hypochlorous acid and by nitrogen trichloride measured by the
pulsed-acceierated-flow method. Inorganic Chemistry, 27(16): 2773-2780.
Neta. P. and L.M. Dorfman (1968). Pulse radioivsis studies. XIII: Rate constants for the
reaction of hydroxyl radicals with aromatic compounds in aqueous solutions. Ad¬
vances in Chemistry Series. 81: 222-230.
Palmer. D.A. and M.H. Lietzke (1982). The equilibria and kinetics of iodine hydrolysis.
Radiochimica Acta, 31: 37-44.
Paquette. J. and B.L. Ford (1985). Iodine (liemistrv in the +Î oxidation state 1. The
electronic spectra of OT, HOI, and Hd)C. Canadian Journal of Chemistry, 63:
2444-2448.
Pearson. R.G. (1969). Hard and soft acids and bases. Survey of Progress in Chemistry,
5: 1-52.
Pelhybridge, A.D. and J.E. Prue (1967). Equilibria in aqueous solutions of iodic acid.
Transactions ol the Faraday Society. 63: 2019-2033.
Pinkernell, IF, B. Nowack, H. Gallard, and F. von Gunten (1999). Photometric deter¬
mination of reactive bromine and chlorine species using ABTS. submitted to Water
Research.
Pundt, I., J.-P. Pommereau, C. Phillios. and E. Eateltin (1998). Upper limit of iodine
oxide in the lower stratosphere. Journal of Atmospheric Chemistry, 30: 173-185.
Rabai, G. and M.T. Beck (1988). Exotic kinetic phenomena and their chemical explana¬
tion in fhe iodate-sulfite-thiosulfate system. Journal of Physical Chemistry, 92(10):
2804-2807.
Ramette, R.W. and R.W. Sandford Jr. (1965). Thermodynamics of iodine solubility and
triiodidc ion formation in water and in deuterium oxide. Journal of the American
Chemical Society. 87(22): 5001-5005.
Reckhow, D.A. and P.C. Singer ( 1984). Mechanisms of organic halide formation during
fulvic acid chlorination and implications with respect to preozonation, in "Water
Chlorination: Chemistry. Environmental Impact and Health Effects. Vol. 5". Eds.:
R.L. Jolley. R.J. Bull. W.P. Davis, S. Katz, M.H. Roberts Jr., and V.A. Jacobs;
Lewis Publishers, Chelsea, Michigan; 1229-1257.
Reifenhäuscr. W. and K.G. Heumann (1992). Detenmnahons ot methvl iodide in the
Antarctic atmosphere and tiie south polar sea. Atmospheric Environment, 26À(16):
2905-2912.
Page 140
127
Rook. J.J. (1974). Formation of haloforms during chlorination of natural waters. Journal
of Water Treatment and Examination, 23(2): 234-243.
Sammet, V. ( 1905). Die Gleichgewichte 6 FT + 5 I + IO, =3 F+3 H20 und 6 H+ +
5 Br' + BrO, - 3 Br2 + 3 H,0, chemisch und elektromotorisch bestimmt. Zeit¬
schrift für Physikalische Chemie. 53( 6): 641-691.
Sano. T., H. Hon, M. Yamamoto, and T. Yasimaga (1984). Kinetic studies of the poh-
iodide complex formation in the iodine-iodide solutions. Bulletin of the Chemical
Society of Japan. 57(2): 575-576.
Shin. U.S., Y.S. Oh-Shm. J.H. Kim, and J.K. Ryu ( 1996). Trace level determination of
iodide, iodine and iodate by gas chroinatographx-niass spectrometry. Journal of
Chromatography A, 732: 327-333.
Soulard, M., F. Bloc, and A. Hatterer (198 1 ). Diagrams of existence of chloramines and
bromamuies m aqueous solution. Journal of the Chemical Society, Dalton Transac¬
tions 12: 2300-2310.
Sturges, W.T. and F.A. Barrie (1988). Chlorine, bromine, and iodine in arctic aerosols.
Atmospheric Environment, 22(6): 11 79-1194.
Suez Lyonnaise des Eaux (1993). Conditions de formation et destruction des trihalome¬
thanes iodés responsables des goûts et odeurs pharmaceutiques. Internai Report,
Lyonnaise des Eaux, Le Pecq, France.
Suffet, 1 H.. A. Corado, D. Chou, M.J. McGmre. and S. Buttcrworlh (1996). AWWA
iciste and odor survey. Journal ol the American Water Works Association, 88(4):
168480.
Taurog, A., E.A. Howells, and HT. Nachimson (1966). Conversion of iodate to iodide
in vivo and in vitro. Journal of Biological Chemistry, 241(20): 4686-4693.
Ternes, T.A.. R.W. Hirsch, M. Stumpf T. Eggerl, B.E. Schuppert, and K. Haberer
(1999). Nachweis und Screening \on Arzneimittelrückständen, Diagnostika und
\nnseptika m der aquatischen Umvelt. ESWE-Institut für Wasserforschung und
Wassertechnologie GmbH, Wiesbaden.
Thomas, T.R., D.T. Pence, ana R.A. Hasty ( 1980). The disproportionation of hy¬
poiodous acid. Journal of Inorganic & Nuclear Chemistry. 42: 183-186.
Thompson. A.M. and O C Zafiriou ( 1983). Air-sea fluxes of transient atmospheric spe¬
cies. Journal ot Geophysical Research, 88(011): 6696-6708
Page 141
128
Tian. R.C. FC Marty, E. Nicolas, J. Chiavérini, D. Ruiz-Pino, and M.D. Pizay
(1996), Iodine speciation: a potential indicator to evaluate new production versus
regenerated production. Deep-Sea Research I, 43(5): 723-738.
Troy. R.C. M.D. Kelley, J.C. Nagy. and D.W. Margerum (1991). Non-metal redox
kinetics: iodine monobromide reaction with iodide ion and the hydrolysis of IBr.
Inorganic Chemistry, 30(25): 4838-4845.
Truesdale, V.W.. C. Canosa-Mas, and GAV. Luther III (1994). Kinetics of dispropor¬
tionation of hypoiodous acid. Journal of the Chemical Society, Faraday Transac¬
tions. 90(24): 3639-3643.
Truesdale, V.W. and C. Canosa-Mas (1995). Kinetics of disproportionation of hypo¬
iodous acid in phosphate and borate buffer at pH < 8.5 modelled using iodide feed¬
back. Journal of the Chemical Society. Faraday Transactions, 91(15): 2269-2273.
Truesdale. V.W. ( 1997). Kinetics of disproportionation of hypoiodous acid at high pH,
with an extrapolation to rainwater. Journal of the Chemical Society, Faraday Trans¬
actions, 93(10): 1909-1914.
Turner, D.H., G.W. Flynn, N. Sutin, and J.V. Beitz (1972). Laser Raman temperature-
jump study of the kinetics of the triiodidc equilibrium. Relaxation times in the 10~'H~
IO'7 second range. Journal of the American Chemical Society, 94(5): 1554-1559.
Urbansky, E.T., B.T. Cooper, and D.W. Margerum (1997). Disproportionation kinetics
of hypoiodous acid as catalyzed and suppressed by acetic acid-acetate buffer. Inor¬
ganic Chemistry, 36: 1338-1344.
USEPA (United States Environmental Protection Agency) (1998). Federal Register Pan
IV.
Vollhardt, K.P.C. and N.E. Schore (1994). Organic Chemistry. W.H. Freeman, New
York.
von Gunten, U. and J. Hoigné (1994). Bromate formation during ozonation of bromide-
containing waters, interaction of ozone and hydroxyl radical reactions. Environ¬
mental Science & Technology, 28(7): 1234-1242,
Waber, U., H.R. von Gunten. and U. Krähenbühl (1987). The impact of Chernobyl ac¬
cident on a river/groundwater aquifer. Radiochimica Acta, 41: 191-198.
Wang, Y.L., J.C Nagy, and D.W. Margerum (1989). Kinetics of hydrolysis of iodine
monochlonde measured by the pulsed-acceterated-flow method. Journal of the
American Chemical Societv, 111(20). 7838-7844
Page 142
129
Wayne, R.P., G. Poulet, P. Biggs, J.P. Burrows, R.A. Cox, P.J. Crutzen, G.D. Hay-
nian, M.E. Jenkin, G. Le Bras, G.K. Moortgat, U. Platt, and R.N. Schindler
(1995). Halogen oxides: radicals, sources and reservoirs in the laboratory and in the
atmosphere. Atmospheric Environment. 29(20): 2675-2881.
Weast, R.C, Ed. (1984). Handbook of chemistry and physics. CRC Press: Boca Raton,
Florida.
Webster, S.H., M.E. Rice, B. Highman, and W.E. von Oettingen ( 1957). The toxicol¬
ogy ofpotassium and sodium iodates: acute tovicitv in mice. Journal of Pharmacol¬
ogy and Experimental Therapeutics, 120: 171-178.
Webster, STF. E.F. Stohlman. and B. Highman (1966). The toxicology of potassium
and sodium iodates III. Acute and subacute oral toxicity of potassium iodate in
dogs. Toxicology and Applied Pharmacology. 8: 185-192.
Weinberg, H.S. and H. Yamada ( 1998). Post-ion-cliromatography dérivaiization for the
determination of oxxhalides at sub-ppb levels in drinking waters. Analytical Chem¬
istry, 70(1): 1-6
Wennberg, P.O., J.W. Brault, T.F. Hanisco, R.J. Salawitch, and G.H. Mount (1997).
The atmospheric column abundance of 10: implications for stratospheric ozone.
Journal of Geophysical Research, 102(D7): 8887-8898.
Whitehead, D.C. (1984). The distribution and transformations of iodine in the environ¬
ment. Environment International, 10: 321-339.
WHO (World Health Organization) (1993). Guidelines for Drinking-Water Quality. Vol.
I: Recommendations. WHO, Geneva.
WHO (World Health Organization) (1996). Guidelines for Drinking Wafer Quality. Vol.
2: Health criteria and other supporting information. WHO, Geneva.
Wolfe, R.F., N.D. Ward, and B.H. Olson (1985). Inorganic chloramines as drinking
water disinfectants: a review. Journal of the American Water Works Association,
77(10): 74-88.
Wong, G.T.F. (1991). The marine geochemistry of iodine. Reviews m Aquatic Sciences,
4(1): 45-73.
Wren, J.C, J. Paquette. S. Sunder, and B.L. Ford (1986). Iodine chemistry in the +1
oxidation state II. A Raman and UV/visible spectroscopic study of the dispropor¬
tionation of hypoiodite in basic solutions. Canadian Journal of Chemistry, 64(12).
2284-2296.
Page 143
130
Xin-Min. J., C Xue-Yi, J. .Ti-Yong, M. Tai, D.W. James, M.A. Rakeman. D. Zhi-
Hong, M. Mamette, K. Amette, Z. Ming-Ei, and G.R. Delong (1997). Dynamics
of environmental supplementation of iodine: Four years' experience of iodination of
irrigation water in Ilotien, Xinjiang, China. Archives of Environmental Health,
52(6): 399-408.
Yokouchi, Y., H, Vlukai, H. Yamamoto, A. Otsuki, C Saitoh, and Y. Nojiri (1997).
Distribution of methyl iodide, ethyl, iodide, bromoform, and dibromomethane over
the ocean (east and southeast Asian seas and the western Pacific}. Journal of Geo¬
physical Research, 102(D7): 8805-8809.
Young, W.E.. H. Horth, R. Crane, T. Ogden, and M. Arnott (1996). Taste and odour
threshold concentrations of potential potable water contaminants. Water Research,
30(2): 331-340.
Page 144
131
Appendix A: Overview of Equilibrium and Rate
Constants
equilibrium K ref.
F + H,0 = HOI + I + H+
3 HOI = 10, + 2 T + 3 H+
F + F = I7
H2OF - HOI + H^
HOI = H* + Ol
OF + F = FO7
HOI + T = FOH
HIO, = TO, + FF
i, + r = 17
F + F = I,
~> I-
_T
'
X* I, lö
1CI7 - ici + er
ICI + ILO = HOI + Cl" + H*
IBr, = IBr + BF
IBr = 1 +FBr
IBr + H?0 = HOI + H1 + Br
F + Cl - FCl
5.44 x IO"" Burger & Liebhafsky,
1973
6x 10" Sammet, 1905
725 Burger Si Liebhafsky,
1973
0.04 Bell & Gelles, 1951
4.0 x 10"" Chapter 3
0.045 Atwater et al., 1996
300 Chia, 1958
0.18 Pethybridge & Prue, 1967
0.184 Genser & Connick, 1973
9 Ramette & Sandford.
1965
0.41 Sano et al, 1984
0.013 Wang et al., 1989
8.2x 10" Wang et al.. 1989
0.035 Troy et al., 1991
2 x 1(T Troy et al., 1991
2.4 x 1(7 Troy étal., 1991
\,1 Margerum et al., 1986
Page 145
132
reaction rate constant products réf.
F + OH" 8x KFMV FOH" Lengyel et al., 1993
FOH 6.9 x 10's1 F, OH" Lengyel et al., 1993
FOH" + FF 2.2xl0l0M1s1 F, H20 Lengyel et al., 1993
FOH 1.3 x 10⁶s' HOI. I Eigen & Kustin,
1962
HOI + I 5 x 10° M 's'
FOH Eigen & Kustm,
1962
107 + 2 I" + 2 FF 3.0x umv HOF 01" Barton & Wright,
1968
F + F 6.2 x UT' M 7s'
1. Turner et ai., 1972
L, 8.5 x 1(7 s~ F, F Turner et al.. 1972
HOI + HOI 3±2x 10"'rvF's1 107, I Chapter 3
hoi + or 15±lM"'s' 107, F Chapter 3
HOT + HOI + 5±2x 10JM~V 107, F Chapter 3
HOO7
FTOI + HOI + 5.0±0.5x 10'M V 107, r Chapter 3
COf
HOI + HOI + 1.7±0.6x KF\FV IO7, F Chapter 3
B(OH)4
o, + r 2 x 10⁹ M"7s '
01 Garland et al.. 1980
HOCl + F 4.3 x 10bM"'s"' HOI Nagy et al... 1988
NH.C1 + T + H' 2.4 x 10I0MV HOI Kumar et al., 1986
CIO. + 1 1870 M 's {F Fabian & Gordon,
1997
Page 146
133
reaction rate constant products ref.
HOI + O, 3.6±1 Ox 10* M 's1 IO, Chaprer 4
01 + O, l.6±0.5x 1(7 M 's1 TO, Chapter 4
HOI + HOCl + HOCl 8.3±0.8x I04MV IO, Chapter 4
HOI + HOCl 8.2±0 8 M 's '
io3 Chapter 4
HOI + OCl 52±5 M's1 xKJ^ Chapter 4
HOI + NTFC1 <2x 10 M 7s1 Chapter 4
Ol +NTFFC1 <3M's' Chapter 4
H2OP + p-methoxy¬ 5±lxl0,MV Chapter 5
phenol
H2OF + p-cresol 4.0± F5v 10 7mV Chapter 5
H2OF + phenol 5±2xl01M's1 Chapter 5
H2OI+ + p-chlorophenol 3±lxlO,M'sI Chapter 5
HoOF + p-iodophenol 4±l\UrM's' Chapter 5
71,01'
+ p-cyanophenol 2±1\10:M V Chapter 5
HOI + p-methoxy¬ < 100 M V Chaptei 5
phenol
HOI + p-cresol 3±lxlO:M's' Chapter 5
HOI + phenol FOiOJxlO-M's1 Chapter 5
FIOI + p-chlorophenol < 5 M 's'
Chapter 5
HOI + p-iodophenol 20±8MV Chapter 5
HOI + p-cyanophenol 1.5±0 5 NT's"1 Chapter 5
Page 147
134
reaction rate constant ref.
HOI + p-methoxy- 7±2x 1 if M"'s '
Chapter 5
phenol
HOI + p-cresol 7±3x 1(FM"V Chapter 5
HOI + phenol 2± I x 10'1 \F's"
'
Chapter 5
HOI + p-chlorophenol F6±0.5xlO'1M",s]
Chapter 5
HOI + p-iodophenol i^O.SxUFXT's"1 Chapter 5
HOI + p-cyanophenol 4±2x 10²M"'s"' Chapter 5
acetaldehyde 9±lxl()V Chapter 5
pinacolone 4±2 x 10Q s'
Chapter 5
acetone i.3±0.4 x 10" s"1 Chapter 5
acetaldehyde + OH" 0.90±0.04 M"V Chapter 5
pinacolone + OH" 0.037±0.002 M"V Chapter 5
acetone + OH" 0.25±0.03 MV Chapter 5
HOI + acetone 2.5± FO M"'s '
Chapter 5
01 + acetone + OH" 3±1 x 10* M~xs'
Chapter 5
HOI + methylglyoxal 6±2 x 10: M"1 V Chapter 5
+ OH
H2OF + allyl alcohol l.8±0.4 x IO7 MV Chapter 5
HOI + glucosamine 0.27±0.07 M V! Chapter 5
HOI + Hglucosamine- 7±3 x 10"^ M"7 ä
Chapter 5
Page 148
135
Appendix B: I and I03" in Natural and Treated
Waters and in Table Salts
10
Moos, Zurich
source water S ihl 401
source water Lorze 402
source water after CIO, 107
lake water 101/01
lake watei pieox (CF, C102) 102/02
fast filtiation 156
ozonation 110
GAC filtrate 1 12
finished water I 15/01
Fe Pecq
raw water
o/onated water
GAC filtrate
osmosis
Fe Pecq
raw water
ozonated water
GAC filtration
new GAC filtei
/ pg/F 1 / pg/F Date
16.10.1998
0.9 1.8
I 2 2.0
1 0 0.0
0 0 0 3
0 s 0 1
0 4 0 0
1 ! 0 0
t 4 0 o
1 4 0 1
19.4.1999
4 2 10.2
25.5 1.0
24 9 0.1
0.2 0.3
29.4.1999
1.9 11.2
24.8 1.9
24.0 0.9
10.8 0.6
Croissy/Fe Pecq
raw water
ozonation
GAC filtration
ground water F l Le Peeqground water F4 Le Pecqground water F6 Le Pecqground water F7 Le Pecq
ground water F9 Le Pecqground water FI Mexiqueground water F12 Mexique
ground water F15 Mexiqueram water
8.6.1999
0.8 8.7
20.0 <0.2
22.9 <0.2
10.7
12.0
17,
V7 b
21 8
L2
0.4
< 0 2
0.3
Page 149
136
Rainwaters Switzerland 107 / Fg/L F / ug/F
f
Chaumont
Chaumont
Chaumont
Chaumont
Chaumont
Chaumont
Chaumont
Dübendorf
Dübendor
Dübendorf
Dübendorl
Dübendorf
Payerne
Payerne
Payerne
Rigi
Rigi
Rigi
Rigi
Rigi
Tänikon
Tänikon
Fänikon
Tänikon
Fämkon
Fànikoi)
<0.l 3.3
0.5 1 0
O.l 7.3
<0.i 2.8
<0.1 1.9
<0.l 2.3
<0.l 10.8
0.4 1.4
< 0.1 •y n
< O.L 1.0
-. 0.1 1 0
<0.1 1.6
<0.1 5.5
<0.1 0.5
<0.1 2.2
<0.i 4.4
0.6 3-
0.3 0F
<. 0.1 0.7
<(M 2.3
<0.l 1.5
<0.1 4.7
<0.l 5.2
<0.l 3.7
0.2 2 8
< 0.1 0.8
27.4.1999
29.4.1999
30.4.1999
1.5.1999
7.5.1999
8.5.1999
11.5.1999
29.4.1999
30.4.1999
55 jQOQ
7 5 |9QQ
8.5.1999
27.4.1999
8.5.1999
11.5.1999
27.4.1999
29.4.1999
30.4. J 999
5.5.1999
6.5.1999
21.4.1999
23.4.1999
24.4.1999
27.4.1999
30.4.1999
6.5.1999
Mimizan ( french Atlantic coast)
rain water
drinking water
0.2
3.5
<0.3
<0.3
Aus. 99
Fable salts India
A
TO, / ms/kc I > me/kg
1,1.. i
May 99
Page 150
137
Appendix C: Kinetic Raw Data
Raw data: oxidation of HOI bv chlorine and ozone
pFl [HOCllwt/uM k/ pH lFlOCi]tot/uM k/s
5.30 5.1 2.45c-5 8.75 49.4 3.66e-3
5.40 35.3 4.78c-4 8.75 49.2 2.74e-3
5.40 20.4 1.95 c-4 8.75 10.1 5.84e-4
5.40 19.8 l.SOc-4 8.80 40.3 3.36e-3
5.40 15.0 1.7lc-4 8.80 15.0 7.62e-4
5.40 10.1 8.36e-5 8.80 5.0 2.52e-4
5.40 4.9 2.30e-5 8.90 249.3 1.02c-2
5.40 19.8 3.73c-4 8 90 150.1 5.90e-3
5.50 100.8 2.17e-3 8 90 59.9 5.53c-3
5.50 71.0 l.36e-3 8.90 49.8 3.25e-3
5.50 69.5 9.52e-4 8.90 20.4 1.14e-3
5.58 433.0 2.08e-2 8.91 102.0 4.48e-3
5.60 375.5 F26C-2 8.93 198.3 7.34e-3
5.62 289.0 l.l()e-2
5.64 254.8 7.23c-3 pH ozone: k/ TVTV1
5.69 144.0 2.09e-3 5 99 29100
5.70 145 0 1 88o-3 6 00 36200
6.20 15 0 l.28e-4 6.00 30400
6.20 10 0 9.890-5 6 05 25345
6.20 5.0 1 86e-5 6.36 29921
6.26 375.5 1.14e-2 6.38 25300
6.29 240.3 4.57c-3 6.39 50000
6.30 20.4 1.97c-4 6.40 56300
6.35 114.0 9.24e-4 6.68 35400
7.18 341.2 1.21 c-2 6.70 37500
7.20 39.6 6.16c-4 6.96 32900
7.20 20.4 2 90e-4 7.00 42100
7.20 20.2 5.83c-4 7.00 52800
".20 15 3 5.26c-4 7.38 50600
"720 15.3 6 05c-4 7.40 54700
7.20 10.2 1.08e-4 7.80 59100
7.20 5.1 6.26e-5 7.81 37900
7.23 L70.4 4.46e-3 7.82 59900
7.28 83.1 2.450-3 8.24 57100
8.14 41.3 I 81 o-3 8.36 34200
8.16 123.8 6.020-3 8.39 50435
8.17 82.5 } 97c-3 8 42 66300
8.20 20.4 8 01 c -4 8.46 4ö 150
S.20 15 0 5 94e-4 8.77 53490
8.20 J 9 8 4.290-4 9.17 113700
8.20 19.8 l.?5e-3 9.21 123700
8.21 9.6 5.08e-4 9.43 172900
8.22 254.1 1.05e-2 9.50 181900
8.24 10.2 3.510-4 9.56 187090
8.25 5.1 2.170-4 9 56 182600
8,26 131 8 5 89o-3 9 61 231900
8.28 ö3 8 3,220-3 9 o2 232400
8.50 19 9 1 28e 3 9 74 387000
8 58 29 3 1 90o- * 9.74 377000
S,7| 40.3 2 2le ;
Page 151
138
Raw data. di sproportionation
k£/MV pFl borate / M L/MV pH carbonate / M
1.28 7.65 3.00e-3 4,17 9.00 3.00e-3
1.04 7.66 2.94e-3 9.24 9.01 2.98e-3
2.95 7.95 2.49c-2 4,75 9.07 3.00e-3
1.89 8.18 3.04e-3 18.64 9.07 jLi • F 1 V'*"* Zj
2.04 8.18 2.94e-3 9.80 9.13 1.21C-2
4.88 8.21 1.230-2 1.21 9.19 3.02e-3
6.19 8 21 2.17c-2 8 02 9.47 3.00e-3
1.41 8.21 U)le-3 8 62 9.49 3.00e-3
2.68 8.33 3 OOe-l 27 43 9.5 î 1 .jLt I C-" *»
6.89 8.39 1.2IC-2 9 09 9.53 3.00C-3
3.31 8.52-1
01 e-3 13.62 9.69 3.02e-3
3.21 8.90 ~> 73e-3 10.64 9.85 2.97c-3
5.43 8.94 2 910-3 35.36 9.96 1.19e-2
8.32 8.96 2 99e-3 56.10 9.97 2.07e-2
6,86 8.96 2 96e-3 12.71 9.97 3.00e-3
11.18 8 96 3 00o-3 14.61 9.98 3.00e-3
32.42 8.97 2 40e-2 14 90 9.98 3.00e-3
6.14 8 98 0 93o-3 15,30 10.01 3.00e-3
5.79 8 98 2 93o-3 61 8^ 10.02 2.lle-2
5 66 8 98 2 93e-3 40 04 10.04 1.2le-2
5.73 8 99 2 93e-* 16.57 10.18 3.02e-3
12.14 9.0 4.32e-3 17.69 10.42 3.00e-3
9.12 9.0 4.32e-3 15.17 10.43 3.00e-3
8.42 9.0 4.32c-3 15,91 10.49 3.00e-3
4.46 9.0 2.86e-3 15 05 10.51 3.00C-3
18.74 9,0 l.20e-2 8.96 10.86 2.96e-3
6.07 9.03 3.00e-3 10.15 10.88 3.00C-3
7.23 9 04 3.01e-3 9.80 10.92 3.00e-3
12.80 9 73 2.96c-3 9.47 10.95 3.00e-3
11.32 9 95 3.0 le-3 9.22 10.98 3.00e-3
12.40 9 96 3 04c-3 14 98 10.99 l.l9c-2
50.1 6 9 97 2 10c-2 12 45 11.00 3 02e 3
53 9"' 9,97 2.10C-2 13.54 11.02 t.2le-2
32.20 9.98 1.23C-2 16,77 11.06 2.07c-2
33 98 9.98 1.200-2
8.40 10.0 2.00e-3 kv/MV pit ammonia / M
13.30 10.44 2 96e-3 2.07 8.29 1.98e-3
10.66 10.61 3 00c-3 2.19 8.32 9.89e-3
1^/M'F pH carbonate / M 1 67 8.33 4.94e-2
2 13 8.46 3 00e-3 4 90 8.79 9.98e-4
2 ^5 8.46 3 00e-3 0.87 8.98 4.99e-2
2,15 8 48 3 00e-3 0.77 8.98 9.98e-2
2 02 8 48 3.00e-^ 1.07 9.07 2.48e-2
^ 93 S 94 3,000-3 2.49 9.08 3.40e-3
29.52 8 97 2 98e-2 1.56 9.08 1.46e-2
21 33 8 09 2 090-2 2.75 9.96 1.98e-3
13 40 8»9 1.190-2 1 09 10.00 9.68e-3
4.07 8.99 3 00e-3 0.55 10.15 4.88e-2
Page 152
139
Raw data: reaction of HOI with phenols
pH n-iodophenol/M k/s pH phenol / M k/s
0.47 1.00e-5 2.80e-2 4.91 2.00c-5 2.58e-3
0.96 1.00e-5 3.15e-2 5.15 4.00e-4 7.71e-2
1.43 1.00e-5 2.04e-2 5.43 5.00e-4 1.88e-l
1.94 2.Ü0C-5 1.52c-2 5.48 2.00e-5 8.18e-3
3.09 5.00e-5 5.03e-3 5.8 1.25e-4 6.01e-2
3.35 2.00e-4 1.06c-2 6.25 l.00e-4 1.7 le-1
4.09 2.00e-5 4.60e-4 6.28 5.00e-4 7.70e-l
4.27 2 OOc-4 6.36e-3 6.29 1.25e-4 2.0le-l
5.05 2.00C-5 4.23e-4 7.02 1.00e-4 5.06c-1
5.11 6 00e-5 2.23e-3 7 66 5.00e-5 8.01e-l
5.38 2.00e-5 5.22e-4 7.68 2.50e-5 3.99e-l
5.57 2.00C-5 5.96e-4 7.8 5.00e-5 5.780-1
6.27 2.00e-5 5.03e-3 7.91 2.50c-5 5.04c-1
7.29 1,00e-4 2.20e-l 7 97 2.50e-5 4.46e-l
7.29 2.00e-4 4.69e-l 84)8 2,50c-5 4.97e-l
8.23 2.50C-5 2.42c-1 8.16 2.50e-5 8.71C-1
8.18 2.50e-5 6.92e-1
pH p-cresol/ M k/s1 8.33 2.50C-5 9.08e-l
2.45 1 00c-5 3.87c-2 8.55 2.50e-^ 1.55e+0
2.49 1 00c-5 4.08e-2
2.79 1 00c-5 2.96e-2 pFl p-cyanophenol 'M k/s'
3.24 i.OOe-5 9.33e-3 -0.04 1.00e-5 6.03c-2
3.24 1,00c-5 1.28e-2 0.54 l.00e-5 1.33e-2
3.48 1.00e-5 1.01e-2 1.02 1.00e-5 6.17e-3
4.05 1 .OOc-5 5.33e-3 1.02 t.00e-5 6.42e-3
4,88 1.00c-5 3,95c-2 1,48 2.00e-5 5.26C-3
1.86 1,00e-4 7.99c-3
pfl p-methoxyphenol / M k/s1 1 91 S.OOe-5 7.04c-3
i 1 1 00e-5 1 36e-2 2.44 5.00e-4 8.830-3
F 16 1.00c-5 1.08e-2 3 24 1 00e-3 5 18e-3
F2o 1 00e-5 8.850-3 4.09 i 00e 3 1,520-3
3.27 1 00e-5 9.45e-3 4 11 5.00e-4 8,50e-4
3.49 1 00c-5 5.800-3 4 56 5,00c-4 9.66c-4
3.5 1 00e-5 6.770-3 4 58 1.00e-3 2.05e-3
3.7 1 00e-5 5.220-3 5 03 5.00e-4 1.22e-3
4.07 1 00e-5 5.070-3 5 07 l.OOc-3 2.63e-3
4.07 2 00e-5 1 62e-2 5 54 1.00e-3 4,68e-3
4.51 1 00e-5 1,380-2 6 25 2.00e-4 3.74e-3
4.68 1 00e-5 2.43e-2 6"ïn l.00e-4 1 86c-3
7 *C7 2.00e-5 1 69e-3
pH phenol / M k/ s"7 2C> 1.00e-5 9.00e-4
* 09 1 Ü0e-5 L37e-2 7 63 l.00e-5 l.31e-3
F26 l.OOc-5 1.23C-2 7 66 2.00e-5 2.45e-3
3.71 1.00e-5 4.47e-3 8.19 1.00e-5 F28e-3
3 98 4 OOe-5 7.90e-3 8 41 2 00e-5 3.07e-3
4.0 2.00e-5 3 75e-3
4.49 6 00e-5 1.170-2
4.5 t.00e-4 L25C-2
4.53 ~> 00c-5 2.99c-^
Page 153
0000
0soooooo
a--jootJ>-^4^
4uOOOO
-J
i-*
00
o to
J-Joo
OO
-Joo
--1IV-.
Juno
un
O--4O
4UOOun
ooooooo
ooooooo
no
no
aa
a'<
]P
I!
ii
ijIjIJUUIjIj
g
oocoooooo
ooooooooo
co
na
an
oo
ot
ii
ii
!!
IP
i
4—
>J
'jjtoUitoUi
Uito4—
i—
Ui
i—oo
boun
n
—ij
Ol—
no
F•bÖ
^~"
r—-J
to
W4iVo
p-•
-J£;un
7>
?-"
tJ
JJ4-
J 4-o
OO
èF
Uj
n
Fj o i
;Cy
-O
-O
r—•
tu,—
toun
.
4-b
4-uj
£:
too
Uiun
^°
oo
oo
,""
oooo
UIunun
unu~
o*\
Ui
4uon
n
O o CD
Co
eF
Ounui4^
MDO
4^-to
cdo
cd
cd
o o a7jn
O CD
o o
ti
()Iv
i^jtolo
t—
lulu
<"
-J.
~-J-J
OOOOOOoo
'jjFF^ooF-j
r--COO
tUOO4U
sO
ooxj^4^o
^t
<y
o*
ux
tJO
CAUiUjtO
UntO—*U0UjVO
OOUi
4uU1
3h
—.r—
Ui
—lUiUi
•—'
öo'o'a>'a>'o'cd
ooooooo
oo
eto
cd
n>n
tO
!to
UiUitoto
tO
—^
4^Uj
r—'Ui
>—'
FF
boFbF
I—
n>
cdo
n>
cd
cd
oft
•oo
MD
,t
i—00
Ui
Ui\oun
Ni
4U\©
Ui
hoGA
Uj
CD
O00OO
vO
oono
1!
f1
O oî
un
CD
oo
<oooo
COCOOOOOOO
~4~J
-J
-~J
ca
4-4>Ui
Oh
£=-
4^-!—OCiJtJ—
Ö-Jtooo
—Oi>—oo
uno
Uj
oonououn
n^
»4^
4^
Uj
Uj
to
r_i
__>"O
-J
4-
UnVO
00
00
to
CA
Uj
-Jun
4i.X
p
i—
0->—-
O-jTw_
r—
p—|j
to
t-ototo
<:
Q
ooooo
<—)oOO
enooO
1Q
P OocoooOooo
oooo
"-<
CD
C[>O
OO
Oi";
CDo
ri>n
CDa
^-.
pi
iI
1
UJ
'jjUj
Uj
t
UJUi
!
UjUj
&j
o 3 O X oUj'—
toCOUn
tJ
.—,-J
'—
Cv>to—'
'—'
^-J—-
O"
0O
vOto
-J
O"*4-
enCO
'./)
,i^
r
CACAO
Uj
CA
OO
4-
Ui
4-O
Uj4-to
---
*^*
aa
cio
nfi
<u
r^o
'D
ft
r-jo
jr
p3"
o4-4^
-t-4u
4-UiUj
4-
Uj
4-4-4-4-
P >i cro
T3 I
O Cçr
(O
Nj
t^
tU—
Nvr—
C7
ÖÖÖOOOÖO
OOOOOOOT3
es
(to
oo
(s
(tï
ip
pp
ip
pes
4u4^
4^
4xununun3 o
I—oo
to
-J
tj
i—
Ij
UjO
'jJO
--JO
to
unoo
i——
IJ'jiC
cd
cdo
n,o
ncd
Ui
4—UjUj
Uj
tJÎO
?r
p^
to
to
'uiunun
Ju
oo
un
000004--JUjO
OOOOO—r-00O
CDOCDCDOeDCDCDCD
!I
!I
PI
if
i
UiUjUjUj
'jjUiUj
UJ
Uj
CD
JDCO
_-
totu
o^
-J
-J<1
-J
un
'o«_
-Jo
to
to0000O
O-J-JCAUiO
-J
g
--_
OOOO
sOUi00Qy
4UO
-O.VD00
4j>
O 'ji
oo
oo
OCD
Ii
un
4^
o X
CD
i—
:—
to
i—
un
bbboc
OOOOO
OCD
CD
CD
CD
IJ
o cd
n>
tx
1P
i!
ii
i/-)
unununu»un
4u
4ua o
Cjs4^00~Jun4^4i.i—
CDCDOCDCDnCDOCD
tototolo
t-j
'jj
tu
toF
unoc
-£•lu
GCD
pp
4-4^
7~
X o
to
toto
to
p>V
to
'-o
-~jh-uno
sO
Uiotooo-J-Jun^-
CDCDCDOCDCDCDtÄ
tOtOtUtO
IO
UiUj
Page 154
141
Curriculum Vitae
Yves Bichsel
born December 30. 1971 in Zurich
Citizen oi Eggiwil, Switzerland
Married
1978-1984 Primary school, Zurich
1984-1990 High school, Zurich (Kantonsschule Zürich-Oerlikon)
1990 Matura type C
199Fl995 Undergraduate studies in chemistry, Swiss Federal In¬
stitute of Technology Zurich (ETF1Z, Abt. IV)
1995 Diploma in General Chemistry (Analytical Chemistry,
Physical Chemistry, Environmental Chemistry, Inor¬
ganic Chemistry. Organic Chemistry)
Diploma thesis at the Swiss Federal Institute of Envi¬
ronmental Science and Technology EAWAG (in the
group of Prof. Dr. René Schwarzenbach), 'Triphenyl-
tin: Analytics and Sorption on SiO, and Kaolimte'
1995-1999 Doctoral thesis, EAWAG (in the group of Dr. Urs von
Gunten), 'Beha\ior of iodine species in oxidative proc¬
esses during drinking water treatment.'
996-1999 Teachins assistant, EAWAG/ETH