Page 1
Research Collection
Doctoral Thesis
Low-temperature selective catalytic reduction of NOxcatalytic behavior and kinetic modeling
Author(s): Willi, René
Publication Date: 1996
Permanent Link: https://doi.org/10.3929/ethz-a-001686051
Rights / License: In Copyright - Non-Commercial Use Permitted
This page was generated automatically upon download from the ETH Zurich Research Collection. For moreinformation please consult the Terms of use.
ETH Library
Page 2
Diss. ETH No 11856
Low-Temperature Selective Catalytic
Reduction of NOx
catalytic behavior and kinetic modeling
A dissertation submitted to the
SWISS FEDERAL INSTITUTE OF TECHNOLOGY ZURICH
for the degree of
DOCTOR OF TECHNICAL SCIENCES
presented by
RENE WILLI
Dipl. Chem. Ing. ETH
born November 11, 1967
citizen of Mels (SG)
accepted on the recommendation of
Prof. Dr. A. Baiker, examiner
Prof. Dr. A. Wokaun, co-examiner
1996
Page 3
To my parents who provided the opportunities and to
Sibyllefor her love, patience, and understanding.
Page 4
Acknowledgments
I am very grateful to Professor Alfons Baiker for the scientific supervision of this
work I appreciated his skill to create an atmosphere for creativity and to find always
time for constructive discussions
I thank Professor Alexander Wokaun for agreeing to be co-examiner and giving
expert advice about this work
My special thanks are due to Dr Rene Koppel for being a helpful and untiring
teacher He was always a partner for fruitful discussions and spent a lot of time for
proof-reading our publications and this thesis
The co-operation with Dr Lukas Padeste, Dr Marek Maciejewski, Dr Helmut
Schneider and Bertrand Roduit was a great help for my research and I want to thank
them for their ideas which are involved in this work
Thanks are also due to Dr Ulnch Gobel for carrying out the XPS measurements,
to Dr Michael Schneider for the preparation of the aerogel sample and to
Katalysatorwerke Huls GmbH for providing the commercial catalyst sample
Financial support of this work by the Nationaler Energie-Forschungs-Fond
(Neff-Project 569) is gratefully acknowledged
Many other people supported me during my thesis Therefore I express my
gratitude to all these unnamed, who contributed in various ways to the success of this
work
In the past few years I won new friends and I am happy for the hours we spent
together I will always remember skiing in Colorado, Tnftji, Damuls, mountain biking in
the Valais Alps and all the other adventures
Acknowledgments
Page 5
Table of Contents
SUMMARY 1
ZUSAMMENFASSUNG 5
CHAPTER 1 INTRODUCTION
1 1 Nitrogen cycle 9
1 2 Environmental problems by nitrogen oxide emissions 10
1 2 1 NOx emission 10
1 2 2 N20 emission 14
1 3 Control technologies for the nitrogen oxides emissions 15
1 3 1 Primary Measures 16
1 3 2 Selective Non-Catalytic Reduction (SNCR) 17
1 3 3 Non-Selective Catalytic Reduction (NSCR) 17
1 3 4 Selective Catalytic Reduction (SCR) 18
13 4 1 Process description 18
13 4 2 Types of catalysts 23
13 4 3 Kinetics and Mechanisms for vanadia containing catalysts 24
13 4 4 Kinetics and Mechanisms for chromia containing catalysts 28
1 4 Research Frontiers 29
1 4 1 The direct decomposition of NO to its elements 29
1 4 2 New developments in the selective reduction of NOx with NH3 30
1 4 3 Using hydrocarbons as reducing agent 31
1 5 Scope of the Thesis 32
1 6 References 33
CHAPTER 2 EXPERIMENTAL
2 1 Apparatus 39
2 2 Analysis 42
2 3 Kinetic Modeling 44
Table of Contents
Page 6
2.4 Notation 47
2.5 References 48
CHAPTER 3: VANADIA-BASED COMMERCIAL CATALYST
Abstract 49
3.1 Introduction 50
3.2 Experimental 51
3.3 Results 52
3.3.1 Mass and heat transfer 52
3.3.2 Catalyst stability 53
3.3.3 Influence of space velocity 53
3.3.4 Influence of water 54
3.3.5 Influence of oxygen 55
3.3.6 Influence of ammonia 56
3.3.7 Influence of S02 57
3.3.8 Kinetic modeling 58
3.4 Discussion 62
3.5 Conclusions 65
3.6 Notation 66
3.7 References 66
CHAPTER 4: VANADIA-TITANIA AEROGEL CATALYST
Abstract 69
4.1 Introduction 70
4.2 Experimental 71
4.2.1 Catalyst 71
4.2.2 Catalytic tests 72
4.2.3 Kinetic modeling 72
4.3 Results 73
4.3.1 Mass and heat transfer 73
4.3.2 Catalyst stability 74
4.3.3 Temperature dependence 75
4.3.4 Influence of space velocity 76
4.3.5 Influence of the ammonia concentration 77
Table of Contents
Page 7
4.3.6 Influence of water
4.3.7 Influence of oxygen 80
4.3.8 Influence of S02 81
4.3.9 Kinetic modeling 83
4.4 Discussion 85
4.5 Conclusions 89
4.6 Notation 90
4.7 References 90
CHAPTER 5: CHROMIA ON TITANIA CATALYST
Abstract 93
5.1 Introduction 94
5.2 Experimental 97
5.2.1 Catalyst preparation 97
5.2.2 Catalytic tests 98
5.2.3 Kinetic modeling 99
5.2.4 X-ray photoelectron spectroscopy 99
5.2.5 Transmission FTIR spectroscopy 99
5.3 Results 100
5.3.1 Heat and mass transfer 100
5.3.2 Stability of the catalyst 100
5.3.3 Influence of temperature 102
5.3.4 Influence of gas flow rate 103
5.3.5 Influence of the ammonia concentration 105
5.3.6 Effect of water 106
5.3.7 Influence of the oxygen concentration 108
5.3.8 Influence of the feed gas composition 110
5.3.9 Effect of S02 112
5.3.10 XPS analysis 114
5.3.11 Transmission FTTR-spectroscopy 115
5.3.12 Kinetic modeling 116
5.4 Discussion 120
5.5 Conclusions 125
5.6 Notation 126
Table of
Page 8
5.7 References 126
CHAPTER 6: COMPARISON OF THE INVESTIGATED CATALYSTS
6.1 Catalytic performance in the low temperature range 131
6.2 Influence of the exhaust composition on the kinetics 133
6.3 Conclusions 134
6.4 References 134
FINAL REMARKS 135
LIST OF PUBLICATIONS 137
CURRICULUM VITAE 139
Table of Contents
Page 9
Summary
The aim of this study was to design new catalytic systems for the selective
catalytic reduction of NO, with increased activity and improved dynamic behavior,
particularly in the lower temperature range This included the optimization of the
structural and chemical properties of the catalysts and comprehensive investigations of
the kinetics The catalysts, developed in our laboratory, were scrutinized under
conditions corresponding to real exhausts and the sensitivity of the activity and
selectivity to the different components in the exhaust gas was determined Additionally,
the kinetic behavior of a commercial sample, used as a reference catalyst, was
investigated in the low temperature range
The work can be subdivided in the following main topics
• Setup of a fully computer controlled pilot plant for exhaust gas catalysts
• Preparation of chromia on titania catalysts with an improved activity and selectivity
• Experimental investigations and simulations of the intrinsic kinetics of a commercial
catalyst, a vanadia-titania aerogel catalyst and a Mania supported chromia catalyst
• Investigations of the deactivation behavior and of the SO2 poisoning of titania
supported chromia catalysts by kinetic measurements, X-ray photoelectron
spectroscopy analysis and transmission FTIR spectroscopy
Reference experiments were carried out with a commercial vanadia based
catalyst provided by Huls GmbH (T1O2 > 70%, V2Os, WO3, M0O3 and additives) The
results obtained with this catalyst were used as a base for comparison with data obtained
with the own catalysts The influence of the different exhaust gas components on the
kinetics was determined, and a model of the intrinsic kinetics was created NO reacts
stoichiometncally with ammonia to water and nitrogen Side reactions, as the formation
of nitrous oxide or the direct oxidation of ammonia, were not significant in the
investigated temperature range
Summary
Page 10
2
For temperatures exceeding 473 K, the kinetic data are described well with a
model which is based on an Eley-Rideal mechanism The kinetic rate expression of the
model was first order with respect to NO and zeroth order with respect to NH3 Below
473 K the conversion is higher than predicted with this model, probably due to the
contribution of an additional reaction pathway, which occurs only at low temperatures
By the introduction of an additional reaction pathway based on a Langmuir-
Hinshelwood mechanism, good fitting of the experimental results with the model
predictions could be achieved also below 473 K
The influence of oxygen was taken into account with a Langmuir adsorption
isotherm expression The impact of the variation m the oxygen concentration on the NO
conversion was small for concentrations between 4% and 10% Lower oxygen
concentrations resulted in a marked decrease of the catalytic activity Water inhibited
the reaction The effect leveled off for water concentrations over 2 5% Between 2 5%
and 7 5% H20 in the feed gas, no significant dependence of the NO conversion was
perceptible To account for this, the kinetic parameters were separately estimated for
water concentrations below and above 2 5%
Recently, vanadia-titania aerogels developed in our laboratory were found to
exhibit high activity for the selective catalytic reduction of NO by NH3 The highly
dispersed vanadia-titania aerogel with a vanadia content of 30 wt % has been prepared
by a two-stage sol-gel process with ensuing high-temperature supercritical drying This
catalyst possesses a specific surface area of 183 m2/g which is several times higher than
that usually found for commercial catalysts The kinetic investigations led to a model
which agrees to a large degree with the model proposed for the commercial catalyst
However, no deviations from the model based only on an Eley-Rideal reaction path had
been detected in the lower temperature range The stoichiometry and the reaction orders
in ammonia and nitric oxide were the same as found for the commercial catalyst, and the
formation of nitrous oxide was not significant
The addition of up to 3% H20 to the dry feed significantly reduced the rate of NO
conversion The effect leveled off for higher H20 concentrations For high water
Summary
Page 11
3
concentrations, the reaction rate reduced to about 60% of the value without water and kept
constant In the absence of 02 in the feed the activity collapsed Small amounts of oxygen
resulted in a sharp increase of the NO conversion, but for oxygen concentrations
exceeding 4 % the increase diminished The influence of oxygen was well descnbed by
the assumption of a Langmuir adsorption The influence of water was modeled with a
modified Langmuir adsorption which took into account the constant activity for high water
concentration by a constant remainder The temperature dependence of the estimated
adsorption constants was not significant in die investigated temperature range CO2
showed no influence, and a high tolerance with respect to sulfur dioxide was observed
The titania supported chromia catalyst with a nominal chromium content of 6 84
wt % Cr, corresponding to 10 wt % Cr203, was prepared by wet impregnation of T1O2
(P25, Degussa) with chromium(III)nitrate nonahydrate After drying and reduction, the
catalyst contained the chromium component mainly in the form of X-ray amorphous
Cr203 In the past, an important disadvantage of catalysts based on chromium oxide was
the undesired formation of nitrous oxide This side reaction could be strongly
suppressed, with an optimized pretreatment of the catalyst, thus maximizing the amount
of X-ray amorphous Cr203
Similar to the vanadia based catalysts the kinetic model approach involves the
assumption of an Eley-Rideal mechanism The observed reaction orders were the same
for the chromia containing catalyst and for the vanadia based catalysts, for which a
reaction rate of first order in NO and zeroth order in NH3 was determined It was not
possible to explain the influence of oxygen on the conversion of NO by a single
Langmuir adsorption model, probably due to an additional reoxidation of the catalyst by
gaseous oxygen Water inhibited the reduction of NO, the undesired formation of N2O
and the reoxidation of the catalyst
Sulfur dioxide exhibited a severe poisoning effect even at low concentrations
This poisoning of the catalyst by S02 was irreversible and occurred at temperatures so
high that the formation of ammonium sulfates/bisulfates/sulfites is implausible The
formation of a sulfate species was established by X-ray photoelectron spectroscopy and
Summary
Page 12
4
transmission FTIR spectroscopy The precise determination of the nature of this sulfate
species needs further investigations
The final comparison of the investigated catalysts showed that the vanadia titania
aerogel and the titania supported chromia catalyst offers a better performance per
catalyst weight in the lower temperature range than the commercial catalyst Due to the
high specific surface area, the aerogel exhibited high activity for temperatures even
below 473 K The selectivity of the newly developed chromia on titania catalyst to N2
and H2O was distinctly improved compared to the known catalysts The lack of
resistance towards SO2 poisoning of this catalytic system is the main obstacle for an
industrial application However, present trends in fuel technology show an increasing
tendency for the use of fuels with very low sulfur content, which would circumvent the
SO2 poisoning problem
Summary
Page 13
Zusammenfassung
Das Ziel dieser Studie bestand in der Entwicklung neuartiger Katalysatorsysteme
mit hoherer Aktivitat und verbesserter Dynamik in bezug auf die selektive katalytische
Reduktion von NOx mit NH3 Besonders wichtig erschien das Ereichen eines guten
Ansprechverhaltens im tieferen Temperaturbereich (<523 K) Dies bedingte neben der
Optimierung der strukturellen und chemischen Eigenschaften der Katalysatoren auch
umfassende kinetische Untersuchungen Die in unserer Gruppe entwickelten
Katalysatoren wurden unter moghchst praxisnahen Bedingungen getestet, und die
Einflusse der einzelnen Abgaskomponenten auf die Kinetik wurden bestimmt Das
kinetische Verhalten eines uns zur Verfugung gestellten kommerziellen Katalysators
wurde eingehend untersucht und als Referenz fur die weitergehenden Studien
verwendet
Die durchgefuhrten Arbeiten lassen sich in folgende Hauptbereiche unterteilen
• Aufbau einer computergesteuerten Testanlage fur Verbrennungsabgaskatalysatoren
• Praparation von Chromoxid auf Titanoxid Schichtkatalysatoren, welche eine
verbesserte Selektivitat und Aktivitat aufweisen
• Experimented Untersuchungen und Modelherung der intnnsischen Kinetik eines
kommerziellen SCR-Katalysators, eines Vanadiumoxid-Titanoxid-Mischaerogels
und eines Chromoxid auf Titanoxid Schichtkatalysators
• Untersuchung von Vergiftungs- und Deaktivierungserscheinungen bei Chromoxid
auf Titanoxid Schichtkatalysatoren mittels kmetischen Messungen, XPS und
Transmissions-FTIR-Spektroskopie
Die ersten Versuche wurden mit einem kommerziellen, auf Vanadiumoxid
basierenden Katalysator der Firma Huls GmbH durchgefuhrt (Ti02 >70%, V205, WO3,
M0O3 und Zuschlagstoffe) Dieser Katalysator diente als Vergleichsbasis fur die
weiteren Versuche mit den eigenen Katalysatoren Es wurde der Einfluss der einzelnen
Zusammenfassung
Page 14
6
Abgaskomponenten auf die Kinetik ermittelt und ein Modell fur die Mikrokinetik
erstellt NO reagierte stochiometnsch mit dem eingesetzten Ammoniak zu Wasser und
Stickstoff Nebenreaktionen, wie die Bildung von Lachgas oder die direkte
Ammoniakoxidation, waren im ganzen Temperaturbereich vernachlassigbar
Fur Temperaturen uber 473 K konnten die kinetischen Daten gut mit einem auf
einem Eley-Rideal Mechanismus beruhenden Modell beschneben werden Die
ermittelten Reaktionsordnungen waren 1 fur Stickstoffmonoxid und Null fur
Ammoniak
Unter 473 K wurde em hoherer Umsatz beobachtet als aufgrund der
Modellvorhersage erwartet wurde Dies deutet auf einen zusatzlichen Reaktionsweg hin,
welcher nur bei tiefen Temperaturen wirksam ist Durch die Einfuhrung eines
zusatzlichen Reaktionsweges, basierend auf einem Langmuir-Hinshelwood
Mechanismus, konnte eine gute Ubereinstimmung mit dem beobachteten kinetischen
Verhalten erzielt werden
Der Einfluss von Sauerstoff konnte durch einen Langmuiransatz beschneben
werden Der Umsatz von NO zeigte fur Sauerstoffkonzentrationen oberhalb 4% nur
noch eine geringe Abhangigkeit Sauerstoffkonzentrationen unter 4% fuhrten zu einem
deuthchen Einbruch der Aktivitat Wasser mhibierte die Reaktion Fur hohere
Wasserkonzentrationen verringerte sich jedoch die Abnahme des Umsatzes, und bei
einem Wassergehalt von uber 2 5% war kein signifikanter Einfluss der H20
Konzentration auf die Umsatzrate mehr erkennbar Aus diesem Grund wurden die
kinetischen Parameter jeweils fur Abgase mit und ohne Wasser einzeln ermittelt S02
und C02 zeigten in den fur Dieselabgase typischen Konzentrationsbereichen keinen
sigmfikanten Einfluss
Bei den Titanoxid-Vanadiumoxid-Mischaerogelen handelt es sich um
neuentwickelte Mischoxide, welche in einem zweistufigen Sol-Gel-Prozess hergestellt
werden Diese Katalysatoren weisen eine im Vergleich zu den kommerziellen
Katalysatoren mehrfach grossere spezifische Oberflache auf Der untersuchte
Katalysator wies einen Vanadiumoxidgehalt von 30 Gew % und eine BET-Oberflache
von 183 m2/g auf Die kinetischen Untersuchungen ergaben ein Modell, welches die
Zusammenfassung
Page 15
7
Erkenntnisse mit dem auf Vanadiumoxid basierenden kommerziellen Katalysator
weitgehend bestatigte Die Abweichung vom Eley-Rideal Mechanismus im unteren
Temperaturbereich (<473 K) konnte jedoch nicht mehr festgestellt werden Es wurde
dieselbe Stochiometne der Reaktion wie beim kommerziellen Katalysator und ebenfalls
keine signifikante Lachgasbildung beobachtet Die ermittelten Reaktionsordnungen
betrugen wiederum 1 fur NO respektive 0 fur Ammoniak
Wasser zeigte fur Konzentrationen unter 4% einen stark mhibierenden Einfluss
auf die Reaktion Bei hohen Wasserkonzentrationen wies der Katalysator eine um etwa
60% vernngerte, jedoch konstante Aktivitat auf Dies bedeutet, dass auch bei maximaler
Bedeckung des Katalysators durch Wasser, der Katalysator eine auf tieferem Niveau
konstante Grundaktivitat beibehalt Die Aktivitat steigt mit der Sauerstoffkonzentration
bis 4% stark an Diese Zunahme schwacht sich ab 4% O2 stark ab und die Aktivitat
nahert sich einem oberen Grenzwert Ohne Sauerstoff im Feedgas bncht der Umsatz
zusammen Dieses Verhalten konnte wie beim kommerziellen Katalysator sehr gut
durch einen Langmuiransatz beschneben werden Der Einfluss der Wasserkonzentration
auf die Sauerstoffabhangigkeit war nicht signifikant Die Temperaturabhangigkeit der
Adsorptionskonstanten konnte in dem von uns untersuchten Temperaturbereich
ebenfalls vernachlassigt werden C02 und S02 zeigten zudem in den fur Dieselabgase
typischen Konzentrationsbereichen kemen Einfluss
Die Chromoxid auf Titanoxid Katalysatoren mit nominell 6 84 Gew % Cr,
entsprechend 10 Gew % Cr203, wurden durch Nassimpragnation von Titanoxid (P25,
Degussa) mit Cr(N03)3 9 H20 hergestellt Nach Trocknung und Reduktion bestand der
Chromanteil des Katalysators zu >95% aus rontgenamorphem Cr203 Em Hauptproblem
bei den DENOx-Katalysatoren auf der Basis von Chromoxiden stellte bis anhm die
unerwunschte Bildung von Lachgas dar Durch eine Optimierung der Vorbehandlung,
wobei der Anted an rontgenamorphen Cr203 maximiert wurde, konnte diese
Nebenreaktion weitgehend unterdruckt werden Wie bei den auf Vanadiumoxid
basierenden Katalysatoren beruht der Modellansatz auf einem Eley-Rideal
Mechanismus Die Reoxidation konnte nicht durch einen reinen Langmuiransatz
ausgedruckt werden Nicht adsorbierter Sauerstoff aus der Gasphase scheint ebenfalls
Zusammenfassung
Page 16
8
teilweise fur die Reoxidation des Katalysators verantwortlich zu sein Wasser
beemtrachtigte die Oxidation des Katalysators und mhibierte zudem die Reduktion von
NO zu N2, sowie die Bildung von Lachgas Die Chromoxid auf Titanoxidkatalysatoren
zeigen schon bei genngen S02 Konzentrationen starke Deaktivierungserscheinungen
Diese Vergiftungserscheinungen traten auch bei Temperaturen uber 540 K auf Es
erschemt deshalb unwahrscheinhch, dass es sich um ein Fouling durch Ablagerung von
Ammoniumsulfaten/sulfiten handelt, welches in der Praxis bei tiefen Temperaturen
auch auf Vanadiumoxid basierenden Katalysatoren auftntt Durch XPS und
Transmissions-FTIR Spektroskopie konnte gezeigt werden, dass sich eine Sulfatspezies
auf der Katalysatoroberflache gebildet hat, deren exakte Natur jedoch noch nicht
ermittelt werden konnte
Der zusammenfassende Vergleich aller untersuchten Katalysatoren bei fur
Dieselabgasen realistischer Abgaszusammensetzung zeigte deutlich, dass die in unserer
Gruppe entwickelten Katalysatoren klare Vorteile im unteren Temperaturbereich
aufweisen Der V2O5/T1O2 Mischaerogel-Katalysator 1st durch seine hohe Oberflache
und den im Vergleich zum kommerziellen Katalysator hohen V205-Gehalt schon bei
sehr tiefen Temperaturen aktiv Die auf Chromoxid basierenden Katalysatoren zeigten
eine ebenfalls hohere Aktivitat im tieferen Temperaturbereich, und es konnte eine
deuthche Verbesserung der Selektivitat bei diesem Katalysatorsystem erreicht werden
Die Empfindlichkeit gegenuber S02 bildet noch ein Problem, welches jedoch durch die
Entwicklung von neuen Dieselkraftstoffen mit sehr genngem Schwefelgehalt entscharft
wird
Zusammenfassung
Page 17
1
Introduction
1.1 Nitrogen cycle
Nitrogen is the main component of the atmosphere as well as a structural
component of the nbonucleic acid (RNA), the desoxynbonucleic acid (DNA) and many
other organic substances In the animated world, nitrogen uptake is mainly in the form
of nitrate (NOi) There are two ways for the fixation of nitrogen in the ecosystem (1)
Firstly via the photochemical reaction of N2 to NH3 and NOx induced by high energy
radiation in the upper atmosphere yielding up to 35 mg m2
year ', and secondly via the
fixation by bacteria and by bluegreen algae yielding to 140 mg m2 year' Both
processes only amount to 6 7 % of the overall nitrogen cycle Dunng the
industrialization, several new flows in the nitrogen cycle were created by man By
burning the biomass and fossil fuels, nitrogen, contained in the combustion air and
nitrogen as components in the biomass and the fuel, oxidize at higher temperatures to
NO, NO2 and N20 The chemical transformations of atmosphenc nitrogen oxides are
depicted in Figure 1-1
The human impact on the natural nitrogen cycle led to severe problems in the
environment The total NOx emissions are estimated to an amount of 50 (±25) Mt(N)/y
(2) 66% of them are made by human activities The human sources are subdivided to
42% from fossil fuel combustion and 24% from biomass burning Natural sources are
lightning (16%), microbiologic activities (16%) and input from the stratosphere (1%)
Introduction
Page 18
10
(HO;NO^)=L> |?|
W7JffiV77rib707^07h7777777d7^bMZ>77zh777,
Figure 1-1. Upper atmospheric chemistry of nitric oxide
Reprinted from ref. 3
1.2 Environmental problems by nitrogen oxide emissions
1.2.1 NO. emission
NOx formation occurs by three fundamentally different mechanisms (4). The
most important mechanism at higher temperatures (thermal NOx) is based on the
thermal dissociation and subsequent reaction of nitrogen and oxygen molecules in the
combustion air. Conversion starts at temperatures above approximately 1600 K and
increases markedly with rising temperatures. The degree of conversion is proportional to
the concentration of atomic oxygen. A mechanism of the thermal NOx formation was
proposed by Zeldovich (5, 6). Under excess of oxygen the kinetic is described by
reactions rl and r2, and under excess of fuel by reaction r3, respectively.
Chapter 1
Page 19
11
excess 02
0 + N2<->NO + N (rl)
N + 02HNO + 0 (r2)
excess fuel
N + OH <-> NO + H (r3)
The second mechanism (fuel NOx), involves the reaction of fuel-bound nitrogen
components with oxygen The reactions are not fully known The nitrogen contents are
0 5 wt % till 2 wt % for coal, 0 5 wt % for heavy oil, trace amounts for light oil and for
natural gas virtually none
The third mechanism (prompt NOx) has only a minor effect Nitrogen radicals
and hydrocarbons react to HCN (r4-r6) as an intermediate, followed by the oxidation to
NO (7, 8) The formation of prompt NOx is only significant in very fuel-nch flames
CN + H2 <-> HCN* + H (r4)
CN + H20 <-» HCN* + OH (r5)
CH + N2<->HCN* + N (r6)
Different sources of anthropogenic NOx emissions are known The most
important is due to combustion processes (see paragraph 1 1) The transport sector is
responsible for 50% of global man-made NOx emission (9) The remainder onginates
from stationary sources, like power plants, internal combustion engines, industrial
boilers, waste and sludge incinerators, process heaters and gas turbines In Switzerland
the contribution is similar (Fig 1-2) The lion share of the NOx emission is produced by
traffic Since 1985 the emission by traffic dropped due to the introduction of catalyst
technology for cars But in the future the part caused by traffic will get bigger due to the
increasing volume of traffic (10)
Introduction
Page 20
12
200000
150000
CO
100000
O2
50000-
—— forestry and agriculture—O— private households
—A— industry—V— traffic
—O— total
./ \
/yv\ «.
/\
o-o
-O—O"
/ 7 \
o 7/ -A^A-A-A-A^^
A-A
0 $=A=A=^$S^,9:Q^=Q-Q-Q=Q-a-B:B:B|1900 1920 1940 1960
year
1980 2000
Figure 1-2. Nitric oxide emission in Switzerland 1900-2010
Reprinted from ref. 10.
In the hot waste gas after the burning chamber, the oxidized nitrogen is mainly in
the form of nitric oxide (NO), a small amount of the NO is transformed to nitrogen
dioxide (N02) and nitrous oxide (N20). For example in a typical diesel exhaust after the
muffler only about 5% of the total NOx emission is in the form of N02, and less than 1 %
in the form of N20. In most of the other combustion types also more than 90 % of
nitrogen oxides are in the form of nitric oxide. Dinitrogen trioxide (N203), dinitrogen
tetroxide (N2O4) and dinitrogen pentoxide (N205) are formed in negligible amounts.
In the troposphere NO is completely oxidized to N02, according to reaction r7
(11).
2 NO + 02 -> 2 N02 (r7)
The main problem of the NOx emission in the troposphere is the formation of
photochemical smog. Ozone, NOx and hydrocarbons are the key substances for the
Chapter I
Page 21
13
appearance of photochemical smog UV radiation (K < 420 nm) leads to a photolytical
decomposition of N02 The atomic oxygen O reacts with molecular oxygen 02 to ozone
O3 Ozone in high concentrations is toxic for men and is supposed to be one cause of the
dying of forests Radicals (CH200*, HO2*) accelerate the formation of ozone A
reaction scheme of the ozone formation in the presence of volatile organic compounds
(VOC) is depicted in Figure 1-3 The alternative formation of ozone in the troposphere
with carbon monoxide instead of VOC is slow and has only a minor effect
O3
C^O
Figure 1-3. Ozone formation in urban air by photochemical reactions.
Reprint from ref 12
After sunset O3 reacts with NO (r8) In the stratosphere, the same reaction occurs
with NO formed by aircrafts or by the decomposition of N2O and attacks the vital ozone
layer, which protects the earth from the hard UV radiation (X < 242 nm)
Introduction
Page 22
14
03 O2 O* O2
NO ^-^1N02 ^^.NO
^(18)
The concentration of PAN (peroxyacyl nitrate), an organic compound which is
also formed from N02 in presence of aldehydes or ketones, is high in photochemical
smog. Daily averages in Los Angeles range from 10 to 30 ppb with maxima up to 210
ppb (13). PAN can cause health problems such as skin cancer and damages the foliage
of trees.
An other severe problem caused by NOx is the acid rain, mainly consisting of
sulfuric, nitric and hydrochloric acid. Nitrogen dioxide reacts with water or OH*
radicals to nitric and nitrous acid (reactions r9 and rlO). Acid rain is also supposed to be
responsible for the dying of forests and led to immense damages at buildings.
2 N02 + H20-» HN02 + HNO3 (r9)
N02 + OH* -> HNO3 (rlO)
1.2.2 N20 emission
Nitrous oxide leads to stratospheric ozone destruction and greenhouse warming.
Because the greenhouse warming potential of N2O with an atmospheric lifetime of 150
years is 150 times higher than that of C02, strong efforts were made to identify the
sources of nitrous oxide and to limit its emission. In the stratosphere 90% of the N2O is
decomposed by photolysis to molecular nitrogen and free oxygen radicals. Another 5 %
react with free oxygen radicals to N2 and 02 and the remaining 5% react with free
oxygen radicals to NO. The formed NO leads to a depletion of stratospheric ozone (r8).
The total annual emission of N20 amounts to approximately 20 Mt(N)/y (14). The
principal source of nitrous oxide is the microbiological activity within soils. The direct
formation of N2O by burning of fuels is only a minor source. Recent estimates from the
Chapter I
Page 23
15
IPPC (15), for the N20 emissions due to fossil fuel combustion only amounted to
approximately 3% of the total N20 emissions Most nitrous oxide is not produced
dunng the burning process, but by undesired side reactions in catalytic reduction
processes (see paragraph 1 3) In Switzerland about 8% of the nitrous oxide comes from
industrial sources, mainly nitnc acid plants and waste incinerators (10) The N20
emission caused by traffic is nsing parallel with the number of catalyst equipped
vehicles For Switzerland the share of the traffic at the total emission is estimated to
approximately 15% in the year 2010 (10)
1.3 Control technologies for the nitrogen oxides emissions
There is a large number of commercial approaches to NOx removal from
stationary sources More than 115 control systems are documented in reference 15 A
good overview is also given by the comprehensive review from Bosch and Janssen (4)
The most important control technologies are listed in Figure 1-4 They can be divided
into two mayor groups
(NOx control)
Primary measures
Flue Gas Recirculation (FGR)
Low NO, Burners (LNB)
Overfire Air (OFA)
Injection Timing Retard
Water-Fuel Mixture Injection
Secondary measurements
Selective Non-Catalytic Reduction (SNCR)
Selective Catalytic Reduction (SCR)
Non-Selective Catalytic Reduction (NSCR)
Figure 1-4. Most important techniques for NOx emission control.
Introduction
Page 24
16
Primary measures prevent the formation of NOx during the combustion, whereas
secondary measures reduce or fix the nitrogen oxides after their formation. Additionally
there are many other processes such as adsorption, absorption complexation and
radiation induced decomposition which have negligible importance and are not
addressed in this paragraph. Table 1-1 presents an overview of the NOx control
technology applications by combustion source type.
Nowadays the strict environmental regulation requires additional post-
combustion removal of NOx (secondary measures) to fulfill the mandatory air quality
standards. The best available but also most expensive post-combustion control
technology with high removal efficiency is the selective catalytic reduction (SCR).
Table 1-1. Applicability of NOx control technology (16)
Control Technology Combustion Stationary Boilers/ Waste
Turbines Combustion Heaters Incinerators
Engines
Combustion Controls X
Post-combustion controls
Selective catalytic reduction X
Non-selective catalytic reduction
Selective non-catalytic reduction
X
X
1.3.1 Primary Measures
The aim of primary measures is to avoid the formation of NOx. This can be
achieved by modification of the fuel composition or by altering the combustion process.
Chapter I
Page 25
17
The substitution of coal or oil by gas or adding of water to the fuel are possibilities of
improvements with fuel modifications (17) Examples of m-combustion modifications
are Flue Gas Recirculation, Low NO„ Burners, Over Fired Air, etc (18, 19) The most
important advantage of primary measures are the low costs
1.3.2 Selective Non-Catalytic Reduction (SNCR)
The name indicates that in this process no catalyst is required, which is the main
advantage of SNCR In the SNCR-process, ammonia or another reducing agent like urea
or cyanunc acid is injected in the flue gas at temperatures between 1100-1300 K (20)
The method gives a lower NOx reduction degree than SCR (SNCR 25 - 50%, SCR
>70%) and has a higher consumption of reducing chemicals (19) A key problem is the
narrow temperature window The temperature of diesel engine exhaust is lower and
prevents an economic application of SNCR Exhaust gases of incinerators operate in this
temperature range In this case SNCR can be the proper and most cost effective
technology
1.3.3 Non-Selective Catalytic Reduction (NSCR)
The best known and one of the earliest techniques to remove nitrogen oxides is
the non-selective catalytic reduction NSCR is used to reduce the NOx emission of nitric
acid plants and gasoline engines
The abatement of exhaust gases from nitric acid plants is one major application
of NSCR (21) The waste gas of a nitnc acid plant, based on the high-temperature
catalytic oxidation of NH3 process, contains excess of oxygen In a first step all the
excess of oxygen has to be consumed by combustion of the fuel reductant, due to the
nonselectivity of the NSCR-process Subsequent, the remaining fuel reduces
catalytically the NOx to N2
Introduction
Page 26
18
Well known is the automotive fiiree way catalyst for cars, which is based on the same
catalytic chemistry. The engine operates near stoichiometric conditions. High
conversion of NOx needs a feedback control loop to ensure the near stoichiometric
operation point. The most widely used catalysts are made up of washcoats of platinum,
rhodium and palladium on high surface supports.
1.3.4 Selective Catalytic Reduction (SCR)
The selective catalytic reduction is the proper technique if a high efficiency of
NOx reduction in excess of oxygen is required. Today, plants with over 90% NOx
reduction are in operation, and a variety of design approaches are in use (16, 22).
1.3.4.1 Process description
In the SCR process, ammonia or an ammonia earner is used as a reducing
agents. Nitrogen oxide and ammonia react over the catalyst with high selectivity to
nitrogen and water. The most common overall reaction is:
4NO + 4NH3+02-»4N2 + 6H20 (rll)
With varying flue gas compositions the overall SCR reactions are frequently
written as:
6 N02 + 8 NH3 -» 7 N2 + 12 H20 (rl2)
NO + N02 + 2 NH3 -> 2 N2 + 3 H20 (rl3)
6 NO + 4 NH3 -> 5 N2 + 6 H20 (rl4)
The SCR process is typically applied for flue gases with an excess of oxygen.
Therefore, in many cases reaction rl4 is not significant. In most flue gases, NOx
contains 90-95% NO and the NH3 consumption is stoichiometrical to the NOx reduction,
Chapter 1
Page 27
19
according to reaction rl 1 and rl3 A change in the stoichiometry was observed by Kato
et al (23), if the NO2/NO ratio was bigger than 1 For pure N02 in die feed gas die mole
ratio of NHi to NO2 was found to be about 1 3 (24), which is in accordance with the
stoichiometry of reaction rl2 Furthermore deviations from the stoichiometry can be
caused by side reactions of NH3 wiffi 02 At high temperatures and in the presence of
oxygen, ammonia can be oxidized directly to N2, N20 and NO, according to reactions
rl5-rl7
4NH3 + 302-»2N2 + 6H20 (rl5)
2NH3 + 2 02->N20 + 3H20 (rl6)
4NH3 + 502->4N0 + 6H20 (rl7)
The selective catalytic reduction of NO with NH3 is very temperature sensitive,
and the operating temperature differs for each class of catalyst matenal (see paragraph
13 4 2) The typical optimum temperature is between 550 K and 700 K
Reducing agent. Commonly ammonia is used as reducing agent The storage
and transport of the toxic ammonia is problematical Consequently, often urea is used in
place of ammonia as reductant (25, 26) Urea is solid and less toxic than ammonia,
which makes the storage and handling more easily In the process it is dissolved m water
and injected into die hot flue gas The water evaporates and the urea decomposes at
440 K to ammonia and carbon dioxide The reaction takes place in two steps, forming
cyanunc acid as an intermediate, according to reactions rl8 and rl9
CO(NH2)2 -> NH3 + HNCO (rl8)
HNCO + H20 -» NH3 + C02 (rl9)
Most other reducing agents are not suitable, because they react mainly with O2
rather than with NOx Recently great research efforts were made to use hydrocarbons as
Introduction
Page 28
20
reductant (see paragraph 1 4 4), but the efficiency of this route is still too small for
commercial application
Catalyst Location. The catalytic unit can be placed in different positions (see
Fig 1-5 for the example of a coal fired power plant) The flue gas composition and
temperature are the decisive criteria for the location Generally we can distinguish
between high dust, low dust and tail end location All of them have advantages and
disadvantages in comparison to each other For a retrofit in most cases the tail end
location is easier to realize, but a great disadvantage is that reheating of the flue gas is
necessary In a low dust case the flue gas is dust free and there are no erosion problems
But a hot gas precipitator is required, which is the main disadvantage for this location
The temperature at the high dust location is m the optimum range for most types of
catalysts Disadvantages are the erosion by the flue gas and poisoning, which cause a
shorter catalyst life time
NH,1
high dust B -*-» SCR — AH — ESP — FGD
tail end
NH,
1low dust B — ESP SCR — AH — FGD
NH,
B — AH — ESP — FGD 'r* SCR
heat
Figure 1-5. Position of catalyst (15)
B = boiler, AH = air preheater, ESP = electrostatic precipitator (or other
particulate collector), SCR = selective catalytic reduction, FGD = flue gas
desulfunzation
Chapter I
Page 29
21
In the year 1990, in Europe 65% of the catalysts were installed at the high dust
location and 35% at the tail end location Only in Japan a significant number of plants
equipped with high temperature precipitators are in use, because they need a higher
flexibility due to large differences in their coal quality Therefore they have 66% high
dust SCR plants and 34% low dust applications (15)
Catalyst Geometry. The market of SCR plants is dominated by two types of
catalyst geometries Extruded and selfsupported honeycomb catalysts, in the form of
squares or honeycombs, and plate type catalysts, which have a metal support covered
with the active substance The plate type catalysts have a higher resistance to erosion
and deposition of dust particles than honeycomb catalysts and are often used for high
dust installations Honeycomb catalysts are used in all positions
Catalyst Degradation. The lifetime of the catalyst dominates the cost of an SCR
plant Usually the replacement costs are higher than the operating costs Different types
of degradations limit the catalyst's lifetime Important are poisoning, formation and
deposition of solids, sintering and erosion
Alkali ions poison the active sites of most SCR catalysts (27, 28) These
elements are contained particularly in lignite and lubricants Arsenic oxides have also
been found to poison catalysts (27, 29, 30, 31) and selenium exhibits the similar
poisoning effect as arsenic If alumina is used as support, S02 can react with A1203 to
aluminium sulfate leading to a deactivation of the catalyst (32, 33)
An other problem caused by SOx is the formation and deposition of ammonium
sulfates/sulfites which can plug the downstream process equipment (4) The formation
of ammonium sulfates is a function of the flue gas temperature, the sulfur trioxide
concentration and the ammonia concentration (see Fig 1-6) SO3 is formed by catalytic
oxidation of S02 (34) and reacts with NH3 and water (see r20 and r21)
NH3 + S03 + H20 -» NH4HSO4 (r20)
2 NH3 + SOi + H20 -> (NH4)2S04 (r21)
Introduction
Page 30
22
1 10 100 1000
SO concentration/ppm
Figure 1-6. Equilibrium partial pressures of NH3 and S03 for ammonium sulfate
deposition
Below 480 K ammonium nitrate and nitrite can be formed homogeneously (see
r22). Ammonium nitrate has a boiling point of 483 K and ammonium nitrite explodes at
about 340 K (35). In some cases these solid salts lead also to problems in the
downstream equipment.
2 N02 + 2 NH3 + H20 -> NH4NO2 + NH4NO3 (r22)
Catalyst degradation by sintering occurs only at higher temperatures and reduces
the specific surface and the dispersion of the catalytically active material. The pore size
distribution is shifting to larger pores, but this will not have a great impact on the NO
conversion, due to the diffusion limitation at higher temperatures. In this range, the
conversion is proportional to the geometrical (external) surface (36).
Severe problems are caused by solid particles, which leads to physical damage of
the catalysts. This reduces the catalyst's lifetime and toxic substances of the catalyst
may get in the environment. An advantage of the abrasion is, that fresh catalyst is
Chapter I
Page 31
23
always on the top of the surface and the activity remains constant over the whole
catalyst's lifetime
1.3.4.2 Types ofcatalysts
Titania supported Catalysts. Titanium oxide based catalysts with vanadium
oxide and tungsten oxide as active components dominate the market for SCR catalysts
Titania is used in the form of anatase, because of the larger surface area of 50-120 m2/g
in comparison to less than 10 m2/g for the rutile phase The vanadia on titania catalysts
with typically 1-5 wt % V2Os are mainly installed in medium temperature (550 - 700 K)
applications Above 700 K the direct ammonia oxidation is significant and decreases die
selectivity to N2 and H2O At 725-775 K the anatase phase of Ti02 converts irreversibly
to rutile and the activity decreases For lower temperature applications higher vanadia
contents are necessary for sufficient activity
Platinum based Catalysts. In the low temperature range (450 - 525 K), Pt-based
catalysts are used Above 500 K significant amounts of N20 are produced Due to the
narrow temperature window this type of catalyst is not commonly used today
Zeolite Catalysts. In the high temperature range, above 650 K, zeolite catalysts
are suitable for SCR. Commercially available zeolite catalysts for SCR can operate at
temperatures till 800 K Zeolite catalysts are manufactured in granular form and also as
honeycomb type catalysts No additional active substances are added in contrast to die
catalysts used in SCR with hydrocarbons (see paragraph 1 4 and ref 16) Zeolite
catalysts for SCR is a German development and three SCR plants (3 x 35 MW) at
Sandereuth power plant are in operation since 1987 (16)
Several other types of catalysts for example iron based catalysts and activated
carbon are frequently used in commercial or test plants A good overview covering most
commercial catalysts and catalyst suppliers is given in reference 16.
Introduction
Page 32
24
1.3.4.3 Kinetics andMechanisms for vanadia containing catalysts
Many mechanistic studies concerning the selective catalytic reduction of NO
with NH3 were carried out with vanadia based catalysts. Generally, mechanisms are
based on a Langmuir-Hinshelwood reaction path involving adsorbed ammonia and nitric
oxide or an Eley-Rideal reaction path with weakly bound or gas phase nitric oxide are
assumed.
Langmuir-Hinshelwood mechanism. Based on IR-spectroscopy, mass-
spectrometry, XPS measurements and kinetic studies under reaction conditions, Takagi
et al. (37) postulated, that in the presence of oxygen, nitric oxide adsorbs in the form of
N02(ad). In the absence of oxygen nitric oxide was not adsorbed on the vanadia surface.
Oxygen was found to be essential for the reaction. They proposed that the reaction
proceeds via the two adsorbates, N02(ad) and NH4+(ad), which react on the catalyst
surface through a Langmuir-Hinshelwood mechanism to form N2 and H2O according to
reactions r23 - r26.
NO + Vi 02 -» ^-N02(ad) (r23)
^-OH + NH3 -> ^ O" NK,+(ad) (r24)
^ O" NIl,+(ad) + 2hN02(ad) -> N2 + 2 H20 + ^~0 (r25)
23-0 + H20 -> 2 ^-OH (r26)
Eley-Rideal mechanism. In contrast to the postulated mechanism of Takagi et
al., Inomata et al. (38) established the following mechanism for the selective catalytic
reduction under dilute gas condition in the presence of oxygen: NH3 is strongly
adsorbed adjacent to V5+=0 as NH4+(ad), whereas NO is hardly adsorbed on the
catalyst. Then, gaseous NO reacts with adsorbed NH3, i.e., NHt+(ad), to form N2, H20,
and V-OH. The V-OH species is reoxidized to V5+=0 by either gaseous 02 or bulk
V5+=0 species.
Chapter 1
Page 33
25
O OHII I + NH3
V^V Vg^ „
O 0 O fast
H20 + O2
OH OHI I
• N2
-H20
H H
NS \
H HI
O O
\r
N,
H'
i
O
+ NO
O,
H \.
! ,-H:n-
HIOI
^o-%'Vs-o^activated complex
Figure 1-7. Mechanism of the NO-NH3 reaction on the vanadium oxide catalyst
in the presence of oxygen proposed by Inomata et al. (38).
Miyamoto et al (39) investigated the mechanism by N tracers studies in a pulse
reactor over V2Os, supported V2Os and V2O4 catalysts Their results supported the
previously proposed mechanism in the presence of oxygen In absence of oxygen the
mechanism on the partly reduced vanadium oxide is almost the same At first NH3 is
strongly adsorbed at the Br0nsted acidic site, l e, Vs-OH, on the surface of the V204
catalyst Then, a gaseous NO attacks the adsorbed NH3 to form N2, H20, and a V-H
species The V-H species reacts readily with NO to form N20 and H2O, and vacant
vanadium ion sites are produced Although N2O is formed by the reaction of NO with
the V-H species a high selectivity to N2 and H2O can be achieved due to the successive
reaction of N2O with the V-H species leading to the formation of N2 and H20
Introduction
Page 34
26
OH+ NH3
>wVwV. / *\~0'
+ NO
- 1/2 N20- 1/2 H20
"O' "O' fast
H H
N/ \
H H
IO
trVV
HI
OHI N2
^O-V^Vs^/
"O' O H20
+ NO
O/ • \^
n\** IhX
H'' 'hIO
activated complex
Figure 1-8. Mechanism of the NO-NH3 reaction on the vanadium oxide catalyst
in the absence of oxygen proposed by Myamoto et al. (39).
lanssen et al. (40) investigated the mechanism of die selective reduction of nitric
oxide wim ammonia in the presence of labeled oxygen over pure and supported vanadia
catalysts. The results confirmed that lattice oxygen participates in the reaction. They
proposed a participation based on a reduction/oxidation mechanism. Water was formed
at two sites; the first part came from the reaction of gaseous nitric oxide and adsorbed
ammonia via an Eley-Rideal mechanism and the other came from a surface dehydration
process. They assumed that ammonia adsorbs differently on a group of two V=0 sites
and on a group of a V-OH site next to a V=0 site. The adsorption on the group of a
V-OH site next to a V=0 site leads to the mechanism proposed by Inomata et al. (38),
which is illustrated in Figure 1-7. On the other hand, they suggested that ammonia can
adsorb dissociatively on two adjacent V=0 sites, which involves breaking of the N-H
Chapter I
Page 35
27
bond Of ammonia Until now, the proposed NH2 species was not proved and remains
speculative
Recent investigations of vanadia-titania catalysts by in situ FTTR-spectroscopy
(41, 42) and by the analysis of the microkinetic (43) supported the mechanism proposed
by Inomata (38) The results of Tops0e (43) showed a direct correlation between the
concentration of the Br0nsted acid sites (associated wtdi V-OH surface groups) and the
NOx conversion No correlation was found for the Lewis acid sites, which were assumed
by Janssen et al (40) to be responsible for an alternative reaction path But the V=0
groups are also crucial for the catalytic activity Tops0e found a weakening of the V=0
bond, due to the NH3 adsorption, and she proposed the formation of an activated
complex by the partial transfer of H to the vanadyl group, in accordance to the reaction
scheme proposed by Inomata (see Fig 1-7) She proposed two separate catalytic
function for the vanadia-titania catalyst Figure 1-9 illustrates the two cycles of die acid
and redox function of the catalyst, which are based on the same mechanism as proposed
by Inomata
N2 + H20
Acid Redox
Figure 1-9. Catalytic cycles for the SCR reaction of NO by NH3 over vanadia-
titania catalysts in the presence of oxygen proposed by Tops0e (43).
Introduction
Page 36
28
1.3.4.4 Kinetics andMechanisms for chromia containing catalysts
Besides investigations with vanadia containing catalysts, in this work chromia on
titania catalysts were in the focus of our attention In comparison to die numerous
studies concerning vanadia based catalysts only few investigations were earned out for
chromia containing catalysts
Based on investigations of the kinetic behavior and isotope labeling studies
Niyame et al (44, 45) proposed a mechanism involving reactions r27 - r32 Due to the
significant improvement in the catalytic activity by preoxidation, they suggested surface
oxygen as the active site and proposed the formation of nitrous oxide via the reaction of
two NO molecules or via the reaction of NO with NH3
2 Cr=0 + NO + NH3 -> Cr-O-NO + Cr-0-HNH2 -» N2 + H20 +Cr=0 + Cr-OH (r27)
2 Cr-OH + 2 NO -> 2 Cr-O-NHO -> 2 Cr=0 + NNO + H20 (r28)
2NO + Cr -> NNO + Cr=0 (r29)
N20 + Cr -> N2 + Cr=0 (r30)
2 Cr=0 + NO + NH3 -> Cr-O-NO + Cr-0-HNH2 -> Cr + Cr-OH + NNO + H20 (r31)
2 Cr-OH -> Cr=0 + Cr + H20 (r32)
More recently, Duffy et al (46) earned out activity studies and isotopic labeling
expenments m the absence and presence of oxygen using amorphous and crystalline
chromia catalysts. They studied the effect of water on the activity and selectivity and
tentatively suggested a mechanism, according to reactions r33 -r44, which considers
also the direct oxidation of ammonia and the reactions involving N20.
Cr=0 + NH3(ad) -» Cr-OH + NH2(ad) (r33)
NH2(ad)+NO(ad)->N2 + H20 (r34)
2 Cr-OH <-> Cr=0 + Cr + H20 (r35)
Chapter I
Page 37
29
2Cr + 02 -» 2 Cr=0 (r36)
NH(ad) + NO(ad) + Cr=0 -> N20 + Cr-OH (r37)
NH(ad) + NH(ad) + 2 Cr=0 -»N2 + 2 Cr-OH (r38)
NH(ad) + 2Cr=0-»NO + Cr-OH + CrD (r40)
N(ad) + Cr=0(ad) -» NO + Cr (r41)
3N20 + 3CrD-»3N2 + 3Cr=0 (r42)
2NH3 + 3Cr=0-*N2 + 3H20 + 3CrD (r43)
3 N20 + 2 NH, -> 4 N2 + 3 H20 (r44)
1.4 Research Frontiers
1.4.1 The direct decomposition of NO to its elements
The catalytic decomposition of NOx into its elements in the presence of oxygen
would be the ideal method for controlling NOx emissions.
2 NOx -> N2 + x 02 (r45)
This reaction is thermodynamically strongly favored at temperatures below
1000 K. Despite the fact that numerous catalytic systems were investigated until now,
no catalyst was found, which was able to overcome the kinetic barrier under lean
exhaust conditions. Promising results were published by Iwamoto et al. (47, 48). They
found that Cu exchanged zeolite catalysts decompose NOx directly to N2 and 02. With
rising temperatures the reaction passes through a maximum at 750 - 850 K. Further
studies by Li and Hall (49, 50) showed a strong inhibition by oxygen which decreases
with rising temperatures. Water vapor inhibits reversibly the NO decomposition (51)
and the presence of S02 completely poisons the active sites, requiring regeneration at
higher temperatures. Due to the typical water concentration of combustion effluents in
Introduction
Page 38
30
the range of 5 - 15 %, an industrial implementation of mis catalytic system is not
possible In spite of the setbacks the search for a suitable catalyst is still on because a
NOx decomposition catalyst which needs no reducing agent would be a breakthrough of
tremendous ecological and economical importance
1.4.2 New developments in the selective reduction of NOx with NH3
At present the selective catalytic reduction of nitrogen oxides with ammonia on
vanadia/titania catalysts is the most frequently used catalytic technique to remove
nitrogen oxides Recently, mam development efforts concern ammonia slip,
improvement of the catalyst durability, the decrease of the S02 oxidation, pressure drop,
the handling and storage of ammonia and the catalytic performance, especially in the
lower temperature range (below 525 K)
To minimize the ammonia slip the NH3 distnbution system has to be improved
by optimizing the NH3 injection and the mixing section (52)
Poisoning and abrasion are the key factors which determine the durability of the
catalyst The influence of the catalyst location on the catalyst lifetime and the catalyst
degradation by poisoning are described in paragraph 13 4 1 Most commercial catalysts
contain additives like WO3 or Mo03 which increase the poison resistance but have also
an impact on the catalyst's activity (53) Other additives are used to harden the surface
and to improve the mechanical strength of the catalyst
The oxidation of S02 is an undesired side reaction which is catalyzed by vanadia
catalysts (5) The oxidation of S02 is slow in companson to the reduction of NO with
NH3 and is only significant for the temperature range at which the selective catalytic
reduction of NO with NH3 is mass transfer controlled In that case the NO conversion is
proportional to the geometric surface whereas the oxidation of S02 to SO3 uses the
whole specific surface and is proportional to the mass of me catalyst (54, 55) A
decrease in the S02 oxidation can be achieved by the development of thin-walled
monoliths, by low vanadia loadings or by the addition of W03
Chapter I
Page 39
31
Pressure drop caused by the down stream equipment after a turbine or a diesel
engine can markedly affect the overall efficiency To minimize the pressure drop the
cross-sectional area of the catalyst and the wall thickness have to be optimized.
The problem of handling and storage of ammonia can be solved by the use of
urea But for a non stationary application me control of the NH3 supply is difficult due
to the dynamic behavior of the temperature and exhaust gas flow and me ammonia
storage capacity of the catalyst At the moment, a NH3 metenng system to avoid NH3
slip which allows also a high conversion would be too complex and expensive for
commercial applications in trucks or cars and needs further investigations
An increase in the intnnsic activity can be achieved by optimizing die
morphological and chemical properties of new catalysts In the lower temperature range
the widely used vanadia supported on titania catalyst exhibits a low activity and a slow
dynamic behavior (56) Recently, catalytic systems based on pillared mterlayered clays
(57, 58), chromium oxides (59, 60), aerogels (61 - 63), activated carbon (64, 65) and
grafted vanadia on titania (66) were investigated.
1.4.3 Using hydrocarbons as reducing agent
Since the last years, the use of hydrocarbons instead of ammonia or urea as
reducing agents is in me focus of the research with regard to mobile applications such as
diesel and lean-burn engines Important drawbacks of ammonia as reductant are difficult
handling, costs and ammonia slip
The main development direction in the SCR with hydrocarbons is related to
zeohtic catalysts (67) Among this group of catalysts, Cu-ZSM-5 is me most promising
catalytic system But the addition of water to the stream causes an instantaneous
reversible deactivation effect Furthermore catalysts based on acidic supports, such as
alumina, silica-alumina or ztrconia, doped with transition metals, have been found as
another group of active catalysts for SCR applications A major problem ansing widi all
Introduction
Page 40
32
the catalysts mentioned is the insufficient selectivity because the hydrocarbons are
mainly burned by the oxygen present in die exhaust
Although considerably research efforts are cunently undertaken for the
development of HC-SCR catalysts, a large gap remains to the practical realization due to
numerous selectivity, inhibition and durability problems In addition, recent
investigations in our group revealed the formation of HCN and other harmful
compounds over Cu-ZSM-5 and alumina catalysts in the selective catalytic reduction of
nitrogen oxides by olefins which is a further severe hurdle for an industrial application
(68 - 70)
1.5 Scope of the Thesis
The aim of this study was to develop novel catalytic systems for me selective
catalytic reduction of NO with NH3 wiffi an improved activity, particularly in the low
temperature range From preliminary measurement widi vanadia-titania aerogels (61,
62) and chromia on titania catalyst (60), we assumed a high potential of these catalytic
systems, especially at low temperatures These types of catalyst were not yet
investigated under real SCR conditions There was a lack of knowledge about the
kinetic behavior, the long time stability and the resistance against poisoning
The kinetic behavior in the low temperature range of a commercial vanadia
based catalyst was studied and modeled in order to have a base for comparing the novel
catalytic systems with that of catalysts reflecting the state of me art The ultimate goal
was to uncover possibilities to improve the structural and chemical properties of the
novel catalysts under real SCR conditions
Chapter I
Page 41
33
1.6 References
1 Heinrich, D and Hergt, M "dtv-Atlas zur Okologie', 2rd Ed, p 65, Deutscher
Taschenbuch Verlag GmbH & Co KG, Munchen, 1991
2 Singh, H B Environ Sci Technol 21,320(1897)
3 Cox, R A and Penkett, S A in "Acid Deposition' (Beilke, S and Elshout, A
J ), p 56, D Reidel Publishing Co ,Dordrecht, 1983
4 Bosch, H and lanssen, F Catalysis Today 2, 369 (1988)
5 Zeldovich, J Acta Physicochimica USSR 21,577 (1946)
6 Zeldovich, J Compt Rend Acad Sci USSR 51, 217 (1946)
7 Fenimore, C P "13th Int Symp on Combustion, 1970, Pittsburgh", p 373, The
Combustion Institute, Pittsburgh, 1971
8 Fenimore, C P Combust Flame 19, 289 (1972)
9 CONCAWE 1989 "Trends in motor vehicle emissions and fuel consumption
regulation - Special task force on assesment of trends in motor vehicle emission
control', p 86, COCAWE, The Hague, Netherlands, 1989
10 Bundesamt fur Umwelt, Wald und Landschaft (BUWAL) in "Schnftenreihe
Umwelt Vom Menschen verursachte Luftschadstoff-Emissionen in der Schweiz
von 1900 bis 2010"
Vol 256, BUWAL, Bern, Schweiz, 1995
11 Bodenstein,M Z Phys Chem 100,68(1922)
12 Hoigne, J "Umweltchemie I", ETH, Zunch, Schweiz, 1990
13 Roberts, J M Atmospheric Environment 24A, 243 (1990)
Introduction
Page 42
34
14 Thuriow, G in "Technological Responses to the Greenhouse Effect" (The Watt
Committee on Energy), Vol 23, Elsevier Science Publishers LTD, London and
New York, 1990
15 IPPC Intergovernmental Panel on Climate in "Climate Change"(Houghton, J
T, Jenkins, G J and Ephraums, J J), Cambridge University Press, Cambridge,
UK, 1990
16 NDC in "Nitrogen Oxides Control Technology Fact Book" (L L Sloss et al),
Noyes Data Corperation, Park Ridge, New Yersey USA, 1992
17 Colannino, J Chemical Engineering, 100 (1993)
18 Makansi, J Power 11, 11 (1993)
19 Wood, S C Chem Eng Prog ,32 (1994)
20 Kasuya, F , Glarborg, P , Johnsson, J E and Dam-Johansen, K Chem Eng Sci
50, 1455 (1995)
21 Engelhard Corporation Research and Development in "Catalytic Air Pollution
Control Commercial Technology"
(Heck, R M and Farrauto, R J), Van
Nostrand Remhold, New York, U S A,1995
22 Cho, S M Chem Eng Prog ,39(1994)
23 Kato, A , Matsuda, S, Kamo, T
,F Nakajima, Kuroda, H and Manta, T J
Phys Chem 85,4099(1981)
24 Odenbrand, C U I, Andersson, L A H, Brandin, J G M and Lundin, S T
Appl Catal 27, 363 (1986)
25 Kobel, M, Elsener, M and Eicher, H P BWK/TU/Umwelt/Special
Luftreinhaltung , 3, E24 (1991)
26 Kobel, M VDI Benchte 1019, (1993)
Chapter 1
Page 43
35
27. Chen, J. "Preparation, characterization, and deactivation of die catalysts for the
selective catalytic reduction of NO with NH3.", Dissertation, Buffalo, U.S.A.,
1993.
28. Chen, J. P. and Yang, R. T. J. Catal. 125,411 (1990).
29. Hums, E. and Spitznagel, G. W. ACS Symosium Series 587,42, (1995)
30. Hilbrig, F.; Gobel, H. E.; Knozinger, H.; Schmelz, H. and Lengeler, B. J. Catal.
129,168(1991).
31. Gutberlet, H. VGB Kraftwerkstechnik 68, 287 (1988).
32. Nam, I. S.; Eldridge, J. W. and Kittrell, J. R. Ind. Eng. Chem. Prod. Res. Dev.
25, 192 (1986).
33. Vollenweider, J.; Eyres, A. and Holbrook, R. P. Trans IMarE 106, 163 (1994).
34. Svachula, J.; Alemany, L. J.; Ferlazzo, N.; Forzatti, P. and Tronconi, E. Ind.
Eng. Chem. Res. 32, 826 (1993).
35. Weast, R. C et al. "Handbook of Chemistry and Physics", 67lh Ed., CRC Press
INC., Florida,U.S.A., 1987.
36. Prins, W. L. and Nuninga, Z. L. Catalysis Today 16, 187 (1993).
37. Takagi, M.; Kawai, T.; Soma, M.; Onishi, T. and Tamaru, K. J. Catal. 50, 441
(1977).
38. Inomata, M.; Miyamoto, A. and Murakami, Y. J. Catal. 62, 140 (1980).
39. Miyamoto, A.; Kobayashi, K.; Inomata, M. and Murakami, Y. J. Phys. Chem.
86,2945(1982).
40. Janssen, F. J. J. G.; v. den Kerkhof, F. M. G.; Bosch, H. and Ross, J. R. H. J.
Phys. Chem. 91, 5921 (1987).
41. Topsoe, N. -Y. /. Catal. 128,499 (1991).
Introduction
Page 44
36
42 Schneider, H , Tschudin, S, Schneider, M , Wokaun, A , Baiker, A
J Catal 147, 14 (1994)
43 Tops0e, N -Y Science 265, 1217 (1994)
44 Nnyama, H , Murata, K , Ebitam, A and Echigoya, E J Catal 48, 194 (1977)
45 Niiyama, H , Murata, K and Echigoya, E J Catal 48, 201 (1977)
46 Duffy, B L, Curry-Hyde, H E, Cant, N W and Nelson, P F J Catal 154,
107 (1992)
47 Iwamoto, M , Yokoo, S, Sakai, S and Kagawa, S J Chem Soc Faraday
Trans 1,1629(1981)
48 Iwamoto, M , Furukawa, H , Mine, Y , Uemura, F, Mikunya, S and Kagawa
M,S J Chem Soc, Chem Commun
,1272 (1986)
49 Li, Y and Hall, W K J Phys Chem 94, 6145 (1990)
50 Li, Y and Hall, W K J Catal 129, 202 (1991)
51 Iwamoto, M , Furakawa, M and Kagawa, S in "New Developments in Zeolite
Technology' (Murukami, Y, Ijima, A, Ward, J W), p 943, Elsevier,
Amsterdam, 1988
52 Sulzer Brothers Limited, The Chemical Engineer 30, 17 (1993)
53 Chen, J P and Yang, R T Appl Catal 80, 135 (1992)
54 Binder-Begsteiger, I Catalysis Today 27, 3 (1996)
55 Beeckman,J W andHegedus, L L Ind Eng Chem 30,969(1991)
56 Lowe, P A ACS Symosium Series 552, 205, (1994)
57 Yang, R T, Chen, J P
, Kikkinides, E S and Cheng, L S Ind Eng Chem 31,
1440 (1992)
58 Yang, R T and Li, W J Catal 15,414 (1995)
Chapter I
Page 45
37
59 Curry-Hyde, E and Baiker, A Ind Eng Chem Res 29, 1985(1990)
60 Engweiler, J, Nickl, J
, Baiker, A, Kohler, K, Schlapfer, C W and von
Zelewsky, A J Catal 145, 141 (1994)
61 Engweiler, J and Baiker, A Appl Catal A General 120, 187(1994)
62 Schneider, M, Maciejewski, M , Tschudin, S
, Wokaun, A and Baiker, A J
Catal 149,326(1994)
63 Amindis, M D, Na, B K and Ko, E I ACS Symostum Series 587, 32, (1995)
64 Mochida, I, Kawano, S, Hironaka, M , Yatsunami, S
, Korai, Y , Matsumura,
Y and Yoshikawa, M Chem Lett ,385(1995)
65 Mochida, I, Kawano, S, Kisamon, S
, Fujitsu, H and Maeda, T Carbon 32,
175 (1994)
66 Baiker, A and Wokaun, A Naturwissenschaften 76, 168 (1989)
67 Shelef, M Chem Rev 95, 209 (1995)
68 Radtke, F, Koppel, R and Baiker, A / Chem Soc, Chem Commun,421
(1995)
69 Radtke, F , Koppel, R and Baiker, A Env Sci & Techn 29, 2703 (1995)
70 Radtke, F , Koppel, R and Baiker, A Catal Lett 28, 131 (1994)
Introduction
Page 46
Leer - Vide - Empty
Page 47
2
Experimental
2.1 Apparatus
Catalytic tests were earned out in a fully computer controlled apparatus
equipped with a continuous tubular fixed-bed microreactor A process flow diagram of
the reactor system is shown in Figure 2-1 The flows of the individual reactant gases
were controlled by means of mass flow controllers (MFC) and mixed in a hot box
(thermostated at 413 K) Water was fed by a step-motor pump and evaporated into die
preheated feed stream through a micro capillary The reaction gas mixture employed in
kinetic expenments consisted of 0-1000 ppm NO (99 0%, PanGas), 0-1000 ppm NH3 (5%
NH3 (99 98%) in N2 (99 999%), CarbaGas), 0-10% H20 (bidest), 0-15% 02 (99 995%,
PanGas), 0-10% C02 (99 99%, PanGas) and 0-90 ppm S02 (15% S02 (99 98%) in N2
(99 999%), PanGas) in N2-balance (99 995% PanGas) The conversion of NO to N02 in
the gas mixing unit was less man 3 % as evidenced by measurements wrth an empty
reactor Fast responding 3-way solenoid valves allowed rapid changes in the
concentrations of O2, NH3 and NO The maximum adjustable gas flow was 25 L
(NTP)/min A bypass controlled by an additional MFC was used for gas flow rates up to
1000 ml(NTP)/min To avoid condensation in die system, all tubings after die hot box
Experimental
Page 48
40
N, O, 02 NO NO NH, NH, CO, SOV V V V
Chapter 2
Page 49
41
Figure 2-1. Apparatus used for the catalytic tests.
1. mass flow controller, 2. valve to equalize back pressure, 3. rotameter for
fine adjusting the back pressure, 4a. solenoid valve for rapid changes in
concentration, 4b. pneumatic ball valve to bypass the reactor, 4c-d.
pneumatic ball valves to bypass the gas cell, 4e. ball valve to adjust flow
rates below 1000 ml(NTP)/min, 5. relief pressure controller, 6. step-motor
pump, 7. thermostated box (413 K), 8. fixed bed reactor, 9. tubular
furnace, 10. filter (2 urn), 11. digital temperature controller, 12. long path
gas cell, 13. safety relief valve, 14. back pressure controller, 15. vent.
were heated at 413 K. The resulting gas stream could either be directed to the reactor or
to the analysis system by means of a pneumatic ball valve. Before entering the reactor,
the gas mixture was heated to reaction temperature in the first part of the tubular
furnace. The quartz glass reactor with an inner diameter of 7.5 mm was placed in the
middle of the heated section. The catalyst powder was placed on a porous quartz filter
and the free space over the catalyst bed was filled with quartz wool to prevent a radial
velocity profile in the bed. The pressure in the reactor was kept constant at 1.1-105 Pa
for all experiments by an electronic pressure controller.
Experimental
Page 50
42
2.2 Analysis
The temperature of the reactor effluent was adjusted to 413 K in a second hot
box arid the product stream was then either directed to the analysis system or to the
purge. A filter (Nupro 2 um) prevented solid particles from entering the analysis system,
which consisted of a Fourier transform infrared (FT-IR) spectrometer (Perkin Elmer
System 2000) and a quadrupole mass spectrometer (GAM 400 Balzers). The FT-IR
spectrometer was equipped widi a multiple pass gas cell operated at 415 K (Infrared
Analysis, 100 ml volume, 2.4 m path length) and a liquid nitrogen cooled MCT detector.
The pressure in the gas cell was measured by a pressure transducer (Haenni ED 513). 02
and N2 were measured with the mass spectrometer using die QuadStar+ software by
Balzers (1), whereas NO, N02, N20, NH3, S02, C02, CO and H20 were analyzed by
FT-IR spectroscopy. For each spectrum 350 scans with a resolution of 2 cm"1 were
taken. After each measurement the gas cell was purged with nitrogen and a reference
spectrum was taken. For calibration two sets of spectra (one for water concentrations
below 2%) of specially prepared gas mixtures were recorded for each component. Based
on the characteristic absorption frequencies of the different compounds (see Table 2-1)
the spectral ranges specified in Table 2-2 were used for quantification. The software
package QUANT+ by Perkin Elmer,which is based on a partial least square method,
was used to calculate the concentrations of the feed and effluent gases (2, 3). The
accuracy in the concentration measurements was within ± 5% for FT-IR spectroscopy
and within ± 2% for mass spectroscopy, respectively, as evidenced by measurements
with calibration gas mixtures.
Chapter 2
Page 51
43
Table 2-1. Components measured by FT-IR spectroscopy.
Component Location of bands or lines
(cm"1)
Comments
H20 Almost everywhere in the
spectrum
Interferes witii detection of nearly
everything else.
co2 2400-2200,2077,741
CO 2250-2040 Small amounts of CO (<300 ppm) are
difficult to detect if N20 or C02 (>5%) are
present.
NO 1960 - 1780,
1875 (Q branch)
Interference with water.
N02 2920, 1629, 1595 Strong bands at 1620 cm'1 and 1595 cm'1,
which are obscured by water and a weaker
one at 2920 cm"1 with no interference with
water.
N20 2581, 2238, 2214, 1302,
1271
Interference widi CO2 around 2220 cm"1
and with water around 1280 cm"1, weak
band at 2581 cm'1.
NH3 3500 - 3200, 1800 -1400,
1250-700
Strong bands at 967 cm"1 and 931 cm"1,
which have little interference with water.
so2 1374, 1361, 1344 Interference widi water.
Experimental
Page 52
44
Table 2-2. Spectral Regions used for Quantification.
method 1. 0-2000 ppm H20
[cm1]
method 2. 0.2-10 % H20
[cm1]
2230-2093 2945-2830
1920-1873 2300-2165
1610-1580 2155-2145
1546-1400 2110-2093
1360-1342 1920-1873
978-900 1610-1580
750-730 1360-730
2.3 Kinetic Modeling
The model parameters were estimated from the experimental data by linear and
non-linear regression analysis (4, 5, 6). For the non-linear regression analysis me
simulation software "Simusolv" (version 3.0-120, Dow Chemical Company) was used
(7). As objective function the maximum likelihood of the partial pressures of die relevant
gases was chosen (8). The used simulation software maximized the Log Likelihood
Function (LLF, equation 2-1), which is equivalent to maximizing the Likelihood Function
itself. The Likelihood Function is based on me assumptions mat replicated experimental
measurements result in values which are normally distributed and that the errors in the
Chapter 2
Page 53
45
measured values are independent of each other. In die used Simusolv version the
number of estimated parameters was not taken into consideration by me estimation of die
standard deviation s (equation 2-2).
LLF = <!> = --
2ln(2n)+l + ln
X(z,-f,)2
tfc^ (2-1)
JJ
(2-2)
In practice, the experimental error involves an absolute error and an error relative
to the magnitude of the measured value. In the used software, the degree of dependence of
s is taken into consideration by an adjustable parameter y, called the heteroscedasticity
parameter. The modified standard deviation of die observation i is given by uie square root
of equation 2-3 and the objective function is expressed by equation 2-4. The parameter y is
optimized in the range of 0 - 2 togedier widi the other adjustable parameters. If y is zero,
maximizing the 4> is equivalent to maximizing the sum of squares of die residuals, and the
objective function is controlled by the residuals for die high value of me variables. Even
large relative errors in die small values will have very little influence. In contrast, if y is 2,
me relative errors or residuals are important in determing the 4>. Thus the small values of
the variables are just as influential in controlling die objective function as die large ones.
Experimental
Page 54
46
_,rfOv(',-f,)
S2=f,'wir
*= -f(»"(2n) + l)-^lnn
('-0
f,rJSKf,) (2-4)
The modified LLF was used if die data, involved in die model, varied over a wide
range, else die obtained value for y was zero or near by zero. In this case the LLF
according to equation 2-1 was applied.
The discrimination between different models and die judging of the significance of
die model parameters were made using die LLF and variance analysis. The F-test was
carried out widi a significance level of a=0.05 and if several models were not rejected due
to die F-test, die model with fewer adjustable parameters was chosen. The standard
deviation of die experimental error o (equation 2-5, 9) was determined separately for bom
calibration ranges (see paragraph 2.2), because the experimental error of the concentration
measurement was strongly influenced by the water concentration. If the parameter
estimation included data widi water concentration above 2%, always the estimated
standard deviation of die experimental error for the calibration range over 2% water was
applied.
(2-5)n-1
Chapter 2
Page 55
47
The standard deviation of die estimated parameters was given by the square root of
die diagonal element of die vanance-covanance matnx, which was estimated by die
inverse of the Hessian matnx The Hessian matnx is defined as die matnx of second
partial denvatives of die LLF widi respect to each pair of parameters. In die applied
software die Gauss approximation to the Hessian was used
The fourth-order Runge-Kutta method (10) was used for die numencal integration
and me procedure of Nelder-Mead direct search method (11) for maximizing die objective
function
2.4 Notation
LLF = Logandim of the Likelihood function
4> = objective function
n = number of measurements
z = measured partial pressure, Pa
z = average value of the measured partial pressure, Pa
f = predicted partial pressure, Pa
s = estimated standard deviation of the model prediction, Pa
y = heteroscedasticity parameter
0 = estimated standard deviation of me experimental error, Pa
1 = ith data point
j = jth measurement of a data point
Experimental
Page 56
48
2.5 References
1. Balzers AG, "User's Guide QUADSTAR PLUS V 3.0", Balzers, FL, 1990.
2. Perkin-Elmer Ltd., "Quant+ User' Guide", Beaconsfield, UK, 1992.
3. Griffiths P. R. and de Haseth J. A., "Fourier Transform Infrared Spectrometry",
John Wiley & Sons, Inc., New York, U.S.A., 1986.
4. Bard, Y., "Nonlinear Parameter Estimation", Academic Press, Inc., Orlando,
U.S.A., 1974.
5. Radcowsky, D. A., "Nonlinear Regression Modeling", Marcel Dekker, Inc., New
York, U.S.A., 1983.
6. Seber, G. A. F. and Wild, C. J., "Nonlinear Regression", John Wiley & Sons,
Inc., New York, U.S.A., 1989.
7. The Dow Chemical Company, "Simusolv Reference Guide", Midland, U.S.A.,
1989.
8. Edwards, A. W. F., "Likelihood", Cambridge University Press, Cambridge,
1987.
9. Ineichen, R., "Stochastik", 6. Aufl., p. 19, Raeber Verlag, Luzern und Stuttgart,
1984.
10. Collatz, L., "Numerische Behandlung von Differentialgleichungen", 2. Aufl.,
Springer, Berlin-Heidelberg-New York, 1955.
11. Nelder, J. A. and Mead, R. A., Comp. J., 7, 308 (1965).
Chapter 2
Page 57
3
Vanadia-based commercial catalyst:Analysis and modeling of the kinetics
Abstract
The kinetics of die selective catalytic reduction of nitnc oxide by ammonia have
been investigated over a vanadia-based commercial DeNOx-catalyst For temperatures
exceeding 473 K the kinetic data are descnbed well widi a model which is based on an
Eley-Rideal mechanism Below 473 K the conversion is higher man predicted with this
model, probably due to the contnbution of an additional reaction pattiway, which occurs
only at low temperatures Regarding me influence of water and oxygen on SCR, 02
accelerated and H20 decreased the reaction rate The addition of up to 2% H2O to me dry
feed notably reduced die rate of NO conversion The effect levels off for higher H2O
concentrations, and between 2 5% and 7 5% H2O no significant dependence was
perceptible Similarly, die conversion of NO is almost independent on O2 for
concentrations between 4% and 10% Lower oxygen concentrations resulted in a marked
decrease of the catalytic activity The estimated activation energies for die dry and wet
feed amounted to 87 kJ/mol ± 3 kj/mol and 99 kJ/mol ± 9 kJ/mol, respectively (95%
confidence limits)
Vanadia-based commercial catalyst
Page 58
50
3.1 Introduction
In paragraph 1.3 it was mentioned that die selective catalytic reduction (SCR) by
ammonia is the most widely employed technique for the removal of NO„ from stationary
combustion sources. Several kinetic and mechanistic studies for vanadia containing
catalysts are published in the literature (1). Some of them have been performed on the
basis of empirical power-law rate equations (2-4). For a well defined catalyst and with
no variation of the experimental parameters an empirical model is sufficient for the
reactor design (5), but the determined kinetic parameters have limited physical or
chemical background and are not suitable for being used in a wide experimental range.
Including mechanistic information in the kinetic approach usually results in more global
models. Most of mem are based on an Eley-Rideal or a Langmuir-Hinshelwood
mechanism (see paragraph 1.3.4.3). On the basis of IR an Eley-Rideal type mechanism
involving gaseous or weakly adsorbed nitric oxide and ammonia adsorbed as NH4+ was
proposed by Inomata et al. (6) and Miyamoto et al. (7). Janssen et al. (8) further
supported this mechanism by transient isotopic studies with labeled oxygen and Gasior
et al. (9) found from IR and XPS measurements that the reaction proceeds via
participation of ammonia adsorbed on Br0nsted acid sites. In contrast, a Langmuir-
Hinshelwood type mechanism involving NO adsorbed as N02 and ammonia adsorbed as
NJV was favored by Takagi et al. (10). Srnak et al. (11) concluded from TPR/TPD
studies that depending on die reaction conditions bom reaction mechanism are effective
for the SCR of NOx and proposed an activation energy, amounting to about 84 kJ/mol,
independent of die reaction mechanism. Under typical SCR reaction conditions die Eley-
Chapter3
Page 59
51
Rideal mechanism was expected to be dominant The adsorption of NO under reducing
conditions was also proposed by omer groups (12, 13) Recently, Tufano and Turco (14)
reported an underestimation of die NOx conversion at lower temperatures The aumors
postulated a reaction mechanism involving die formation of a relatively stable
nitrosamidic intermediate The resulting rate equation is similar to the equations based on
die assumption of a Langmuir type adsorption ofNO
The most studies of the intrinsic kinetics in die selective catalytic reduction of NO
widi NH3 were earned out for temperatures above 573 K (15-17) In practice, using
honeycomb or plate type catalysts, die kinetics in this temperature range are usually
determined by mass transfer limitation Only in low temperature applications is the overall
reaction rate dominated by the intrinsic kinetic In order to explore me kinetic behavior in
the relevant temperature range, we have first studied systematically me influence of all
important exhaust components on die kinetics and developed a model for temperatures
below 573 K Additionally the results of die commercial catalyst were used as a reference
for subsequent expenments with catalysts designed in our laboratory
3.2 Experimental
A commercial catalyst (ZERONOX®, Katalysatorwerke Huls GmbH) containing
T1O2 (>70%), V205, WO3 and M0O3 was used In industnal applications die catalyst is
used in die form of honeycombs The BET surface area determined by N2-physisorption at
77 K using a Micrometncs ASAP 2000 instrument amounted to 55 m2/glM!liySt Before die
tests me catalyst was crushed and calcined for 2h at 623 K in a flow of 20% oxygen
(99 995%, PanGas) in nitrogen (99 995% PanGas) This pretreatment was repeated at die
Vanadia-based commercial catalyst
Page 60
52
start of each test senes With this conditioning it was possible to obtain reproducible
activity measurements and no activation or deactivation phenomenon was perceptible The
catalytic studies were earned out in the continuous tubular fixed-bed microreactor
descnbed in paragraph 2 1 The steady-state was established for all measurements The
reaction gas mixture consisted of 1000 ppm NO (99 0%, PanGas), 300-1000 ppm NH3
(99 98%, PanGas), 0-7 5% H20 (bidest), 0-11 5% 02 (99 995%, PanGas), 0-10% C02
(99 99%, PanGas) and 0-90 ppm SO2 (15% S02 (99 98%) in N2 (99 999%), PanGas) m
N2-balance (99 995% PanGas) Standard expenments were earned out using 0 4 g of
catalyst (180-300 (im sieve fraction) and a reactant flow rate of 200-1000 ml (NTP) mm'
(60'000-300'000 h'
(NTP) GHSV ) at a constant pressure of 1 1 bar in the temperature
range 393-563 K The model parameters were estimated from die expenmental data by
linear and non-linear regression analysis as descnbed in paragraph 2 3 As objective
function die maximum likelihood of die NO partial pressure was chosen
3.3 Results
3.3.1 Mass and heat transfer
The small particle size (180 - 300 p.m) in companson to the reactor diameter
(7 5 mm) prevented significant bypassing along the walls The quartz wool plug on top
of the catalyst bed ensured that no radial gas velocity profil was established This
expenmental set up let us assume tiiat plug flow was established over the whole catalyst
bed, which was additionally confirmed by measurements with varying die catalyst bed
height Theoretical calculations using the criterion of Weisz and Prater (18) indicated
that no internal mass transfer limitation occurred in the investigated temperature range
Chapter 3
Page 61
53
Experiments with larger catalyst particle sizes (300 - 500 |im) showed no influence on
the catalytic behavior and confirmed the results of the theoretical calculations The
calculated maximum adiabatic temperature rise for a feed containing 1000 ppm NO was
about 13 K The measured expenmental temperature raise over die catalyst bed for full
conversion at the highest space velocity amounted to 1 5 K Because of the small
particle size and the small temperature increase, no significant temperature gradients in
the catalyst bed and in die catalyst particles had to be taken into account
3.3.2 Catalyst stability
No significant deactivation was perceptible dunng 24 hours time on stream If
the catalyst was not calzinated before die tests (see paragraph 3 2), the catalyst exhibited
a lower activity at the beginning of the measurements Within several hours the activity
of the uncalzinated catalyst approach the activity of the calzinated sample by exposing it
to the SCR feed stream The velocity of this process depends on the oxygen
concentration, the catalyst temperature and the water concentration In the practice the
observed lifetime of the catalyst, dunng which no significant deactivation is observed,
amounts to 2-4 years
3.3.3 Influence of space velocity
Figure 3-1 shows the conversion of NO versus increasing catalyst weight per gas
flow (W/F) for temperatures in the range 473-513 K Widi raising temperature the
influence of space velocity on NO conversion increases The measured conversions are
in good accordance with the simulated conversions based on the model descnbed in
Vanadia-based commercial catalyst
Page 62
54
paragraph 3 3 8 Integral analysis of the data also showed that a first order kinetic in NO
descnbes the experimental behavior properly
m A/* /kg s m-3cat cat
Figure 3-1. The influence of the gas flow per catalyst weight on the conversion.
473 K, • 493 K, 513 K, — simulated Feed 10% 02, lOOOppm
NO, 1000ppmNH3, balance N2, flow rate = 200-1000 ml(NTP)/min,
catalysts weight = 0 4 g
3.3.4 Influence of water
Without water in die feed die catalyst showed high activity for the reduction ofNO
even at low temperatures as emerges from Figure 3-2 Addition of 2 5% water
significantly reduced die activity Similar behavior of vanadia/titania catalysts is descnbed
by odier audiors (19-22) The audiors observed an inhibition by water below 653 K and a
decrease of the conversion of NO above dus temperature Figure 3-2 also shows that a
further increase of die amount of H20 up to 7 5% resulted in no measurable loss of
activity, indicating mat NO conversion is almost independent of die H20 concentration
Chapter3
Page 63
55
under practical SCR conditions (5-15% H20) Measured activation energies for me dry
and wet feed amounted to 87 kJ/mol ± 3 kJ/mol and 99 kJ/mol ± 9 kJ/mol, respectively
(95% confidence limits)
1 0
o2•- 06O
c
o
</J 04
CD>
8 02
00
>—-
\
ik
1 1 1 1 1 1 1 1 1 1 1 1 1 1
H O concentration /%2
Figure 3-2 Conversion of NO versus H20 concentration in the feed.
• 463 K, 483 K, T 500 K, 520 K Feed 10% 02, 1000 ppm NO,
1000 ppm NH3, 0%-7 5% H20, balance N2, flow rate = 500 ml(NTP)/min
3.3.5 Influence of oxygen
The oxygen concentration was vaned in the range 0%-l 1 5% Without oxygen in
die feed the reaction rate was almost completely suppressed in die investigated
temperature range of 473-533 K Low oxygen concentrations were sufficient to maintain
the activity of me catalyst A further increase in oxygen concentration over 4% enhanced
die reaction rate only slightly (see Fig 3-3)
Vanadia-based commercial catalyst
Page 64
56
dry feed wet feed
0.8-
/*^^-
ik
o2*- 0.6-O
7 /^^" '*
/ / /*
c
o
'52 0.4-a>>
ir /^
sim.
c 503 KoO 0.2-
• 513 K
523 K
T 533 K
0.0' i—i—i—i—i—1 I F i r-
0 concentration/%2
O concentration/%2
Figure 3-3. Conversion of NO versus oxygen concentration for dry and wet feed.
Feed: 0-11.5% 02, 1000 ppm NO, 1000 ppm NH3, 0% , resp. 5% H20,
balance N2, flow rate: 430 ml/min(NTP) dry feed, 500 ml(NTP)/min wet
feed.
3.3.6 Influence of ammonia
The influence of ammonia on die kinetic behavior was investigated for feed
concentration between 300 and 1000 ppm NH3. No change in die conversion rate of NO
was observed by varying die ammonia concentration. The conversion of NO and NH3
versus die reaction temperature widi 300 or 1000 ppm NH3 in me feed is depicted in
Figure 3-4. The deviations of die NO conversion to die model (will be described in
paragraph 3.3.8) were always in die experimental error. Good fitting of die model
Chapters
Page 65
57
prediction with the experimental NH3 conversion was achieved for a NH3 feed
concentrations of 300 ppm as well as 1000 ppm.
-i—1—1—1—1——1—1—1——1—1—1—1—1—1—r
360 380 400 420 440 460 480 500 520 540
temperature /K
Figure 3-4. Conversion of NO and NH3 versus temperatures for different
ammonia feed concentrations.
O measured and simulated NO conversion for a feed widi 1000 ppm
NHi, M NH1 conversion, • NO conversion and — simulated
conversions for a feed with 300 ppm NH3. Feed composition: 10% O2,
1000 ppm NO, 1000 or 300 ppm NH3, balance N2, flow rate =
430 ml(NTP)/min.
3.3.7 Influence of S02.
Exposing the catalyst alternately to a S02 free feed and to a feed containing
increasing concentrations of SO2, respectively, at 523 K (Fig. 3-5) indicated no
Vanadia-based commercial catalyst
Page 66
58
poisoning or deactivation. Additionally no significant amounts of S03 were detected.
The variation of the NO conversion in die experiment was always in the experimental
error.
100 150
time /min
Figure 3-5. Influence of S02 on the NO conversion.
NO conversion, S02 concentration. Feed: 10% 02, 1000 ppm NO,
1000 ppm NH3, 5% H20, 0-80 ppm S02 and balance N2, reactor
temperature = 523 K, flow rate = 430 ml(NTP)/min.
3.3.8 Kinetic modeling
The kinetic model was based on die reaction stoichiometry shown in equation rl.
The selectivity to N2 and H2O was higher man 99 % in all experiments. There was no
significant impact of carbon dioxide and sulfur dioxide on die reaction rate observable.
Consequenfly, no side reaction had to be taken into account.
Chapter 3
Page 67
59
4NH3 + 4NO->4N2 + 6H20 (rl)
Different kinetic equations were investigated. The best descnption of die
expenmental data was obtained widi die following approach. For temperatures exceeding
473 K me catalytic behavior could be descnbed well widi a kinetic rate expression first
order with respect to nitnc oxide and zerom order widi respect to ammonia The influence
of oxygen was taken into account widi a Langmuir adsorption isomerm expression, at
which the isotherm is normalized to 10% oxygen in the exhaust gas to allow an
independent estimation of ki (see equation 3-1) For temperatures below 473 K a
significant deviation was perceptible in die case of dry feed In dns temperature range die
kinetics could only be properly descnbed by accounting for an additional reaction padiway
following a Langmuir-type mechanism (see equation 3-2) For wet feed, die conversion
was low in that temperature range and no significant deviation was observable
Ko, Po,
ri=k,pNO 1K+K°'P°' (3-D
1 + K„ pn .
Ko, Po,
KNOpNO 1 + Ko, Po,
Ko,
Po,|,I + K°>Po,|„
r2 = k2"NOt,NO
„
"'ru'(3-2)
1 + KNOpNo Ko, Po,U
Vanadia-based commercial catalyst
Page 68
60
In order to reduce the correlation between pre-exponential factor (k, , Ka ), die
activation energy (EaO, and die endialpy of adsorption (AHA), respectively, die reaction
rate constant (k„ equation 3-3) and die equilibrium constant of adsorption (Ka, equation
3-4) were expressed as proposed by Himmelblau (23).
k,(T) = k;(TRef)exp J_ 1^T T
1*Ref J
(3-3)
KA(T) = KUTRef)exp-AH.
T
*Ref JJ
;TRcf=500K (3-4)
Under dry conditions die simulations were carried out widi die same activation
energy of 87.4 kJ/mol for both reaction pams. Widi this approach it was possible to
estimate the reaction rate constants k, independent of die otiier kinetic parameters and to
prevent a correlation between die estimated values of k, and die adsorption equilibrium
constants of oxygen and nitnc oxide, respectively. Under wet conditions (more man 2.5%
H2O in die feed), the Eley-Rideal reaction padi was dominant for die temperature range
investigated (363-463 K) and die simulations were performed widi an activation energy of
98.5 kJ/mol.
The temperature dependence of ki and Koj are shown in die linearized form in
Figure 3-6. For me kinetics under wet conditions only die data over 473 K were used for
die linear regression. The Arrhenius-type plot shown in Figure 3-6 demonstrates well the
deviation below 473 K. All die model parameters estimates are listed in Table 3-1.
Chapter 3
Page 69
61
- -8-
-10-
0 0020 0 0024
1/T/(K-1)
-5-i
-6-
~ yCO -7-
Q. /CM
o
^ "8"
J*^*/*
-9-;x^-10-
0 0018 0 0020
1AT7(K-1)
Figure 3-6. Temperature dependency of ki and K02 for dry and wet feed.
0% H20, 5% H20, — simulated Feed 10% 02, resp 0-11 5%,
1000 ppm NO, 1000 ppm NH3, balance N2
Table 3-1. Model parameters
units feed without
h2o
standard
deviation
H20 cone. >2 5% standard
deviation
k?(TRrf) m3/kgs 5 05E-2 6 9E-4 2 79E-2 8 1E-4
Eai J/mol 87400 1490 98700 4450
k2(TRrf) Pa mVkg 47 32
Ea2 J/mol 87400
KoiCTstf) Pa1 2 27E-4 1 7E-6 4 93E-4 2 21E-6
AH0, J/mol -46100 6670 -61500 3300
*^No(TRef) Pa1 2 25E-5 1 14E-5
AHno J/mol -112000 19000
Vanadia based commercial catalyst
Page 70
62
3.4 Discussion
Figure 3-2 shows diat water has only an influence up to a concentration of 2.5%. In
die temperature range over 473 K die presence of water resulted in an increase of die
activation energy from 87.4 kJ/mol (dry condition) to 98.7 kJ/mol (Table 3-1). In
comparison to dry conditions die pre-exponential factor decreases about 50% and remains
constant for higher water concentrations. This indicates tiiat water only blocks part of die
active sites. Because of the higher proton affinity of ammonia compared to water, it is not
expected diat water blocks die sites for ammonia adsorption (11). However Odriozola et
al. (13) reported that ammonia does hardly adsorb on fully hydroxylated vanadia surfaces.
The hydroxylation of the vanadia surface could be a possible explanation of the inhibition
by water. The influence of water on the oxygen adsorption equilibrium constant is
different. In die presence of water die adsorption enthalpy becomes more negative and die
pre-exponential factor increases (Table 3-1). Water favors die adsorption of oxygen,
because oxygen adsorbs hardly at die V=0 sites, whose number is decreasing in die
presence of water. This is in accordance with die mechanism proposed by Inomata et al.
(6) where V-OH species are reoxidized to V=0 species (see equation r2).
2 V-OH i-°-o,.cb.itv*=o ) 2V = 0 + H2q (r2)
In die mechanism proposed by Inomata et al. (6) oxygen is not involved in die rate
limiting step. However, die audiors also showed diat die number of active surface V=0
sites is proportional to die reaction rate. The concentration of oxygen has an important
Chapter 3
Page 71
63
influence on the number of diese sites, especially in the low concentration range.
Therefore it is necessary to take oxygen into account in the kinetic modeling.
The estimation of the adsorption equilibrium constant of NO contains a high level
of uncertainty, due to the low conversion in die temperamre range below 473 K, where a
significant deviation for ki is observable (see Fig. 3-6). But only widi die additional
Langmuir-Hinshelwood paui a good fitting of die kinetic behavior can be reached also in
die low temperature range.
1.0
0.8-
H— 06u
c
o
CO 0.4
CD>co
o 0.2
0.0 4—r —i—i——i——i—i—i—i—i—i—)' i—
360 380 400 420 440 460 480 500 520 540
temperature /K
Figure 3-7. Contributions of the different reaction paths to the overall
conversion as a function of the temperature.
• experimental data, — simulated overall conversion, conversion via
Langmuir-Hinshelwood padi, — conversion via Eley-Rideal paui.
Feed: 10% 02, 1000 ppm NO, 1000 ppm NH3, balance N2> flow rate =
430 ml(NTP)
Vanadia-based commercial catalyst
Page 72
64
Figure 3-7 illustrates die conversion of NO versus the temperature and die
contributions of each reaction paui to the overall conversion. Below 433 K die reaction
occurs mainly via die patii based on die Langmuir-Hinshelwood mechanism. In die higher
temperature range no NO adsorption occurs and die Langmuir-Hinshelwood reaction patii
can be neglected.
Wiui water in die feed no significant influence was measurable (see Fig. 3-8), due
to die very low conversion below 473 K.
0.0 i——i——i——i——i——i-
400 420 440 460 480 500 520 540 560
temperature /K
Figure 3-8. Conversion of NO versus temperature for dry and wet feed.
• 0% H20, T 2.5 % H20, 5% H20, 7.5% H20, - simulated.
Feed: 10% 02, 1000 ppm NO, 1000 ppm NH3, 0% - 7.5% H20, balance
N2, flow rate = 430 mlAnin(NTP).
Chapter 3
Page 73
65
For the occurrence of a Langmuir-Hinshelwood mechanism die adsorption of NO
is necessary NO adsorption is only reported on Ti02 and on reduced vanadia but not on
oxidized V205 surfaces (11,13,24) In the presence of ammonia a part of die V2Os surface
is reduced and the adsorption of NO at this sites becomes possible if die reoxidation by 02
is not too fast
An other explanation for the occurrence of a Langmuir-Hinshelwood mechanism is
that NO adsorption occurs on the Ti02 support In that case NO may be spilled over onto
the active vanadia sites and react according to a Langmuir-Hinshelwood mechanism
However this mechanism has so far not been proven and needs direct expenmental
confirmation In any case, the suggestion made by Srnak et al (11) mat bom an
Eley-Rideal and a Langmuir-Hinshelwood mechanism may be relevant to descnbe SCR
kinetics is further supported by this work
3.5 Conclusions
Below 473 K the kinetic of the selective reduction of NO can not be properly
descnbed with the model including a Eley-Rideal mechanism alone Best fitting is
obtained at an additional Langmuir-Hinshelwood pathway Under typical SCR conditions
(5-15% 02, 5-15% H20, 523-723 K) the model with the Eley-Rideal mechanism is
sufficient The influence of oxygen has to be taken into account for die whole temperature
range The importance of oxygen decreases with nsing concentrations of oxygen, but can
not be completely neglected in the concentration range typical for SCR Water has no
significant influence on the kinetics under typical SCR conditions
Vanadia-based commercial catalyst
Page 74
66
3.6 Notation
mem = catalyst weight, kg
V* = flow rate, m3/s
r, = reaction rate, Pa m3/kg s
k, = reaction rate constant
KA = adsorption equilibrium constant, Pa"1
p, = partial pressure of die component i, Pa
k, , Ka = pre-exponential factors
Ea, = activation energy, (J/mol)
AHA = adsorption endialpy, (J/mol)
3.7 References
1. Marangozis, J. Ind. Eng. Chem. Res. 31,987 (1992).
2. Bauerle, G. L.; Wu, S. C. and Nobe, K. Ind. Eng. Chem. Prod. Res. Dev. 17, 117
(1978).
3. Odenbrand, C. U. I.; Lundin, S. T. and Andersson, L. A. H. Appl. Catal. 18, 335
(1985).
4. Tuenter, G.; van Leeuwen, W. F. and Snepvangers, L. J. M. Ind. Eng. Chem.
Prod. Res. Dev. 25, 633 (1986).
Chapter 3
Page 75
67
5 Robinson, W R A M,van Ommen, J G
, Woldhuis, A and Ross, J R H
Proceedings of the 10th International congress on Catalysis, 19-24 July,
Budapest, Hungary, 2673 (1992)
6 Inomata, M, Miyamoto, A and Murakami, Y J Catal 62, 140 (1980)
7 Miyamoto, A , Kobayashi, K , Inomata, M and Murakami, Y J Phys Chem
86, 2945 (1982)
8 Janssen, F J J G,v den Kerkhof, F M G
,Bosch, H and Ross, J R H J
Phys Chem 91,5921 (1987)
9 Gasior, M,Haber, J
, Machej, T and Czeppe, T J Mol Catal 43, 359 (1988)
10 Takagi, M , Kawai, T , Soma, M ,Onishi, T and Tamani, K J Catal 50, 441
(1977)
11 Srnak, T Z, Dumesic, J A
, Clausen, B S, Tornqvist, E and Tops0e, N -Y J
Catal 135,246(1992)
12 Wu, S C and Nobe, K Ind Eng Chem Prod Res Dev 16, 136 (1977)
13 Odriozola, J A,Hememann, H
, Somorjai, G A, de la Banda, J F G and
Pereira,P J Catal 119,71 (1989)
14 Tufano, V and Turco, M Appl Catal B Environmental 2, 133(1993)
15 Svachula, J, Ferlazzo, N , Forzatti, P ,
Tronconi, E and Bregani, F Ind Eng
Chem Res 32,1053(1993)
16 Jung, J and Panagiotidis, T Chemie im Kraftwerk 1990, 1 (1990)
17 Beeckman.J W andHegedus.L L Ind Eng Chem 30,969(1991)
18 Weisz, P B and Prater, C D Advances in catalysis and related subjects 6, 144
(1954)
19 Turco, M,Lisi, L and Pirone, R Appl Catal B Environmental 3, 133 (1994)
20 Odenbrand, C U I, Gabnelsson, P L T,Brandin, J G M and Andersson, L
A H Appl Catal 78, 109(1991)
21. Tops0e, N. -Y., Slabiak, T , Clausen, B S, Srnak, T Z and Dumesic, J A J
Catal 134,742(1992)
Vanadia based commercial catalyst
Page 76
68
22. Duffy, B. L.; Curry-Hyde, H. E.; Cant, N. W. and Nelson, P. F. J. Phys. Chem.
98,7153(1994).
23. Himmelblau, D. M. "Process Analysis by Statistical methods", Wiley, New
York, 1970.
24. Baltensberger, U.; Ammann, M.; Bochert, U. K.; Eichler, B.; Gaggler, H. W.; Jost,
D. T.; Kovacs, J. A.; Turler, A.; Scherer, U. W. and Baiker, A. J. Phys. Chem. 97,
12325 (1993).
Chapter 3
Page 77
4
Vanadia-Titania Aerogel Catalyst:Catalytic behavior and kinetic modeling
Abstract
The kinetics and the parametric sensitivity of die selective catalytic reduction of
NO by NH3 were investigated for a high surface area vanadia-titania aerogel The
catalyst showed high activity at low temperatures and the selectivity was higher than
99% for all expenments The addition of up to 3% H20 to die dry feed significantly
reduced die rate of NO conversion The effect leveled off for higher H2O concentrations
In the absence of 02 in die feed the activity collapsed Small amounts of oxygen resulted
in a sharp increase of die reaction rate, but for oxygen concentrations exceeding 4% the
increase diminished A high tolerance with respect to sulfur dioxide was observed The
estimated activation energy amounted to 60 kJ/mol ± 1 kJ/mol The microkmetic analysis
resulted in a model based on an Eley-Rideal mechanism which descnbes the kinetic
behavior over a wide expenmental range
Vanadia Titania Aerogel catalyst
Page 78
70
4.1 Introduction
Three different positions are often used as locations for the SCR reactor in the
flue gas stream (see paragraph 13 4 1) The catalyst location is one of the most
important factor which determine the catalyst lifetime At the tail end position the
catalyst lifetime is increased, due to the relatively clean flue gas However, the flue gas
has to be reheated to the SCR operating temperature The consequence is a 1-4%
decrease in die overall thermal efficiency of the power plant (1) In the most cases, these
additional costs make the tail end location less economic than the other ones An
economic study of the SCR process for power plant applications indicates, that overall
costs could be reduced if a suitable catalyst would allow to carry out the SCR reaction at
lower temperatures (2) Today platinum catalysts are utilized for low temperature
applications (175 - 250°C) Major disadvantages of the platinum based catalysts are the
narrow temperature window, the formation of N2O as a byproduct and the oxidation of
the ammonia reductant to NOx at higher temperatures, resulting in a decrease m
selectivity and conversion The precise control of the temperature complicates the
process design and leads to an increase of the overall costs Consequently, a demand for
new technologies being capable of reducing NOx at lower temperatures exists today A
new approach to lower the active temperature window of SCR catalysts was recently
made by Shell (3) They developed a system based on a granular SCR catalyst m a fixed
bed type reactor consisting of numerous shallow slabs of catalysts The good contact
between gas and catalyst allowed an operation temperature between 120 and 350°C The
system has a high catalyst holdup and needs clean gases with low dust concentration
Below 200°C ammonium sulfate deposition can cause a reversible catalyst deactivation
Chapter 4
Page 79
71
Recently it has been shown that vanadia-titania aerogels offer a high specific surface
area combined with high dispersion and good accessibility of the active vanadia
constituent Due to their unique morphological and textural properties, the aerogel
catalysts show excellent catalytic performance in the SCR of NO at low temperatures
(4-6)
The aim of the work presented in this chapter is to gain information on the
performance and stability of vanadia-titania aerogel SCR catalysts under conditions
similar to real lean exhaust conditions, e g in the presence of water in the feed The
influence of oxygen, water and sulfur dioxide on catalyst stability, activity and
selectivity is investigated A model of the intrinsic kinetics is developed, which includes
the influences of all major exhaust components It is shown mat satisfactory predictions
of the kinetic behavior with a single Eley-Rideal based model is possible The effects of
02 and H20 are included by Langmuir-type-adsorption terms
4.2 Experimental
4.2.1 Catalyst
A highly dispersed vanadia-titania aerogel with high surface area has been used
for catalytic tests The catalyst with a nominal loading of 30 wt % V205 was synthesized
by a two-stage sol-gel process with ensuing high temperature supercritical drying
Details of the preparation procedure and of the physical and chemical characterizations
are descnbed in ref (5, 6) After calcination at 573 K in 20% 02/N2 for 2 hours, the
catalyst powder was agglomerated under a pressure of 2 5 MPa for 2 min and then
crushed to sieve fractions of 100-250 urn and 250-350 urn, respectively
Vanadia Titania Aerogel catalyst
Page 80
72
N2-physisorption at 77 K of the fresh catalyst showed a type-IV isotherm with a type-Hl
hysteresis according to IUPAC classification (Sing et al, 1985) The average pore
diameter of the pronounced meso-to macroporous catalyst was 18 nm and the specific
nitrogen pore volume was 1 1 cm3/gcataiyst The BET surface area amounted to 183
m /gcataiyst. with a surface area in micropores < 10 m2/gcataiysI XRD analysis of the
agglomerated catalyst showed only reflections due to crystalline anatase No evidence for
crystalline V2Os was found, corroborating a high dispersion of the vanadia component
4.2.2 Catalytic tests
The catalytic studies were earned out in the continuous tubular fixed-bed
microreactor descnbed in paragraph 2 1 The reaction gas mixture employed in kinetic
expenments consisted of 100-1000 ppm NO (99 0%, PanGas), 100-1000 ppm NH3 (5%
NH3 (99 98%) in N2 (99 999%), CarbaGas), 0-6% H20 (bidest), 0-15% 02 (99 995%,
PanGas), 0-10% C02 (99 99%, PanGas) and 0-90 ppm S02 (15% S02 (99 98%) in N2
(99 999%), PanGas) in N2-balance (99 995% PanGas) Kinetic experiments at steady-state
conditions were earned out in the temperature range 390-510 K at a pressure of 1 1 105 Pa
using 0 1 -0 15 g of catalyst (100 - 250 |im) and a reactant flow rate of 200-1000 ml (NTP)
mm'(60'000-300'000 h
'(NTP) GHSV) Before catalytic expenments, the catalyst was
pretreated in the reactor for 2 h at 573 K in 20 % 02/N2
4.2.3 Kinetic modeling
The model parameters were estimated from the expenmental data by linear and
non-linear regression analysis as descnbed in paragraph 2 3 The logandimic maximum
Chapter 4
Page 81
73
likelihood function of die NO partial pressure was chosen as objective function to estimate
the model parameters
4.3 Results
4.3.1 Mass and heat transfer
The quartz wool plug on top of the catalyst bed and the small particle size (100 -
250 p.m) in comparison to the reactor diameter (7 5 mm) ensured that no radial gas
velocity profile and no channeling occurred and let us assume that plug flow was
established over the whole catalyst bed Theoretical calculations using the criterion of
Weisz and Prater (7) and expenments with larger catalyst particle sizes (250 - 350 |im)
indicated diat no internal mass transfer limitation occurred in the investigated
temperature range Figure 4-1 shows no deviation of reaction rate due to the particle size
for high conversions and thus confirm that lntraparticle mass transfer limitations were
negligible A maximum adiabatic temperature increase for a feed containing 1000 ppm
NO of 13 K was calculated The measured expenmental raise of the gas temperature for
complete conversion at the maximum space velocity was 1 5 K, equal to the increase
observed with the commercial catalysts Due to the small particle size and the negligible
increase of the temperature, the kinetic behavior was not significantly affected by
temperature gradients in the catalyst bed and in the catalyst
Vanadia Titania Aerogel catalyst
Page 82
74
-i r
0.0020 0.0021 0.0022 0.0023 0.0024 0.0025
1/T/K-1
Figure 4-1. Arrhenius plot for kinetic tests with different catalyst particle size
• 100-250 um, O 250-350 urn, model. Feed: 1000 ppm NO, 1000
ppm NH3, 10 % 02, balance N2.
4.3.2 Catalyst stability
Up to 500 K no significant deactivation was perceptible during 7 hours time on
stream (see Figure 4-2). For temperatures exceeding 500 K, a small decrease in activity
was observed. This behavior can be explained by a loss of specific surface area due to
hydrotiiermal aging of the aerogel catalyst, as observed previously for vanadia supported
on titania-aerogel catalysts (8). After 200 h under SCR conditions the BET surface area
decreased by 14% from initially 183 m2/gcataiyst to 158 m2/gcataiysi, whereas no change in
porosity occurred during the SCR reaction.
Chapter 4
Page 83
75
1 O-i 1
Z —• • •—• • •—•—•—•
o
£ 08- - _ - _ _ _ _
o ——————(0
>c
oo
0 6-1 1 1 . 1 . 1 . 1
0 100 200 300 400
time/min.
Figure 4-2. Catalyst stability for wet and dry feed.
# 0% H20, temperature 473K, 5% H20, temperature 493K Feed
1000 ppm NO, 1000 ppm NH3, 10 % 02, 0 or 5% H20, balance N2, gas
flow = 500 ml(NTP)/min, catalyst weight = 0 1 g
4.3.3 Temperature dependence
In Figure 4-3 the conversion of NO with raising temperature is compared for a dry
feed and for a feed containing 5 % water The temperature necessary to obtain 50% NO
conversion (Jxno=os) is shifted by 25 K to higher temperatures in die presence of water A
selectivity to N2 higher tiian 99 5% was observed for the whole temperature range
investigated The reproducibility of the catalytic behavior under steady state SCR
conditions is illustrated in Figure 4-3 by companson of a fresh catalyst with a catalyst
which has been on stream for 24 hours at 453 K The deviations are in die range of the
expenmental error A first order kinetics and an Arrhenius type temperature dependence of
Vanadia Titania Aerogel catalyst
Page 84
76
die reaction rate constant with an apparent activation energy of 60 kJ/mol ± 1 kJ/mol
(95 % confidence limits) was determined from the data presented in Figure 4-1
350 550400 450 500
temperature /K
Figure 4-3. NO conversion as a function of temperature
• 0 % H20 (new catalysts), O 0 % H20 (used catalysts), 5 % H20,
—simulated progress, Feed 1000 ppm NO, 1000 ppm NH3, 10 % 02,
0 % or 5 % H20, balance N2, gas flow = 500 ml(NTP)/min, catalyst
weight = 0 1 g
4.3.4 Influence of space velocity
Figure 4-4 depicts the conversion of NO versus the gas flow per catalyst weight
(W/F) for temperatures in die range 405 - 477 K With increasing temperature a stronger
influence of space velocity on NO conversion is perceptible which is most pronounced
up to 10 kgcatm 3s The expenmental data are in good accordance with the simulated
Chapter 4
Page 85
77
progress assuming a first order reaction Integral analysis of the data also revealed that
only a first order kinetic in NO can descnbe the expenmental behavior properly
m A/* /kg nv3scat cat
Figure 4-4. NO conversion as a function of the gas flow
405 K, O 414 K, 425 K, V 436 K, 445 K, 455 K, • 466 K,
A 477 K, simulated progress Feed 1000 ppm NO, 1000 ppm NH3,
10 % 02, balance N2, gas flow = 300-800 ml(NTP)/min, catalyst weight
= 01g
4.3.5 Influence of the ammonia concentration
The ammonia inlet concentration was vaned between 100 and 1000 ppm to
investigate the influence of ammonia on the kinetic behavior The conversion of NO
was only sensitive to me ammonia concentration if die reactor outlet concentration of
Vanadia Titania Aerogel catalyst
Page 86
78
ammonia was less than 15 ppm In the measurements depicted in figure 4-5, this
occurred only if the conversion was limited by ammonia
1000
Figure 4-5. NO conversion as a function of the NH3 reactor inlet concentration.
O NO conversion and • NH3 conversion at 453 K, A NO conversion
and NH3 conversion at 428 K Feed 1000 ppm NO, 100-1000 ppm
NH3, 10 % 02, balance N2, gas flow = 500 ml(NTP)/min, catalyst weight
= 01g
4.3.6 Influence of water
Addition of water to the dry feed decreased the reaction rate (Fig 4-6) The
effect is more pronounced for low temperatures and concentrations up to 3%, whereas
for concentrations above 5% the activity was almost independent of the water
concentration
Chapter 4
Page 87
79
The inhibition effect of water was occasionally reported by other groups (9-12)
Tops0e et al (10) found that water hydroxylates the surface thus forming Br0nsted acid
sites Moreover, water was reported to adsorb more weakly than ammonia and therefore
should not inhibit NHi adsorption This finding is in agreement with the observed low
influence of water on activity in the higher concentration range With models which
included a competitive adsorption of ammonia and water the kinetic behavior could not
be described properly On grounds of the postulated formation of Br0nsted sites, an
increase in activity would be supposed which is inconsistent with the expenmental
results It seems that water not only affects the number of active site but also the rate
limiting step (10)
H O concentration /%2
Figure 4-6. NO conversion as a function of the water concentration
477 K, • 486 K, 495 K, T 501 K simulated progress Feed
1000 ppm NO, 1000 ppm NH3, 10 % 02, 0- 6 % H20, balance N2 gas
flow = 500 ml(NTP)/min, catalyst weight = 0 1 g
Vanadia - Titania Aerogel catalyst
Page 88
80
4.3.7 Influence of oxygen
The oxygen concentration was vaned in die range 0 - 15% Without O2 in the feed
the reaction rate was almost completely suppressed due to an inhibited reoxidation of
the catalyst Figure 4-7 shows that low concentrations of oxygen strongly accelerate the
reaction rate, independently whether water is present in the feed or not The rate
enhancing influence declined with increasing oxygen concentration and for higher 02
levels the enhancement is only small (Fig 4-7) The promoting effect of oxygen is well
known for vanadia based catalysts (12, 13) Small deviations between the expenmental
data and the model predictions were perceptible for low oxygen concentrations The
calculated conversion was lower than the experimental value with the effect being more
pronounced with water in die feed gas The simulated progress for wet feeds shown in
Figure 4-7 is an extrapolation from dry conditions as the kinetic parameters for the
oxygen influence were estimated from kinetic data of expenments without water in the
feed gas The underestimation at lower oxygen concentrations is in accordance with
previously reported results, which indicated that water favors the reoxidation of the
catalyst (see paragraph 3 4) The small overestimation of activity observed for the wet
feed at 503 K results from a loss of specific surface area
Chapter 4
Page 89
81
02 8
0 2 4 6 8 10 12 14 0 2 4 6 8 10 12 14
O concentration/% o concentration/%2 2
Figure 4-7. NO conversion as a function of the oxygen concentration
A = 0 % H20, B = 5 % H20 447 K, • 456 K, A 466 K, T 476 K,
477 K, O 486 K, A 495 K, V 503 K, simulated progress Feed
1000 ppm NO, 1000 ppm NH3, 0-15 % 02, balance N2, gas flow = 500
mI(NTP)/nun, catalyst weight = 0 1 g
4.3 8 Influence of S02
Exposing the catalyst alternately to a dry S02 free feed and to a feed containing
increasing concentrations of S02, respectively, at 500 K (Fig 4-8 ) gave no indication
for poisoning or deactivation processes Moreover, the undesired formation of SO3 was
not observed Longer exposure of the catalyst to a S02 containing wet and dry feed
indicated a small decrease in activity for the wet feed at 500 K (Fig 4-9) The
deactivation was ascribed to the concomitant small loss of surface area induced by
hydrothermal processes and not to the SOz content in die feed gas Poisoning as well as
Vanadia Titania Aerogel catalyst
Page 90
82
promoting effects of S02 are proposed in the literature Chen (15) suggested an increase
of die Br0nsted acidity by S02 resulting in higher activity Problems m industnal
applications are generated by the oxidation of S02 to SO3 although the formation of SOi
is slow compared to die reduction of NO with NH3 Svachula et al (16) proposed a
steady state kinetics of the S02 oxidation with a reaction rate which is of vanable order
in SO2 and asymptotically independent of oxygen The oxidation is inhibited by water
and ammonia and slightly promoted by NO SO3 reacts with ammonia and water thus
forming ammonium bisulfate (NH4HSO4) or ammonium sulfate ((NH4)2S04) (see
paragraph 13 4 1) The deposition of ammonium sulfates in pores leads to a decrease in
specific surface area The fouling depends on exhaust gas temperature and the ammonia,
sulfur trioxide and water concentrations (17)
' ulm — 1 ^ 1
1 m r
A —A80
E08-Q.
O Q.
Z - 60 "^"5 06-
A- A tioc CO
.0 40 c
52 04- CD
<D>
Oc
c^ ^
0
8 02- 20 "
1
CO
0 0' 1 r^i i, _^ i—i—i t j 1 i
,1 kT •' '0
c) 50 100 150 2()0 250
time /min
Figure 4-8. Influence of S02 on catalyst behavior
H conversion of NO, A S02 concentration Feed 1000 ppm NO, 1000
ppm NH3, 5 % H20, 0-76 ppm S02, balance N2, gas flow = 800
ml(NTP)/min, T^Br = 500 K, catalyst weight = 0 15 g
Chapter 4
Page 91
83
09--
08- -
O 07-Z 1
-
"S 06-o
5 05--
o 1 \«? 04- / \
-
<D / \> 03- / \c / \
-
8 02- / \0 1-i / \00--U , . , r--,—.—M-
140
120 EQ.
Q.
100""-
c
o
80m^
*..
60c
CDOr
40 oo
20 O(/)
0
100 400200 300
time /mm
Figure 4-9. Influence of S02 on catalyst behavior for wet and dry feed
I conversion of NO for wet feed at Trcactor = 500 K, % conversion of NO
for dry feed at Trcactor = 480 K, A S02 concentration for wet feed, T S02
concentration for dry feed Feed 1000 ppm NO, 1000 ppm NH3, 0 or 5 %
H20, 0 or 80 ppm S02, balance N2, gas flow = 800 ml(NTP)/min,
catalyst weight = 0 15 g
4.3.9 Kinetic modeling
The selectivity to N2 and H2O was higher than 99 % and no significant oxidation
of ammonia was observed for all experiments For the temperature range investigated no
side reaction had to be taken into account and consequently an overall stoichiometry of
the reaction as shown in equation rl can be assumed
4 NO + 4 NH3 + 02 -> 4 N2 + 6 H20 (rl)
Vanadia Titania Aerogel catalyst
Page 92
84
The kinetic behavior is well descnbed with the following approach The core of
the model is an Eley-Rideal-mechanism which is well known from the literature
Oxygen has a strong influence on the number of active sites The relation between the
partial pressure of oxygen and the number of active sites was incorporated by a
Langmuir-Hinshelwood model Water inhibits the reaction This effect levels off for
higher water concentrations in the feed stream This indicates that the sites still have an
activity when water covers the catalyst completely This behavior is described with a
modified Langmuir adsorption model including an additional constant remainder n The
temperature dependencies of the adsorption constants were negligible in the investigated
temperature range The influence of water to the reoxidation was not significant for all
experimental conditions The best descnption of the experimental data was obtained
with a model based on equation 4-1
r = k
K p
1 + K0, Po,
n + -
l+K„,oP(4-1)
k = k°(Trrf)exp' Ej\ 1^
R T T„,
In order to reduce the correlation between pre-exponential factor and activation
energy, the reaction rate constant was expressed as proposed by Himmelblau (18)
The model parameter estimates are listed m Table 4-1 Due to the independent
estimation of the reaction rate constant, Ko; and the water dependency, no correlation
Chapter 4
Page 93
85
exists between these parameters The calculated correlation between n and Kh2o was 0 8
and 0 2 for k°(Tref) and EA, respectively
Table 4-1 Estimated Model Parameters
units parameter standard deviation
k°(Trcf) m3/kg s'
0 15 9e-4
EA kJ/mol 60 05
Ko, Pa1 2 8e-4 le-5
n - 04 9e-3
KhjO Pa1 17e-3 le-4
4.4 Discussion
The proposed model is in good accordance with the findings of other groups in
this field An Eley-Rideal model is also proposed by several authors (19-21) In our
experiments the reaction rate was always zeroth order in ammonia It can be assumed
that the catalyst was completely covered with ammonia even for small concentrations
due to the low temperatures in all expenments Variation in the ammonia concentration
(see Figure 4-5) and calculations with adsorption constants from die literature (22)
confirmed this assumption At higher temperatures and high conversion or at unsteady
operation conditions (23) ammonia adsorption has to be taken into account and could
Vanadia - Titania Aerogel catalyst
Page 94
86
have a significant impact on the ammonia slip which is an important parameter in
industrial applications
The activation energy found without water in the feed gives also a good fitting
for the expenments with water This is manifested in Figure 4-3 and 4-6 The mam
effect of water is a decrease in the pre-exponential factor (see Figure 4-9) But also an
increase in the activation energy would be expected for low coverages due to
exothermic adsorption of water For low surface coverage (KwPw« 1), the adsorption
equilibnum constant of water Kw should decrease exponentially with the increased
temperature by the factor e4""^7 However, this effect is too small for a proper
estimation of the adsorption energy AHW An estimation would only be possible if more
experimental data in a wider temperature range and for small water concentrations
would be accessible But at die higher temperature the hydrothermal deactivation would
cause a small loss in the activity which is sufficient for distorting die estimation of die
adsorption energy Furthermore, for a typical exhaust gas the water concentration is high
and Kwpw» 1, so that the modified Langmuir term for water is always about 0 4 and
independent of die water content
Chapter 4
Page 95
87
0 00200 0 002100 00205
1/T/K-1
Figure 4-9. Arrhenius type plot for different water concentrations
4 8 % H20, A 3 9 % H20, O 1 6 % H20, O 0 3 % H20, model
Feed 1000 ppm NO, 1000 ppm NHi, 10 % 02, 0 3 - 4 8% H20, balance
N2, gas flow = 500 ml(NTP)/min, catalyst weight = 0 1 g
The same restrictions as for the water adsorption constant exists for the
estimation of the temperature dependence of the reoxidation It is obvious from Figure
4-10 that the prediction of the reaction rate is too small for lower oxygen concentrations
This effect is stronger if water is present in the feed gas Water strengthens the
reoxidation of the catalysts Similar behavior was found with an industrial vanadia
based catalyst (see chapter 3) An explanation could be that water favors die adsorption
of oxygen, because oxygen adsorbs hardly at the V=0 sites, whose number is decreasing
in the presence of water But mechanistic interpretation of this effect needs further
investigations and is not understood yet
Vanadia Titania Aerogel catalyst
Page 96
88
-1 5-
-2 0-
2*
c -2 5-
-3 0-
-3 5 1 1 1 "-i-1 -3 5 "I 1 1 1'
0 0021 0 0022 0 0020 0 0021
1/T/K-1 1/T/K-1
Figure 4-10. Arrhenius type plot for different oxygen concentrations
1 % 02, • 2 % 02, A 3 % 02, T 10 % 02, model Feed 1000
ppm NO, 1000 ppm NH3, 10 % 02, A = 0% or B = 5 %H20, balance N2,
gas flow = 500 ml(NTP)/min, catalyst weight = 0 1 g
Furthermore Figure 4-10 demonstrates diat the oxygen concentration has no
significant influence on die activation energy This indicates, that die oxygen dependence
depicted in Figure 4-7, is not a result of a change in the rate determining step It must be
assumed that adsorbed oxygen has an influence on the number of active sites This was
earlier proposed by Janssen et al (20, paragraph 13 4 3) They suggested that molecular
oxygen initially adsorbs at a single site When diere is an otiier vacancy next to the
adsorbed oxygen molecule, die molecule dissociates and one of the atoms becomes
adsorbed on me vacancy This would be a possible explanation of the observed Langmuir
behavior and clanfy die underestimation for low oxygen concentration The probability for
Chapter 4
Page 97
89
pairs and clusters of oxygen vacancies is assumed to increases witii dropping oxygen
concentrations leading to acceleration of the reoxidation An additional factor for the
underestimation in the lower concentration range could be the reoxidation witii NO This
reaction path was proposed by Miyamoto et al (24) in absence of oxygen (see paragraph
1343)
4.5 Conclusions
It has been demonstrated that vanadia titania aerogels are highly active catalysts
for the SCR reaction in the low temperature range, due to large specific surface and the
high vanadia content Water inhibits the reduction of NO to N2, but in the typical
concentration range of exhaust gases the influence levels off Under practical conditions
the reoxidation is fast and the reaction rate is independent of the oxygen concentration
Like other vanadia based DeNOx catalysts, the aerogel shows a good resistance to S02
poisoning A hindrance for an industrial application in the near future is the high price
due to the relatively demanding preparation and the high vanadia content For
preserving the high specific surface area the gel has to be dried under supercntical
conditions
With a simple model very good predictions of kinetic behavior and the
parametric sensitivity were obtained The kinetic analysis demonstrated that only a
model based on Eley-Rideal mechanism can describe the kinetic behavior properly
Vanadia Titania Aerogel catalyst
Page 98
90
4.6 Notation
met = catalyst weight, kg
V* = gas flow, m3/s
r = reaction rate, m3 Pa / kg s
k = reaction rate constant, m3/kg s
k°(Tref) = pre-exponential factor, m3/kg s
EA = activation energy, kJ/mol
T = temperature, K
K, = adsorption equilibrium constant of component i, Pa"'
n = constant, -
p, = partial pressure of component i, Pa
3.7 References
1. Lowe, P. A. "Low-Temperature Selective Catalytic Reduction NOx
Control." American Chemical Society, 1994.
2. Robie, C. P.; Ireland, P. A. and Cichanowicz, J. E. Joint Symposium on
Stationary Combustion NOx Control, San Francisco, (1989).
3. van der Grift, C. J. G.; Woldhuis, A. F. and Maaskant, O. L. Catal. Today 27, 23
(1996).
Chapter 4
Page 99
91
4 Schneider, H , Tschudin, S, Schneider, M , Wokaun, A and Baiker, A J Catal
147,5(1994)
5 Schneider, M, Maciejewski, M , Tschudin, S
, Wokaun, A and Baiker, A J
Catal 149,326(1994)
6 Scharf, U , Schneider, M , Baiker, A and Wokaun, A J Catal 149, 344 (1994)
7 Weisz, P B and Prater, C D Advances in catalysis and related subjects 6, 144
(1954)
8 Engweiler, J and Baiker, A Appl Catal A General 120, 187(1994)
9 Odenbrand, C U I, Gabnelsson, P L T, Brandm, J G M and Andersson, L
A H Appl Catal 78, 109(1991)
10 Tops0e, N -Y, Slabiak, T , Clausen, B S
,Srnak, T Z and Dumesic, J A J
Catal 134,742(1992)
11 Duffy, B L, Curry-Hyde, H E
,Cant, N W and Nelson, P F J Phys Chem
98,7153(1994)
12 Turco, M , Lisi, L and Pirone, R Appl Catal B Environmental 3, 133 (1994)
13 Jung, J and Panagiotidis, T Chemie im Kraftwerk 1990, 1 (1990)
14 Bauerle, G L,Wu, S C and Nobe, K Ind Eng Chem Prod Res Dev 17, 117
(1978)
15 Chen, J in "Preparation, characterization, and deactivation of the catalysts for
the selective catalytic reduction of NO with NH3"
Dissertation No 189, Buffalo,
1993
16 Svachula, J, Alemany, L J
, Ferlazzo, N, Forzatti, P and Tronconi, E Ind
Eng Chem Res 32,826(1993)
Vanadia Titania Aerogel catalyst
Page 100
92
17 Hums, E , Joisten, M ,Muller, R
, Sigling, R and Spielmann, H Catal Today
27,29(1996)
18 Himmelblau, D M in "Process Analysis by Statistical methods", Wiley, New
York, 1970
19 Inomata, M , Miyamoto, A and Murakami, Y J Catal 62, 140 (1980)
20 Janssen, F J J G,v den Kerkhof, F M G
,Bosch, H and Ross, J R H J
Phys Chem 91, 5921 (1987)
21 Odenbrand, C U,Bahamondo, A ,
Avila, P and Blanco, J Appl Catal B
Environmental 5, 117 (1994)
22 Ruppel, W , Drews, R, Hess, K ,Holdench, W , Scheidsteger, O in "SCR-
DeNOx-Katalysatoren - Qualitatsicherung, Beurteilung und neue Entwicklung"
(Koser, H), 65, Vulkan-Verlag, BRD, 1992
23 Tronconi, E, Lietti, L, Forzatti, P and Malloggi, S Chem Eng Sci 51, 2965
(1996)
24 Miyamoto, A , Kobayashi, K ,Inomata, M and Murakami, Y J Phys Chem
86, 2945 (1982)
Chapter 4
Page 101
5
Chromia on Titania Catalyst:Modeling of the kinetic behavior and
investigations of the deactivation behavior
Abstract
The kinetics and the parametric sensitivity of the selective catalytic reduction
(SCR) of NO by NH3 were investigated over a chromia on titania catalyst The chromium
oxide phase was made up predominantly of X-ray amorphous Cr203 High SCR activity
and selectivity to N2 was attained at low temperatures The high selectivity is attributed
to the absence of significant amounts of Cr02 and crystalline 0C-Cr2O3 which favor N20
formation The selectivity to N20 increased witii higher temperature Addition of up to
6 % H20 to the dry feed reduced the rate of NO conversion and decreased the undesired
formation of N20 The effect of water on die catalytic behavior was reversible In the
absence of oxygen, the reaction between NO and NH3 became marginal, independently
whether H20 was present or not Small amounts of oxygen were sufficient to restore
SCR activity Admission of S02 to the SCR feed resulted in a severe loss of activity
The poisoning of the catalyst by S02 was already notable for low S02 concentrations
(30 ppm) and for temperatures up to 573 K X-ray photoelectron and FTIR spectroscopy
Chromia on titania catalyst
Page 102
94
revealed the presence of sulfate species on the catalyst surface Analysis of the kinetic
data indicated that the SCR reaction is first order m NO and zeroth order in NH3 for
temperatures in the range 400 - 520 K The estimated activation energies for dry and wet
feed amounted to 60 0 ± 16 kJ/mol (95% confidence limits) For temperatures in the
range 400 - 520 K, and for a S02 free feed, die steady-state kinetic data could be well
descnbed witii a model based on an Eley-Rideal type reaction between activated ammonia
surface species and gaseous or weakly adsorbed NO
5.1 Introduction
Vanous matenals have been investigated for their application as SCR catalysts
(1) One of the most effective catalyst is vanadia on titania, frequently in combination
with tungsten- and/or molybdenum-oxide (see chapter 3) Other oxides have received
less attention Recently, chromia-containing catalysts have been reported to exhibit
interesting properties for the reduction of nitnc oxide with ammonia in the presence of
excess oxygen (2, 3), especially in the low temperature range Bulk amorphous
chromium oxide was shown to be highly active at low temperatures affording nitrogen
with high selectivity, whereas crystalline chromia (cc-Cr203) produces substantial
amounts of nitrous oxide and also exhibits significant activity for ammonia oxidation (4,
5) Differences in the catalytic behavior of these unsupported chromia catalysts are
correlated witii the higher density of labile oxygen species available on the surface of
the amorphous sample under SCR reaction conditions (6)
In studies of supported chromium oxide catalysts it has been demonstrated that the
behavior in SCR is strongly influenced by the support as well as by the nature of the
Chapter 5
Page 103
95
chromia surface species Wong et al (7) reported that Ti02-supported chromia catalysts
were generally more active than Al20,-supported catalysts and that formation of
undesired N20 was higher for the titania supported catalyst Previous investigations
performed in our group with CrOx/Ti02 catalysts have shown that the supported
chromium species are characterized by pronounced oxidation-reduction chemistry The
nature and oxidation state of the chromium oxide species depends on the Cr loading,
preparation procedure, and on the pre-treatment conditions (8) It was demonstrated that
the various chromium oxide phases, i e, Cr02, CrOOH, and Cr O^ differ markedly in
their activity and selectivity (9) The highest activity combined with a high selectivity to
N2 was found for X-ray amorphous Cr20., supported on titania Crystallization of Cr20,
induced at higher temperatures reduced the activity significantly Similar high
conversion of NO is found with CrO/TiO ,but substantial amounts of undesired N20
are produced with this catalyst Supported CrOOH is oxidized to CrO under typical
SCR conditions above 570 K and consequently exhibits similar catalytic behavior as
CrO2(10, 11)
A limited number of studies have focused so far on the parametric sensitivity, the
mechanism, and the kinetics of the SCR reaction over chromia based catalysts For
vanadia based catalysts it is well known from the literature that the presence of oxygen
in the reaction mixture markedly enhances the activity for the SCR reaction (12-14),
whereas water suppresses the reduction of NO (15) Duffy et al (16) investigated the
influence of oxygen on the rate and the selectivity of the SCR reaction over amorphous
and crystalline chromia A sharp rise in activity was observed for concentrations up to
1000 ppm 02 with both forms of chromia For higher oxygen concentrations the effect
Chromia on titania catalyst
Page 104
96
levelled off Willey et al (17) similarly found higher reaction rates in the presence of
oxygen for iron oxide-chromia-alumina aerogel catalysts
Although flue gases usually contain water, most of the laboratory studies of
chromia based SCR catalysts have been performed under dry conditions The effect of
water on the reaction of NO and NH over amorphous and crystalline chromia catalysts
has been investigated by isotopic labelling experiments by Duffy et al (5) In the
presence of excess oxygen, the addition of 1 5% HO decreased NO and NH,
conversions and inhibited the formation of ammonia oxidation products N20 and NO
for temperatures up to 523 K over both forms of chromia The authors verified that the
effect of water on the activity and selectivity was reversible Kohler et al (8) observed
significantly lower activity as well as higher selectivity to N20 for chromium oxide
supported on titania when the SCR feed gas contained water
In low-temperature SCR applications the presence of S02 and its oxidation to SO,
is of particular importance as sulfur tnoxide can react with ammonia in the presence of
water The resulting ammonium sulfate and/or bisulfate can cause catalyst deactivation
and can be deposited down stream in the flue gas flow (18) Yang et al (19) prepared a
Cr203-pillared interlayered clay, which exhibited a higher activity than a commercial
reference catalyst, but addition of S02 markedly decreased its activity Lower SCR
activity and increased selectivity to N20 was reported by Zhang et al (20) upon
2
deposition of S04 on amorphous chromia catalysts The behavior was attributed to
strong adsorption of NH3 which prevents chromia from reacting with NO
Several authors (21, 22) suggested for SCR on supported chromia catalysts a first
order kinetics in nitnc oxide and zeroth order in ammonia Comparable reaction orders
in nitric oxide and ammonia were observed for vanadia based catalysts and several
Chapter 5
Page 105
97
kinetic models were proposed (23-25) However, to our knowledge no model including
all relevant exhaust gas components has been reported so far for chromia based
catalysts
In the present work, a 10 wt.% Cr203/Ti02 catalyst has been investigated In order
to decrease the amount of Cr02 and to minimize the formation of cc-Cr203, which both
are considered responsible for N20 formation, the method of catalyst preparation of
Maciejewski et al (10) was modified By directly reducing the dned sample without
calcination, predominantly poorly crystalline Cr O (> 95 wt %) was obtained Previous
studies have concentrated on chemical and structural properties as well as on the
catalytic behavior of different chromium oxide phases (CrO , CrOOH, Cr203) in the
selective catalytic reduction of NO by NH3 in excess oxygen Here we are focusing on
the performance and stability of Cr.OVTiO, under real SCR conditions, e g, in the
presence of water in the feed The influence of oxygen, water, and sulfur dioxide on
activity and selectivity and on catalyst stability is investigated The influence of different
reaction parameters was studied and a microkinetic model has been developed, which
includes the influences of all major exhaust components
5.2 Experimental
5.2.1 Catalyst preparation
The catalyst was prepared by wet impregnation of Ti02 (P25, specific surface area
49 m /g, supplier Degussa) with chromium(UI)nitrate nonahydrate (Fluka) as described in
a preceding paper (ll). A chromium content of 6 84 wt% Cr, corresponding to 10 wt%
Cr203 was used After drying at 1 104 Pa and 363 K for two hours and at 413 K for 8 hours
Chromia on titania catalyst
Page 106
98
the catalyst was crushed and sieved to a grain size of 180 to 300 p:m In order to avoid the
formation of crystalline C1O2 upon thermal decomposition of the chromia precursor, the
dried catalyst was reduced witii pure hydrogen at 523 K for 1 h without pre-calcmation,
thus producing mainly CrOOH (11) Heating in argon at 773 K for 5 hours resulted in the
decomposition of CrOOH to a mixture of poorly crystalline CT2O3 (> 95 wt %) besides of
a minor amount of undecomposed CrOOH The BET surface area determined by N2-
physisorption at 77 K using a Micrometncs ASAP 2000 instrument amounted to 49 m2/g
5.2.2 Catalytic tests
Steady-state catalytic studies were earned out in die computer controlled apparatus
descnbed in paragraph 2 1 The reaction gas mixture consisted of 200-1000 ppm NO (99 0
vol %, PanGas), 200-1000 ppm NH3 (99 98 vol %, PanGas), 0-6 vol % H20 (bidistilled)
and 0-12 vol % 02 (99 995 vol %, PanGas) in N2-balance (99 995 vol % PanGas)
Standard expenments were earned out wiui a feed containing 1000 ppm NO, 1000 ppm
NH3, 10 % 02 in N2-balance using 0 35 g of catalyst (180-300 p:m sieve fraction) and a
reactant flow rate of 200-1000 ml (NTP) nun'(60'000-300'000 h
'
(NTP) GHSV) at a
constant pressure of 1 1 bar in the temperature range 400 - 520 K
The selectivities to N2 and N20 were calculated according to equation 5-1
2 F
S, = -^ (5-1)f*NOin + Mm,!! ^NOoiii ^NH,oiil
Where F, is die molar flow rate of component 1 and in and out refer to the reactor
inlet and outlet, respectively
Chapter 5
Page 107
99
5.2.3 Kinetic modeling
The model parameters were estimated from the expenmental data by linear and non¬
linear regression analysis (see paragraph 2 3) As objective function the maximum
likelihood function of the NO and N2O partial pressures was chosen
5.2.4 X-ray photoelectron spectroscopy (XPS)
XPS analysis of the catalyst samples was performed in a Leybold-Heraeus LHS 11
MCD instrument using Mg Ka radiation (240 W) to excite photoelectrons The analyzer
was operated at 37 8 eV constant pass energy at an energy scale calibrated versus the Au
4f 7/2 signal at 84 0 eV Under these conditions the full-width at half-maximum
(FWHM) of the Ag 3d5/2 line was 0 9 eV To compensate for the steady state charging
effects, binding energies have been normalized with respect to the position of the C Is
signal, resulting from the adsorbed hydrocarbons
5.2.5 Transmission FTIR spectroscopy
The transmission FTIR spectra were recorded on a Perkin Elmer System 2000
spectrometer Mixtures of 0 5 mg catalyst sample and KBr (Fluka) were finely ground and
agglomerated under pressure (15 MPa, 180 s) The transparent wafers were mounted on a
special sample holder in an environmental chamber and heated at 473 K in a flow of dried
nitrogen for 1 hour Before measurements the sample was cooled to 323 K to avoid a
broadening of the absorption bands Spectra were recorded with a resolution of 4 cm'in
the range of 4000 - 450 cm'accumulating 500 scans Background spectra were recorded
under identical conditions with a pure KBr wafer
Chromia on titania catalyst
Page 108
100
5.3 Results
5.3.1 Heat and mass transfer
Due to the small catalyst particle size in companson to the reactor diameter and a
quarz wool layer in front of the catalyst bed, plug flow was established over the whole
catalyst bed Theoretical calculations based on the criterion of Weisz and Prater (26)
indicated that no mass transfer limitation occurred in the investigated temperature range
The calculated maximum adiabatic temperature increase for 1000 ppm NO in the feed
was about 13 K The measured expenmental increase of the gas temperature for full
conversion at the highest space velocity amounted to 1 5 K Due to the negligible
increase of the temperature and the small particle size, temperature gradients in the
catalyst bed and catalyst particles were negligible
5.3.2 Stability of the catalyst
The effect of time on stream on the catalytic behavior of chromia/titania in the
selective reduction of NO by NH3 with and without water in the feed is depicted in
Fig 5-1 for a temperature of 473 K Starting with a dry feed, NO conversion and the
selectivity to N2O reached steady state within 30 mm Changing to a feed containing
5 % water resulted in an immediate sharp drop in NO conversion from 87 % to 42 %
Simultaneously a pronounced decrease of the undesired formation of N20 from 1 9 % to
0 5% was observed NO conversion further decreased with time on stream to reach a
new steady state value of 31 % after two hours, while N2O selectivity remained
constant The results manifest that the formation of N20 (73 % decrease) is slightly
more inhibited in the presence of water than the reduction of NO to N2 (64 % decrease)
Chapter 5
Page 109
101
The previous activity and selectivity of the catalyst was re-established within several
minutes if water was removed from the feed For a catalyst being on stream for 250 h
under varying reaction conditions a decrease in catalytic activity, combined with an
increase of the formation of N20 was observed Note that the same catalyst was used for
consecutive measurements at times in the following experiments thus leading to slightly
different conversion and selectivity values for similar reaction conditions The decrease
in activity is thereby reflected by the variation of the corresponding pre-exponential
factors k°i and k°2
- 8
10
c
6 .2
*->
c
4 oC
oo
200 300
time/min.
Figure 5-1. NO conversion and selectivity to N20 as a function of time on stream
for a chromia/titania catalyst being alternately exposed to dry and
wet feed conditions.
I NO conversion, • selectivity to N20, A H20 concentration, 0 or 5%
H20, gas flow rate = 300 ml/min(NTP), Trcactor = 473 K
Chromia on titania catalyst
Page 110
102
5.3.3 Influence of temperature
Fig 5-2 demonstrates die dependence of die NO conversion and the selectivity to
N20 on the temperature for different gas flow rates The symbols in this and the
subsequent figures indicate measured values, whereas the curves represent the predicted
conversions and selectivities from an Eley-Rideal model A detailed description of the
model is presented in a following part of this chapter The temperature dependence of
the NO conversion shows, that 90% NO are converted at 459 K for a flow rate of 300
ml(NTP)/min (Fig 5-2) Increasing the flow rate resulted in an increase of the
temperature to obtain 50% NO conversion from 424 K (300 ml/min) to 448 K (700
ml/min) Note that the amounts of NO and NH3 converted were equal within the
expenmental error for all expenments (not shown) From Fig 5-2 it is also apparent that
the selectivity to N20 is only influenced by the temperature and is independent of the
gas flow rate With raising temperature an increase of the formation of the undesired
N20 is observed
Chapters
Page 111
103
360 380 400 420 440 460 480 500 520
temperature /K
Figure 5-2. Conversion of NO (filled symbols) and selectivity to N20 (open
symbols) as a function of temperature for different gas flow rates.
A,A 300 ml(NTP)/min, 9,0 500 ml(NTP)/min, , 700 ml(NTP)/min,
Symbols indicate measured values, whereas the conversion and selectivity
curves (—) were calculated using the model described by Eqs 5-2 - 5-5
and the pre-exponential factors k i
tn^/kg s
86E-2 m3/kg s and k°2 = 2 4E-4
5.3.4 Influence of gas flow rate
Fig 5-3 shows the dependence of NO conversion on the ratio catalyst mass to gas
flow (W/F) for different temperatures Increasing the W/F ratio led to higher NO
conversions for all temperatures Integral analysis of the data presented in Figure 5-3
revealed reaction orders of one with respect to NO and of zero with respect to NH3 The
reaction orders were confirmed by vanation of the inlet concentrations of NO and NH3
Chromia on titania catalyst
Page 112
104
in the range of 200 ppm to 1000 ppm Good agreement of predicted and measured
conversions was achieved over the whole experimental range with the model based on
an Eley-Rideal mechanism
m (V*)-1 /kg m-3scatv ' acat
Figure 5-3. Influence of the weight/flow ratio (W/F) on the NO conversion for
different temperatures.
402 K, O 413 K, A 422 K, V 430 K, 443 K, 452 K, • 463 K, A
473K, T 483 K, catalyst weight = 0 35g, gas flow rates = 200 ml/min -
800 ml(NTP)/min Symbols indicate measured values, whereas the
conversion and selectivity curves (—) were calculated using the model
described by Eqs 5-2 - 5-5 and the pre-exponential factors k°i = 1 86E-2
m3/kg s and k°2 = 2 4E-4 m3/kg s
Chapter 5
Page 113
105
5.3.5 Influence of the ammonia concentration
Figure 5-4 illustrates the conversion of NO and NH3 for different NH3 reactor inlet
concentrations. No influence to the conversion of NO was observed as long as more
than 15 ppm NH3 was present at the reactor outlet (not depicted in Figure 5-4)
c
CO
1.0
0.8
0.6
O 0.4
c
o
"co0.2
0.0
\ •-.
^^^-A-=^— o —^H I
g A A £—1=^=,^
200 400
PNH ,in
3
600
/ppm800 1000
Figure 5-4. NO conversion as a function of the NH3 reactor outlet concentration.
A NO conversion and A NH3 conversion at 405 K, O NO conversion
and • NH3 conversion at 424 K, Feed: 1000 ppm NO, 200 -1000 ppm
NH3, 10% 02, balance N2, catalyst weight = 0.4 g, gas flow rates =
500 ml(NTP)/min.
Chromia on titania catalyst
Page 114
106
5.3.6 Effect of water
As revealed by Fig 5-1, the addition of water substantially influenced the
conversion of NO Fig 5-5A depicts the decrease in activity caused by water
concentrations of 1 - 6 vol % for temperatures in the range 471 K to 512 K The effect
of water on NO conversion is stronger for low temperatures and low concentrations of
H2O The expenmental data presented in Fig 5-5B show that water has not only an
impact on the conversion of NO, but also influences substantially the selectivity to
nitrous oxide Addition of water in the range 1 to 6 vol % strongly suppressed the
undesired formation of N2O, with the effect being more pronounced at higher
temperatures where comparably high selectivities to N2O would be attained in the
absence of water The deviation of measured values from the model predictions is in the
range of the experimental error for bom NO conversion and N20 selectivity
Chapter 5
Page 115
107
H O concentration /%2
Figure 5-5. NO conversion and selectivity to N20 as a function of the water
concentration in the feed gas for different temperatures.
471 K, • 481 K, A 492 K, T 500 K, 512 K,
gas flow rate = 500 ml(NTP)/min. Symbols indicate measured values,
whereas the conversion and selectivity curves (—) were calculated using
the model described by Eqs. 5-2 - 5-5 and the pre-exponential factors k°i
= 1.2E-2 irP/kg s and k°2 = 3.5E-4 m3/kg s.
Chromia on titania catalyst
Page 116
108
5.3.7 Influence of the oxygen concentration
The effect of oxygen on the catalytic behavior is presented in Figs 5-6 and 5-7 In
the absence of oxygen, conversion of NO was negligible in the temperature range
investigated, irrespective whether dry or wet conditions were applied Addition of a low
amount of oxygen (1500 ppm) to a dry feed already substantially increased NO
conversion, as revealed by the measurements at 456 K (Fig 5-6) The increase in NO
conversion was most pronounced for oxygen concentrations up to 2 vol % for all
temperatures, whereas for concentrations exceeding 2 vol % 02 the catalyst exhibited an
almost linear raise in activity No significant dependence of the selectivity to N2O on the
oxygen concentration was found
In the presence of 5 vol % water in the feed gas a similar behavior was observed
(Fig 5-7), although a linear dependence of NO conversion on oxygen concentration was
only found for higher O2 levels Similar slopes of the linear raise were observed for
oxygen concentrations higher than 6% with botii dry and wet feeds
Chapter 5
Page 117
109
O concentration /%2
Figure 5-6. Influence of oxygen concentration in the feed gas on the NO
conversion for a dry feed.
420 K, • 431 K, A 440 K, T 444 K, 456 K,
gas flow rate = 500 ml(NTP)/min. Symbols indicate measured values,
whereas the conversion and selectivity curves (—) were calculated using
the model described by Eqs. 5-2 - 5-5 and the pre-exponential factors k°i
= 1.76E-2 m3/kg s and k°2 = 5 8E-4 m3/kg s.
Chromia on mania catalyst
Page 118
110
O concentration /%2
Figure 5-7. Influence of oxygen concentration in the feed gas on the NO
conversion for a feed containing 5 % H20.
489 K, • 497 K, A 505 K, T 520 K,
gas flow rate = 500 ml(NTP)/min Symbols indicate measured values,
whereas the conversion and selectivity curves (—) were calculated using
the model descnbed by Eqs 5-2 - 5-5 and the pre-exponential factors k°i
= 0 7E-2 m3/kg s and k°2 = 7 5E-4 m3/kg s
5.3.8 Influence of the feed gas composition
The dependence of the formation of N20 on varying the feed gas composition is
illustrated in Fig 5-8 together with the corresponding conversions of NO and NH3 Feed
A had a composition of 1000 ppm NO, 1000 ppm NH3, 10% 02 and 5% H20 Feed B
contained no nitric oxide, and feed C no ammonia, respectively Starting with feed A the
conversions of NO and NH3 were comparable within the expenmental error After
switching off NO (feed B), the conversion of NH3 dropped from 86 % to 10 % and the
Chapter 5
Page 119
Ill
N20 concentration decreased simultaneously from 88 ppm to 10 ppm, corresponding to
a constant selectivity to N20 of 10 % The finding shows that the direct oxidation of
ammonia by oxygen is comparably small at 505 K and moreover results in a similar
selectivity to N2O In the absence of ammonia in the feed gas (feed C) NO conversion
decreased to zero and the formation of N20 was completely inhibited Presented results
obtained with feed A and feed B demonstrate that nitrogen and nitrous oxide are
predominantly produced by the reaction of NH3 with NO at 505 K and that the
contribution by direct oxidation of ammonia is negligible
1 0
X 08-z.
§ 06-
O 04-
W
CD
C 02
OO
00
feed A feed B feed A feed C feed A
fcfl^ „-,
,=fi=|
g—e-
--
-e-
100 150
time /min.
200
:160EQ.
,0.
c
o120 £
(0
80
40
200
03OC
oo
Figure 5-8. Influence of feed gas composition on the formation of N20 and on
conversion of NO and NH3, respectively.
D NHi conversion, A NO conversion, O N20 concentration, feed A
1000 ppm NO, 1000 ppm NH3, 10 % 02, 5 % H20, balance N2, feed B
1000 ppm NH3, 10 % 02, 5 % H20, balance N2, feed C 1000 ppm NO,
10 % 02, 5 % H20, balance N2 Gas flow rate = 500 ml(NTP)/min,
1 reactor= 505 K.
Chromia on titania catalyst
Page 120
112
5.3.9 Effect of SOz
The activity of the catalyst was irreversibly affected by the presence of
sulfur dioxide in the feed gas even at low concentrations of SO2 The poisoning effect of
sulfur dioxide as a function of the SO2 concentration is illustrated in Fig 5-9 At a
temperature of 503 K 30 ppm of S02 in the feed gas are sufficient for a distinct decrease
of the NO conversion The degree of deactivation is a function of the S02 concentration
and exposure time Dunng the deactivation SO2 is completely consumed After
changing to a feed without S02 the activity remained stable Increasing the S02
concentration m steps to 60 ppm and further to 90 ppm led to a continuous decrease in
NO conversion, while switching off SO2 resulted in stable activities No SO3 was
detected in the product stream over the whole experimental period Running the catalyst
at 503 K using the same feed stream without S02 for three hours revealed no change in
catalytic activity and the conversion remained on the low level Attempts were made to
regenerate the catalyst by heating at 573 K m a stream of pure nitrogen for 3 hours
During this treatment compounds such as ammonium sulfates or ammonium bisulfates
formed in the lower temperature range should decompose However, neither SO2 nor
SO3 were detected in the effluent gas stream and a subsequent conversion measurement
at 503 K showed no increase in activity If S02 was added at 573 K a further
deactivation was observed This indicated that the formation of ammonium sulfates or
ammonium bisulfates can not exclusively explain for the poisoning effect Moreover, no
loss of specific surface area and no significant change in porosity occurred during the
SO2 poisoning expenments Additional catalytic tests with the partly poisoned catalyst
in the temperature range 523 to 573 K, showed that not only the reduction of NO to N2
Chapter 5
Page 121
113
but also the undesired formation of N20 was affected by the poisoning At 573 K and a
gas composition of 10 % 02, 1000 ppm NO and 1000 ppm NH3 in N2 balance 100%
conversion and a selectivity of 98% to N2 were obtained Based on the assumption of
different sites being responsible for the formation of N2 and N20, we presume that the
sites which are involved in the undesired formation of nitrous oxide are much stronger
affected by S02 than sites which catalyze the reduction of NO to N2
1 u-
08-
OZ-^
^—A—A
JO
•s06-c
0
1i—AW
1——|
O^ -
"w 0 4- \\0)> A—A—A / W
§02- C ) / "-
oo^J,\^
J 1
100
50 100 150
time /min.
200
- 80
60
- 40
20
EQ.Q.
c
o
+->
c
<Doc
oo
CM
oCO
Figure 5-9. Effect of S02 on the conversion of NO.
A S02 inlet concentration, O S02 outlet concentration, I NO
conversion, feed composition 1000 ppm NO, 1000 ppm NH3, 10% 02,
5% H20, 0-90 ppm S02, balance N2, gas flow rate = 300 ml(NTP)/min,
Treactor = 503 K
Chromia on titania catalyst
Page 122
114
5.3.10 XPS analysis
In order to elucidate the nature of SO2 poisoning, XPS measurements were made
either with fresh catalyst samples or with catalysts exposed to SCR conditions with and
without SO2 in the feed Part of the samples were washed three times with bidistilled
water at a temperature of 353 K for 8 hours and subsequently dried under vacuum at
400K XPS measurements were made with the washed and unwashed samples Fig 5-10
shows the sulfur 2p signal which was only observed for the samples exposed to feeds
containing SO2 The binding energy of 169 1 eV indicates that sulfur is present as a
sulfate species (27, 28), but whether it is an adsorbed species or part of an ammonium or
chromium complex is not clear Dickinson et al (29) reported a sulfur 2p binding
energy of 169 1 eV with an asymmetric component on the higher binding energy side
for chromium sulfate The binding energy of the S 2p orbital of (NH4)2S04 is found at
168 3 eV (30), which is substantially lower than the value observed in the present work
Moreover, no significant changes in the signals for the other elements (O Is, Cr 2p,
C Is), and especially of the N Is signal, were observed In addition, the signal due to
sulfur is still present after treatment of the catalyst with water (Fig 5-1 OB), which
should eliminate soluble ammonium sulfate This suggests that predominantly a sulfate
type complex of chromium (or titanium) is present on the catalyst surface Upon
treatment of the catalyst with water at 353 K, the semiquantitative analysis revealed a
decrease of the sulfur surface concentration from 1 6 at % to 1 2 at % and a concomitant
increase of the chromium surface concentration from 7 7 to 9 3 at %, thus indicating that
the detected sulfate species could partly originate from soluble ammonium sulfates or
ammonium bisulfates
Chapter 5
Page 123
115
3
CO
c
175 170 165 160
binding energy / eV
Figure 5-10. XP spectra of S 2p core level of (A) fresh catalyst, (C) catalyst after SCR
reaction in a feed containing 90 ppm S02, and (B) the same catalyst after
subsequent treatment with water at 353 K for 8 hours to remove soluble
sulfate species
5.3.11 Transmission FTIR-spectroscopy
The transmission FTIR measurements were made with catalyst samples after use
in SCR with and without S02 in the feed Only one weak additional band at 1115 cm
was perceptible (Fig 5-11) upon exposure of the catalyst to a feed containing 90 ppm
SO2 No other significant differences in the spectra were observed The reported ranges
of the characteristic absorptions of sulfates (1000 - 1420 cm ') and sulfites (980 - 1225
cm ') (31) include the observed band This is a further indication that a sulfate or sulfite
Chromia on titania catalyst
Page 124
116
type species was formed on the catalyst surface during the exposure to the SO2
containing SCR-feed
100
o; 90
c
o
'tn<n
E<2 80
C3
70800
SCR feed without SO
1400
Figure 5-11. Transmission FTIR-spectra of a catalyst after SCR reaction with a SO?
free feed and with a feed containing 90 ppm SO2, respectively
5.3.12 Kinetic modeling
The kinetic model used to describe the experimental results was based on the
overall stoichiometric reactions expressed by the Equations rl and r2 Equation rl
represents die mam reaction of the selective catalytic reduction of NO for an oxygen
containing flue gas, whereas Equation r2 descnbes the side reaction responsible for the
undesired formation of nitrous oxide In all expenments the amounts of NO and NH3
consumed during the reaction were comparable within the expenmental error, indicating
that NO reacts stoichiometncally with NH3 under the reaction conditions investigated
Regarding the stoichiometry of the side reaction, the expenmental results depicted in
Chapter 5
Page 125
117
Fig 5-8 suggest that in the presence of water N20 is predominantly formed by the
stoichiometnc reaction of NO with NH3 in the investigated temperature range However,
substantial amounts of ammonia are oxidized directly to N2 and N20 in the absence of
NO (Fig 5-8) These findings support the assumption of a reaction stoichiometry
according to Equations rl and r2 under typical SCR conditions over Cr203/Ti02
4N0 + 4NH3 + 02->4N2 + 6H20 (rl)
4 NO + 4 NH3 + 3 02 -* 4 N20 + 6 H20 (r2)
Different approaches based on Langmuir-Hinshelwood and Eley-Rideal models
were investigated for setting up the kinetic equations The number of kinetic parameters
was minimized in order to prevent an overfitting of the obtained results The best
description of die kinetics was achieved with the following approach
The reaction rate is first order in NO and zeroth order in ammonia for the main
and the side reaction
The inhibition of the main and side reaction by water is caused by a Langmuir
adsorption of water on the active sites
The reoxidation of the catalyst determines the number of the active sites and can
occur with adsorbed oxygen as well as with oxygen from the gas phase
Water inhibits the reoxidation by a competitive Langmuir type adsorption
Chromia on titania catalyst
Page 126
118
The reaction orders of NH3 and NO were established by varying the inlet
concentrations of NO and NH3 in the range of 200 ppm to 1000 ppm and by integral
analysis, which involves a comparison of the expenmental data with values predicted by
the model The zeroth order in ammonia suggests a strong adsorption of ammonia The
assumption that the main and the side reaction have the same reaction orders implies
that a variation of the NO or NH3 concentration has no effect on selectivity Figure 5-2
indeed shows that the same selectivity is observed for different conversions upon
varying the gas flow rate at a constant temperature As different conversions involve
different concentrations of NO and NH3, this finding confirms our assumption
The inhibition by water could be caused by the competitive adsorption of water
and ammonia, but no sufficient fitting was achieved under this assumption Good fitting
was obtained on condition that part of the active sites are covered independently by
water The temperature dependencies of the adsorption equilibrium constants Kh2o and
Kh2o(2) were significant which allowed us to estimate the heats of adsorption (AHh2o)
and the pre-exponential factors (K°h2o) for the main and the side reaction (Table 5-1)
For die reoxidation of the catalyst gaseous as well as adsorbed oxygen were taken
into account This can be justified by the observed sharp increase of NO conversion in
the range of low oxygen concentrations and the linear dependence in the higher 02
concentration range Worse fitting was obtained if only one type of reoxidation was
considered An empirical weighing factor was introduced to account for the different
influence on reoxidation by either gaseous or adsorbed oxygen The promoting effect of
oxygen has to be the same for the main and the side reaction because the selectivity was
independent of the oxygen concentration The observed inhibiting effect of water on the
Chapter 5
Page 127
119
adsorption of oxygen was considered in the model by taking into account competitive
adsorption of O2 and H20
In order to prevent any distortion of the parameter estimation by the observed slow
decrease of catalytic activity and the simultaneous slight increase of the selectivity to
N2O with time on stream, the pre-exponential factors were adjusted according to the
aging of the catalyst Separate parameter estimation with used and fresh catalysts
showed that only the pre-exponential factors k°i(Tref) and k°2(Tref) changed Based on
this assumption the reaction rates for the reduction to N2 (ri) and for the formation of
N20 (r2), respectively, are described by the following equations
r, = k,
nPo +
f
nPo +
Ko,Po,1 + Ko,Po: +kwPh,(
Ko2Po,i + K^Po, +kwPh!o,
1 + ^h!o,1)Ph!o
1 + kh!o,!)Ph2o
k,(T) = ^(Tref)exp1 1
R T T_,
KH]0(|i(T) = K°H!0(ii(Tref)exp
Tf=450K
f-AHu 1 1
R I I.
Pno (5-2)
Pno (5-3)
(5-4)
(5-5)
To reduce the correlation between the pre-exponential factors (k ,(Trcf),
K H2o(Tref)), the activation energies (EA), and the enthalpies of adsorption (AH,), the
reaction rate constants (k,) and the equilibrium constant of adsorption (Kh o ) were
expressed as proposed by Himmelblau (32) All estimated parameters of the kinetic
model are listed in Table 5-1
Chromia on titania catalyst
Page 128
120
Table 5-1. Estimated parameters for kinetic model decnbed by Eqs 5-2 - 5-5
parameter value standard deviations units
k°, 1 9e-2 - 0 7e-2 0 01e-2-0 06e-2 mVkgs
EA. 60 08 kJ/mol
k°2 2 4e-4 - 7 5e-4 0 04e-4 - 0 6e-4 m3/kgs
Ea2 115 16 kJ/mol
If0
KH20(l,
6 0e-4 0 7e-4 Pa1
AHH20(„ -43 4 kJ/mol
KV(2, 15e-2 0 3e-2 Pa1
AHH20(2) -77 4 kJ/mol
n 8 9e-5 0 7e-5 Pa1
Ko2 4 8e-3 0 6e-3 Pa1
Kw 12e-3 03 Pa1
5.4 Discussion
The kinetic behavior of the 10 wt % Cr203/Ti02 catalyst is comparable with
findings of Wong and Nobe (22) for titania supported vanadia and chromia catalysts for
which a reaction rate first order in NO and zeroth order in NH3 is proposed The integral
analysis of the experimental data revealed a zeroth order reaction with respect to NH3,
suggesting that the catalyst is completely covered by ammonia under reaction
conditions, which is reasonable for low temperatures At higher temperatures and for
low ammonia concentrations the coverage is not complete and ammonia adsorption has
Chapter 5
Page 129
121
to be considered in the model (33) Based on temperature-programmed desorption and
in situ diffuse reflectance FTIR measurements, Schneider et al (34) proposed that the
presence of Br0nsted bound ammonia is a necessary requirement for the reduction of
NO to N2 over CrOx/Ti02
The observed first-order reaction with respect to NO indicates that gaseous NO is
involved in the rate limiting step This finding would support an Eley-Rideal
mechanism, as proposed similarly for vanadia based catalysts The same reaction order
in NO would be expected if the adsorption of NO is involved in the rate limiting step
As opposed to vanadia based catalysts, where the adsorption of NO has only been
reported under reducing conditions (35, 36), the adsorption of NO on chromia was
observed by several authors Kugler et al (37) suggested that nitric oxide adsorbs on
reduced chromia surface in the form of a CIS-N2O2 dimer and as an N02 chelate surface
complex The same surface species were observed on a-Cr203 but not on amorphous
chromia (38) On 0C-Cr2O3, these two species are discussed to be formed by oxidation of
adsorbed NH3 molecules and are intermediates on the reaction pathway to N2O (38)
Schneider et al (9) observed by FTIR bands due to surface bound NO under reaction
conditions on Cr02/Ti02, but not on Cr203/Ti02 The question whether adsorbed or
gaseous NO reacts with ammonia on the surface of chromium based catalysts is still
unresolved and no conclusive statement can be given based on experimental evidence
In analogy with supported vanadia catalysts, Schneider et al (9) observed
Br0nsted sites even at higher temperatures for Ci203fTi02 catalysts During SCR, N20
is formed by oxidation of Lewis-bound ammonia with NO and/or oxygen present in the
feed gas In the case of &2O3, with no adsorbed NO, oxidation of ammonia to N20
occurs at temperatures higher than 450 K (9) In the absence of NO only Lewis bound
Chromia on titania catalyst
Page 130
122
ammonia is observed above 420 K, which is oxidized to N2 and N20 (34) At higher
temperatures ammonia oxidation to NO is favoured in the presence of oxygen In our
expenments we observed in the presence of NO that N20 was mainly formed by the
reaction of NH3 with NO (Fig 5-8) The direct oxidation of NH3 by 02 to N2, N20 and
H20 was negligible in comparison to the main reaction However, based on our results it
can not be excluded that NH3 is oxidized to NO in a first step, followed by subsequent
reaction to N2 and N20 under certain conditions The fact that differences in the
selectivity of used and fresh catalysts have only an influence on the pre-exponential
factors indicates that the reaction to N2 and N2O, respectively, occur on different sites in
accordance with findings by Schneider et al (34, 9) The estimated adsorption enthalpy
of water amounted to -43 kJ/mol for the reaction to N2, and -77 kJ/mol for the reaction
to N20, respectively, which is a further indication of different sites being responsible for
the main and the side reaction Taking into account the estimated adsorption enthalpies
and the observed inhibition of the NO conversion, it can be assumed that water adsorbs
stronger on a Lewis site than on a Br0nsted site
The role of water in the reversible inhibition of the SCR reaction is not fully
understood yet Water can be involved in the rate limiting step or block the active sites
If the inhibition by water is due to a competitive adsorption between water and
ammonia, the reaction order of ammonia should not equal zero in the presence of water
In the model we assumed kinetics of first order in NO and zeroth order in NH3 in the
presence and absence of water These assumptions necessitate a linear temperature
dependency of die reaction rate in the Anhenius-type plot The data depicted in Figure
5-12 confirm our assumption of the reaction orders for NO and NH3 in presence and
absence of water in the feed gas
Chapter 5
Page 131
123
-2 5-
-3 0-
S-3 5-
_tz
-4 0-
-45--
0 00195 0 00200 0 00205 0 00210 0 00215
1/T/K-1
Figure 5-12. Arrhenius type plot for kinetic tests under standard conditions with a feed
containing 5 % H2O, gas flow rate = 500 ml(NTP)/min
The variation of ammonia concentration in the feed gas led to small changes of the
NO conversion, which were in the range of the experimental error and could also be
caused by the observed slow deactivation of the catalyst in the presence of water at high
temperatures An estimation of the adsorption constant of ammonia in a statistically
significant way was not possible due to the lack of accurate data at low NH3
concentrations No successful fitting was achieved with models based on an assumption
of a competitive adsorption between water and ammonia
Oxygen plays a crucial role in SCR for vanadia and chromia based catalysts (16,
39) Schneider et al (34) demonstrated by TPD experiments that CrO,/Ti02 reduced by
ammonia is inactive for the selective catalytic reduction of NO They suggested that a
partially oxidized state of the surface must be maintained for SCR A marked increase in
activity and a concomitant decrease in the selectivity to N20 upon addition of 0 1 % O2
Chromia on titania catalyst
Page 132
124
to the SCR feed was also reported for amorphous chromia by Duffy et al (16) In
accordance with these results we found that in the absence of oxygen the reaction rate
collapsed Below 1 vol % oxygen in the dry feed, and below 2 vol % oxygen for a feed
containing 5 vol % water, a sharp raise in activity was observed with increasing oxygen
concentration For higher oxygen concentrations, a smaller linear increase was found
(Figs 5-6 and 5-7 ) The description of the kinetic conversion curves by a power law
approach, implementing a Freundlich isotherm, was not satisfactory By using a Temkin
isotherm good fitting was only achieved for the range between 2 and 10 vol % oxygen
and by assuming a pure Langmuir isotherm, only the concentration range below 5 vol %
could be fitted properly The linear dependence of NO conversion on oxygen
concentration led us to the assumption that an additional path of reoxidation of the
catalyst takes place, which involves gas phase oxygen and which is significant for
higher oxygen partial pressures This assumption in combination with the model based
on a Langmuir-type adsorption resulted in the best description of the oxygen
dependency for the investigated expenmental range Water in the feed gas inhibited the
path of the reoxidation via adsorbed oxygen The inhibition was significant and was
taken into account by a competitive adsorption of oxygen and water The adsorption
equilibrium constant was about four times smaller for water than for oxygen
The nature of SO2 poisoning of the chromia on titania catalyst differs from fouling
effects caused by ammonium sulfate deposition observed on vanadia based catalysts,
where the effect is reversible (18) Ammonium sulfate or bisulfate decomposes at higher
temperatures and no fouling is expected for reaction temperatures above 530 K In our
case the catalyst was also poisoned at temperatures of 573 K, as well as m the presence
of low S02 concentrations Attempts to reactivate the catalyst either by heating in pure
Chapter 5
Page 133
125
nitrogen at 573 K, or by washing with water failed Note that no significant change of
the specific surface area and the pore size distribution was perceptible after the S02
poisoning experiments Observed changes of the selectivity after the exposure to S02
indicate that the process of poisoning may be different for the sites responsible for N2
and N20 formation, respectively The sites which produce N2O are mainly poisoned by
S02 XPS as well as FTIR measurements revealed the presence of sulfate species on the
catalyst surface The affinity of these species to the Lewis acid sites seems to be stronger
than to the Br0nsted sites This is m accordance with the stronger inhibition by water
and the postulated stronger adsorption of ammonia on Lewis acid sites (36) Lower SCR
activity upon deposition of sulfate ions on amorphous chromia was attributed by Zhang
et al (20) to strong adsorption of NH3 which prevents chromia from reacting with NO
5.5 Conclusions
Chromia supported on titania exhibits high activity and selectivity to N2 in the
catalytic reduction of NO in the temperature range 400 - 520 K Applying a modified
preparation procedure resulted in a catalyst containing > 95 wt % poorly crystalline
Cr203, which shows significantly lower tendency for N20 formation compared to Cr02
or crystalline a- &2O3
The addition of water decreases NH3 and NO conversion and increases the
selectivity to N2 The effect of water on activity and selectivity is reversible Similar as
with vanadia based catalysts, the activity collapsed in the absence of O2 in the feed gas
Low amounts of oxygen resulted in a sharp increase of the reaction rate The addition of
Chromia on titania catalyst
Page 134
126
SO2 led to irreversible poisoning of the catalyst, which restricts application of this
catalyst to SO2 free waste gases
With a model based on an Eley-Rideal mechanism good prediction of the kinetic
behavior was obtained for the temperature range 400-520 K and for a S02 free feed gas
5.6 Notation
rrica, = catalyst mass, kg
V* = gas flow (NTP), m3/s
r, = reaction rate, Pa m3 / kg s
k, = reaction rate constant, m3 / kg s
KA = adsorption equilibrium constant of component A, Pa
k°, = pre-exponential factor of the reaction rate constant, m / kg s
K°h2o = pre-exponential factor of the adsorption equilibnum constant of H20, Pa'
AHh2o,
= adsorption enthalpie of water, kJ/mol
n = empirical weighting factor for the reoxidation, -
5.7 References
1 Bosch, H and Janssen, F, Catalysis Today 2,369 (1988)
2 Curry-Hyde, E and Baiker, A ,Ind Eng Chem Res 29, 1985 (1990)
3 Engweiler, J, Nickl, J, Baiker, A, Kohler, K, Schlapfer, C W and von
Zelewsky, A ,J Catal 145, 141 (1994)
Chapter 5
Page 135
127
4 Curry-Hide, H E, Musch, H and Baiker, A , Appl Catal 65, 211 (1990)
5 Duffy, B L, Curry-Hyde, H E
,Cant, N W and Nelson, P F
,J Catal 154, 107
(1995)
6 Schraml-Marth, M , Wokaun, A , Curry-Hyde, H E and Baiker, A ,J Catal 133,
415(1992)
7 Wong, W C and Nobe, K ,Ind Eng Chem Prod Res Dev 25, 179 (1986)
8 Kohler, K, Engweiler, J
, Viebrock, H and Baiker, A, Langmuir 11, 3423
(1995)
9 Schneider, H , Maciejewski, M ,Kohler, K
, Wokaun, A and Baiker, A ,J Catal
157,312(1995)
10 Maciejewski, M , Kohler, K , Schneider, H and Baiker, A,J Solid State Chem
119, 13 (1995)
11 Kohler, K , Maciejewski, M , Schneider, H and Baiker, A,J Catal 157, 301
(1995)
12 Bauerle, G L, Wu, S C and Nobe, K ,
Ind Eng Chem Prod Res Dev 17, 117
(1978)
13 Inomata, M , Miyamoto, A and Murakami, Y ,J Catal 62, 140 (1980)
14 Jung, J and Panagiotidis, T ,Chemie im Kraftwerk 1990, 1 (1990)
15 Odenbrand, C U I, Gabnelsson, P L T, Brandin, J G M and Andersson, L A
H,Appl Catal 78, 109(1991)
16 Duffy, B L, Curry-Hyde, H E
, Cant, N W and Nelson, P F, Appl Catal B
Environmental 5, 133 (1994)
17 Willey, R J, Lai, H and Pen, J B
,/ Catal 130, 319 (1991)
18 Kittrell, J R, Eldndge, J W and Conner, W C
, Catalysis 9, 126 (1992)
Chromia on titania catalyst
Page 136
128
19 Yang, R T, Chen, J P
, Kikkmides, E S and Cheng, L S,Ind Eng Chem 31,
1440(1992)
20 Zhang, G, Buckingham, S
, Curry-Hyde, H E and Cant, N ,APCChE 3, 31
(1993)
21 Nnyama, H , Murata, K and Echigoya, E ,J Catal 48,201 (1977)
22 Wong, W C and Nobe, K,Ind Eng Chem Prod Res Dev 25, 179 (1986)
23 Nam, I S, Eldridge, J W and Kittrell, J R
,Ind Eng Chem Prod Res Dev 25,
186(1986)
24 Robinson, W R A M, van Ommen, J G, Woldhuis, A and Ross, J R H,
Proceedings of the 10th International congress on Catalysis 19-24 July,
Budapest, Hungary, 2673 (1992)
25 Tufano, V and Turco, M , Appl Catal B Environmental 2, 133 (1993)
26 Weisz, P B and Prater, C D,Advances in catalysis and related subjects 6, 144
(1954)
27 Briggs, D and Seah, M P, "Practical Surface Analysis by Auger and X-Ray
Photoelectron Spectroscopy"
J Wiley, Chichester, 1985
28 Wagner, C D et al, "Handbook of X-Ray Photoelectron Spectroscopy ", Perkin
Elmer (Physical Electronics Division), Eden Prairie, 1978
29 Dickinson, T, Povey, A F and Sherwood, P M A, J Chem Soc Faraday
Trans 772,686(1976)
30 Barbaray, B , Contour, J P and Mouvier, G ,Env Sci Technol 12, 1294 (1978)
31 Pretsch, E , Seibl, J, Simon, W and Clerc, P D ."Strukturaufklarung organischer
Verbindungen mit spektroskopischen Metiioden", Springer-Verlag, Berlin, 1981
Chapter 5
Page 137
129
32 Himmelblau, D M,"Process Analysis by Statistical Methods" Wiley, New York,
1970
33 Efstathiou, A M and Fhatoura, K, Appl Catal B Environmental 6, 35 (1995)
34 Schneider, H,Scharf, U
, Wokaun, A and Baiker, A ,J Catal 147, 545 (1994)
35 Odriozola, J A, Hememann, H
, Somorjai, G A,
la Banda, J F G d and
Pereira, P,7 Catal 119,71 (1989)
36 Srnak, T Z, Dumesic, J A
, Clausen, B S, Tornqvist, E and Tops0e, N -Y J
Catal 135,246(1992)
37 Kugler, E L, Kadet, A B and Gryder, J W, / Catal 41, 72 (1976)
38 Schraml-Marth, M , Wokaun, A , Curry-Hyde, H E and Baiker, A ,J Catal 134,
75 (1992)
39 Janssen, F J J G,v den Kerkhof, F M G
, Bosch, H and Ross, J R H,J
Phys Chem 91,5921(1987)
Chromia on titania catalyst
Page 138
Leer - Vide - Empty
Page 139
6
Comparison of the investigatedcatalysts
6.1 Catalytic performance in the low temperature range
The comparison of the performance of the catalysts was carried out using the
proposed kinetic models to calculate NO conversion and selectivities to N2O for the
different catalysts In the case of the CrOx/Ti02 catalyst the kinetic parameters estimated
with fresh catalyst samples were used to exclude deactivation effects It is obvious from
Figure 6-1 that for a dry feed the vanadia-titania aerogel exhibited the highest NO
conversion rate, followed by the titania supported chromium oxide catalyst and the
commercial vanadia based catalyst The commercial catalyst was less and the
chromoxide catalyst most affected by water Significant formation of the undesired
nitrous oxide was only observed for the chromium oxide on titania catalyst The
addition of 5% water to the dry feed suppressed NO conversion for all catalysts
(Fig 6-2) The comparison of the temperature dependence of the undesired formation of
nitrous oxide for CrOx/Ti02 shows a a lower selectivity for the feed containing 5%
water
The highest estimated activation energy was obtained for the vanadia based
commercial catalyst with 99 kJ/mol for the wet feed, and 87 kJ/mol for the dry feed,
respectively The higher activation energy in the presence of water, may be due to the
adsorption of water Considering a Langmuir type adsorption the adsorption equilibrium
Comparison of the investigated catalysts
Page 140
132
constant of water decreases exponentially with increasing temperature (1). Due to this
temperature dependence, the adsorption of water can cause an increase of the apparent
activation energy.
For the aerogel catalyst with a several times higher vanadia content than the
commercial catalyst the estimated activation energy amounted to 60 kJ/mol. This is in
accordance with the findings of Amindis and Solar (2), who found a significant
decrease in activation energy with increasing vanadia surface concentration in presence
and absence of H2O and S02. A similar activation energy of 60 kJ/mol was observed for
CrOx/Ti02.
1 .u-
V O/TiO2 5
-Aerogel/ /'
0.8- /CrO/TiO /'x 2/
O2
/ commercial DeNO
*- 0.6-O
'
catalyst
c m1 /
;
0 / //
'2 0.4- -+-*'
03 '^_ //
> / '
C /
8 0.2-/ /
,
' 'CrO /TiO,* X 2
jf ,'
^\_---
---*'
0.0- 1 f*r y„ , *——r -'
1'
1 '
1 0
0.8
OCM
0.6 Z
O
0.4 ">
o
_0)
0.2 OT
0.0
350 400 450 500 550 600
temperature /K
Figure 6-1. NO conversion and N20 selectivity versus temperature for the different
catalysts in the absence of water.
Simulation conditions: feed: 10% 02, 1000 ppm NO, 1000 ppm NH1?
balance N2, 1.1 bar pressure, gas flow = 500 ml(NTP)/min, catalyst weight
= 0.1g.
Chapter 6
Page 141
133
1.0
0.8
0 0.6
c
1 0.4
>C
o" 0.2
0.0-I r
commercial DeNO
catalyst
1.0
0.8
OCM
0.6 Z
O
0.4 •§O
0 o CDUiL
CO
0.0
550 600
temperature /K
Figure 6-2. NO conversion and N20 selectivity versus temperature for the different
catalysts in the presence of water.
Simulation conditions: feed: 10% 02, 5% H20, 1000 ppm NO, 1000 ppm
NH3, balance N2, 1.1 bar pressure, gas flow = 500 ml(NTP)/min, catalyst
weight = 0.1 g.
6.2 Influence of the exhaust composition on the kinetics
All investigated catalysts showed similar dependencies on the oxygen and water
concentration, respectively. 02 accelerated and H20 decreased the reaction rate. The
effects were less pronounced for higher water and oxygen concentrations. Carbon
dioxide showed no significant influence on the kinetic behavior for all catalysts. Sulfur
dioxide poisoned the CrOx/Ti02 catalyst markedly, whereas the vanadia based catalysts
showed a sufficient resistance to S02.
Comparison of the investigated catalysts
Page 142
134
6.3 Conclusions
The companson of the catalysts under real SCR conditions, 1 e in the presence
of water, showed a distinct improvement of the catalytic performance in the lower
temperature range for the newly developed catalysts Due to the high specific surface
and the high vanadia content compared with the other catalysts, the V205/Ti02 aerogel
exhibits a high activity at very low temperatures
6.4 References
1 Satterfield C N "Heterogeneous Catalysis in Industrial Practice', 2nd edition,
McGraw-Hill, New York, 1991
2 Amindis D M,Solar J P
,Ind Eng Chem Prod 35, 978 (1996)
Chapter 6
Page 143
Final Remarks
The aim of this study was to investigate and model the kinetic behavior of new
promising SCR catalysts, which were developed in our laboratory during the last few
years
It has been shown that vanadia-titania aerogels are highly active and selective for
the selective catalytic reduction of NO by NH3, particularly in the low temperature
range It was possible to improve the chemical properties of the chromoxide based
catalysts using a new pretreatment without calcination A significantly lower selectivity
to N20 was achieved, improving the efficiency for the removal of nitrogen oxides at low
temperature
In the future, the elimination of the hindrances to an industrial application has to
be in the focus of the research In the case of the vanadia-titania aerogel catalyst, the
preparation has to be modified to lower the costs, and proper methods to manufacture
the catalyst in a geometric form, which has sufficient mechanical strength against
abrasion and erosion and low pressure drop, has to be developed The main hindrance
for the CrOx/Ti02 catalyst is the lack of resistance to the poisoning by SO2 In the case
of a successful improvement of the resistance to poisoning, this type of catalyst would
be an interesting alternative to the existing commercial vanadia based catalysts
especially in the lower temperature range
The investigations of the commercial catalysts showed that with simple models
the kinetic behavior can be explained However a proper scale up needs further
investigations of the makrokinetics, which also include mass and heat transfer In the
future the dynamic behavior during the start up and the shut down procedure, will have
growing importance The control of the NOx emission and the ammonia slip during
these sequences needs further research and is in the focus of the present research in our
laboratory
Final Remarks
Page 144
List of Publications
The following list summarizes the papers which resulted from this study.
"Selective reduction of NOx by NH3 over commercial DeNOx catalyst'
Parametnc Sensitivity and kinetic modeling", Willi R., Roduit B., Koppel R. A, Wokaun
A and Baiker A., Chem. Eng. Sci 51, 2897 (1996).
"High Performance Aerogel DeNOx Catalyst: Catalytic Behavior and Kinetic
Modeling", Willi R., Koppel R. A. and Baiker A., submitted to Ind. Eng. Chem. Res..
"Selective Reduction of NO by NH3 over Chromia on Titania Catalyst-
Investigation and Modeling of the Kinetic Behavior", Willi R., Maciejewski M., Gobel
U., Koppel R. A. and Baiker A., submitted to J. Catal..
List of Publications
Page 145
Curriculum Vitae
Name:
Date ofbirth:
Place ofbirth.
Nationality:
Willi, Rene
November 11, 1967
Zurich
Swiss, citizen of Mels (SG)
Education:
1974 - 1980 Primary School, Mels (SG)
1980 - 1982 Intermediate School, Mels (SG)
1982 - 1986 Grammar School Type C, Sargans (SG)
1987 - 1992 Chemical Engineering studies at the Swiss Federal Institute of
Technology (ETH), Zurich
1993 - 1996 Ph.D. Thesis under the supervision of Prof. Dr. A.
Baiker at the Department of Chemical Engineering
and Industrial Chemistry of the ETH Zurich
Curriculum Vitae


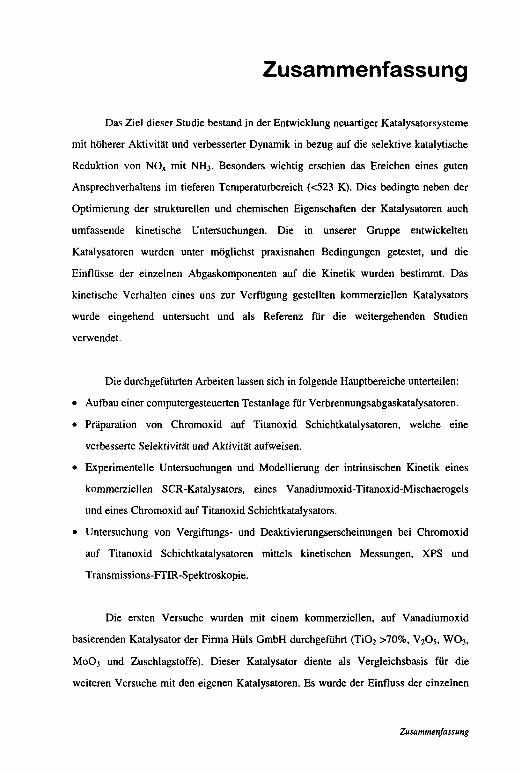
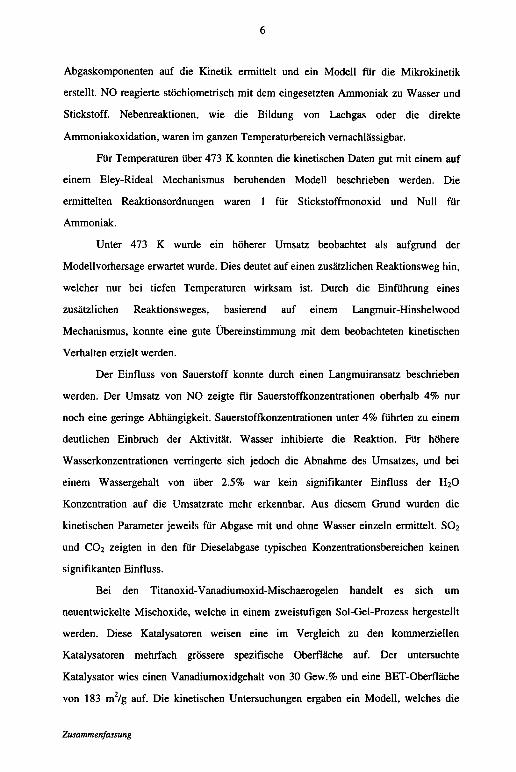


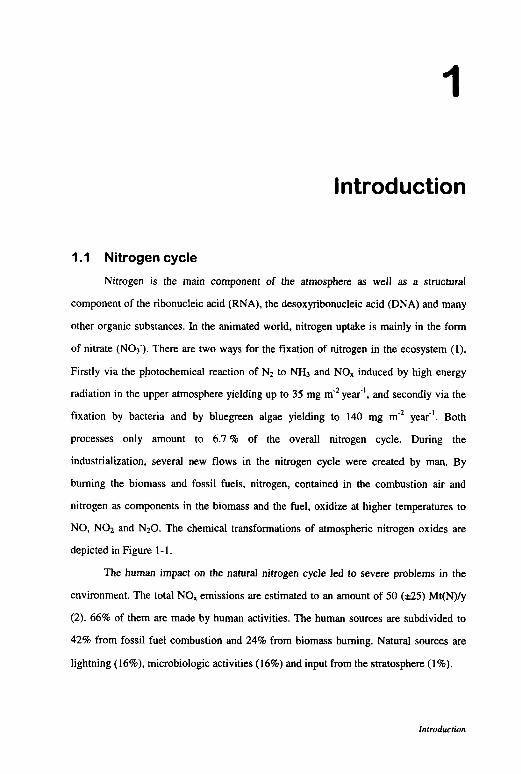
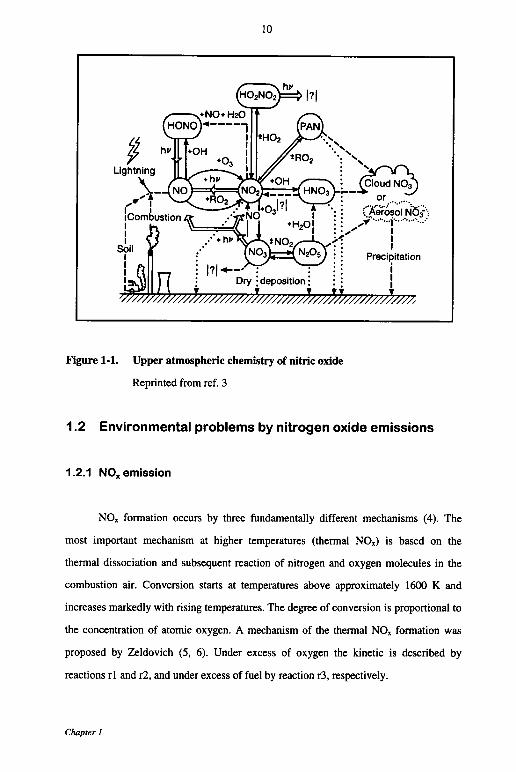


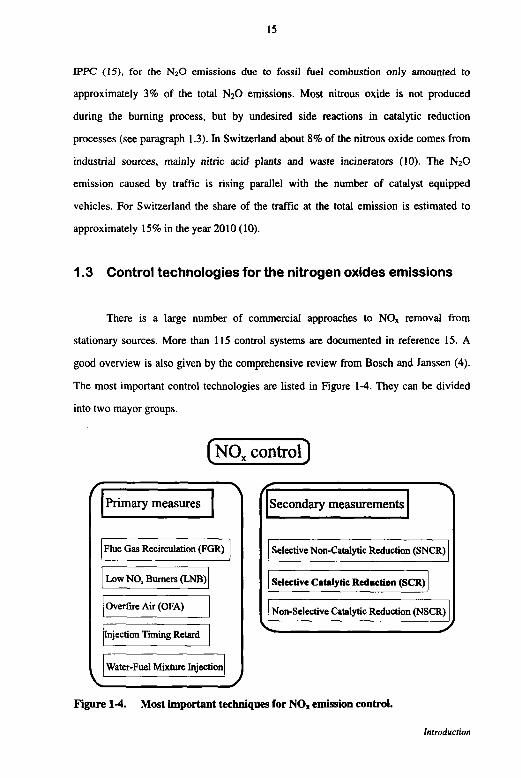
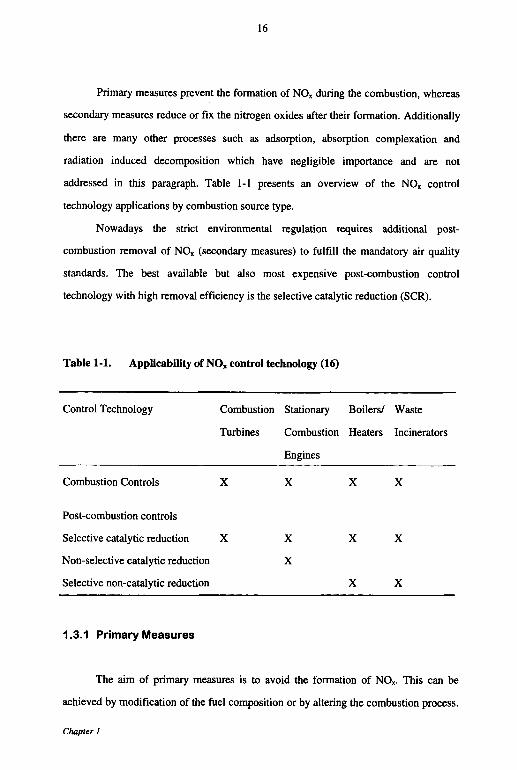


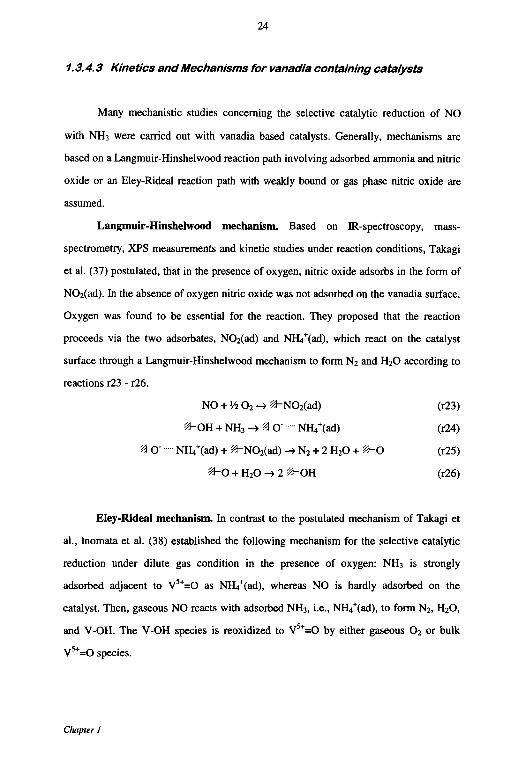

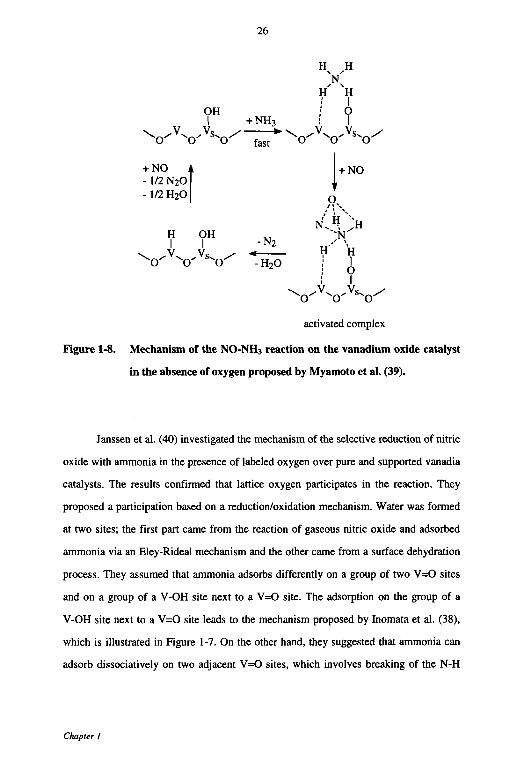

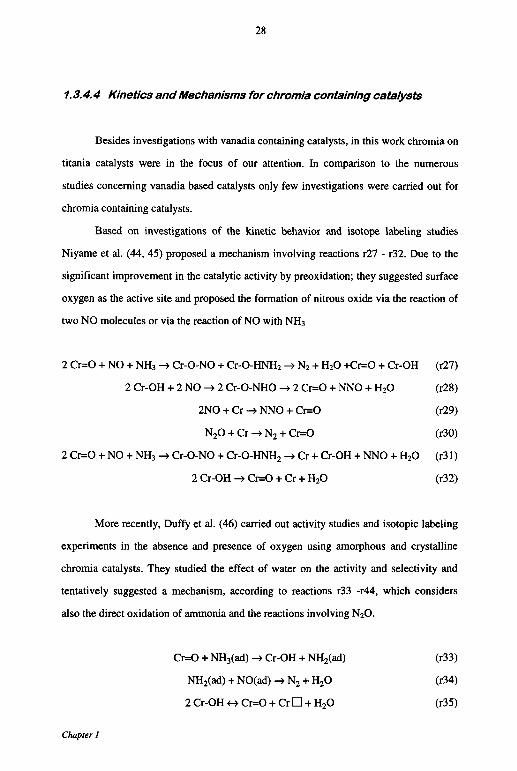


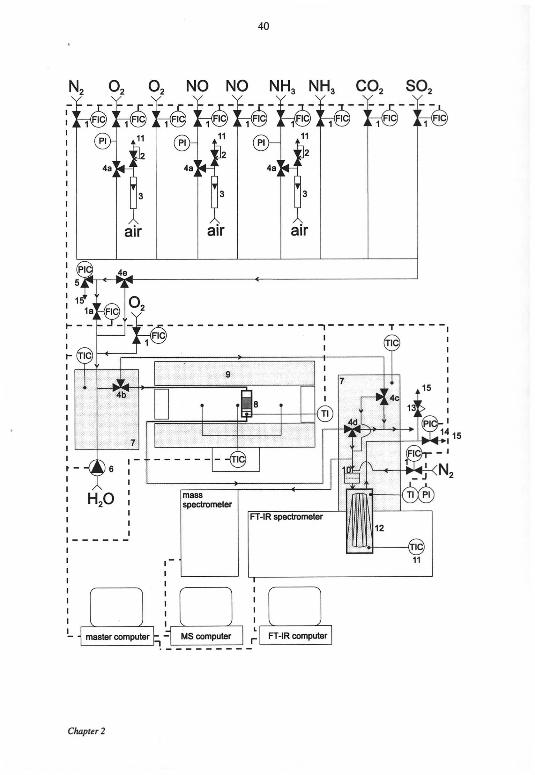


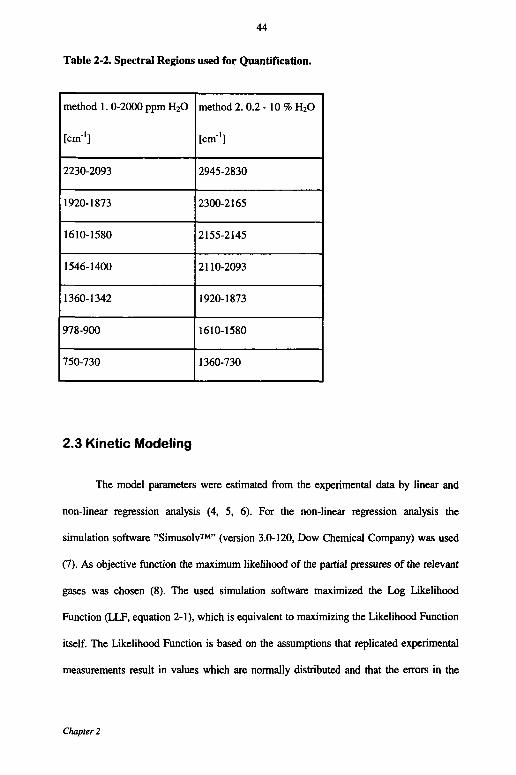
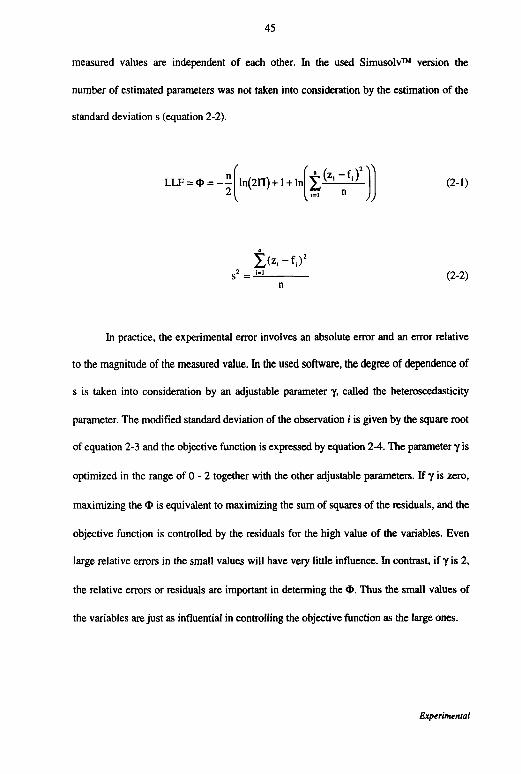
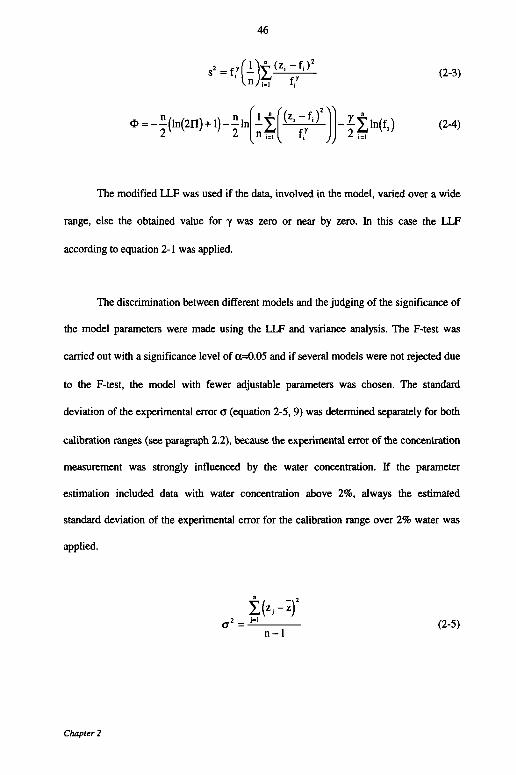


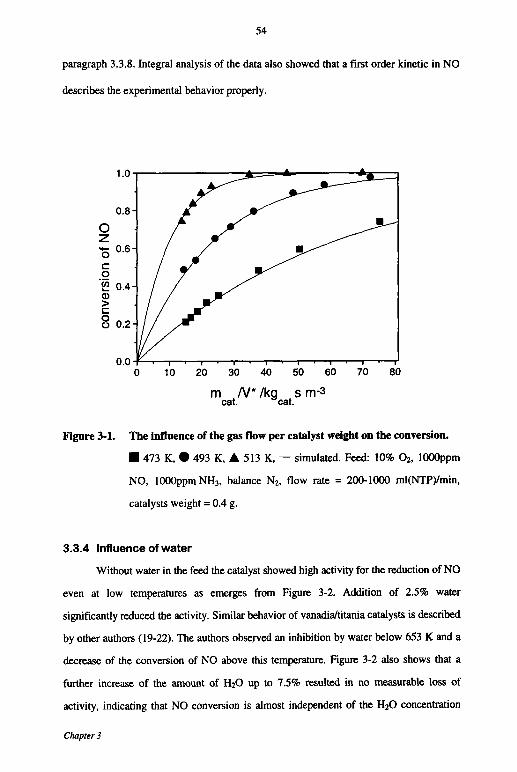


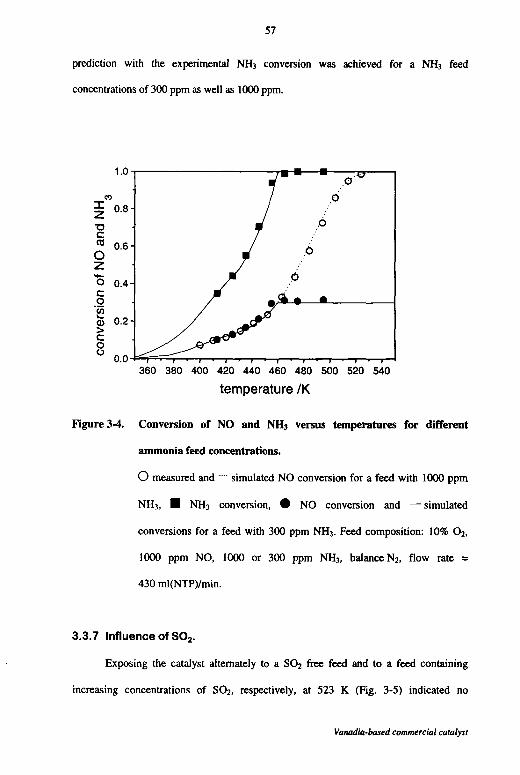


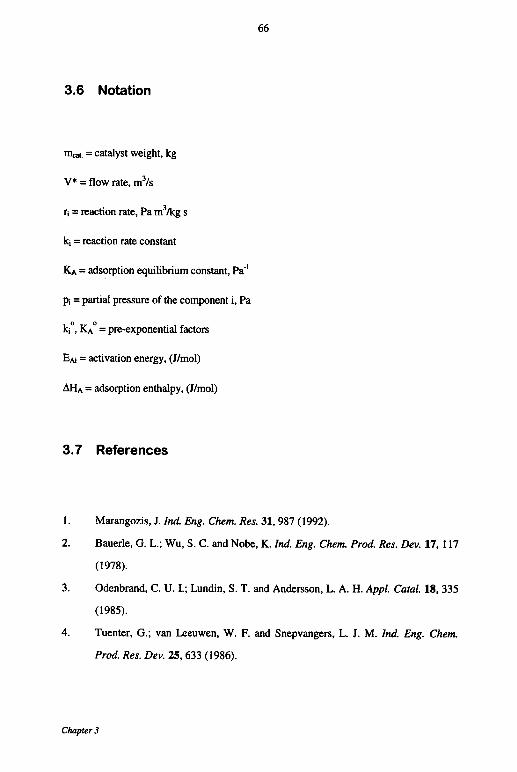


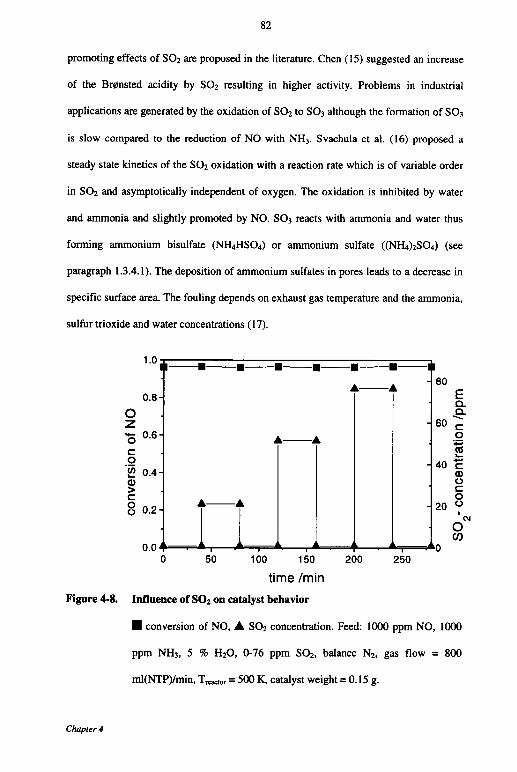


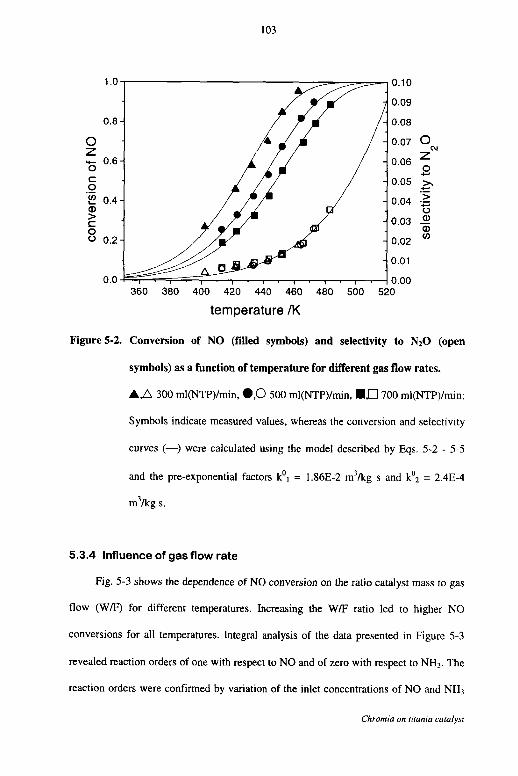


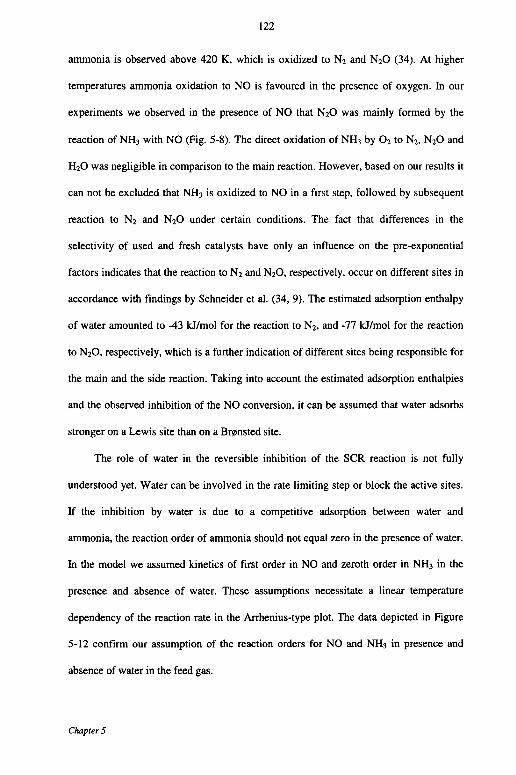
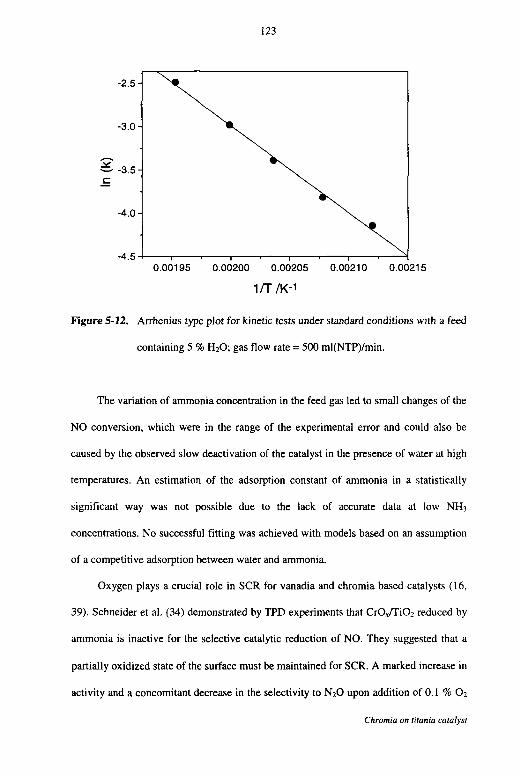


![The selective catalytic reduction of NO by NH at Brønsted and … · 2017. 4. 20. · acrylonitrile [14, 15], or the selective catalytic reduction (SCR) of NOx with NH3 [16, 17].](https://static.documents.pub/doc/80x56/6126f09950e7a65daa1740c4/the-selective-catalytic-reduction-of-no-by-nh-at-brnsted-and-2017-4-20-acrylonitrile.jpg)


