1. Report No. 2. Government Accession No. FHWA/TX-83/l3+249-5 4. Title and Subtitle RIGID PAVEMENT NETWORK REHABILITATION SCHEDULING USING DISTRESS QUANTITIES 7. Author'.l Manuel Gutierrez de Velasco and B. F. McCullough 9. Performing Orgonization Nome and Address Center for Transportation Research The University of Texas at Austin Austin, Texas 78712-1075 12. Sponsoring Agency Nome and Addresa Texas State Department of Highways and Public Transportation; Transportation Planning Division P. O. Box 5051 Austin, Texas 78763 15. Supp lementary Notes TECHNICAL REPORT STANDARD TITLE PAGE 3. Recipient's Catalog No. 5. Report Dote August 1983 6. Performing Organization Code 8. Performing Organization Report No. Research Report 249-5 10. Work Unit No. II. Contract or Gront No. Research Study 3-8-79-249 13. Type of Report and Period Covered Interim 14. Sponsoring Agency Code Study conducted in cooperation with the U. S. Department of Transportation, Federal Highway Administration Research Study Title: "Implementation of a Rigid Pavement Overlay Design Svstem" 16. Abstract This report presents the development and application of a scheme, in the form of a computer program, for prioritizing and scheduling a set of rigid pavements for rehabilitation within a specified time frame and budget constraints. The program is intended to provide the Texas State Department of Highways and Public Transpor- tation with guidelines for generating decision elements for the management of road maintenance funds. The prioritization and scheduling scheme is based on observed distress quantities; it makes use of distress indices and distress prediction equations, for which a detailed description is given. The immediate application of the computer program is to generate lists of candidate pavements for rehabilitation. However, the use of the program is extended to analyze the effect of several different budget policies on the condi- tion of the pavement network. Although availability of funds and managerial preferences play an important role in the budget selection procedure, the program can be used as an aid in the selection of a budget policy. 17. Key Words rigid pavements, maintenance and rehabilitation management, prioriti- zation, scheduling, budgeting, distress pred1ction, condition surveys 18. Distribution Statement No restrictions. This document is available to the public through the National Technical Information Service, Springfield, Virginia 22161. 20. Security Clo .. lf. (of thi s page) 21. No. of Poges 22. Price 19. Security Cla .. if. (of this report) Unc lass ified Unclas s ified Form DOT F 1700.7 18-U)
Transcript
1. Report No. 2. Government Accession No.
FHWA/TX-83/l3+249-5
4. Title and Subtitle
RIGID PAVEMENT NETWORK REHABILITATION SCHEDULING USING DISTRESS QUANTITIES
7. Author'.l
Manuel Gutierrez de Velasco and B. F. McCullough
9. Performing Orgonization Nome and Address
Center for Transportation Research The University of Texas at Austin Austin, Texas 78712-1075
~-------------------------------------------------------------~ 12. Sponsoring Agency Nome and Addresa
Texas State Department of Highways and Public Transportation; Transportation Planning Division
P. O. Box 5051 Austin, Texas 78763 15. Supp lementary Notes
TECHNICAL REPORT STANDARD TITLE PAGE
3. Recipient's Catalog No.
5. Report Dote
August 1983 6. Performing Organization Code
8. Performing Organization Report No.
Research Report 249-5
10. Work Unit No.
II. Contract or Gront No.
Research Study 3-8-79-249 13. Type of Report and Period Covered
Interim
14. Sponsoring Agency Code
Study conducted in cooperation with the U. S. Department of Transportation, Federal Highway Administration
Research Study Title: "Implementation of a Rigid Pavement Overlay Design Svstem" 16. Abstract
This report presents the development and application of a scheme, in the form of a computer program, for prioritizing and scheduling a set of rigid pavements for rehabilitation within a specified time frame and budget constraints. The program is intended to provide the Texas State Department of Highways and Public Transportation with guidelines for generating decision elements for the management of road maintenance funds.
The prioritization and scheduling scheme is based on observed distress quantities; it makes use of distress indices and distress prediction equations, for which a detailed description is given.
The immediate application of the computer program is to generate lists of candidate pavements for rehabilitation. However, the use of the program is extended to analyze the effect of several different budget policies on the condition of the pavement network. Although availability of funds and managerial preferences play an important role in the budget selection procedure, the program can be used as an aid in the selection of a budget policy.
Report No. 249-1, "Improvements to the Materials Characterization and Fatigue Life Prediction Methods of the Texas Rigid Pavement Overlay Design Procedure," by Arthur Taute, B. Frank McCullough, and W. Ronald Hudson, presents certain improvements to the Texas Rigid Pavement Overlay Design Procedure (RPOD2) with regard to materials characterization and fatigue life predictions. November 1981.
Report No. 249-2, "A Design System for Rigid Pavement Rehabilitation," by Stephen Seeds, B. Frank McCullough, and W. Ronald Hudson, describes the deve1opement, use and applicability of a Rigid Pavement Rehabilitation Design System, RPRDS, developed for use by the Texas State Department of Highways and Public Transportation. January 1982.
Report No. 249-3, "Void Detection and Grouting Process," by and B. Frank McCullough, presents the results of an theoretical analysis to determine an optimum procedure for beneath CRC pavements. April 1983.
Francisco experiment detecting
Torres and a voids
Report No. 249-4, "Effect of Environmental Factors and Loading Position on Dynaflect Deflections in Rigid Pavements," by Victor Torres-Verdin and B. Frank McCullough, discusses several of the factors that affect Dynaf1ect deflections, in rigid pavements and provides a recommended procedure for Dynaf1ect deflection measurements which can be implemented on the rigid pavement overlay design procedures. Novemeber 1982.
Report No. 249-5, "Rigid Pavement Network Rehabilitation Scheduling Using Distress Quantities," by Manuel Gutierrez de Velasco and B. F. McCullough, presents the development and application of a computer program, PRP01, to prioritize and schedule a set of rigid pavements for rehabilitation within a specified time frame and budget constraints. August 1983.
Conceptual Development of a Data Processing Procedure Applications: Purposes of Collecting the Data Data Collection Considering Quality and Quantity
Additional Information Data Reduction and Analysis
Sources of Information .... CRC Pavements Condition Surveys Condition Surveys for Jointed Pavements Condition Surveys for AC Overlaid Rigid Pavements Sources of Additional Information
Sampling Within Projects . . . . . . Sampling Punchouts and Patches Sampling Spalling ..... . Reconunendations for Sampling Within Projects
Data Reduction ........... . Data Reduction for CRCP: Program CONSRV Data Reduction for JCP and JRCP Data Reduction for Overlays: CONOVL Data Reduction for Special Projects: Program CONSMS
Sununary
CHAPTER 4. DISTRESS INDEX AND DECISION CRITERIA INDEX
Definition of the Indices Distress Index Decision Criteria Index
Literature Review Subjective Parameters . Regression Analysis (Refs 60 and 61) Factor Analysis . . . . . Discriminant Analysis (Refs 57, 58, and 59) Evaluation of the Methods
Discriminant Analysis of Data Data Base Analysis . . . .
Equation for CRC Pavements (Ref 11) Equation for Jointed Pavements . . •
Commentaries on the Discriminant Analysis Approach Summary .•......................
Approaches to Distress Prediction Markov Process Regression Analyses . . . Method of Analysis
Equations for CRC Pavements Data Base .•.... Description of the Model for Failures Description of the Model for Minor Spa11ing • . Description of the Severe Spa11ing Model Discussion of Equations . . . . • • • .
Equations for Jointed Pavements (JCP and JRCP) Prediction of Cracking Prediction of Spa11ing . • . . Prediction of Faulting . • • . . . • . . • . •
Equations for AC Overlaid Rigid Pavements Data Base ............ . Analysis Approach . . . . . . • • . • • Description of Distress Prediction Models
Prediction of Distress in New Overlays • Prediction of Distress in Existing Overlays
Discussion of Equations . Summary
CHAPTER 6. APPLICATIONS OF THE DISTRESS MODELS
Network Level Application: Rehabilitation Prioritization and Scheduling ••••.•...•.. .••.•..•
Rationale of the Prioritization and Scheduling Scheme • Description of Program PRP01 . • . . . . . . .
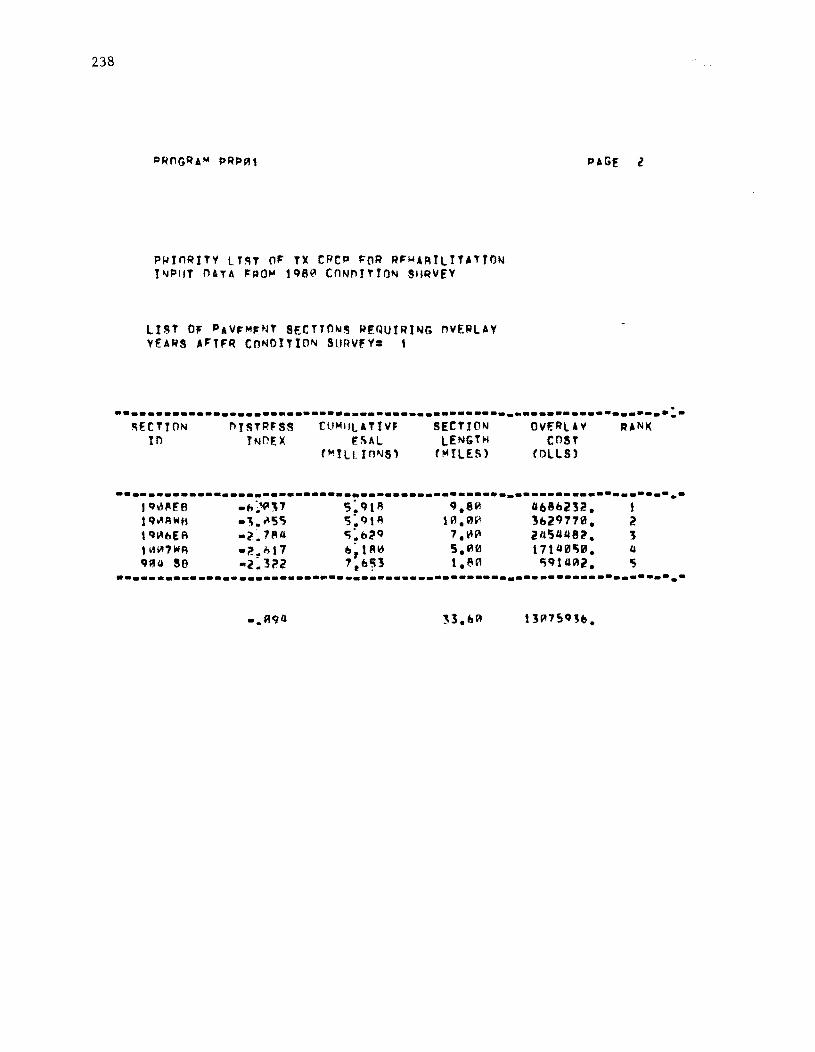
Distress Models in the Program . • • • • . • • Sample Runs Using the Prioritization and Scheduling Program PRP01 . . . . . . . . II • • • • • • • • • • • • • • •
Project Level: Distress and Maintenance Evaluation Scheme Rationale of a Design and Maintenance Evaluation Scheme . Description of the Program DMEOl . . • . . . . . .
Models Used by DME01 . . . . . • • . . . . . Alternative Procedure to Derive a Distress Index
Surmnary
CHAPTER 7. APPLICATIONS OF THE REHABILITATION SCHEDULING PROGRAM PRP01
Analysis Approach . • . • • Analysis of the Results
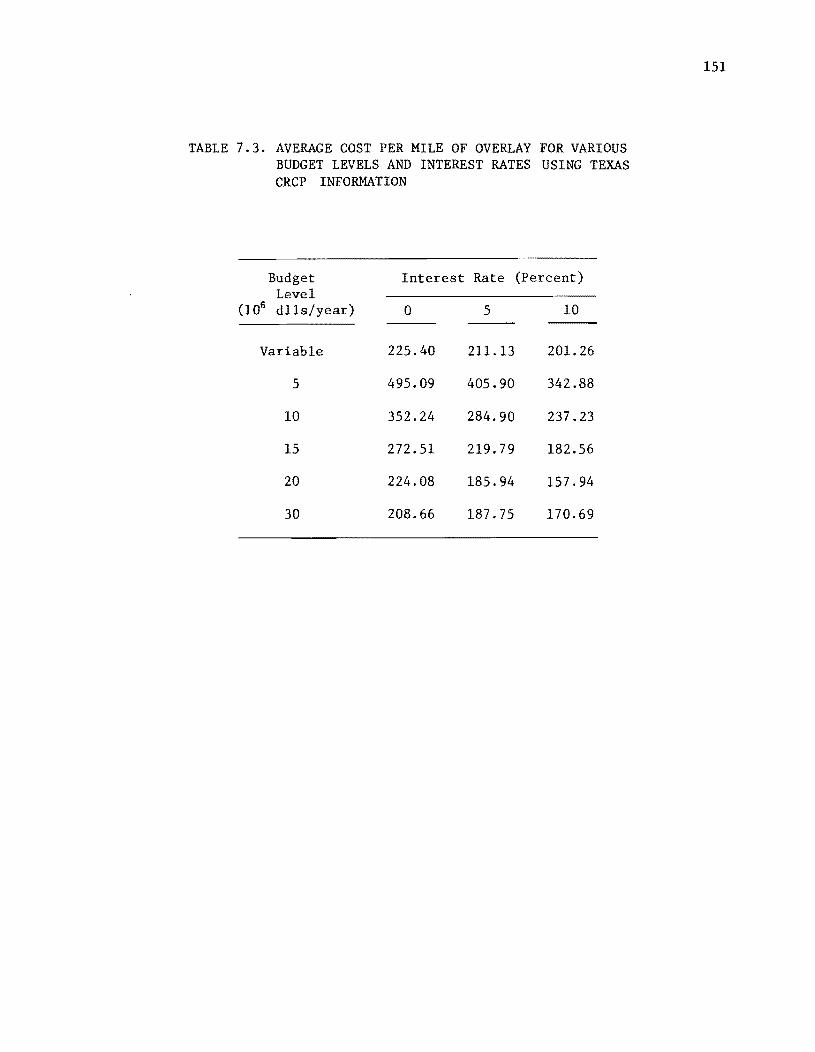
Effect of Yearly Budget Effect of the Time Value of Money Cost of Postponing an Overlay
Discussion of Results Surmnary
xv
87 88 88 89 89 89 90 92 96 98 98 99
103 104 108 108 109 110 110 116 116 119
121 122 124 127
130 134 136 138 139 141 142
143 144 144 150 150 154 155
CHAPTER 8. CONCLUSIONS AND RECOMMENDATIONS
Summary of Work Accomplished Conclusions and Recommendations
This report focusses on the use of distress quantities for rigid
pavements within a Pavement Management System. The main objective is the
development of a working rehabilitation scheduling scheme. These are the
specific objectives of the study:
(1) To present a detailed discussion of the data collection procedure and of the possibilities of sampling to collect information. The current state of technology in the pavement field is imperfect and requires upgrading on a continuing basis. This can best be accomplished by collecting feedback information from in-service pavement sections. However, the data collection needs to be carefully planned; the selection of the type, the amount, and the quality of the information to be gathered depends mainly on the specific future applications intended.
(2) To pinpoint the importance of distress as an output function to be used in PMS. A system output function in PMS should consider all the relevant pavement factors, such as riding quality, skid resistance, distress, structural capacity, traffic, and costs; nevertheless, riding quality has been prefered over the others. In the case of pavements with good periodic maintenance, distress appears to be a more relevant factor in the decision making process than riding quality.
(3) To develop a distress index for rigid pavements. A distress index combines into a single nl~ber several different distress quantities to facilitate comparison among projects. An approach different from the traditional ones is offered.
(4) To develop a terminal condition criterion for distress in rigid pavements. The failure of a pavement is not a catastrophic occurrence; but it indicates that the pavement did not meet the conditions which it was designed to fulfill. An excessive amount of distress can be considered as a terminal condition of the pavement due to its implications for the costs of maintenance or its effects on the riding quality of the pavement.
(5) To develop distress prediction models for rigid pavements. These models are intended to forecast the different distress quantities as functions of age, traffic variables, environmental conditions, and pavement material characteristics.
(6) To present the implementation of the models developed in the context of a PMS.
8
(7) To analyze the impact of several different budgeting policies using the rehabilitation scheduling scheme developed in this study and condition survey information collected in Texas during 1980.
RESEARCH APPROACH
The main issue of the report is the preparation of a working
rehabilitation scheduling scheme to help the Texas SDHPT with decisions about
maintenance and rehabilitation of rigid pavements at the network level. The
development of such a scheme involves several steps, which are described in
the following paragraphs.
The first step is the conceptual formulation of the problem. At this
stage, the capabilities and limitations of the scheme to be developed are
defined. Also, the availability of models for the scheme studied; if
models are required, data requirements are established.
The models in the system were developed using field data c:ollected from
Texas roads during the last decade. In addition, other data found in the
literature were used. Although the field information used represents a
unique set of data, it was not collected to fulfill the rE!quirements for
developing a PMS but to assess the condition of the roads; therefore, our
models are limited by the availability of data.
The distress models in the system were developed using standard
statistical techniques. Discriminant analysis was used to develop a distress
index and the terminal condition criterion. For the distress prediction
equations, regression analysis techniques were used.
A computer program was written integrating the distress models developed
into the conceptual scheme of PMS. Using field data, sample runs were made
9
to predict the maintenance requirements of the rigid pavements in the state
of Texas.
SCOPE AND ORGANIZATION
The scheme developed represents a first stage in the development of a
network level PMS for rigid pavements. Guidelines are provided for future
developments.
Chapter 2 presents a conceptual formulation of the scheme developed and
contains a brief description of PMS theory. In addition, it presents a
justification for using distress quantities instead of other pavement
attributes as an output function of the system.
In Chapter 3 the collection and preparation of condition survey
information for analysis is discussed. The following topics are presented
and discussed: the data processing procedure, the evolution of the condition
surveys carried out in the state, other sources of information, and the
possibilities of sampling.
The analysis of the data is presented in Chapters 4 and 5. Chapter 4
contains the development of a distress index and the terminal condition
criterion through
developing index
discriminant analysis. Other analysis
type equations are also investigated.
techniques
Chapter 5
for
is
dedicated to the development of distress prediction equations. Models are
presented for Continuously Reinforced Concrete Pavements (CRCP), Jointed
Unreinforced and Reinforced Concrete Pavements (JCP and JRCP) , and for
asphaltic concrete overlays on rigid pavements.
10
Chapter 6 is devoted to the description of the program written to
implement the developed models in a PMS. In addition, sample applications
are presented using field information.
Chapter 7 presents additional applications of the rehabilitation
scheduling program presented in Chapter 6. The capabilities of the program
are demonstrated by analyzing the effects of different budgeting policies
using field data from a condition survey performed in 1980.
Conclusions and recommendations made throughout the report are
summarized in Chapter 8. Guidelines for future developments are also given.
CHAPTER 2. CONCEPTUAL FORMULATION OF THE SYSTEM
This chapter contains a description of PMS concepts to provide a
perspective of the problem. The principal
conceptual formulation of the scheme developed
objective is to present the
in the following chapters.
The concepts described in this chapter deal with the PMS decision levels:
the network level, where decisions that affect the entire road network are
made, and the project level, where decisions for specific projects are made.
In addition, a justification for using distress quantities instead of other
pavement characteristics as an output function is presented.
ANALYSIS AT THE NETWORK LEVEL
At the network level, the management system provides information to help
decision makers in the development of agency-wide programs of new
construction, maintenance, or rehabilitation which will optimize the use of
available resources (Ref 5).
The basic inputs for a network level analysis are road need studies for
new pavements, and periodic evaluations of existing pavements. Additional
information is required, such as traffic studies and cost records, depending
on the application intended and the sophistication of the system. The
11
12
results of the analysis are a program for construction, ma:lntenance, and
rehabilitation of pavements within available resources.
Among the network PMS studies, the methods for planning maintenance and
rehabilitation have become important in recent years. The desired result
from this type of application is a maintenance and rehabilitation (M & R)
schedule for each year during a period of several years. HOWE!Ver, different
degrees of complexity can be achieved, and an agency without PMS experience
should start with a simplified version progress in a staged manner (Ref 6).
The following stages can be identified in the devl!lopment of a
maintenance and rehabilitation system; the stages are not intended to be
unique, and several of the existing M & R systems fall with:ln the stages
presented:
(1) The first stage is a simplified version of the M & R system which considers planning one year at a time and provides a prioritized listing of projects to be rehabilitated for the next year. The requirements for this stage are some form of prioritization index, which may include several pavement outputs, for rank:lng the various projects; decision criteria for selecting the projects requiring rehabilitation; and costs, which, at least in an average form, can be included to help in the preparation of a budget or, in case the budget already exists, as another restraint in the selection of projects for rehabilitation.
(2) The next stage of development can follow two different paths; one includes the selection of maintenance alternatives and the other extends the design period to provide a prioritization listing for several years.
(a) For the case including maintenance, the additional requirements are some rational determination of maintenance needs and maintenance costs.
(b) To extend the design period, prediction equations are required for all the variables in the prioritization index in addition to the requirements listed in the first stage.
(3) The third stage is a combination of the two paths prl!sented in the previous stage; that is, the system should consider a design period and several maintenance alternatives at the same time. This stage involves prediction models which account for differlmt maintenance and rehabilitation possibilities, a procedure to select among
13
competing maintenance alternatives, and an algorithm to optimize the timing of M & R for the design period considered, within a budget and using available resources.
Existing M & R Schemes
Several schemes for maintenance and rehabilitation management have been
presented in the literature or are currently in use by state agencies. The
following review is not comprehensive but offers a sample to indicate the
extent of development of network level PMS activities.
New York has developed a scheme to identify deficient pavement sections
(Ref 12). A single response, pavement serviceability rating, is used to
evaluate the complete network and to rank candidate projects. The procedure
involves calculations with current values only and does not consider
prediction models. After a project has been selected, it is necessary to
perform a detailed evaluation, select the rehabilitation option, and
calculate the cost of rehabilitation; that is, no attempt is made to evaluate
the effects of single decisions in the overall network. The New York
procedure includes both flexible and rigid pavements.
Pedigo and Hudson (Ref 6) developed guidelines for a simplified network
level PMS and indicated how such a framework can be applied to produce a
priority ranking. Among the guidelines presented, suggestions are given for
formulating a Prioritization Index (PINDEX) using subjective information.
This approach can be readily implementable even if objective data are not
available.
The State of Washington combines roughness and distress into a single
pavement rating (Refs 5 and 13). The future condition of the pavement is
projected in terms of this rating, using prediction models based primarily on
subjective data. Rehabilitation alternatives are considered whenever this
14
index falls below a predetermined value, and rehabilitation i ·, ., contemplated
when the rating reaches a critical level.
Karan and Haas (Ref 14) have suggested a priority programming model
which minimizes the loss in total net present value of annual benefits for
all the projects in a network to determine the best timing for repairing each
of the projects within a design period. This method was conceived for urban
pavements and it makes use of a Urban Serviceability Index which can be
forecast using a Markov process. In addition, a relation is given for
determining average operating costs for different values of the Urban
Serviceability Index.
Researchers from Texas A & M (Refs 15, 16, 17 and 18) developed a
Rehabilitation and Maintenance System for the Texas flexible pavement
network. The system contains several computer programs (a) identifying and
scheduling effective strategies, (b) quantifying its benefits, (c) deriving
working plans within system constraints, and (d) determining optimal
policies. The sequence of activities involved in the optimjlzation process
can be summarized as follows:
(1) The first program in the information collected by state authorities.
series is used to check the field the districts before it is sent to the
(2) An approximate strategy for the highway segments and the upper and lower budget limits for the districts are determined by a second program.
(3) The optimal rehabilitation and maintenance strategies and the benefits for one year planning horizons are determined by a third program for each district. In addition, a multi-pE~riod resource effective highway maintenance schedule can be obtained using a fourth computer program.
(4) The fifth computer program is capable of selecting the most promising set of budget levels for the districtn under a fixed statewide budget. At the same time, another program" the sixth, is used to determine the best rehabilitation and maintE!nance strategy
(5)
15
for each section, and the resources and budget allocation district by district.
The last program, which is basically the optimizes the district fund allocations selecting the best strategy on each project.
same as the sixth, to its residencies by
The scheme developed by Texas A & M is a comprehensive system which
involves activities at the network and project levels. The combined and
sequential use of programs is aimed at helping management allocate money,
men, equipment, and materials in an efficient manner. This system
contributes several mathematical formulations which ~an be adopted by other
agencies. The main drawbacks of the scheme are the costs and the prediction
models therein which require further refinement.
Evaluation of Existing Network Level Schemes
A sample of the different degrees of complexity which can be found in
existing network level maintenance and rehabilitation prioritization schemes
has been presented. The existing schemes provide valuable information for
the development of new schemes. However, the adoption of an already existing
scheme is not possible without major modifications because the existing
schemes have been conceived with specific needs in mind and under particular
conditions.
A scheme which uses only serviceability index does not seem applicable
to the rigid pavements in Texas since, according to information presented in
Fig 2.4, this parameter does not indicate when a pavement with heavy
maintenance is reaching terminal condition.
Optimization techniques based on user costs are not readily
implementable because of the lack of cost information if an attribute other
than PSI is used in the prioritization scheme.
16
It is the general consensus that, when developing a PMS, one should
start from simplified schemes and evolve into more complicated forms as
experience is accumulated (Ref 6). Therefore, a simplified scheme is
formulated here with guidelines for its future development.
proposed Network Level Scheme
The purpose of the scheme developed in this study is to provide
maintenance management with a multi-period list of candidate rehabilitation
projects. Figure 2.1 is a flow chart of the main steps involv-ed in an M & R
scheme. The scheme uses field information on the group of projects composing
the network under analysis; the input information varies, depl~nd ing on the
models used within the program.
The first step in the program is the computation of a prioritization
index for each project that transforms all of the pavement rl~sponses into a
single number, which facilitates comparison among projects. In the program
developed, only distress manifestations were considered in the prioritization
index; although, in a more refined stage, the index should resemble the
system output function described at the end of the chapter. With the
prioritization index, the projects can be sorted out to define the priorities
for rehabilitation and maintenance. After the priorities for the first year
are defined, the next step involves the prediction of the futu"re condition of
the pavement sections in order to repeat the prioritization cycle for the
following years. The cycle is repeated until the time frame of analysis is
fully covered.
PREDICT FUTURE DISTRESS
NO
CONDITION SURVEY
DO FOR ALL SECTIONS
CALCULATE DISTRESS
INDEX
DETERMINE APPROXIMATE
YES
A. C. OVERLAY j--__ ----l
THICKNESS AND COST
PRIORITIZED LIST OF
PAVEMENT SECTIONS FOR E/YR
Fig 2.1. Basic steps in a rehabilitation and maintenance system at the network level.
17
18
ANALYSIS AT THE PROJECT LEVEL
At the project level, detailed consideration is given to alternative
design, construction, maintenance, or rehabilitation activities for a
particular section or project within an overall program. The inputs for a
project level analysis are load, environmental conditions, materials
characteristics, construction and maintenance variables, and costs. The
specific information varies, depending on the models in the system. The
output of the analysis consists of a set of the best possible strategies to
provide, maintain, or rehabilitate a pavement structure. The selection of
alternatives is made from a detailed design, which includes the prediction of
some or all of the pavement responses, and an economic evaluation of the
alternatives under consideration.
Most of the research effort on PMS has been centered on project level
analysis to provide new facilities. Progress in this area transformed the
design concept from the one shot design approach into the selection of an
optimum strategy.
Existing Design Systems
The first major working systems were developed during thE! late 1960's
and early 1970's; among them is the Rigid Pavement System (RPS) , the only
working program for rigid pavements, which was developed by Kher et al
(Refs 19 and 20). There are several highly developed design systems for
flexible pavements and descriptions of them can be found elsewhere (Refs 3
and 5); this report is centered on rigid pavements.
19
The Rigid Pavement System (RPS) was developed at The University of Texas
to design rigid pavements. RPS presents the designer with a set of best
alternatives. The program utilizes 115 different input variables. All
possible solutions, within the limits specified by the designer, are
analyzed; costs incurred are calculated for each strategy and the optimal
pavement strategies are selected primarily on the basis of minimum total
overall costs. Other factors are utilized as constraints in the selection
procedure, including availability of funds and minimum safety provisions.
For those designs that reach the minimum level before completition of the
analysis period, stage construction concepts are utilized.
The Rigid Pavement Rehabilitation Design System (RPRDS) recently
developed by Seeds et al (Ref 21) to optimize the design of overlays on rigid
pavements generates a number of feasible overlay design strategies based on
user inputs, performs a present value cost analysis on each strategy, and
then presents those which are optimal. The program considers several types
of overlays, i.e., asphalt concrete, CRCP, and JCP.
Several M & R design systems can be found in the literature; of these,
the one developed by Shahin et al (Refs 22 and 55) for the U. S. Air Force
and the Army has the capability to account for jointed concrete pavements.
This system uses a Pavement Condition Index (PCI) to evaluate the structural
integrity of the pavement sections. Depending on the PCI level, several
categories of M & R are indicated. On the basis of the results of the
evaluation and the guidelines for M & R selection, the engineer may want to
consider several alternatives for restoring the structural integrity and
operational condition of the pavement. The selection of the best alternative
involves performing an economic analysis to compare the costs of all feasible
20
alternatives. The optimum alternative is selected from the eeonomic analysis
results, the mission of the pavement, and the policies of the management.
Evaluation of Existing Models at the Project Level
The model used in RPS to determine pavement thickness is based on the
results of the AASHTO Road Test (Refs 23,24, and 25) and" therefore, the
main factor in the analysis is the serviceability versus traffic
relationship. On the other hand, RPRDS uses elastic layered theory coupled
with a fatigue-like equation to determine overlay thicknesses .. The fatigue
equation, in the case of rigid pavements, is related to the occurrence of
severe cracking in jointed pavements (Ref 26). The two programs were
developed using the best state-of-the-art information; however, neither of
them is useful in predicting distress quantities for maintenance management
purposes.
The distress index developed by Shahin et al was developed from the
collective judgement of experienced pavement maintenance engineers, and it
seems to render acceptable results. However, it was developed to be applied
to airport pavements.
Using more refined equations in a network level prioritization as
opposed to the project level may result in more data requirements, more
computer time, and, therefore, more money without affecting considerably the
results of the procedure. One way to improve the procedure without
excessively increasing the requirements is by developing approximate
equations through computer simulation using a project levE!l program. One
such program was developed in this study to illustrate how to improve the
prioritization equations. This program is conceptual rather than a working
21
program since cost models as a function of distress are not available.
However the program can be used to evaluate the design of existing projects.
In conclusion, a specific overlay can be designed more accurately using
programs like RPRDS; however, the fact that it is not oriented to the
prediction of distress quantities, plus the extensive input data and running
time required, prevent the use of such programs at the network level.
Proposed Project Level Scheme
In rigid pavements, the derivation of an optimum maintenance or
rehabilitation strategy, by means of economic analysis, is difficult due to
the lack of cost and prediction models. Furthermore, the serviceability
performance concept, which has been successfully used in flexible pavements,
may be an inappropriate model for rigid pavements. Therefore, a
rehabilitation and maintenance design approach is presented which replaces
the serviceability performance concept with the distress history of the
pavement.
The scheme proposed is not intended to replace more sophisticated
schemes, such as RPRDS, but to illustrate its applications for future
developments as better information becomes available. Among these
applications, the scheme is suggested as an alternative approach for
developing or improving distress index equations.
Figure 2.2 presents the basic steps in the proposed scheme. The design
life and costs are calculated for several feasible alternatives, the purpose
being to define the most effective rehabilitation and maintenance strategy
from several under consideration. If user costs related to distress are not
22
NEXT ALTERNATIVE
NO
READ INPUT DATA
DO FOR ALL DESIGNS
DESIGN MODELS
DESIGN?
ECONOMIC ANALYSIS
PRIORITIZE
PRINT ALTERNATIVES
AND COSTS
YES
Fig 2.2. Basic steps in a design system at the project level.
23
available, rehabilitation is optimized not from the standpoint of economic
analysis but from the results of a distress index.
INTERFACED ANALYSIS
A coupled or interfacing P~1S is the combination of the two levels
described before. Network and project decisions interact with one another.
A good estimate of the resources to be used at the network level requires
information on maintenance and rehabilitation for individual projects. On
the other hand, timing of rehabilitation for an individual project depends on
the network decisions.
This may be better explained using Fig 2.3, which pres~nts a matrix of
the allocation of certain resources among competing projects within a certain
time frame. The columns in the figure are for the years considered in the
analysis while the rows represent each of the projects. The amount of
resources consumed in each block depends on the maintenance strategy selected
for that project in that year. The purpose of the anlaysis might be to
minimize the amount of resources consumed in each project and at the same
time not exceed the available budget. The interaction between projects and
network is evident if one considers that, in order to match the budget for
each year, it is necessary to modify the sequence of maintenance alternatives
and the rehabilitation timing of the projects until a best solution is
obtained.
At the present time, the coupling of project and network level analysis
is possible only in a simplified manner. The coupling of the two levels is
deterred because
24
~ Project Proj 1 2 3 ... n Cost
n
1 Cll
C12 Cl3 Cin E Cl "
" 1 J J=
2 C2l C
22 C
23 C
2n
3 C3l C3l
C33
C3n
4
... . ..
m Cml Cm2
Cm3
C mn
Required m
Investment .E Cil ... EECij 1=1 ij
Budget Bl ...
I~ Time Frame -------...,. .... ,..1
Fig 2.3. Matrix of allocation of resouces among competing pavement rehabilitation projects in various years.
1
(1) the data collection requirements at the project level are detailed and expensive when compared to the network requirements;
25
very level
(2) due to the lack of accurate prediction equations, two different sets of models are employed at the two levels; and
(3) the computer costs would be excessive if detailed models were to be used at the network level.
A simplified form of an interfaced system is currently being used by
agencies which have a multi-period network level analysis.
SYSTEM OUTPUT FUNCTION
Among the important developments required in PMS is an output function
involving the various parameters which affect decision making in pavements,
such as riding quality, skid resistance, distress, traffic, and costs. The
problem is not only the determination of the output function but the
capability to predict each of the output parameters in the equation under
variable conditions. Generally, riding quality has been the most important
factor considered, primarily because of the influence of the AASHTO Road
Test, where the concept of Present Serviceability Index (PSI) was developed.
Distres~~pes
Since the report focusses on the use of distress quantities in PMS, an
overview of what distress is must be given. In Ref 7, the following
definition is given: "Any indication of poor or unfavorable performance or
signs of impending failure; any unsatisfactory performance of a pavement
short of failure." Another definition, given in Ref 3, considers distress as
26
a limiting response of the pavement when one of the primary rl~sponses, i.e.,
stress, strain, or deflection, is taken to a limit."
Distress is commonly grouped into three modes or
fracture, (b) distortion, and (c) disintegration. Table 2.1
categories: (a)
presents
a schematic summary of the distress groups. For each mode, individual
distress manifestations can be identified; detailed definitions of each
individual manifestation are provided by Smith et al (Ref 9).
distress mechanisms are also presented in Table 2.1.
Serviceability vs. Distress
Some of the
In a large number of the cases observed in practice, the pavement
serviceability history does not appear to change with time or traffic, while
the distress condition does. Figures 2.4 and 2.5 show how serviceability and
distress vary with traffic for Texas pavements. Each point represents a
surveyed section of CRCP in Texas (Refs 11 and 37). The servieeability index
was derived from roughness data obtained using profilomete:r measurements.
The traffic figures were provided by the Planning Survey Division of the
Texas SDHPT. The number of failures (punchouts and patches) per mile was
obtained from the records of the CRCP condition surveys peforml:!d in the State
of Texas in 1974 and 1978 and described in the next chapter. From the
figures, it appears that the serviceability index is independent of the
traffic, i.e., the serviceability index value does not val~y. One likely
reason for having a constant serviceability is the continuous repair of the
highway performed by the District's staff. Although from a structural or
economics standpoint the section is approaching the end of its life, the
riding quality remains unchanged. Thus, the use of distress measures may be
TABLE 2.1. DISTRESS MODES, MANIFESTATIONS AND MECHANISMS (Ref 8)
Adhesion (i.e., loss of bond) Chemical reactivity Abrasion by traffic
Adhesion (i.e., loss of bond Chemical reactivity Abrasion by traffic Degradation of aggregate Durability of binder
27
28
)(
CI> "'0 c
>. -.--.Q c CI> (,)
> .... CI>
C/)
6.0
o 0 ~o 0 8 4.0
~~O~ ~@ €a) 0 08 8 § 0 ~ 0
o 0 0 @ f ~ ,€l~ 8 0
2.0
00 3.5 7.0 10.5 14.0 17.5
Traffic (Cumulative ESAL) x 10 6
Fig 2.4. Serviceability index versus traffic app1icattons (both directions) for Texas CRCP sections surveyed in 1974 and 1978.
CI>
~
L-CI> 0-
(/)
CI> L-::::J
CJ IJ..
75.0
o
60.0
45.0 0
0
0 0
30.0 0 0 0
0 c:P 0 0
0 0
~P8 <i3 0
15.0 0 o 0 00
0 0
o o 3.5 7.0 10.5 14.0 17.5
Traffic (Cumulative ESAL) x 10 6
Fig 2.5. Number of failures per mile (punchouts and patches) versus traffic applications (both directions) for Texas CRCP sections surveyed in 1974 and 1978.
29
30
a more realistic way to evaluate a pavement's terminal condition. This
statement is contrary to the AASHTO guide concepts (Ref 25);; however, the
AASHO concepts, which are based on the AASHTO Road Test results (Ref 23), do
not consider pavement sections deteriorating without maintenance.
Therefore, it appears that distress manifestations, in this case
failures per mile, are better indicators of the deterioration of a CRCP than
the serviceability index as evidenced by the variability. In other words, in
a CRCP with heavy maintenance, distress appears to be a more significant
factor in the decision making process than the serviceability lndex. Other
factors may seem more relevant in other cases, depending on the particular
circumstances.
An additional advantage of using distress is that it relates directly to
maintenance requirements and indirectly measures other pavemEmt functional
indicators, such as serviceability. Among the disadvantages of using
distress manifestations is the lack of applicable cost equations since past
research has made more extensive use of the PSI concept.
SUMMARY
This chapter presented the conceptual formulation of a rehabilitation
prioritization scheme using distress quantities. These are the prinCipal
points presented in the chapter:
(1) It was decided that a simplified scheme should be formulated as a starting point and that some guidelines should be provided for future evolution into more complicated forms as experience is accumulated.
(2 ) The proposed scheme will provide maintenance management multi-period list of candidate projects for rehabilitation.
with a The
31
prioritization procedure is based on a distress index and several distress prediction equations.
(3) It was suggested that a project level program be used as a simulation tool to generate improved prioritization or distress index models. This approach would be feasible if better prediction and cost models were available.
(4) From experience in Texas with rigid pavements, it is felt that distress is a better indicator of the condition of the pavements. Therefore, it is recommended that distress be used as the central factor to be considered in the prioritization scheme.
The main concern of this report is to develop a scheme for scheduling
rehabilitation of rigid pavements based on distress quantities. A computer
program is developed in the process. The program, a rehabilitation
prioritization program presented in Chapter 6, produces a set of ordered
candidate pavements for maintenance and rehabilitation. This program uses
only distress quantities in the prioritization procedure. However, it
appears reasonable to include in future versions the impact of other
variables, such as traffic and climatic conditions, in the procedure. Also,
in order to optimize the prioritization procedure, user and agency costs
(2) Sampling. Sampling can be performed from the network by selecting representative sections or from each project by selecting representative subsections within a project. Sampling from the network has been used for quick evaluation of the network or to make a broad estimate of the long-term condition of the network (Refs 1 and 28). An attempt was made in this study to obtain samples within specific projects and from them to infer the condi tion of the whole project; the results were discouraging (Ref 29).
The quantity of information sampled by some state agencies to vary from 100 percent to 8 percent of the net~iOrk.
intervals range from 1000-sq-ft areas every 1/3 mile to long segments every mile within selected projects (Ref 30).
appears Sampling 100-ft.
(3) Experimental design. A factorial design is mandatory 1n some of the condition surveys, as in the case of developing or evaluating design methods which need to be applicable to a variety of conditions. Furthermore, the factorial matrix should be specified in terms of "ranges" and not "points"; the reason being that, due to the scarce research resources, measurements and observations need to be made from existing in-service roads; the adoption of point levels would make the field search for test sE!ctions next to impossible (Ref 33).
In the case of evaluating maintenance or construction techniques, simpler experimental designs have been used. Usually test and control sections are monitored to detect differences in the overall performance among both types of sections and to assess the advantages or disadvantages of the technique under study.
Project. overlay section,
When the information required is for designing an or evaluating the design or construction of a pavement the condition survey refers only to that single section.
For quality, the terms used 1n Table 3.1 are as follows:
(1) Reconnaisance. These qualitative judgment individual.
surveys of the
consist of visual inspection and pavement made by a qualified
(2) Tally or semi-detailed. In this type of survey a pavement section is divided into subsections. The distress manifestations are tallied and, once the subsection has been completed, the quantities are transferred to the field sheets.
(3) Detailed or photographic. The exact location of each distress manifestation is recorded 1n this type of condition survey. Usually sketches or photographic techniques are used. The use of photographic techniques is not limited to detailed condition surveys; they can be used when the survey operation interferes to a large extent with the traffic, as in urban areas.
39
Additional Information. The information collected for pavement
management activities can be classified as pavement responses or attributes
(dependent variables) and additional information (independent variables). The
pavement responses are dependent variables only if some form of forecasting
is involved. The additional information can be further subdivided into fixed
and variable, indicating if such information is constant or varies with time.
The selection of the type and quality of information to be gathered
depends on the application intended. For instance, in order to evaluate the
condition of a roadway network, only responses of the pavement such as
riding quality, load response, distress, and safety are required. On the
other hand, 1n the case of research activities, it may be worthwhile to
collect all types of information.
Table 3.2 indicates which additional information may be required 1n
several PMS activities. In Table 3.2, the quality of the information is not
specified, although econom1CS and the degree of accuracy required will
dictate the quality of the information. Of course, there 1S a m1n1mum
quality for each application. For example, prediction equations derived
through research require less accuracy at the network level than they do at
the project level. Therefore, the quality of information used at the network
can be different than that used at the project level.
Some applications make indirect use of the information, such as the ones
that involve the use of prediction equations. These applications can be
carried out even without the indirectly required information.
Data Reduction and Analysis
After the information has been collected, it must be organized,
summarized, and documented. Due to the extensive amount of information, the
.jO-
0 TABLE 3.2. ADDITIONAL INFORMATION TO THE CONDITION SURVEY REQUIRED FOR VARIOUS
PMS ACTIVITIES
Application Traffic Materials Construction Maintenance Costs Environment
PLANNING
Network evaluation N N N N N N
Prioritization y N N N Y Y
Short term planning Y N N N Y N
Long term planning y I I I Y I
DESIGN
Information for design y y y N Y Y
Evaluation of design y Y Y Y Y Y
Eval. of design equations Y Y Y Y N Y
MAINTENANCE
Short-term scheduling I N N Y Y N
Long-term scheduling I I I Y Y I
Eval. of maintenance I Y N Y Y N techniques and matls.
CONSTRUCTION
Eval. of pavt. section N N Y N Y N
Eva 1. of construction I Y Y N Y N techniques and matls.
RESEARCH y Y Y Y Y Y
Y information required N information not required I information indirectly required
41
use of computer facilities is mandatory. By analyzing the information,
future conditions may be inferred. As stated before, the models used in
pavement technology are far from accurate, and continuous upgrading is
necessary; these models are the result of the analysis of the information.
SOURCES OF INFORMATION
This section presents the sources of information used in this report.
Field data were collected for CRCP and AC overlaid pavements, and literature
information was collected for jointed pavements. The information has been
used, first, to develop prediction models and, last but not least, to test
and demonstrate the applications of the rehabilitation and prioritization
program presented 1n Chapter 6.
The data collection procedure involves the following (Ref 30):
(1) determination of what attributes of the pavement should be measured and what type of information needs to be acquired;
(2) field measurement of attributes, such as structural capacity, ride quality, distress condition, and skid resistance, on a sample or mass inventory basis and to a degree of accuracy and frequency appropriate to the class of road, agency resources, use of the data, etc;
(3) collection of data from as built pavements and maintenance, including costs;
(4) traffic measurements;
(5) determination of environmental conditions;
(6) inventory of available resources (materials, equipment, manpower, budget, etc.).
In the following paragraphs a description is g1ven of the distress
information collected through condition surveys of the various types of
pavements included in this report: CRCP, jointed pavement, and AC overlaid
42
rigid pavement. The final part of this section describes the sources of
additional information.
CRC Pavements Condition Surveys
Condition surveys, i.e., field measurements of distress aimed toward
assessing the pavement condition, have been carried out by the CTR 1n rural
and urban districts. The condition survey procedure in urban zones 1S
different from the one used 1n rural zones due to the different traffic
conditions.
Table 3.3 presents 1n condensed form the var10US condition surveys
performed on CRCP in the state. The rural districts were surveyed in 1974,
1978, and 1980; the urban districts were surveyed in 1976 and 1981.
Figure 3.2 shows the locations within the state of the districts surveyed.
The distress manifestations measured were somewhat different 1n each
condition su~vey, but the following are the manifestations measured:
transverse cracking, localized cracking, spalling, pumping, punchouts, and
patches. Detailed information on the condition survey procedure is given 1n
Appendix A.
Table 3.4 presents a summary of the information collected in the rural
condition surveys. The summary is organized by districts and by the year of
the condition surveys. The information provided is length surveyed, length
overlaid, age range, distress manifestitions (cracking, spalling, and
failures), and average and standard deviation of the riding quality or
serviceability index of the pavements surveyed.
Condition Surveys for Jointed Pavements
Although jointed pavements (JCP and JRCP) are not uncommon in the
state, regular monito~ing of this type of pavement has not been carried out
TABLE 3.3. SUMMARY OF CONDITION SURVEYS PERFORMED IN THE STATE OF TEXAS AND MEASURED DISTRESS MANIFESTATIONS
Distress Manifestation Intensity 74
Transverse Minor
Severe
Cracking Longi tudinal • ----~-------------
Localized Minor
Severe -----------------------------Spalling Minor
Severe
Minor Pumping
Severe
Punchouts Minor
Severe
Patches Asphalt
PC Concrete
*Refer to Appendix A for details **Not included in this study
Condition Survey*
Rural Urban**
78 80 76 81
•
•
43
44
rz:zl Urban Districts
Httd Rural Districts
TEXAS
Fig 3.2. Location of rural and urban diotricts surveyed to collect CRC pavement information.
TABLE 3.4. SUMMARY INFORMATION OF eRe PAVEMENTS IN TEXAS FROM 1974, 1978, AND 1980 CONDITION SURVEYS
••••••••••••••••••••••••••••••••••••••••••••••••••••••••••••••••••••••••••••••••••••••••••••••••••• OUTIUCT VEAR I.ENGTH AGE U~GE CRACt< "PC IoIIIN SP'I.I. sEv SIt,I.'- FULU~ES RQ
NO. TOT OVI. 'IilOM TO MEAN aD MEAN so "'UN 80 "'~A'" SO loll! AN SD ................................... ~ .......... ~ ............•.............•...•..•...........•...... (miles) (years) (ft) (%) (%) (No)
NO. TOT OVI,. ,Rnf14 TO fI4!AN 10 MEAN SO "'UN 80 ,..! A'J SO MEAN 10 •••••••••••••••••••••••••••••••••••••••••••••••••••••••••••••••••••••••••••••••••••••••••••••••••••
regularly in the field. Therefore, other sources of information were used in
this study. Table 3.5 presents data used by Carey and Irick (Ref 34) to
develop the serviceability-performance concept. The same information is used
1n this report to develop some of the distress models, as discussed in
Chapter 4. Other models have been adopted from the literature (Refs 23, 35
and 36).
Condition Surveys for AC Overlaid Rigid Pavements
The monitoring of overlaid rigid pavements was only recently begun, and,
therefore, the existing information does not present extensive time-histories
of distress occurrence. Futhermore, only a few sections with the status of
experimental sections are monitored. However, among these experimental
sections there is one, known as Walker County, which represents one of the
oldest, better monitored asphalt concrete overlays on rigid pavements 1n the
state. Walker Co.
overlay thicknesses,
contains several experimental sections, with varying AC
constructed on IH-45. The total project length is 11.4
miles. In order to monitor the distress condition of the overlay, condition
surveys have been carried out before and at 20, 28, 55, and 71 months after
the overlay was placed. Table 3.6 presents a summary of the information
collected in such sections, including percentage of distress reflected in the
various overlay thicknesses and the rut depths measured for the
overlay thicknesses.
Sources of Additional Information
different
In the following paragraphs, a description 1S presented of the sources
of additional information, i.e., information other than distress quantities.
Although the description is applicable to the three types of pavements
included in this report, emphasis is placed on CRCP due to the fact that, so
48
TABLE 3.5. DATA FOR 49 SECTIONS SELECTED BY CAREY AND IRICK (REF 34) TO DEVELOP THE PRESENT SERVICEABILITY: INDEX FOR RIGID PAVEMENTS USED IN THE AASHO ROAD TEST.
aesthetics. At present, there is no preC1se formula to consider all these
aspects in an integrated manner (Ref 3).
The quantity and quality of this information 1S similar to the
requirements for condition surveys, shown 1n Table 3.1, for the different
applications 1n a PMS.
Pave~nent engineers suspect that there is some correlation among riding
comfort, distress, and load carry1ng capacity or behavior. Nevertheless,
conclusive information has not yet been presented.
SAMPLING WITHIN PROJECTS
Several condition survey sampling procedures were investigated using
existing CRC pavement condition survey data. Cursory observation of some of
the pavements led to the idea that distress occurs in clusters and 1S not
evenly spread throughout the length of the pavement. If this is the case,
then random sampling procedures could result 1n extremely erroneous
estimations of the actual extent of distress. Simulation of a random sampling
procedure was carried out by sampling the data that was collected during the
1978 CRCP statewide condition survey. Predictions based on the samples taken
56
-40
I I I I I \ \
I
\
I -30
, " ......
-40
-20
I
-
-10 I
\ \
I , \
-30
o 10
\
" "- ,
-10
Fig 3.4. Contours of Thornwaite moisture index for Texas.
'10
57
were compared with the actual distress observed when the entire pavement was
surveyed. The results of the analysis revealed the extent of the probable
errors ~n prediction associated with the different levels of sampling.
Sampling Punchouts and Patches
Taute and Noble (Ref 29) analyzed various samples of failures (punchouts
and patches) drawn from all 237 eRep sections surveyed ~n 1978. The
distribution of errors associated with samples of varying size was plotted on
a frequency diagram. Figure 3.5 indicates the probability of being within
+ 25 percent of the correct answer for four different sample sizes, i.e.,
20, 40, 60, and 80 percent. By inspecting this diagram, they found that 80
percent of the roadway needs to be surveyed for an error smaller than 20
percent with a confidence of 75 percent. In other words, sampling of
punchouts and patches is not feasible. However, they pointed out that rigid
and flexible pavements may exhibit different behavior regarding the
occurrence of failures, and, thus, one may hesitate to apply these results
summarily to flexible pavements. It should, however, be noted that the
sections into which the 1978 CRep condition survey and this analysis were
separated were the individual pavement construction jobs. The subgrade
support along the length of such a job may vary considerably. If the
condition survey sections were split up further into much smaller lengths,
based on a cursory examination of the pavement, the error might be reduced
considerably.
Sampling Spalling
Using existing eRC pavement condition survey data from two districts,
the possibility of sampling spalled cracks was investigated. Two sampling
schemes were considered: (1) sampling from each mile in a project and (2)
sampling a continuous length at the end of a project.
100
i 80 I ~80 i i 60 1.
1
_----40 ,/1 ,----' ~_I ~~~~ , ,_------ ___ - -20
. ' -""".. -- ..".".,..
-c::
80
~ 60 L-
a>
~ ~ o 0
10 0 C\I to
~ ~ o 0 o 0 o to ON 0.
.. <0 a:> ~ I
'r--.: q- q-
c:: I
~ 40 I t:r 1 I ~ ·1 20 ~-1< L L+- /' ~O of,'
~_+_i- " 20 t- 60 ~~' i
t ... ' -..,. -------.-----.
,~"/
Error
Sample Sizes ---20
----- 40
--60 _._.- 80
o -1.12 -0,75 -0.37 0.0 0.37 0,75 1.12
Percent Error, Times .01
Fig 3.5. Percent error distribution for various sample sizes of failures (punchout and patches) from Texas CRCP sections surveyed in 1978 (Ref 28).
1.50 1.87
v' I))
59
The percent error as a function of the percent of the project length
sampled was obtained as follows:
where
PE, 1
PE, 1
SP
SP, 1
=
=
100 (3,3)
percent error of the sample,
true number of spalled cracks ln a project, and
number of spalled cracks estimated from the sample.
The first scheme of sampling studied was a systematic sampling; for
instance, for a 20 percent sample size, the first two-tenths of each mile
were included ln the sample. The second scheme consisted of taking a single
sample at the beginning of each project; for instance, for a 20 percent
sample Slze ln a 5-mile project, the first mile was sampled.
For each of the schemes, the percent error was considered normally
distributed and, uSlng a 95 percent confidence level, the percent error
versus the percent sampling was calculated. Figure 3.6 shows the results of
the analysis; two curves are shown in the figure, one for each sampling
scheme. It is apparent that the first sampling scheme provides better results
than the second one.
The analysis was originally performed using information from one
district. In order to corroborate the results, the analysis was repeated for
another district. Figure 3.7 shows the results of sampling in two districts
following the first sampling scheme. It appears that the results are about
the same; therefore, the results from the first district sampled are valid.
100
80
to :: 60 w -c: Q)
o :D 40 a..
20
o
Scheme 2
'\ / Sampling the First '\ From a Project
x Miles
'\
'" ~ - - 1\ -L!.l.
25 50 Sample Size, 0/0
Scheme I
Sampling From Each
Mile
75 100
Fig 3.6. Percent error calculated for various sample sizes (95 percent confidence of spalling using data from Texas CRCP sections in one of the Districts (District 10) surveyed in 1978.
'" o
... o ... ...
50
w 25 l-u CL
o
Fig 3.7
~ '-'
25 50 Sample Si ze, 0/0
Dist 10
-..::::::: ~ ~
75
Effect of sample size in the percent error calculated for CRCP sections in two Texas Districts (Districts 4 and 10), sampling from each mile (Scheme 1).
100
0' ........
62
A replication study was conducted in the 1978 CRCP condition survey to
evaluate the precision of the measurements (Ref 41). Two different teams
surveyed the same sections in various districts and the results were compared
to assess the precision of measurements. A large difference was observed
when spalling was measured. Table 3.7 shows the different results from each
team when measuring spalling.
The results illustrate the need to constantly be aware of proper
definitions and calibration if different teams are used. For example, for
District 19, where a large difference is noted the team were working
independently and at different times during the first phases of the project.
For the two cases in District 24, i. e, a and b, the same probl\:!ms existed for
the first projects surveyed a large error existed, but later projects where
better control existed the error was much smaller. The errors are also
smaller ~n the other Districts where better calibration control was
exercised. Thus, these results indicate the need for constant calibration by
the teams.
Another alternative to sampling which was tried in the field by SDHPT
and CTR personnel was to conduct the survey at a higher speed than the
normally recommended 5 mph. Reasonable accuracy, less than 15 percent error,
was obtained at 10 mph when the number of spalled cracks was less than 30
percent of the existing cracks. This result could be used in conjunction with
the required degree of accuracy to speed up the condition survey procedure.
Recommendations for Sampling Within Projects
(1) In aggrement with Ref 29, the number of failures per mile can not be sampled but needs to be counted for the whole section.
(2) Pumping, although a major cause of failures, can be neglected when the purpose of the condition survey is to collect information to prioritize pavement sections for rehabilitation. The reason for
TABLE 3.7. RESULTS OF REPLICATE SECTIONS FROM THE 1978 TEXAS CRCP CONDITION SURVEY INDICATING THE NUMBER OF MINOR SPALLS PER MILE PER SECTION AND THE ERROR BETWEEN TEAMS
Team Effect on
I Spalling Discriminant
District 1 2 Error (%) Score (%)
3 61. 3 35.3 1. 55 2.33
4 36.6 70.1 1. 02 1. 53
10 77.7 75.5 0.14 0.21
13 31.1 30.9 0.01 0.02
19 70.8 18.2 1. 84 2. 76
24a 86.2 133.7 2.25 3.38
24b 54.6 46.8 0.55 0.83
25 90.6
•
70.0 0.57 0.86
E = 0.99%
oE 0.82%
63
64
this is that pumping is not an important factor 1n the prioritization equation developed in Chapter 4.
(3) Spalling, both minor and severe, may be sampled, depending on the amount of spalling in the pavement and the accuracy required.
(4) If the condition lengths, using deflections, the
survey sections were split up further into smaller a cursory examination of the pavement or
sampling error might be reduced considerably.
DATA REDUCTION
In this section, the programs which have been used to summarize and
report the condition survey data are presented and discussed: the program
CONSRV for CRC pavements, CONOVL for overlaid sections, and CONSMS for
experimental sections. Additional information on each program can be found in
the CTR documentation.
Data Reduction for CRCP: Program CONSRV
The condition survey program CONSRV is used to process and summarize
condition survey data collected in various highway districts 1n Texas.
CONSRV produces the following reports:
(1) project identification information, including the CTR number, length, construction data, and location of each project within a district;
(2) a failure total and spalling, surveyed;
summary, per-mile
patches,
including the total and unoverlayed length, number of failures,'lnd per-mile counts of
and punchouts for each project in each year
(3) a riding quality summary, including serviceability indices for each project in each year surveyed; and
(4) detailed project sumary sheets which itemize all the survey data recorded in the latest survey for each project, broken down into one-mile segments and including mile posts, mile points, total and overlayed project lengths, serviceability indices, means and standard deviations of crack spacing, minor and severe spalling, m1nor and severe pumping, the number of minor and severe spalled
65
cracks, the number of minor and severe punchouts greater than and less than 20 feet, and the number of AC and PCC repair patches.
In addition, CONSRV produces a project-by-project year-by-year summary file
suitable for analysis by other programs.
Figure 3.8 is a flowchart of the different reports and files produced by
CONSRV. The program produces all these summaries from the condition survey
files, each of which contains data for one district; these condition survey
files are stored as permanent files in our data base.
In Ref 42, a description is given of CONSRV. In general terms the
description ~s still valid; some changes have been made to the program to
work with 1980 information: the failure summary prints out information for
all the condition surveys, ~.e., 1974, 1976, and 1980; &nd in the project
summary sheets pumping is reported as a yes-no condition.
The program has been modified each time a condition survey is made and
major work is needed to make it a general program. Currently work ~s under
way to process the urban condition surveys, i.e., 1976 and 1981, using
CONSRV.
Data Reduction for JCP and JRCP
At this time, no program is available in the CTR to process jointed
pavements information. CONSRV may provide a basic model for developing such a
program for JRCP and JCP.
Data Reduction for Overlays: CONOVL
CONOVL reports the condition survey information for AC overlays. The
printout shows the results of all the condition surveys performed on a
section so that the deterioration process is obvious from a simple inspection
of the data. Figure 3.9 is a sample printout from program CONOVL.
66
PROJECT IDENTIFICATION
INFORMATION
INPUT CS INFORMATION
(CRCP)
PROGRAM CONSRV
FAILURE (PUNCHOUTS AND
PATCHES) SUMMARY
RIDING QUALITY SUMMARY
DETAILED PROJECT SUMMARY
OTHER PROGRM1S
(ANALYSIS, PLOTTING, ETC.)
t
Fig 3.8. Reports and files produced by program CONSRV used to process and summarize CRCP condition survey information.
ACP OVERLAY CONDITIoN SURVEY
********************************************************************** 'RI 141+ 0 TO I 111+2115
LENGTH I le2! n PERCENT nHll
SURVEYS •
IIlE'L~CRICS/ND;P!R MIl PATCHEI INO,PER MIl 'AlLURES INO.PER MIl LOSS OF BOND 'AlLURES, NUN RIIT DEpTH rIN)1
eOMM~NTSI
MAY 8t
01 I.e ~I I,f) el a,~
II
THICICNUU Ih. PLACI!MENT T!""fIUTUR!1 "
MAR 81
11 t,15 01 1.1 f!ll I,ll
VI
*****tt*************************************************************** FRI 742+U LENGTH I QU! 'T THICKNES81 IN. TOI 8lC,.Z5 PERCI!NT IITEELI PLACEMENT TfMPERATUREI ,~
SURvEvft • MAY 81 MAR U
RF.'L.CRKS/NO;P£R MIl 'Ill 'Il.~ 01 O,0 PATCHES INO P[R MIl 01 III.~ ru 1ll.0 FAILURES INO!PER MIl AI 0,0 II 1,1 LOSS OF AOND 'AILURESI 0 I MEAN RUT DfPTH (IN). ~Ul
COMMI!N,,!,SI ******ttt***.**.**********************************.**.** ••••• ***.* •••• FRI 8]4tt2!) LENGTHI 2&q" n THICKNUSI JtoI. Tn. 86 .. 15 PERCENT STEEL. PLACEMENT TEMPERATURE I '.
8URVE¥1iI • MAy 81 "'AA ez R!'L;CRKS/NO;P!R "'It ., B,I II I,t PATCH£8 INn,P!R MIl '" t.1II f!ll ',11 'AILUPES INO.PER MIl II ',1 1111 1,8 LOSS 0' BOND 'AlLURES. " 0 MUN RIIT DfpTM UN'. ~26fJ
Fig 3.9. Sample output from program CONOVL used to report condition surveys on AC overlays on rigid pavements.
67
68
Slight modifications need to be made to the output; it prints only star
symbols when the quantities exceed the printing format, which is a common
case.
Data Reduction for Special Projects: Program CONSMS
CONSMS reports the condition survey of small CRCP sections. The output
~s similar ~n form to that for AC overlays, but the distress manifestations
are different. Figure 3.10 is a sample output of CONSMS.
SUMMARY
The collection and preparation of condition survey data for analysis
has been presented. An attempt has been made to explain the data processing
procedure, about which the following statements can be made:
(1) The condition survey procedure, in terms of quality and quantity, depends on the intended applications. That is, when deciding which, and how much information should be collected, it is necessary to have in mind the applications for which the data will be used.
(2) The limitations and additional information required Ln our data base can be assessed by comparing it to the standard information required for future applications. That is, at the present time analysis at the network level, verification of existing design methods, and some specific special studies are possible, but improvement of design methods or accurate predictions are not possible with the information available.
(3) Sampling within sections was attempted but the results are discouraging. If the existing projects could be broken into smaller sections by cursory examination or using deflections so as to reduce heterogenity within the sections, then the variability could be reduced.
(4) The computer programs used to report the information have been described. Program CONSRV needs to be modified to deal with future condition surveys. A more sophisticated data system would be of great help for the increasing amount of information being collected.
(5) In Appendix A, the developement of the condition survey procedures used by the CTR is presented. Updating of the procedures can be made when relevant variables are identified for specific applications.
SMAIL 8!CTION8 CDNDITtnN 8U~VEV ... ----........•............... SECT~ 1 BOW!! CO~ EXP£R!M!NTAL SECTIONS ~IT~ A WATERPROOF JOI~T 8F.AL AND A 2 INCH TVP! D HMAC OVERLAY wITHOUT PU~PINn
In the normalized equation, heavier weight is assigned to cracking,
while low weights are given to spa1ling and patching. That is, cracking has
a large influence in the decision to accept or reject a jointed pavement.
Equation 4.7 classifies correctly 92 percent of the 49 cases.
It was mentioned that the acceptability or unacceptabi1ity of the
pavement sections used in the derivation of the discriminant equation for
jointed pavements was originally formulated serviceability, a concept
completely different from distress. However, the coefficients derived in
84
Eq 4.7 are supported by an independent analysis suggested by Zaniewski
(Ref 64). He recommended transforming the equation developed for CRCP by
substituting the distress terms with equivalent distress mani.festations in
jointed pavements (the magnitude of the new variables was scale~d so the range
was equal to one of the original variables). The coefficients obtained by
this method were about the same as the ones derived by Discriminant Analysis
(Ref 65). The approach suggested by Zaniewski appears to be viable when data
are not available. Nevertheless, the approach requires good engineering
judgement.
Commentaries on the Discriminant An~lysis Approach
At this stage, it is important to mention some assumptions inherent in
the discriminant analysis that might invalidate the results if not satisfied:
(1) That the discriminant functions obtained are linear. This might not be correct. This situation arises from the fact that the mathematics involved in the discriminant analysis are based on the assumption that distributions of the groups are equivalent (variance and covariances should be the same in both groups).
(2) That the variables are considered normally distributed.
Non-parametric and non-linear discriminant analysis techniques could be
used if assumptions (1) and (2) or are not found to be valid. Regardless of
the restrictions mentioned above, the prediction results obtained with the
discriminant equations are encouraging.
In addition to the previously mentioned assumptions, the following
points should be considered:
(3) The data points used are not comprehensive. That is, for distress values outside the range of our data, the equations derived are not applicable.
85
(4) The subjective decisions for overlaying the sections were assumed to be correct and not affected by availability of funds.
(5) Not all the factors have been included. The criterion followed for deciding to overlay some of the sections used in the CRCP analysis is not clear. The coefficient derived could be different if all the factors involved in the decision process were included.
SUMMARY
Several approximate methods aimed at developing a distress index have
been presented and discussed; i.e. subjective parameters, regression
analysis, factor analysis, and discriminant analysis. The following
conclusions have been drawn from the study of these methods:
(1) The equations with subjective parameters rely heavily on engineering judgement and experience and, therefore, are useful when sufficient information is not available.
(2) Factor analysis is difficult to interpret and to the assumption used in this approach equations measure structural performance or pavement section.
there is no support that the resulting deterioration of a
(3) Regression analysis and discriminant analysis are viable techniques for developing distress and decision criteria indices, the selection of one or the other being dependent on the dependent variable selected.
An alternative procedure for developing distress indices is presented in
Chapter 6. Such a procedure makes use of the distress models presented in
the next chapter plus cost equations which are a function of the distress
F = transverse joint faulting of adjacent slabs, inches;
ESAL = cumulative applied l8-kip equivalent single axle loads in the
given lane, millions; and
BSTRESS = maximum bearing stress of the dowel bars as determined by
Friberg's method for an l8-kip single axle load.
The statistics reported for the model show 2
R not meaningful, since
the equation was forced through the origin, standard error of 0.09 in., and
coefficient of variation of 60 percent, for 284 cases. Through algebraic
manipulation, the following equation was obtained:
lOG
+ 1) • [ (S.13)
where
-0.091 + O.OOOl*BSTRESS
and the subindexes 1 and 2 are interpreted as before.
In order to compare the equations, calculations of future values of
faulting were performed using various levels of BSTRESS, axle load
applications, and initial faulting. Table 5.1 presents the results of such
analysis. The comparison is possible regardless of the different units in
the two equations. It appears that, as the ratio of traffic approaches
unity, the equations produce similar results. The largest difference between
equations is obtained at low values of BSTRESS and high traffic ratios. The
traffic ratios which will be more commonly used in the scheduling scheme
under development are close to unity.
Equation S.11 was adopted for this study because it has a simpler format
and involves less input data than Eq 5.13. If faulting for a new JRC
pavement is required, then the equation of Darter et al CEq 5.12), seems more
appropriate because the BSTRESS term can be extended to different cases of
slab thickness or foundation support. Notice that the equation selected is
applicable to both JCP and JRCP.
BSTRESS
1000
3000
TABLE 5.1. COMPARISON OF RESULTS FROM TWO FAULTING PREDICTION EQUATIONS FOR JOINTED PAVEMENTS
Faulting, F2
107
Traffic, ESAL l
Traffic, ESAL
2
Faulting,
Fl Gulden Darter et al
0.2 0.273 0.204 1.0 2.0
0.6 0.820 0.606
0.2 0.448 0.214 1.0 6.0
0.6 1. 344 0.618
0.2 0.273 0.306 1.0 2.0
0.6 0.820 0.741
0.2 0.448 0.559 1.0 6.0
0.6 1. 344 1. 079
0.2 0.217 0.239 5.0 6.0
0.6 0.651 0.652
lOb
EQUATIONS FOR AC OVERLAID RIGID PAVEMENTS
In the next paragraphs, the development of distress prediction equations
for AC overlaid rigid pavements is presented. The data base used is
documented, the equations derived for old and new overlays are presented,
and, finally, the results are discussed.
Data Base
Several experimental sections of AC overlay on CRCP were eonstructed on
IH-45, Walker County, in 1974. The total length is 11.4 miles. Since IH-45
is the primary connection between Houston and Dallas, the perc'~ntage of truck
traffic is high. 6
The estimated cumulative 18-kip ESAL was 5.25 x 10 in
both directions between the date of placement of the overlay and the latest
condition survey, in 1980.
The typical pavement section consists of 6.0 inches of l:ime stabilized
subbase, 6.0 inches of crushed stone base, 8.0 inches of CRCP, and variable
thicknesses of overlay, i.e., 2.5, 4.0, 5.0, and 6.0 inches.
III order to monitor the distress condition of the AC overlay, condition
surveys were carried out before and at 20, 28, 55, and 71 months after the
overlay was placed. Twenty-four sections were surveyed. The distress
manifestations recorded are number of reflected cracks, patches, reflected
failures, loss of bond, and mean rut depth. A sample of the condition survey
report printout was given in Fig 3.8.
109
Analysis Approach
A distress index was used to group the different reflected distress
manifestations into a single figure. Loss of bond was not included in the
index since it did not occur in any of the sections analyzed.
considered separately.
Rut depth was
The distress index used in the anlaysis was similar to the discriminant
scores presented in Chapter 4. The discriminant score for CRC pavements,
Eq 4.6, was modified so it could be applied to AC overlays on rigid
pavements. It was decided to include patches and failures per mile in the
failures per mile term of the equation, and reflected cracks in the spalling
term. Furthermore, since the analysis is conducted in terms of percentage of
distress from the before overlay condition, the
subtracted from the equation. The resulting equation is
where
Z - A o
-AI (RF + P) - A2 (RC)
A o
coefficient was
(5.14)
Z distress index for AC overlaid rigid pavements,
Zl modified Z,
A 1.0, 0
Al 0.065,
A2 0.015,
RF number of reflected failures per mile,
P number of patches per mile, and
RC = percent of reflected cracks.
110
Table 3.6 presents a summary of the percentages of distress and rut
depth in relation to the before overlay condition for the various ages of the
overlay. Column 1 contains the overlay thicknesses, column 2 presents the
section lengths, column 3 contains the discriminant scores for the before
overlay condition, columns 4 through 7 are the percentages of reflected
distress, columns 8 and 9 are the measured rut depth in inches" and column 10
gives the percentage of failures repaired before the overlay was placed.
From Table 3.6 it is apparent that
(1) distress increases with age,
(2) distress decreases with overlay thickness,
(3) rut depth increases with age, and
(4) rut depth increases with overlay thickness.
Figures 5.4 and 5.5 are plots of the data presented in Table 3.6.
Average values of distress for each thickness were used in these figures.
Tyner et al (Ref 80) obtained similar results in AC overlays on jointed
pavements; their observations at 48 months yielded the following values: 100
percent reflected cracks for 2.0-inch overlays, 75 percent for 4.0-inch, and
24 percent for 6.0-inch.
Description of Distress Prediction Models
Linear regression analysis was used to analyze the data and to develop
equations to predict distress in new and existing overlays. In the following
paragraphs, both equations are presented and discussed.
Prediction of Distress in New Overlays. The equation for new overlays
was developed using percent distress as the dependent variable and age and
111
100
)( CI) 80 2.5 11 Overlay "0 c:
Thickness U) U) CI) L. -U)
60 0
0 c: .-0' L.
0 40 E 0 L.
4" u.. '::/!. 0
20 5"
611
0 0 20 40 60 80 100
Age ,months
Fig 5.4. Plot of average percent distress time history for different overlay thicknesses as monitored in Walker County, Texas.
112
c: .. ~ -a. CD 0 -::l a::
0.5
0.4
. 6 11 Overlay Thickness
0.3
. 5 11
0.2
4 11
0.1 . 2.5 11
o 20 40 60 80 100 Age, months
Fig 5.5. Plot of average mean rut depth time history for different overlay thicknesses as monitored in Walker County, Texas.
113
thickness as the independent variables. The equation, obtained with 21
observations at four different ages, was
where
y 3.012 * (X - 1.667) D2. 8
a
Y predicted distress percentage;
(5.15)
X = age of overlay when prediction is required, years; and
D thickness of overlay, in. a
The equation R2 is 0.682 with a mean standard error of 0.289 and a
poor plot of residuals. Figure 5.6 presents a comparison of actual versus
predicted reflected distress as obtained from Eq 5.15. By analyzing the
residual plots, it was found that other independent variables are required in
the equation to account for the quality of the supporting soil and the
quality of the pavement structure beneath the overlay.
Figure 5.7 indicates the increase in variance of the predicted distress
with age for the 2.5-inch overlay; furthermore, the variance is different for
the various thicknesses. It is felt that the inclusion of variables to
account for the soil and the pavement structure will overcome this problem.
The equation was retained because it accurately predicts avErage values.
In future analyses, the sections need to be separated using lengths with
similar Dynaf1ect deflections, representing sections with similar soil and
pavement structure quality.
114
("'\1
l_)
I -: (; ,
! ,
U
C-' ,~ ,
r',
c (",'." ~l
iT'lT'
rr rr
rr~ rr
:r ~~-
40 r"T liD' t~ "" 1-'1 L
0,,(30
'"
'r i~
rr
t30 ., t"" 1 f'L
'r
2~ iJO
Fig 5.6. Comparison of actual versus predicted reflected distress for new overlaid rigid pavements in Walker County, Texas.
I z:.: 4i)
o N , N
2.0
1.75
1.50
1.25
1.00
0.75
Average Line x f 2 II ,,~'--- or .5
~ ~~ Overlay
Thickness
0.50
0.25
o o 20 40 60 80 100
Age, months Fig 5.7. Plot of percent distress versus time for the 2.5-inch
overlay on CRCP monitored in Walker County, Texas and used to develop distress prediction equations.
115
116
Prediction of Distress in Existing Overlays. The equation for existing
overlays was developed using percent distress as the dependent variable and
thickness, previous age, previous percent distress, and age at time of
prediction as the independent variables. The equation obtained with 21
observations at six different age increments was
where
=
x -2
X -1
1. 67 ]
1. 67
Zl 2
Z ' predicted distress percentage at age X2
o
Zl 1 , previous distress percentage at age Xl
Z o
X2
age of overlay when prediction is required, years; and
Xl = previous age of overlay, years.
(5.16)
The equation R2 is 0.968, with a standard error of 0.066 and good
plots of residuals (Fig 5.8). The inclusion of previous distress at a given
age accounts for the quality of the soil and the pavement structure. This
equation has better prediction capabilities than Eq 5.15 but it requires the
knowledge of previous distress history of the overlay.
Discussion of Equations
In regard to the analysis approach, the following commentaries can be
made:
o
Ul .~ LL! 0:.-tU;
c.~ >----'(\;
o
CJ Lu 0 c: --t'
0.. C}
fr
rr
f~
rr
0, 80 R~ F L
iP'"
1 20 DISTRESS
rr
rr
r
peT}
Fig 5.8. Comparison of actual versus predicted reflection distress for AC overlays on rigid pavements.
117
118
(1)
(2)
The analysis approach, i.e., pulling together all manifestations into a single index, appears to simplifying the analysis.
the distress be helpful in
Nevertheless, includes loss overlays.
a discriminant score (or distress index) which of bond and rut depth needs to be developed for AC
In relation to the regression equations derived, the following comments
can be made:
(3) The prediction equations correctly model the change of distress with age and overlay thickness.
(4) Nevertheless, their prediction capabilities are restricted to AC overlays with conditions of pavement structure, traffic, and environmental conditions similar to those of overlays in Walker County.
(5) Therefore, it is recommended that future analyses include other overlay projects with different traffic and environmental conditions.
Finally, in relation to the results obtained from the analysis, the
following comments can be made:
(6) Initial distress of Therefore, it seems about 2 years.
the overlays occurred after 20 months. that the first survey can be postponed for
(7) The analysis supports the conclusion derived in a previous study of the Walker County overlay project (Ref 81), specifically, that there is a maximum thickness beyond which the rate of failures in the AC overlay decreases to a minimum amount, from the standpoint of maintenance.
(8) Thick overlays need to be checked against rut depth.
(9) For future analysis, sections with similar overlay thicknesses need to be separated using Dynaf1ect deflections to reduce the variance of the observations.
119
SUMMARY
This chapter describes the development of distress prediction models for
rigid pavements and AC overlaid rigid pavements. Regression analysis was
used to obtain equations for each type of distress considered in the distress
indices developed previously. The application of both the distress indices
and the distress prediction equations is shown in the next chapter.
A system is not a computer program per se; however, the large number of
calculations involved make it essential to develop a program to move past the
conceptual stage into a working system.
The purposes of this chapter are to
(1) demonstrate the application of the distress models developed in Chapters 4 and 5 in a PMS at the network and project levels.
(2) document the development of a computer program to prioritize a set of rigid pavement sections for maintenance and rehabilitation within a certain time frame.
(3) generate a list of candidate projects for rehabilitation using Texas CRCP condition survey information. It is intended that this type of list help the Texas State Department of Highways and Public Transportation in planning future allocation of money for rehabilitation.
(4) present a project level program for the evaluation of design and maintenance of specific projects.
(5) indicate how the distress index equations can be improved by means of computer simulation using a project level design and maintenance evaluation program.
NETWORK LEVEL APPLICATION: REHABILITATION PRIORITIZATION AND SCHEDULING
The first part of this chapter is concerned with the applications of the
distress models at the network level. This includes development of a
rehabilitation prioritization and scheduling program and the use of such a
121
122
program in preparing a list of candidate rehabilitation projects for the
Texas network.
The section begins with an explanation of the scheduling procedure
before describing the computer program. The capabilities of the program are
described and some sample runs are made to illustrate such capabilities.
Appendix D presents a list of recommended projects for rehabilitation in the
next five years, using field information as an input.
Rationale of the Prioritization and Scheduling Scheme
Figure 6.1 depicts the distress history of three hypothetical projects
(A, B, and C) that will be used to explain, using a heurist1.c approach, the
procedure used in the prioritization scheme presented in this section. Each
of the plots on the graph corresponds to one of the projects; the Y-axis is
the distress index and the X-axis is time in years. A broken line in the
figure indicates an acceptable maximum level for the distress index. That
is, when any project reaches that level, it is considered to have reached
terminal condition and needs to be rehabilitated.
Assume that a condition survey of the network is performed in 1982 and
the resulting information indicates that rehabilitation of the projects needs
to be programmed. The problem seems fairly easy, i.e., determine the date on
which each of the pavement sections reaches the terminal condition and
prepare a list showing that. An output list is shown in Fig 6.1.
There are several problems which complicate the procedure:
(1) Which pavement responses should be considered in ascertaining the condition of the pavement?
(2) What levels of the responses or combinations thereof are to be considered terminal condition?
Fig 6.1. Distress hist0ry vf several hypothetic projects showing the concept of prioritization.
1982 1986 1984
I-' N '-'"
124
(3) How accurate are the response prediction equations?
(4) Are there any budget constraints?
The first three questions were addressed in past chapters. This section
is concerned with presenting the developmentof a program whic.h produces an
ordered set of pavement sections requiring rehabilitation with and without
budget constraints.
Description of Program PRPOI
A program named PRPOI was developed to schedule rehabil Ha.tion of rigid
pavements (JCI', JRCP, and CRCP) within a certain design per1.od. The input
data are condition survey information on a set of rigid pavements for the
same year. The solution is obtained using distress models: distress indices
and distress prediction equations. All of the distress models were
integrated as subroutines in the program in order to facilitate future
modifications.
The program output has several alternatives:
(1) A prioritized list of pavement sections according to their distress condition at the time of the condition survey.
(2) A multi-period rehabilitation schedule of the pavement sections without considering budget constraints. The selection of candidates for each year is made on the basis of the magnitude of the distress index.
(3) A mul ti-period rehabilitation schedule of the pavement sec tions accounting for budget restrictions. The selection for each year depends on the magnitude of the distress index and the budget availabil ity.
Figure 6.2 is a simplified flowchart of the computer program.
Information on the distress condition of each project is required as an
input. The program starts by calculating the distress index for each
125
START
NPER Number of years in the design period.
PREDICT CONDITIONS
FOR NEXT YEAR
DISTRESS INDICES
PRIORITIZE PAVEMENT
SECTION
NO
YES PRINT LIST
NO /BUDGET YES
SELECT FAILED
PAVEMENT SECTION
NO
CONSTRAINTS >-----?
PRINT LIST
YES
SELECT PAVEMENT
SECTION UNTIL BUDGET IS SATISFIED
Fig 6.2. Simplified flowchart of the computer program (PRP01) developed in this report to prioritize and schedule rehabilitation.
126
section. The sections are prioritized according to the magnitude of their
distress ind ices. At this stage, a check is made of the design period. If
the design period is set equal to zero, the program prints the priority list
and stops, but, if the design period is larger than zero, the program
continues. Next, a check is made for budget restrictions and two different
criteria are followed, depending on the existance of budget constraints. If
no budget constraints are imposed by the user, the rule for selecting the
rehabilitation candidates is very simple: all the pavements which have
reached terminal condition are included in the list for that year. If budget
constraints are present, the selection of candidates is made on the basis of
budget availability. The already prioritized sections are considered one by
one, and the rehabilitation cost of each is calculated and accumulated until
the budged is satisfied. A list of candidate projects is printed for each
year of the design period. The program checks to see if the design period
has been covered, in which case it exits; otherwise, condition:; are predicted
for the next year and the program returns to the step in which the distress
indices are calculated.
The possibil ity exists of optimizing the average condition of the
sections using budget restrictions; however, it was thought this would
complicate the program unnecessarily. A better objective function for
optimization would consider user and maintenance costs, which, at this time,
are not available in terms of distress.
In Appendices B, C, and D, relevant information on the program is given.
Appendix B contains the FORTRAN listing of the program, Appendix C an input
guide, and Appendix D sample input and outputs.
127
Distress Models in the Program. Table 6.1 presents in summary form the
equation numbers used in the report for the distress models in program
PRPOI.
A couple of modifications were made to the distress index equation
formulated for jointed pavements. First, the cracking and patching terms
were pulled together since, usually, patching is the repair of cracking.
Second, the spalling term had different units than the prediction equation
and it was modified to appear as a percentage instead of feet per 1000 square
feet. The reasoning behind the units change is the following: percent
spalling is the ratio of the number of spalled cracks and joints to the total
number of discontinuities; if an area of 83 x 12 sq ft (1000 sq ft) is
considered,
where
PS (spalled discontinuties/total no. of discontinuties) x 100
S/12 83L
• (100.0)
S • L/lO.O
S spalling in ft per 1000 sq ft, and
L spacing between consecutive discontinuities.
If the spacing, L, is not available, an assumption is needed for estimating
this value. Usual joint spacings are from 15 to 50 ft, the smallest value
being used for JCP (no reinforcement), and, if intermediate cracking occurs,
L = 7.5.
128
TABLE 6.1. EQUATION NUMBERS USED IN THIS REPORT FOR THE DISTRESS MODELS IN COMPUTER PROGRAM PRP01.
Pavement Type
CRCP
JRCP and JCP
AC Overlay on Rigid Pavement
Distress Manifestations
Punchouts and patches
Spa11ing
Scaling
Pumping
Cracking
Spa1ling
Patching
Faulting
Reflected
Punchouts and patches
Loss of bond
Rutting
*NC: Not considered
Prediction Equations
(5.1)
(5.3)
(5.4)
NC*
(5.8)
(5.9)
(5.8)
(5.11)
(5.15)
(5.15)
NC
NC
Distress Index Eqs.
(4.6)
(6.1)
(5.14)
129
An additional modification was to transform the terms in the equation
into per mile figures instead of the original units. Substituting the
modifications into the distress index equation, the following is obtained:
where
Z. J
1.0 - 0.005 C - 0.006 PS - 0.003 F m
C = C + 0.25 P m
and all the rest of the terms are as previously defined.
(6.1)
(6.2)
Several distress manifestations were not considered in the distress
index equations. Pumping was not considered in the case of CRCP because its
inclusion resulted in an illogical equation, as described before. In the
case of overlaid rigid pavements, loss of bond did not appear in the sections
considered for the development of the distress index equation. Rutting,
although not included in the distress index of overlaid pavements, is a very
important factor and needs to be considered when an overlay is designed.
A key assumption made in the program is that all of the distress indices
are equivalent. This assumption in based on the fact that the best possible
value for all the indices is unity and the terminal condition is zero.
However, no formal proof of the assumption is given.
130
Sample Runs Using the Prioritization and Scheduling Program PRPOI
Figures 6.3, 6.4, and 6.5 are partial outputs of sample runs made with
the prioritization and scheduling program PRPOl. These sample outputs are
used to explain the contents of the lists produced by the program for the
various available options. In addition, the program automatically prints the
input information, except that printing detailed information from the
condition survey is left as an alternative to the user.
Figure 6.3 is the type of output generated when the option selected is
the prioritization of projects using the condition survey information
directly. This option does not involve any type of distress prediction. The
program calculates the distress index for each of the sections and sorts them
all according to the relative magnitude of the indices, with the worst
condition first. The output contains 4 columns. The first one is the
section identifications; the second is the distress indices (note that the
numbers increase progressively, as the condition of the sections does); the
third column is the cumulative equivalent single axle loads, which were input
by the user; and the last column is the ranking of each section as obtained
from the distress indices, with the poorest pavement listed first.
Figures 6.4 and 6.5 are the type of output obtained for both the second
and third options of the program, i.e., multi-period rehabilitation
scheduling without and with budget constraints, respectively. Any of these
options prints a list of projects requiring overlay for each year of the
design period similar to Fig 6.4, plus a summary of the design period similar
to Fig 6.5. In Fig 6.4, which represents the year-by-year output, each of
the lists indicates the number of years after the condition survey for which
it is generated. The output contains 6 columns: the first one is the
Fig 6.5. Sample output summary from the computer program PRP0l using the scheduling option.
133
134
section identifications; the second one is the sorted di:stress indices
calculated from the distress predicted for that year; the third one is the
cumulative equivalent single axle loads estimated for that year; the fourth
column contains the section length; the fifth column contains the estimated
cost of each overlay; and the sixth column shows the ranking given to each
section as a function of the distress indices. At the bottom 'of the printout
the total length and the total cost to overlay the candidate sections for
that year are printed.
For the second option, i.e., scheduling of pavement sections without
budget constraints, the distress indices for years other than the first one
are very close to zero and they are not very different; therefore, further
ranking of the sections can be made in terms of cumulative ESAL.
Figure 6.5, which presents the summary of the year-by-year analysis
contains, for each year, the following information: the average distress
index calculated for the network, the total length of projects recommended
for rehabilitation, and the yearly budget. An overall summary is printed at
the lower part of the table.
Appendix D contains a list of CRC pavements suggested for rehabilitation
in the five years after the 1980 condition survey. Forecasts for longer
periods would reduce the accuracy of the predictions.
PROJECT LEVEL: DISTRESS AND MAINTENANCE EVALUATION SCHEME
In order to complete the discussion on the use of distress models in
PMS, this section presents the application of such models at the project
135
level. The project level schemes can be used to accomplish several different
tasks:
(1) Pavement design - The current design schemes are based on the prediction of serviceability-history or by fatigue prediction approaches. Since design is accomplished by deriving cost effective alternatives, the cost models should include maintenance and user's costs related to pavement distress.
(2) Definition of optimal maintenance strategies - If the effect of maintenance on the future occurrence of distress is ascertained, comparisons among different maintenance strategies can be performed to derive the more cost effective ones (Refs 69, 88, and 89).
(3) Improvement of distress index equations - An alternative procedure for the development or improvement of a distress index equation can be performed by computer simulation, using a project level program, to determine the optimal rehabilitation timing from cost standpoint.
The development of a design and maintenance evaluation program is
presented in the next pages for illustrative purposes. At the present time,
it is considered difficult to implement distress models in a working program
for rigid pavements to successfully accomplish tasks similar to the ones
mentioned previously.
In the case of pavement design, distress models are commonly used in the
design procedure to evaluate maintenance costs but they are not a factor in
defining the pavement structure. This is easily understood if one considers
the poor prediction capabilities of the available models. The most effective
overlay thickness can be derived with the program presented if cost
optimization is derived from the use of the distress index instead of the
optimal timing approach.
For the derivation of optimal maintenance strategies, adequate
information is not extensively available. Reference 90 presents the
evaluation of several maintenance methods for CRCP. Similar information is
currently being collected by the CTR to ascertain the effectiveness of
136
maintenance methods, such as void grouting, underdrains, special patching
techniques, and fabric undersea1s.
The improvement of distress index equations requires for its
implementation the derivation of user's costs related to the degree of
distress of the pavement. Guidelines are presented in this section for
improving the distress indices through computer simulation.
In the next paragraphs, a rationale is presented for the derivation of a
design and maintenance scheme at the project level. Guidelines are presented
to transform the scheme into a working program. Finally, an application of
such a program is suggested to develop a distress index.
Rationale of a Design and Maintenance Evaluation Scheme
The distress history of a given pavement is shown in Fig 6.6. For each
age, there is a corresponding distress level in the pavement; at each stage,
a decision is needed as to whether to overlay the pavement or to accept a
higher level of distress. If the decision is to overlay, the pavement will
have zero distress immediately after the overlay is placed and a new rate of
distress occurrence will begin. When a higher level of distress is accepted,
the distress rate will keep on increasing until, eventually, the rate becomes
excessive from a cost standpoint. There are a number of different
rehabilitation strategies which can be followed and, obviously, one of them
is the most economical.
By performing an economic analysis for a specific pavement, the failure
condition, i.e., the distress level at the optimum time to overlay, can be
defined for that pavement. Of course, the failure condition will be
different for different pavement structures, traffic, ani environmental
e o -c -en CD
1It-
e c :E en en CD ... -en
Cl
/
8 1/
~ Distress Predietion\ / I Equation for y I Origina I Pavement 8 /
D" > DI > D
/;// / /"y./
C'
Age, years
Fig 6.6. Hypothetical distress history of a pavement section.
Terminal Condition
Dis tress Pre diet ion Equation for Overlay
f-" W -...J
138
conditions. Furthermore, this method can be used to define the traffic or
years left to an existing pavement before overlaying is required. If
overlaying is needed for causes other than distress, i.e., safety or riding
quality, this "remaining life" prediction will be useful in designing thinner
overlays.
In order to develop such an analysis, distress prediction equations and
accurate cost functiQns are needed. Also, the effect of periodic maintenance
should be accounted for. Because the current models are not accurate and
because of the computer and manpower costs, this type of an.3.lysis does not
appear more beneficial than the use of approximate methods at the network
level. However, this approach can be used to develop approxim.3.te equations.
Daniel et al (Ref 82) developed a methodology to determin,e the optimum
time to overlay a pavement structure based on the total cost encountered over
the entire design life. The models developed in that reference failed to
minimize the cost function and, therefore, do not opt imiz,e the number of
years to overlay within the range of years to overlay selected for the
experiment.
Although the approach presented in this section is similar to the one
recommended in Ref 82, there are several differences, the most important
being the distress models and the emphasis placed on distress for the
selection of a pavement overlay thickness.
Description of the Program DMEOl
Program DMEOl was developed for illustrative purposes only, and
extensive improvements are required if significant results are to be obtained
from it. The program reads as input information the condition of a pavement
139
at a given time and iterates to determine the timing of overlays, calculating
the user and agency costs incurred in each case. If there is an optimum time
to overlay, it is optimal from the standpoint of economics, i.e., it is the
timing with the minimum overall cost.
Figure 6.7 is a sample output of the program for a specific timing. The
first column is the pavement age; the second is the traffic volume; the third
one contains the present value interest factor for each year since the costs
are discounted to the first year for comparative purposes among the different
alternatives. The fourth contains the amount of distress calculated for each
specific year, and the fifth shows the incremental distress from one year to
the other. Columns 6 and 7 are the agency and user's costs estimated for the
maintenance, or excess cost, required by the distressed state of the road;
the last column gives the overall cost for each year. In the lower part of
the page, the totals discounted to the first year are given.
Similar output pages are produced for other overlay timings. The timing
which produces the minimum overall cost is the optimum time to overlay. The
FORTRAN listing of the program is not documented since the purpose of
developing it was to illustrate concepts rather than produce a working
program.
Models Used by DME01. The distress models used by the program are the
ones presented in Chapter 5. With current condition survey information as a
starting point, the program uses models for the particular pavement type to
predict future distress. When the section is theoretically overlaid, models
for overlay pavements are used for distress prediction.
Fig 6.7. Sample output of a project level program which makes use of distress
quantities to evaluate alternatives.
I-' +-o
141
Descriptions of the models, which can be used to calculate the cost
components, can be found elsewhere (Refs 82 and 83) with the exception of the
user's operational cost. Several sources, such as Winfrey, Claffey,
MCFarland, and Zaniewski et a1 (Refs 84, 85, 86, and 87) present user's
operational cost data for various highway types and design characteristics.
However, McFarland was the first to considers the effects of varying pavement
serviceability on user's cost. None of the above mentioned references
consider the effects of distress on user's operational costs. This is the
primary flaw of the scheme proposed.
Alternative Procedure to Derive a Distress Index
The purpose of this section is to sketch an alternate procedure for
developing a distress index and/or an output function for the prioritization
and scheduling procedure at the network level. The alternative procedure
involves the following steps:
(1) Prepare or select a project level computer program with the capacity to generate the optimum time to overlay and the costs of maintenance and rehabilitation for a specific section.
(2) Set an experimental design to derive, techniques, approximate models to calculate
(a) the optimum time to overlay and
through regression
(b) costs of maintenance and rehabilitation for different overlay timings.
(3) With these equations, introduce an improved distress index into the prioritization scheme, as a function of
(x. - X ) 1 0
142
where
Xi time of overlaying,
X optimum time to overlay, o
or, introduce cost equations to optimize the scheduling procedure
by minimizing costs.
SUMMARY
This chapter presents the application of distress models at both the
network and project levels. At the network level, a program wa:; developed to
prioritize or/and schedule rigid pavements for rehabilitation. The program
was run using Texas CRCP field data, and the outputs are shown :In Appendix D;
similar runs are intended to help the State Department of High~lyS and Public
Transportation with future rehabilitation decisions. At the project level, a
design and maintenance evaluation program was presented for illustrative
purposes. Guidelines were suggested to apply a similar program for the
derivation or improvement of the distress index equations.
CHAPTER 7. APPLICATIONS OF THE REHABILITATION SCHEDULING PROGRAM PRP01
The most obvious application of the computer program PRP01 is to
generate lists of candidate pavements for rehabilitation similar to the ones
presented in Appendix D. However, the use of the program can be extended to
analyze the impact of several different budgeting policies on the condition
of the pavement network. The purpose of this chapter is to present the
effects of different budget policies using information from the 1980 East
Texas CRCP condition survey. The data used for the analysis came from 139
sections, representing 7 districts, with a total length of 756.5 miles and an
age range of 9 to 18 years. These specific questions will be dealt with:
(1) What is the effect of various yearly budgets on the distress condition of the pavement network?
(2) What is the effect of considering the time value of money in the analysis?
(3) What is the additional cost overlaid at a later date distress index?
ANALYSIS APPROACH
incurred if a than the one
pavement section is recommended using the
As described in Chapter 6, program PRP01 can generate lists of candidate
pavements for rehabilitation with and without budget restrictions. The
analysis approach followed makes use of this capability: several computer
143
144
runs were performed for a 10-year analysis period using several budget
levels, i.e., 5, 10, 15, 20, and 30 million dollars per year. An additional
computer run was carried out without considering budget restrictions. The
output of the runs was plotted to observe the effect of the various yearly
budgets on the distress condition of the pavement network. The same results
were used to perform an economic analysis of the various budget levels
considered.
A different approach was followed to ascertain the additional cost
incurred when the overlay date is postponed. Several runs were carried out,
first using only the pavement sections which required overlay the first year,
assuming a zero budget for the first year, and then those which required
overlay for the first and second years, and so on. From the output, the
percent increase in cost of postponing an overlay is obtained for severe and
slightly distressed sections and for the network as an average. The numbers
used in the analysis are not definitive since the cost of overlay used was
approximate. An accurate figure should include costs such as the cost of
handling traffic, materials, equipment, labor, etc.
ANALYSIS OF THE RESULTS
Effect of Yearly Budget
Tables 7.1 and 7.2 present in summary form the results from the computer
runs performed using several budget levels. Table 7.1 presents summary
information for each budget level considered: the second column contains the
total number of miles repaired for the desig~ period considered; the third
column contains the total budget used in the design period in millions of
TABLE 7.1. SUMMARY INFORMATION FOR SEVERAL DIFFERENT BUDGET LEVELS FROM THE COMPUTER PROGRAM PRP01 USING TEXAS CRCP INFORMATION
Budget Level Length Budget Used Avg. Overlay
145
(millions/year Repaired (millions Cost Per Mile Avg. Distress of d11s) of dlls) (miles) (103 dlls/roi) Index
Variable 532.2 119.957 225.40 0.628
5 70.8 35.052 495.09 -0.670
10 261.0 91. 934 352.24 -0.128
15 506.3 137.974 272.51 0.154
20 756.5 169.515 224.08 0.415
30 756.5 157.850 208.66 0.648
*10-year analysis period
146
TABLE 7.2. SUMMARY TABLE OF AVERAGE DISTRESS INDEX PREDICTIONS FOR VARIOUS BUDGET LEVELS FROM PROGRAM PRP01 USING TEXAS CRCP INFORMATION
Budget Level
Year v* 5 10 15 20 30
1 -0.09 -0.09 -0.09 -0.09 -0.09 -0.09
2 O. 74 -0.20 -0.16 -0.07 0.03 0.14
3 0.74 -0.32 -0.14 -0.01 0.13 0.32
4 0.73 -0.41 -0.13 0.04 0.20 0.53
5 0.71 -0.55 -0.11 0.08 0.35 0.70
6 0.69 -0.69 -0.12 0.15 0.45 0.91
7 0.68 -0.85 -0.14 0.23 0.55 1. 00
8 0.67 -1. 03 -0.15 0.33 0.70 1.00
9 0.69 -1. 22 -0.13 0.40 0.83 1.00
10 0.72 -1.33 -0.09 0.50 1. 00 1. 00
* V = Variable Budget
147
dollars; the fourth column contains the average overlay cost per mile for
each budget level, without considering the time value of money. The average
overlay cost per mile was obtained by dividing the total budget by the number
of miles repaired. Column five presents the average distress index for each
budget level. The poor condition of the network for the low budget levels,
exemplified by negative average distress index values, is obvious, as is the
improved condition for higher budgets.
Table 7.2 presents summary information on the average distress index
predicted each year within the design period for the network and for the
various budget levels. Figure 7.1 presents the same information in graphical
form. In this figure it is readily apparent that the rate of deterioration,
i.e., the slope of any of the lines in the figure that occur when a low
budget is used, i.e., 5 million dollars per year, can be diminished or even
reversed if higher budgets are adopted. Also, it can be noticed that there
is a yearly budget, i.e., 10 million dollars, for which the condition of the
network is maintained at a constant level. This budget level may not be
recommendable because of the low initial distress condition of the network,
i.e., the average distress index in year one. The use of a variable budget
involves investing an extensive amount of money the first year, about 84
million dollars for the problem in question, to bring up the condition of the
network, and a yearly budget of about 4 million dollars (lower than the 10
million per year required if the network is not restored to a better
condition) for the rest of the design period.
In order to help the reader visualize the meaning of the distress index,
Fig 7.2 was produced. A 0.2-mile section with several different stages of
distress is depicted in the figure. Notice the different stages of
deterioration corresponding to various magnitudes of the distress index.
)( CI.)
"'0 c: fJ) fJ) CI.) '--fJ) .-c
1.0
Variable
0.5
0.0 I Jk' ... --- 10
-0.5
o 2 4 6 8 10 Years
Fig 7.1. Average distress index for the network through time for various yearly budgets using Texas CRCP information.
.......
.c::oo
I 01=1.0
I I
r
01 =0.5 I I
I I
DI =0.0 I
01 =-0.5 I
01=-1.0
o Failures o Spoiling
~ I Failure 12% Spoiling
2 Failures 230/0 Spoiling
3 Failures 35 % Spoiling
4 Failures
I
I
I l
I
I I
I
I I
I ~ I
\f
L 47% Spoiling J ~-----------0.2 mi------------~~~
149
Key:
I Crack
~ Spoiled ~ Crack
~ Failure
Pavement Edge
Note: Not All Cracks Shown
~ig 7.2. Sample distress condition of a 0.2 mile CRC pavement section with different values of the distress index.
150
Then, if a low budget is used, the deterioration of the pavement follows
stages similar to the ones presented in Fig 7.2.
Effect of the Time Value of Money
Table 7.3 is a summary of the computations performed as part of an
economic analysis to ascertain the effect of the time value of money in
choosing a budgeting policy; a 10 year analysis period was used. This table
contains the average cost per mile of overlay to the agency for various
budget levels and interest rates. Caution is recommended when the results of
this analysis are used since user costs are not considered. The results
presented in Table 7.3 are plotted in Fig 7.3.
From the plot, it can be observed that a minimum average cost per mile
exists for the problem under analysis. This outcome is not surprising if one
considers that as the budget increases above the minimum, the number of
sections repaired in the short range increases. On the other hand, budget
levels below the minimum tend to exclude sections requiring overlay. An
important observation to be made is that the yearly budget which produces the
minimum cost per mile of overlay is not necessarily the budget producing the
"ideal" average distress index (Table 7.1).
Cost of Postponing an Overlay
Table 7.4 presents the results of the analysis carried out to
investigate the additional cost incurred when postponing the recommended date
of overlay. The time lags considered were from one to five years. Table 7.4
indicates the increased cost per mile of overlay for three different cases:
first, for the network as an average, i.e., when all the sections which
TABLE 7.3. AVERAGE COST PER MILE OF OVERLAY FOR VARIOUS BUDGET LEVELS AND INTEREST RATES USING TEXAS CRCP INFORMATION
Budget Interest Rate (Percent) Level
(106 d11s/year) 0 5 10
Variable 225.40 211.13 201.26
5 495.09 405.90 342.88
10 352.24 284.90 237.23
15 272.51 219.79 182.56
20 224.08 185.94 157.94
30 208.66 187.75 170.69
151
500 CI)
-E (/)
~ 400 0 c
",
0
- 300 (/)
0 u ~
C
L.. CI) 200 > 0 CI)
C' C L.. CI)
> « o 5 10 15 20 25 30
Yearly Budget, millions of Dollars
Fig 7 3. Average overlay cost per mile versus different yearly budgets for various interest rates using Texas CRCP information.
t-' V1 N
Year of Overlay
1
2
3
4
5
TABLE 7.4. ADDITIONAL COST INCURRED WHEN POSTPONING THE OVERLAY OF A PAVEMENT SECTION DEVELOPED FROM TEXAS CRCP INFORMATION
Severely Slightly Network Average Deteriorated Section Deteriorated Section
Cost Cost Cost Per Mile Percent Per Mile Percent Per Mile Percent
should have been overlaid in year one were postponed a certain time lag and
the average cost incurred was calculated; second, for a severE!ly deteriorated
section with a high rate of deterioration; and, finally, on the other side of
the spectrum, for a slightly deteriorated section with a low rate of
deterioration.
The results indicate that, on the average, a 1 percent increase in cost
per year may be expected if the recommended date of rehabilitation is
postponed. This cost increment varies, for the information used in the
analysis, from one to 14 percent per year, depending on the specific
conditions of the pavement section under consideration.
DISCUSSION OF RESULTS
Availability of funds and managerial preferences play an important role
in the budget selection procedure; however, program PRP01, or similar
computer programs, can be used as an aid in the selection of a budget policy.
The use of the program for the purposes of this report has indicated that its
results are supported by a-priori considerations.
From the analysis conducted in this chapter the following conclusions
are drawn. Although they may seem obvious, the program corroborates and
provides means for estimating them.
(1) A minimum budget is required to pavement network. This minimum original condition of the network.
maintain the is variable
condition depending
of a on the
(2) If the network is allowed to deteriorate, the amount of money required to upgrade its condition to a certain level will increase with time. That is, more money will be needed to upgrade the network as time goes by.
155
(3) In addition to availability of funds and personal preferences, an economic analysis is an important factor in the selection of a budget. However, since user costs are not included in the analysis, in the computer program presented, detailed consideration should be paid to
(a) the initial distress condition of the network and
(b) the predicted distress history of the network.
SUMMARY
This chapter is devoted to demonstrating the capabilities of the
rehabilitation prioritization and scheduling program presented in Chapter 6.
The program can be used
(1) to generate a list of cand idate pavements for rehabil itation wi thin a design period and
(2) as a tool in the analysis of alternatives to select budget policies.
The use of the program in the selection of budget policies is explained
and demonstrated in the course of the chapter. Conclusions are derived on
the impact of different budget levels, the time value of money, and the
postponing of the overlay date in the selection of a budget policy.
This chapter presents the principal conclusions and recommendations
derived in this study. The first section of the chapter is dedicated to
summarizing the work accomplished and to presenting the status of this effort
in the context of an M & R management system. The principle conclusions and
recommendations, already presented throughout the report, are grouped and
organized in the second section of the chapter. This section has been
further subdivided into conclusions and recommendations related to (a) the
scheme in general and (b) the models therein.
SUMMARY OF WORK ACCOMPLISHED
The main contribution of this report is a working scheme to prioritize
and schedule M & R in a rigid pavement network. In addition to the
procedure, other major contributions have been made, such as developing a
failure criteria, and stressing the use of distress quantities in PMS. The
scheme makes use of a distress index as a decision criterion to determine
when a pavement has reached its terminal condition. The distress index is
calculated by combining into a single number the various distress
manifestations occurring in a pavement section. The initial pavement
157
158
condition is determined from field distress condition surveys, and the future
condition is determined by means of prediction models.
The material presented in this report is part of an effort to develop an
M & R management system. Figure 8.1 presents, the pavement maintenance and
rehabilitation management system currently under development in CTR Research
Project 249. The flowchart indicates the activities carried out in the PMS
at the network and project levels. The cycle starts by collecting field
information to assess the current condition of the network. The information
collected is the input data for Program PRP01, which helps management select
rehabilitation candidates for the next years. Once the sel·ection has been
made, the activities are carried out at the project level. Sleveral Project
249 reports dealing with project level activities have been pu:blished.
CONCLUSIONS AND RECOMMENDATIONS
The principal conclusions and recommendations derived In this study
concerning the rehabilitation prioritization and scheduling seheme for rigid
pavements at the network level are summarized here:
(1) When the computer program was used to analyze the :impact on the future distress history of a pavement network of several different budgeting policies, it was concluded that the program is a very useful tool for selecting an adequate budgeting policy. From the analysis conducted, the following additional conclusions were drawn:
(a) A minimum budget is required to maintain the condition of a pavement network. This minimum is variable, depending on the original condition of the network.
(b) If the network is allowed to deteriorate, i.e., is not maintained, the amount of money required to upgrade its condition to a certain level will increase with time.
CONDITION SURVEY ___ ------II~ OF PAVEMENT
I STRATIFICATION
OF DATA
*Report Number
SECTIONS
249-5* Ir
PGM. PRP01
SELECTION OF CANDIDATES FOR REHABILITATION
249-3* DEFLECTIONS AND DETAILED SURVEY
ALTERNATIV MAINTENANCE
STRATEGY
249-1* If
MATERIALS J CHARACTERIZATION
249-2* PGM. RPRDS-1
SELECTION OF OPTIMAL
REHABILITATION STRATEGY
FOR E/PROJECT
IMPLEMENT M & R STRATEGY
NETWORK
PROJECT
Fig 8.1. Flowchart of pavement M & R management system as developed in CTR project 249.
159
160
(c) In addition to availability of funds and personal preferences, an economic analysis is an important factor in the selection of a budget. However, since user costs are not included in the analysis, detailed consideration should be paid to the initial distress condition and the predicted distress history of the network.
(2) It is recommended that the program be implemented, using current information, in order to obtain an updated rehabilitation schedule and budget. That is, performing another condition survey is recommended, for estimating future maintenance requirements.
(3) The program estimates, in predictions, need to be scheme. As with any PMS, achieve improved management
terms of verified to continuous of funds.
both dollars and distress corroborate and improve the upgrading is required to
In relation to the models within the rehabilitation prioritization and
scheduling scheme, the following conc1us ions and recommendat ions have been
derived:
(1) From experience in Texas with rigid pavements, it appears that distress is a better indic.ator of the conditic.n of a pavement sec tion than rid ing qual ity. Therefore, it is recommended that distress be used as the decision criterion in the prioritization and scheduling scheme.
(2) The distress index used to prioritize and schedule pavement sections for rehabilitation should include other variables such as traffic and environmental conditions. Future efforts should be aimed towards including these variables in order to improve the decision criterion.
(3) The following conclusions were obtained from the study of several approximate methods aimed at developing a distress index, i.e., subjective parameters, regression analysis, factor analysis, and discriminant analysis.
(a) The equations with subjective parameters rE!ly heavily on engineering judgement and experience and, therefore, are useful when sufficient information is not available.
( b) Fac tor analysis is difficult to interpret and there is no support to the assumption used in this approach that the resu1 ting equations measure structural performance or deterioration of a pavement section.
(c) Regression and discriminant ancllyses are viable techniques for developing distress and decision criteria indices. Because of the configuration of the information available, the latter was selected in this report to derive a distress index.
161
(4) An alternative procedure has been sketched for developing distress indices for the prioritization and scheduling procedures at the network level. This alternative procedure involves the use of cost equations which are functions of the distress condition of a pavement. At the present time, this type of equations is not available. Therefore, reseach should be conducted to estimate user cost equations as a function of the distress of the pavement.
(5) If the rehabilitation scheduling procedure is to include flexible pavements, similar distress indices need to be developed so as to have a common "yard stick" for evaluating both types of pavements, i.e., rigid and flexible.
(6) Field data were used to obtain models for rigid pavements; for jointed pavement, the from the literature. When applying these points should be kept in mind:
CRCP and AC overlaid models have been adopted
models, the following
(a) All the equations presented consider past condition as an independent variable. This factor helps to "characterize" the pavement sections, i.e., it accounts for material properties, environmental conditions, and construction variables as well as previous age and traffic conditions. However, any change in these variables from previous conditions can not be accounted for; also, new pavements can not be handled by these equations.
(b) In the case of parent pavements, the highly deteriorated pavements are usually overlaid; therefore, the prediction equations are biased because only "good" pavements were used in their development.
(c) The equations presented are bound by their inference space.
(d) The information used for the development of the equations came not from an experimental design but from data collected primarily for evaluating pavement conditions.
(7) The distress prediction equations need to account for the effect of preventive maintenance. Therefore, it is recommended that the monitoring of experimenta~ sections to assess the impact of different maintenance techniques on the rate of deterioration of a pavement section be continued.
(8 ) Future improvements of distress prediction contemplate experimental design techniques. the literature (Ref 38) for that purpose.
equations should Guidelines exist in
(9) Accurate traffic information is of vital importance in the prioritization and scheduling procedure. Current practice followed by the Texas SDHPT involves estimating traffic from data collected using a few in-motion weighing scales. A more extensive weighing system should be procured to obtain accurate information, as recommended in Ref 52.
162
(10) In order to have homogenous sections for the development of improved distress prediction equations or to be able to sample within projects, it is recommended that the existing sections be broken into smaller sections using the Dynaflect to characterize the subgrade and the pavement structure.
REFERENCES
1. Phi 11 ips, B. A., "Do lIar Needs to Reserve and Restore U. S. Roads, II General Motors Research Labs, Warren, Michigan, December 1980.
2. Federal Highway Administration, Highway Statistics, U. S. Government Printing Office, Washington, D. C., 1980.
3. Haas, R. C. , and W. R. Hudson, Pavement Mana~ement Sxstems, McGraw Hill Book Co. , 1978.
4. Road and Transportation Association of Canada, Pavement Mana~ement
Guide, Ottawa, Canada, 1977 .
5. IIpavement Management System Development," NCHRP Transportation Research Board, November 1979.
Report 215,
6. Pedigo, R. D., and W. R. Hudson, IISimplified Pavement Management at the Network Level," Report Nt). NA-3/l, ARE, Inc., 1981.
7. "Standard Nomenclature and Deficiencies," Special Washington, D. C., 1970.
Definitions for Pavement Report 13, Highway
Components and Research Board,
8. McCullough, B. F., "Distress Mechanisms - General," Special Report 126, Highway Research Board, Washington, D. C., 1971, pp 77-85.
9. Smith, R. E., M. 1. Darter, and S. M. Herrin, "Highway Pavement Distress Identification Manual for Highway Condition and Quality of Highway Construction Survey," DOT-FH-1l-9175/NCHRP 1-19; Federal Highway Administration, University of Il1inios, Urbana, Illinois, 1979.
10. McCullough, B. F., and P. Strauss, IIA Performance Survey of CRCP ~n
Texas," Research Report 21-1F, Center for Highway Research, The University of Texas at Austin, 1974.
11. Guiterrez de V., Manuel, and B. F. McCullough, "Summary Report for 1978 CRCP Condition Survey in Texas," Research Report 177-20, Center for Highway Research, The University of Texas at Austin, 1979.
163
164
12. Weaver, P . .1., and .1. M. Newman, "The Dream versus the Reality of a PMS," RHWA-TS-79-206 PM Workshop, Tumwater, Washington, 1978, pp 267-293.
13. Nelson, T. L., D. B. House, H. E. Sandahl and R. V. LeClerc, "Washington Pavement Management System," Washington Dot, Tumwater, Washington, 1977 .
14. Karan, M. A., and R. C. G. Haas, "Urban Pavement Management on a Coordinated Network: Project Basis," Proceedings, 4th International Conference on Structural Design of Asphalt Pavements, University of Michigan, Ann Arbor, Michigan, 1977.
15. Ahmed, N. V., D. Y. Lu, R. L. Lytton, J. P. Mahoney, and D. T. Phillips, "The Texas Rehabilitation and Maintenance District Optimization System," Research Report 207-3, Texas Transportation Institute, November 1978.
16. Phillips, D. T., R. L. Lytton, and C. V. Shanmugham, "Rehabilitation and Maintenance System: The Optimization Models," Research Report 239-1, Texas Transportation Institute, January 1981.
17.
18.
Phillips, D. T., "Rehabi 1 it at ion - Program II Transportation
C. V Shanmughan, F. Ghasemi-Tari, and R. L. Lytton, and Maintenance System:State Optimal Fund Allocation
(RAMS-SOFA-2)," Research Report 239-2, Texas Institute, January 1981.
Phillips, D. T., C. V. Shanmughan, S. Sathaye, and R. L. Lytton, "Rehabilitation and Maintenance System: District Time Optimization (RAMS-DTO-l)," Research Report 239-3, Texas Transportation Institute, September 1980.
19. Kher, R. K., W. R. Hudson, and B. F. McCullough, "A Systems Analysis of Rigid Pavement Design," Research Report 123-5, Texas Highway Department, Texas Transportation Institute, and the Center for Highway Research, January 1971.
20. Carmichael, R. Implementation 123-26, Texas and the Center
F. , and B. F. McCullough, "Modi Hcat ion and of the Rigid Pavement Design System," Research Report Highway Department, Texas Transportation Institute, for Highway Research, January 1975.
21. Seeds, S. B., W. R. Hudson, and B. F. McCullough, "A Design System for Rigid Pavement Rehabilitation," Research Report 249-2, Center for Transportation Research, The University of Texas at Austin, 1980.
22. Shahin, M. Y., "Components of a Pavement Transportation Research Record 781, Washington, D. C., 1981, pp 31-39.
Maintenance Management System," Transportation Research Board,
23. "The AASHO Road Test: Report 5 - Pavement Research," Special Report 6lE, Highway Research Board, Nat ional Academy of Sc ience s, Washington, D. C., 1962.
24.
25.
26.
Van Til, C. J. , B. F. McCullough, B. A. Vallerga, and R. "Evaluation of AASHO Interim Guides for Design of Structures " NCHRP 128, Highway Research Board, 1972. ,
"AASHO Interim Guide for Design of Pavement Structures, " Washington, D. C. , 1972.
Treybig, H. J., B. F. McCullough, P. Smith, and H. Von Quintus, Design and Reflection Cracking Analysis for Pavements - Vol. 1," Research Report No. FHWA-RD-77-66, Washington, D. C., August 1977.
165
G. Hicks, Pavement
AASHO,
"Overlay Rigid FHWA,
27. Schnitter, 0., W. R. Hudson, and B. F. McCullough, "A Rigid Pavement Overlay Design Procedure for Texas State Department of Highways and Public Transportation," Research Report 177-13, Center for Highway Research, University of Texas at Austin, May 1978.
28. Mahoney, J. P., "Heasur ing Pavement Performance by Using Sampling Techniques," Transportation Research Transportation Research Board, National Academy of Washington, D. C., 1979, p 45-51.
Statistical Record 715,
Sciences,
29. Taute, A., and C. Noble, "Optimum Condition Survey Sampling Procedures," Technical Memorandum 249-8, Center for Transportation Research, The University of Texas at Austin, June 1979.
30. Collection and Use of Pavement Condition Data," NCHRP: Synthesis of Highway Practice 76, Transportation Research Board, 1981.
31. Cochran, W. G., Sampling Techniques, T. E. Wiley and Sons, New York, 1963.
33. Queiroz, C. A., "Performance Prediction Models for Pavements in Brazil," Ph.D. Dissertation, The University of Texas at Austin, May 1981.
34. Carey, W. N., and P. E. Irick, "The Pavement Serviceability Performance Concept," Highway Research Bulletin 250, Transportation Research Board, Washington, D. C., 1960, p 40-57.
35. Gulden, W., "Pavement Faulting Study - Extent and Severity of Pavement Faul ting in Georgia," Research Projec t 7104, Georgia Department of Transportation, 1972.
36. Darter, M. 1., M. B. Snyder, and R. E. Smith, "Nationwide Evaluation of Concrete Pavements - Illinois Demonstration," Proceedings, Second Internaional Conference on Concrete Pavement Design, Purdue University, Purdue, Indiana, April 1981, p 399-408.
37. Machado, J. P., B. F. McCullough, and W. R. Hudson, "CRCP: Prediction of Distress Quantities," Research Report 177-8, Center for Highway Research, The University of Texas at Austin, 1977 (unpublished).
166
38. Pedigo, R. D., W. R. Hudson, and F. L. Roberts, "Pavement Performance Modeling for Pavement Management," Transportation Research Record 814, Transportation Research Board, National Academy of Sciences, Washington, D. C., 1981, p 14-21.
39. Taute, A., B. F. McCullough, and W. R. Hudson, "Improvements to the Materials Characterization and Fatigue Life Prediction Methods of the Texas Rigid Pavement Overlay Design Procedure," Research Report 249-1, Center for Transportation Research, The University of Texas at Austin, 1981.
40. Yoder, E. J., and M. W. Witczak, Principles of Pavement Desig~ (2nd Edition), John Wiley and Sons, New York, 1975.
41. Noble, C., F. Robinson, and B. Eagleson, "Replication Study to Evaluate Precision of 1978 CRCP Condition Survey," Technical Memorandum 177-69, Center for Transportation Research, The University of Texas at Austin, August 1979.
42. Taute, A., and B. F. McCullough, "Manual for Condition Survey of CRCP," Research Report 177-19, Center for Transportation Research, The University of Texas at Austin, 1979.
43. Strauss, P., J. Long, and B. F. McCullough, "Development of Photographic Techniques for Condition Surveys," Research Report 177-10, Center for Highway Research, The University of Tex,'is at Austin, 1977 •
44. Richards, M., "Data Base Index for Rigid Pav~ments," Technical Memorandum 249-37, Center for Transportation Research, The University of Texas at Austin, October 1981.
45. Yoder, E. J., D. G. Shurig, and A. Faiz, "A Comprehensive Pavement Evaluation System Applied to CRCP," Transportation Research Record 602, Transportation Research Board, National Academy of Sciences, Washington, D. C., 1976, p 109-116.
46. Haas, R. C. G., "Developing a Pavement Feedback Data Sys"tem," Research Report 123-4, Center for Highway Research, Texas Highway Department and Texas Transportation Institute, 1971.
47. Hudson, W. R., and B. F. McCullough, "Flexible Pavement Design and Management Systems Formulation," NCHRP Report 139, Highway Research Board, Washington, D. C., 1973.
48. Lytton, R. L., W. M. Moore, and J. P. Mahoney, "Pavement Evaluation," FHWA-RD-75-78, FHWA Final Report, Phase 1, March 1975.
49. Fernando, E., "Review and Evaluation of A1 ternative Approaches to Formulate a Rating Index for Establishing Candidate Projects for Rehabilitation Work," Technical Memorandum 307-11+, Center for Transportation Research, The University of Texas at Austin, February 1982.
167
50. Finn, F. N., R. Kulkarni, and J. McMorran, "Development of Framework for Pavement Management System for Arizona," Final Report, Woodward-Clyde Consultants, San Francisco, California, August 1976.
51. "Maintenance Management System, Pavement Evaluation System, Detailed Design Document," Texas State Department of Highways and Public Transportaton, August 1979.
52. Lin, Han-Jei, C. E. Lee, and R. B. Machemehl, Acquisition Program," Research Report Transportation Research, The University February 1980.
"Texas 245-1F,
of Texas
Traffic Data Center for
at Austin,
53. McCullough, B. F., "A Pavement Overlay Design System Considering Wheel-loads, Temperature Changes, and Perfonnance," ITTE Graduate Report, University of California, Berkeley, California, July 1969.
54. Crumley, T. A., and T. W. Kennedy, "Fatigue and Repeated-Load Elastic Characteristics of Inservice PC Concrete," Research Report 183-9, Center for Highway Research, The University of Texas at Austin, June 1977.
55. Shahin, M. Y., M. 1. Darter, and S. D. Kohn, "Evaluation of Airfield Pavement Condition and Detennination of Rehabilitation Needs," Transportation Research Record 700, Transportation Research Board, National Academy of Sciences, Washington, D. C., 1979, p 1-10.
56. Oehler, L. T., and L. F. Holbrook, "Perfonnance Concrete Pavements," Research Report 711, State Highways, June 1970:------------
of Michigan's Postwar Michigan Department of
57. Thorndike, R. M., Correlational Procedures for Research, Gardner Press, Inc., New York, 1978.
58. Tatsuoka, M. M., Multivariate Analysis: Techniq~es for Education
59.
and Psychological Research, John Wiley and Sons, New York, 1971.
Nie, N. H., C. H. Hull, J. G. Jenkins, K. Steinbrenner, and Statistical Package for the Social Sciences (SPSS), Book Co., (2nd Ed.), New Y;rk, 1970.
D. H. Bent, McGraw-Hill
60. Draper, N. R., and H. Smith, Applied Regression Analysis, John Wiley and Sons, New York, 1966.
61. Daniel, C., and F. S. Wood, Fitting Equations to Data, Wiley-Interscience, 1971.
62. Hutchinson, B. G., "Principles of Subjective Rating Scale Construction," Highway Research Record 46, Highway Research Board, 1963, p 60-70.
63. Weaver, R. J., "Quantifying Pavement Serviceability As It Is Judged By Highway Users," Transportation Research Record 715, Transportation Research Board, National Academy of Sciences, Washington, D. C., 1979, p 37-44.
168
64. Zaniewski, J., "Condition Survey Information in PPMIS," ARE Memorandum ID-2/3, January 1981.
65. Gutierrez de V., M. and B. F. McCullough, "Comments on a Memo by Zaniewski," Technical Memorandum 249-34, Center for Transportation Research, The University of Texas at Austin, June 19E1.
66. Maj idzadeh, K., G. J. Ilves, and R. McComb, "Mechanistic Design of Rigid Pavements," Proceedings, Second International Conference on Concrete Pavement Design, Purdue University, April 1981, p 87-96.
67. Rauhut, J. B., F. L. Roberts, and T. W. Kennedy, "Response and Distress Models for Pavement Studies," Transportation Research Record 715, Transportation Research Board, National Academy of Sciences, Washington, D. C., 1979, p 7-14.
68. Hudson, W. R., F. N. Finn, R. D. Pedigo, and F. L. Roberts, "Relating
69.
70.
Pavement Distress to Serviceability and Performance," FHWA/RD-80/098, February 1981.
Smith, W. S. and C. L. Monismith, "Maintenance Management Asphalt Pavements," Transportation Research Transportation Research Board, National Academy Jf Washington, D. C., 1976, p 17-25.
Hiller, F. S., and G. J. Lieberman, Operations Research, (2nd Holden-Day, Inc., San Francisco, California, 1974.
System for Record 598,
Sciences,
Edition) ,
71. Darter, M. I., "Requirements for Reliable Predictive Models," a paper presented at the Annual Meeting of the Transportation Research Board, Washington, D. C., January 1980.
72. "Summaries of the 1980 Condition Surveys," unpublished reports of the Center for Transportation Research, The University of Texas at Austin, 1981.
73. Faiz, A., and E. J. Yoder, "Factors Influencing the PE~rformance of CRCP," Transportat ion Reseach Record 485, Transportat ion Research Board, National Academy of Sciences, Washington, D. C., 1974, p 1-13.
74. McCullough, B. F., and H. J. Treybig, "A Statewide DeflecUon Study of CRCP in Texas," Highway Research Record 239, Highway Research Board, 1968, p 150-174.
75. Potter, D., "Prediction of Performance and Distress in CRC!'," Technical Memorandum 177-72, Center for Transportation Research, The University of Texas at Austin, September 1979.
76. Noble, C. S., and B. F. McCullough, "Distress Prediction Models for CRCP," Research Report 177-21, Center for Transportation Research, The University of Texas at Austin, Derember 1979.
169
77. Strauss, P. J., B. F. McCullough, and W. R. Hudson, "CRCP: Structural Performance and Design/Construction Variables," Research Report 177-7, Center for Highway Research, The University of Texas at Austin, May 1977.
78.
79.
80.
Portland Cement Association, "Thickness Design for Concrete Skokie, Illinois, 1966.
Witczak, M. W., "Pavement Performance Models," U. S. Army Waterways Experimental Station, S-76-15, Vol 1, 1976.
Tyner, H. L., W. Gulden, and D. Brown, "Resurfacing Jointed-Concrete Pavements," Transportation Research Transportation Research Board, National Academy of Washington, D. C., 1981, P 41-45.
Pavements, "
Engineers
of Plain Record 814,
Sciences,
81. Jackson, T., and B. F. McCullough, "Analysis of Performance of AC Pavement Overlays for Maintenance Purposes," Technical Memorandum 177-77, Center for Transportation Research, The University of Texas at Austin, January 1980.
82. Daniel, J. 1., B. F. McCullough, and W. R. Hudson, "A Methodology to Determine an Optimum Time to Overlay," Research Report 177-14, Center for Transportation Research, The University of Texas at Austin, August 1979 (unpublished).
83. Kher, R. K., W. A. Phang, and R. C. G. Haas, "Economic Analysis of Elements in Pavement Design," Jransportation Research Record 572, Transportation Research Board, National Academy of Sciences, Washington, D. C., 1976, P 1-14.
84. Winfrey, R., Economic Analysis for Highways, International Textbook Co., Scranton, Pennsylvania, 1969.
85. Claffey, P. J., "Running Costs of Motor Vehicles as Affected by Road Design and Traffic," NCHRP 111, Transportation Research Board, Washington, D. C., 1971.
86. McFarland, W. F., "Benefit Analysis for Pavement Design Systems," Research Report 123-13, joint publication of the Texas Highway Department, Center for Transportation Research, and Texas Transportation Institute, April 1972.
87. Zaniewski et a1, "Vehicle Operating Costs, Fuel Consumption, and Pavement Type and Condition Factors," Report FHWA-RD-80, Texas Research and Development Foundation, August 1981.
88. Potter, D. W. and W. R. Hudson, "Optimization of Highway Maintenance Using the Highway Design Model," a paper presented at the 59th Annual Transportation Research Board Meeting, Washington, D. C., January 1980.
89. Kulkarni, R., K. Go1abi, F. Finn, and E. A1viti, "Development of a Network Optimization System," Woodward-Clyde Consultants, May 1980.
170
90. Yoder, E. J., A. Faiz, and D. G. Shurig, "A Comprehensive Evaluation System: Application to CRCP," JHRP-76-2, University, Indiana State Highway Commission, 1976.
Pavement Purdue
APPENDIX A
CONDITION SURVEYS: EVOLUTION OF PROCEDURES AND FORMS
drains, concrete shoulder addition, fabrics), etc. The CTR is currently
monitoring several of these projects.
CONDITION SURVEYS FOR CONTINUOUSLY REINFORCED CONCRETE PAVEMEWrS
Condition surveys for CRC pavements have been carried out in rural and
urban districts; the condition survey procedure in urban zonl~S is different
from the one used in rural zones due to the different traff:Lc conditions.
The rural districts were surveyed in 1974, 1978, and 1980; the urban
districts were surveyed in 1976 and 1981.
were followed in measuring the
In some cases, diffl~rent criteria
same distress manifestation; the
transformations used to put the information into common units will be
mentioned.
CRCP Condition Survey Procedure
Rural Districts (Ref 6 and 9). In 1974, the road was surveyed by two
persons in one vehicle, travelling on the shoulder at approximately five
miles per hour. Only the outside lane was surveyed. The driver, while
noting the condition of the shoulder to comment on it later, had to assess
175
the section length that was subjected to pumping, count the punchouts, and
determine the size of the repair patches.
The passenger, who sat behind the driver to get a better view of the
road, quantified transverse and localized cracking and made a note of the
spalling encountered.
The road was surveyed in sections of 0.2-mile, and the driver informed
the passenger of his findings at the end of every section. This, with his
own assessment, was entered in one column of the survey sheet.
only one survey sheet was used between the two raters.
Therefore,
At the end of every three miles, when a sheet of the survey form had
been completed, the condition of the shoulder was discussed and commented on.
Other obvious distress phenomena or interesting facts about the road were
also noted under general comments.
In the 1978 condition survey, the driver noted the punchouts and pumping
along the roadway while the passenger noted the minor and severely spalled
cracks and patches. A 300-foot portion of each project, roughly in the
middle of the section, was selected for measuring crack spacing.
In 1980, in order to expedite the condition survey procedure, only the
structural failures, i.e., punchouts and patches, were counted in detail.
Minor and severe spalling were counted the first mile of a project; if no
difference was detected from the 1978 condition survey, then spalling was not
considered for the rest of the surveys; if it was found to be different, then
it was counted for the rest of the project. Pumping was not measured or
estimated but its occurrence was noted as a yes-no condition.
Urban Districts (Ref 5). Before the 1976 condition survey, a study was
conducted to develop a technique for surveying heavily trafficked highways.
176
Because of the need to be able to conduct a survey at a speed of at least 30
miles per hour (48 km/h) , the possibility of utilizing photographic
techniques was investigated; accuracy, speed, and reasonable cost are
important criteria for a successful condition survey on urban highways.
It was found that by mounting a camera with a shutter speed of up to
1/2000 second and capable of taking 4 to 5 frames per second on a boom
hanging in front of a vehicle so that the line through the camera lens is
perpendicular to the road surface, a birdseye view of the distress can be
obtained on film. By adjusting the vehicle speed and equipment, a survey of
the condition of a CRCP pavement is possible. The difference in quality
between a visual and a photographic survey is minimal.
In 1976, the condition survey was conducted using photographic
techniques. Sample lengths of about 300-feet per mile were used and it was
recognized that cracking, spalling, and pumping were accurately represented
by the sample, but punchouts and patches were not; therefore, it was
suggested that all these structural failures be counted. Although pictures
provide an excellent record of pavement condition, the analysis of the
photographs is a time consuming task.
In 1981, it was decided to return to the visual survey.
adopted was similar to the 1978 rural condition survey.
CRCP Distress Discriptions (Refs 4 and 6)
The procedure
Transverse Cracking. All CRCP show transverse cracking; the design
conc~pt of this type of pavement is to replace the joints by closely spaced
narrow cracks, and cracking per se is not a distress manifestation. Only
177
cracks that deviate from the regular crack pattern and at spacing closer than
about 2 feet can be considered as distress.
During 1974, the different lengths of road, within the section surveyed
that experienced crack spacing of less than 18 inches were added up and the
accumulated length of the road as a percentage of the section length, i.e.,
0.2-mi1e, was entered in the survey sheet. The intensity of cracking was
further divided into minor and severe: minor transverse cracks were defined
as cracks which were newly formed, narrow, or not easy to be seen; and severe
transverse cracks as big, well defined openings.
In 1978, it was decided to measure the crack spacing by taking 300-foot
samples around the middle of the job. The crack spacing is the distance in
feet between transverse cracks in the outer lane of the roadway.
In 1980, cracking was not measured. The percent transverse cracking
below 18 inches can be estimated from the 1978 condition survey using the
frequency or cumulative distribution of the crack spacing sample.
Measurements of crack spacing in experimental sections appears to indicate
that it does not change after the first year of the pavement.
developed from 1978 data, seems to corroborate this observation.
Figure A.1,
Localized Cracking. The formation of Y-cracks that link the transverse
cracks, which occurs when the closely space transverse cracks start to
deteriorate, is called localized cracking.
Localized cracking was measured only in 1974. The amount of localized
cracking was determined using the same method as described in transverse
cracking.
178
20
16
0'1 12 0 c: u 0 0 0 0-en 0
(ID 0 0
~ 0 0 0 8 u 0 c 8 0 0 0 '- 0 o OOg 0 0
<..)
8 00 8 '0 ~ 0 ' i@ e 00 0
4 §~ 00 0 8 8 :~ uO~8i~ ~o 0
e -, o§,' ~8
00 4 8 12 16
Age, years
Fig A.I. Plot of measured crack spacing versus age in the 1978 Texas CRCP condition survey.
20
179
Spalling. Spalling is defined as the widening of existing cracks by
secondary cracking or breaking of the crack edges. The depth of a spall is
generally less than one inch but it can be very wide. Minor and severely
spalled cracks are distinguished by the width of the spall. Minor spalling
is defined as a condition of edge cracking in which the loss of material has
resulted in a spall roughly one half inch in width. Severe spalling is
defined as a condition in which the spall is wider than one-half inch.
In 1974, an estimate of the percentage of cracks that showed minor and
severe spalling was recorded. The percentage was not exact since four
categories were provided for estimating the quantity.
In 1978, the actual number of cracks showing either type of spalling was
recorded; that is, they were keyed into a mechanical counter and every
0.2-mile were transferred to the surveying form. This counting procedure
happened to be very time consuming; therefore, in 1980, samples were taken to
see if there was no difference with 1978. When the sample was different from
that in the previous survey, all the spalled cracks in the section were
counted.
In order to compare the 1974 condition survey to the 1978 and 1980
results, the following equation can be applied:
PS NSPL * CSPC 1056.0
(A.l)
180
where
PS = percent spalling in a 0.2 mile section,
NSPL number of spa11ed cracks in a 0.2 mile section, and
CSPC = mean crack spacing for the project.
Pumping. Pumping is said to occur if water penetrates through cracks
and openings in the pavement and then, when a load, such as a heavy vehicle
passing over a crack, is applied, is pressed out again, taking fine material
of the sublayers with it.
Pumping may occur at construction joints that have opened up
longitudinal cracks or transverse cracks. However, for the purpose of these
surveys, only pumping at the edge of the pavement was recorded. The edge in
this case is the joint where the pavement and the shoulder meet.
Minor pumping occurs when water is pumped out leaving streaks of fines
on the surface of the shoulder or pavement. Severe pumping is indicated by a
severe loss of fines from the sublayers and it is also associated with
vertical movement of the pavement where pumping occurs.
The percentage of section length that is subjected to pumping is
recorded. The worst condition of pumping again defines the quality of
pumping at that section, although some minor pumping may also experienced
within the section. If a few distinct spots of pumping are found, say 300
feet apart, they are handled as separate sections subjected to pumping and
are assessed as minor or severe separately. The minor sections are added
separately from the severe sections and recorded.
The same measuring criterion was used in 1974 and 1978. In the 1980
survey, pumping was recorded as a yes-no occurrence; therefore, it can be
181
assessed only if pumping, minor or severe, appeared in a section from 1978 to
1980.
Punchouts. When closely spaced transverse cracks are linked by
longitudinal cracks to form a block, the block is called a punchout. This
must not be confused with longitudinal cracking, which is not recorded on the
sheet. A minor punchout is defined as a condition where, although a block
has formed, no sign of movement under the traffic is apparent. The cracks
surrounding the punchout are narrow and few signs of spalling are apparent.
A severe punchout is recorded when the block moves under traffic. The
surrounding cracks will be wide and signs of pumping around the edge of the
block may be apparent.
Punchouts were divided into four categories in the 1974 survey according
to their lengths, namely 1-3, 4-9, 10-19, and above 20 feet. In 1978 and
1980 minor and severe punchouts per 0.2-mile sections were recorded in two
categories: those shorter than 20 feet and those longer than 20 feet.
Repair Patches. The pavement needs to be repaired in the final stages
of distress. Repairs can be made with either portland cement concrete or
asphalt cement concrete. The condition of the repair patch is not
determined. Columns are provided to record whether the patch is made of
asphaltic or portland cement concrete.
It is important to note that repair work that is done over the full
depth of concrete thickness is classified as a repair patch. Patching of
spalling and overlaying part of the concrete pavement is not classified as
patch work. The former is defined as spalling and the latter is commented on
under General Comments.
182
To determine the amount of patching that was involved in 1974, a scale
was provided for in square feet of patch work. The scale is divided into
four categories, namely 1-15, 16-120, 121-240, and greater than 241 square
foot patches. The category under which every patch falls is determined, and
the number of patches for every category is counted and the figure entered on
the survey sheet.
In 1978 and 1980 only the number of repair patches observed was
recorded. In some cases, fewer patches were observed in 1978 than in 1980,
because several adjacent patches observed in 1978 were replaced in several
instances by a larger single patch.
CRCP Survey Forms
Slightly different condition survey forms have been used for the
different surveys. The modifications to the survey form are related to the
changes in the procedure or in the criteria to measure the distress
manifestations.
A copy of the survey form used in the 1974 rural survey is included as
Fig A. 2. At the top of the sheet, a few details are given to define the
position of the section. Space is provided for the control number, section
number, highway number, district number and county in which the sections are
located. The exact location of the section must be described to facilitate
reference to or a detailed survey of the section at a later stage.
road.
The names of both raters must be listed as well as the date of survey.
It is imperative to tie the sections to the mileposts alongside the
The trip recorder of the vehicle may be used to facilitate the
CRCP
PERFORMANCE SURVEY
Dhtrict Control Section Highway County Leave Blaok Dah' _yr.] Mn nav
I I I I I I 1 J - I -I Leave Blank Location From To Raters
I I I I . Mile lU1e Transverse Localized SpalUng PUlDping Punch Outs Repai r Patches Ride Post :Point Cracks 1. Craclul 't 1. 1. in feet Square feet
-~~-- --, M S .M. .-5_ M S 11. S A r.. .c..~ .. 0 .. .. .. c .. . :: <>:: 4 DC ... ::~ 00 0'" "0 .. C> .,. co ... <> N - ... -.... 0 ... _ 0'" _ 0"'_ ..... - - N i .. '" i I # ... r I ., ... , ..... I ..... I .... I ... "'II ...... , I "'''' i I i'1.!.! .. • I ... .,.
i ~~ .. 7 ~: N
. ..!L=.; I I'" I I ... , I! .... I I DO I 10 <> I I .... , I '" 1\ I , to 1\ ... " .. 1\
Fig A.4. Crack spacing survey form for CRC pavements used in Texas in 1978.
t-' CO (j\
187
CONDITION SURVEYS FOR PLAIN AND REINFORCED JOINTED CONCRETE PAVEMENT
This jointed pavement condition survey procedure has not been used to a
large extent in the field. It is based on concepts used in the development
of the CRCP condition survey procedure which has been used with success in
the statewide condition survey in Texas.
In order to make the survey procedure as comprehensive as possible, a
large number of different distress manifestations are observed. Reinforced
and unreinforced pavements may exhibit different distress types. A
transverse crack in an unreinforced pavement may cause more structural damage
than a transverse crack in a reinforced pavement.
Different joint types may also exhibit different distress
manifestations. For example, spa11s along a wrinkled tin jOint may be fairly
deep before significant load transfer is lost at the joint. In the case of a
dowelled joint, such a deep spall may result in further cracking and loss of
load transfer.
In order to make the survey as objective as possible, most of the
distress manifestations are counted and not estimated. In this manner no
subjective measurement of the severity and extent of a distress manifestation
will result.
avoided.
In the interests of speed, time consuming measurements are
Regular surveys of the distress manifestations should provide conclusive
results regarding the significance of each type of distress in the gradual
development of pavement failure.
188
Procedure for the Jointed Concrete Pavement Condition Survey
The procedure for the survey is as follows. The roadway is divided into
sections which correspond to the SDHPT control sections and job numbers. The
road is surveyed by two people who travel in a vehicle on the shoulder at
approximately 5 miles per hour. Depending on the condition of the roadway,
the driver and passenger may keep track of different distress manifestations.
The driver will typically note distress manifestations which (~an be seen from
a distance. This will enable the driver to concentrate on dr:lving as well as
surveying.
Distress Description for JCP and JRCP
Slab Associated Distress. These distress manifestations occur along the
length of the slab and not in the vicinity of a joint. The first three
distress manifestations relate only to jointed reinforced conerete pavement.
(a) Transverse Cracks. Transverse cracks occur at intervals along the slab. Transverse cracks in the vicinity of a joint, which may have resulted from some joint defect, do not fall into this category. Transverse cracks occur as a result of temperaturl~ drop stresses, drying shrinkage, and traffic loading.
(b) Spa11ed Transverse Cracks. Spa11ing is the widening of existing cracks by secondary cracking or breaking of the concrete at the edges. Spa11ing results from traffic loading and from stresses which occur because of material which enters the erack an resists thermal expansion. Both these situations result in high stresses in the upper edge of the concrete along the crack, and a spall results.
The number of spa11ed cracks in the outer lane is rl~corded. If the spall is less than an inch wide and deep and on1)1 a few of these spa11s occur along the length of a crack, the crack is not counted as spa11ed. For a crack to be counted as spa11ed, a significant amount of spa11ing must have occurred and a drop in the riding quality of the pavement must result. If the spall has been patched, the spalled crack should be counted, not the patch.
(c) Faulted Transverse Cracks. Faulted transverse cracks occur result of a loss in subgrade support and traffic loading. concrete in the immediate vicinity of the steel will break off the final result will be the difference in the level of the
189
as a The and
slab across the crack. This will result in a significant loss of riding quality.
The number of faulted transverse cracks in the outer lane of the roadway per 0.2-mile section is recorded.
(d) Crack Slabs. Typical unreinforced slabs are 15 feet long. A crack in this type of slab results in two smaller slabs, which may begin to move under load. The number of cracked slabs in both the inside and the outside lane are counted. Corner breaks are not counted as cracked slabs, but rather as joints with cracking. If the joint side of the corner break triangle is longer than half a lane width, then the corner break is counted as a cracked slab. Longitudinal cracks may also result in cracked slabs.
(e) Shattered Slabs. These slabs are counted similarly to the cracked slabs except that the slab should be broken into three distinct pieces in order to be counted as a shattered slab.
(f) Slab Patches. The number of repair patches in both lanes of the roadway is recorded. Portland cement concrete and asphalt concrete patches are recorded separately. Neither the condition nor the size of the patch is recorded.
(g) Edge Pumping. Water passes through cracks in the pavement and penetrates the sublayers. When a load, such as a heavy vehicle passes over the crack, the water is forced out of the crack, taking fine material of the sublayers with it. This is defined as pumping. From the survey vehicle, pumping is generally evident from an accompanying stain on the shoulder of the road.
The length of the edge crack causing this staining is estimated and divided by the length of the section (approximately 1000 feet) to arrive at a percentage. Because it is difficult to estimate the length of the edge crack which is pumping, this result will be slightly subjective.
Joint-Associated Distress. This distress should be directly related to
the joints in the pavement.
(a) Spalled Joints. Spalled joints occur in a manner similar to the occurrence of spalled cracks. The number of joints exhibiting spalls which are wider and deeper than one inch is recorded. The whole joint across both trafficked lanes should be examined for spalls.
190
(b) Faulted Joint. are recorded. faulting.
The number of faulted joints per O.2-mile section The joint should be examined across both lanes for
(c) Joints with Cracking. A large number of different crack types and patterns occur at joints. In order to simplify the recording of this distress form, all the crack types have been grouped under one heading. Figure A.3 shows a number of different crack patterns at a joint. The number of joints with cracking in every 0.2-mile section are recorded. The joint should be examined across both lanes widths for cracking.
(d) Patched Joints. When the cracking at a joint becomes severe, the joint is repaired with a patch. The number of patched joints per 0.2-mile section is recorded. The joint should be examined for patches in both trafficked lanes. Care must be taken to count a repaired spall in the spalled joint category rather than in this category.
(e) Bad Joint Sealant. Traffic and environment will cause a deterioration of the joint sealant in the pavement. Eventually some of the sealant will be stripped out of the joint and water may pass through the joint. The number of joints in which the sealant is significantly damaged is recorded. The joint should be examined across both lanes of the roadway.
(f) Pumping Joints. Once the joint sealant has failed, water may pass through the joint and pumping may occur. Telltale pumping stains will be removed by traffic in the dry season. Thus, if any accurate record of this distress manifestation is required, the condition survey should be carried out immediately after a period of rainfall. The number of joints exhibiting pumping in one O.2-mile section is recorded. The joint should be examined across both traffic lanes for pumping.
JCP and JRCP Survey Form
A copy of the survey form is shown in Fig A.s. The form provides space
to identify the county, district, highway, and direction, as well as the
control, section, and job number. The exact location of the section must be
fixed by relating the ends of the section to some detail which can be located
on a map of the area. The date of the survey and the name of the survey team
should also be entered on the sheet. The slab joint spacing is also entered
on the field sheet.
JOINTED CONCRETE PAVEMENT CONDITION SURVEY DIST. CONn!O~SECT JOB COUNTY AGE TEAM
I HIGHWAY DIR J.SPACING MO DAY YEAR I
i LOCATION FROM TO
COMMENTS SLAB ASSOCIATED DISTRESS JOINT ASSOCIATED DISTRESS MI LE MILE uOVERLAYS J TRANSVERSE CRACKS CRACKING BAD
POST BRIDGES AS PHAL T PCC EDGE SPALLED FAULTED AT ASPHALT PCC JOINT JOINT
COMMENTS LI MIT S OVERLAY % PLACE; SITION I DATE REFL. I BOt-[) I RUT
71 FROM T THICKNES~ STEEL ~E:: Yo~S SURVEY CRACKS PATCHESFAILURESFAILURES DEPTH 8 0 INCHES (±) NO MADE 0. I; - '"iT r-' IJ T T'-~ In'" T I '~, "f-H-~ L .. -f- -~-f-- .. r-r- -~+- ~-, i+ 1 ++- tt! I I I I M\N\
1 O_~ _~ ___ . ___ .. _ I, i i .+4- i ! T : I Ii! ! I, 1,-,-, I I I I '. I ! , IlL' I I ,I I. I ' ,! )1 f'\T\ 1'-1\\--~r- ---t- -f- --'+-i- f--c- -'--t- -f-, '·t-t-f- ' -i-~ ~-' , \1'J\I\j\
12 -f-I--T~ 1 I, . _ I i I I it itt' I -f-f-' I __ f_h-' :1 . ...:- I \ I, 'I \~~N\ 13 I L I '--l--t--- 1----,-+ : i w.! : J#' 'i.: I I i r ~J\\I\\l. I 4 I i I I I I i I I 'I' II i 'T " : I :' r\\~)\1\ i\ I _~+-, . _ ,_ . _-+-+- r-.' +.;, I' I \I\i\:\ .. ~
:5 I tl I! , 1 " :Iii! L' II '111'i "\i\~' -f-'- -1---- oj. , . t- +-t- .w+ .1':' ' ! \1_" I
16 !" I' I 'I 'I T' !,' , -f- ---I-
H-_- , .lU_~~ -~ -J' -t, I I. 11+=+: '+.'-;- • i __ L.1J 1- -H' ~..;-r-!t ~,I - i I I I, -.1 , \' I
17 J I I IL' T 'i , ~t·' I-nl- I '" I ITt I i Tit., - - - '-f- - .. , --1- 1- f-.- ... + f+, r-+ I 1-+ : 1[ --l-++ - Ii, I I 1--1+' \1 \1 \ 1\ 1 8 I 1 I I' I' 1 , 1 I i I ! ' ! I! I I 1 \~\i\r\f\
- -- I II -H-I---Lt-+_ .. -++- 4+- f-t--H-+- H- , +I-+--~ 'H-+_ 1-!- .. ;-~-LT'·-r'· ;-IT-4-. ' 19 ' ! '" ii' . I 1 " IT I "I ' \"1\ 1\ , ~ +-t+ --1- -I---!-~ +il--~r- -'-1--- -+-!._ I, " . I 1 . Iii i I: , ! \J \I \1 \
20 I : ~f-I--f-i:t' :;: i j I L I I I 1 1 I 4-1 !-W-J I i I I f\ \;\[\ \1 21_ I I ~--f-- i ' __ ~ i- -w :1+ 1 ____ -1! l +-w I i_r-, ,i I j Ill\\I\[\\ 22'_ _ i _L- -+- H- _~_+_ _~~_ it"'! '-1- I-- iiffT. Ii i lnj-H+ I I I!, \f\f\ \1 23 ! I iii til i ' Ii i i T-n ~ ti ,I i I I 1 t+ \ ,~, 24 . I .l-t t ~-' J[ I -- _ ~t +r' '-tttT 1--,- - f-- - I-TTf -r - --+- -t j ii +~- TIC I I -t\1\t
-4 -t I c__ --- ,. t -;---t ,-i:T - - - ,-1" -- -1' -h-rT---ti- -r -t,~
6
27 _ ' __ .1 L 1 1 __ I
_ 1111. ilUl -11 ~Ji_ir- ~T __ ,~r~i-t-r l-qTrrT-iT1,rr"-t-~--llrTrf'l1\l\f\! 26 ffi---J - - ~! - I i·-t· - - ,I,. I -' I 1:: . I I I I 1 ,I I I, ,I I I I , j \ !\, .' ,
2sH ~-ll II I i I I J : 1 iI' r Ii .ll ~! i tlltTmr n I-rrr l-I!- rT'--t:-rrrt- r-f,T\r,t'! t-l2J;~~~L~~i JJ~J2L~ ~iL:. 'ii_52_: ·~:ol."~,~~j~~"{Ji~:iEf~ ili~2~~~_~tr~s5:~{'o ~rJiW§~~~E i)~it±~b1;~-9~~;*'~~~ J46~Jr~i hLJ.~r{~ Fig A.6. AC overlay condition survey form.
r \lJ \JI
196
sheet. Different colors may be used for different surveys in order to show
the development of distress. A copy of such an opaque sheet is shown in
Fig A.7. The number of spalled cracks and the linear feet of pumping
observed along the edge of the roadway are not sketched on the survey sheet.
These distress manifestations can be entered onto the survey form directly at
the site, or a separate note can be made for subsequent transfer to the
survey form in the office.
Once all the distress manifestations have been marked on the sheet the
survey in the field is complete. In the office, the number of individual
distress manifestations is taken off the sheet and transferred to a survey
form. The form is shown in Fig A.S. Space should be left on the survey form
for subsequent surveys of a particular section. This is shown in Fig A.S.
i --;-) ~ 7""' 1-- I ~-t- /1 \'\7'--r-l
o
90
180
I I I \ t I \
1/ {I I 1/ ,
10
100
I'" r--r--
I
190
20
110
200
--1975
30
120
I
1\ I
210
----1979
40
130
I
220
\
\ \ \
50
140
-r--
( I
230
60 70 80
150 160 170
r---r" - r---
240 250 260
Fig A.7. Copy of field map used to record distress manifestation in small (experimental) pavement sections.
90
180
\ I
270
,..... \0 "-J
CRC PAVEMENT CONDITION SURVEY FORM FOR SMALL SECTIONS
ffif-l I H I1111I1 UTI 1111111111111111111111111111111111111111111111 j Illl 1I11111I f 11 DISTRICTlcONTROL I SECTION I JOB NO I CFT R:# IHIGHWAY AND DIRE eTION
1111 0 UilllJJllJ 1IIIIIill LOCATIONS
COMMENTS DATE OF
SURVEY
COUNTY
NUMBER OF
NUMBER ISPALLED CRKS r
DATE
I m PUNCHOUTS PATCHES PUMPING
MINOR ISEVERE
FROM I TO OF
CRACKS MINOR ISEVEREI < 20'1> 20' 1<20'1>201 A. C·I PCC IMINOR ISEVERE
THIS PROGRAM PRYORITll!' A srT 0, RIGID PAV[MfNTS tJCP,JRCP;AND CRCP' 'OR RFHAB!l!TATION WIT~IN A GIVFN TIM' PEAroo~ THE PRIORITrZATION PROCEDURr !S PERFORMED USING A DIITREX INDEX FnR EAe~ PAV!M!NT TVP! AND SEVERAL OISTp!S8 PREDICTION EQUATIONS. RUOG!T CON8TRAINTS CAN Br CONS!O!RfO IN THF PRIORITtZATION PROCEDURF.~
C COL • enST nF OVERLAY, DLL8~/IN~ PER S~;'T~ tie R!ADt~,841,cnL
PRINT 841;eOL C C N8Ee • TnTAL NUMR!R OF BECTION 0' ALL TYPfS C ~!l • NUMAER OF SECTIONS OF TYPE t, JCp AND JRCP, C N!2 • NUMAfR OF SECTIONS OF TYpE 2, CRCP,
e •• nrSTRf8S MANI'~$TATIONB AND SECTIQN INFO.' C C SECtOrr' • ALPHANUMERIC SECTION IDENTIFICATION. C FOR Jep AND JRCP' OT1CI' • CR~CKING AND 'ATCHING, e FT, PEA tIll SQ"T. C "UU, • JOINTS AND CRACKS BPALLtNG, C PERCENT. C DUtn • 'AUL TING, IfI/; PO te." n ~ C e FoR CRep, DTICI' • CRACKING AND PATCWINO, C NUMBER PER MIL!. e DT2tI' • PERCfNT MINOR 8PALLING~ C DTltI' • PERC!NT 8fY!R! IPALLINC~ C AGECI\ • SECTION AGf AT TIM! 0' CONDITION SURV!y. C ESALCYl • CUMULATIVE EQUIVALENT SINGLE AXL! LOAD C APPLICATIONS AT TIM! 0, CONDITION SURy!y. C GCI' • flAL GRQWTH RATE. C XLNT(I' ~ S!CTION LENGTH; C XNLtI' • NUMBER OF LAN!S IN BECTIaN; C
SU MII·fJ.0 ~Ullltl.0.(1
no 2M' ht,NSF.C REAnte,8~~'~ECrD(I"DTttr"DT2tl),DTJtl"AG!tl).!IALtl"
I G(I),XLNT(I',XNLtl) tNO tt hlI TIHn.~.O'I AUMX.RU~Y.XlNTtl)
C INCrI' • INDICATOR USED IN THE 10RTING SUBROUTINr; l~tI~G!;Nfl.t'GO TO t3~ ~JPT tt" t SUMYI.~U~ft+XLNT(I)
C NPTtI' • TNnrCATOR OF PAYEMENT TVPEI C i FOR JCP AND JACP, C , FOR CRep, C , FOR AC OVERLAYS,
DO 22~ hi,NSEC INDo,.r COSTtU II III:0 GO TO(151;t~2,'53)NPTtI) CALL PQEoi(DTltJ',DTl(I',OT3t!"AG!tI',G(I',!SALtI" CALL ZETAitDTltI',OTl(I',OT3tI',lETA(I" GO TO 220 CALL PREn~(DTltt"DTl(I"OT1(1"AGI!(I',G(I"E'AL(I') CALI Z!TA,(nTl(Y),OT2tI',DT3(I',lETA(I)' GO TO 220 C6Ll PRE7'tZETA(I',l0(I"AGE(I',G(I"EsALtI"T~tI)' CONTINUF.
SECOND ALTERNATIVE
I' AUOGFT CONSTRAr~TS AR£ NOT CONSrO!R~D, T~! S~L(CTrON 0' PAVEMF.NT SECTIONS TO BE OVERLAID IS MADE D(prNDING ON TME MAGNJTUD OF T~E DISTRESS INDF.X.
t 1,25)(,* eTR. UT AUSTIN ., 2 1,25X,* VERSION "'AR lm,lq~2.)
8'5 'OR"AT(SX~'At0) A'6 FORMATftX~III,~X,'At0' 81' FORMATt~x,'AI0,111' 820 FORMAT (215) "21 'ORMATt5x;.ANALYSIS PERIoea.,IZ,/' AZ2 'OAMAT(~X;*ANALVSIS PERIOD SHoulD Sf SHORTER THAN tl YRI.*,/) 823 FORMATt~X;.SUMMARV OF S!CTIONS CONSIDER!D IN TN, ANALYSIS*,II,
I 5x;a6H.-••• -~.~-.-••••• ;.; •• ; ••• ~ ••••• ~.~ •••• ~.-.w .•• I. 2 5x~* SeCTION NO; 0' MILls *,1, 1 5)(,*. TVP!. . IfCTt9N'. •. *,1, G 5x.46H •••••••••••••••••••••••••••••••••••••••••••••• , I , 5 5x~* t *,I',IIW,'12,2,1, " 5x.* .. 2 '. *,U,1I~.'n.2,/" 1 ~x."'H ••••••••••••••••••• -•••••••••••••••••••••••••• ,I, A 22x,16,10X,'12:2'
A~U FORMATt5X;*NO 8UDGET CONSTRAINTS AP! TO BE eON'IDfR!O*,/) 825 'ORMATt!X;.NS~t SHOULD !! 0 OR 1*,/) 830 FORMATtlx.II,!x,.~UnGET CONSTRA!NTS ,OR !_CH YEAR*,I,
t 5x,.IN THE ANAlYS!S PEAICD.,I, 2 s~,*~.~ •• -.~ ••• -.; ••• -~.-_.,I'
t tX;.DllS~/IN:P!R 8Q~'T~*'/' SU! FOR",,, UI'P 846 'ORMATC5~,*80M£ MISTAKE IN THE NO: OF S!CTION8*~/' II 5 I/! FORMAT(I5~ ~St FORMATt~X;.NSW2 SHOULD BE 0 OR 1*,/) A~2 FOR"'AT(1~\,5X,*PROGRAM PRPll.,G0x,.'AG!*,13,111, AS] FORMATtSx,*ACCORDING TO YOU INPUT IN,ORMATlnN.,I,
1 5X,.THE 'OllOWING DATA 8ET WAS R!AD*,II, 2 5x;*FRO~ COL: TO eOl~*)
C **********.~.*.*********.****.******************************* C C
c e THE FUNCTyON OF SU~ROUTINE PREnl IS TO CALCULATE FUTUR!
207
208
C OISTRESS eONOITrON 0' TH! JOINT!" PAY!M!NT SECTIONS C cJc~ AND JRCP): C C PARAMfTERSI C CRK • CRArW!NG,FT P[A JS0A IQ 'T, C PS • ~£RCFNT SPALLED JOINTS AN" CRACKS, C 'LT • "Ul TING IN W~[!LPATH,IN PER 1190 FT, CAGE • AG! OF PAV(M!NT SECTION IN VEA_S, Cr.. !~AL GRnWTH RAT!, C ESAL • CU~UlATIY! EQUIVAL!NT! SINGL! AXL! LOADS; C
C ************************************************************* C C
C t THI8 SUBRnlJTtNE I~ USED TO PR!nICT T~f FUTUR! DISTRlSS C CON~rTtON nF T~! CRCP PAV!MENT S!CTtONS; C e PARAMFT!R~I e FPM • FAILUR£S PER MIL!, C PM •• P!Rr.ENT MrNOR SPALLING, C pSS N P!RefNT SFVERE SPALLING, CAGE • AGE OF ~AV!MENT SECTION IN VEARS, C G • ESAl CRnwTM RATE, e ESAL • CUMULATIVE EQUIVALENT! SINGLE AXLE LOAOS. c
e ***************.*****************.****** •• **.*.***** ••••• *.*. c e e c THIS SU~RnUTrN~ CALCULATES T~! 'UTUAE DISTRESS C INO!X n' AN AC OVERLAID RIGID 'AVEMENT SECTION.
C PARAMET!~S' C lElA • DI8TR!le INDEX, C ze • DISTRESS tNO!X 0' THE srCTION CONSIDERED e B!FnR! OV,ALAV WAS PLACED, CAGE • AGr. OF PAV!M!NT SICTION IN VEARS, C G • tSAL r.A~WT~ RATE,
C fSAl • CU~ULATIVE EQUIVAL!NTE SINGL! AXL! LOADS. e TM • TMICKNESS O~ TME OVERLAY, INCMfS. C
C ************************************************************* C C
SUBROUTINF TMICKCl0,TM) C C T~rs SUBRnUTINf CALCULATES A RECOMMENDED THICKNESS C ~OR Ae OV~RlAV8 ON RIGID PAVEMENTS. T~IS TMICKNESS C ~s APPRO~IMATE AND NEEDS TO !E CORRnBORATEO By MOR! e ACCllJUTE ",nIGN PROCEDURES. c
C
TH·~~~q*(1~0.Z0'**0:5 RETURN END
C ********.***************~************************.**********_ C C
c C INCSRT ACCEPTS AN ARRAY "F K!YS OR DATA IT!MS AND RETURNS C AN ASSOCIATED ARRAY OF INDICES SORTED ACCORDING TO TH! C ORDER OF TH! KEVS: C e PARAMETERS. ex. ARRAV OF KEYS IN R!LATION TO WHleH TH! INDlelS AA! C TO BE snRTED tN ASCENDING ORDER tX IS NOT ~ODI'I!D"
209
210
c rNO • ARRAY O~ tNDIC!S POINTING TO !LEMENTS 0' X, C N • NUM8[R nF !lEM!NTS IN ARRAva ~ AND rND, C IF III IS N!GATIV!, IND IS NOT INZTIALll!D AND THE ORDER C 0' ANV PR!VIOUS S!CONDAAV aORTa la PR!'ERV[D~ C C AlQORITHM TAkEN FROM QRnGONO,*PRDGRAMMING IN PASCAL.,p.t.e. c
c C C
C
c C
C C C C
c C
c C
c C
5
"
Ul
2~
le
nIM!NStON xtN',IND(N) LOGICAL "nN,
** !NtrlA~ t1! ARUV 0' I' (N .LT. "" GO TO " 00 5 hl,N P.lDtt' • t CONTINUE
JUMP. rUIH N/2 ,
** JUMP ... srZE LOOP CONTINUE
** LOOP Tn SCAN ARRAY
** WIT'" CIJRRENT VAI.Ue: CONTINU! I)ONI!:.:TRU'~
INDICra
UNTIL NO MORE INTfRCHANG!S ARE PDBSral!
0' JUMP •
** lOOP TO MAKE ON! ICAN 0, DATA DO 19 l.t,tN.JU~P)
The computer program PRP01 prioritizes a set of rigid pavements (JCP,
JRCP and CRCP) for rehabilitation within a specified time period. The input
data are distress condition survey information on the current state of the
pavement sections to be analyzed. The prioritization procedure is based on a
distress index which results from the combination of several distress types.
Future condition of the pavement is estimated using distress predicition
models. In addition, budget constraints can be considered in the
prioritization procedure.
LIMITATIONS
(1) Only rigid pavements (JCP, JRCP, and CRCP) are processed by the computer program.
(2) The analysis period should be less than 10 years. (3) The maximum number of pavement sections is 500.
INPUT CARDS
The notation CC refers to card columns, with the range of columns being
inclusive. All REAL values are punched with a decimal point as a part of the
213
214
value and all INTEGER values are punched without a decimal point and right
justified in the data field.
Card Type 1 (2 cards)
6 60
C><J
CC 6-60 (ALPHANUMERIC) any combination of alphanumeric characters may be
used to identify the problems to be solved.
Card Type 2
5 6 10
CC 1-5 (INTEGER) switch to specify if budget constraints are to be
considered; if 0 budget is not considered, if 1 budget is considered.
CC 6-10 (INTEGER) analysis period, years; from 0 to 10 years are
processed by the program.
The program provides for the following alternatives:
(a) Prioritized list of pavement sections for rehabilitation using the condition survey information; thus alternative is run by making the analysis period equal to zero.
215
(b) Multiperiod rehabilitation schedule without budget constraints; to run this alternative the budget switch should be euqal to zero.
(c) Multiperiod rehabilitation schedule with budget constraints; to run this alternative the budget switch should be equal to one.
Card Type 3 (one or two cards, as needed; cards required only if the
budget switch in Card Type 2 is equal to one)
10 II 20 21 30 61 70 ,---------,----------r--------- ---------~~------~
CC 1-10 (REAL) budget constraint specified for the first year in the
analysis period. CC 11-20 (REAL) budget constaint specified for the second
year in the analysis period.
CC 61-70 (REAL) budget constraint specified for the seventh year in the
analysis period.
Card Type 4
10
CC 1-10 (REAL) cost of overlay, dllso/in per square foot; a detailed
analysis needs to be carried out to determine this cost figure which should
include all of the agency costs.
216
Card Type 5
5 6 10 II 15
- ==
CC 1-5 (INTEGER) total number of pavement sections to bl~ processed by
the program.
CC 6-10 (INTEGER) number of jointed sections (JCP and JRCP).
CC 11-15 (INTEGER) number of continuous sections (CRCP).
Card Type 6
5
==
CC 1-5 (INTEGER) switch to print input informations; if 0 input is not
printed, if 1 input is printed.
Card Type 7 (as many cards as number of sections specified)
2 7 14 21 28 35 42 49 56 63
CC 2-6 (ALPHANUMERIC) section identification.
If jointed pavement section (JCP and JRCP):
CC 7-13 (REAL) cracking and patching, number per mile.
CC 14-20 (REAL) joint and crack spa11ing, percent.
CC 21-27 (REAL) faulting, number per mile.
If continuous pavement sections (CRCP):
CC 7-13 (REAL) punchouts and patching, number per mile.
CC 14-20 (REAL) percent minor spa11ing.
CC 21-27 (REAL) percent severe spa11ing.
CC 28-34 section age at time of condition survey, years.
217
CC 35-41 cumulative equivalent single axle load applications at time of
survey, ESAL-18R.
CC 42-48 ESAL growth rate.
CC 49-55 section length, miles.
CC 56-62 width of the pavement section including shoulders.
APPENDIX D. SAMPLE INPUT AND OUTPUTS TO THE PROGRAM PRPOl
This appendix contains sample input and outputs of the program PRPOl as
follows:
(1) Sample INPUT.
(2) Sample OUTPUT using alternative 1, i.e., printing of a prioritized list of pavement sections for rehabilitation using the condition survey directly.
(3) Sample OUTPUT using alternative 2, i.e., printing of a multiperiod rehabilitation schedule without considering budget constraints.
(4) Sample OUTPUT using alternative 3, i.e., printing of a multiperiod rehabilitation schedule taking into acount budget constraints.
The information contained in the sample INPUT is real CRCP field
information collected in east Texas in 1980. Therefore, the runs presented
are of direct use to the Texas State Department of Highways and Public
Transport to assess the current condition of its CRCP network and the needs
of rehabilitation in the next few year presented.
221
222
SAMPLE INPUT pHY(1RITV LI~T ('lJ:' T'I( Cpr,:p !"OR QE~'B I L I TA Tt "~I INPUT DATA '~OM 19At-l CONor TION SIIRVE'I