Page 1
I
THESIS FOR THE DEGREE OF LICENTIATE OF ENGINEERING
NOx Formation in Rotary Kilns for Iron Ore Pelletization
Rikard Edland
Department of Space, Earth and Environment
CHALMERS UNIVERSITY OF TECHNOLOGY
Gothenburg, Sweden 2017
Page 2
II
NOx Formation in Rotary Kilns for Iron Ore Pelletization
RIKARD EDLAND
© RIKARD EDLAND, 2017.
Department of Space, Earth and Environment
Chalmers University of Technology
SE-412 96 Gothenburg
Sweden
Telephone + 46 (0)31-772 1000
Printed by Chalmers Reproservice
Chalmers University of Technology
Gothenburg, Sweden 2017
Page 3
III
NOx Formation in Rotary Kilns for Iron Ore Pelletization
RIKARD EDLAND
Division of Energy Technology
Department of Space, Earth and Environment
Chalmers University of Technology
Abstract
The production of iron ore pellets is often performed in the so-called Grate-Kiln process. The
aim of the process is to oxidize the magnetite (Fe3O4) to hematite (Fe2O3) and to sinter the
pellets so they can be used in steel manufacturing. The heat required for this is produced by
combusting a pulverized fuel in a rotary kiln, forming a suspension flame. Due to the need to
oxidize the pellets, large amounts of air are introduced to the kiln. Relating the amount of air to
the fuel, an air-to-fuel equivalence ratio of 4-6 is obtained. Furthermore, the air is pre-heated to
above 1000°C. High temperatures and large amounts of excess air are known to promote NOx
formation and NOx emissions from iron ore processing plants are in general high.
The aim of this work is to describe the NO formation in the rotary kiln and to identify governing
parameters that may be altered to reduce the emissions. The thesis contains results from
experiments in a pilot-scale kiln and from modeling work based on the same experiments. In
the experiments, four coals were tested as well as co-firing coal with biomass. In-flame
measurements of temperature and gas concentrations were performed with the use of a suction
pyrometer and FTIR spectroscopy (+paramagnetism). Different primary measures for NOx
reduction were also tested. Overall, reducing the primary air flow in the burner and co-firing
coal with biomass were the most effective measures for reducing NOx emissions, compared to
the reference case. Using natural gas and oil resulted in three times the amount of NOx.
Reducing the total amount of excess air only resulted in a small NOx reduction, and increasing
the secondary air temperature resulted in slightly decreased NOx formation.
The general assumption in rotary kilns is that NOx is mostly formed by the thermal NO
mechanism due to the high temperatures involved. Although this is certainly true for the cases
with gas and oil, the experimental results indicate that NOx formed from the fuel-bound nitrogen
is dominating the total NOx formation when solid fuels are used. The results from the detailed
reaction modeling show that the thermal NO formation is of minor importance. Instead, the
reduction of NO by char appears to be remarkably low in the kiln and responsible for the high
net conversion of fuel-bound nitrogen to NO.
Keywords: Nitrogen oxides, combustion chemistry, NOx formation, emissions control, rotary
kiln, Grate-Kiln process
Page 5
V
List of Publications
This thesis is based on the following papers:
I. R. Edland, F. Normann, C. Fredriksson, K. Andersson, Implications of Fuel Choice and
Burner Settings for Combustion Efficiency and NOx Formation in PF-Fired Iron Ore
Rotary Kilns, Energy and Fuels, 2017, 31 (3), pp 3253–3261
II. R. Edland, F. Normann, K. Andersson, Modelling the contribution from volatile and
char bound nitrogen to NOx formation in iron ore rotary kilns, Submitted for
publication, 2017
III. R. Edland, F. Normann, K. Andersson, Nitrogen chemistry in rotary kiln flames: Impact
of mixing rate and temperature at high air to fuel ratios, Nordic Flame Days Conference
2016
Rikard Edland is the main author of all three papers. Associate Professor Fredrik Normann and
Professor Klas Andersson contributed with guidance for the modeling and experimental work,
as well as to the editing of the papers. Dr. Christian Fredriksson was responsible for the planning
and evaluation of the experimental campaign at LKAB (Paper I).
Page 7
VII
Acknowledgments
I would like to start off by expressing my gratitude to my supervisors Professor Klas Andersson
and Associate Professor Fredrik Normann for all your guidance and willingness to share your
expertise, as well as helping me develop as a researcher and teacher. I would also like to thank
my examiner Professor Filip Johnsson for providing valuable input to this thesis. The Swedish
Energy Agency and LKAB are acknowledged for their financial support of this work. An extra
appreciation goes to Christian Fredriksson at LKAB for fruitful discussions and for planning
the experimental campaign that much of this thesis is based on.
A special thanks to Adrian Gunnarsson for your enjoyable company, efficient cooperation and
solid support during our work together. Thomas Ekvall receives my appreciation for teaching
me about our experimental facility, as well as always being willing to discuss combustion
chemistry and video games. Daniel Bäckström is also greatly appreciated for all the help with
many experiments, and for taking care of that unruly FTIR.
To the rest of the Combustion and Carbon Capture Technologies group and everyone else at
Energy Technology: Thank you for being who you are and for contributing to a stimulating
working environment! A special thanks to my officemate Angelica Corcoran for your support
and for putting up with my disorderliness.
Thanks to all my friends for making my life (both inside and outside of the Chalmers walls) so
active and enjoyable. Thanks to my brother for being a role model and a great friend, and to my
father for always believing in me and for thinking that I can fix any technical problem. Last but
definitely not least, thanks to my mother who has encouraged me my entire life and with whom
I can discuss anything. I wouldn’t have made it here without your support.
Rikard Edland
Gothenburg, Sweden
September, 2017
Page 9
IX
Table of contents
1 Introduction ........................................................................................................................... 1
1.1 Aim and scope ................................................................................................................ 1
1.2 Outline of the thesis ........................................................................................................ 1
2 Background ............................................................................................................................ 3
2.1 Nitrogen oxides .............................................................................................................. 3
2.2 NOx legislation ............................................................................................................... 3
2.3 Iron ore production ......................................................................................................... 6
3 Theory .................................................................................................................................... 9
3.1 NO formation routes ....................................................................................................... 9
3.2 Fuel-N evolution during solid fuel combustion............................................................ 11
3.3 General NOx mitigation strategies ................................................................................ 16
3.4 Units of emission measurements .................................................................................. 18
4 Previous work on NOx in rotary kilns ................................................................................. 21
4.1 Cement industry............................................................................................................ 21
4.2 Iron ore industry ........................................................................................................... 22
5 Experimental equipment ...................................................................................................... 25
5.1 Experimental Combustion Facility ............................................................................... 25
5.2 In-flame measurements ................................................................................................ 26
6 Modeling .............................................................................................................................. 31
6.1 Overall modelling considerations ................................................................................. 31
6.2 Model description ......................................................................................................... 31
7 Results and discussion ......................................................................................................... 35
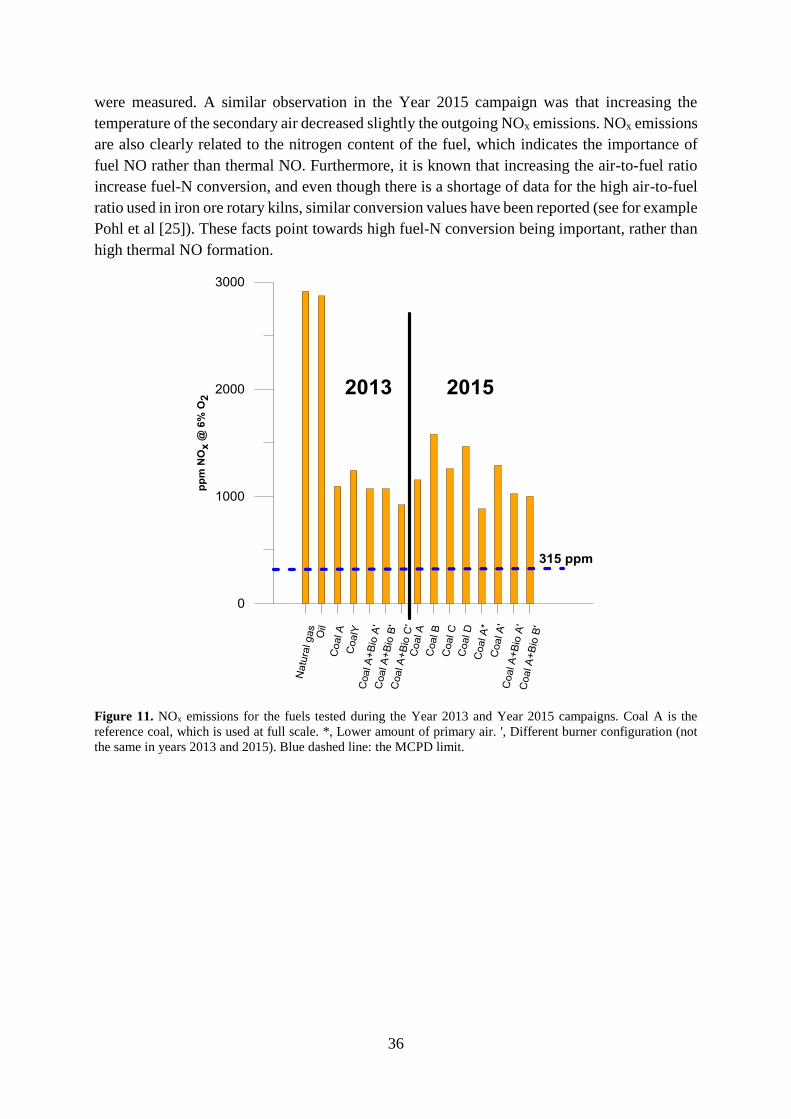
7.1 NOx performance .......................................................................................................... 35
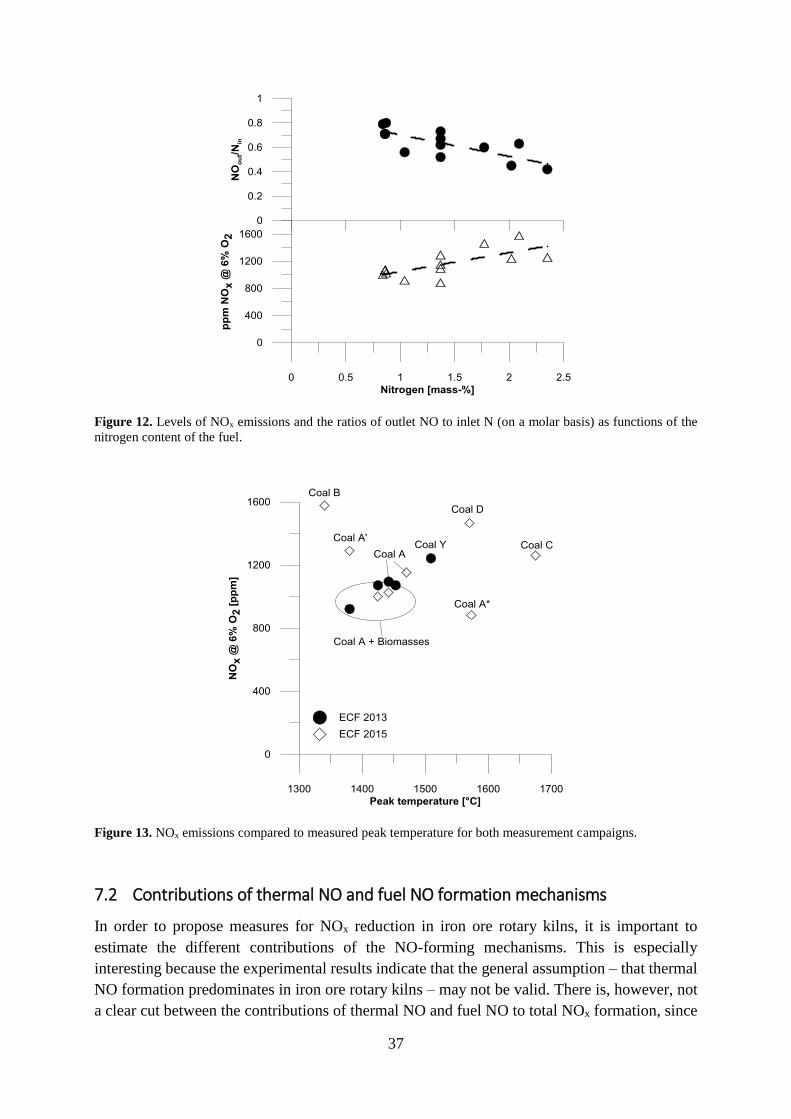
7.2 Contributions of thermal NO and fuel NO formation mechanisms ............................. 37
8 Summary .............................................................................................................................. 43
9 Future work ......................................................................................................................... 45
References ................................................................................................................................ 47
Page 11
1
1 Introduction
The production of iron ore pellets, which is vital to the production of steel, is expected to be an
important industry for many years to come. The pelletizing of iron ore is often performed in the
‘Grate-Kiln’ process, in which the iron ore is heated, first on a traveling grate and then in a
rotary kiln. The pelletizing process is energy-intensive and powered by combustion in the
presence of large volumes of hot air (>1000°C), usually employing fossil fuels. NOx emissions
from this combustion process are generally high, and these emissions will need to be controlled
in order to comply with upcoming NOx legislation.
In Europe, NOx emissions have decreased significantly over the last few decades thanks to strict
NOx regulations combined with the development of NOx mitigation technologies. However,
specific features of the Grate-Kiln process, e.g., the rotation of the kiln and the large volumetric
gas flows, make conventional methods for NOx mitigation unfeasible. Therefore, it is important
to understand and describe accurately the mechanisms governing NOx formation in order to
identify and evaluate the mitigation possibilities. Recent targets set by the European Parliament
to reduce emissions is a major motivating factor for this research.
1.1 Aim and scope
The overall aim of the work is to describe the NOx formation under combustion conditions that
are relevant for the Grate-Kiln process. An important part is to identify governing parameters
that are feasible to alter within the constraints of the pelletizing process in order to reduce the
NOx emissions. The NOx chemistry is evaluated through a combination of pilot-scale
experiments and combustion modeling.
1.2 Outline of the thesis
This thesis consists of a summary of the work and the three appended papers. Chapter 2
provides the background related to the effects of NOx and current legislative measures, as well
as a description of the Grate-Kiln process. The aim of this chapter is to set the thesis in an
appropriate context. Chapter 3 presents the theoretical framework of the chemistry and the
processes that govern NOx formation. Chapter 4 summarizes the previous research on NOx
mitigation in rotary kilns. Chapters 5 and 6 describe the experimental and numerical methods
used. Chapter 7 provides the results and a discussion. The thesis concludes with a summary and
ideas for future work.
Paper I is an experimental investigation of the impacts of fuel and combustion parameters on
NOx formation in rotary kilns. Different coals, as well as co-firing of coal and biomass were
tested. In-flame measurements of temperature and gas composition were performed with
suction pyrometry and FTIR spectroscopy. Paper II evaluates the importance of the NOx
formation mechanisms in iron ore rotary kilns using detailed reaction modeling. Paper III is an
investigation of the gas-phase chemistry and how it depends on the combustion temperature
and mixing of the fuel and air.
Page 13
3
2 Background
2.1 Nitrogen oxides
A nitrogen oxide molecule is composed of nitrogen and oxygen atoms. There are several
theoretical possibilities for the arrangement of these atoms, although the only relevant
compounds in terms of atmospheric pollution are nitric oxide (NO), nitrogen dioxide (NO2),
and nitrous oxide (N2O). The term “NOx” is a generic term for NO and NO2 (as they are closely
related), whereas N2O is not usually included in this term. N2O is a potent greenhouse gas (more
potent by orders of magnitude than CO2), although it is not directly hazardous to humans or the
environment. In contrast, both NO and NO2 are inherently toxic and may cause lung injury in
humans. NO is considered to less toxic but is the main precursor of NO2 and is, therefore, of
equal importance. The main problems associated with NOx are however secondary effects,
which result in the formation of tropospheric ozone and acid deposition. Tropospheric ozone
(O3) represents ozone that is close to the ground (the troposphere). Although the ozone in the
upper atmosphere (the stratosphere) is important for protecting the planet from UV-radiation,
it is hazardous to humans as it harms the respiratory system and causes damage to vegetation
and crops [1-3]. Ozone is responsible for many of the negative health effects associated with
“smog”, which blights many urban areas around the world. Ozone may be formed by the
reaction between an oxygen molecule (O2) and an oxygen radical (O). While natural
concentrations of oxygen radicals are low, the decomposition of NO2 by sunlight increases this
concentration, thereby increasing the level of ozone. The formation of ozone through NO2 is
described by reactions R 2-1 and R 2-2 below, where hv is the energy from solar radiation.
𝑁𝑂2 + ℎ𝑣 → 𝑁𝑂 + 𝑂 R 2-1
𝑂 + 𝑂2 → 𝑂3 R 2-2
The other major problem with NOx is acid deposition, in the form of either acid rain (wet
deposition) or gas and particles (dry deposition). Once NOx is released into the atmosphere it
can react with water vapor to form nitric acid (HNO3), which can be transported thousands of
kilometers before being deposited as acid rain. The resulting acidification of the soil and
waterways is harmful to the vegetation and aquatic wildlife, and has caused severe
environmental problems in many parts of the world [4]. Emissions of sulfur oxide (SOx) also
cause acid deposition (in the form of H2SO4). However, SOx emissions have been efficiently
controlled during the last few decades by desulfurization and flue gas cleaning, and the problem
of acid deposition has been resolved in many locations. Thus, in industrialized countries, acid
rain is now mainly caused by NOx emissions.
2.2 NOx legislation
Although NOx may form naturally, e.g., during lightning [5], anthropogenic activity is the main
cause of increased NOx levels in the atmosphere [6]. Most NOx originates from combustion
processes in which nitrogen in the air or in the fuel reacts with oxygen to form NOx (discussed
in detail in Chapter 3). In developed countries, NOx emissions originate essentially from the
Page 14
4
transport sector and/or the industrial sector, and the regulatory frameworks for NOx emissions
are important for these sectors. As this thesis deals with NOx emissions from an industrial
process, the transport sector (i.e., road vehicles, ships, and airplanes) will not be considered in
this work.
In 1979, the Convention on Long-range Transboundary Air Pollution (CLRTAP) was signed
by a group of 32 countries, which has today grown to include 51 countries worldwide [7]. The
motivation for the convention was the rapid destruction of forests and entire ecosystems in
European countries by acid rain from air pollution that originated thousands of kilometers away
from the affected areas. The convention has been extended by several protocols, of which the
Gothenburg protocol (1999) is the most recent [8]. This protocol aims by Year 2010 to reduce
tropospheric ozone and the eutrophication and acidification of waterways by setting a limit on
emissions of SOx, NOx, volatile organic compounds (VOC), and ammonia (NH3). The protocol
was entered into force in Year 2003, and was revised in Year 2012 to achieve further reductions
in these emissions by Year 2020. Within the European Union (EU), directives are launched to
set limits as to how much each Member State may emit. The individual countries then regulate
the emissions on a national level. The latest EU directive regarding air pollution is Directive
2016/2284/EU [9], which entered into force on the 31st of December 2016; it states that NOx
emissions should be reduced by 42% by Year 2020 and 63% by Year 2030, relative to the levels
of emissions in Year 2015. Figure 1 shows the annual emissions of NOx and SOx for the EU-
15 countries and EU-28 countries, together with the limits set by EU directives to comply with
the Gothenburg protocol [8-10]. The levels of NOx and SOx emissions have been reduced over
the past 20 years, although the reduction of NOx levels has been less successful. It is also clear
that further reductions in NOx levels are needed to reach the targets, while for SOx immediate
action is less urgently needed.
Apart from complying with national regulations to fulfil the targets set by Directive
2016/2284/EU, combustion plants within the EU also need to follow other directives. Large
combustion plants (≥50 MWth) are required to operate in accordance with the stipulations of a
permit, which include an emission limit that is based on the use of best-available technologies
(BAT) [11]. In practice, the processes are thereby obliged to implement BAT in order to be
operational. However, it should be noted that the definition of BAT considers that the cost for
controlling emissions should be proportionate to the environmental benefit. Medium-sized
combustion plants (i.e., 1-50 MWth) operate under a directive (the Medium Combustion Plant
Directive; MCPD) that entered into force in December of 2015. The limits set by MCPD should
be reached by Year 2018 for new plants and by Year 2025 or Year 2030 for existing plants
(depending on size) [12].
Page 15
5
Figure 1. NOx and SOx emissions per annum for the EU-15 and EU-28 countries [10]. The target goals for NOx
and SOx emissions set by the EU [8, 9] are also shown indicated by the respective boxes.
The environmental protection agency in Sweden (Naturvårdsverket) is the main authority
responsible for reducing national emissions and they monitor the current status of emissions
and evaluate possible improvements. They also provide information and support for legislation,
which is finally decided upon by the Swedish Parliament. In 1992, a fee was imposed on NOx
emissions from energy-generating plants, with the consequence that NOx emissions have
decreased continuously since then [13]. The concerned companies are charged for their NOx
emissions and the revenue from this charge is then redistributed to the concerned companies in
accordance with how much energy they have produced [14]. Plants that are not producing
power or district heating are not affected by this fee, although they still have to comply with
national targets. In general, the Swedish targets are more ambitious than the EU targets. For
example, the NOx limit for medium-sized combustion plants proposed by Naturvårdsverket is
300 mg/m3n (at 6% O2), as compared to the 650 mg/m3
n (at 6% O2) limit set by the EU in the
MCPD [15]. The monitoring of regional emissions is performed by the county governments
(Länsstyrelsen), which may propose even stricter targets. Länsstyrelsen report yearly to
Naturvårdsverket, which in turn reports to the Swedish Government.
Combustion-based power generation is relatively limited in Sweden, and most combustion
occurs in other industrial processes or in car engines. In 1990, NOx emissions from the transport
sector accounted for about 55% and the industrial sector accounted for about 17% of the
national NOx emissions (the remainder is attributed to machinery, agriculture, and heat and
power generation). In 2015, these values were 39% and 23%, respectively, although it should
be noted that the absolute NOx emissions have been reduced in both sectors, albeit more so for
the transport sector. The iron ore industry, which is the focus of this thesis, is a substantial
emitter of NOx. The iron ore industry in Sweden typically has processing plants with a heat
input of around 40 MW and will, therefore, most likely have to comply with the above-
Page 16
6
mentioned MCPD. However, limited research has been carried out on NOx mitigation measures
for these plants. In these plants, the combustion conditions (which will be discussed later) differ
from conventional combustion systems, and implementation of, for example, flue gas cleaning
(SCR), is less efficient and more costly. With respect to iron ore pelletizing plants, the document
that relates to BAT for iron and steel production [16] states that: “Due to high costs, the end-
of-pipe nitrogen oxide reduction of waste gas should only be considered in circumstances where
environmental quality standards are otherwise not likely to be met”. The proportionate cost for
the environmental benefit is thus still being discussed for this industry. Therefore, there is an
incentive to develop cost-efficient means to reduce the NOx emissions from these plants. This
necessitates an improvement of the current understanding of the relevant NOx formation
mechanisms in rotary kilns.
2.3 Iron ore production
Global steel production has grown from 189 million metric tonnes in Year 1950 to 1630 million
metric tonnes in Year 2016, with half of this growth having occurred since Year 2000 [17].
Since steel production requires iron ore, it is reasonable to assume that iron ore will continue to
be an importance product, although its production has declined slightly since Year 2014 [18,
19]. Australia is the leading producer of (useable) iron ore, followed by Brazil and China.
Sweden produces around 1% of the world’s useable iron ore.
Steel blast furnaces typically require iron ore that has an iron content of at least 58% and that
is in a form that allows the formation of a bed through which gas can flow with low resistance.
Therefore, the mined iron ore is often concentrated and shaped into spherical pellets. The
concentration process for iron ore involves removing impurities through grinding, filtration,
and the addition of chemicals. This results in a slurry that is then formed into soft pellets (so-
called ‘green pellets’), which are heat-treated before shipping. The heat treatment, which
includes drying, oxidation, sintering, and finally cooling of the pellets, can be performed either
in a ‘Straight-Grate’ process or in a ‘Grate-Kiln’-process. In the Straight-Grate process, the soft
pellets are heat-treated in a bed upon a moving grate. In the Grate-Kiln process, the pellets are
first dried and strengthened on a moving grate before being sintered in a rotary kiln. The focus
of the current work is on the Grate-Kiln process, a detailed description of which is given below.
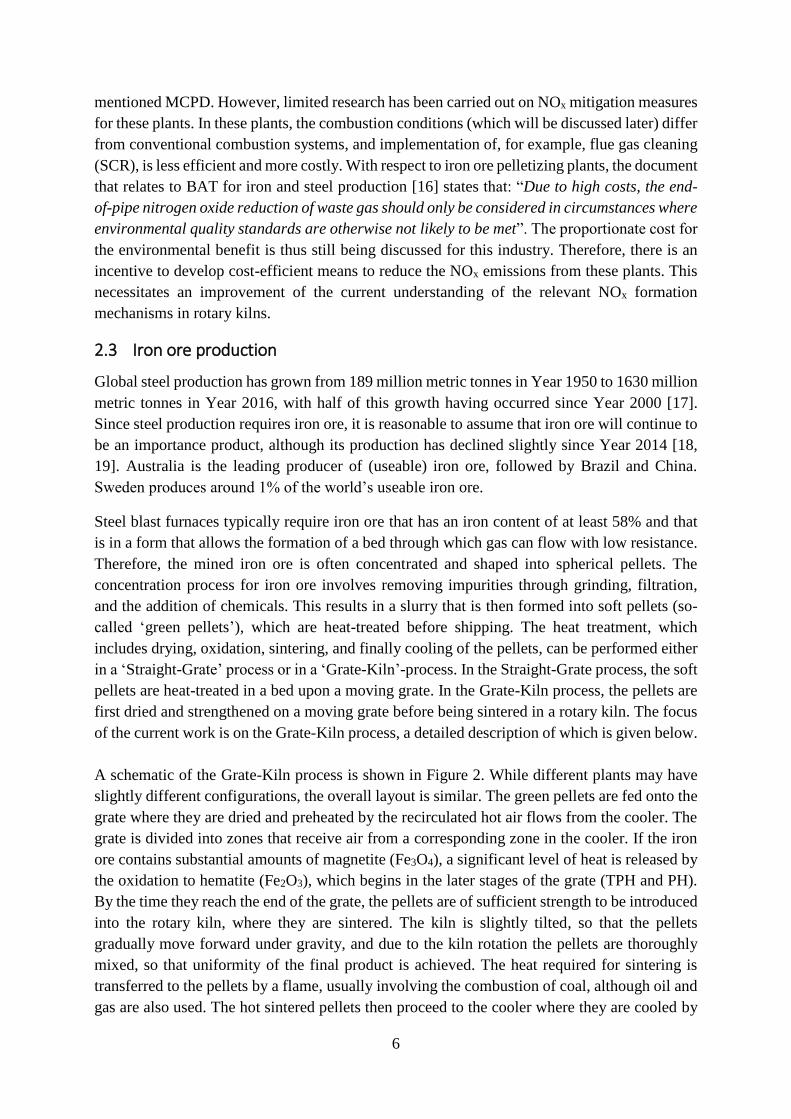
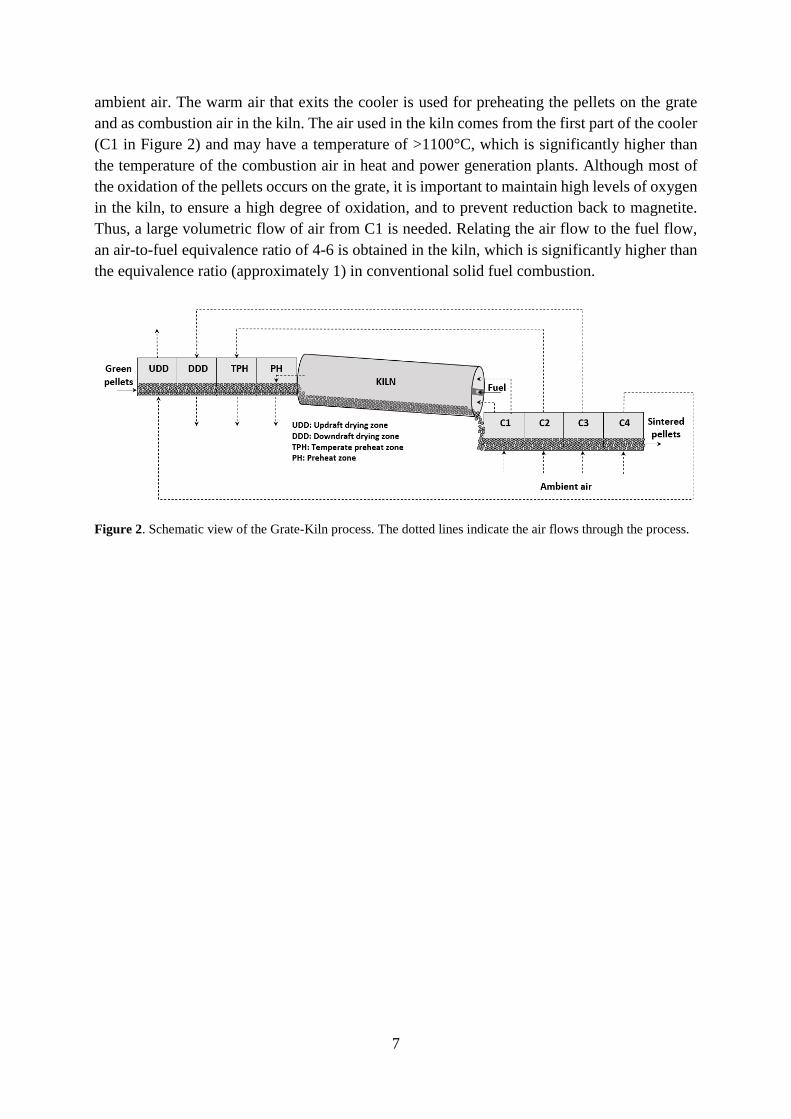
A schematic of the Grate-Kiln process is shown in Figure 2. While different plants may have
slightly different configurations, the overall layout is similar. The green pellets are fed onto the
grate where they are dried and preheated by the recirculated hot air flows from the cooler. The
grate is divided into zones that receive air from a corresponding zone in the cooler. If the iron
ore contains substantial amounts of magnetite (Fe3O4), a significant level of heat is released by
the oxidation to hematite (Fe2O3), which begins in the later stages of the grate (TPH and PH).
By the time they reach the end of the grate, the pellets are of sufficient strength to be introduced
into the rotary kiln, where they are sintered. The kiln is slightly tilted, so that the pellets
gradually move forward under gravity, and due to the kiln rotation the pellets are thoroughly
mixed, so that uniformity of the final product is achieved. The heat required for sintering is
transferred to the pellets by a flame, usually involving the combustion of coal, although oil and
gas are also used. The hot sintered pellets then proceed to the cooler where they are cooled by
Page 17
7
ambient air. The warm air that exits the cooler is used for preheating the pellets on the grate
and as combustion air in the kiln. The air used in the kiln comes from the first part of the cooler
(C1 in Figure 2) and may have a temperature of >1100°C, which is significantly higher than
the temperature of the combustion air in heat and power generation plants. Although most of
the oxidation of the pellets occurs on the grate, it is important to maintain high levels of oxygen
in the kiln, to ensure a high degree of oxidation, and to prevent reduction back to magnetite.
Thus, a large volumetric flow of air from C1 is needed. Relating the air flow to the fuel flow,
an air-to-fuel equivalence ratio of 4-6 is obtained in the kiln, which is significantly higher than
the equivalence ratio (approximately 1) in conventional solid fuel combustion.
Figure 2. Schematic view of the Grate-Kiln process. The dotted lines indicate the air flows through the process.
Page 19
9
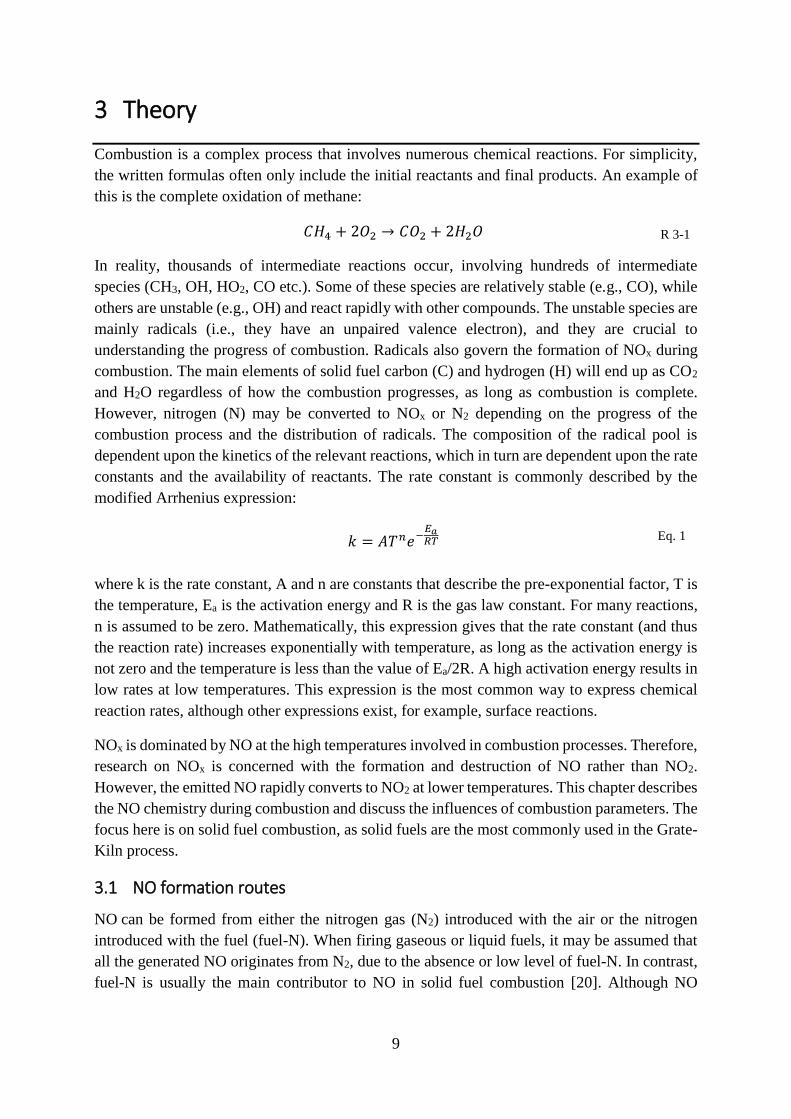
3 Theory
Combustion is a complex process that involves numerous chemical reactions. For simplicity,
the written formulas often only include the initial reactants and final products. An example of
this is the complete oxidation of methane:
𝐶𝐻4 + 2𝑂2 → 𝐶𝑂2 + 2𝐻2𝑂 R 3-1
In reality, thousands of intermediate reactions occur, involving hundreds of intermediate
species (CH3, OH, HO2, CO etc.). Some of these species are relatively stable (e.g., CO), while
others are unstable (e.g., OH) and react rapidly with other compounds. The unstable species are
mainly radicals (i.e., they have an unpaired valence electron), and they are crucial to
understanding the progress of combustion. Radicals also govern the formation of NOx during
combustion. The main elements of solid fuel carbon (C) and hydrogen (H) will end up as CO2
and H2O regardless of how the combustion progresses, as long as combustion is complete.
However, nitrogen (N) may be converted to NOx or N2 depending on the progress of the
combustion process and the distribution of radicals. The composition of the radical pool is
dependent upon the kinetics of the relevant reactions, which in turn are dependent upon the rate
constants and the availability of reactants. The rate constant is commonly described by the
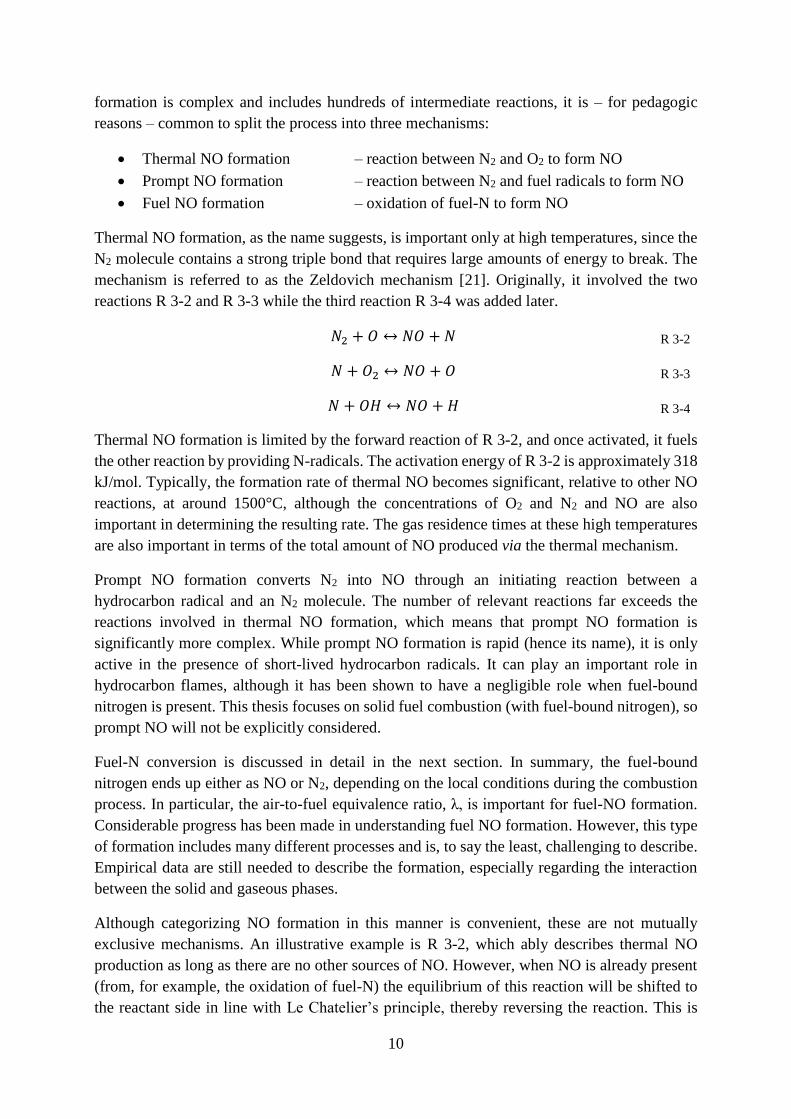
modified Arrhenius expression:
𝑘 = 𝐴𝑇𝑛𝑒−
𝐸𝑎𝑅𝑇 Eq. 1
where k is the rate constant, A and n are constants that describe the pre-exponential factor, T is
the temperature, Ea is the activation energy and R is the gas law constant. For many reactions,
n is assumed to be zero. Mathematically, this expression gives that the rate constant (and thus
the reaction rate) increases exponentially with temperature, as long as the activation energy is
not zero and the temperature is less than the value of Ea/2R. A high activation energy results in
low rates at low temperatures. This expression is the most common way to express chemical
reaction rates, although other expressions exist, for example, surface reactions.
NOx is dominated by NO at the high temperatures involved in combustion processes. Therefore,
research on NOx is concerned with the formation and destruction of NO rather than NO2.
However, the emitted NO rapidly converts to NO2 at lower temperatures. This chapter describes
the NO chemistry during combustion and discuss the influences of combustion parameters. The
focus here is on solid fuel combustion, as solid fuels are the most commonly used in the Grate-
Kiln process.
3.1 NO formation routes
NO can be formed from either the nitrogen gas (N2) introduced with the air or the nitrogen
introduced with the fuel (fuel-N). When firing gaseous or liquid fuels, it may be assumed that
all the generated NO originates from N2, due to the absence or low level of fuel-N. In contrast,
fuel-N is usually the main contributor to NO in solid fuel combustion [20]. Although NO
Page 20
10
formation is complex and includes hundreds of intermediate reactions, it is – for pedagogic
reasons – common to split the process into three mechanisms:
Thermal NO formation – reaction between N2 and O2 to form NO
Prompt NO formation – reaction between N2 and fuel radicals to form NO
Fuel NO formation – oxidation of fuel-N to form NO
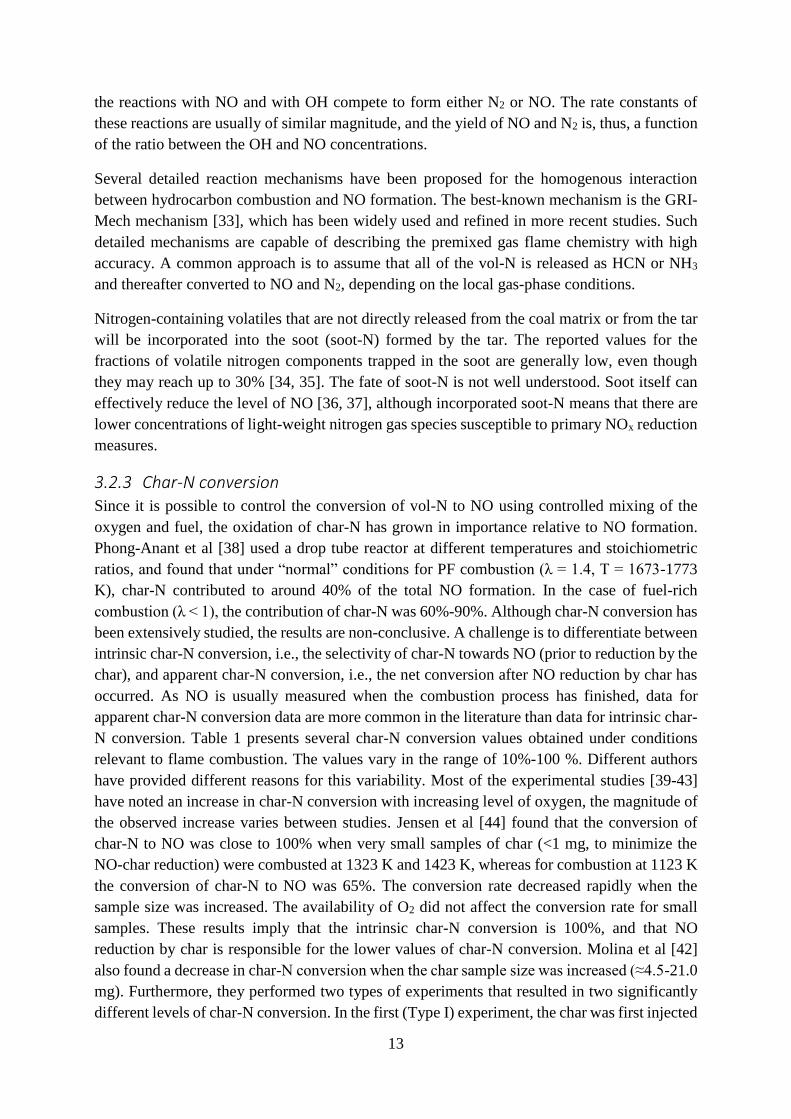
Thermal NO formation, as the name suggests, is important only at high temperatures, since the
N2 molecule contains a strong triple bond that requires large amounts of energy to break. The
mechanism is referred to as the Zeldovich mechanism [21]. Originally, it involved the two
reactions R 3-2 and R 3-3 while the third reaction R 3-4 was added later.
𝑁2 + 𝑂 ↔ 𝑁𝑂 + 𝑁 R 3-2
𝑁 + 𝑂2 ↔ 𝑁𝑂 + 𝑂 R 3-3
𝑁 + 𝑂𝐻 ↔ 𝑁𝑂 + 𝐻
R 3-4
Thermal NO formation is limited by the forward reaction of R 3-2, and once activated, it fuels
the other reaction by providing N-radicals. The activation energy of R 3-2 is approximately 318
kJ/mol. Typically, the formation rate of thermal NO becomes significant, relative to other NO
reactions, at around 1500°C, although the concentrations of O2 and N2 and NO are also
important in determining the resulting rate. The gas residence times at these high temperatures
are also important in terms of the total amount of NO produced via the thermal mechanism.
Prompt NO formation converts N2 into NO through an initiating reaction between a
hydrocarbon radical and an N2 molecule. The number of relevant reactions far exceeds the
reactions involved in thermal NO formation, which means that prompt NO formation is
significantly more complex. While prompt NO formation is rapid (hence its name), it is only
active in the presence of short-lived hydrocarbon radicals. It can play an important role in
hydrocarbon flames, although it has been shown to have a negligible role when fuel-bound
nitrogen is present. This thesis focuses on solid fuel combustion (with fuel-bound nitrogen), so
prompt NO will not be explicitly considered.
Fuel-N conversion is discussed in detail in the next section. In summary, the fuel-bound
nitrogen ends up either as NO or N2, depending on the local conditions during the combustion
process. In particular, the air-to-fuel equivalence ratio, λ, is important for fuel-NO formation.
Considerable progress has been made in understanding fuel NO formation. However, this type
of formation includes many different processes and is, to say the least, challenging to describe.
Empirical data are still needed to describe the formation, especially regarding the interaction
between the solid and gaseous phases.
Although categorizing NO formation in this manner is convenient, these are not mutually
exclusive mechanisms. An illustrative example is R 3-2, which ably describes thermal NO
production as long as there are no other sources of NO. However, when NO is already present
(from, for example, the oxidation of fuel-N) the equilibrium of this reaction will be shifted to
the reactant side in line with Le Chatelier’s principle, thereby reversing the reaction. This is
Page 21
11
mentioned in the review of Glarborg [22] with reference to the work of Pershing and Wendt
[20], and temperatures as high as 2200 K could be required for thermal NO to contribute
significantly when coal dust flames are used. Given these types of interactions, determining the
contribution of each NO mechanism to the total NO formation is not a trivial task.
3.2 Fuel-N evolution during solid fuel combustion
A solid fuel particle undergoes several processing steps during combustion. In a pulverized fuel
(PF) flame, the particle is heated through convection and radiation from the upstream flame as
well as the walls, and the water contained in the particle starts to evaporate. For small particles,
as in PF flames, this process occurs rapidly (takes a couple of milliseconds). Once the drying is
completed, the particle temperature increases, the particle starts to decompose, and volatile
compounds contained in the particle escape from the solid fuel matrix. This process is called
‘devolatilization’ or ‘pyrolysis’, depending on whether oxygen is present or not. For bituminous
coal particles, significant pressure builds up inside the particle, which causes it to swell or
fracture. The products of devolatilization are volatiles and char. The volatiles, which comprise
light-weight gases (such as CO and CH4) and tars (heavier hydrocarbons), react with oxygen to
form a small flame envelope around the remaining particle. The processes of devolatilization
and volatile combustion occur on a time-scale similar to that of the drying process. The solid
fraction of the particle remains after devolatilization is called ‘char’, and it consists mainly of
carbon and ash, although small amounts of other elements are also present. When the
combustion of volatiles is complete and the flame envelope is gone, oxygen reaches the surface
of the char and may diffuse into the pores. Heterogeneous reactions between the solid and the
gaseous oxygen occur, and the products consist mainly of CO and CO2. The time-scale for char
combustion is considerably longer than those of the previous processes, and usually takes
hundreds of milliseconds to reach completion.
The fuel-bound nitrogen is released either with the volatiles or with the char, and the conversion
to NO or N2 will depend on the local conditions. The following sections will cover the
partitioning of nitrogen between volatiles (vol-N) and char (char-N), followed by an
examination of the formation of NO from vol-N and char-N. Thereafter, the reduction of NO is
discussed.
3.2.1 Nitrogen partitioning during pyrolysis The partitioning of nitrogen during pyrolysis is important for NO formation, since the
combustion process and the possibility for NOx control differ substantially between volatile-
and char-bound nitrogen. Different conditions yield different volatile products, and there is
consensus regarding the importance of the pyrolysis temperature in dictating the amount of
fuel-N that is retained in the char. Figure 3 presents the amounts of nitrogen that are lost with
the volatiles during pyrolysis, based on the works of Zhang and Fletcher [23], Blair et al [24],
Pohl et al [25], Solomon and Colket [26], and Kambara et al [27]. Even though there is a clear
trend towards more nitrogen leaving with the volatiles at higher pyrolysis temperatures, there
are considerable differences between the test series. Blair et al [24] also compared the release
rate of nitrogen to the release rate of total mass (which also increases with temperature) during
Page 22
12
pyrolysis, and concluded that nitrogen release is more sensitive than mass release to
temperature.
Figure 3. Nitrogen loss as a function of pyrolysis temperature. The data are taken from the indicated publications
in the literature [23-27]. Trend lines are shown for each investigated coal.
As seen from the wide range of data-points in Figure 3, the fraction of nitrogen that leaves with
the volatiles is not predictable when it is based solely on the pyrolysis temperature. Kambara et
al [27] have stated that it is impossible to predict the partitioning of volatile nitrogen based on
proximate and ultimate analyses, as they found that two coals with the same levels of nitrogen
and volatile matter yielded two different fractions. However, since then, several models have
been developed with reasonable success to predict the composition and yield of volatiles based
on the chemical structures of coals. Three commonly used pyrolysis models are FG-DVC [28],
FLASHCHAIN [29], and CPD [30].
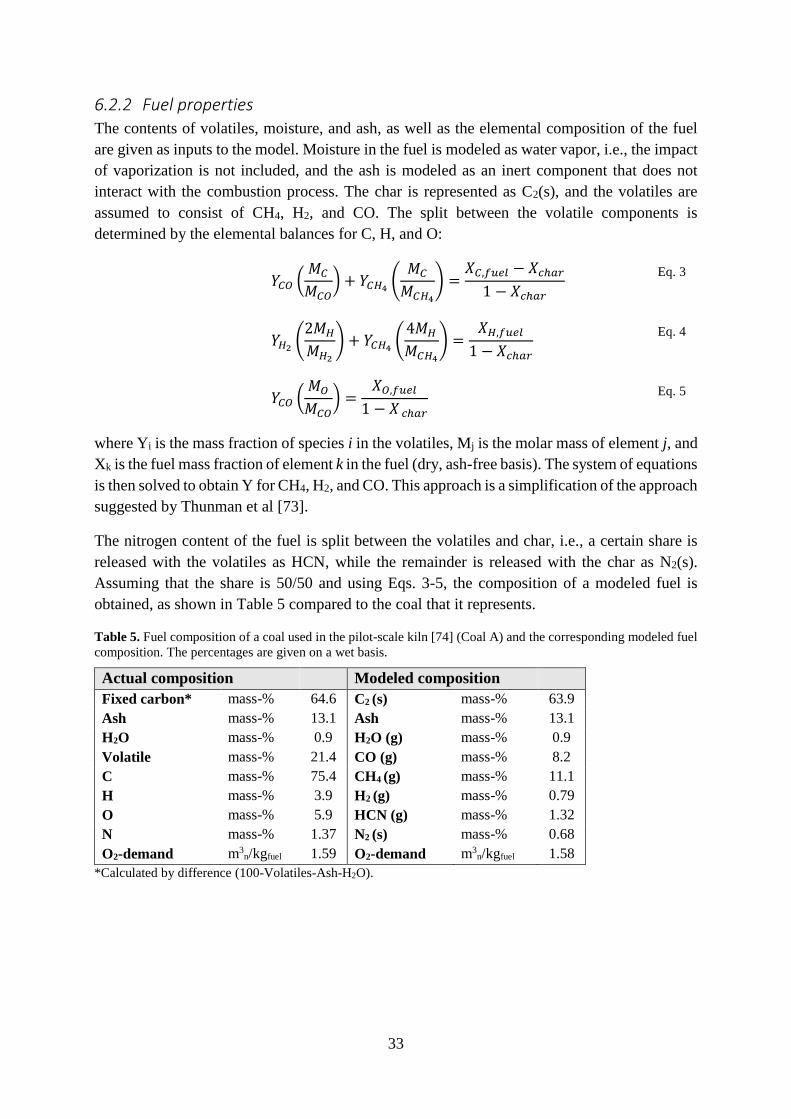
3.2.2 Vol-N conversion The nitrogen-containing volatiles (vol-N) evolve mainly as light-weight nitrogen species (HCN
or NH3), either directly from the coal matrix or indirectly from the tar formed during pyrolysis,
and thereafter reacts with radicals to form either NO or N2. The conversion of light-weight
nitrogen gas species to NO is largely dependent upon the availability of oxygen. The conversion
varies from 0% to 100% depending on the local stoichiometry (i.e., oxygen-rich or oxygen-
lean) [25, 31]. Thus, if left uncontrolled, vol-N can be a significant contributor to total NO
formation. Given that local stoichiometry has such a significant impact, it is beneficial to design
burners and combustion equipment to achieve oxygen-lean combustion zones, so as to reduce
net NO formation. Miller and Bowman [32] have provided a thorough assessment of the
oxidation of light-weight nitrogen species, and the major reaction pathways for HCN and NH3
have been confirmed: nitrogen atoms in HCN or NH3 end up as N radicals, which then react
either with OH to form NO or with NO to form N2. In other words, when N radicals are formed,
Page 23
13
the reactions with NO and with OH compete to form either N2 or NO. The rate constants of
these reactions are usually of similar magnitude, and the yield of NO and N2 is, thus, a function
of the ratio between the OH and NO concentrations.
Several detailed reaction mechanisms have been proposed for the homogenous interaction
between hydrocarbon combustion and NO formation. The best-known mechanism is the GRI-
Mech mechanism [33], which has been widely used and refined in more recent studies. Such
detailed mechanisms are capable of describing the premixed gas flame chemistry with high
accuracy. A common approach is to assume that all of the vol-N is released as HCN or NH3
and thereafter converted to NO and N2, depending on the local gas-phase conditions.
Nitrogen-containing volatiles that are not directly released from the coal matrix or from the tar
will be incorporated into the soot (soot-N) formed by the tar. The reported values for the
fractions of volatile nitrogen components trapped in the soot are generally low, even though
they may reach up to 30% [34, 35]. The fate of soot-N is not well understood. Soot itself can
effectively reduce the level of NO [36, 37], although incorporated soot-N means that there are
lower concentrations of light-weight nitrogen gas species susceptible to primary NOx reduction
measures.
3.2.3 Char-N conversion Since it is possible to control the conversion of vol-N to NO using controlled mixing of the
oxygen and fuel, the oxidation of char-N has grown in importance relative to NO formation.
Phong-Anant et al [38] used a drop tube reactor at different temperatures and stoichiometric
ratios, and found that under “normal” conditions for PF combustion (λ = 1.4, T = 1673-1773
K), char-N contributed to around 40% of the total NO formation. In the case of fuel-rich
combustion (λ < 1), the contribution of char-N was 60%-90%. Although char-N conversion has
been extensively studied, the results are non-conclusive. A challenge is to differentiate between
intrinsic char-N conversion, i.e., the selectivity of char-N towards NO (prior to reduction by the
char), and apparent char-N conversion, i.e., the net conversion after NO reduction by char has
occurred. As NO is usually measured when the combustion process has finished, data for
apparent char-N conversion data are more common in the literature than data for intrinsic char-
N conversion. Table 1 presents several char-N conversion values obtained under conditions
relevant to flame combustion. The values vary in the range of 10%-100 %. Different authors
have provided different reasons for this variability. Most of the experimental studies [39-43]
have noted an increase in char-N conversion with increasing level of oxygen, the magnitude of
the observed increase varies between studies. Jensen et al [44] found that the conversion of
char-N to NO was close to 100% when very small samples of char (<1 mg, to minimize the
NO-char reduction) were combusted at 1323 K and 1423 K, whereas for combustion at 1123 K
the conversion of char-N to NO was 65%. The conversion rate decreased rapidly when the
sample size was increased. The availability of O2 did not affect the conversion rate for small
samples. These results imply that the intrinsic char-N conversion is 100%, and that NO
reduction by char is responsible for the lower values of char-N conversion. Molina et al [42]
also found a decrease in char-N conversion when the char sample size was increased (≈4.5-21.0
mg). Furthermore, they performed two types of experiments that resulted in two significantly
different levels of char-N conversion. In the first (Type I) experiment, the char was first injected
Page 24
14
into a helium atmosphere and pyrolyzed (low levels of NO and CO exited the char) for 60 s,
and then an O2/He mixture was injected to facilitate combustion. In the second (Type II)
experiment, the char was injected directly into a stream of O2/He. The Type I experiments
resulted in char-N conversion values in the range of 10%-15%, while the Type II experiments
gave values in the range of 40%-55%. The authors attributed this difference to the lower local
stoichiometry used in the Type I experiments leading to an increase in the homogenous
reduction mechanism that involves HCN. The importance of HCN for char-N conversion is not
established, although modeling conducted by some groups (see for example [45, 46]) have
shown that assuming HCN to be the primary product from char-N provides good results.
Another common approach is to use NO as the primary product obtained from char-N, with
subsequent reduction by char.
Additional combustion issues are discussed by Shimizu et al [47], who showed that the
conditions during char production affect the final conversion of char-N to NO, and Spinti and
Perching [40] have taken this as an explanation for the differences observed in the literature.
Jensen et al [45, 46] have shown that NO-char reduction is significantly faster directly after
pyrolysis than when the char has been prepared separately, as is the case in most NO-char
reduction studies.
Table 1. Experimental values for char-N conversion to NO relevant to PF combustion, as taken from the literature.
Authors Apparatus Set temperature [K] Char-N conversion (%)
Perching and Wendt [41] Combustor 10-15
Spinti and Perching [40] Combustor 40-60
Nelson et al [43] Combustor 35-80*
Song et al [39] EFR 1250-1750 20-35*
Molina et al [42] EFR 1698 10-55
Phong-anant et al [38] EFR 1273-1873 30-50
Pohl et al [25] EFR 1500 1-20*
Wang et al [48] EFR 1273 10-45
Jensen et al [44] Fixed bed 1123-1423 10-100
* Only values for λ>1 are taken. Lower values were obtained when λ was <1.
EFR: Entrained Flow Reactor (includes drop tube reactors).
As char-N conversion is closely linked to char conversion, a brief overview of char combustion
is presented here. Char combustion may be divided into three zones based on the limiting rate.
In Zone I, the char conversion rate is kinetically controlled and increases rapidly with
temperature. In Zone III, the rate is controlled by the mass transport of oxygen to the char and
is less dependent upon the temperature. Zone II represents conditions in which both kinetic and
oxygen transport rates are important. High temperatures move the combustion towards Zone
III, since the chemical reaction rates increase, making mass transport the limiting factor. In
contrast, using small particles moves the combustion towards Zone I, as the specific diffusive
mass flux to the particle is increased, thereby promoting more rapid mass transport. High
temperatures and small particles are present in pulverized coal combustion, and these systems
are generally well represented by the conditions characteristic of Zone II [49]. Due to the
abovementioned factors, it is clear that it is complicated to describe char oxidation over a wide
range of temperatures and combustion conditions, especially with respect to the partial pressure
Page 25
15
of oxygen. In general, neither global power-law kinetics nor semi-global Langmuir-
Hinshelwood kinetics describe with sufficient accuracy the temperature dependence. Instead,
more complex models are required, some of which attempt to maintain the dependence on just
temperature and concentrations [50], while others include dimensionless numbers and specific
coal parameters [51].
3.2.4 NO reduction Since it is most common to report the values for apparent char-N conversion, which is primarily
a function of NO reduction by char if the intrinsic char-N conversion is 100%, it is worthwhile
to discuss the NO reduction mechanisms. It is convenient to divide the NO reduction process
during solid fuel combustion into reduction by volatiles and reduction by char, as these
reactions occur on different time-scales. NO reduction by volatiles is important and is the main
reason why air staging achieves significant reductions in NO, i.e., by prolonging the zone in
which NO can interact with the radicals formed by the volatile compounds. This mechanism is
also used when fuel staging is applied, i.e., introducing a fuel (e.g., natural gas) downstream of
the initial combustion zone. The reduction of NO may occur by reaction with N-containing
species (such as NHi) or N-free species (such as CHi) [52]. In those combustion systems in
which fuel staging is not applied, NO reduction by volatiles only affects the NO formed during
the early stage of combustion, while the NO formed subsequently is not affected.
In contrast, the reduction of NO by char affects a larger fraction of the formed NO, since the
char reactions occur on a longer time-scale. Many studies have been conducted on NO reduction
by char and carbonaceous materials, and several of those studies have suggested a decrease in
the apparent NO conversion as the background NO level is increased, i.e., the (NOout-
NOin)/char-N ratio decreases significantly as the initial NO concentration increases [40, 42, 45,
53]. Some of these studies have even observed negative rates of apparent conversion of char-
N, i.e., more NO is reduced by the char than is formed by the char-N [40, 45]. This reduction
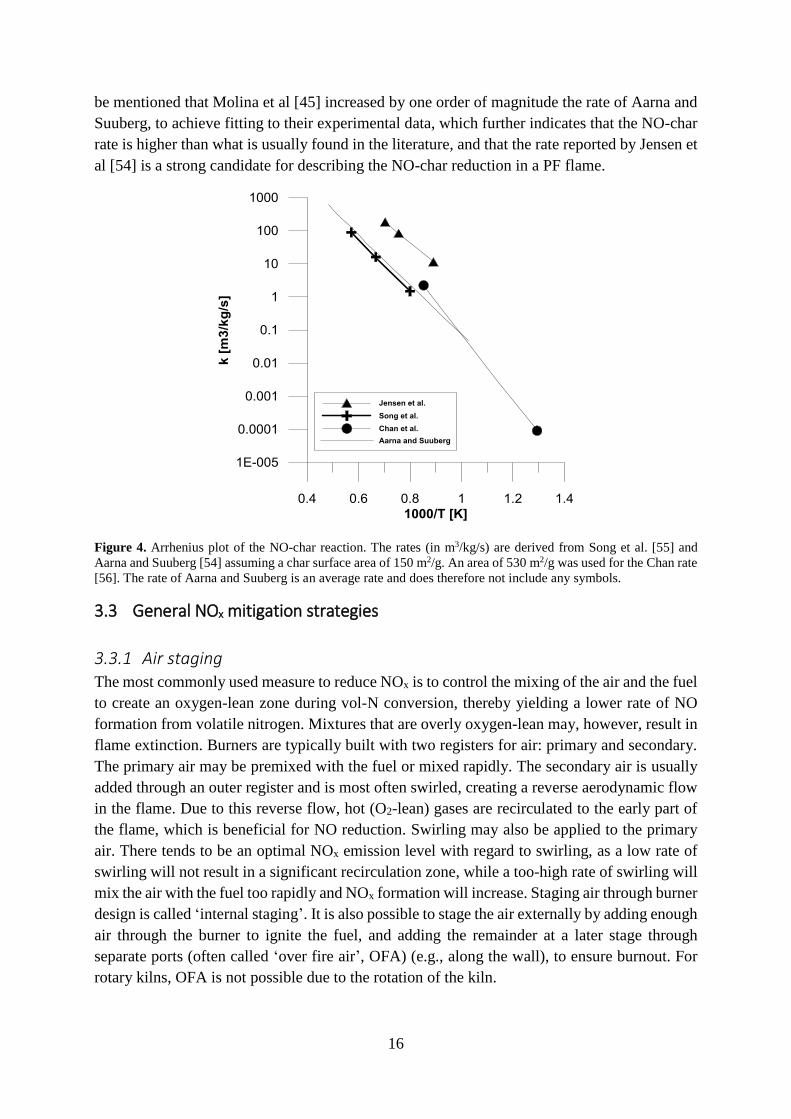
appears to be enhanced in the presence of CO [46]. Aarna and Suuberg [54] have reviewed the
studies on NO-char kinetics in the literature and averaged the rates; the resulting rate constant
is shown in Figure 4 along with selected constants. Most of the rates found in the literature are
within one order of magnitude of the Aarna and Suuberg rate. However, most of the studies
have used chars that have been prepared prior to the experiments. Jensen et al [44] have shown
that the rate of NO-char reduction decreases continuously in the time-span after pyrolysis, due
to some deactivation mechanism, and that the rate directly after pyrolysis is significantly higher
than that usually reported in studies in which the chars have been prepared separately. The rate
reported by Song [55] is included in the figure, since it was obtained from experiments
performed in the temperature range relevant to the conditions in a rotary kiln. The rate reported
by Jensen et al [44] is shown for comparison, and this rate is also applied in the modeling of
this thesis. While it is significantly higher than the average rate provided by Aarna and Suuberg
[54], it is derived in one of the few studies in which the char was produced in situ with NO-
char reactions proceeding directly afterwards. The rate described by Chan [56] was obtained at
lower temperatures. Nonetheless, it is recommended by Visona and Stanmore [46] for
pulverized fuel combustion carried out at around 1750 K. Extrapolating this rate to higher
temperatures results in a rate similar to that found by Jensen and co-workers. Finally, it should
Page 26
16
be mentioned that Molina et al [45] increased by one order of magnitude the rate of Aarna and
Suuberg, to achieve fitting to their experimental data, which further indicates that the NO-char
rate is higher than what is usually found in the literature, and that the rate reported by Jensen et
al [54] is a strong candidate for describing the NO-char reduction in a PF flame.
Figure 4. Arrhenius plot of the NO-char reaction. The rates (in m3/kg/s) are derived from Song et al. [55] and
Aarna and Suuberg [54] assuming a char surface area of 150 m2/g. An area of 530 m2/g was used for the Chan rate
[56]. The rate of Aarna and Suuberg is an average rate and does therefore not include any symbols.
3.3 General NOx mitigation strategies
3.3.1 Air staging The most commonly used measure to reduce NOx is to control the mixing of the air and the fuel
to create an oxygen-lean zone during vol-N conversion, thereby yielding a lower rate of NO
formation from volatile nitrogen. Mixtures that are overly oxygen-lean may, however, result in
flame extinction. Burners are typically built with two registers for air: primary and secondary.
The primary air may be premixed with the fuel or mixed rapidly. The secondary air is usually
added through an outer register and is most often swirled, creating a reverse aerodynamic flow
in the flame. Due to this reverse flow, hot (O2-lean) gases are recirculated to the early part of
the flame, which is beneficial for NO reduction. Swirling may also be applied to the primary
air. There tends to be an optimal NOx emission level with regard to swirling, as a low rate of
swirling will not result in a significant recirculation zone, while a too-high rate of swirling will
mix the air with the fuel too rapidly and NOx formation will increase. Staging air through burner
design is called ‘internal staging’. It is also possible to stage the air externally by adding enough
air through the burner to ignite the fuel, and adding the remainder at a later stage through
separate ports (often called ‘over fire air’, OFA) (e.g., along the wall), to ensure burnout. For
rotary kilns, OFA is not possible due to the rotation of the kiln.
Page 27
17
3.3.2 Fuel staging Introducing part of the total fuel input at a later stage in the combustor enables the formed NO
to be reduced by, for example, hydrocarbon radicals (CHi). The mechanism is called
‘reburning’, and it has proved to be an efficient way to reduce NOx. The reburn fuel is typically
natural gas, although solid fuels may also be used as long as they ignite readily and mix well.
The reburn zone is generally sub-stoichiometric and additional air has to be added after this
zone. Although fuel staging is generally performed externally, it is also possible to apply
internal fuel staging using burners with different fuel registers.
3.3.3 Fuel switch Since fuel-N is a significant contributor to NO formation in PF flames, a simple measure that
is often used is to switch to a fuel that contains less nitrogen. Switching from a solid fuel to a
gaseous fuel tends to decrease significantly the NOx emissions. However, the linkage between
the fuel-N content in solid fuels and NO emissions is weak, as fuel-N conversion depends on
many other aspects. Thus, changing to a solid fuel with a lower nitrogen content does not
guarantee a lower level of NOx formation. The content of volatiles has, for example, been shown
to play a significant role. In unstaged flames, a higher volatile content leads to higher NO
emissions, whereas for staged flames the opposite trend is observed. The reason for this is that
a fuel that has a high content of volatiles is likely to release more volatile nitrogen, and if air
staging is achieved it will affect a larger fraction of the total fuel-bound nitrogen. Other fuel
properties, such as particle size and ash content, can also play important roles, so it is difficult
to predict the effect on NO of a fuel swap.
Another possibility is to co-combust the fuels. Apart from reducing the amount of incoming
fuel-N, the interaction between the two fuels has the potential to create NO reduction by
forming additional, local O2-deficient zones. In theory, a volatile fuel with low nitrogen content
could be manipulated so that a reducing zone is formed at an optimum location, thereby
reducing the fuel-N conversion from the other fuel [57]. Co-combustion also facilitates the
combustion of certain fuels that may be difficult to ignite. Using a small amount of gaseous fuel
can, for example, stabilize a solid fuel flame.
3.3.4 Other primary measures The relationship between stoichiometry and NO formation is clear; a lower stoichiometry
(air/fuel) results in a lower level of NO formation, which means that decreasing the overall
excess of air an effective measure. Although it is always the local stoichiometry that determines
the level of fuel-N conversion, the global stoichiometry controls the ease with which local O2-
lean zones can be created. The stoichiometry in the early part of combustion can, as mentioned,
be controlled effectively through burner design, whereas the stoichiometry in the later stages is
less sensitive to such changes. However, decreasing the global stoichiometry lowers the O2
levels post-flame inherently.
Another possibility is to recirculate the O2-lean flue gases through the burner. This has three
potential benefits for NO reduction: the reduction in O2 concentration leads to decreased
oxidation of fuel-N, as well as a lower temperature (reducing the thermal-NO mechanism), and
the recirculation enables a reduction in the NO levels through reburning. Substantial reductions
Page 28
18
in NO levels have been attained in oil- and gas-fired boilers owing to the decrease in thermal-
NO formation, while this strategy has proven to be less effective for solid fuels [58].
3.3.5 Secondary measures If NOx emissions cannot be reduced effectively using primary measures, flue gas cleaning may
be necessary. This is performed by adding ammonia (NH3), which reacts with NO to form N2.
Urea [CO(NH2)2] is also used, since it decomposes to NH3 but is safer to handle. The reaction
between NO and NH3 is highly temperature-dependent, and it is most efficient at temperatures
in the range of 900°-1100°C. At higher temperatures, the oxidation of ammonia becomes more
prominent, which can result in increased NO emissions, while at lower temperatures, the
reaction may not proceed to completion and ammonia may be emitted (so-called ‘ammonia
slip’).
The reduction of NO by NH3 is possible at lower temperatures (200°-500°C) if a catalyst is
present. This is selective catalytic reduction (SCR), and it can provide significant NOx
reduction. The reduction without a catalyst is called selective non-catalytic reduction (SNCR)
and is less common in industrial systems.
3.4 Units of emission measurements
Several units for quantifying NOx emissions are used depending on application. A common unit
in research is the volumetric gas fraction of NOx given in ppm as it is the unit employed by
most measurement instruments. The volumetric gas fraction is equivalent to the molar gas
fraction and proportional to the partial pressure and concentration. The latter is, however,
dependent on system conditions like pressure and temperature. The concentration and partial
pressure are useful units as they determine the rate of reactions. It may also be of interest to
look at the ratio of emitted NOx to introduced fuel-N, since this relates to the performance of
the combustion process with regard to NOx emission. The NOx to fuel-N ratio is used in Papers
I and II.
Neither of these units directly quantifies the amount of NOx formed in the process as they
depend on the flue gas flow. A common approach to avoid this is to correct NOx fraction to a
certain base oxygen level. This correction is performed according to:
𝑥𝑁𝑂𝑥,𝑐𝑜𝑟𝑟𝑒𝑐𝑡𝑒𝑑 = 𝑥𝑁𝑂𝑥∗
𝑥𝑂2,𝑜𝑥 − 𝑥𝑂2,𝑏𝑎𝑠𝑒
𝑥𝑂2,𝑜𝑥 − 𝑥𝑂2
Eq. 2
where 𝑥𝑁𝑂𝑥,𝑐𝑜𝑟𝑟𝑒𝑐𝑡𝑒𝑑 is the corrected molar NOx fraction, 𝑥𝑁𝑂𝑥 is the measured molar NOx
fraction, 𝑥𝑂2 is the measured molar O2 fraction, 𝑥𝑂2,𝑜𝑥 is the oxygen molar fraction in the
oxidizer (≈0.21 for air), and 𝑥𝑂2,𝑏𝑎𝑠𝑒 is the base oxygen fraction to which the emission should
be corrected (0.06 for solid fuels within the EU).
It is also common to use the unit mgNO2/m3
n instead of the molar fraction. This unit is equivalent
to the molar fraction and the conversion is obtained by applying the ideal gas law and assuming
that all the NO is converted to NO2. Correction to a base oxygen level might still be necessary,
and it is also performed using Eq. 2.
Page 29
19
Another common practice is to relate the emitted NOx to the energy input, i.e., mgNO2/MJfuel.
An advantage of using this unit system is that correction to a certain oxygen level is not needed.
It does, however, depend on accurate measurements of the flue gas flow and the fuel feed,
which are not always available. Attention must also be paid to the specific heating value (lower
or higher) on which the unit is based.
For the Grate-Kiln process, use of the molar fraction or mgNO2/m3n corrected to a certain oxygen
level should be avoided, as the product (the pellets) absorb a certain amount of oxygen, thereby
introducing an error when attempting to correct the NOx measurement (see Appendix A for
proof). Nonetheless, this approach is used in Paper I for comparison with European emission
legislation, as there were no pellets present in the pilot-scale kiln used in the experiments. A
unit that is commonly used in industrial production processes is NOx/unit of production. In the
Grate-kiln process, this is expressed as gNO2/tonne pellets, and it may be advantageous because
it incorporates the production efficiency of the plant. It is, however, difficult to compare NOx
emissions across different industries using this unit system.
Units corrected to a certain oxygen level or related to the energy input are often used in
legislation aimed at industrial applications; the review of Baukal and Eleazer [59] provides
more details. Finally, it should be noted that these units indicate the environmental performance
of individual plants, and that using them in designing legislation incentivizes the use of BAT.
The environmental impact on a regional or global level is, however, more sensitive to the
absolute amount of NOx emitted than to the concentrations in flue gases, i.e., for evaluating the
degree of pollution, kgNO2/year is superior to mgNO2/m3
n. The Gothenburg protocol and
Directive 2016/2284/EU use units of ktonNO2/year.
Page 31
21
4 Previous work on NOx in rotary kilns
In addition to their application in iron ore manufacturing, rotary kilns are used in cement
production, lime manufacturing, lightweight aggregate manufacturing, reduction of oxide ore,
and waste incineration [60]. The most common application is in the cement industry, and most
of the research on combustion in kilns has been performed using cement kilns. This section
provides an overview of the research on cement kilns and on the iron ore kiln. It should be noted
that although both industries use rotary kilns, there are significant differences in terms of their
design and use: sintering cement clinker requires a bed temperature of about 1450°C and the
flue gas oxygen concentration is 2%-4%, whereas iron ore is sintered at around 1300°C and
employs a level of excess air equivalent to 15%-17% oxygen in the flue gases.
4.1 Cement industry
Among the various studies of NOx control in cement manufacturing, there is a consensus that
thermal NO formation dominates NO formation in the rotary kiln, and intensive efforts have
been made to reduce the levels of NOx in other parts of the process (specifically, the
precalciner). However, emissions-related legislation has motivated research also on the kiln.
Vaccaro [61] reviewed NOx campaigns conducted in industrial cement kilns and concluded that
significant NOx reductions could be achieved through the use of low-NOx burners. In kiln
systems, these burners have two primary air inlets (one is swirling and one is axial) and one
fuel inlet. The amount of primary air used was considered to be especially important. The NOx
emission levels could be reduced by 45% (compared to a mono-channel burner) by lowering
the amount of primary air while maintaining stable operation. Further reductions could be
achieved (up to 54%), although this entailed unstable operation. In a review performed by
McQueen et al [62], decreasing the level of primary air was shown to have the potential to
reduce NOx levels by 30%. Other primary measures were found to contribute NOx reductions
of 15%-30%, while the use of SNCR and SCR could reduce NOx levels by 40%-70% and 70%-
90%, respectively.
Both the European Union and the US Environmental Protection Agency have published
documents on NOx control in the cement industry that include several proposed measures [63,
64]. One measure that is unique to rotary kilns is a fuel switch from gas to coal. A gas-fired
cement kiln could achieve a decrease of up to 70% in NOx emissions by switching the fuel to
coal [63]. Reducing the amount of excess air (i.e., the flue gas oxygen concentration is reduced
from 2% to 1%) was shown to decrease the levels of NOx by 15%. An innovative NOx strategy
that has been discussed is fuel staging by means of “mid-kiln firing”, which entails the use of a
fuel inlet through the wall half-way along the rotary kiln. This allows slow-burning fuels, such
as whole tires, to be introduced once per rotation of the kiln. Since the energy input by the kiln
inlet can be reduced by this measure, the combustion is dispersed and the level of NOx is
reduced by as much as 50%. The use of low-NOx burners does not always yield reductions in
NOx, but the reported values are up to 35%.
Page 32
22
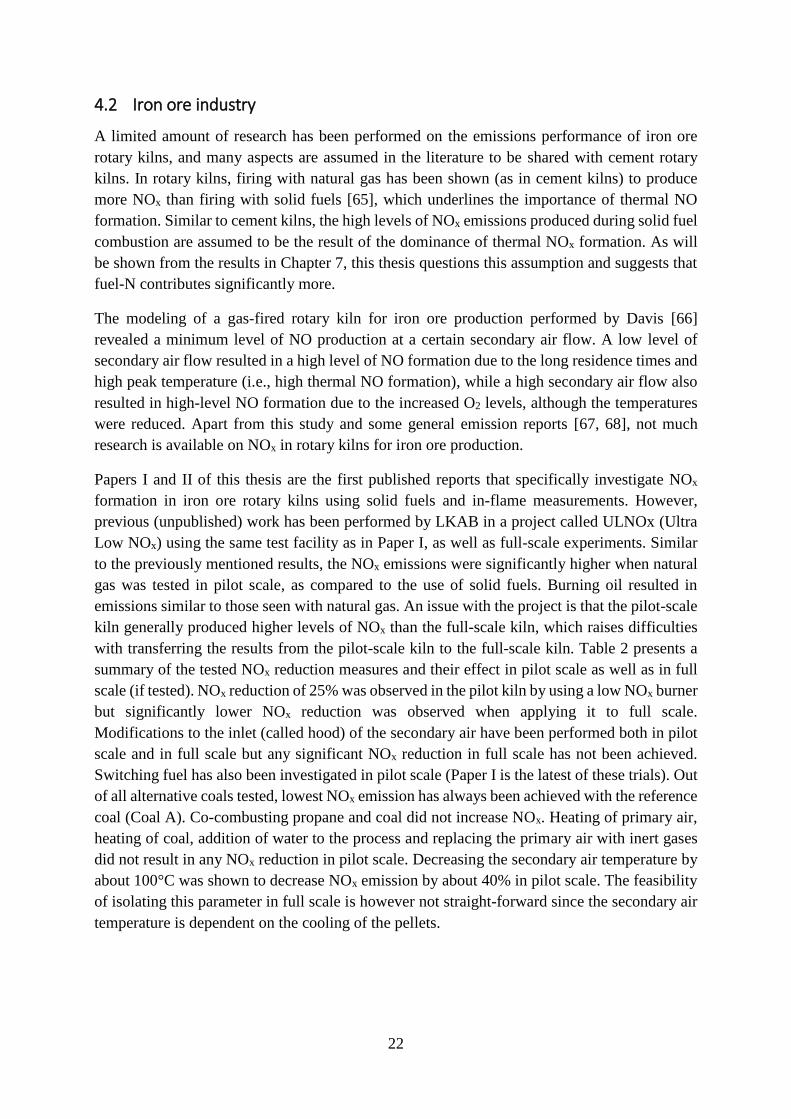
4.2 Iron ore industry
A limited amount of research has been performed on the emissions performance of iron ore
rotary kilns, and many aspects are assumed in the literature to be shared with cement rotary
kilns. In rotary kilns, firing with natural gas has been shown (as in cement kilns) to produce
more NOx than firing with solid fuels [65], which underlines the importance of thermal NO
formation. Similar to cement kilns, the high levels of NOx emissions produced during solid fuel
combustion are assumed to be the result of the dominance of thermal NOx formation. As will
be shown from the results in Chapter 7, this thesis questions this assumption and suggests that
fuel-N contributes significantly more.
The modeling of a gas-fired rotary kiln for iron ore production performed by Davis [66]
revealed a minimum level of NO production at a certain secondary air flow. A low level of
secondary air flow resulted in a high level of NO formation due to the long residence times and
high peak temperature (i.e., high thermal NO formation), while a high secondary air flow also
resulted in high-level NO formation due to the increased O2 levels, although the temperatures
were reduced. Apart from this study and some general emission reports [67, 68], not much
research is available on NOx in rotary kilns for iron ore production.
Papers I and II of this thesis are the first published reports that specifically investigate NOx
formation in iron ore rotary kilns using solid fuels and in-flame measurements. However,
previous (unpublished) work has been performed by LKAB in a project called ULNOx (Ultra
Low NOx) using the same test facility as in Paper I, as well as full-scale experiments. Similar
to the previously mentioned results, the NOx emissions were significantly higher when natural
gas was tested in pilot scale, as compared to the use of solid fuels. Burning oil resulted in
emissions similar to those seen with natural gas. An issue with the project is that the pilot-scale
kiln generally produced higher levels of NOx than the full-scale kiln, which raises difficulties
with transferring the results from the pilot-scale kiln to the full-scale kiln. Table 2 presents a
summary of the tested NOx reduction measures and their effect in pilot scale as well as in full
scale (if tested). NOx reduction of 25% was observed in the pilot kiln by using a low NOx burner
but significantly lower NOx reduction was observed when applying it to full scale.
Modifications to the inlet (called hood) of the secondary air have been performed both in pilot
scale and in full scale but any significant NOx reduction in full scale has not been achieved.
Switching fuel has also been investigated in pilot scale (Paper I is the latest of these trials). Out
of all alternative coals tested, lowest NOx emission has always been achieved with the reference
coal (Coal A). Co-combusting propane and coal did not increase NOx. Heating of primary air,
heating of coal, addition of water to the process and replacing the primary air with inert gases
did not result in any NOx reduction in pilot scale. Decreasing the secondary air temperature by
about 100°C was shown to decrease NOx emission by about 40% in pilot scale. The feasibility
of isolating this parameter in full scale is however not straight-forward since the secondary air
temperature is dependent on the cooling of the pellets.
Page 33
23
Table 2. Tested primary measures in the ULNOx project
Primary measure Description NOx reduction
pilot scale
NOx reduction
full scale
Low NOx burners 12 different burners
were tested
20-25% 0-12%
Kiln hood modifications Less intensive mixing of
secondary air
10-25% <10%
Decrease in secondary air
temperature
From 1080°C to 970°C 40% Not tested
Heating of primary air 170°C 0% Not tested
Heating of coal 85°C 0% Not tested
Propane co-fire 0% Not tested
Reducing excess air 7.5% reduction
55% reduction
72% reduction
Not tested
17%
33%
8.5%*
Not tested
Not tested
Reducing primary air 87% reduction 8.5%** Not tested
Increasing transport air
velocity
0% 0-16%
Primary air partly replaced
by steam, N2 or Ar
0% Not tested
Addition of water sprays
around burner
0% Not tested
Addition of water to the
secondary air
0% Not tested
Switching to gas ≈ -250%† Not tested
Switching to oil ≈ -250%† 25%***
* resulted in pellet quality problems
** using the reference burner. Larger reduction were seen with other burners
*** Oil is only used during startup and when operation issues occurs, which results in a high
uncertainty of this value † i.e. an increase in NOx emission
Page 35
25
5 Experimental equipment
This section describes the experimental facilities that are the basis of Paper I, as well as the
measuring equipment used.
5.1 Experimental Combustion Facility
The experimental work in this thesis has been performed using LKABs pilot-scale kiln, known
as the Experimental Combustion Facility (ECF). In Year 2013, the heat input of the ECF was
400 kWfuel but this was increased in Year 2015 to 580 kWfuel and a cooling system was added
to the bottom part of the kiln, to simulate the heat sink of pellets. Figure 5 is a schematic side-
view of the Year 2015 ECF, which is the version that will be referred to hereinafter. The kiln is
designed to replicate the combustion conditions in a full-scale rotary kiln. It is scaled down
from approximately 40 MWfuel with constant velocity scaling and has a diameter of 65 cm the
first 4 meters. The length of the entire facility is 14 m, and after the first 4 m the diameter
expands to 80 cm. The reason for extending the furnace is mainly to be able to perform e.g.
slagging measurements. The rotation of the kiln, as well as the pellets is not included in the
ECF. The ECF is equipped with both horizontally and vertically arranged access ports, which
were used during the campaigns for in-flame measurements of temperature, concentrations,
radiation, and heat flux. The temperature and concentration measurements in Paper I were
obtained at four measurement ports (MH0, MH1, MH3 and MH7).
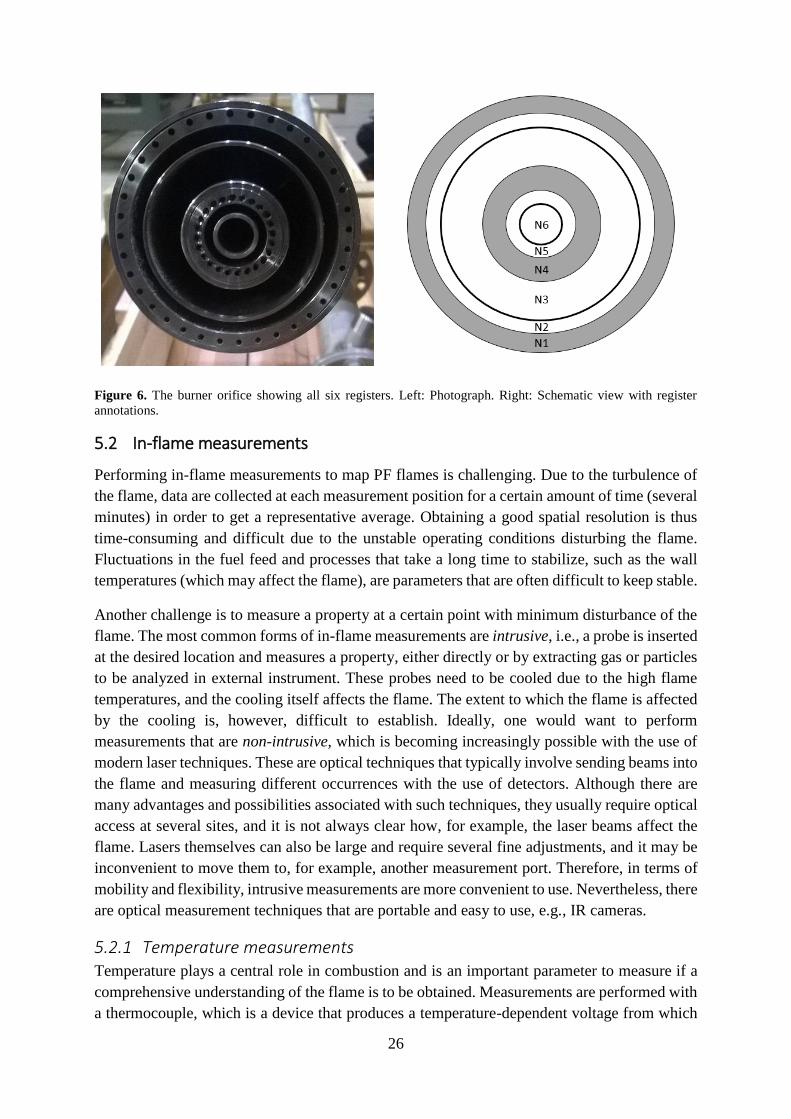
Hot secondary air enters through two channels located above and below the centrally positioned
burner (through which the primary air and fuel are introduced). The burner is shown in Figure
6 and has six registers: two for primary air, and four for fuel. One primary air register is swirled
(N4), while the other register introduces air axially (N1). Different fuel registers may be used
depending on which full-scale plant the ECF simulates. In Paper I, the central fuel register (N6)
was the most frequently used, although when co-combusting coal and biomass, coal was fed
through N3 and biomass was fed through N2.
Figure 5. Side view of the ECF, showing the distances from the burner to the measurement ports. Source: Paper I
Page 36
26
Figure 6. The burner orifice showing all six registers. Left: Photograph. Right: Schematic view with register
annotations.
5.2 In-flame measurements
Performing in-flame measurements to map PF flames is challenging. Due to the turbulence of
the flame, data are collected at each measurement position for a certain amount of time (several
minutes) in order to get a representative average. Obtaining a good spatial resolution is thus
time-consuming and difficult due to the unstable operating conditions disturbing the flame.
Fluctuations in the fuel feed and processes that take a long time to stabilize, such as the wall
temperatures (which may affect the flame), are parameters that are often difficult to keep stable.
Another challenge is to measure a property at a certain point with minimum disturbance of the
flame. The most common forms of in-flame measurements are intrusive, i.e., a probe is inserted
at the desired location and measures a property, either directly or by extracting gas or particles
to be analyzed in external instrument. These probes need to be cooled due to the high flame
temperatures, and the cooling itself affects the flame. The extent to which the flame is affected
by the cooling is, however, difficult to establish. Ideally, one would want to perform
measurements that are non-intrusive, which is becoming increasingly possible with the use of
modern laser techniques. These are optical techniques that typically involve sending beams into
the flame and measuring different occurrences with the use of detectors. Although there are
many advantages and possibilities associated with such techniques, they usually require optical
access at several sites, and it is not always clear how, for example, the laser beams affect the
flame. Lasers themselves can also be large and require several fine adjustments, and it may be
inconvenient to move them to, for example, another measurement port. Therefore, in terms of
mobility and flexibility, intrusive measurements are more convenient to use. Nevertheless, there
are optical measurement techniques that are portable and easy to use, e.g., IR cameras.
5.2.1 Temperature measurements Temperature plays a central role in combustion and is an important parameter to measure if a
comprehensive understanding of the flame is to be obtained. Measurements are performed with
a thermocouple, which is a device that produces a temperature-dependent voltage from which
Page 37
27
the temperature can be obtained. In theory, the thermocouple can be inserted directly into the
flame and will be heated by convection to the temperature of the flame. Unfortunately, it is
challenging to measure accurately, as the wall temperatures are lower than the flame
temperatures and this causes a significant radiative cooling effect on the thermocouple, which
results in a measurement error. This cooling effect can be reduced by shielding the
thermocouple with a ceramic shell. The shielding also protects the thermocouple from physical
damage by particles. Another measure that can be taken is to increase the convective heat
transfer from the flame by applying suction around the thermocouple, which reduces the relative
importance of the radiative loss. The gas velocity around the thermocouple should be around
200 m/s, so as to increase sufficiently the convective heat transfer. A drawback of applying
suction is that the volume of gas that is sucked out of the flame makes the measurement less of
a point measurement.
For the measurements performed in Paper I, a triple-shielded thermocouple of type B (suitable
for T<1800°C) was mounted on a cooled probe with suction. The probe was then traversed
across the flame. Even when the convective heat transfer was increased by suction, a waiting
period of around 4 minutes was required for the thermocouple to stabilize at each measurement
point. Figure 7 shows a schematic view of the suction pyrometer as well as a picture of the
ceramic shield after an in-flame measurement.
Figure 7. Top panel: Schematic of the probe showing how the thermocouple is protected by ceramics. Courtesy
of Adrian Gunnarsson [69]. Bottom panel: Photograph of the protective ceramic around the thermocouple. The
gas inlet is on the other side and is therefore not visible in this shot. Hot coal particles adhere to the ceramics after
the measurements.
Cooling water outletCooling water inlet
Flue gas outletThermocouple
Page 38
28
5.2.2 Gas composition measurements There are several ways to measure the concentration of a specific gas in a gas mixture. A
common approach is to force the gas mixture through a cell and direct light of a set wavelength,
commonly infrared (IR) or ultraviolet (UV), through the cell towards a detector. If the gas
mixture contains a gas that absorbs light of the set wavelength this will be detected by the
detector and the attenuation of the light can be used to determine the actual concentration. A
standard IR gas analyzer typically measures 1-3 gases simultaneously.
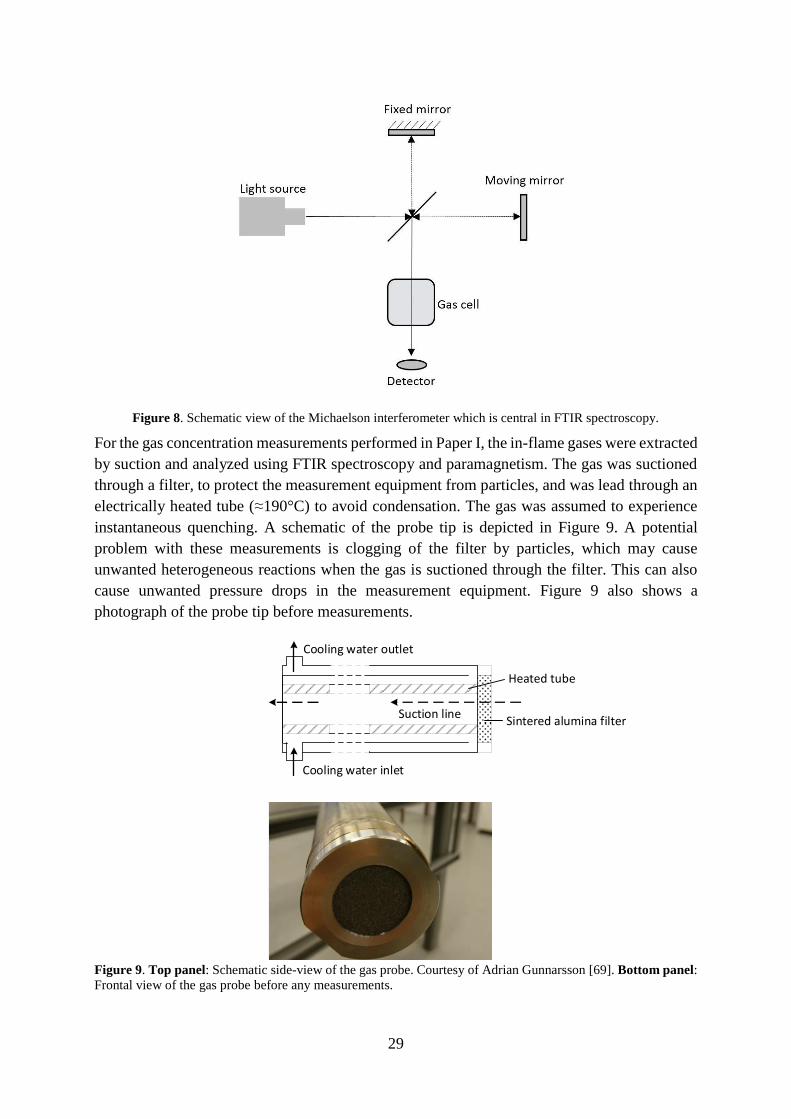
A technology that can effectively measure more gases simultaneously is Fourier Transform
Infrared (FTIR) spectroscopy, which scans a wider range of wavelengths in the IR spectrum.
Instead of using a light source that has only one wavelength (monochromatic), FTIR
spectroscopy uses a light source with multiple wavelengths (polychromatic). The light from
this source enters a so-called Michelson interferometer (Figure 8) where it encounters a beam
splitter, which splits the beam into two beams, one of which is refracted to a fixed mirror and
one of which is refracted to a moving mirror. The beams are reflected back to the beam splitter,
where destructive and constructive interference occur depending on whether the wavelengths
are in phase, which in turn is dependent upon the distances between the mirrors and the beam
splitter. The resulting beam enters a sample cell that is filled with the gas mixture, where
absorption of certain wavelengths occurs depending on the gases present in the mixture. The
remaining beam is measured with a detector. Since one of the mirrors is moving, different
distances between the mirror and beam splitter are achieved, and thus different wavelengths
experience constructive/destructive interference, which means that the light entering the sample
cell varies. The result is a so-called interferogram, which is transformed to a spectrum with the
use of Fast Fourier Transform. A computer then compares this spectrum with a reference
spectrum (typically an N2 spectrum) and analyzes which wavelengths have been absorbed and
to what extent. Knowing which wavelengths are relevant for which gases, it calculates the
concentration of each gas. An issue with FTIR gas analyzers is that although every gas can be
associated with a unique set of absorption wavelengths, a gas may share individual wavelengths
with other gases, which may result in an error. For example, if gas A absorbs wavelengths x
and y, which are also absorbed by gases B and C, it may appear that gas A is present even
though only gases B and C are present. It is therefore necessary to have some idea as to which
gases could be present. Another drawback is that FTIR spectrometers do not detect symmetrical
diatomic gases (e.g., O2), since these molecules lack a dipole moment and, therefore, will not
interact with the electric field of the light. In the case of O2 measurements, it is possible to use
a paramagnetic instrument that relies on the magnetic property of O2.
Page 39
29
Figure 8. Schematic view of the Michaelson interferometer which is central in FTIR spectroscopy.
For the gas concentration measurements performed in Paper I, the in-flame gases were extracted
by suction and analyzed using FTIR spectroscopy and paramagnetism. The gas was suctioned
through a filter, to protect the measurement equipment from particles, and was lead through an
electrically heated tube (≈190°C) to avoid condensation. The gas was assumed to experience
instantaneous quenching. A schematic of the probe tip is depicted in Figure 9. A potential
problem with these measurements is clogging of the filter by particles, which may cause
unwanted heterogeneous reactions when the gas is suctioned through the filter. This can also
cause unwanted pressure drops in the measurement equipment. Figure 9 also shows a
photograph of the probe tip before measurements.
Figure 9. Top panel: Schematic side-view of the gas probe. Courtesy of Adrian Gunnarsson [69]. Bottom panel:
Frontal view of the gas probe before any measurements.
Suction line
Cooling water outlet
Cooling water inlet
Heated tube
Sintered alumina filter
Page 41
31
6 Modeling
6.1 Overall modelling considerations
As described in the theory section, NO formation from solid fuel combustion is dependent on
the pyrolysis process, volatile combustion and char combustion. The model developed in this
work incorporates these processes to describe the NO formation, and the processes that relate
to the combustion are treated as boundary conditions. Table 3 presents how the model treats the
kinetics and the boundary conditions, such as mixing, heat release, heat transfer, species
concentrations, temperature, and fuel characteristics, all of which all important and
interconnected. The NO fractions that originate from vol-N and char-N are treated separately,
and a major output from the model is the NO contribution from each of these two sources. Tars
are not included in the model, and the pyrolysis process is assumed to be instantaneous. In the
case of an iron ore rotary kiln, there could be interactions between the pellets and the
combustion, e.g., thermal radiation and catalytic reactions. Such effects are however not
included in the current model.
Table 3. Summary of ways in which combustion characteristics are treated in the modeling.
Combustion characteristic(s) Treatment in the modeling
Kinetics Detailed homogeneous reaction kinetics are used for the
volatiles
Apparent kinetics are used for the heterogeneous kinetics
Mixing Mixing is defined by how fast air is added to the fuel in the
axial direction
Mixing on smaller scale (e.g., eddies and vortexes) is not
considered
Heat release, heat transfer, and
temperature
The energy equation is not solved. Instead, the temperature
profile is given as an input from the measurements (or
CFD)
Fuel composition The volatiles are assumed to consist of CH4, CO, H2 and
HCN
Char and Char-N are modeled as C2(s) and N2(s) only
converted through irreversible heterogeneous oxidation
Ash is treated as a fully inert component
Water is assumed to be in the form of vapor from the start
Particle characteristics Properties related to the solid particles, such as porosity,
surface area, fragmenting, and swelling, are neglected
6.2 Model description
The model describes the combustion chemistry and NO formation during combustion of a fuel.
In theory, it could be used as a predictive model, although for this the model would require
information on heat losses, to calculate the temperature profile, as well as an estimation of the
mixing of the fuel and oxidizer, since the momentum equation is not included. Instead,
providing the model with a temperature profile (from, for example, measurements) and fitting
Page 42
32
the mixing profile to existing O2 and CO concentrations avoids these uncertainties and provides
a detailed description of the combustion conditions in a given process. Analysis of the reaction
pathways and the governing reaction mechanisms may then be performed. Figure 10 presents
a schematic overview of the model.
Figure 10. Illustration of the model structure with the inputs and outputs.
6.2.1 Mixing and kinetics The in-flame combustion chemistry is modelled using a plug flow reactor (PFR) description,
and mixing is described using a Zwietering approach [70]. The fuel is added at the main inlet
to the PFR and the air is introduced in a staged manner. The staged insertion of air represents
the mixing of the fuel and air. The air is divided into primary air and secondary air, with the
primary air being injected more rapidly. The mixing rate is dependent upon the total flow of air
and the share of the flow introduced at a given distance in the PFR (defined by the user). Mixing
occurs rapidly if most of the air has been inserted at a short distance. The combustion chemistry
is described by the detailed reaction kinetics proposed by Mendiara and Glarborg [71] for the
homogeneous reactions, and the apparent kinetics are described by Jensen [72] for the
heterogeneous reactions. The detailed homogeneous reaction mechanism involves 97 species
and 779 reactions. In addition, three heterogeneous reactions with apparent kinetics are
included: (i) the conversion of char into CO (R1); (ii) the oxidation of char-N to NO (R2); and
(iii) the reduction of NO by char (R3&R4). The reduction of NO by char is described by two
reactions in order to fit Chemkin’s reaction arrangement. Table 4 presents the reactions and the
corresponding kinetics. The mechanism assumes full conversion of char-N to NO. Thus, the
reduction of NO by char, which depends on the local conditions, describes the apparent
conversion.
Table 4. Reactions and kinetics of the heterogeneous mechanism.
Reaction A [cm3/mol/s] Ea [cal/mol]
R1 C2(s) + O2(g) -> 2 CO (g) 2.24E11 29,400
R2 N2(s) + O2(g) -> 2 NO (g) 2.24E11 29,400
R3 NO(g) + C2(s) -> CO(g) + CN(s)* 1.46E11 29,400
R4 2 CN(s) -> C2(s) + N2(g)* 1.00E20 0
*The overall reaction NO(g) + ½ C2(s) -> ½ N2(g) + CO(g) is implemented as a two-step reaction, with R3 as the
controlling step.
Page 43
33
6.2.2 Fuel properties The contents of volatiles, moisture, and ash, as well as the elemental composition of the fuel
are given as inputs to the model. Moisture in the fuel is modeled as water vapor, i.e., the impact
of vaporization is not included, and the ash is modeled as an inert component that does not
interact with the combustion process. The char is represented as C2(s), and the volatiles are
assumed to consist of CH4, H2, and CO. The split between the volatile components is
determined by the elemental balances for C, H, and O:
𝑌𝐶𝑂 (
𝑀𝐶
𝑀𝐶𝑂) + 𝑌𝐶𝐻4
(𝑀𝐶
𝑀𝐶𝐻4
) =𝑋𝐶,𝑓𝑢𝑒𝑙 − 𝑋𝑐ℎ𝑎𝑟
1 − 𝑋𝑐ℎ𝑎𝑟
Eq. 3
𝑌𝐻2
(2𝑀𝐻
𝑀𝐻2
) + 𝑌𝐶𝐻4(
4𝑀𝐻
𝑀𝐶𝐻4
) =𝑋𝐻,𝑓𝑢𝑒𝑙
1 − 𝑋𝑐ℎ𝑎𝑟
Eq. 4
𝑌𝐶𝑂 (
𝑀𝑂
𝑀𝐶𝑂) =
𝑋𝑂,𝑓𝑢𝑒𝑙
1 − 𝑋 𝑐ℎ𝑎𝑟
Eq. 5
where Yi is the mass fraction of species i in the volatiles, Mj is the molar mass of element j, and
Xk is the fuel mass fraction of element k in the fuel (dry, ash-free basis). The system of equations
is then solved to obtain Y for CH4, H2, and CO. This approach is a simplification of the approach
suggested by Thunman et al [73].
The nitrogen content of the fuel is split between the volatiles and char, i.e., a certain share is
released with the volatiles as HCN, while the remainder is released with the char as N2(s).
Assuming that the share is 50/50 and using Eqs. 3-5, the composition of a modeled fuel is
obtained, as shown in Table 5 compared to the coal that it represents.
Table 5. Fuel composition of a coal used in the pilot-scale kiln [74] (Coal A) and the corresponding modeled fuel
composition. The percentages are given on a wet basis.
Actual composition Modeled composition
Fixed carbon* mass-% 64.6 C2 (s) mass-% 63.9
Ash mass-% 13.1 Ash mass-% 13.1
H2O mass-% 0.9 H2O (g) mass-% 0.9
Volatile mass-% 21.4 CO (g) mass-% 8.2
C mass-% 75.4 CH4 (g) mass-% 11.1
H mass-% 3.9 H2 (g) mass-% 0.79
O mass-% 5.9 HCN (g) mass-% 1.32
N mass-% 1.37 N2 (s) mass-% 0.68
O2-demand m3n/kgfuel 1.59 O2-demand m3
n/kgfuel 1.58
*Calculated by difference (100-Volatiles-Ash-H2O).
Page 44
34
6.2.3 Reaction analysis The Chemkin solver calculates the rates of all reactions at each step in the PFR using the law
of mass action:
𝑟𝑎𝑡𝑒 = 𝑘 ∏ 𝑐𝑖𝜈𝑖 Eq. 6
where k is the rate constant (see Eq. 1), ci is the ith reactant in the reaction, and νi is the
stoichiometric coefficient for the ith reactant. Reverse reactions are calculated with the use of
thermodynamic data. The resulting rate at each step in the PFR is in mole/cm3/s. Since the
purpose of the model is to evaluate NO formation under combustion, each rate has to be
integrated in order to evaluate its overall importance. This can be done either over volume or
residence time, depending on the desired outcome. The net formation of NO (in mol/s) in the
PFR is obtained by integrating the net NO formation rate over the volume of the reactor.
Likewise, the level of NO production from char-N and the level of NO reduction by char are
calculated by integrating R2 and R3, respectively. The thermal NO formation is usually
described by reactions R3-2 - R3-4 but due to the fact that the reverse reaction of R3-2 and the
forward reaction of R3-4 are central to the net conversion of vol-N to NO, these reactions cannot
simply be integrated to obtain the thermal NO formation. Instead, only the forward reactions of
R3-2 and R3-3 are considered to be part of the thermal NO formation mechanism. Although it
is possible to integrate the remainder of the homogeneous NO reactions to obtain a value for
NO formation from vol-N, it becomes slightly misleading due to circular reactions (such as
NO→HONO→NO2→NO), which make volatile formation and reduction reactions appear
more prominent than they actually are. Instead, the net amount of NO formed from the volatiles
is calculated as the difference between the total net NO formation and the net level of NO
formation from the processes of char-N formation, thermal NO formation, and NO reduction
by char. In order to compare NO formation between combustion of different scale, the NO
formation is divided by the fuel input (in MWfuel). The resulting value is then in units of mol/MJ.
Furthermore, since combustion processes use different fuels with different contents of nitrogen,
this unit is in turn divided by the nitrogen content of the fuel (kgN/kgfuel). The final unit is
displayed as mol/MJ/N, where N stands for the nitrogen content.
Page 45
35
7 Results and discussion
The results are presented in two parts. First, the impacts on NOx emission levels of the fuel and
combustion parameters, based on the inputs and outputs of the ECF from the experimental
campaign in Paper I, are presented. Previous results from a measurement campaign conducted
in Year 2013 are also included. Second, the experimental results are evaluated through
modeling, and the contributions of different formation mechanisms are analyzed. The
evaluation concludes regarding the governing chemistry and the contribution from thermal NO,
as well as regarding the conversion of vol-N and char-N.
7.1 NOx performance
Figure 11 presents the levels of NOx emissions detected in the ECF for the fuels tested in the
Year 2013 and Year 2015 campaigns. The reference coal (Coal A) had approximately the same
levels of NOx emission in the two campaigns when the burner conditions were similar. Natural
gas and oil produced significantly more NOx than did the solid fuels, which is in agreement
with previous work on rotary kilns [63-65]. Furthermore, the NOx emissions from the solid
fuels were high compared to those from conventional combustion – they reached levels that
were 3-times the NOx limit in the MCPD (shown in Figure 11). In both campaigns, Coal A
produced the lowest amount of NOx amongst the coals tested. Co-firing coal with biomass
slightly reduced the level of NOx compared to burning only Coal A (under similar combustion
conditions). In the Year 2015 campaign, it was also shown that reducing the amount of primary
air reduced the NOx emissions significantly, and that even lower levels of NOx were reached
for Coal A (albeit still remarkably high), as compared to when co-firing was employed. Even
though the levels of emissions were high, the solid fuels contained enough nitrogen to account
for the emitted NOx, and thermal NO did not necessarily predominate, as is usually assumed.
Figure 12 presents the NOx emissions and the ratio of outlet NOx to inlet fuel-N flow (on a
molar basis) as functions of the nitrogen contents of the solid fuels. The ratio varied between
0.8 and 0.4. A lower level of conversion to NO was obtained for fuels with a high content of
nitrogen, even though the absolute level of NOx emissions increased with nitrogen content. The
trend that higher N-content leads to a lower ratio of outgoing NOx to ingoing fuel-N has been
observed in earlier studies of combustion [75].
In the Year 2015 campaign, the secondary air temperature varied within the range of 965°-
1020°C, the outlet gas temperature varied within the range of 1200°-1300°C and the in-flame
measurements yielded peak temperatures in the range of 1300°-1675°C (solid fuels only). The
upper end of the range of the measured peak temperatures is clearly sufficiently high for thermal
NO to be significant in terms of the kinetic rate constant, although the residence times at these
temperatures, as well as the gas concentrations (e.g., N2, O, and NO) are also crucial parameters.
Figure 13 presents the NOx emissions plotted against the measured peak temperature. Due to
the low number of data-points, and the fact that the fuels vary in terms of nitrogen content, it is
not possible to draw any definite conclusions from the figure. However, the spread seen in the
figure (at least for ECF 2015) is an indication that thermal NO may not be dominating. Coal A
was used in four experiments and appeared to produce less NOx when higher peak temperatures
Page 46
36
were measured. A similar observation in the Year 2015 campaign was that increasing the
temperature of the secondary air decreased slightly the outgoing NOx emissions. NOx emissions
are also clearly related to the nitrogen content of the fuel, which indicates the importance of
fuel NO rather than thermal NO. Furthermore, it is known that increasing the air-to-fuel ratio
increase fuel-N conversion, and even though there is a shortage of data for the high air-to-fuel
ratio used in iron ore rotary kilns, similar conversion values have been reported (see for example
Pohl et al [25]). These facts point towards high fuel-N conversion being important, rather than
high thermal NO formation.
Figure 11. NOx emissions for the fuels tested during the Year 2013 and Year 2015 campaigns. Coal A is the
reference coal, which is used at full scale. *, Lower amount of primary air. ', Different burner configuration (not
the same in years 2013 and 2015). Blue dashed line: the MCPD limit.
Page 47
37
Figure 12. Levels of NOx emissions and the ratios of outlet NO to inlet N (on a molar basis) as functions of the
nitrogen content of the fuel.
Figure 13. NOx emissions compared to measured peak temperature for both measurement campaigns.
7.2 Contributions of thermal NO and fuel NO formation mechanisms
In order to propose measures for NOx reduction in iron ore rotary kilns, it is important to
estimate the different contributions of the NO-forming mechanisms. This is especially
interesting because the experimental results indicate that the general assumption – that thermal
NO formation predominates in iron ore rotary kilns – may not be valid. There is, however, not
a clear cut between the contributions of thermal NO and fuel NO to total NOx formation, since
Page 48
38
the respective formation mechanisms are not completely exclusive. The main connection
between the two mechanisms is reaction R 3-2, since the forward reaction is the rate-limiting
step for the thermal reaction, while the reverse reaction is the main reaction for homogeneous
reduction of NO, which is central to the chemistry governing the conversion of vol-N.
As mentioned, lower levels of primary air resulted in lower levels of NOx emissions in the
campaign conducted in Year 2015. Figure 14 presents the temperature profiles for the two cases
with different levels of primary air (Coal A and Coal A* in Figure 11), as obtained by both
suction pyrometry and the use of an IR-camera. As can be seen, the temperatures are
significantly higher when low levels of primary air are used. Figure 15 presents the center line
in-flame measurements of NO and O2, together with the fitted model described in Section 6.2.
Significantly lower concentrations of O2 were measured early on in the case with low levels of
primary air (Coal A*), which indicates the presence of a pronounced reducing zone. Therefore,
a reduction in the conversion of vol-N to NO is thought to be the reason for the lower level of
NOx emissions.
Figure 14. Measured temperature profiles for a case with a low level of primary air (Coal A*) and a case with a
high level of primary air (Coal A). The temperatures were obtained with both a suction pyrometer and an IR-
camera. For the suction pyrometer measurements, only the three centre-line measurements are included.
Page 49
39
Figure 15. In-flame measurements of O2 and NO for a case with a low level of primary air (Coal A*) and a case
with a high level of primary air (Coal A). The O2 concentrations are shown on a dry basis, and the NO
concentrations on a wet basis. Symbols: Measurements. Line: Model. Source: Paper II.
In Paper II, modeling was used to evaluate Coal A and Coal A*. As a reference point, the model
was also applied to previous measurements carried out in a 100-kWfuel facility that combusted
lignite [76]. This case will be referred to as ‘Lignite’. Figure 16 presents a comparison of the
gas profiles of O2, NO, CO, and CO2 after fitting the model to the experiments. Since the lengths
of the two combustion facilities are different, the x-axis in Figure 16 is normalized. The
combustion process can be assumed to be complete when the concentrations have stabilized.
Figure 17 presents the resulting levels of NO formation/reduction. Three main conclusions are
drawn from Figure 17:
Thermal NO appears to be negligible
The increased conversion of vol-N to NO is responsible for the higher formation of
NOx seen for Coal A, as compared to Coal A*
The level of NO reduction by char is low in rotary kilns, as compared to the
corresponding level in the 100-kW combustor, i.e., apparent char-N conversion is high
in rotary kilns and is responsible for the high levels of NOx emissions
The first and second points are in accordance with the indications from the experimental results.
The third point constitutes perhaps the main conclusion of this thesis: high apparent conversion
of char-N is the main reason for the high levels of NOx emissions in iron ore rotary kilns. Since
the intrinsic rate of char-N conversion to NO is modelled as 100%, the reduction of NO by char
is the governing mechanism. The reduction reaction (R3) requires both NO and char, so high
concentrations of these components are beneficial. However, the high air-to-fuel ratio employed
in iron ore rotary kilns counteract this, since both components are diluted by the large gas flow,
and the high concentration of O2 in the burnout zone (i.e., after volatile combustion) leads to
rapid consumption of char. With the used kinetics, the ratio of the NO reduction rate (R2) to
the rate of char consumption by O2 (R1) gives an indication of the effectiveness of the NO
reduction mechanism. The ratio between these rates becomes:
Page 50
40
𝑅3
𝑅1=
𝐴3
𝐴1
[𝑁𝑂]
[𝑂2]
Eq. 7
An increased ratio of NO to O2 indicates that the char may reduce a larger amount of NO before
being consumed by O2. As can be seen in Figure 16, the O2 levels are significantly higher in
the rotary kiln cases, while the NO levels are similar. The result is low NO reduction by char.
Figure 16. Gas profiles derived in the model for the three cases. Coal A* and Coal A are based on the ECF Year
2015 cases shown in Figure 11. The Lignite case was not performed in a rotary kiln. Source: Paper II
Figure 17. Calculated formation/reduction contributions for the three cases. Coal A* and Coal A are based on the
ECF Year 2015 cases shown in Figure 11. The Lignite experiment was not performed in a rotary kiln. Source:
Paper II
As char combustion occurs further away from the burner than volatiles combustion, it is less
dependent upon the burner design. Modifying the air-to-fuel ratio is one way to increase the
NO/O2 ratio after volatile combustion, thereby influencing the conversion of char-N. However,
Page 51
41
drastically reducing λ from 4.2 to 2.8 (brought about by reducing the oxygen content in the
secondary “air”, while keeping the same volumetric flow), as tested in an experiment (Paper I),
decreased the conversion to NO (NOout/Nin) from 0.67 to 0.59, which is a rather small reduction.
This is also not a particularly attractive measure to apply in full-scale kilns, since the partial
pressure of O2 is important for pellet quality.
A possible measure to reduce the ratio of O2 to NO without reducing the amount of excess air
is to recirculate the flue gases. However, achieving significant reductions in the O2
concentrations would require high levels of gas recirculation due to the high levels of O2 post-
combustion (15%-16% without recirculation). An alternative approach is to enhance the
combustion through oxygen addition, thereby achieving the level of oxygen required for
combustion and pellet oxidation while reducing the dilution effect of NO (since less N2 is
added). This latter approach is briefly evaluated in Paper II and appears to have potential,
although it is unclear how the temperature profile would be affected.
The second bullet point obtained from Figure 17 is simply a consequence of the amount of
available oxygen during vol-N conversion. This is controlled by the mixing rate of air to the
fuel, as well as the point of fuel ignition. The latter is strongly temperature-dependent, and
achieving a high initial temperature is beneficial for rapid ignition. In Paper III, an investigation
of the homogenous chemistry during volatiles combustion was performed by setting up an
isothermal PFR with a fuel inlet that consisted of CH4 and HCN, with a staged insertion of air.
The total residence time was set to 1 s, independent of the conditions used. Figure 18 presents
the ratio of outgoing NO to ingoing vol-N as functions of temperature and mixing rate
(described as the time that elapses until mixing is complete). At low temperatures (<1000°C),
the ratio is low due to incomplete combustion, which leads to a low rate of conversion of vol-
N. At high temperatures (>1600°C), the ratio is greater than unity due to the onset of thermal
NO formation. Between these regimes, vol-N conversion exhibits a step change that is
dependent upon the mixing rate and temperature. This characterizes a shift from transport-
controlled to kinetics-controlled conversion. A case in which the mixing is rapid and the
temperature is low leads to significantly higher vol-N conversion than a case in which the
temperature is high (but <1600°C) and mixing is slow. In other words, if the addition of oxygen
through mixing is faster than the consumption of oxygen by reactions, NO formation increases
significantly. Figure 19 presents a reaction pathway analysis for a transport-controlled case and
a kinetics-controlled case. Only the most important species and reaction pathways are shown.
The main difference between the cases is that the formation of NO from NCO and NH is
important in the kinetically controlled case, while in the mixing-controlled case, NO is mainly
produced by the reaction between the N-radical and OH. In addition, in the kinetically
controlled case, the reduction of NO by the N-radical is negligible.
Page 52
42
Figure 18. Ratio of outgoing NOx to ingoing vol-N as a function of temperature and mixing time (equivalent to
the mixing rate). Based on Paper III.
Figure 19. Reaction analysis of a kinetically controlled case and a transport-controlled case. The thickness of each
line indicates the relative importance of that reaction step. Source: Paper III
Since char-N conversion may be difficult to control without reducing the equivalence air-to-
fuel ratio close to unity, and since vol-N conversion can be reduced through burner staging,
measures to control the fuel-N that is released with the volatiles rather than the char might
represent the best alternative amongst the primary measures. In theory, this could be achieved
by increasing the pyrolysis temperature. However, a prerequisite for this is a better description
of the pyrolysis process than we have in the current model, and the practical feasibility of this
has to be evaluated in further studies.
Page 53
43
8 Summary
This thesis presents an investigation of the formation of NOx in iron ore rotary kilns that
combust solid fuels. The impact of changing to alternative coals, as well as that of co-
combusting coal and biomass were investigated. The effects of changing combustion settings
were also examined. The research involved experiments in a pilot-scale kiln (580kWfuel),
combined with modeling work that focused on the combustion chemistry.
The experimental investigation shows that the amount of primary air has a significant impact
on NOx emissions. A case with a low level of primary air emitted significantly less NOx than a
case in which the level of primary air was high. In-flame measurements revealed that the
temperature was actually higher in the case with a low level of primary air, even though amount
of NOx formation was reduced. The measurements also revealed the presence of an O2-lean
zone in front of the burner when the level of primary air was low. This zone was absent in the
case with a higher level of primary air. The main reason for the reduction in NOx formation is
thought to be decreased conversion of vol-N to NO. Other measures that reduced NOx emissions
included the co-combustion of coal and biomass, reducing the air-to-fuel ratio, and increasing
the secondary air temperature.
The results from the modeling confirm that the conversion of vol-N to NO is significantly
increased when an O2-lean zone is absent. The reaction analysis shows that under highly
oxidizing conditions, vol-N conversion becomes kinetically controlled rather than transport-
controlled, which promotes significant NO formations. When comparing the contributions of
char-N and vol-N to the total NO formation under iron ore rotary kiln conditions to that
employed in more conventional combustion, it is clear that the apparent conversion of char-N
to NO is significantly higher in the rotary kiln. This high level of conversion is attributed to a
high O2/NO ratio, which promotes an oxidizing environment and a low efficiency of NO
reduction by char. Furthermore, thermal NO formation appears to be negligible in all
investigated cases.
Given the difficulties associated with controlling the conversion of char-N to NO, plans to
create conditions in which the fuel-N is released with the volatiles rather than the char appear
to be an avenue for future research.
Page 55
45
9 Future work
The results from the modeling work indicate that exploring the possibility of increasing the
fraction of nitrogen released with the volatiles might be a solution for reducing NOx formation
in iron ore rotary kilns. A detailed investigation of the pyrolysis process would thus be a logical
continuation of this thesis. There exist available pyrolysis models with the inclusion of nitrogen
species on the web, which might be a first step. Furthermore, since the results indicate that the
solid-gas reactions are of utmost importance, the model needs to cover this in more detail. In
particular, the importance of mass transfer has to be evaluated and ways to describe the process
when mass transfer is limiting the combustion process. Some kind of particle model could be
developed to complement the current model.
Apart from investigating the pyrolysis process further, there are three experimental paths
forward. The first is to perform more experiments in LKABs pilot kiln, similar to those that
Paper I and Paper II are based on. More focus on burner settings as well as modifications of the
secondary air would be interesting from a NOx perspective. The second possibility is to attempt
to apply the lessons learned from the pilot scale to full scale. A problem encountered in previous
attempts to reduce NOx is that the results from the pilot kiln did not transfer to the full scale
kiln, and it would be interesting to see if the new modifications to the pilot kiln changes this.
Apart from an environmental and economic perspective, there is thus also a scientific desire for
more research on the NO formation in iron ore rotary kilns. The combustion of pulverized fuel
at elevated temperatures and at higher-than-normal partial pressures of oxygen has received
attention in recent years due to the development of oxy-fuel combustion, but the impact on NO
formation when N2 is present is not well documented. A path forward is to apply laser
technology to measure e.g. OH radicals and soot concentrations. This can provide valuable
information of the combustion chemistry and flame structure.
Page 57
47
References
[1] S. V. Krupa and W. J. Manning, "Atmospheric ozone: Formation and effects on
vegetation," Environmental Pollution, vol. 50, pp. 101-137, 1988/01/01/ 1988.
[2] J. Fuhrer, L. Skärby, and M. R. Ashmore, "Critical levels for ozone effects on
vegetation in Europe," Environmental Pollution, vol. 97, pp. 91-106, 1997/01/01/
1997.
[3] W. H. Organization, "Health aspects of air pollution with particulate matter, ozone and
nitrogen dioxide: report on a WHO working group, Bonn, Germany 13-15 January
2003," 2003.
[4] J. Rose, Acid rain: current situation and remedies vol. 4. Yverdon: Gordon and
Breach, 1994.
[5] C. Price, J. Penner, and M. Prather, "NOx from lightning: 1. Global distribution based
on lightning physics," Journal of Geophysical Research: Atmospheres, vol. 102, pp.
5929-5941, 1997.
[6] R. Zhang, X. Tie, and D. W. Bond, "Impacts of anthropogenic and natural NOx
sources over the US on tropospheric chemistry," Proceedings of the National Academy
of Sciences, vol. 100, pp. 1505-1509, 2003.
[7] UNECE. (2017-06-30). Air Pollution. Available:
http://www.unece.org/env/lrtap/welcome.html
[8] "1999 Protocol to Abate Acidification, Eutrophication and Ground-level Ozone to the
Convention on Long-range Transboundary Air Pollution," ed: Gothenburg, 1999.
[9] EU, "Directive (EU) 2016/2284 of the European Parliament and of the Council of 14
December 2016 on the reduction of national emissions of certain atmospheric
pollutants," 2016.
[10] CLRTAP. WebDab Search [Online]. Available:
http://webdab1.umweltbundesamt.at/official_country_year.html?cgiproxy_skip=1
[11] EU, "Directive 2010/75/EU of the European Parliament and of the Council of 24
November 2010 on industrial emissions (integrated pollution prevention and control)
Text with EEA relevance," 2010.
[12] EU, "Directive (EU) 2015/2193 of the European Parliament and of the Council of 25
November 2015 on the limitation of emissions of certain pollutants into the air from
medium combustion plants (Text with EEA relevance)," 2015.
[13] Naturvårdsverket. (2017-06-30). Resultat för kväveoxidavgiften. Available:
http://www.naturvardsverket.se/Miljoarbete-i-samhallet/Miljoarbete-i-
Sverige/Uppdelat-efter-omrade/Energi/Kvaveoxidavgiften/Resultat-for-
kvaveoxidavgiften/
[14] Naturvårdsverket, "Vägledning till NFS 2016:13 - för versamhetsutövare," 2017.
[15] Naturvårdsverket, "Genomförande av MCP-direktivet," 2017.
[16] JRC, "Best Available Techniques (BAT) Reference Document for Iron and Steel
Production " 2010.
[17] W. S. Association, "World Steel in Figures 2017," 2017.
[18] U. G. Survey, "Global Iron Ore Production Data; Clarification of Reporting from the
USGS," 2017.
[19] U. S. G. Survey, "Mineral commodity summaries 2017," 2017.
[20] D. Pershing and J. Wendt, "Pulverized coal combustion: The influence of flame
temperature and coal composition on thermal and fuel NOx," in Symposium
(International) on Combustion, 1977, pp. 389-399.
Page 58
48
[21] Y. Zeldovich, D. Frank-Kamenetskii, and P. Sadovnikov, Oxidation of nitrogen in
combustion: Publishing House of the Acad of Sciences of USSR, 1947.
[22] P. Glarborg, "Fuel nitrogen conversion in solid fuel fired systems," Progress in
Energy and Combustion Science, vol. 19, pp. 89-113, 2002.
[23] H. Zhang and T. H. Fletcher, "Nitrogen transformations during secondary coal
pyrolysis," Energy & fuels, vol. 15, pp. 1512-1522, 2001.
[24] D. Blair, J. O. Wendt, and W. Bartok, "Evolution of nitrogen and other species during
controlled pyrolysis of coal," in Symposium (International) on Combustion, 1977, pp.
475-489.
[25] J. H. Pohl and A. F. Sarofim, "Devolatilization and oxidation of coal nitrogen," in
Symposium (International) on Combustion, 1977, pp. 491-501.
[26] P. R. Solomon and M. B. Colket, "Evolution of fuel nitrogen in coal devolatilization,"
Fuel, vol. 57, pp. 749-755, 1978.
[27] S. Kambara, T. Takarada, Y. Yamamoto, and K. Kato, "Relation between functional
forms of coal nitrogen and formation of nitrogen oxide (NOx) precursors during rapid
pyrolysis," Energy & Fuels, vol. 7, pp. 1013-1020, 1993.
[28] P. R. Solomon, D. G. Hamblen, M. A. Serio, Z.-Z. Yu, and S. Charpenay, "A
characterization method and model for predicting coal conversion behaviour," Fuel,
vol. 72, pp. 469-488, 1993.
[29] S. Niksa, "FLASHCHAIN theory for rapid coal devolatilization kinetics. 3. Modeling
the behavior of various coals," Energy & Fuels, vol. 5, pp. 673-683, 1991.
[30] T. H. Fletcher, A. R. Kerstein, R. J. Pugmire, M. Solum, and D. M. Grant, "A
chemical percolation model for devolatilization: summary," Brigham Young
University, 1992.
[31] J. O. Wendt and C. Sternling, "Effect of ammonia in gaseous fuels on nitrogen oxide
emissions," Journal of the Air Pollution Control Association, vol. 24, pp. 1055-1058,
1974.
[32] J. A. Miller and C. T. Bowman, "Mechanism and modeling of nitrogen chemistry in
combustion," Progress in Energy and Combustion Science, vol. 15, pp. 287-338,
1989/01/01 1989.
[33] G. P. Smith, D. M. Golden, M. Frenklach, N. W. Moriarty, B. Eiteneer, M.
Goldenberg, et al., "GRI-Mech 3.0, 2000," URL http://www. me. berkeley.
edu/gri_mech.
[34] J. C. Chen and S. Niksa, "Suppressed nitrogen evolution from coal-derived soot and
low-volatility coal chars," Symposium (International) on Combustion, vol. 24, pp.
1269-1276, 1992/01/01 1992.
[35] G. J. Haussmann and C. H. Kruger, "Evolution and reaction of coal fuel nitrogen
during rapid oxidative pyrolysis and combustion," Symposium (International) on
Combustion, vol. 23, pp. 1265-1271, 1991/01/01 1991.
[36] M. T. Cheng, M. J. Kirsch, and T. W. Lester, "Reaction of nitric oxide with bound
carbon at flame temperatures," Combustion and Flame, vol. 77, pp. 213-217,
1989/08/01 1989.
[37] M. Østberg, P. Glarborg, A. Jensen, J. E. Johnsson, L. S. Pedersen, and K. Dam-
Johansen, "A model of the coal reburning process," Symposium (International) on
Combustion, vol. 27, pp. 3027-3035, 1998/01/01 1998.
[38] D. Phong-Anant, L. Wibberley, and T. Wall, "Nitrogen oxide formation from
Australian coals," Combustion and flame, vol. 62, pp. 21-30, 1985.
[39] Y. H. Song, J. H. Pohl, J. M. Beér, and A. F. Sarofim, "Nitric oxide formation during
pulverized coal combustion," Combustion science and technology, vol. 28, pp. 31-40,
1982.
Page 59
49
[40] J. P. Spinti and D. W. Pershing, "The fate of char-N at pulverized coal conditions,"
Combustion and Flame, vol. 135, pp. 299-313, 2003.
[41] D. Pershing and J. Wendt, "Relative contributions of volatile nitrogen and char
nitrogen to NOx emissions from pulverized coal flames," Industrial & Engineering
Chemistry Process Design and Development, vol. 18, pp. 60-67, 1979.
[42] A. Molina, E. G. Eddings, D. W. Pershing, and A. F. Sarofim, "Nitric oxide
destruction during coal and char oxidation under pulverized-coal combustion
conditions," Combustion and Flame, vol. 136, pp. 303-312, 2004.
[43] P. F. Nelson, P. C. Nancarrow, J. Bus, and A. Prokopiuk, "Fractional conversion of
char N to NO in an entrained flow reactor," Proceedings of the Combustion Institute,
vol. 29, pp. 2267-2274, 2002.
[44] L. S. Jensen, H. E. Jannerup, P. Glarborg, A. Jensen, and K. Dam-Johansen,
"Experimental investigation of NO from pulverized char combustion," Proceedings of
the Combustion Institute, vol. 28, pp. 2271-2278, 2000.
[45] A. Molina, J. J. Murphy, F. Winter, B. S. Haynes, L. G. Blevins, and C. R. Shaddix,
"Pathways for conversion of char nitrogen to nitric oxide during pulverized coal
combustion," Combustion and Flame, vol. 156, pp. 574-587, 2009.
[46] S. P. Visona and B. R. Stanmore, "Modeling NOx release from a single coal particle
II. Formation of NO from char-nitrogen," Combustion and Flame, vol. 106, pp. 207-
218, 1996/08/01 1996.
[47] T. Shimizu, Y. Sazawa, T. Adschiri, and T. Furusawa, "Conversion of char-bound
nitrogen to nitric oxide during combustion," Fuel, vol. 71, pp. 361-365, 1992/04/01
1992.
[48] W. Wang, S. D. Brown, C. J. Hindmarsh, and K. M. Thomas, "NOx release and
reactivity of chars from a wide range of coals during combustion," Fuel, vol. 73, pp.
1381-1388, 1994.
[49] I. Glassman and R. A. Yetter, "Chapter 9 - Combustion of Nonvolatile Fuels," in
Combustion (Fourth Edition), ed Burlington: Academic Press, 2008, pp. 495-550.
[50] R. H. Hurt and J. M. Calo, "Semi-global intrinsic kinetics for char combustion
modeling," Combustion and Flame, vol. 125, pp. 1138-1149, 2001/05/01/ 2001.
[51] R. Barranco, A. Rojas, J. Barraza, and E. Lester, "A new char combustion kinetic
model 1. Formulation," Fuel, vol. 88, pp. 2335-2339, 2009/12/01/ 2009.
[52] W. Chen, L. Smoot, S. Hill, and T. Fletcher, "Global rate expression for nitric oxide
reburning. Part 2," Energy & fuels, vol. 10, pp. 1046-1052, 1996.
[53] B. Coda, F. Kluger, D. Förtsch, H. Spliethoff, K. Hein, and L. Tognotti, "Coal-
nitrogen release and NOx evolution in air-staged combustion," Energy & fuels, vol.
12, pp. 1322-1327, 1998.
[54] I. Aarna and E. M. Suuberg, "A review of the kinetics of the nitric oxide-carbon
reaction," Fuel, vol. 76, pp. 475-491, 1997.
[55] Y. H. Song, J. M. BEÉR, and A. F. SAROFIM, "Reduction of nitric oxide by coal
char at temperatures of 1250–1750 K," 1981.
[56] L. Chan, A. Sarofim, and J. Beer, "Kinetics of the NO carbon reaction at fluidized
bed combustor conditions," Combustion and Flame, vol. 52, pp. 37-45, 1983.
[57] M. Sami, K. Annamalai, and M. Wooldridge, "Co-firing of coal and biomass fuel
blends," Progress in Energy and Combustion Science, vol. 27, pp. 171-214,
2001/01/01/ 2001.
[58] A.-K. Hjalmarsson, NOx control technologies for coal combustion: IEA Coal
Research, 1990.
[59] C. Baukal and P. Eleazer, "Quantifying NOx for industrial combustion processes,"
Journal of the Air & Waste Management Association, vol. 48, pp. 52-58, 1998.
Page 60
50
[60] A. A. Boateng, Rotary kilns: transport phenomena and transport processes:
Butterworth-Heinemann, 2008.
[61] M. H. Vaccaro, "Low NOx rotary kiln burner technology: design principles & case
study," in Cement Industry Technical Confernece, 2002. IEEE-IAS/PCA 44th, 2002,
pp. 265-270.
[62] A. T. McQueen, S. J. Bortz, M. S. Hatch, and R. L. Leonard, "Cement kiln NO x
control," IEEE transactions on industry applications, vol. 31, pp. 36-44, 1995.
[63] R. Battye, S. J. Walsh, J. Lee-Greco, and D. Sanders, NOx Control Technologies for
the Cement Industry: US Environmental Protection Agency, Office of Air Quality
Planning and Standards, Air Quality Strategies and Standards Division, 2000.
[64] F. Schorcht, I. Kourti, B. Scalet, S. Roudier, and L. Sancho, "Best Available
Techniques (BAT), Reference Document for the Production of Cement, Lime and
Magnesium Oxide: Industrial Emissions Directive 2010/75/EU:(Integrated Pollution
Prevention and Control)," JRC Reference Reports; Publications Office of the
European Union, 2013.
[65] J. Bolen, "Modern air pollution control for iron ore induration," Minerals &
Metallurgical Processing, vol. 31, 2014.
[66] R. A. Davis, "Nitric oxide formation in an iron oxide pellet rotary kiln furnace,"
Journal of the Air & Waste Management Association, vol. 48, pp. 44-51, 1998.
[67] R. Remus, M. Aguado Monsonet, S. Roudier, and L. Delgado Sancho, "JRC reference
report," Best Available Techniques (BAT) Reference Document for Iron and Steel
Production, 2013.
[68] R. K. Zahl, L. A. Haas, and J. Engesser, "Formation of NOx in iron oxide pelletizing
furnaces," University of Minnesota1995.
[69] A. Gunnarsson, "Experimental and numerical studies of thermal radiation in gas, coal
and co-fired pilot test facilities," Licentiate thesis, Energy and Environment, Chalmers
University of Technology, 2017.
[70] T. N. Zwietering, "The degree of mixing in continuous flow systems," Chemical
Engineering Science, vol. 11, pp. 1-15, 1959.
[71] T. Mendiara and P. Glarborg, "Ammonia chemistry in oxy-fuel combustion of
methane," Combustion and Flame, vol. 156, pp. 1937-1949, 10// 2009.
[72] L. S. Jensen, "NOx from cement production-Reduction by Primary Measures," 1999.
[73] H. Thunman, F. Niklasson, F. Johnsson, and B. Leckner, "Composition of volatile
gases and thermochemical properties of wood for modeling of fixed or fluidized
beds," Energy & Fuels, vol. 15, pp. 1488-1497, 2001.
[74] R. Edland, F. Normann, C. Fredriksson, and K. Andersson, "Implications of Fuel
Choice and Burner Settings for Combustion Efficiency and NOx Formation in PF-
Fired Iron Ore Rotary Kilns," Energy & Fuels, vol. 31, pp. 3253-3261, 2017.
[75] S. Chen, M. Heap, D. Pershing, and G. Martin, "Influence of coal composition on the
fate of volatileand char nitrogen during combustion," in Symposium (International) on
Combustion, 1982, pp. 1271-1280.
[76] K. Andersson, F. Normann, F. Johnsson, and B. Leckner, "NO Emission during Oxy-
Fuel Combustion of Lignite," Industrial & Engineering Chemistry Research, vol. 47,
pp. 1835-1845, 2008/03/01 2008.