EARTH SCIENCES RESEARCH JOURNAL Earth Sci. Res. J. Vol. 13, No. 1 (June 2009): 42-53 RIO GRANDE CONE TECTONO-STRATIGRAPHIC MODEL BRAZIL: SEISMIC SEQUENCES Castillo., L.L.A 1 , Kazmierczak, T. de S. 2 , and Chemale., Jr., F. 3 'Profesor, curso de Geofísica, Departamento de Geociencias - Universidad Nacional de Colombia Bogotá. 3 Professor, Instituto de Geociècias, Universidade Federal do Rio Grande do Sul, Porto Alegre - Brazil. Corresponding author Email: [email protected], [email protected][email protected]Análisis sísmicos integrados con técnicas de interpretación, procesamiento, información de velocidades y datos geofísicos permiten modelar diferentes rasgos de tipo tectónico, estructural o geomorfológico. Este trabajo se constituye en una primera aproximación a un modelo tridimensional de un rasgo geomorfológico ubicado en el fondo oceánico. El modelo inicial comprende una configuración bidimensional de una grilla interpretada a partir de secciones sísmicas llevadas a un volumen tridimensional, esto mediante la concepción de una aproximación dos y medio dimensional. Además de un cambio de configuración, se hizo un análisis de atributos sobre las imágenes de las secciones y se determinaron las características presentes desde un área de la plataforma, hasta el offshore del sudeste Brasilero. El rasgo geomorfológico a tratar es conocido como el Cono de Rio Grande, el cual pudo ser caracterizando con sus principales estructuras tectónicas y estratigráficas, mediante la cartografía y modelamiento tridimensional del subsuelo, con la integración geológica, geofísica y geomorfológica. La geomorfología del cono, se ve influenciada por procesos gravitacionales, corrientes de fondo, estructuras de tipo tectónico y composición litológica, como sus principales controladores que están presentes a partir del Neógeno. Así, a partir de la interpretación sísmica pueden ser extractados diferentes estructuras tectónicas, sedimentarias y geoformas, por ejemplo presencia de fallas, pliegues, canales, levee naturales, contornitos, etc. Palabras clave: Sismoestratigrafía, Modelamiento, tectonoestratigrafía, interpretación geofísica. Manuscript receiver: February 03 th , 2009. Accepted for publication: June 01 th , 2009. Schlumberger Ltd, Brazil. RESUMEN 42
RIO GRANDE CONE TECTONO-STRATIGRAPHIC MODEL - BRAZIL: SEISMIC SEQUENCES
ABSTRACT
The seismic analyses integrated to interpretation techniques, processing, velocity model and geophysical data have permitted modeling different tectonic, stratigraphy or geomorphology features. This paper is the first approach to geomorphological features for a three dimensional depth model. The initial model comprises a seismic section grid withbidimensional configuration conversed to three dimensional subvolumes. These include a two and half dimensional model. Also, an attribute analyses in image section is necessary to determine the most relevant characteristics. The geomorphologic feature corresponds to the named Rio Grande Cone, which is characterized by principal tectonic and stratigraphic structures. That is why mapping and subsurface three dimensional modeling, with geology, geophysical and geomorphologic integration is necessary. The cone geomorphology is characterized by gravitational processes, bottom currents, tectonic structures and lithological compositions which are the principal factors that have been influencing it since Neogene. Then, the seismic interpretation could extract different tectonic, sedimentary structures and geoforms, for instance, faults, folds, channels, natu¬ ral levee, contourites, etc.
Seismic stratigraphy method has improved since development of acquisition, processing and interpretation processes. They include loading, processing, visualization and modeling tools that have allowed the manipulation of format data, screen and the creation of a high quality model. Data could be transformed to different configurations like 2D, 2.5D and 3D.
The first concepts related to seismostratigraphy interpretation refer to geometry and stratal termina¬ tions (Mitchum et al. 1994).In the Brazil's Southeast area, the Rio Grande Cone has been influenced by tectonic episodes since the Cretaceous until the Re¬ cent. Two and half dimensional seismic interpreta¬ tion on some sections along the surface and the subsurface show the presence of some features lo¬ cated on shelf. They include a fault system, geoforms and folds that influence the slope, proximal and distal shelf and the sea floor. The tectono-stratigraphyc analysis make the description of some geological as¬ pects in subsurface possible. As a consequence, a geological model was obtained by means of the seis¬ mic information and a velocity function within seis¬ mic interpretation (Sarta, 2004).
The geological mapping was obtained by means of the seismic stratigraphic interpretation on the Rio
Grande Cone . This interpretation allowed the division of the deep sedimentary package into several sequences and a driven-model from a sequential stratigraphy clas¬ sification could be made. To define seismic units (chronoestratigraphic unit referred as sequences), the first step was to define the unconformities and then rec¬ ognize the unit according to the facies, the seismic ex¬ pression and the attributes analyses.
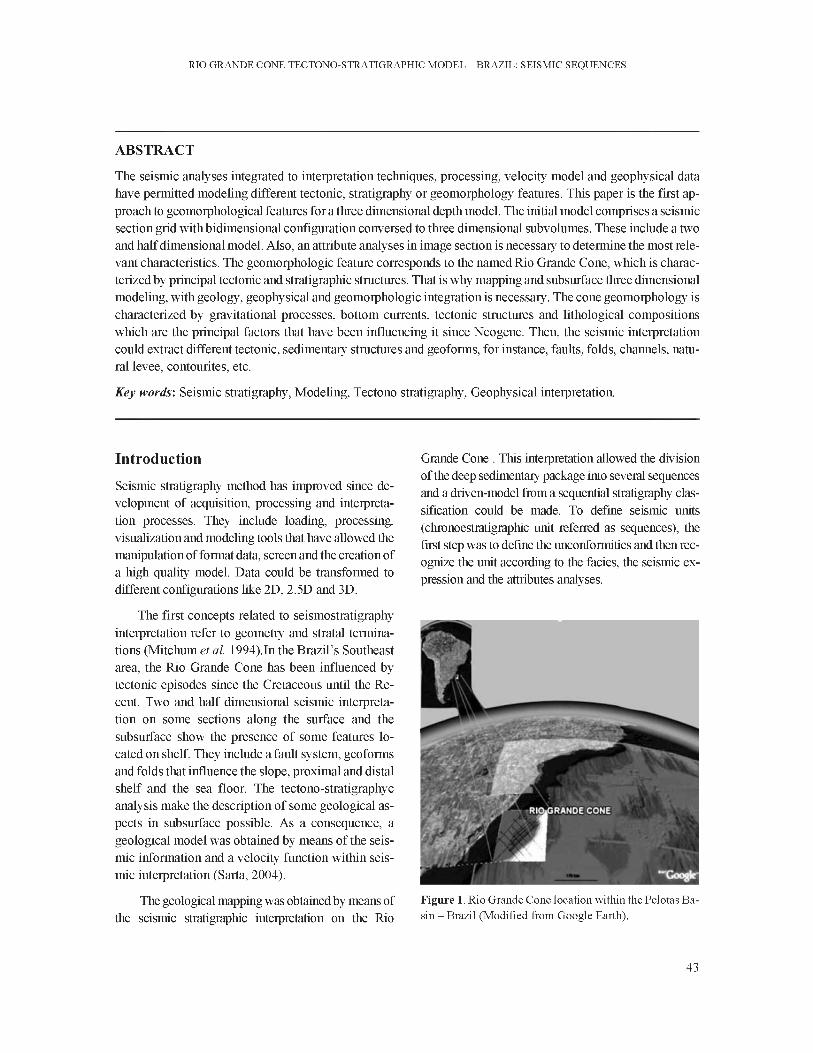
Figure 1. Rio Grande Cone location within the Pelotas Basin - Brazil (Modified from Google Earth).
43
CASTILLO., L.L.A, KAZMIERCZAK, T. DE S., AND CHEMALE., JR., F.
Geomorphology, geophysics and computational disciplines are powerful tools that could be integrated in order to obtain a 3D approach by using a driven-model method. This model allows the generation of a more realistic feature of the subsurface geomorphology. In this preliminary research a 3D model obtained from seismic interpretation in the Rio Grande Cone will be documented.
Location
Rio de la Plata and Rio Grande Cone were formed during the Maastrichtian/Danian Atlantic transgression in South America. The continental shelf and the depression are flooded by the sea. They are typical examples of geoforms can be seen on the Uruguay and Brazilian platforms. The Rio Grande Cone (RGC) is a relevant geoform that extends 28900 km 2
on the Brazilian offshore (Figure 1). It is a subsurface landscape semicircular-shaped noticeable feature that comprises a transition from shelf to slopes with a high amount of shale supply. Its source is the high¬ lands and the Brazilian craton.
Seismic Data
In this analysis, the data corresponds to 3577km of seismic lines that were acquired from Brazil's ANP, and other old printed sections (Fontana, 1996; Porto, 2007). Structural and straigraphy models were generated by means of software modules: Petrel 2008, Matlab (v. 7.0.1), Voxler, Seismic Unix and open source seismic interpretation software (OpendTect V3.03e).
The dominant frequency seismic information could be obtained from attributes analyses, i.e. an in¬ stantaneous frequency map, which exhibits a 30-35Hz dominant frequency and 90 us/ft slowness in the area. A 4ms sample rate, 5 to 10s record length and 28ms windows time analyses are comprised. In order to establish the wavelength, geophysical pa¬ rameters on Pelotas Basin whose average velocity is 3050 m/s and frequency of 30Hz need to be considered. The expression for wavelength is given by:
e=V/f. (1)
Then, e = 3048m/s / 40 Hz = 76,2m, by the e/4 => 76,2 m/4 = 19,05m => 62,5 feet.
These calculations determined that the obtained thickness for a minimum layer is between 20 to 100 feet (7 to 30m), otherwise it is not tuned. The seismic resolution limit in section data establishes what can and cannot be seen on subsurface.
Attribute Analysis
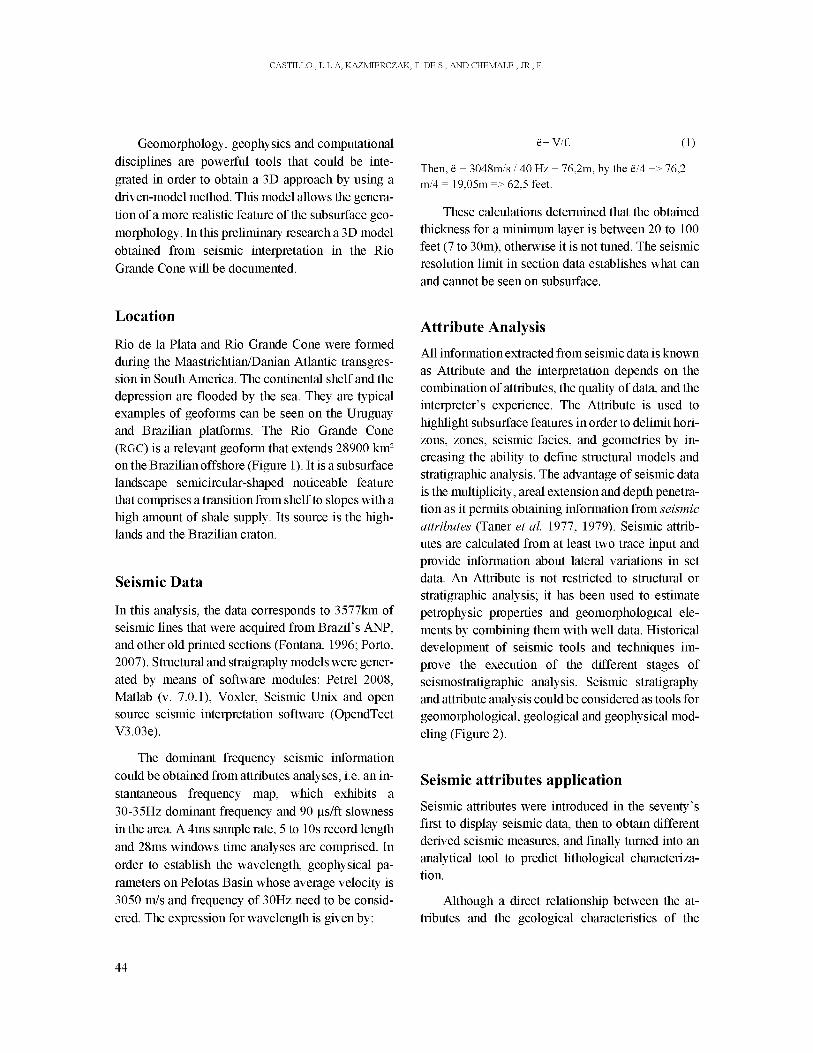
All information extracted from seismic data is known as Attribute and the interpretation depends on the combination of attributes, the quality of data, and the interpreter's experience. The Attribute is used to highlight subsurface features in order to delimit hori¬ zons, zones, seismic facies, and geometries by in¬ creasing the ability to define structural models and stratigraphic analysis. The advantage of seismic data is the multiplicity, areal extension and depth penetra¬ tion as it permits obtaining information from seismic attributes (Taner et al. 1977, 1979). Seismic attrib¬ utes are calculated from at least two trace input and provide information about lateral variations in set data. An Attribute is not restricted to structural or stratigraphic analysis; it has been used to estimate petrophysic properties and geomorphological ele¬ ments by combining them with well data. Historical development of seismic tools and techniques im¬ prove the execution of the different stages of seismostratigraphic analysis. Seismic stratigraphy and attribute analysis could be considered as tools for geomorphological, geological and geophysical mod¬ eling (Figure 2).
Seismic attributes application
Seismic attributes were introduced in the seventy's first to display seismic data, then to obtain different derived seismic measures, and finally turned into an analytical tool to predict lithological characteriza¬ tion.
Although a direct relationship between the at¬ tributes and the geological characteristics of the
44
RIO GRANDE CONE TECTONO-STRATIGRAPHIC M O D E L - B R A Z I L : SEISMIC SEQUENCES
Adquisition Processing Time line
Interpretation
1 D
1 2 D
CMP Configuration
Air Gun Marine
Digital Recording Digital Seismic Processing
Bright Spot Technology
Digital migration Comercial Seismic Attribute Comercial in colors
1970 Color Display
3Dsho t Introduction to Vertical Seismic Seismic Attribute concept
profile (Anstey) Energetic Crises
Dip Moveout Geophysicist Stratigraphy
1980 AVO analysis
Attribute proliferation Seismic Attributes
Ocean deep Cable e x p a n s i o n
Seismic Attributes Analysis
Texture Attributes
Analysis of Multi-Attributes
Attributes and Horizons
Classes
2000
Now
Synthetic Seismogram
Workstation
Complex Traces Analyses
Trace Complex
Seismic Stratigraphy Seismic Inversion Analyses
Horint Attributes Dip, zimur
3D autotracking
Attributes respose 3D Seismic (Brown)
Seismic Stratigraphy Sequences
Subsalt Imgen
Attribute analysis Attribute Classification
Coerence Attribute Introduction
Spectral decomposition
Neural network Geomorfología Sísmica
Volumentric Attributes
Spectral Inversion
Figure 2. Historical development of the seismic method: acquisition, from Liner, 2008; Chopra and Marfurt, 2005 and Friedman, 1998).
processing, interpretation and modeling (Adapted
1960
2.5 D
3 D
1990
4 D
Earth has not been established, almost all analyses describe several uses of seismic attributes i.e. classes' classification discriminator.
Recently, the seismic attribute application includes surfaces, horizon, geomorphology mapping, sequence stratigraphic interpretation, modeling subsurface and geobody information. They all have been accepted as tools to interpret old strata and pro¬ cesses through the use of modern survey (Posamentier and Kolla, 2003). Then seismic geo-morphology is an evolving field, building on the his-
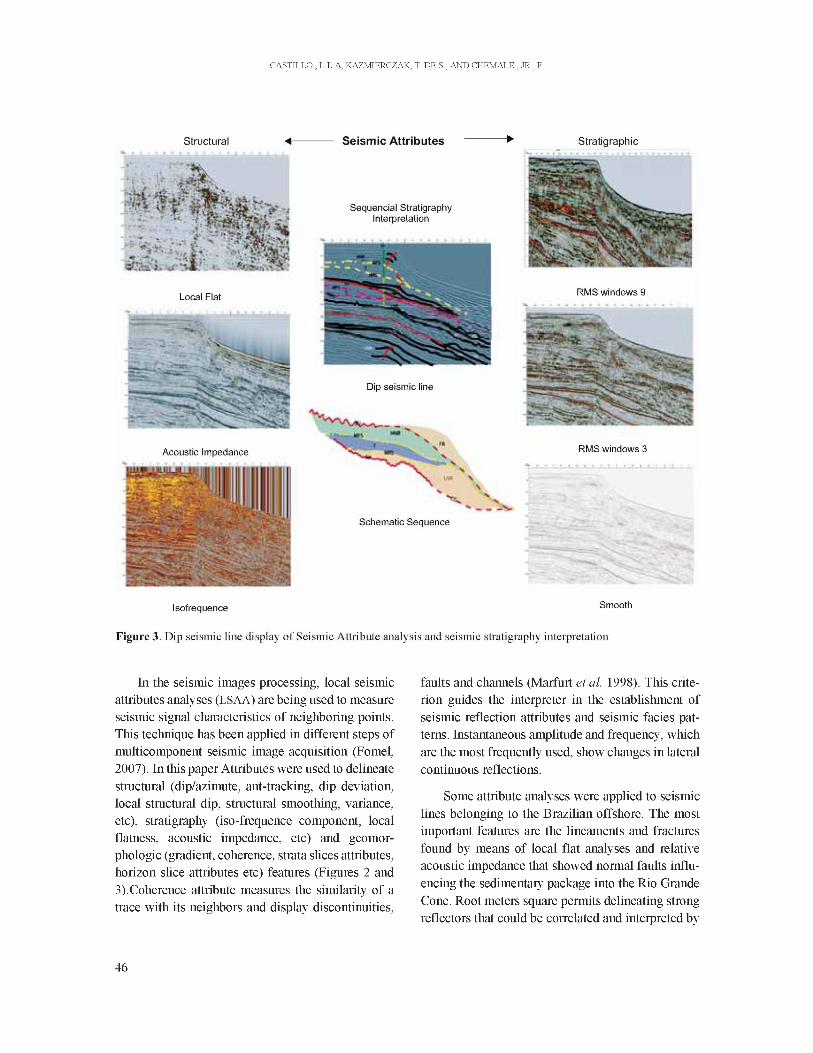
toric approaches of seismic stratigraphy, sequential stratigraphy, fluvial geomorphology and three dimensional modeling. Seismic attributes are used in structural, stratigraphy and geomorphologycal inter¬ pretation (Figure 3). An example of this is the improvement of image resolution thanks to the sophistication of computational systems that allow determining reservoir properties and their lateral continuity. Figure 3. Dip seismic line display of Seis¬ mic Attribute analysis and seismic stratigraphy inter¬ pretation
45
CASTILLO., L.L.A, KAZMIERCZAK, T. DE S., AND CHEMALE., JR., F.
In the seismic images processing, local seismic attributes analyses (LSAA) are being used to measure seismic signal characteristics of neighboring points. This technique has been applied in different steps of multicomponent seismic image acquisition (Fomel, 2007). In this paper Attributes were used to delineate structural (dip/azimute, ant-tracking, dip deviation, local structural dip, structural smoothing, variance, etc), stratigraphy (iso-frequence component, local flatness, acoustic impedance, etc) and geomor-phologic (gradient, coherence, strata slices attributes, horizon slice attributes etc) features (Figures 2 and 3).Coherence attribute measures the similarity of a trace with its neighbors and display discontinuities,
faults and channels (Marfurt et al. 1998). This crite¬ rion guides the interpreter in the establishment of seismic reflection attributes and seismic facies pat¬ terns. Instantaneous amplitude and frequency, which are the most frequently used, show changes in lateral continuous reflections.
Some attribute analyses were applied to seismic lines belonging to the Brazilian offshore. The most important features are the lineaments and fractures found by means of local flat analyses and relative acoustic impedance that showed normal faults influ¬ encing the sedimentary package into the Rio Grande Cone. Root meters square permits delineating strong reflectors that could be correlated and interpreted by
46
RIO GRANDE CONE TECTONO-STRATIGRAPHIC MODEL - BRAZIL: SEISMIC SEQUENCES
a sequence stratigraphic model, and delineated by geomorphological elements like channels.
Seismostratigraphy and sequence stratigraphy of the Rio Grande Cone
Rio Grande Cone is located in a passive margin basin characterized by several progradational systems sup¬ plied by fluvial and cratonic sediments influenced by sea level fluctuations. Some geological features have been reported by authors like Alves (1977); Fontana (1996) and Porto (2007).
Seismic section and attributes permit identifying structural, sedimentology, and geomorphology fea¬ tures and they allow determining structural and the stratigraphic sequences elements.
Tectonic structures description
The southeast of the Brazilian offshore is composed by sequences influenced by rift faults causing a half-graben configuration on the basal sequence. The Rio Grande Cone comprises pos-rift sequences. The Post-rift stage starts during Aptian, in which the
adiastrophic tectonic developed, influencing basal sequences, i.e., the Aptian-Albian sequence. Above it more than 3000 m of sediments belonging to Rio Grande Cone were laid (Fontana, 1996). Structural sequences are influenced by tectonic and sedimentary structures. Relevant structures correspond to active system faults until Pleistocene -late Wisconsin (Alves, 1977).
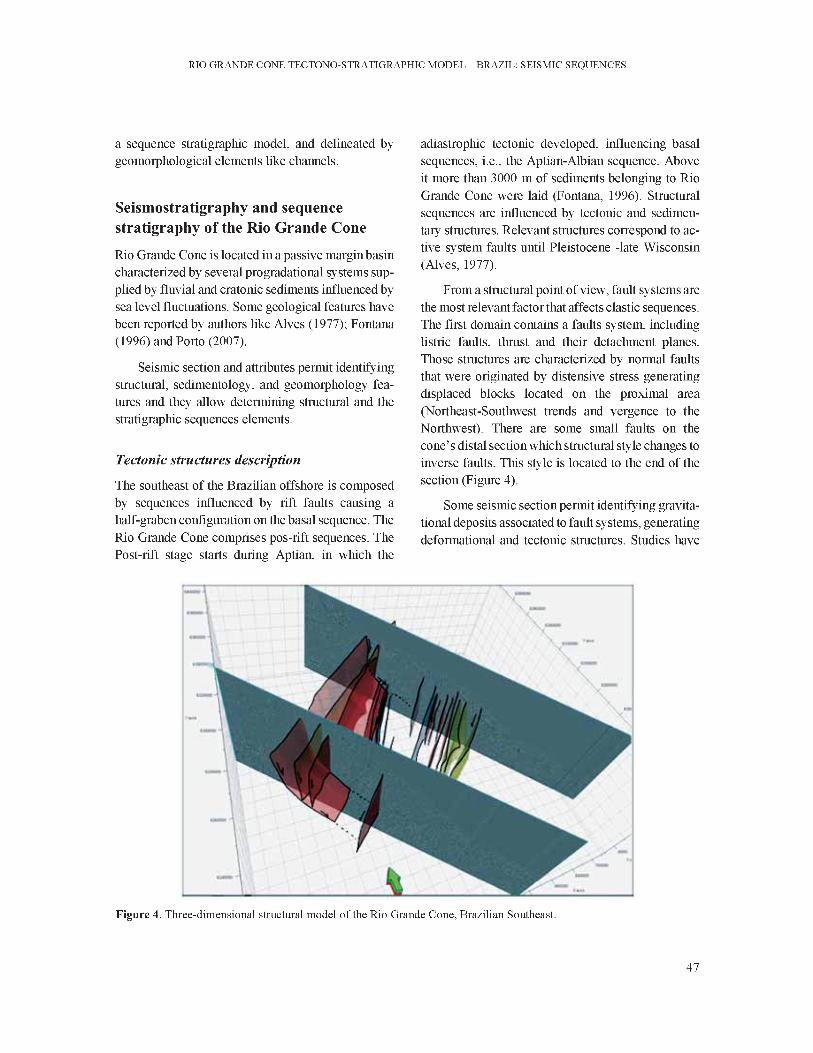
From a structural point of view, fault systems are the most relevant factor that affects clastic sequences. The first domain contains a faults system, including listric faults, thrust and their detachment planes. Those structures are characterized by normal faults that were originated by distensive stress generating displaced blocks located on the proximal area (Northeast-Southwest trends and vergence to the Northwest). There are some small faults on the cone's distal section which structural style changes to inverse faults. This style is located to the end of the section (Figure 4).
Some seismic section permit identifying gravitational deposits associated to fault systems, generating deformational and tectonic structures. Studies have
Figure 4. Three-dimensional structural model of the Rio Grande Cone, Brazilian Southeast.
47
CASTILLO., L.L.A, KAZMIERCZAK, T. DE S., AND CHEMALE., JR., F.
determined that some lineaments and faults were originated by fluids decompactation, and have influ¬ enced on the generation of fluid escape structures visible on the sea bottom's surface (Fontana, 1996; Porto, 2007).
The Rio Grande Cone constitutes a huge sedi¬ mentary package characterized by the result of chan¬ nel system morphology, sediment waves and contourities that have been influenced on the upper sequences by a distensional fault system that origi¬ nated normal faults to the North and inverse faults to the South.
Stratigraphic Sequence in the Rio Grande Cone
The seismic stratigraphic interpretation of the Pelotas Basin includes at least sixteen sequences (Butler, 1970; Fontana, 1996 and Porto, 2007). The cone's area has geoforms, internal structures and velocity models that can be described with geophysical meth¬ ods, for instance seismic refraction. The refraction
method revealed along to Rio Grande do Sul and the Uruguay's continental margin a 1.8 km/s wedge, and a velocity model for the sedimentary sequence (Alves, 1977). The wedge sedimentation lasted from Middle Miocene to Pleistocene. Stages of deposition and erosion were caused by eustatic sea level fluctua¬ tions, originating the development of four sedimen¬ tary sequences. The depocenters distribution suggests a source migration towards the continent, maybe due to marine transgression (Alves, 1977). A different interpretation for the Pelotas Basin and Florianopolis shelf established eight sedimentary se¬ quences using seismic reflection (Goncalves et al. 1979). Martins (1983) described the Rio Grande Cone as a sedimentary-originated deep sea feature supplied by Rio Grande do Sul highlands, with progradational deposition and gravitational pro¬ cesses (turbidities and another flux) modeled by bot¬ tom current. Some researchs reports hydrate gas in the Pelotas Basin, i.e., Fontana (1989), Rosa et al. (2006).
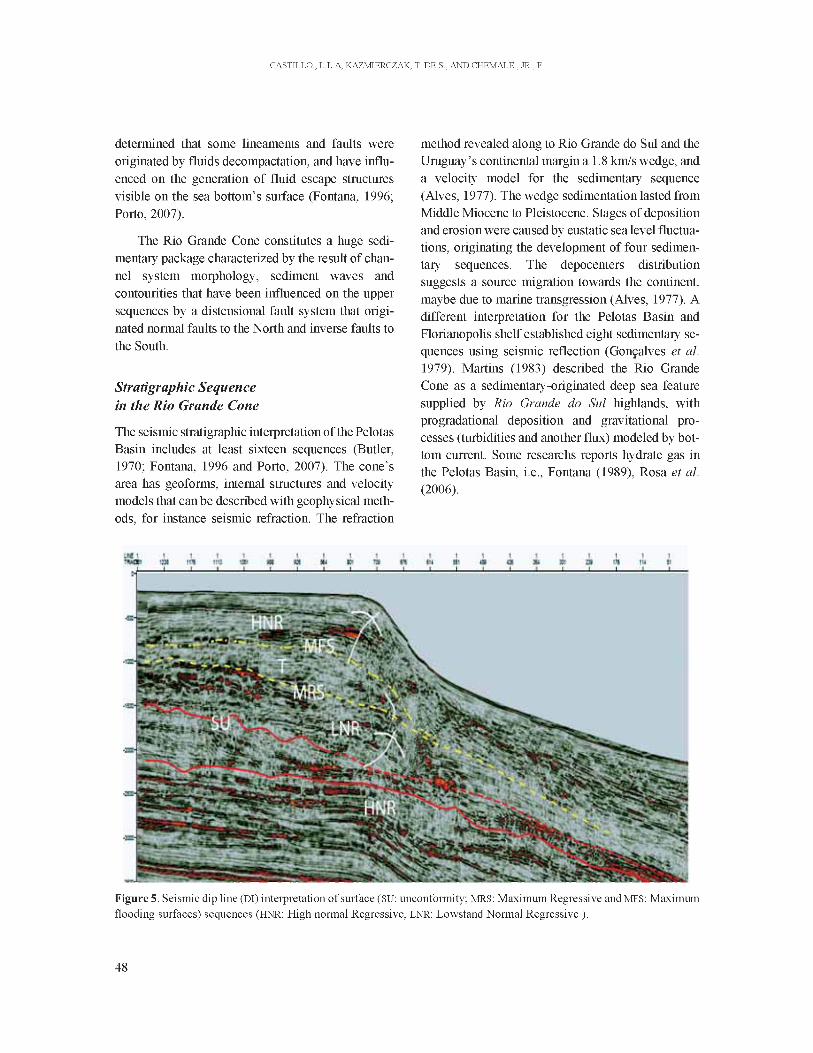
Figure 5. Seismic dip line (DI) interpretation of surface (SU: unconformity; MRS: Maximum Regressive and MFS: Maximum flooding surfaces) sequences (HNR: High normal Regressive, LNR: Lowstand Normal Regressive ).
48
RIO GRANDE CONE TECTONO-STRATIGRAPHIC MODEL - BRAZIL: SEISMIC SEQUENCES
The generated Trasgressive (T), highstand (HNR) and Lowstand regressive (LNR) could be iden¬ tified on seismic sections (Figure 5). The shelf edge suffered erosion resulting in the truncation of the prograding sediments. The eroded sediments fed it via suspension or gravitational processes. This feed¬ ing was four times greater than Holocene rates.
Seismo-stratigraphy and sequence stratigraphy description
In order to describe the evolution of the Rio Grande Cone, it is important to describe its tectono-stratigra-phy. The Cone comprises several Continental and
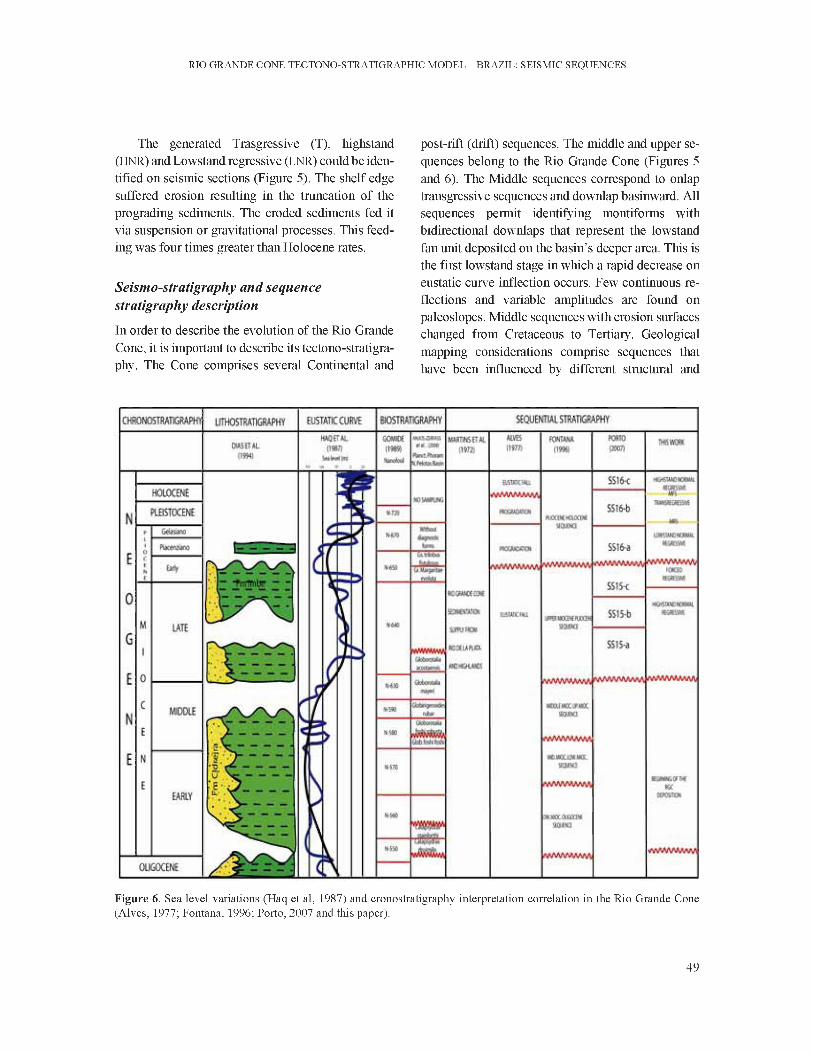
post-rift (drift) sequences. The middle and upper se¬ quences belong to the Rio Grande Cone (Figures 5 and 6). The Middle sequences correspond to onlap transgressive sequences and downlap basinward. All sequences permit identifying montiforms with bidirectional downlaps that represent the lowstand fan unit deposited on the basin's deeper area. This is the first lowstand stage in which a rapid decrease on eustatic curve inflection occurs. Few continuous re¬ flections and variable amplitudes are found on paleoslopes. Middle sequences with erosion surfaces changed from Cretaceous to Tertiary. Geological mapping considerations comprise sequences that have been influenced by different structural and
Figure 6. Sea level variations (Haq et al, 1987) and cronostratigraphy interpretation correlation in the Rio Grande Cone (Alves, 1977; Fontana, 1996; Porto, 2007 and this paper).
49
CASTILLO., L.L.A, KAZMIERCZAK, T. DE S., AND CHEMALE., JR., F.
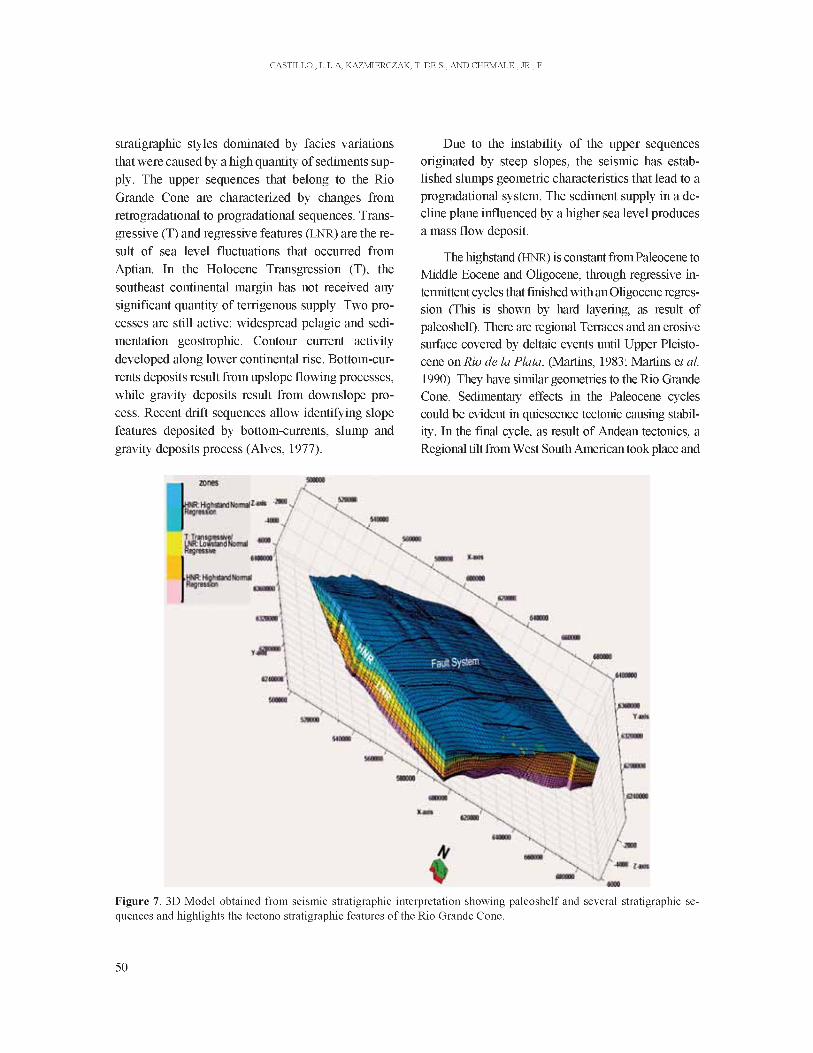
stratigraphie styles dominated by facies variations that were caused by a high quantity of sediments supply. The upper sequences that belong to the Rio Grande Cone are characterized by changes from retrogradational to progradational sequences. Trans-gressive (T) and regressive features (LNR) are the re¬ sult of sea level fluctuations that occurred from Aptian. In the Holocene Transgression (T), the southeast continental margin has not received any significant quantity of terrigenous supply. Two pro¬ cesses are still active: widespread pelagic and sedi¬ mentation geostrophic. Contour current activity developed along lower continental rise. Bottom-cur¬ rents deposits result from upslope flowing processes, while gravity deposits result from downslope pro¬ cess. Recent drift sequences allow identifying slope features deposited by bottom-currents, slump and gravity deposits process (Alves, 1977).
Due to the instability of the upper sequences originated by steep slopes, the seismic has established slumps geometric characteristics that lead to a progradational system. The sediment supply in a decline plane influenced by a higher sea level produces a mass flow deposit.
The highstand (HNR) is constant from Paleocene to Middle Eocene and Oligocene, through regressive intermittent cycles that finished with an Oligocene regres¬ sion (This is shown by hard layering, as result of paleoshelf). There are regional Terraces and an erosive surface covered by deltaic events until Upper Pleistocene on RiodelaPlata, (Martins, 1983; Martins etal. 1990). They have similar geometries to the Rio Grande Cone. Sedimentary effects in the Paleocene cycles could be evident in quiescence tectonic causing stabil¬ ity. In the final cycle, as result of Andean tectonics, a Regional tilt from West South American took place and
Figure 7. 3D Model obtained from seismic stratigraphic interpretation showing paleoshelf and several stratigraphic sequences and highlights the tectono stratigraphic features of the Rio Grande Cone.
50
RIO GRANDE CONE TECTONO-STRATIGRAPHIC MODEL - BRAZIL: SEISMIC SEQUENCES
caused the beginning of the sea level decrease and the deposition of progradantional sequences. This event could be coincident with Haq curve (Figure 6).
Rio Grande Modeling and MappingThe bound¬ aries and horizon picking obtained in 2,5-D configu¬ ration permitted constructing the three-dimensional subsurface image of the Rio Grande geoform (Figure 7). Seismic stratigraphic analyses and basal sequence mapping permit identifying platforms with regres¬ sive progradational sediments. The sequences are comprised by sequential systems in a marginal sag type since late Cretaceous. These correspond to the Pelotas Basin sequences.
The semicircular-shaped plan-view morphology extends to the Southeast and strike to the North. The thick recent sequences are crossed by faults systems and by the presence of geophysics anomalies, for in¬ stance a reflector that simulates the bottom surface (BSR). This reflector is an anomaly generated by the high impedances caused by hydrate gas presence. Below 500 ms, a system faults extends cutting allup-per sequences.
Near offset or proximal sector it includes some clinoform set which has been separated by internal downlap surfaces and are not faulted. Visualization and 3D modeling has allowed defining fault systems geometries (Figure 7), showing details of normal faults. This process includes fault propagation and could be interpreted as a polygonal faults system due to contraction factors and early fluid expulsion during possible burial, where compaction acts in different directions on clay rich sediments.The Rio Grande Cone progradational layering produce con¬ tinuous offlap, evidencing features like the conti¬ nental slope, the Marginal Cone, Progradational systems, and the upper interval that constitute recent continental Shelf (Urien et al. 2003). The last stage during the inferior Holocene sedimentary disper¬ sion included erosive process through submarine sedimentation.
Eustatic changes are less evident during the Neo¬ gene. The Highstand and Lowstand alternation could be aged Miocene and Pliocene. They are associated
to eustatic episodes with sea level changes that are controlled by Andean orogenic pulses.
ConclusionThe feature named Rio Grande Cone could be defined as a huge semicircular shape geo¬ logical body with a thick package of sediments. It is mainly a shale geoform. The area is influenced by complex structures that affect the whole sedimentary package. The Rio Grande Cone is overlying an older inferior and a middle sedimentary sequence that con¬ stitute the Pelotas Basin sequences. The cone com¬ prises the basin's younger sequence which is the upper sequence.The three dimensional analysis com¬ prises an academic research of seismic data applied to the modeling and visualization for interactive un¬ derstanding. This will permit a paleogeomorpholgy reconstruction of Rio Grande Cone.
A methodology and a typical sequence of seis¬ mic interpretation are given in this paper. The pur¬ pose is to show the importance of visualization, attribute analysis and modeling, especially in sequen¬ tial stratigraphy.
It is important to emphasize the use of different computational technologies as tools for data interpre¬ tation, visualization, and the recovery of information for the subsurface image by means of a velocity model.
Acknowledgments
This article was written for the Doctorate Program Research in the Federal University of Rio Grande do Sul (UFRGS - Porto Alegre, Brazil) sponsored by Na¬ tional University of Colombia. Thanks to National Petroleum Agency for providing some of the seismic lines used in this paper. Thanks to Schlumberger for the software contribution, especially to the technical support for Petrel's (Module and tools 2008), pro¬ cessing, visualization and seismic interpretation with the geophysical integration data.
References
Al-Husseini, M., Glover J. and Barley B. (1981). Dispersion Patterns of the Ground Roll in East-
51
CASTILLO., L.L.A, KAZMIERCZAK, T. DE S., AND CHEMALE., JR., F.
ern Saudi Arabia, Geophysics, Vol 46, p.
121-137.
Alves, E. C. (1977). Estrutura rasa do talude e sopé
da Margem Continental do Rio Grande do Sul e
Uruguai. Tese de Mestrado. Instituto de
Geociéncias, Universidade Federal do Rio
Grande do Sul, Porto Alegre/RS, 77p.
Al-Yahya, K.M. (1991). Application of the Partial
Karhunen-Loéve Transform to Suppress Ran
dom Noise in Seismic Sections: Geophys.
Prosp., 39, p. 77-93.
Anjos-zerfass, G., Souza, P. A., Chemale Jr. F. (2008).
Biocronoestratigrafia da Bacia de Pelotas: estado
atual e aplicacao na geologia do petróleo. Revista
Brasileira de Geociéncias 38(2), 42 - 62.
Butler, L. W. (1970). Shallow structure of the conti¬
nental margin southern Brazil and Uruguay.
Geological Society of America Bulletin, New
York, N.Y., V.81, p. 1079-1096Catuneanu, O.
(2006). Principles of sequence stratigraphy.
Elsevier's sciences & Technology. British Li
brary, p. 375.
Chopra, S. and Marfurt, K. J. (2005). Seismic attrib
utes - A historical perspective. Society Explora¬
tion Geophysicists 7 5 t h Anniversary.
Geophysics, Vol. 70, N. 5. 26 p.
D'Agosto, C., Marfurt, K. and Steven, J. (2003).
Modeling and Removal of Ground Roll from
Horizontal Component of C-Waves. SEG.
1981-1983.
Dias J. L., Silveira, D. P., Sad A. R. E., and Latgé M.
A. L. (1994). Estágio atual do conhecimento
geológico. Boletim de Geociéncias da Petrobras,
8(1), p. 235-245.
Fomel, S. (2007). Local seismic Attributes. Geo¬
physics. vol. 72. N. 3. Pag. A29-A33.
Fontana, R. L. (1989). Evidencias Geofísicas da
presenca de Hidratos de Gás na Bacia de Pelotas
- Brasil. Primer Cong. Soc. Bras. Geofísica,
7(1):93.
Fontana, R. L. (1996). Geotectónica e sismoestra-
tigrafia da Bacia de Pelotas Plataforma de
Florianópolis. Tese de Doutorado, Universidade
Federal do Rio Grande do Sul, Porto Alegre/RS.
214p. Friedman, M. G. (1998). Sedimentology and
stratigraphy in the 1950's to mid-1980s: The story
of a personal perspective. Episodes. Vol. 21. no. 3.
New York. USA. 172-177.
Gomide, J. (1989). Bacia de Pelotas - Bioes-
tratigrafia baseada em nanofóeseis calcáreos. In:
SBP, Congresso Brasileiro de Paleontologia,
Anais 11, 338-351.
Goncalves, A., Oliveira, M.A. and Oliveira, M. S.
(1979). Geología da Bacia de Pelotas e da
Plataforma de Florianópolis. Boletim Técnico da
Petrobrás, RJ. 79:157-174.Haq, B. U., Harden-
bol, J., and Vail, P. R. (1987). Chronology of
Fluctuations Sea Levels since the Triassic (250
years ago to Present): Science, V. 235,
p.1156-1167.
Jones, I. F., and Levy, S. (1987). Signal Noise En¬
hancement in Multichannel Seismic Data Pro¬
cessing: Geophys. Prosp., 35, p. 12-32.
Karsh, H., and Bayrak, Y. (2004). Using the Wiener
- Levinson Algorithm to Suppress Ground Roll.
Journal of Applied Geophysics 55, p 187-197.
Levy, A. and Linderbaurn, M. (2000). Sequential
Karhunen-Loève Basis Extraction and its Appli¬
cation to Images, IEEE Transactions on Image
Processing, Vol 9, N. 8, p. 1371-1374.
Liner, C. (2008). Time line data. American Associa¬
tion ofPetroleum Geologist - Explorer. Novem¬
ber. p 31.
Luo, Y., Marhoon, M., Al Dossary, S., and Alfaraj,
M. (2002). Edge-preserving smoothing and ap¬
plications: The leading edge, 22, 136, 138,
141-158.
Marfurt, K.J., Kirlin, R. L.,Farmer, S., L. and
Bahorich, M.S. (1998). 3-D seismic attributes
using a semblance-based coherence algorithm:
Geophysics, 63, 1150-1165.
52
RIO GRANDE CONE TECTONO-STRATIGRAPHIC M O D E L - B R A Z I L : SEISMIC SEQUENCES
Martins, L. R.; Uruen, C. M.; Buttler, L. W. (1972).
Provincias fisiográficas e sedimentos modernos
da margem continental Atlántica. Congresso
Brasileiro de Geologia, 26o, Belém-Pará.
Anais...Sociedade Brasileira de Geologia,
p.105-114.
Martins, I. L. (1983). Modelo Sedimentar do Cone
de Rio Grande. Tese de Doutoramento.
Instituto de Geociências, Universidade Fed¬
eral de Rio Grande do Sul, Porto Alegre, RS.
205p. Martins, L. R.; Martins, I. R. and Urien,
C.M. (1990). Episodios Dinámicos de Curta
Duraçào na Margem Continental do Rio
Grande do Sul: Registro e Importancia. Acta
Geológica Leopoldensia. 29 (2): 9-22. Sao
Leopoldo. Brasil. Mitchum, M. R. Jr., Sangree,
J., Vail, P., and Wornardt W. (1994).
Reconizing Sequences and System Tracts from
Well logs, Seismic Data, and Biostratigraphy:
Examples from the late Cenozoic ofthe Gulfof
Mexico. In: Weimer, P. and Posamentier, H.
W. (1994). Siliciclastic sequence stratigraphy:
recent developments and applications. Ameri¬
can Association of Petroleum Geologist,
Memoir, 58. p. 163-197.
Porto, R. A. (2007). Interpretaçào Sismoes-
tratigrafica da Porçào da Bacia de Pelotas que
engloba o Cone de Rio Grande e a Avaliaçào do
seu Potencial Petrolifero. Tese de Doutorado.
Universidade Estadual do Norte Fluminense.
Macaé/RJ. 264 f.
Posamentier, H., andKolla, V. (2003). Geomorphol-
ogy and Stratigraphy of Depositional Elements
in Deep-Water Settings. Journal of Sedimentary
Research; v.73; no. 3; p. 367-388.
Rosa, M. L. C., Ayup-Zouain, R. N., & Barboza, E.
G. (2006). Utilizacao de Secoes Sísmicas 2D na
Identificacao de zonas de escapes de Fluidos,
Gravel, N. 4. p. 109-118. Porto Alegre.
Scales, J. and Snider, R. (1998). ¿What is Noise?
Geophysics, Vol 63, p. 1122-1124. Sarta, E.
(2004). Implementación de un software de pre
proceso y análisis de datos sísmicos - Seismic -
UN. Geociencias - Universidad Nacional de Co¬
lombia. 163 p.
Taner, M. T., and Sheriff, R. E. (1977). Applications
of amplitude, frequency and other attributes to
stratigraphic and hydrocarbon determination:
American Association Petroleum Geologist,
Memoir 26, 301-327.
Taner, M. T., Kochler, F., Sheriff, R. E. (1979).
Complex Seismic trace analyses. Gephysics, 44,
no. 6, 1041-1063.
Urien, C. M., Martins, L. R. and Martins, I.R. (2003).
Paleoplataformas e Programacao Deltaica do
Neógeno na Margem Continental do Uruguai e
Norte a Argentina. Gravel N. 1. 40 - 46. Porto
Alegre - Brasil.
Yilmaz, O. (1987). Seismic Data Processing: Society