Rip current related drowning deaths and rescues in Australia2004–2011
B. Brighton1, S. Sherker1, R. Brander2, M. Thompson1, and A. Bradstreet1
1Surf Life Saving Australia, Locked Bag 1010, Rosebery, NSW 2018, Australia2School of Biological, Earth and Environmental Sciences, The University of New South Wales, Sydney, NSW 2052, Australia
Received: 4 December 2012 – Published in Nat. Hazards Earth Syst. Sci. Discuss.: –Revised: 15 February 2013 – Accepted: 25 February 2013 – Published: 22 April 2013
Abstract. Rip currents are a common hazard to beachgoersfound on many beaches around the world, but it has provendifficult to accurately quantify the actual number of rip cur-rent related drowning deaths in many regions and countries.Consequently, reported estimates of rip current drowning canfluctuate considerably and are often based on anecdotal evi-dence. This study aims to quantify the incidence of rip cur-rent related drowning deaths and rescues in Australia from2004 to 2011. A retrospective search was undertaken for fa-tal and non-fatal rip-related drowning incidents from Aus-tralia’s National Coronial Information System (NCIS), SurfLife Saving Australia’s (SLSA, 2005–2011) SurfGuard In-cident Report Database (IRD), and Media Monitors for theperiod 1 July 2004 to 30 June 2011. In this time, rip cur-rents were recorded as a factor in 142 fatalities of a total of613 coastal drowning deaths (23.2 %), an average of 21 peryear. Rip currents were related to 44 % of all beach-relateddrowning deaths and were involved in 57.4 % of reported ma-jor rescues in Australian locations where rips occur. A com-parison with international operational statistics over the sametime period describes rip-related rescues as 53.7 % of the to-tal rescues in the US, 57.9 % in the UK and 49.4 % in NewZealand. The range 49–58 % is much lower than 80–89 %traditionally cited. The results reported are likely to under-estimate the size of the rip current hazard, because we arelimited by the completeness of data on rip-related events;however this is the most comprehensive estimate to date.Beach safety practitioners need improved data collection andstandardized definitions across organisations. The collectionof drowning data using consistent categories and the routinecollection of rip current information will allow for more ac-curate global comparisons.
1 Introduction
It is well established that rip currents represent a sig-nificant hazard to bathers on many beaches around theworld (e.g. Klein et al., 2003; Sherker et al., 2008; Gensiniand Ashley, 2010; Scott et al., 2009; Brander et al., 2011).These strong, narrow seaward-flowing currents occur on anybeach characterised by waves breaking across a wide areaand can occur during conditions of both low and high waveenergy conditions on many different types of beaches (Short,2007). There are different types of rip currents (e.g. Dal-rymple et al., 2011; Leatherman, 2012), and most are easilycapable of carrying unsuspecting and both experienced andinexperienced bathers significant distances offshore. Batherscaught in rip currents often experience panic and exhaustionwhile fighting the current or attempting to escape it, whichunfortunately can lead to drowning (Brander et al., 2011).For this reason rip currents represent the greatest hazard tobathers on many of the world’s beaches and are the primaryreason for the establishment of lifeguard and lifesaver ser-vices in areas where they occur.
However, while we presently have a good scientific under-standing of the morphologic behaviour, occurrence and flowdynamics of rip currents (MacMahan et al., 2006; Dalrympleet al., 2011) and our knowledge of the people who get caughtin them is improving (Drozdzewski et al., 2012), we simplydo not know how many people drown or are rescued in ripcurrents. This is largely due to a lack of national reportingsystems in many countries as well as the logistical difficultiesinvolved in obtaining accurate and reliable incident reports.
It has therefore proven difficult to provide quantitativelyreliable estimates of rip current drowning deaths or theamount of surf rescues directly attributable to rips. For
Published by Copernicus Publications on behalf of the European Geosciences Union.
1070 B. Brighton et al.: Rip current related drowning deaths and rescues in Australia 2004–2011
example, in the United States it is widely reported by theUnited States Lifesaving Association (USLA) that the annualnumber of fatalities due to rip currents exceeds 100 (Brew-ster, 2010) and Lushine et al. (1999) estimated this numberto be closer to 150. However, using an analysis of histori-cal hazard event data, Gensini and Ashley (2010) suggestedthat on average 35 people die from rip currents each yearin the US. The discrepancy in these estimates is significantand, depending on which estimate is reported by the media,may have implications towards the perceived severity of thehazard to the general public, the funding and sponsorship ofvaluable rip current public education programs, and the pro-vision of lifeguarding services
A similar situation exists in Australia. More than 80 %of the Australia’s 22.6 million residents live within 50 kmof the coastline (CSIRO, 2011). Australian beaches are aprime recreational destination for locals, domestic and in-ternational tourists alike, receiving tens of millions of visitsper year (Blackwell, 2003). Many of these beaches are char-acterised by the existence of rip currents. Short (2007) esti-mated that approximately 17 500 rip currents occur on 30 %of Australia’s 10 685 mainland beaches at any given time.Not surprisingly, rip currents also account for a high inci-dence of drowning deaths and rescues on Australian beaches.Based on a survey of 689 surf rescues done on 124 beaches inNew South Wales during the 1989–1991 patrol season, Shortand Hogan (1991) estimated that 89 % of rescues were at-tributed to rip currents, and this value has been widely re-ported in the rip current literature (Brander et al., 2011; Hat-field et al., 2012; Miloshis and Stephenson, 2011; Sherkeret al., 2010).The aim of this paper is to quantify and describethe number and demographics of rip current related drowningdeaths and rescues in Australia. A current national estimateof the magnitude of the rip current hazard is necessary forevidence-based safety practice prioritization.
2 Methods
A retrospective search was undertaken for fatal and non-fatal drowning incident data obtained from the AustralianNational Coronial Information System (NCIS), Media Mon-itors and Surf Life Saving Australia’s (SLSA, 2005–2011)SurfGuard Incident Report Database (IRD).
SLSA is Australia’s major water safety, drowning preven-tion, and rescue authority. The organisation provides vol-unteer lifesaving services from 310 Surf Life Saving Clubs(SLSCs) around the country. Volunteer patrols are usuallycarried out over weekends and public holidays during ex-tended summer seasons. SLSA also provides a professionallifeguard service, the Australian Lifeguard Service (ALS),to 63 local government areas. ALS lifeguards patrol on bothweekends and weekdays during the extended summer period.SLSA lifesavers and ALS lifeguards together perform an av-erage of 13 151 rescues per year (SLSA, 2005–2011).
The SurfGuard IRD is a web-based portal used by SLSAservices to electronically record incident reports. Reports arerequired when treatment is administered after an incidentsuch as a carnival incident, minor first aid, major first aid,or major rescues. Reports for search and rescue operations,member injuries, employee injuries, marine stings, and gen-eral complaints are also recorded. The reports are regularlyuploaded to the SurfGuard database by club, branch, or statepersonnel.
Media monitor services track and monitor news publishedin newspapers, magazines, journals, television, radio, inter-net and social networking sites. Our subscription results in apublication produced bi-monthly that includes media relatingto SLSA and Australia’s coastal incidents and hazards.
SLSA’s National Coastal Safety Report (2011) defines acoastal drowning death as “a fatality arising from the pro-cess of respiratory impairment from submersion/immersionin the foreshore, seabed, coastal water, and air space above alarge body of water (harbour/bay/inlet), including areas upto 2 nautical miles (NM) offshore and of which the land-ward boundary is the line of mean high water, except thatwhere that line crosses a river/inlet, the landward bound-ary at that point shall be the point upstream that is cal-culated by multiplying the width of the river/inlet mouthby 5”. These coastal/inland boundaries have been adoptedfrom New Zealand’s Resource Management Amendment Act1993 (NZ, 1993).
A search query was performed on NCIS for all deathsdue to drowning between 1 July 2004 and 30 June 2011.NCIS case files were searched according to mechanism 1“threat to breathing” and specifically mechanism 2 “drown-ing or near-drowning”. NCIS documents (including coronialfindings, autopsy reports, toxicology reports, and police re-ports) were also searched for inclusion of the following textinstances: “drown”, “drowning”, or “immersion”. Incidentswere defined as rip current related when witness statementsincluded the cause as a rip current, a strong current taking thedeceased out to sea or the individual being swept away froma surf beach. Deaths that were reported as unintentional, un-known intent and unlikely to be known intent were included.Deaths were excluded if they met the following conditions:the cause was reported as intentional; drowning was not theprimary cause of death; or drowning occurred at an inlandlocation or more than 2 NM offshore.
Fatal drowning incidents were verified by each State SurfLife Saving Centre, and compiled for analysis by Surf LifeSaving Australia’s Operations and Research Departments.The following variables were recorded for each fatal drown-ing incident: state; date; drowning location; GPS coordi-nates; time; age; gender; incident type; activity information;whether the incident was work-related; whether is was en-tered into IRD; IRD number; NCIS case number; whetherthe case is open/closed; whether the case was reported bythe state; the original source of information; drowning lo-cation suburb; local government area; postcode; associated
B. Brighton et al.: Rip current related drowning deaths and rescues in Australia 2004–2011 1071
SLS club; month; day; season; quarter; victim’s name; ad-dress; residence country; residence distance to coastline; res-idence distance to drowning location; victim’s birth coun-try; nationality; time in Australia; main language; additionalactivity information; the victim’s experience in the activity;whether the incident was rip current related; detailed de-scription of the incident; details relating to alcohol, drugs, orhealth conditions; weather conditions; wind conditions; seaconditions/wave size; wave type; water surface; temperature;tides; distance to a lifeguarding service; whether or not thelocation was patrolled at the time; personnel who first sightedthe incident; first rescued; other services; and resuscitationdetails.
Non-fatal drowning incidents were compiled from inci-dent reports in the IRD. All incidents categorised as “majorrescues” were examined from 1 July 2004 to 30 June 2011.A major rescue is defined by SLSA as a rescue where a per-son who required assistance was returned to shore (or placeof safety) and who without assistance would have drownedor become injured. The variables reported for each incidentwere as follows: date; location; patient; rip type; incidenttype; contributing factors; incident description; and nature ofinjury.
Incidents were considered rip current related if the inci-dent reports included the following: (i) an associated “riptype” as “permanent”, “fixed”, “travelling”, or “flash”; or theoption “rip type” within the “contributing factors” category;or (ii) the “incident description” included the patient beingcaught in a rip current. Descriptions included text such as“swept/washed offshore/out to sea”, “struggling in currentsunable to return to shore”, or “caught in strong current” (ex-cept where incident was at a river mouth or creek). Majorrescues that were land-based (i.e. caught in tree, impaled onland, vehicular accidents) were also excluded from the anal-ysis.
In order to compare Australian SLSA results with thoseoverseas, operational statistics from 2004 to 2011 were ob-tained via personal request from the United States LifesavingAssociation (USLA), the United Kingdom Royal NationalLifeboat Institute (RNLI), and Surf Life Saving New Zealand(SLSNZ). The USLA data describe the “total rescues” and“rip” rescues for each year. RNLI data are described as “totalwater assists” and “with rip current as a factor”. SLSNZ dataare described as “number of rescues” and “rip identified as afactor”.
3 Results
3.1 Fatalities
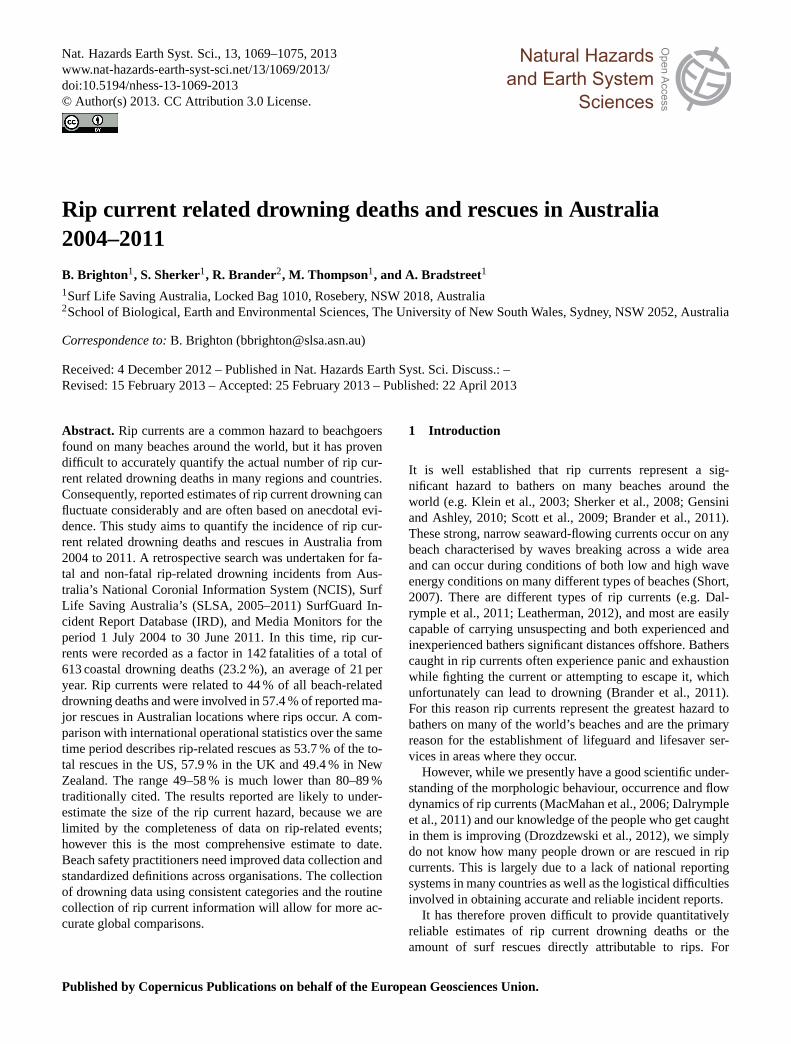
Overall, there were 613 coastal drowning deaths recordedfrom 1 July 2004 to 30 June 2011 in Australia. Of these,rip currents were a confirmed factor in 142 of the drowningdeaths (23.2 %, 0.10 per 100 000 pop., Fig. 1) ascertained
13
Figure 1: Coastal drowning death rates and those that are related to rip currents in Australia from 2004-05 to 2010-11
0
0.05
0.1
0.15
0.2
0.25
0.3
0.35
0.4
0.45
0.5
Rat
e (
pe
r 1
00
,00
0 p
op
.)
Coastal Drowning Death Rate
Rip Current Related Drowning Death Rate
Fig. 1.Coastal drowning death rates and those that are related to ripcurrents in Australia from 2004–2011.
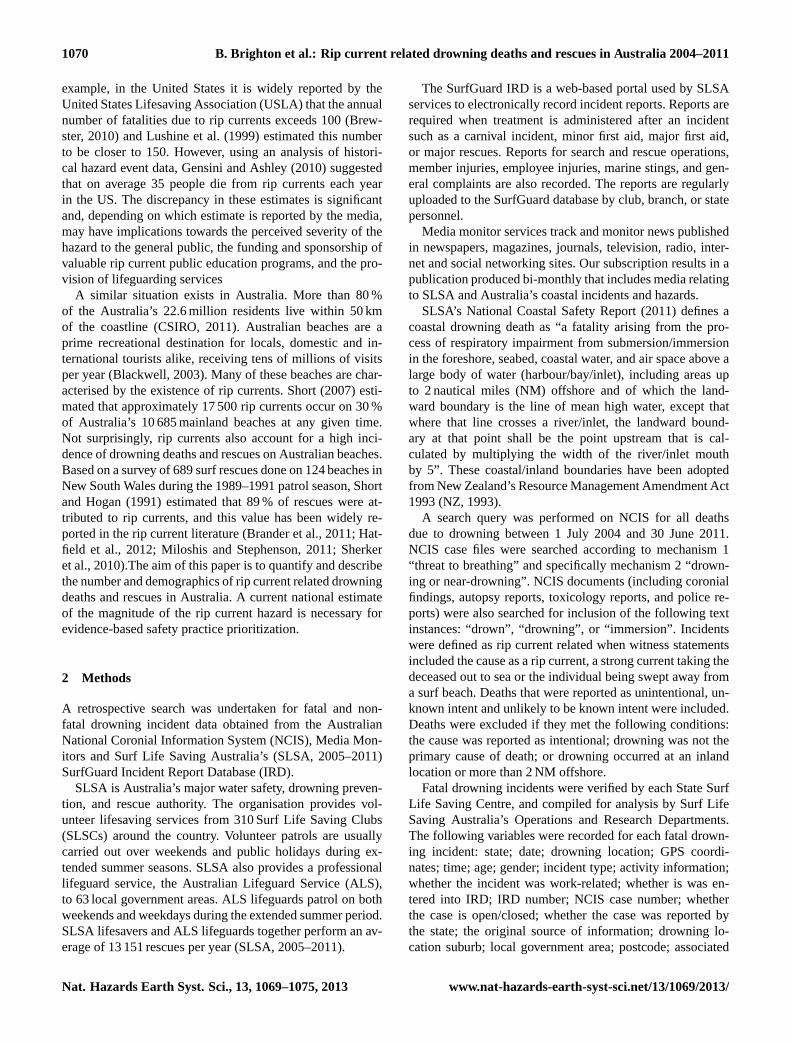
from the incident report descriptions. As shown in Fig. 2a,the number of annual rip current drowning deaths variedfrom 12–30 over the seven-year period with an average of 21rip current related deaths per year. The percentage of drown-ing deaths attributed to rip currents also varied from 17–34 %with an average of 23 %. Of note, there appears to be a de-creasing trend in the number of rip current drowning deathsin this period. However, as rip currents are primarily a beach-related phenomenon, it is also useful to examine the relativeproportion of beach-related drowning caused by rip currents.Of the 613 coastal drowning deaths, 293 (48 %) were codedas occurring at a beach location. Out of the 142 rip currentrelated deaths, 130 were coded as occurring at a beach loca-tion. This suggests that at least 44 % of all beach drowningdeaths are attributable to rip currents.
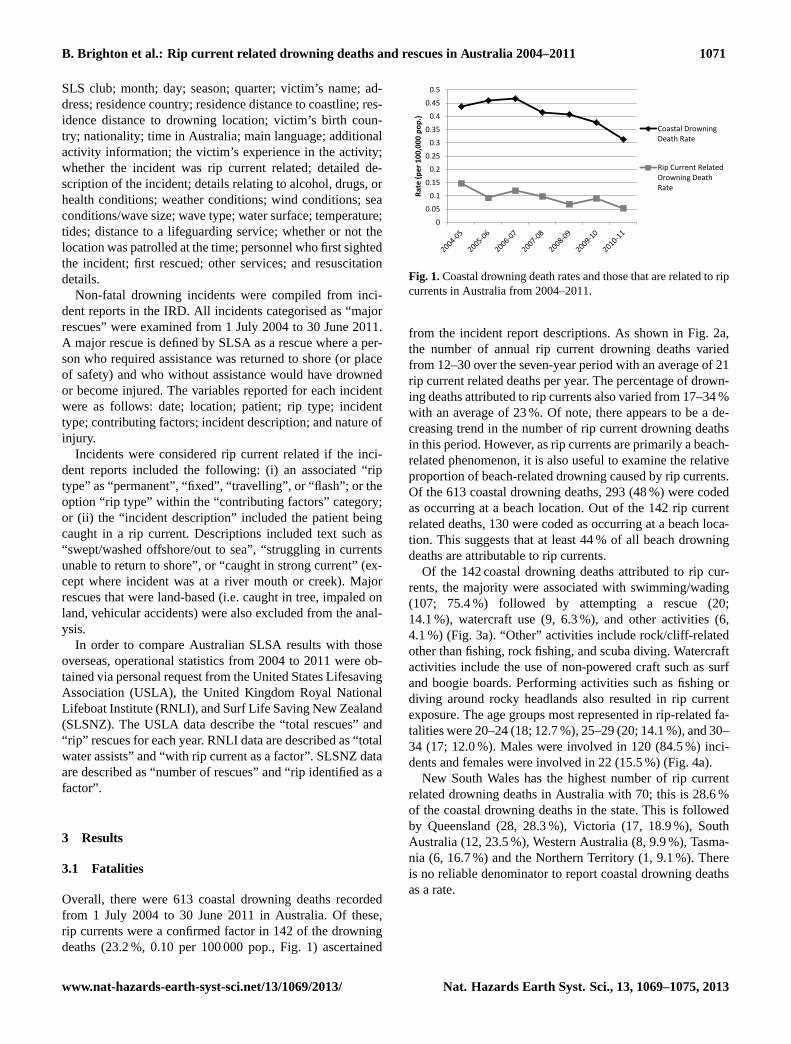
Of the 142 coastal drowning deaths attributed to rip cur-rents, the majority were associated with swimming/wading(107; 75.4 %) followed by attempting a rescue (20;14.1 %), watercraft use (9, 6.3 %), and other activities (6,4.1 %) (Fig. 3a). “Other” activities include rock/cliff-relatedother than fishing, rock fishing, and scuba diving. Watercraftactivities include the use of non-powered craft such as surfand boogie boards. Performing activities such as fishing ordiving around rocky headlands also resulted in rip currentexposure. The age groups most represented in rip-related fa-talities were 20–24 (18; 12.7 %), 25–29 (20; 14.1 %), and 30–34 (17; 12.0 %). Males were involved in 120 (84.5 %) inci-dents and females were involved in 22 (15.5 %) (Fig. 4a).
New South Wales has the highest number of rip currentrelated drowning deaths in Australia with 70; this is 28.6 %of the coastal drowning deaths in the state. This is followedby Queensland (28, 28.3 %), Victoria (17, 18.9 %), SouthAustralia (12, 23.5 %), Western Australia (8, 9.9 %), Tasma-nia (6, 16.7 %) and the Northern Territory (1, 9.1 %). Thereis no reliable denominator to report coastal drowning deathsas a rate.
1072 B. Brighton et al.: Rip current related drowning deaths and rescues in Australia 2004–2011
14
Figure 2: A. Rip related drowning deaths in Australia from 2004-05 to 2010-11 (n=142)
B. Rip related major rescues in Australia from 2004-05 to 2010-11 (n=602)
0
5
10
15
20
25
30
35
0
5
10
15
20
25
30
35
Pro
po
rtio
n o
f al
l Co
asta
l Dro
wn
ing
De
ath
s
Nu
mb
er
(n)
Number (n)
Percentage (%) 0
10
20
30
40
50
60
70
0
20
40
60
80
100
120
140
160
180
Pro
po
rtio
n o
f al
l Co
asta
l Drw
on
ing
De
ath
s
Nu
mb
er
(n)
Number (n)
Percentage (%)
B A
Fig. 2. (A) Rip-related drowning deaths in Australia from 2004–2005 to 2010–2011 (n = 142) and(B) rip-related major rescues in Australiafrom 2004–2011 (n = 602).
15
Figure 3: A. Activities related to rip related drowning deaths in Australia 2004-11 (n=142)
B. Activities related to rip current rescues in Australia 2004-11 (n=602)
75.4%
14.1%
6.3%
4.1%
Swimming/Wading
Attempting Rescue
Watercraft
Other
82.9%
11.6%
2.0% 0.8% 2.7%
Swimming/Wading
Watercraft
Attempting rescue
Snorkelling
Other
A B
Fig. 3. (A) Activities related to rip-related drowning deaths in Australia 2004–2011 (n = 142) , and(B) activities related to rip current rescuesin Australia 2004–2011 (n = 602).
3.2 Major rescues
SLSA volunteer lifesavers and ALS lifeguard services per-formed a total of 92 058 rescues (average 13 151 per year)during the patrol seasons from 2004 to 2011. The vastmajority of these were simply logged as a “rescue” withoutinformation given relating to the actual cause, so the amountof total rescues directly related to rip currents is im-possible to ascertain. Therefore, this study focussed onthe number of “major rescue” incidents which made up1.4 % (1246 rescues) of the reported total. Of these “majorrescue” events, 602 (48.3 %) were recorded as related to ripcurrents. As shown in Fig. 2b, between 2004 and 2011 thenumber of rip current related major rescues ranged from 53–170 and the percentage from 34–65 %. On average, therewere 86 (48 %) rip current related major rescues per year.
Of the 602 major rescues attributed to rip currents, thedominant associated activity of the individuals involved wasswimming/wading (499; 82.9 %). This was followed by wa-tercraft use (70; 11.6 %), attempting a rescue (12, 2.0 %),snorkelling (5, 0.8 %), and other (16, 2.7 %). “Other” activi-
ties include rock/cliff-related other than fishing, rock fishing,and scuba diving (Fig. 3b).
The age group most represented in rip-related major res-cues was the 15–19 (90; 15 %) age bracket. This was fol-lowed by 10–14 (75, 12.5 %) and 20–24 (44, 7.3 %). Therewere 224 (37.3 %) incidents where age was not recorded.Males were involved in at least 294 (48.8 %) incidents and fe-males were involved in at least 156 (26.0 %). There were 152(25.3 %) incidents where gender was not recorded (Fig. 4b).
3.3 Other reasons for major rescues on surf beaches
Major rescues that were described to be at a locationother than a surf beach have been removed for this anal-ysis (n = 198), because the locations are unaffected by ripcurrents. These included those that occurred in lagoons orrock pools (n = 89), boating incidents offshore or at a barcrossing (n = 81), as a result of aircraft, hang glider, sky-diving, kite surfer or wind surfer malfunction (n = 18), or inriver/creek locations (n = 10). The proportion of rip-relatedrescues increased from 48.3 % to 57.4 % when these majorrescues known to be in areas unaffected by rips are removed.
B. Brighton et al.: Rip current related drowning deaths and rescues in Australia 2004–2011 10735
Figure 4: A. Age group and gender of rip current related drowning deaths in Australia 2004-11
(n=142)
B. Age group and gender of rip current related rescues in Australia 2004-11 (n= 367)*
*Incidents of unknown age or gender are not reported here
0
2
4
6
8
10
12
14
16
18
20
0-4
5-9
10
-14
15
-19
20
-24
25
-29
30
-34
35
-39
40
-44
45
-49
50
-54
55
-59
60
-64
65
-69
70
-74
75
-79
80
+
Nu
mb
er
(n)
Age Group (years)
Female
Male
0
2
4
6
8
10
12
14
16
18
20
0-4
5-9
10
-14
15
-19
20
-24
25
-29
30
-34
35
-39
40
-44
45
-49
50
-54
55
-59
60
-64
65
-69
70
-74
75
-79
80
+
Nu
mb
er
(n)
Age Group (years)
Female
Male
B
A
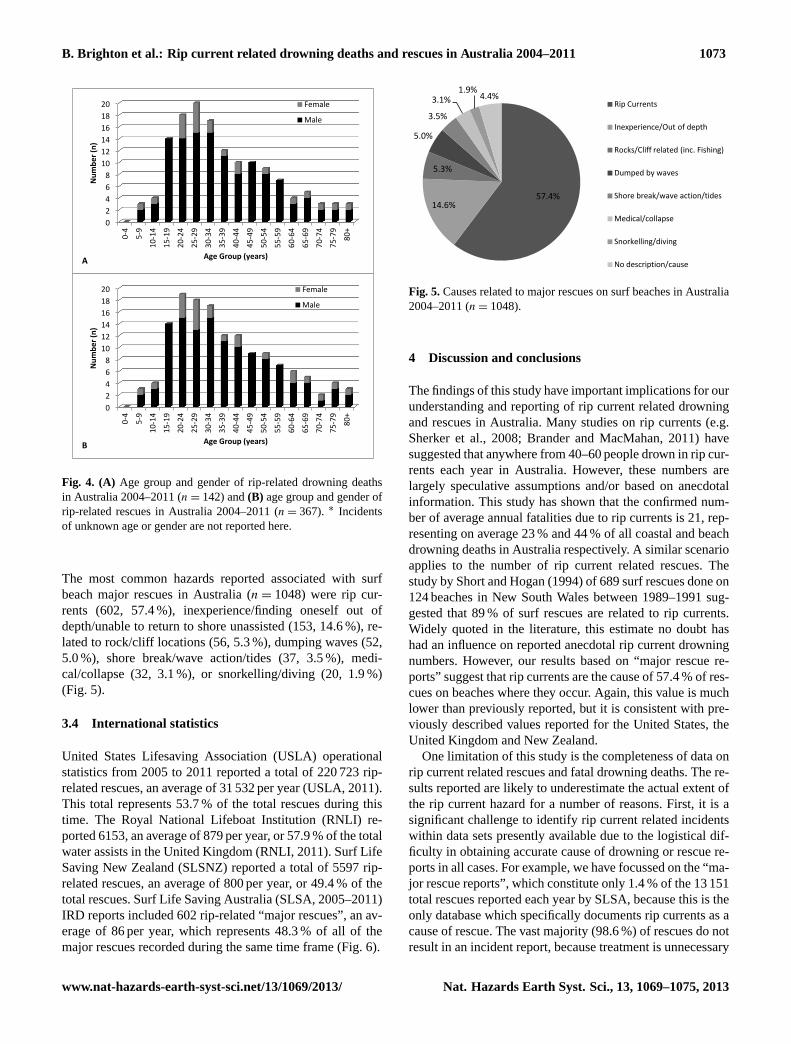
Fig. 4. (A) Age group and gender of rip-related drowning deathsin Australia 2004–2011 (n = 142) and(B) age group and gender ofrip-related rescues in Australia 2004–2011 (n = 367). ∗ Incidentsof unknown age or gender are not reported here.
The most common hazards reported associated with surfbeach major rescues in Australia (n = 1048) were rip cur-rents (602, 57.4 %), inexperience/finding oneself out ofdepth/unable to return to shore unassisted (153, 14.6 %), re-lated to rock/cliff locations (56, 5.3 %), dumping waves (52,5.0 %), shore break/wave action/tides (37, 3.5 %), medi-cal/collapse (32, 3.1 %), or snorkelling/diving (20, 1.9 %)(Fig. 5).
3.4 International statistics
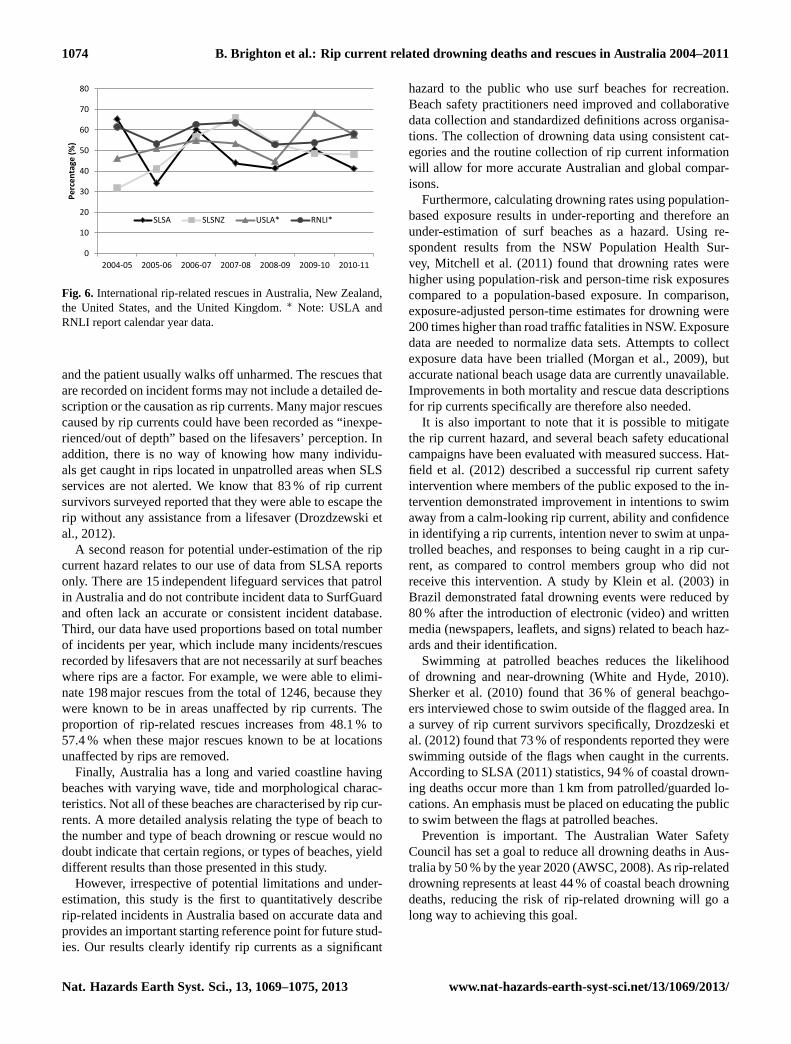
United States Lifesaving Association (USLA) operationalstatistics from 2005 to 2011 reported a total of 220 723 rip-related rescues, an average of 31 532 per year (USLA, 2011).This total represents 53.7 % of the total rescues during thistime. The Royal National Lifeboat Institution (RNLI) re-ported 6153, an average of 879 per year, or 57.9 % of the totalwater assists in the United Kingdom (RNLI, 2011). Surf LifeSaving New Zealand (SLSNZ) reported a total of 5597 rip-related rescues, an average of 800 per year, or 49.4 % of thetotal rescues. Surf Life Saving Australia (SLSA, 2005–2011)IRD reports included 602 rip-related “major rescues”, an av-erage of 86 per year, which represents 48.3 % of all of themajor rescues recorded during the same time frame (Fig. 6).
17
Figure 5: Causes related to major rescues on surf beaches in Australia 2004-11 (n=1048)
57.4% 14.6%
5.3%
5.0%
3.5%
3.1% 1.9%
4.4% Rip Currents
Inexperience/Out of depth
Rocks/Cliff related (inc. Fishing)
Dumped by waves
Shore break/wave action/tides
Medical/collapse
Snorkelling/diving
No description/cause
Fig. 5.Causes related to major rescues on surf beaches in Australia2004–2011 (n = 1048).
4 Discussion and conclusions
The findings of this study have important implications for ourunderstanding and reporting of rip current related drowningand rescues in Australia. Many studies on rip currents (e.g.Sherker et al., 2008; Brander and MacMahan, 2011) havesuggested that anywhere from 40–60 people drown in rip cur-rents each year in Australia. However, these numbers arelargely speculative assumptions and/or based on anecdotalinformation. This study has shown that the confirmed num-ber of average annual fatalities due to rip currents is 21, rep-resenting on average 23 % and 44 % of all coastal and beachdrowning deaths in Australia respectively. A similar scenarioapplies to the number of rip current related rescues. Thestudy by Short and Hogan (1994) of 689 surf rescues done on124 beaches in New South Wales between 1989–1991 sug-gested that 89 % of surf rescues are related to rip currents.Widely quoted in the literature, this estimate no doubt hashad an influence on reported anecdotal rip current drowningnumbers. However, our results based on “major rescue re-ports” suggest that rip currents are the cause of 57.4 % of res-cues on beaches where they occur. Again, this value is muchlower than previously reported, but it is consistent with pre-viously described values reported for the United States, theUnited Kingdom and New Zealand.
One limitation of this study is the completeness of data onrip current related rescues and fatal drowning deaths. The re-sults reported are likely to underestimate the actual extent ofthe rip current hazard for a number of reasons. First, it is asignificant challenge to identify rip current related incidentswithin data sets presently available due to the logistical dif-ficulty in obtaining accurate cause of drowning or rescue re-ports in all cases. For example, we have focussed on the “ma-jor rescue reports”, which constitute only 1.4 % of the 13 151total rescues reported each year by SLSA, because this is theonly database which specifically documents rip currents as acause of rescue. The vast majority (98.6 %) of rescues do notresult in an incident report, because treatment is unnecessary
Fig. 6. International rip-related rescues in Australia, New Zealand,the United States, and the United Kingdom.∗ Note: USLA andRNLI report calendar year data.
and the patient usually walks off unharmed. The rescues thatare recorded on incident forms may not include a detailed de-scription or the causation as rip currents. Many major rescuescaused by rip currents could have been recorded as “inexpe-rienced/out of depth” based on the lifesavers’ perception. Inaddition, there is no way of knowing how many individu-als get caught in rips located in unpatrolled areas when SLSservices are not alerted. We know that 83 % of rip currentsurvivors surveyed reported that they were able to escape therip without any assistance from a lifesaver (Drozdzewski etal., 2012).
A second reason for potential under-estimation of the ripcurrent hazard relates to our use of data from SLSA reportsonly. There are 15 independent lifeguard services that patrolin Australia and do not contribute incident data to SurfGuardand often lack an accurate or consistent incident database.Third, our data have used proportions based on total numberof incidents per year, which include many incidents/rescuesrecorded by lifesavers that are not necessarily at surf beacheswhere rips are a factor. For example, we were able to elimi-nate 198 major rescues from the total of 1246, because theywere known to be in areas unaffected by rip currents. Theproportion of rip-related rescues increases from 48.1 % to57.4 % when these major rescues known to be at locationsunaffected by rips are removed.
Finally, Australia has a long and varied coastline havingbeaches with varying wave, tide and morphological charac-teristics. Not all of these beaches are characterised by rip cur-rents. A more detailed analysis relating the type of beach tothe number and type of beach drowning or rescue would nodoubt indicate that certain regions, or types of beaches, yielddifferent results than those presented in this study.
However, irrespective of potential limitations and under-estimation, this study is the first to quantitatively describerip-related incidents in Australia based on accurate data andprovides an important starting reference point for future stud-ies. Our results clearly identify rip currents as a significant
hazard to the public who use surf beaches for recreation.Beach safety practitioners need improved and collaborativedata collection and standardized definitions across organisa-tions. The collection of drowning data using consistent cat-egories and the routine collection of rip current informationwill allow for more accurate Australian and global compar-isons.
Furthermore, calculating drowning rates using population-based exposure results in under-reporting and therefore anunder-estimation of surf beaches as a hazard. Using re-spondent results from the NSW Population Health Sur-vey, Mitchell et al. (2011) found that drowning rates werehigher using population-risk and person-time risk exposurescompared to a population-based exposure. In comparison,exposure-adjusted person-time estimates for drowning were200 times higher than road traffic fatalities in NSW. Exposuredata are needed to normalize data sets. Attempts to collectexposure data have been trialled (Morgan et al., 2009), butaccurate national beach usage data are currently unavailable.Improvements in both mortality and rescue data descriptionsfor rip currents specifically are therefore also needed.
It is also important to note that it is possible to mitigatethe rip current hazard, and several beach safety educationalcampaigns have been evaluated with measured success. Hat-field et al. (2012) described a successful rip current safetyintervention where members of the public exposed to the in-tervention demonstrated improvement in intentions to swimaway from a calm-looking rip current, ability and confidencein identifying a rip currents, intention never to swim at unpa-trolled beaches, and responses to being caught in a rip cur-rent, as compared to control members group who did notreceive this intervention. A study by Klein et al. (2003) inBrazil demonstrated fatal drowning events were reduced by80 % after the introduction of electronic (video) and writtenmedia (newspapers, leaflets, and signs) related to beach haz-ards and their identification.
Swimming at patrolled beaches reduces the likelihoodof drowning and near-drowning (White and Hyde, 2010).Sherker et al. (2010) found that 36 % of general beachgo-ers interviewed chose to swim outside of the flagged area. Ina survey of rip current survivors specifically, Drozdzeski etal. (2012) found that 73 % of respondents reported they wereswimming outside of the flags when caught in the currents.According to SLSA (2011) statistics, 94 % of coastal drown-ing deaths occur more than 1 km from patrolled/guarded lo-cations. An emphasis must be placed on educating the publicto swim between the flags at patrolled beaches.
Prevention is important. The Australian Water SafetyCouncil has set a goal to reduce all drowning deaths in Aus-tralia by 50 % by the year 2020 (AWSC, 2008). As rip-relateddrowning represents at least 44 % of coastal beach drowningdeaths, reducing the risk of rip-related drowning will go along way to achieving this goal.
B. Brighton et al.: Rip current related drowning deaths and rescues in Australia 2004–2011 1075
Acknowledgements.The authors would like to acknowledgeChris Brewster of the United States Lifesaving Association, RossMacLeod of the Royal National Lifeboat Institution, and BrettSullivan of Surf Life Saving New Zealand for providing operationalstatistics.
Edited by: I. DidenkulovaReviewed by: two anonymous referees
References
Australian Water Safety Council: Australian Water Safety Strategy:Reducing drowning deaths by 50 % by 2020, AWSC, Sydney,2008–2011.
Blackwell, B.: The economics of coastal foreshore and beach man-agement: Use, safe bathing facilities, erosion and conservation,PhD Thesis, School of Economics, The Univ. of Qld, 2003.
Brander, R. and MacMahan, J.: Future Challenges for Rip CurrentResearch and Outreach, in: Rip Currents; Beach Safety, PhysicalOceanography and Wave Modeling, edited by: Leatherman, S.and Fletemeyer, J., CRC Press, Boca Raton, FL., 1–29, 2011.
Brander, R., Bradstreet, A., Sherker, S., and MacMahan, J.: Re-sponses of swimmers caught in rip currents: Perspectives on mit-igating the global rip current hazard, Int. J. Aquat. Res. Edu., 5,476–482, 2011.
Brewster, B.: Rip current misunderstandings, Nat. Hazards, 55,161–162, 2010.
Dalrymple, R., MacMahan, J., Reniers, A., and Nelko, V.: Rip Cur-rents, Annu. Rev. Fluid Mech., 43, 551–581, 2011.
Drozdzewski, D., Shaw, W., Dominey-Howes, D., Brander, R., Wal-ton, T., Gero, A., Sherker, S., Goff, J., and Edwick, B.: Surveyingrip current survivors: preliminary insights into the experiences ofbeing caught in rip currents, Nat. Hazards Earth Syst. Sci., 12,1201–1211,doi:10.5194/nhess-12-1201-2012, 2012.
Gensini, V. and Ashley, W.: An examination of rip current fatalitiesin the United States, Nat. Hazards, 54, 159–75, 2010.
Hatfield, J., Williamson, A., Sherker, S., Brander, R., and Hayen,A.: Development and evaluation of an intervention to reduce ripcurrent related beach drowning, Accident Anal. Prev., 46, 45–52,2012.
Klein, A., Santana, C., Diehl, E., and De Menezes, J.: An analysis ofhazards associated with sea bathing: Results of five years workin oceanic beaches of Santa Catarina State, southern Brazil, J.Coastal Res., SI 35, 107–116, 2003.
Leatherman, S. P.: Undertow, Rip Current or Riptide, J. CoastalRes., 28, iii–v, 2012.
Lushine, J., Fletemeyer, J., and Dean, R.: Toward a predictive modelfor rip currents and their impact on public safety with emphasison physical, demographic, and cultural considerations. Drown-ing: New Perspectives on Intervention and Prevention, edited by:Fletemeyer, J. and Freas, S., CRC Press, Boca Raton, Fl., 281–303, 1999.
MacMahan, J., Thornton, E., and Reniers, A.: Rip current review,Coast. Eng., 53, 191–208, 2006.
Miloshis, W. and Stephenson, W.: Rip current escape strategies:lessons for swimmers and coastal rescue authorities, Nat. Haz-ards, 59, 823–832, 2011.
Mitchell, R., Williamson, A., and Olivier, J.: Estimates of drowningmorbidity and mortality adjusted for exposure risk response, Inj.Prev., 17, 359–360, 2011.
Morgan, D., Ozanne-Smith, J., and Triggs, T.: Direct observationmeasurement of drowning risk exposure for surf bathers, J. Sci.Med. Sport, 12, 457–462, 2009.
New Zealand Government Resource Management Act,http://www.legislation.govt.nz/act/public/1991/0069/latest/DLM230265.html, (last access: 9 October 2012), 1991.
Royal National Lifeboat Institution (RNLI) Annual OperationalStatistics Report 2011,http://rnli.org/SiteCollectionDocuments/2011%20Operational%20Statistics%20Report%20LR.pdf, (lastaccess: 9 October 2012), 2011.
Scott, T. M., Russell, P. E., Masselink, G., and Wooler, A.: Rip cur-rent variability and hazard along a macro-tidal coast, J. CoastalRes., SI 50, 1–6, 2009.
Sherker, S., Brander, R., Finch, C., and Hatfield, J.: Why Australianeeds an effective national campaign to reduce coastal drowning,J. Sci. Med. Sport, 11, 81–83, 2008.
Sherker, S., Williamson, A., Hatfield, J., Brander, R., and Hayen,A.: Beachgoers’ beliefs and behaviours in relation to beach flagsand rip currents, Accident Anal. Prev., 42, 1785–1804, 2010.
Short, A.: Australian Rip Systems-Friend or Foe?, J. Coastal Res.,SI 50, 7–11, 2007.
Short, A. and Hogan, C.: A three year study into the circumstancesbehind surf based rescues, in: NSW Beach Safety Program, Syd-ney, 19 pp., 1991.
Short, A. and Hogan, C.: Rip currents and beach hazards: Their im-pact on public safety and implications for coastal management,J. Coastal Res., SI 12, 197–209, 1994.
Surf Life Saving Australia: Annual Report, SLSA, Sydney, SurfLife Saving Australia: National Coastal Safety Report, SLSA,Sydney, 2005–2011.
USLA: United States Lifesaving Association Statistics,http://www.usla.org/?page=STATISTICS, (last access: 9 October 2012),2011.
White, K. and Hyde, K.: Swimming between the flags: A prelimi-nary exploration of the influences on Australians’ intentions toswim between the flags at patrolled beaches, Accident Anal.Prev., 42, 1831–1838, 2010.