United States Department of Agriculture Forest Service Pacific Northwest Research Station General Technical Report PNW-GTR-830 December 2010 Riparian Adaptive Management Symposium: A Conversation between Scientists and Management
Transcript
United StatesDepartment ofAgriculture
Forest Service Pacific NorthwestResearch Station
General Technical ReportPNW-GTR-830
December 2010
Riparian Adaptive Management Symposium: A Conversation between Scientists and Management
The Forest Service of the U.S. Department of Agriculture is dedicated to the principle of multiple use management of the Nation’s forest resources for sustained yields of wood, water, forage, wildlife, and recreation. Through forestry research, cooperation with the States and private forest owners, and management of the national forests and national grasslands, it strives—as directed by Congress—to provide increasingly greater service to a growing Nation.
The U.S. Department of Agriculture (USDA) prohibits discrimination in all its programs and activities on the basis of race, color, national origin, age, disability, and where applicable, sex, marital status, familial status, parental status, religion, sexual orientation, genetic information, political beliefs, reprisal, or because all or part of an individual’s income is derived from any public assistance program. (Not all prohibited bases apply to all programs.) Persons with disabilities who require alternative means for communication of program information (Braille, large print, audiotape, etc.) should contact USDA’s TARGET Center at (202) 720-2600 (voice and TDD). To file a complaint of discrimination, write USDA, Director, Office of Civil Rights, Room 1400 Independence Avenue, SW, Washington, DC 20250-9410 or call (800) 795-3272 (voice) or (202) 720-6382 (TDD). USDA is an equal opportunity provider and employer.
Technical EditorsDouglas F. Ryan is an ecologist and decision support specialist, U.S. Department of Agriculture, Forest Service, Pacific Northwest Research Station, Focused Science Delivery Program, 3625 93rd Ave. SW, Olympia, WA 98512. John M. Calhoun is Director of the Olympic Natural Resources Center, School of Forest Resources, College of the Environment, University of Washington, 1455 S. Forks Avenue, Forks, WA 98331.
Papers were provided by the authors in camera-ready form for printing. Authors are responsible for the content and accuracy. Opinions expressed may not necessarily reflect the position of the U.S. Department of Agriculture.
The use of trade or firm names in this publication is for reader information and does not imply endorsement by the U.S. Department of Agriculture of any product or service.
CoverGordon H. Reeves, USDA Forest Service, Pacific Northwest Research Station (red salmon, upper left photo). Jason Walters, USDA Forest Service, Shasta-Trinty National Forest (debris flow, upper right photo). Brian Fransen, Weyerhaeuser Co. (Schultz Creek, lower photo).
Riparian Adaptive Management Symposium:
A Conversation between Scientists
and ManagementForks, Washington
November 3–4, 2008
Douglas F. Ryan and John M. Calhoun Technical Editors
U.S. Department of Agriculture, Forest ServicePacific Northwest Research Station
Portland, Oregon General Technical Report
PNW-GTR-830 December 2010
Published in cooperation with: U.S. Department of Agriculture
Symposium Sponsors
University of WashingtonOlympic Natural Resources Centerwww.onrc.washington.edu/
USDA Forest ServicePacific Northwest Research Stationwww.fs.fed.us/pnw
Washington State Department of Natural Resourceswww.wa.gov/dnr
AbstractRyan, Douglas F.; Calhoun, John M., tech. eds. 2010. Riparian adaptive manage-ment symposium: a conversation between scientists and management. Gen. Tech. Rep. PNW-GTR-830. Portland, OR: U.S. Department of Agriculture, Forest Service, Pacific Northwest Research Station. 135 p.
Scientists, land managers and policy makers discussed whether riparian (stream side) forest management and policy for state, federal and private lands in western Washington are consistent with current science. Answers were mixed: some aspects of riparian policy and management have a strong basis in current science, while other aspects may not. Participants agreed that the same body of science, originally synthe-sized by the Forest Ecosystem Management Team (FEMAT) report in 1993, underlies most current federal, state and private land policy and management of riparian areas. With some exceptions, that underlying science base has been supported by most recent research. However, some riparian forest policy and management in western Washington have been implemented in ways that may drive riparian areas toward static and uniform conditions over large areas, an outcome that may not be consistent with current science consensus. Current thinking in the scientific community is that sustaining high aquatic productivity at the scale of large landscapes or river basins probably depends on maintaining dynamic and heterogeneous riparian conditions driven by disturbance processes that operate over large spatial and temporal scales. Recognition of this inconsistency of policy and management with current science appeared to be new, especially for the management and policy communities. Partici-pants suggested steps to address the identified science-policy gap, including analyses to identify specifically what policies are and are not consistent with current science and landscape-scale experiments to test the effectiveness of management alternatives that apply current science.
Riparian Adaptive Mangement Symposium: A Conversation between Scientists and Managers
The goal of this symposium was to ask whether riparian forest policy and management in western Washington is consistent with the current science consensus on riparian processes. This is a cogent ques-tion because, although they are related to one another, changes in science, policy and management do not necessarily occur at the same pace. The mechanisms that align them (e.g. technology transfer, legislation, legal actions, public opinion etc,) sometimes act only after long delays. Further complicating this question, policies guiding management of forested riparian areas are significantly different on federal, State and private lands. Answers that came out of our two-day sympo-sium were mixed: some aspects of riparian policy and management are consistent with current science, but in other areas there appear to be gaps between policy and management and current science. Recognition of some gaps seems to be new, especially for the manage-ment and policy communities. Participants could only outline implications of the gaps because detailed analy-ses have not yet been done. I review what gaps were identified, touch on some of their potential implications and suggest some actions that scientists, forest manag-ers and environmental policy makers might consider to mend these gaps.
There was general agreement among scientists, policy makers and managers at the symposium that the same body of science underlies the current policy and management guidelines for riparian areas on federal, State and private forest lands in Western WA. Much of that body of science was originally synthesized by the Forest Ecosystem Management Team (FEMAT) report (FEMAT 1993), which was developed for use in formulating the Northwest Forest Plan for managing federal lands in western WA, and in western OR, and
northern CA as well. The State of Washington sub-sequently adopted the same science basis to develop its guidelines for riparian management of State and private forest lands for the Cascade Mountains and westward. Specific policy and management guidelines themselves are different for federal, State and private lands, primarily because their legal, economic and political environments are not alike, but their underly-ing science basis is essentially the same.
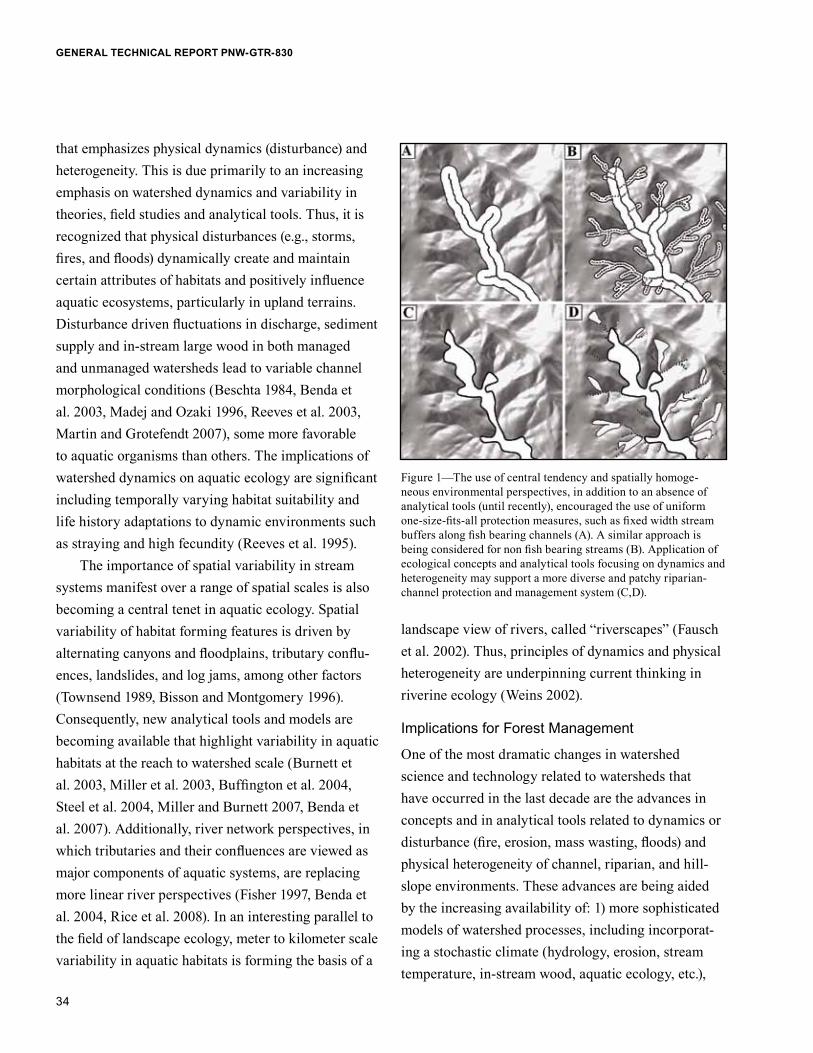
Two parts of the FEMAT science base that were adopted into policy and management, were the focus of much discussion: the first was a series of relationships that described how various ecological functions of the riparian zone change with distance away from the stream bank (often called the “FEMAT curves”), and the second was the hypothesis that the most productive aquatic conditions occurred in “old growth” forests. Gordon H. Reeves, who had been a member of the FEMAT team, related that both of these components of the FEMAT report represented a synthesis of the scien-tific literature available in 1993 and the professional opinion of the FEMAT scientists.
Most of the studies at that time had been done at the scale of individual stream reaches and most of the reaches that were studied were in old-growth forests representing a relatively narrow range of riparian con-ditions. The team also assumed that because aquatic productivity of stream reaches increased with time after severe disturbance, that productivity of native fishes would be maximized in “old growth” conditions because they assumed that “old growth” riparian areas would have had the longest time to develop.
Since the FEMAT report, scientific studies of the relationship between stream habitat and riparian conditions have added to both the depth and range of available knowledge. Riparian processes are now
Douglas F. Ryan, US Forest Service PNW Research Station
Executive Summary and Synthesis
viii
GENERAL TECHNICAL REPORT PNW-GTR-830
better understood at both the reach scale and at larger spatial and temporal scales. This broader knowledge base indicates that the productivity of fish populations depends on processes that occur over landscapes and whole river basins. Recent studies have also largely affirmed the relationships that were embodied in the FEMAT curves, i.e. additional studies found that ripar-ian functions were, for the most part, well described by the curves. However, Lee Benda related that the more rich data currently available on riparian conditions at the reach scale combined with modern geospatial modeling tools now permits these relationships to be predicted taking local factors into consideration. This ability to model riparian influence on stream habitat [analogous to “FEMAT” curves] that vary from point to point along a stream, depending on locally controlling factors, was not available at the time of the FEMAT report. Thus, although the functional rela-tionships between riparian width and aquatic habitat, described by the original FEMAT curves, continues to be supported by current science, more recent data and modeling capabilities can reliably predict how local influences affect these relationships at different places along a stream network. These new capabilities mean that policy and management no longer have to rely on the “one-size-fits-all”, average values for these critical relationships that were in the FEMAT report.
Perhaps the most interesting emergent scientific findings were that the most productive aquatic/ripar-ian systems are not necessarily being found in “old growth” riparian conditions. Rather, highly produc-tive aquatic/riparian sites have been found within a watershed-scale mix of forest conditions of which late-seral forests are only a part. In addition, highly productive aquatic conditions are patchy and do not occur over large areas and are closely associated with certain channel geomorphic characteristics (e.g., floodplains, stream junctions, confined to unconfined
channel transitions). These spatially limited patches of favorable physical habitat for salmon and trout are associated with riparian areas that developed after a severe disturbance about 100 to 200 years in the past. The evidence seems to also indicate that productivity declines as those patches continue to age beyond one to two centuries after disturbance. This dynamic behavior and patchy distribution is linked to the pattern of where severe disturbance events (e.g. intense wildland fires, major floods, large landslides, etc.) intersect with the riparian/stream network. An implication of this finding is that riparian conditions conducive to high aquatic productivity have probably been temporally dynamic and spatially heterogeneous across the landscape for a long time, and were so even before European settlement when fish were more abundant than in the present. Interestingly this would imply that current patches with the highest quality fish habitat are legacies of disturbance events that occurred in the 19th century, before industrialized society exerted strong influences on disturbance patterns in much of the Northwest landscape. This development pattern applies to physical habitat and should not be confused with the different pattern aquatic food webs follow after disturbance. Studies of foodwebs after Mount St. Helens’ eruption and the Yellowstone fires, for example, found that aquatic food webs usually peak within 2 decades or less after disturbance, responding to short-term abundances of resources including nutri-ents and light. Food webs usually decline thereafter as these resources dwindle. Food web transients can con-tribute to fish abundance while they are occurring, but their short duration means they contribute relatively little to long-term sustainability of fish populations at landscape scales. The general consensus among the scientists at the workshop was that sustaining high aquatic productivity at the scale of large landscapes or river basins probably depends on maintaining dynamic
ix
Riparian Adaptive Mangement Symposium: A Conversation between Scientists and Managers
and heterogeneous processes of riparian disturbance and the associated processes that develop high quality physical aquatic habitat for fish.
Symposium participants did not explore in detail what parts of current riparian policy and management guidelines are based on the FEMAT curves (i.e. on maintaining favorable riparian conditions at the reach level). Most likely policy and management that are affirmed by current science probably include, but are not limited to, guidelines for setting riparian buffer widths or conservation zones and the riparian man-agement permitted within these stream-side forests, which are different on federal, State and private lands. In other words, policy and management measures designed to create conditions in riparian areas favor-able to fish productivity at the reach level continue to have a strong science basis, but further analysis will be needed to identify specifically what parts federal, State and private management guidelines the current science affirms.
Presentations by the scientific panelists indicated that implementation of riparian forest policy and man-agement in western Washington strongly influences the distribution of riparian conditions across larger landscapes and river basins. This distribution may not be consistent with current science consensus about what riparian conditions are most favorable for the productivity of native fishes (e.g. Bisson et al. 2009). By adopting goals for riparian and aquatic condition based on “average” and “old growth” targets and applying them to large areas, management and policy guidelines may have, in effect, set goals for managing riparian and aquatic ecosystems that are static in time and uniform over large areas. In theory, these static and homogenous policy goals may not be adequate to sustain the diverse landscape conditions that are neces-sary for resilient and productive watersheds needed to achieve high levels of long-term aquatic productivity.
The scientists hypothesized that spatially uniform and temporally static goals for riparian areas might even be an impediment to restoring highly productive aquatic systems. Their logic followed this path: uniform conditions may prevent aquatic systems from cycling through the full range of disturbance and recovery stages that produce highly productive riparian and aquatic states. In addition, the scientists hypothesized that these static riparian and aquatic conditions also may not conserve the genetic diversity of life cycle patterns in salmon populations that give them the resiliency to respond when aquatic conditions change.
Policies setting underlying riparian goals that are essentially static and homogenous have become an integral part of many of the management guidelines that drive the goals for riparian management on federal, State and private forest lands in western Wash-ington. Discussions at the symposium did not indicate that current management and policy guidelines neces-sarily preclude practices that might produce dynamic and heterogeneous riparian conditions. Because they promote uniform conditions over large areas, however, current policy and management guides do little to encourage treatments that would lead to ecologically diverse landscapes that could maintain critical func-tions that were formerly produced by natural distur-bance regimes. The types of management decisions in which static assumptions may influence on-the-ground implementation are probably numerous. For example, these goals play a role in selecting what criteria are used to designate riparian reserves or buffers, how to assess the quality of riparian/aquatic habitat conditions (favorable or unfavorable for fish species of concern), what monitoring protocols to select to measure effec-tiveness, how to select and implement monitoring protocols and how to interpret monitoring results. However, the participants did not systematically analyze in detail the significance of the implications
x
GENERAL TECHNICAL REPORT PNW-GTR-830
of these static assumptions for forest policy and man-agement of federal, State and private lands.
Response of Policy and Management to post-FEMAT science:
Although members of the science community widely agreed that some important aspects of the science of riparian processes have changed since FEMAT, mem-bers of the policy and management communities at the symposium did not present any examples in western Washington of change in either policy or management on federal, State or private forest land in response to new science. Some management experiments that demonstrate or test management that are alternatives to current practice were cited at the symposium, but, with the exception of a computer modeling exercise in the Cowlitz basin presented by Lee Benda, these activities did not occur in western Washington. A joint science-policy-management meeting that was held a few months before this symposium (Liquori et al. 2008, Benda et al. in preparation), raised issues about the currency of science in riparian policy and management but its focus was confined to California. Subsequently, California has revised its regulations for commercial timber harvesting on private land in watersheds where there are listed salmonid species, based on a review of the current scientific literature and scientists’ testimony (California Board of Forestry 2009). In western Washington, this symposium made clear that, although the science base assembled by the FEMAT team still underlies much of riparian policy and management, a gap has developed between some aspects of riparian policy and management and the science consensus since FEMAT regarding the importance of riparian processes at larger spatial and temporal scales. In effect, the science community sug-gested that the spatial and temporal scope for setting riparian policy and management needs to be expanded to include processes producing high quality riparian
and aquatic habitat that function at landscape or river basin scales. The policy and management communities are still operating within guidelines based on science that was developed at the scale of stream reaches, some of which have been superseded.
Consequences of a science-policy gap:
Could this gap between science, policy and manage-ment create problems? Potentially yes, because societal tensions can arise if a gap persists and it affects values that many people care about. For example, if policy and management based on outdated science fails to restore healthy aquatic habitat, salmonid fish popula-tions may suffer set backs or even extinctions. A decline of these highly visible and regionally important fish could potentially raise questions about why these threatened species were allowed to decline or why so much public money has been spent restoring them without a positive outcome. A further decline of native fish might also lead to more strenuous measures to pro-tect fish habitat with the potential for negative impacts on the State’s timber industry and it’s economic activ-ity. Policy and management goals based on outdated science could also risk losing public confidence in salmon restoration efforts by creating an “illusion of failure” (in Gordon H. Reeves’ words), because they aspire to goals that may be unattainable (for example, that all river segments can be restored to conditions of high fish productivity).
Public frustration with a policy/management strategy that persistently fails to reach its goals might lead members of the public to demand corrections by the courts or legislature. Legal and legislative correc-tions for natural resource issues may be expedient but they run the risk of being “blunt instruments” that may cause unintended social, economic and ecological dis-ruptions. But the participants pointed out that legisla-tive- or court-directed remedies for the science-policy gap do not have to be inevitable. Adaptive management
xi
Riparian Adaptive Mangement Symposium: A Conversation between Scientists and Managers
approaches that actively engage the science, policy and management communities to close the science-policy gap may be worth considering as alternatives with potentially less contentious and disruptive outcomes.
Policy and Management Actions to close the science-policy gap:
First, land managers and policy makers need to become aware that there is a newly emerging sci-ence consensus and that a gap may exist between it and current riparian policy and management. While the science community has a role in this educational process, both the policy and management communities will need to actively engage themselves in understand-ing the new science and creating constructive ways to incorporate it into their practices. This symposium is only a first step toward informing these communities. Clearly additional follow-up educational efforts to inform policy and management groups will be needed.
What aspects of policy/management may need change in the face of new science? Little policy/man-agement analysis on this question was presented at the symposium. A first step for developing an answer would include a reassessment of current riparian policy and management to distinguish parts that have a strong scientific basis and should be retained (the “baby”) from parts that are inconsistent with current science and should be revised (the “bathwater”). Participants in this symposium suggested that policies that are based on ecological processes that operate in riparian areas at the reach scale (e.g. characterized by the FEMAT curves) may still have scientific validity, while those that encourage static conditions in riparian areas across large areas may no longer be consistent with recent science. This analysis should examine whether aspects of policy that lack a strong science basis can be addressed with piecemeal fixes or are systemic, requiring more fundamental changes. Policies applying to federal, State and private lands would probably each
need to be analyzed separately because the specific details of each are different. Outcomes of these analyses could be used to develop options for change in riparian policies that would make them consistent with current science. Options may differ among policies that apply to federal, State and private lands. Potential ramifications for land management practice of implementing these options would need to be part of this analysis. Selection of which options to imple-ment should consider not only their consistency with current science but also how desirable their outcomes are likely to be in ecological, social, economical and political terms.
Research Community Actions to Close the Science-Policy Gap:
One of the lessons from the experience of the FEMAT report is that policy and management can incorporate scientifically based information if it is quantified or clearly defined in terms that these communities can understand. For post-FEMAT riparian science findings to be adopted, they will need to be couched in terms that policy and management can use. The availability of data on spatial and temporal distribution of riparian condition and how they relate to aquatic productivity, needs to be carefully examined. Especially important will be demonstrations of how well ecological mod-els can predict dynamic riparian characteristics (in probabilistic terms). Gaps in existing data on riparian processes should be identified and filled as high prior-ity research to provide an adequate science base for policy and management.
Simply having a revised science base may not be enough to convince policy makers and managers to embrace it. Both of these user communities are pragmatic and need to show that the benefits of incor-porating new science justifies the cost and uncertainty of changing policies and management practices.
xii
GENERAL TECHNICAL REPORT PNW-GTR-830
Management experiments will be needed to demon-strate that application of the new science can produce practical outcomes that are an improvement over current practices. Such experiments could also provide the opportunity to try out alternative management and policy options that apply the latest science derived from science syntheses, and landscape-scale models. John Calhoun and Gretchen Nicholas pointed out that the Olympic Experimental State Forest (OESF), with its mandate to test innovative forest management options, offers a potentially valuable venue for these kinds of landscape-scale management experiments. Coordinated adaptive management experiments on the adjacent lands in the Olympic National Forest Adap-tive Management Areas could complement work on OESF. Recent formal agreements between WDNR, the Olympic National Forest, PNW Research Station, and Olympic Natural Resource Center could serve as a vehicle to facilitate these investigations. Similar management experiments in other parts of the Olympic Peninsula and further afield in western Washington, the Cascade Mountains and Oregon Coast Range could expand upon the applicability of results from OESF.
Adaptively changing forest policy and manage-ment to incorporate the current science could face potential challenges. Restoring dynamic riparian and aquatic ecosystems at landscape scales will require approaches that cross land ownerships and land use patterns. Success will depend on gaining buy-in from policy makers and land managers with differing mandates. The public will need to be informed for them to accept changes in policies and management that incorporate the new science. For example, the public will need to better understand that extreme events, such as floods and debris flows that previously have been perceived primarily in negative terms, may have desirable long-run benefits for restoring fish habitat and aquatic systems. Long time frames over
which riparian and aquatic habitat develop (decades to centuries) mean that restoring these ecosystems will require patience, a virtue that is often in short supply when policy and management changes must achieve public acceptance. Development of ecosystem models may help calibrate public expectations by showing what desirable environmental changes may take a long time and what short-term milestones may indicate whether conditions are improving or deteriorating along the way. Without public acceptance, attempts to revise policy and management in light of the new science may be difficult at best. Finally changing policy and management will require overcoming the formidable inertia of the status quo. Convincing people and institutions to adopt new ways of doing business may be difficult because it entails venturing into new territory where well-worn ways of “getting what you want” may no longer apply.
Dealing with these challenges may require innovative approaches to policy and management e.g. communal decision processes that engage many stakeholders (federal agencies, State agencies, tribal governments and private owners of many stripes), and consider implementation approaches that can embrace multiple property ownerships. On the positive side, over the past few decades many of the stakeholders have gained experience in devising collaborative solutions, (for example the Forest and Fish Agreement). Innovative policy options are also becoming available to address the issues (e.g. ecosystem services concepts and market-based incentive systems, etc.), and the science and technology for dealing with these issues are advancing rapidly.
DiscussionTo follow the principles of Kai Lee’s cycle of Adap-tive Management (Lee 1993), policy and management experiments should periodically be evaluated to
xiii
Riparian Adaptive Mangement Symposium: A Conversation between Scientists and Managers
compare their outcomes with desired future condition that were originally articulated when the experiments were initiated (or, in ongoing management experi-ments, when outcomes were last evaluated). The scien-tists at this symposium suggested that another question may need to be added to this evaluation phase: is the desired future condition, set some time in the past, consistent with the current science consensus? The scientists at the symposium made a case that riparian policy and management goals for federal, state and private forest land in western Washington need to be reexamined now because our scientific knowledge has changed since 1993. In addition, members of the science panel expressed concerns that this gap between the emerging science and the implementation of the riparian policy and management goals might potentially undermine successfully sustaining listed Pacific salmonid species and possibly reduce public confidence in efforts to protect and restore those species. For the more general concept of Adaptive Management, this result illustrates that the consensus of the scientific community itself is dynamic and can change over time and that tracking the current state of relevant science needs to be an integral part of adap-tively managing ecosystems.
SummaryIn western Washington, riparian policy and manage-ment guidelines on federal, State and private forests are strongly influenced by the science of riparian pro-cesses that was articulated in the 1993 FEMAT report. However, our scientific understanding of riparian processes has evolved since 1993. Some aspects of the FEMAT report have been affirmed by the more recent science, while for other parts the scientific conclusions are changing.
Policy and management representatives at the sym-posium were interested to hear about the new science
findings. The affirmation by recent science of the link-age between riparian and aquatic habitat at the reach scale indicated that many of the original conclusions still provide firm ground on which to base policy and management. However, new science that fish popula-tion viability at the basin or landscape scales depend on maintaining dynamic and heterogeneous riparian conditions have not been assimilated into policy and management for western Washington riparian forests. Discussions about the potential implications of this gap between of the new science and policy and man-agement were only suggestive, because an in-depth analyses have not been conducted.
To address these inconsistencies among riparian science, policy and management, discussions at this symposium suggest that the policy and management community should consider doing a more in-depth analyses of current forest policies and management practices to assess what areas may have to be recon-sidered in light of the new science findings. Parts of policy and management would have to be identified that should be retained or revised in light of the new science. Then options for change would need to be developed and fully explored to assess how they might play out in Northwestern ecosystems, in management practice and whether they would be socially, economi-cally and politically acceptable to the public. There is also a need for educational efforts to explain the new science to the general public so that they can better understand why riparian policy and management may need to change in light of new scientific findings.
The science and technology community is actively working to address some of these challenges, and there was optimism that new analytical tools may be within reach. Participants in the symposium identified high-est priority research needed to fill critical gaps as: 1) articulate how the science related to riparian manage-ment has changed and what this means to the policy
xiv
GENERAL TECHNICAL REPORT PNW-GTR-830
and management community, 2) quantify spatial and temporal variability of riparian condition under both “natural” conditions and management options, in col-laboration with land managers, and 3) collaborate with forest managers to design and implement experiments to field-test whether riparian policy and management options based on dynamic assumptions can produce outcome that are significantly different from those based on static assumptions and habitat targets.
This symposium was a wake-up call from the science community that a shift has occurred in the science that underlies riparian forest policy and management in western Washington. How this new science plays out in the ecological, social, economic and political landscape will probably depend on how the policy and management community reacts to this change. Participants suggested that a pro-active, adaptive management approach to incorporating this new science might potentially be less disruptive than waiting for courts or legislation to impose solutions to close this gap between science and policy. If action is taken promptly, an adaptive management approach that engages many stakeholders may offer a cooperative path to bring science, policy management into consis-tency on this important topic. Delay will make judicial or legislative solutions more likely.
Bisson, P.A.; Dunham J.B.; Reeves, G.H. 2009. Freshwater ecosystems and resilience of Pacific salmon: habitat management based on natural variability. Ecology and Society 14(1): 45, 18 p.
Forest Ecosystem Management Assessment Team [FEMAT]. 1993. Forest ecosystem management: an ecological, economic, and social assessment. Portland, OR: U.S. Department of Agriculture; U.S. Department of the Interior [and others].
California Board of Forestry. 2009. Anadromous Salmonid Protection Rules, Title 14 California Code of Regulations (14 CCR). For text of “Final Statement of Reasons” see: http://www.bof.fire.ca.gov/regulations/proposed_rule_packages/ANADROMOUS_SALMONID_PROTECTION_RULES_2009/asp_fsor_10_9_09_.pdf.
Lee, Kai. 1993. Compass and Gyroscope: Integrating Science and Politics for Environment. Washington, DC: Island Press.
Liquori, M.; Martin, D.; Benda, L.; Coats, R.; Ganz, D. 2008. Scientific literature review of forest management effects on riparian functions for anadromous salmonids. Report of Sound Watershed Consulting to the California State Board of Forestry and Fire Protection,Sacramento, CA. Available: http://www.fire.ca.gov/CDFBOFDB/pdfs/FINALBOOK_1.pdf
Contents 1 Introduction 3 Welcome and Opening Remarks John M. Calhoun, University of Washington School of Forest Resources Olympic Natural Resources Center 7 Setting the Stage Fresh Perspectives, Encouraging Diversity and Scientific Analysis in Support of Formulating Policy Brian J. Boyle, University of Washington School of Forest Resources 11 Appendix Presentations Speaker Abstracts and Presentations followed by Question and Answer sessions with audience 13 What are the principal working hypotheses and key assumptions that underlay current riparian strategies on federal, state, and private lands in western Washington? George Ice, National Council for Air and Stream Improvement 25 Gordon H. Reeves, US Forest Service, PNW Research Station, and Jim Sedell, National Fish and Wildlife Foundation 33 In light of current scientific understanding, what is the degree of both confidence and uncertainty for each of these working hypotheses and assumptions? Lee Benda, Earth Sciences Institute 47 Bob Bilby, Weyerhaeuser Company 57 A.J. Kroll, Weyerhaeuser Company 73 Gordon H. Reeves, US Forest Service, PNW Research Station 83 Recap of Day One and Overview and Desired Outcomes of Day Two Douglas F. Ryan, US Forest Service, PNW Research Station 87 Panel Discussion If there is scientific consensus to revise underlying assumptions or working hypotheses, would this revision have important consequences for management strategies or policy goals? 89 Introductory Comments to Panel Discussion Craig Partridge, WA DNR 91 Norm Schaaf, Merrill and Ring Company 95 Gretchen Nicholas, Washington DNR 101 Dave Heller, USDA Forest Service 105 Steve Stinson, Family Forest Foundation
109 Which are the critical assumptions in terms of both scientific uncertainty and management/policy implication? Question, Answer, Comment Session moderated by Craig Partridge, WA DNR 133 Conference Attendees
Introduction
222
GENERAL TECHNICAL REPORT PNW-GTR-802
This page is intentionally left blank.
3
Riparian Adaptive Mangement Symposium: A Conversation between Scientists and Managers
Thank you all for coming; it’s an extraordinary group. I want to provide some opening comments outlining what the symposium objectives are and the desired outcomes. First of all, we want to inform the riparian objective management research programs for DNR or federal agencies and others. We intend to produce a piece of work based on your input over the next two days that will document in various ways steps that can help those agencies and others to more intelligently design their riparian research programs in service of adaptive management obligations that they have under various plans.
I want to start though, by talking just a little bit about the origins of Olympic Natural Resource Center because it really connects to what we are doing here today and illustrates the continuity of public interests and scientific investigation that brought us to this place at this time. In the late 1980s when this region and most of the northwest was involved in the spotted owl wars, for lack of a better term, the Department of Natural Resources ownership on the Olympic Peninsula contained substantial reserves of old growth forest: federal land grant trust that had been man-aged with fiduciary responsibilities for income to the beneficiaries. That was the status quo. The other side of that issue was that those management practices for harvesting, accelerated harvesting in some cases, of old growth for beneficiaries, was no longer supported by the general public, and so the Washington State Lands Commissioner at that time had a problem. And I would like to introduce you to that Land Commis-sioner, Brian Boyle sitting here in the front row. Brian had a problem and lawsuits abounded; programs were
paralyzed and nobody was happy. We have shadows of that still, but it was really intense at that time so Brian sought help and advice by appointing a commis-sion of stakeholders and experts to meet, learn about the issues and make recommendation to the Board of Natural Resources and the Commissioner of Public Lands on how to resolve this conflict. The group became known as the Old Growth Commission. There were thirty members and they included stakeholders, beneficiaries—for example representatives of small communities dependent on the DNR’s management activities, experts in relevant fields from wildlife and forest ecology; Jerry Franklin was a member the group for example. Legislatures that could contribute; Jenni-fer Belcher was a member of the Old Growth Commis-sion, and she at that time was the chair of the House Natural Resources Committee in the Washington State Legislature. At that time, I was the Region Manager for DNR in the Olympic Region and so it became my job to help support that group and help inform them. Craig Partridge from the department, who is still there, represented the commissioner and the agency in the process as well. After about nine months of learning and discussions, we were at Pack Forest at a retreat with this group and we began to try to formulate some recommendations; enough of this learning business we had to finally make some recommendations. It became the sense of that group that we could not do either/or. That is, we couldn’t ignore the public and the legal challenges against the status quo management of these older forests and we could not forsake the fiduciary responsibility to manage them for revenue to the ben-eficiaries. And so, like any commission, they wanted
John M. Calhoun, University of Washington School of Forest Resources Olympic Natural Resources Center
Welcome and Opening Remarks
Overview of Symposium Objectives and Desired Outcomes
4
GENERAL TECHNICAL REPORT PNW-GTR-830
it all. They didn’t want the department to choose one or the other, they wanted us to do both; conserve old growth ecological functions and continue to produce revenue to the beneficiaries. The department was to find a way to achieve some sensitivity to the growing environmental concern. This was expressed in several ways: achieve sustainability of ecological values par-ticularly addressing spotted owls. The salmon issues were looming and so riparian issues became important as well as that time.
As we were standing around a map talking about what we could do I proposed that if we had an area on the west side of the Olympic Peninsula where most of the old growth issues for DNR were focused that we could designate for deviation from the standard sort of policies and procedures of status quo forest management and conduct some long-term landscape scale experiments, if we did this we might be able to find ways to integrate ecological sustainability across landscapes with commercial management of these forest resources given enough time and space. And so we proposed an experimental state forest and Jerry Franklin said ‘and you need a research station located within that experimental state forest that could focus research on that proposition to discover whether or not that could be accomplished.’ So the two recommenda-tions were an experimental state forest, which we have now in the Olympic Experimental State Forest (HCP) and the research station which you are at right now, the Olympic Natural Resources Center. Jennifer Belcher went back to the legislature and developed enabling legislation to create the center. The center was not cre-ated by the University of Washington, but created by the Washington State legislature. It was assigned to the University of Washington, College of Forest Resources and the Legislature appropriated the money to build the center.
We began working with federal and state funds to pursue research that would try to address the issues that were at hand; how could we get both values from the forest. How could we get sustainability of ecologi-cal resources we were interested in and revenue from the forest at the same time? When Brian decided not to run for re-election because he’d had enough of that kind of stuff, I guess, Jennifer Belcher was elected as Lands Commissioner and she decided to implement or develop a Habitat Conservation Plan (HCP) and under provisions of the Endangered Species Act to include all of the state lands in Washington State that supported spotted owls; all of western Washington and part of eastern Washington. With this area the plan was to address all species of interest in a multi-species habitat conservation plan. This was a very ambitious undertaking and by that time salmon issues were becoming prevalent in our thinking. Jennifer asked me to go down to Olympia and lead the habitat conserva-tion plan project for the DNR which I did, from 1993 to 1995. We gathered the best scientist we could to help us, some of you are in this room, to provide advice on conservation strategies to help us achieve conservation strategies that would satisfy the federal services.
I can remember distinctly the riparian issues. The whole set of riparian conservation strategies were discussed amongst the scientists. The fact that we were just beginning to learn what we needed to know became apparent. We had, as our basic model, FEMAT and the federal effort to form conservation strategies on federal lands for riparian areas. Those were not adopted verbatim for DNR lands for a number of reasons. But the underlying science was the same for both efforts. The area where we had the least scientific support for conservation strategies was in the head wall streams; Type 5 streams as they are known in Washington state. Our science team could not provide
5
Riparian Adaptive Mangement Symposium: A Conversation between Scientists and Managers
evidence to support specific conservation strategies for those streams.
We are somewhat in the same position now, although I hope that we can discover today and tomor-row what advances might have been made. Riparian issues were critically important in the OESF plan. We designated the OESF as a separate planning unit within the state wide HCP, which had a separate set of conservation strategies, including conservation strate-gies for riparian areas. What we have in the OESF is a tremendous opportunity that we are about to take advantage of and launch into with your help in the next couple of days. Under our state forest practices act, if you are covered by a federal HCP, those rules are assumed to be adequate and take precedence. So you have some relief or additional conservation strategies available then the state forest practice act. On the OESF we wanted to focus research and experimenta-tion on riparian areas. We wrote that flexibility into the conservation strategies. We have the freedom to learn and to do research and to apply different practices on riparian zones within the OESF that we don’t have any other place on state or on federal lands in Washington. And so that’s an opportunity and a responsibility.
DNR is interested in developing a research and adaptive management plan in riparian areas as part of the implementation of the OESF. We hope that this process we are undertaking today and tomorrow will help inform that process. We have specific advantages in this forest in the fact that it’s of a scale that will allow landscape wide research. There are 270,000 acres of state trust land within the OESF and many of those acres are configured into large blocks with entire watersheds. That is a tremendous opportunity I think. I want to repeat that the Type 5 stream identification and protection remains a critical unresolved issue which requires more investigation.
To sum up, the purpose of this symposium is to inform the riparian adaptive management research program for DNR and federal agencies and others. The way we‘ve chosen to do it here is to invite a select group of policy leaders to participate. But it’s not a policy conference. The majority of participants that we have invited to this symposium are leading scientists that have relevant experience and information to share with us in this subject area. This is not a stakeholder meeting; there are no stakeholders here although the phone’s been ringing off the hook ever since this symposium has been announced. We are not trying to make money on this thing and bring a lot of people in for a fee, and we’re not trying to satisfy all the stakeholders. We’re not interested in a series of canned speeches either. If you look at the agenda, you will see that we have a very few formal presentations. The presentations that we have asked for are meant mainly to stimulate conversations amongst the scientists and policy makers that are here.
The symposium is sponsored by the DNR and USDA Forest Service, Pacific Northwest Olympia Lab. The planning team has been working for nearly a year to put this together. The team includes myself (UW ONRC), Doug Martin (Martin Environmental), Doug Ryan (USDA PNW Olympia Lab), Mark Teply (WA DNR) and Matt Loganbraugh from NOAA.
We have invited you all here for this process. The process is loosely structured; a design to encourage maximum interaction among participants. We will record the proceedings via streaming video and the streaming video will be hosted on ONRC’s website (www.onrc.washington.edu). The presentations will be fully represented including the discussions. We will also produce a hard copy report of the proceedings.
222
GENERAL TECHNICAL REPORT PNW-GTR-802
This page is intentionally left blank.
7
Riparian Adaptive Mangement Symposium: A Conversation between Scientists and Managers
AbstractSolutions to complex national resources problems require a struggle over ideas and perceptions. To be successful there must be serious organizational com-mitment to change the institutional obstacles that have been created by custom and myth. For example, saying “we want to go where science leads” is an example of myth.
Our political system for “managing” natural resources was originally established with only the faintest recognition of the nature of the challenges it would be called upon to address. It’s not simply scarcity of resources, as some suggest. In fact, scarcity is usually not a problem, except in the most benighted lands of Africa. Abundance is the problem-abundance of conflicting goals and opportunities to use the same resources, in new ways, and to produce new products that may or may not have an impact on what was there before.
The big problem for scientists is our recent 35-year history of prescriptive public processes, geared to a litigious society, which have put great burdens on resource policy-makers to meet the multiple require-ments of public acceptability, openness to value-based perceptions and so-called scientific “validity.” This terrible trio is impossible to satisfy.
We simply haven’t organized to deal with natural resources on an ecosystem basis. Instead, we are orga-nized, and we organize information, on the basis of our
historically-evolved political and business structure. Breaking through this gridlock requires a collaboration that is similar to the search for the human genome.
Presentation
Since Bob Lackey was originally slated to speak, and I have much admiration for his work, I will attempt to bring some of his observations into my remarks. I’m sure you know that Bob argues the fundamental differ-ences between “Is” and “Ought” statements. Science deals with “Is”, in other words fact; whereas policy deals with “Ought”, or preference. But as Bill Clinton once said, “it depends on what Is, is.”
And science sometimes has a concept of what is, that is not consistent with what really is. I’m not trying to be confusing, but even though scientists can recognize that there is a clear demarcation between the factual knowledge that science can provide, policy wonks may see a real world of Is’s that, while not supported by science, are true. Furthermore, these Is’s may become the basis of preferences and may in addition frustrate scientists. As examples, I mention local knowledge and tribal knowledge, which are often based on long-term observations, or even on stories and memories, rather than on a rigorous examination of controlled conditions over time.
Scientists are constantly being coerced to operate in a feeling, rather than a knowing environment. The news media are awash with bellicose pundits, and
Brian J. Boyle, University of Washington College of the Environment School of Forest Resources, Northwest Environmental Forum
Setting the StageFresh Perspectives, Encouraging Diversity and Scientific
Analysis in Support of Formulating Policy
The challenge of finding fresh perspectives for science analysis in policy A Cautionary Tale —
8
GENERAL TECHNICAL REPORT PNW-GTR-830
the understated is increasingly undervalued in soci-ety’s discourse. So the scientists who sign a full page advocacy of some issue might seem to be simply playing by the rules of today’s game.
But what Bob Lackey is arguing is that there is a serious downside to this, and one aspect is the dismay that scientists such as he will have for those who play that game. Nevertheless, it is an effective way to play with science advocacy, pushing the preference scale in the media so as to push policy into a corner.
Policy is, of course, politics. And politics is often not reasonable or based on fact. George Bernard Shaw wrote that “The reasonable man adapts himself to the world. The unreasonable man persists in trying to adapt the world to himself. Therefore all progress depends on the unreasonable man.”
It’s fairly easy to conclude that unreasonableness is a good tactic by which to drive policy. We all have had experiences with intransigent people, who are so hard to deal with that policy makers finally cave in and give them their wish. Court cases are rife with cases where judges seem to be hand in glove with the most unyielding and unreasonable groups who will always prefer to delay projects rather than to give an inch from their position.
So is careful science analysis doomed to be lost in a cesspool of unreasonableness and bellicosity? Conferences like this are devoted to the concept that, if policy and science can improve their ability to converse, there will be a sea change in the durability of policy. But this misses the interference of myth.
Politics is based on myth. The myth of superior background-of heroism, or of the ability to change what appears unchangeable. Natural resources politics have been couched in the myth of the West, and the myth of the West is strongest in the East, strangely enough. Look at the New York Times inveighing against Bureau of Land Management or Forest Service
on wild horses or natural gas drilling. Do they know something we don’t know?
We establish myths for ourselves, and these myths perpetuate our perceptions of ourselves, our jobs and reasons for being, and the organizations to which we belong, as well as about the natural world. Our organizations create myth around themselves-myth of identity, and of their value to society. The advertising world calls it “branding.”
Branding is designed to alter peoples’ perceptions of products, and often, reality, and get them to embrace something that they did not realize they valued. One of the myths reinforced by agencies and officials experienced in natural resources discussions is that their perceptions of value are realistic. The myth of the Forest Service has been perpetuated in film and icons like Smokey the bear.
I did a study of Forest Service Management in the early 1990’s, called the Policies and Mythologies of the Forest Service. It revealed through interactions with employees that Forest Service stated policies of ecosystem management could not be accomplished within their organizational structure and reward system. Having this knowledge did not cause them to deviate from the policy.
Solutions to complex national resources problems require a struggle over ideas and perceptions. This struggle, exciting in concept, is often frustrating and unproductive in practice. To be successful there must be serious organizational commitment to change the institutional obstacles that have been created by custom and myth.
The statement “we want to go where science leads” is an example of myth. Natural resource policy-makers and the public generally agree that natural systems operate according to natural principles. So “going where science leads” has appeal as a rational way to reach decisions.
9
Riparian Adaptive Mangement Symposium: A Conversation between Scientists and Managers
Or, certainly not going where science points you is clearly seen as folly. However, science generally does not want to lead policy preference-making, and many policy people would be shocked if scientists said to them, OK, get out of the way and we will lead.
But something has to give. Our political system for “managing” natural resources was originally estab-lished with only the faintest recognition of the nature of the challenges it would be called upon to address. It’s not simply scarcity of resources, as some suggest. In fact, scarcity is usually not a problem, except in the most benighted lands of Africa. Abundance is the problem — abundance of conflicting goals and oppor-tunities to use the same resources, in new ways, and to produce new products that may or may not have an impact on what was there before.
Bob Lackey in 2007 observed that there is “no scientific imperative to remove, or maintain, any dam for any ecological reason, including salmon recovery.” All the policy options have ecological consequences. But if one is to believe the Seattle City Council (a noted body of dam and salmon experts) the dams must be removed. They later quietly buried that impera-tive, after three of their numbers were subsequently removed from office.
The big problem for scientists is our recent 35-year history of prescriptive public processes, geared to a litigious society, which have put great burdens on resource policy-makers to meet the multiple require-ments of public acceptability, openness to value-based perceptions and so-called scientific “validity.” This terrible trio is impossible to satisfy.
These processes are creating an increasingly unmanageable and intractable gridlock, where partici-pants are progressively less willing and able to engage constructively to work through the complexities. Participants can become stuck, doggedly-repeating
their own particular viewpoints, with scientists and scientific information employed as weapons.
My own experience when I chaired Washington’s Forest Practices Board is that public hearings are populated with people paid to attend – staff, lobbyists, association members – and an occasional farmer or such who became curious and wandered into the room. A discordant melody of science facts and examples was used to prove and disprove the same proposal. The result is that decision-makers became more inclined to discount these debates and depend on trusted people or their own instincts for reaching a conclusion.
Policy staff are left with giant amounts of testi-mony to sift through, analyze, interpret, and present to the decision-makers. This corruption of the original intent of a public process is also a corruption of the idea of infusing science into the discourse of ideas that might lead to high quality public decisions.
Over the years, as a result of this corrupted process, many efforts have been mounted to construct new venues, such as the Forest and Fish process. Some negotiations succeeded to some degree. Others failed. Science is arguably more effectively considered in such processes than in the usual public debate. But there are still many flaws, and the devil is usually in the details, such as with watersheds and riparian areas in the Forest and Fish process.
The knowledge of the thousands of variables needed to describe a watershed through the pertinent range of temporal and spatial scales is dispersed among organizations and in data bases that are owned by different organizations with different responsibili-ties, jurisdictions and mythologies. These are also the same entities that are charged with cooperating to save the fish and respect ownership prerogatives.
The owners of the information often lack the tools to access and analyze these dispersed and complex sets of data, and make them available to others in a useful
10
GENERAL TECHNICAL REPORT PNW-GTR-830
way, and their own organizations often tie their hands and prevent creative solutions.
Data is a dry subject. But data is the “Is” that needs to be discussed. When we consider the origins of data-gathered for a single purpose, often collected without regard to other potential users – we uncover a huge problem.
When we then confront the boundaries between agencies, industry, tribes, publics, that have been exac-erbated by decades of battles over power and values, we find that water and fish recovery decisions that might be easily made are instead extremely difficult because usable information is not available, or often, not acceptable.
This problem becomes even more complex when people propose to integrate historical and cultural information into resource decisions. We simply haven’t organized to deal with natural resources on an ecosys-tem basis. Instead, we are organized, and we organize information, on the basis of our historically evolved political and business structure.
This requires a collaboration that is similar to the search for the human genome. The genome discovery was only an interim goal, leading to human survival characteristics. In the case of natural resources, organizations are in their infancy in terms of collabo-ration for discovery that will lead to more facts-based decisions.
This means that organizations of all types, not withstanding their brands and myths, must devote physical, biological, climate, social, informational, computational and other sciences to solving complex natural resources problems.
I see opportunities to work with small landown-ers, whose land values are most affected by riparian regulation, and most likely to convert to urban uses as a result. Creative management and creative regulations can work hand in hand to deliver desired environmen-tal and economic conditions on their lands by logging selectively.
I also suggest that the new forest landowners in this area, the TIMOs, are motivated by investment returns, not timber output. They could provide major mitigation pools on their properties, and would also quickly respond if payments for ecosystem services were made available.
Salmon recovery and stream restoration money could be re-directed to ecosystem services along with long-term management agreements that would save forest and farms lands in private hands. This of course would require science collaboration that supersedes organizational obstacles. Maybe we could even cre-ate a new mythology of science and policy working together.
AppendixPresentations
Speaker Abstracts and Presentations followed by Question and Answer
sessions with audience
222
GENERAL TECHNICAL REPORT PNW-GTR-802
This page is intentionally left blank.
13
Riparian Adaptive Mangement Symposium: A Conversation between Scientists and Managers
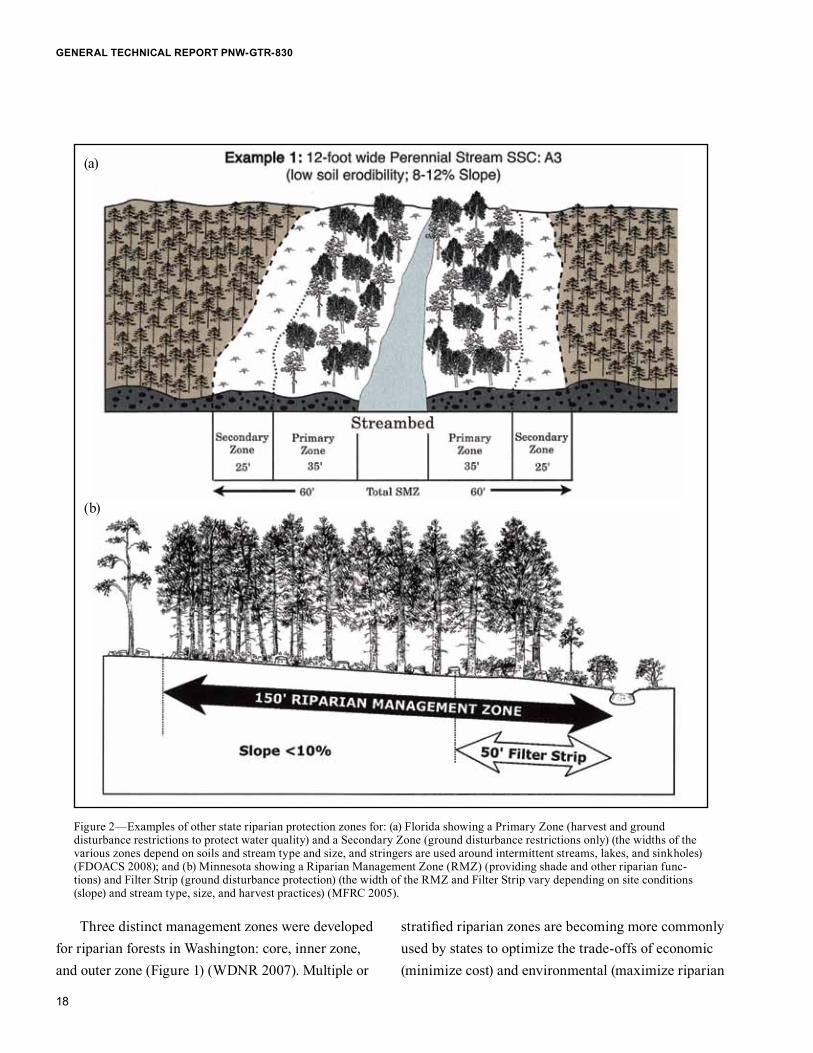
AbstractThe issues and assumptions that underlay riparian conservation strategies on state and private lands in western Washington have evolved over time. Here we review how historic water quality and fisheries issues have combined with science and policy to create the current conservation strategy. Riparian strategies are based on layers of hypotheses and assumptions, includ-ing: fish habitat and water quality are best protected with riparian zones that have mature forests; mature forest characteristics can be described using minimum numbers of trees and basal areas per acre; vegetation closest to a stream provides the most riparian benefits; and appropriate widths for riparian conservation can be established based on the region of the state, site productivity, stream type and width, and harvest-ing option selected. Emerging ideas about dynamic ecosystems and disturbance ecology are challenging static riparian conservation strategies and point toward variable distributions of riparian conditions.
PresentationIntroduction
A discussion about the principal working hypotheses and key assumptions that underlay current riparian conservation strategies on federal, state, and private lands in western Washington is, by necessity, some-thing of a history lesson. What makes this discussion a little bit intimidating is that many of the people involved in these negotiations and processes are participating in this conference. So consider this an outsider’s view of that history. What will be described is a little bit like peeling an onion-trying to unravel the
layers of assumptions that have led to current riparian conservation strategies.
Watersheds and watershed studies often offer unique stories that we learn from. It is the cumula-tive results of these stories that help us understand watershed functions. Here we will discuss this evolu-tion in concerns and strategies. Part of unpeeling the “assumptions onion” is understanding how things have evolved and the interactions between our current scientific understanding and policy considerations. Conservation strategies are not always solely a result of our scientific understanding. Strategies also come from historic events, legacy conditions, and organi-zational mythologies. We will discuss both the Clean Water Act and the Endangered Species Act and how they have influence riparian conservation strategies. Finally, management goals are important as we try to evaluate whether the assumptions that underlie current riparian conservation strategies are properly designed to achieve those goals.
Beginnings of Forest Riparian Conservation Strategies
To start this discussion, let’s go back to the largely unregulated 1960s and 1970s, when the importance of forest management impacts on water quality and fish were first being recognized in the Pacific Northwest. A classic Oregon State Game Commission publication by Lantz (1971), based on early results from the Alsea Water Study, provided recommended guidelines for stream protection and logging operations. Some of the guidelines that the Oregon State Game Commission recommended at that time are shown here:
George Ice, National Council for Air and Stream Improvement, Inc.
What are the principal working hypotheses and key assumptions that underlay current riparian strategies on federal,
state, and private lands in western Washington?
14
GENERAL TECHNICAL REPORT PNW-GTR-830
• Streamside vegetation should be protected and remain standing in all logging operations where fish, wildlife, and water quality considerations are involved or affect downstream areas.
• Commercial conifers do not necessarily have to be left, shrubs and other less valuable species can be.
• Stream clearance requirements, and their enforcement, are essential. Every effort should be made to prevent logging debris from falling into streams. If any debris does get into a chan- nel, it should be removed in order to maintain adequate dissolved oxygen levels in surface water, provide access to spawning grounds for adults, and keep migration routes open for outmigrant juveniles.
These guidelines addressed key concerns of the times. In the original Alsea Watershed Study, Needle Branch was completely clearcut with slash left in the stream, then site-prepared with a very hot broadcast prescribed burn. Dissolved oxygen was a contemporary issue on large streams and rivers, where paper mills and other manufacturing or municipal sources discharged untreated waste materials into the waters, resulting in high biochemical oxygen demand (BOD). In the original Alsea Watershed Study some decreases in dissolved oxygen were observed, and there was concern that slash was getting into streams and degrading habitat. This finding supported a key concern for sanitary engineers at the time. There were also concerns that fish passage might be impaired by slash and wood accumulations, perhaps a legacy of the massive wood accumulations that resulted from the 1962 Columbus Day Storm and the 1965 Christmas week floods. This was further compounded by the high residual wood levels seen for harvests of unmanaged forests during the period. Thus, it was recommended that slash be taken out of streams.
The severe prescribed burning in Needle Branch, along with hand and machine clean out of slash, exposed that stream to direct solar radiation. The result was a large increase in streamwater temperatures, especially compared to nearby Deer Creek, where buffers were left along fish-bearing reaches. Data for Needle Branch for the year before harvesting, the year immediately after harvesting after slash clean out and prescribed burning of the watershed, and over the time of riparian vegetation recovery showed streamwater temperatures first increasing with increased solar exposure and then decreasing with developing riparian shade.
Clean Water Act, Nonpoint Source Control Programs, and Endangered Species Act
Thirty years ago some of us were just beginning our careers. New legislation during that time included the 1972 Federal Water Pollution Control Act Amendment (later known as the Clean Water Act). The Clean Water Act (CWA) provided legal tools and responsibilities to the states to manage water quality. There was clear recognition in the CWA that there were differences between point source discharges from mills and more dispersed nonpoint point sources (NPS) and how best to control them. Point source controls were developed using discharge elimination permits and standards for effluent quality. Nonpoint source controls were designed around best management practices (BMPs). For states in the Northwest, this evolved into state for-est practice rules (although the Oregon Forest Practices Act predates the CWA). Some of the goals of the CWA included an interim goal of fishable and swimmable quality streams across the U.S. by 1983 and elimina-tion of all pollution in navigable streams by 1985. The Endangered Species Act was also enacted at about the same time. The listing of endangered and threatened species under this legislation influences how we man-age for specific at-risk species.
15
Riparian Adaptive Mangement Symposium: A Conversation between Scientists and Managers
Evolution of Washington’s Forest Practices Act Rules
One of the first programs in the United States designed to control NPS contamination was the State of Washington’s Forest Practices Act in 1974. In 1975 amendments to Washington’s program added addi-tional emphasis on controlling pollution from forest activities. In 1979 EPA Region 10 approved these forest practice rules under Section 208 of the CWA as a means of controlling NPS pollution from forestry. A series of monitoring, research, and experimenta-tion, beginning with the Washington Forest Practices demonstration project, was then undertaken to assess the effectiveness of the rules and components such as the riparian practices. The research asked the ques-tions: Is this program effective? Is it controlling water quality? That issue evolved into the Timber, Fish and Wildlife (TFW) program. TFW included a series of experiments conducted by the state to understand whether water quality was being protected (along with other questions). Various elements of the forest prac-tice rules were examined, including riparian manage-ment, asking: Are these rules effective in meeting our objectives? It’s interesting to look back and see the many methods of answering this question, from qualitative audits where teams went out into the field and evaluated effects, all the way to tightly controlled experiments.
In 1999 the Forest and Fish (F and F) Agreement led to additional changes in the forest practice rules. It is important to look at the F and F goals to understand why the rules were evolving. One of the goals was to provide compliance with the Endangered Species Act for aquatic- and riparian-dependent species on non-federal forest lands. Another was to restore and maintain riparian habitat on forest lands and to provide a harvestable supply of fish. The word ‘harvestable’ is
an important modifier; it indicates a high level of pro-duction that will provide more than minimum numbers of fish. This goal helped meet the requirements of the Clean Water Act (fishable) and addressed the legacy of treaty agreements with tribes in Washington. Another goal was to achieve water quality requirements while keeping the timber industry economically viable in the state. This need to optimize for multiple goals is consistent with other state programs. For example, the Oregon Forest Practices Act encourages economi-cally efficient forest management and the continuous growing and harvesting of trees, consistent with sound management of soil, air, water, fish, and wildlife resources. As in Washington, there is an effort to balance between economic viability and essential wild-life, fish, and water quality protection. Idaho has this goal: to ensure the continuous growing and harvesting of forest trees and to maintain forest, soil, air water, vegetation, and aquatic wildlife habitat. Again, there is an interest in both economic viability and providing water quality protection.
Key Assumptions
Trying to look at the different assumptions used to define the current riparian conservation strategy and how these assumptions evolved can be difficult. This paper is not unique in trying to capture that history and the legacy of how these decisions were made. Three primary documents help us look at this: (1) Review of the scientific foundations of the Forest and Fish Plan (CH2M Hill 2000); (2) Final environmental impact statement: For the proposed issuance of mul-tiple species incidental take permits or 4 (d) Rules for the Washington State Forest Practices Habitat Conser-vation Plan (NMFS 2006); and (3) Westside RMZs and the DFC model: Documentation of their conceptual and methodological development (Fairweather 2001). Fairweather is particularly interesting because it goes
16
GENERAL TECHNICAL REPORT PNW-GTR-830
undercover and tries to document the negotiations and how different caucuses argued one way or the other. It’s an interesting view of the process by which these riparian management zones were eventually devel-oped. We’ve all seen lists of key riparian functions. These lists include woody debris recruitment, sediment filtration, stream bank stability, nutrients moderation, and other functions. Interestingly, especially in the Review of the scientific foundations of the Forest and Fish Plan, there is a discussion about the development of inventories throughout the State of Washington that helped guide the focus of what changes in riparian rules should occur. Two of those suggested inventories resulted from concerns about streamwater tempera-tures related to shade and the need for woody debris recruitment. Inventories suggested that there may be shortages of large wood in some stream reaches. Thus, those issues became drivers for the process in the negotiations for how to develop or change the riparian rules.
Some of the working hypotheses that led to the Forest and Fish (F and F) riparian rule modifications included the belief that key riparian functions are needed to provide material and energy at desirable levels to meet fish and water quality goals. There was a need to provide sufficient wood and shade, and a need to manage such that riparian systems could moderate sediment loads to streams. There was also an assump-tion that mature riparian forest conditions provide desirable riparian functions, especially for wood recruitment. You need large trees in order to recruit large wood into streams.
These conditions can be approximated by certain characteristics that can be described for riparian areas. Key questions included: How wide should riparian zones be? What basal area targets should be achieved? How many trees should be left and what minimum
sizes should be counted? How does the spatial distribu-tion of those trees relate to their delivery to streams? These characteristics can help us describe a desired future condition. A final working hypothesis is that there are opportunities to vary these riparian prescrip-tions based on site class, the productivity of a site, stream size, and steam type. Thus there are modifica-tions to these assumptions that will best define where we will get the most return for our investment in riparian management zones. Interestingly, Washington developed regional goals; an eastside goal and a west-side goal. Here we are focused on the westside goal.
In the negotiations about the riparian rules there was recognition that a mature forest could be described as somewhere between 80 and 200 years of age. At some point there appears to have been a compromise that said, “OK, between 80 and 200 years; we’re going to go with about 140 years as being about half way between those values.” Another assumption was: “if we do not have riparian stand data, let’s use adjacent upland data to define the characteristics.” It was assumed that about 81 percent of riparian upland basal area would be a reasonable estimate of what the basal area for the riparian zone should be.
There were very serious negotiations in the past about the development of a cooperative to collect stand-growth data for riparian forests. One key ques-tion that this type of cooperative could address is whether growth patterns in uplands are a good sur-rogate for the patterns we can expect in the adjacent riparian area or if the morphology of the riparian area is more important in determining stand dynamics. Another key question this cooperative considered was “How does mortality differ in riparian areas (e.g., windthrow rates, channel avulsion, beaver activity, etc.) compared to upland sites?” Additional questions about wood recruitment delivery mechanisms and
17
Riparian Adaptive Mangement Symposium: A Conversation between Scientists and Managers
wood depletion rates were also considered. Unfor-tunately, lack of funding resulted in this cooperative never being initiated.
Again, we can look at a neighboring state to see how assumptions compare. Oregon has also developed desired future conditions for riparian areas. In Oregon, the desired future condition for streamside areas along fish-use streams is to grow and retain vegetation so that over time average conditions become similar to those of mature streamside stands. Mature streamside stands were again defined as something between 80 and 200 years (demonstrating either similar conditions or sharing of information and opinions). Interestingly,
there is a split in the prescription goals for riparian management areas in Oregon. Liz Dent with the Oregon Department of Forestry notes that for state lands Oregon uses a goal of riparian conditions consis-tent with 120 year old stands (compared to 140 years in Washington), but for private lands the goal is 80 year old stand conditions, on average, across the landscape, which is consistent with the earliest development of mature stand features. Here we get an intersection of science and policy. This is consistent with observations by Fairweather about how the riparian rules under the F and F Agreement were developed: a combination of science observations, professional judgment, and political compromise.
Figure 1—Zones for defining key management restrictions under the Washington Forest Practices Rules (BFW is Bank Full Width and CMZ is Channel Migration Zone) (courtesy of Washington Forest Protection Association).
18
GENERAL TECHNICAL REPORT PNW-GTR-830
Three distinct management zones were developed for riparian forests in Washington: core, inner zone, and outer zone (Figure 1) (WDNR 2007). Multiple or
stratified riparian zones are becoming more commonly used by states to optimize the trade-offs of economic (minimize cost) and environmental (maximize riparian
Figure 2—Examples of other state riparian protection zones for: (a) Florida showing a Primary Zone (harvest and ground disturbance restrictions to protect water quality) and a Secondary Zone (ground disturbance restrictions only) (the widths of the various zones depend on soils and stream type and size, and stringers are used around intermittent streams, lakes, and sinkholes) (FDOACS 2008); and (b) Minnesota showing a Riparian Management Zone (RMZ) (providing shade and other riparian func-tions) and Filter Strip (ground disturbance protection) (the width of the RMZ and Filter Strip vary depending on site conditions (slope) and stream type, size, and harvest practices) (MFRC 2005).
(a)
(b)
19
Riparian Adaptive Mangement Symposium: A Conversation between Scientists and Managers
functions) goals; for example Florida and Minnesota (Figure 2). In Washington’s case the multiple zone approach was driven by stakeholder demands and hard choices made by certain caucuses. For example, according to Fairweather the ‘core zone’ was an unconditional requirement by EPA and Washington Department of Ecology (WDOE). EPA and WDOE demanded, as an unconditional requirement, that there be some sort of core no-harvest zone. National Marine Fisheries Service considered the site potential tree height buffer to be a non-negotiable requirement. Thus constraints were placed upon development of strategies that influenced the final guidelines, which included the 50 foot no-touch area adjacent to streams, the inner zone that provided recruitment for large wood, and the outer zone. This all came down to a one site potential tree height, but it was based on those unconditional demands for certain riparian zone characteristics.
There is scientific justification for stratifying man-agement because of the law of diminishing returns. There is an effective distance for large woody debris recruitment, and a higher percentage of wood is likely to be delivered from near-stream sites. Functional wood, the stuff that’s big enough to benefit fish habitat, is going to come from closer to the stream, so you have this effective distance where you’re getting delivery; this, again, influenced the distribution of trees that were left. Science was helping design the most effi-cient ways of achieving the goals. Negotiations were informed by the Riparian Aquatic Interaction Simula-tor model (Welty et al. 2002). According to some who talked to me about this process, everyone was going back at night to do their calculations and see how much wood was being recruited under different scenarios. There was also debate about what minimum number of trees was needed. The discussion ranged from 30 to 80 trees and the negotiations settled on a minimum
of 50 trees, then 7 trees were added to account for windthrow.
This is a strategy that we can go back and look at. There is always a debate among scientists and there should be among policy experts. Is windthrow good because it results in delivery of wood to the streams, or is windthrow bad because it changes the functions that these riparian management zones are providing? Nonetheless, seven trees were added to account for windthrow. Some gaming was done to account for different assumptions. Approximately 84 percent of potential recruitment is one of the calculations that resulted from this gaming process. One important component of these rules was an adjustment for the size of the stream. There is an assumption that smaller wood will provide function to smaller streams, and there is research to support this (Bilby and Ward 1989). You can look at some of the other assumptions; for example, smaller streams can recover more quickly, and smaller streams have less capacity to move wood. In small streams boulders may serve as habitat fea-tures.
There was a management concern that large numbers of small channels with wide riparian manage-ment areas would have a dramatic economic impact on the forest community. Non-fish-bearing streams were addressed with yet a different set of assumptions. There was recognition that riparian protection for non-fish-bearing reaches provides protection for some sen-sitive sites. Equipment exclusion zones were prescribed to prevent sediment impacts, and some partial 50 foot no-touch riparian management zones were adopted. The potential for wood and water quality impacts and habitat quality considerations for non-fish streams was part of this process. Those negotiating the rules had to make assumptions about thinning and what manage-ment opportunities it provides. A model, a variant of
20
GENERAL TECHNICAL REPORT PNW-GTR-830
ORGANON, was developed based on findings from the University of Washington’s Stand Cooperative to help in the analysis of trade-offs.
Testing Key Assumptions about Riparian Conservation Strategies
Thus we consider a summary of key assumptions. The law of diminishing returns told us that as buffers became wider the marginal benefits to streams dimin-ished. You have core zones without harvesting, then changing leave tree requirements as you move away from the stream. It is assumed that stream temperature concerns can be addressed by maintaining shade, and this can be largely achieved within the core area. Desired future conditions include appropriate age (a 140 year old stand) to be approximated, and things like basal area and tree number can be used to define the characteristics of this type of stand. Functional ripar-ian wood is derived from an effective riparian buffer width. A large fraction (not 100 percent) of potential wood recruitment will maintain stream habitat for fish. Smaller pieces of wood are functional in smaller streams. Less and less wood is functional in smaller streams. Wood recruitment for perennial non-fish-bearing streams can be achieved by retaining trees along parts of the channels. Upland forest growth and yield data can be used to calculate riparian system development. In addition, it is assumed that windthrow is going to remain within some expected level and not compromise the wood recruitment functions.
We can use some preliminary data to test some of these assumptions. We can go to projects like the RipStream study in Oregon (Dent et al. 2008) and look at the temperature changes that have occurred under the Oregon Forest Practice Rules. We can then assess how Washington’s rules will compare in performance to Oregon’s rules. To date, based on RipStream, there appears to be a relatively small response in tempera-ture under the Oregon Forest Practice Rules. We can
look at Plum Creek Timber Company’s Fish Habitat Conservation Plan, with 50 to 75 foot riparian man-agement buffers and up to 30 percent removal in the buffers, again focused on the outside of the riparian areas (Sugden 2007). In a study of 30 sites in Montana, 27 had no significant increase in temperature. The others experienced increases of 0.3°C, 0.4°C, and 3°C. The one site experiencing a large temperature increase occurred where there was a massive blow down of the riparian area. Thus we are seeing some evidence that at least some assumptions about the core regions of buffers are holding up reasonably well.
Risks Associated with Current Strategies
We need to close by looking at the potential risks of current riparian conservation strategies and their underlying assumptions. Lack of management in the inner zone may delay opportunities to develop large wood and prevent desired forest stands from regenerating in the future. It was recognized early on that in using the simulator model you could advance opportunities for wood recruitment by focusing growth on fewer trees. There is a risk of losing some opportunities to create those desired future conditions because of restrictions on management in the core. Sil-viculturists have been warning us for years that there may be potential reforestation problems at some sites, particularly where salmonberry and other brush com-munities grow along riparian areas and where there are restrictions on vegetation control practices. We need to think about those risks and some disturbance elements such as wildfire and disease. Based on recent research, there is a possibility that by limiting disturbance we may be losing opportunities to enhance fish productiv-ity (Wilzbach et al. 2005). By disturbing small sections of streams, opening them up to light, and increasing primary productivity we may benefit fish. Hardwoods may also serve a useful role in forests. There is a need
21
Riparian Adaptive Mangement Symposium: A Conversation between Scientists and Managers
to provide a range of riparian forest conditions rather than a single prescription.
One final risk to consider is economically unfa-vorable conditions. As more and more of the forest is dedicated to “no-touch” restrictions, there is the problem of competition. Forest conversion becomes more attractive when returns from forest lands are severely restricted compared to other land use activi-ties. Investments in Washington forests might also suffer if there are competitive disadvantages compared to other states or nations, further degrading forest management opportunities and incentives to retain the land in forests.
SummaryHistoric issues and conditions, along with landmark legislation, helped form the early forest practices acts and rules. As issues and our understanding have evolved, so have riparian conservation strategies. These strategies are always a compromise between research findings and policy considerations. Research suggests that existing riparian strategies are achieving many of their goals to protect fish habitat and water quality, but emerging ideas about disturbance and dynamic ecosystems may result in future modifica-tions and refinements to these strategies.
ReferencesBilby, R.E.; Ward, J.W. 1989. Changes in
characteristics and function of woody debris with increasing size of streams in western Washington. Transactions of the American Fisheries Society 118: 368–378.
CH2M HIll. 2000. Review of the scientific foundations of the Forests and Fish plan. Olympia, WA: prepared for Washington Forest Protection Association.
Dent, L.; Vick, D.; Abraham, K.; Schoenholtz, S.; Johnson, S. 2008. Summer temperature patterns in headwater streams of the Oregon Coast Range. Journal of the American Water Resources Association 44(4): 803–813.
Fairweather, S.E. 2001. Westside RMZs and the DFC model: Documentation of their conceptual and methodological development. TFW-RSAG1-01-001. Olympia, WA: prepared for Riparian Scientific Advisory Group (RSAG) and Cooperative Monitoring, Evaluation, and Research (CMER) Committee.
Florida Department of Agriculture and Consumer Services (FDOACS). 2008. Silvicultural best management practices. Tallahassee, FL: Florida Department of Agriculture and Consumer Services.
Lantz, R.L. 1971. Guidelines for stream protection in logging operations. A report of the Research Division, Oregon State Game Commission.
Minnesota Forest Resources Council (MFRC). 2005. Sustaining Minnesota forest resource: Voluntary site-level forest management guidelines for landowners, logger and resource managers. St. Paul, MN: Minnesota Forest Resources Council.
National Marine Fisheries Service (NMFS). 2006. Final environmental impact statement: For the proposed issuance of multiple species incidental take permits or 4(d) rules for the Washington State Forest Practices Habitat Conservation Plan. Seattle, WA: National Marine Fisheries Service and US Fish and Wildlife Service.
22
GENERAL TECHNICAL REPORT PNW-GTR-830
Sugden, B.D. 2007. Accomplishments of the Plum Creek Timber Company Native Fish Habitat Conservation Plan at 5 years. 605611 in Watershed Management to Meet Water Quality Standards and TMDL: 4th Conference Proceedings. Publication 701P0207. St. Joseph, MI: American Society of Agricultural and Biological Engineers.
Washington State Department of Natural Resources (WDNR). 2007. Forest practices illustrated: A simplified guide to forest practice rules in Washington State. Olympia, WA: Washington State Department of Natural Resources, Forest Practices Division.
Welty, J.J.; Beechie, T.; Sullivan, K.; Hyink, D.M.; Bilby, R.E.; Andrus, C.; Pess, G. 2002. Riparian aquatic interaction simulator (RAIS): A model of riparian forest dynamics for the generation of large wood and shade. Forest Ecology and Management 162(23): 299–318.
Wilzbach, M.A.; Harvey, B.C.; White, J.L.; Nakamoto, R.J. 2005. Effects of riparian canopy openings and salmon carcass addition on the abundance and growth of resident salmonids. Canadian Journal of Fisheries and Aquatic Sciences 62: 58–67.
Questions and AnswersQ: There is an unstated assumption that the best buffers can be figured out regardless of land forms. I think that land forms are really important in how those riparian zones really function with the stream system. I think we are going to have to, and we have the opportunity as we research and monitor our riparian zones, to look at how they are operating relative to land forms and educate ourselves better. But certainly we can say that small streams and headwaters only need small wood because it’s a small stream. But if
that streams system is to gather up some big wood and sluice it down into the fish-bearing streams or larger streams, then leaving and recruiting only small wood in all of those little headwater streams is going to mean someday we won’t have that large wood elsewhere downstream. I just think that landforms are something we can work into the research we are doing.
A: I agree. There may be some creative way to condi-tion for appropriate riparian zones within classes of landforms.
Q: With regard to your risk, it seems like the biggest risk that you didn’t mention is time and the current status of riparian zones. Those two things for me put the situation at risk for most of the managed forest regardless of who manages them. George showed great pictures; they generally have a young forest next to the stream and all the modeling shows that you don’t get any serious recruitment. Certainly for the larger streams, there are still a collection of streams in the less than four percent gradient, going all the way up to fairly large rivers that were very important to salmon, and the riparian areas are not going to be functional for recruiting for a very long time under current riparian protections schemes. I think that’s a concern.
A: I tried to cover that in the first risk, which was the lack of management allowed. Management provides the opportunity to accelerate development of large wood. So I agree with you that time interacts in a couple of ways. It interacts in looking at opportuni-ties to manage for conditions that we want, but time is important in looking at our long-term trajectories and how different sized streams respond to different management opportunities.
Q: Almost all of your slides showed standards and guidelines that would apply at the site level—a par-ticular setting. My question is, do you see from your viewpoint any movement towards generating standard or environmental targets that go beyond the site level
23
Riparian Adaptive Mangement Symposium: A Conversation between Scientists and Managers
to landscape level targets? I’ll throw out an example, the old 50/11/40 rule that you used to hear about for the protection of spotted owl habitat. You don’t see anything like that, I think, in place on state and private lands for the protection of aquatic systems yet. But I’m asking: are you seeing any movement in that direction on the state side?
A: Landscape-level guidelines are certainly in discus-sion. Many of us were down in California a week ago at a meeting talking about riparian management. A landscape perspective was one of the topics being discussed in California; how we can put the landscape perspective in some sort of package. We have not got-ten there yet – discussions continue.
Q: You gave great examples of how Fairweather and Washington’s rules started with the science foundation and then veered away with what people think ought to be out in the riparian zones. It’s been bothering me a lot lately. What I’m driving at is we went from good science to this so-called mystical mature state of a certain basal area, even to find what that basal area is, something like 300 square feet per acre, and we are still being driven by that under Forest and Fish. In fact forestry is debating how to deal with DFC and how to alter DFC. And they are so far off the science. If any-one in this room can show me the data, I cannot find other than very poor correlations between basal area and riparian functions; I would like to see it. There are only a few papers that even relate riparian functions: wood recruitment, shade, temperature, erosion, and basal area. Yet the whole Washington State system is being driven by DFC basal area targets. I think that something to think about is that policy and the politics just drove us totally away from the principles of sci-ence that drive riparian function.
This is another corollary to Kate’s question: the underlying assumption is that fish populations are supposed to reflect current management, and we
haven’t really seen that. We all know that things have really changed from the 60s and 70s; we would have expected that fish populations should have gotten bet-ter if those populations actually reflect current man-agement. So Kate put out one hypothesis: we are still waiting for the wood to grow back. There are different mechanisms. I wonder; we keep tweaking this stuff, maybe we need to be waiting. For the last thirty years fish populations have not reflected big changes in how we manage the land.
A: We have always been reluctant to look at salmon populations as a measure of riparian protection effec-tiveness, because they are influenced by so many other external factors besides just forest habitat. NCASI and others are now supporting a research project trying to look at different management schemes, national forests, private forests, and see if there is a difference or if salmon responses are similar under all watershed conservations schemes. If we don’t see a difference in salmon responses between different levels of manage-ment, we’re going to have to look at other mechanisms that may be causing salmon declines. At some point we are going to have to ask the fish if they are seeing a difference in the management practices.
Q: I’m sure the Rockefeller Commission never had in mind that the drinkable, swimmable, fishable waters would be solved with chlorination and hatcheries. If the goal of the Clean Water Act is water quality, then we need to define water quality. I suggest that water quality, in terms of the top list of things you are concerned about, would look different east of the Mis-sissippi than it does west of the Mississippi. You would be hard pressed, east of the Mississippi, to find sedi-ment on that list of problems and you’d be hard pressed to avoid it here. If we are using that as a goal, we need a definition of what water quality is. In some areas it might be mercury levels in a lake; in landscapes that might be irrelevant.
24
GENERAL TECHNICAL REPORT PNW-GTR-830
A: I think the question of water quality is evolving. It used to be the colder, the less sediment, and the higher dissolved oxygen, the better. Now we are starting to recognize that maybe some nutrients are useful to have in streams, maybe the very coldest streams are not the optimal, wood recruitment is important now, whereas it used to be “don’t put anything in" The concepts of water quality and habitat are still evolving and we are still working through that process.
25
Riparian Adaptive Mangement Symposium: A Conversation between Scientists and Managers
PresentationWhat I want to do is talk about the Northwest Forest Plan and some of the underlying assumptions that led to riparian management practices on federal lands. First, I want to be clear; FEMAT and the Northwest Forest Plan did no new science. What we did was science assessment; we looked at what was available in the scientific literature, some underlying assumptions, looked at the paradigm in which we were moving forward with the Northwest Forest Plan and made some suggestions. FEMAT did not make any decisions about what was implemented on the ground. That was a political decision. We crafted and evaluated a series of option and what was selected was done by the administrations, not scientists.
For the Northwest Forest Plan, we were charged with looking at a large geographic area from the BC border, down to northern California. At the time, there was one anadromous fish listed, the central valley Chinook salmon, and two sucker species in the Klamath basin. We were told to come up with a set of options to deal with potential listings of anadromous salmonids; we worked closely with NOAA to get some sense of how extensive the listings were going to be. In 1991 there was a paper that put fish on the map in the American Fishery Society, ‘Salmon at the Crossroad’. The paper identified a whole host of populations that at the time were in need of attention because of declining numbers or that had gone extinct.
There were some previous efforts that lead to FEMAT. The Gang of Four work was the first time fish were inserted in the old growth debate. That was
followed by PAC Fish, which was the Forest Service’s attempt to deal with fish and old growth. The Scientific Assessment Team later made recommendations to Judge Dwyer. FEMAT was built from these efforts. Since the time of Northwest Forest Plan, we have had over 30 ESU’s and fish species listed. We were trying to anticipate the magnitude and extent of the problem, trying to craft options that would put the burden on federal lands to handle as much responsibility for the recovery of fish and their fresh water habitat as pos-sible so that there was less responsibility on state and private lands. That point was driven into our thinking constantly.
Key things in terms of NWFP: we really wanted to focus on ecological processes and we wanted to talk about time. When we talk about the Aquatic Conservation Strategy, ACS, we really focused on dynamic environments and what that means. What did ecosystem management mean-we were interpreting it to be a dynamic environment, we wanted to talk about natural disturbance regimes in terms of the frequency of distribution and magnitude. We were beginning to look at a different ways of determining wood sources for streams, not just coming from the stream-adjacent riparian zone but in terms of coming in as a result of catastrophic events. One of the things to keep in mind is that oftentimes we bring the same mindset to the table that created the problem. It was one of the things I felt we did nicely in FEMAT is that we took a dif-ferent tact-an approach that recognized the dynamic nature of the riparian system.
What was the underlying foundation of riparian management? What were we protecting? We were not
Gordon H. Reeves, US Forest Service, PNW Research StationJim Sedell, National Fish and Wildlife Foundation
What are the principal working hypotheses and key assumptions that underlay current riparian strategies on federal,
state, and private lands in western Washington?
26
GENERAL TECHNICAL REPORT PNW-GTR-830
protecting some sort of idealized set of conditions that we expected to be out there. The Rosgin classification scheme that some people would adhere to was if you have this type of channel you have this type of condi-tions. Thinking about that, it’s not a very dynamic view of the world. It simply says if you have this chan-nel type you should have these conditions. Some would say, that is not what Rosgin is all about but I disagree. If you’re doing a watershed analysis, you go out and look at the channel and you should have this width to depth ratio, etc. If you don’t, you try to make it meet those set of conditions. So this is a very static view of the world.
Another elegant, articulation of how streams work is the River Continuum Hypothesis and again it is really good at telling us that as we move down the channel, the stream network, things should change but it doesn’t talk about dynamics.
In 1992 Bob Neiman published a paper, buried in a book from a meeting at UW, that was one of the first attempts to articulate what a dynamic perspective of aquatic ecosystems might be. It stood up the idea that systems are not static, they are dynamic, beginning in the headwaters and there are periodic events hap-pening; fire, landslides, whatever it is and so you see infrequent but large magnitude type events. You go to middle portion of the network—and this is often where much of our focus is—it turns out that this is the most dynamic part of the network (if you believe this idea), and it’s because of the periodic disturbances here and the number of headwater streams that are influencing this portion of the stream network. This is not an area with a stable environment.
The question is: what’s the range of conditions and the change pattern and how do you maintain this type of pattern in your network? This is certainly what the fish evolved with. One of the things we can do
is look at the fish; what are they telling us. You start looking at the life-history of the fish and it suggests that anadromous salmon and trout are well adjusted to these dynamic places. They didn’t evolve in a static environment.
I’m going to focus on two important components of FEMAT, the Riparian Reserve Network and the Watershed Analysis, because I think these are the most relevant for the issues being discussed at this meeting. One major mistake that we made in FEMAT was using the term Riparian Reserve Network; it’s been inter-preted in a different way than we thought it was going to be. I can tell you I argued that this was going to be a problem because it sent the wrong message about what we are trying to achieve. The reason it happened is that because we were trying to distinguish our effort (FEMAT) from the previous efforts and we simply ran out of names.
Prior to the Northwest Forest Plan on federal land, Augusta Creek on the Willamette National Forest was an example of the most advanced riparian management system on federal lands. The riparian management areas were basically 100 feet on each side of the stream with some kind of constraint on amount of harvest. The justification for this was from a series of stud-ies—primarily McDade et al. – that were interpreted to say that 80–90 percent of the wood recruitment to streams came from within 100 feet of the streamside. Additionally, we kept getting pushed on not having a “one size fits all”. So, we proposed to move away from a distance measure and make the size of the riparian management zone relative to what the tree conditions were along a given streamside area. So we suggested that the distance from the channel to be equal to the height of trees that could grow at the site. We believed that this would accommodate what the natural site potential was and not move away from a single dis-tance measure.
27
Riparian Adaptive Mangement Symposium: A Conversation between Scientists and Managers
This was an attempt to put together the science in a way that had not been done before in talking about riparian function. Were we 100 percent correct? Probably not, it was a first approximation, a different way of trying to make sure we could look at the ripar-ian zones. Again, this was based on a site potential tree height, not absolute distance, which was a major change from what was done before.
If we go back and look, the justification for the 100 feet, and talk about sources of wood, McDade et al. only looked at one source of wood: stream adjacent source wood, or wood that came from the immediately adjacent riparian zone. This would have include pieces of wood that resulted from bank erosion and natural mortality sources. If you look closely at the paper, you find that McDade et al. did not include landslide derived sources of wood; they consciously decided to not consider them. Thus, the interpretation of data of McDade et al. saying that you are going to get 80–90 percent of the wood from 100 feet along the stream is a misinterpretation and an inaccurate interpreta-tion of the results. There are other sources of wood which were coming from these headwaters streams. This is not to say that in some places McDade et al is not going to be true, but if you just make a blanket assumption about an interpretation of wood recruit-ment from McDade et al. you can misrepresent it.
In the Oregon Coast Range, we now know that in some places 50 percent or more of the in stream wood originates from landslide-derived sources. So, if the assumption that most wood comes from the immediate stream side is not correct and in terms of effectiveness of a 100 foot riparian zone we are talking about 80 of 50 percent. So in FEMAT, we started looking at the underlying assumptions about the sources of wood in the literature that was the basis for setting up riparian zones, and none of them, with the exception of Murphy and Koski in Alaska, considered other sources of wood
other than the immediately adjacent stream side. This didn’t seem to fit into a dynamic perspective; this led to the inclusion of headwater streams in our riparian ecosystems. Seventy to -eighty percent of the area had been excluded from involvement in riparian zone man-agement prior to this, representing maybe 95 percent of the stream miles So we are talking a substantial proportion of the stream network that was left out of management consideration. A lot of these headwaters are dynamic in space and time. Work from Christine May and Bob Groswell described change over time in these systems in terms of delivery of sediment and wood to the channel. In Cummins Creek where we saw, by volume, stream side pieces were about a third of the total volume and two-thirds came from upslope sources. Lee Benda has done some work in Northern California and in Washington where similar or higher were percentages of upslope wood.
Looking at the underlying assumptions that went into the previous forest plan about the dependence on McDade et al; it didn’t bear out. The science that’s been produced since the Northwest Forest Plan has identified that there are other kinds of attributes; sediment, wood, become key ecological parts of the landscape along with sources of nutrients and food for fish bearing streams, bio-diversity hot spots for amphibians. We didn’t even recognize much of this at the time. One of the things we need to recognize: we are not leaving buffers out there to protect existing conditions. We are trying to leave buffers out there to protect ecological processes. Usually when we have the biggest controversies over stream protection from certain forest management activities, it is after a big event. What we would argue is that we want to set the landscape so that when these big events happen, the net results are going to be a plus for the fish. These events are usually the big landslide or floods.
28
GENERAL TECHNICAL REPORT PNW-GTR-830
We can look to our terrestrial counterparts for more insights about dynamic processes. We know that under natural disturbance regimes that there is a pro-cess called succession and there is going to be changes in both biological and physical structure over time. Under forest management we’ve changed that suc-cessional trajectory in terms of shortening rotations. When you drive down the highway, you see very few actual clear cuts in Oregon, but you see these legacy trees left there. Those legacy trees are to jumpstart this recovery process so we get some desired semblance of older forests under this type of management. That is the idea we were trying to work with, with the riparian buffers. We can start to compare in terms of attributes, using similar ideas from what Franklin and others have used on the terrestrial side. Look at the magnitude and the frequency of the events and the legacy. We can compare. In many cases we are not going to go back to the natural disturbance regime. We are replacing fire and other major disturbance with timber harvest. Timber harvest is the new disturbance regime on the landscape.
The question becomes: how do we make these manmade events more similar to natural events so we get the desired attributes? The key was that we have to put the coupling back in this—the connection between all parts of the ecosystem that worked together and the channel. The legacy is what is left from those disturbance events. In many cases, we’ve reduced the input of wood into the system because we’ve removed the trees-the wood-from the headwater streams and we are just delivering sediment. The system is not able to work in the same way in terms of its response when you have sediment, versus when you have sediment and wood. The whole idea in terms of buffers on headwater streams is to move away from something where you are just delivering sediment, to something where you are delivering sediment and wood. Then
recognizing that this may not be immediately favorable to fish, but over time the system has the pieces it needs to move into a more productive state. We also recog-nize how systems respond will vary tremendously; you cannot come up with a ‘one size fits all’ type of prescription. The coast range will have something very different than the Andrews Forest and still different from Northern California. You can start to look at the importance of these events and understand how they happen and build management options around that.
The other interesting thing that we started to do in trying to get people to think differently is talk about cumulative effects. Right now we would argue, under the guise of ‘protecting’, we have these cumulative effect thresholds. We think we manage to some magic threshold and if we stop right there, things will be OK. If we get 25 percent of the basin clear-cut or eroded, we’ll just move over and do the next one. I would argue that what we end up with here is basically mediocre conditions everywhere. These are some of the things we need to think about. Fish certainly can adapt to this type of pattern.
There are all kinds of assumptions in the North-west Plan that never were realized. Watershed analysis was supposed to be a key part in this whole thing. Gordon Grant had extensive conversations with people in Washington State, because Washington at the time was looked at as having the best watershed analysis process available and we were looking to model it after that. Watershed Analysis expectations were that it was to be relatively quick and inexpensive process. It was expected to be fish-centric but it turned out not to be. It was not considered a planning tool because of Forest Service rules; more a recommendation than an actual planning tool.
When riparian management areas got as large as they did there was a group at FEMAT working with amphibians and a host of other vertebrates and
29
Riparian Adaptive Mangement Symposium: A Conversation between Scientists and Managers
invertebrates and plants. As a result there were more than eight hundred plus organisms to be considered in FEMAT. Over 80 percent of them became associated with Riparian Reserve Network and that just became too much to try to design any type of adjustment in the buffers.
Another big thing that went by the wayside was the 50/11/40 rule for spotted owls. No one knew how to adjust boundaries of the riparian reserve network and meet this requirement. As a result of these things, very little happened with regard to adjusting the outer boundaries of buffers and working within buffers; we did not have the foresight to see it coming. Now we have a set of tools, we’ve gained a tremendous amount of knowledge in the sixteen to seventeen years since FEMAT. We now know about biological hotspots, physical processes, and are starting to put these together in a way that frees up areas for more intensive management that were never intended to be locked up as they were.
We went through a ten year assessment of the Northwest Forest Plan relatively recently. We assessed the condition of the watersheds. In the vast majority of watersheds, under the Northwest Forest Plan and found that the overall physical condition of a statistically significant proportion of the watershed improved in the first ten years. Some went up, some went down. The ones that went down were the ones that had recently had large wildfires. The change in conditions of these watersheds had nothing to do with management, but with large disturbance events. This was expected. We saw about a two to four percent increase in the number of large trees in riparian areas. This was accompanied by road decommissioning which was the primary reason for improvements. After the ten year assess-ment and with the new science, what I concluded was that science on the basic framework produced since the
Northwest Forest Plan supports the basic assumptions and expectations.
It also provides opportunity for new explorations in policy and approaches that I think haven’t happened fast enough. I really welcome the opportunity here, because I think there is some real opportunity to do things differently that we really need to give some con-sideration to. When we do these evaluations we need to recognize that often doing assessments of the results of a federal or state policy in a mixed land ownership is problematic.
One of the things that we looked at was the best potential habitat for different fish (an idea by Kelly Burdett). For example in coastal Oregon it turned out the lower parts of the network in many cases, are where you have the best potential to provide habitat or best productive habitat for coho salmon. Unfortunately, these areas are either urban areas or agriculture areas while most of the forested areas never could produce large number of coho. However, we are asked the ques-tion: why aren’t we seeing responses in terms of more fish returning to streams? One of the reasons may be that we are asking the part of the landscape that has the least capability of providing habitat or producing fish (the upper reaches of watersheds), to produce fish. We need to keep those types of things in mind as we move forward. It turns out in Coastal Oregon, the best potential areas for coho are private non industrial and private industrial forest areas.
This is where we have some latitude for room to be creative. If you are asking private landowners to make the biggest contribution to introducing or recovering coho, and we have federal lands involved then we can start to look to the federal lands to provide something to the private landowners in exchange for are asking them to leave a buffer (in terms of the timber volume they would forego). Ecologically, we are probably way better off, doing it that way. We’re starting to get
30
GENERAL TECHNICAL REPORT PNW-GTR-830
creative in how we mix and match what goes on; what happens on the various land ownerships.
Finally we need to put the big picture together. Many of us looked back at the Northwest Forest Plan experience and began grousing about what happened. One of the things we were concerned about was that we were told in no uncertain terms that we could only look at federal lands; we know what happened on federal land is going to be strongly influenced by what happened elsewhere. So we put together a project with OSU and the Forest Service called CLAM (Coastal Landscape Analysis Modeling). We looked at the aggregate effect of policy for state and federal lands, both ecologically and from the social economic perspective. We started making projections about what things would look like. One of the things we discovered that the Northwest Forest Plan assumed that we are arguing right now is that old growth and fish productivity don’t necessarily go together. At least in coastal Oregon, streams that are staying in old growth forest are not the most productive for fish. It’s interest-ing that the 120–140 age trees in buffers came up. The little bit of research we’ve done seems to indicate that as the optimal time frame for major disturbances for coho production and steelhead production. At that point in time, those streams are living off the legacy of that past major disturbance event. It’s the big wood and the sediment that were produced from those events that are making the system productive at this time. It’s not the current condition of the buffer that determines productivity.
One of the things we need to think about is how to look at the aggregate effects of these FEMAT policies. For example, putting the onus on the federal lands to recover coho in Oregon is simply to be ineffective. We can hold on to some existing populations, but we are not going to make big gains in terms of recovering populations. Finally, I think we need to get away from
a static aquatic perspective. I can’t tell you how much satisfaction I felt when I walked out of that Pink Tower and thought we had drawn lines on the map that said ‘here are the key watersheds and those are going to be places where if everything else goes to hell in a hand basket, are going to save fish’. Well in thinking about that, that’s a really preposterous thing to conclude because it doesn’t fit with a dynamic view of the world. What we need to be thinking about is protecting these important areas in the short term. But in the long term, and this is the underlying assumption in FEMAT in the aquatic conservation strategies, is that these policies would develop the next generation of good habitat and good refuge.
Questions and AnswersQ: FEMAT was designed to use adaptive management to work with/manipulate buffers-it hasn’t happened because they don’t trust the science or the scientists; why hasn’t it happened?
A: It became such an overwhelming task. When we left the Pink Tower we weren’t that tightly wedded to survey and manage and other things that were part of FEMAT. We failed to recognize how many things were going to come in on top of it. The terminology (ripar-ian reserves) did not help; it sent the wrong message. We need to be very careful of the message. Saying ‘disturbance’ instead of ‘dynamic’ sends the wrong message. We have to be very careful.
Q: Certainly in the first few years of the Forest Plan the term ‘reserve’ made many people hesitant to change boundaries. I think there was a paradigm shift that came along with the Northwest Forest Plan. Pre Northwest Forest Plan, the burden of proof was on riparian dependent resource managers to prove damage; after the plan, the burden of proof was on extractive uses to prove continuity or consistency with riparian objectives. Fast forward to today, really what
31
Riparian Adaptive Mangement Symposium: A Conversation between Scientists and Managers
happened was people quit spending time trying to officially change the width of riparian reserves. Now management is occurring within that boundary to varying degrees, typically based on site conditions and objectives. I agree that ‘reserves’ didn’t fully reflect what was intended, but I think what has happened is that over time there has been a basic level of trust that we can go in and manage without ravaging the place. Regionally, more and more management activities are driven by riparian objectives.
A: People after a while got comfortable doing things in riparian reserves. The burden of proof issue was a major one. Most people didn’t pick up on it. ‘Where is the burden of proof?’ Is it incumbent upon people who want to make a change to show that it has an effect or on someone who wants it to remain the same that it does not have an effect? The burden of proof issue is something we seldom talk about, but I think it is very crucial and a key part of how we approach these problems. The other thing is (I alluded to it but didn’t explain it) if you look at Option 9 as evaluated by scientists, it included a two tree heights buffer along perennial fish bearing streams. The second tree height was a movement corridor for large mammals and other organisms. On non-fish bearing streams the recommendation was half a tree height. In the political process it would become a full tree height. That is one reason the Northwest Forest Plan has never met its one billion board feet harvest projection. No one ever calculated 1 billion board feet with an extra half a tree height. No one ever calculated what the cost of expand-ing a half a tree height in terms of the PSQ. It was a political decision to expand it, but no one ever adjusted the expectations of timber harvest as a result of it.
Q. You mentioned the four corners of Aquatic Con-servation Strategies – talked about two. One of the others is the Adaptive Management Areas. Most of us would think that from an aquatic standpoint we
haven’t stepped up to the plate regarding adaptive management, but we’re starting to see in other areas ‘intensively monitored watersheds’ pop up. What is your take on why the Forest Service has not been very successful with Adaptive Management Areas?
A: Chuck Meslow developed the concept of having adaptive management areas as an educational tool and also to provide economic relief to areas hit hard by the plan. Dealing with the science, there were eight or nine Adaptive Management Areas identified and each one had a certain topic associated with it. The one for riparian areas management happened to be on the Little River on the Umpqua National Forest. They tried to get people who’d been working on FEMAT involved in it. FEMAT scientists were running away as fast as they could. The process was that they tried to bring all the interested parties to the table. And the basic thought was that they were going to provide everything for everybody. There was no clear way to see how priorities were going to be established or decisions were going to be made. People became frustrated. And finally, there was no financial support. The money began to dry up and eventually just withered. If we could resurrect them and do them right, they’d provide invaluable lessons and insights. We’ve basically lost 13–14 years of opportunity to do it right. That was one part of the plan that didn’t work.
Q: I want to move from the science back into the policy question: working in the private sector, I’ve not been a disciple of the FEMAT report; I haven’t read it and the revelation to me that there was no new science was new to me and a little bit of a surprise. But that’s OK.
A: I didn’t say there was no new science—I said we didn’t produce science.
Q: What we find is that FEMAT is being utilized now, outside of the Forest Service realm, as the standard
32
GENERAL TECHNICAL REPORT PNW-GTR-830
for riparian conservation or at least the science that supports FEMAT is used that way. This gets into the realm of both science and policy. If FEMAT did not produce any new science, what is the appropriateness of using the report as a ‘science index’ for the genera-tion of new policy that could be based around the findings of that report?
A: I’ll reiterate: FEMAT did not do science. FEMAT did science assessment and I think science assessment is as valuable as doing science in terms of trying to articulate how people can look at science and use it. I presume you are referring to the FEMAT curves; that seems to be how FEMAT has been defined. Is that fair?
Q: I’d open it up to any of the findings that are within the report, but certainly the curves are the most quoted or misquoted aspects of the report.
A: I think what you’ll see is there may be some quibbling over tweaking the curves, but the curves in general are very based solidly on current scientific thinking. The policy then becomes: how much do you want to move off those curves. Are you willing to say, for example, do we want to go to half a tree height, or three quarters height, or 100 feet or whatever it is? Are we willing to forego some part of the ecological process? Consider the law of diminishing returns…where do you want to make those decisions? Those are policy decisions and then the question becomes, what’s the consequence of losing 20 or 30 percent of that ecological function. I think the science assessment and the findings supported by the assessment within FEMAT are absolutely strong. The question: ‘can we tell you if you lose 20 percent of that riparian function, what that means?’ We don’t have that. Those are policy calls. There is a beauty to be able to show policy mak-ers what they are trading off. That’s how I would view using those curves. You bring that into the whole mix of economics, social needs and so on – that is not a science call and you aren’t going to answer those things from the curves.
33
Riparian Adaptive Mangement Symposium: A Conversation between Scientists and Managers
AbstractBackground
The period of the early to mid 1990s saw benchmarks in the watershed sciences including in the design and application of “watershed analysis” technologies (e.g., Reid and McCammon 1993, WDNR 1997). Applica-tion of the watershed sciences, including via watershed analysis, underpins many modern environmental policies in federal and state resource management agencies throughout the Pacific Northwest including in habitat conservation plans (HCPs), FEMAT and the Northwest Forest Plan, and Washington State’s Forest and Fish program. Much of the science and technology related to the nuts and bolts of measuring and predict-ing watershed processes relevant to channels, riparian zones and hillsides (e.g., surface hydrology, mass wasting, large woody debris, sediment transport, fish habitat morphology) have held steady during the last 15 years.
The more holistic concepts related to the water-shed “big picture” including the roles of disturbance and physical heterogeneity in terrestrial and aquatic ecology that originated in the 1980s through 1990s (Sedell and Dahm 1984, Swanson et al. 1988, Townsend 1989, Reeves et al. 1995, Benda et al. 1998, Poff et al. 1997) has remained mostly in a concep-tual or qualitative stage during the era of watershed analysis and beyond. Thus, the aquatic component of watersheds is often still viewed in terms of central
Lee Benda, Earth Sciences Institute
In light of current scientific understanding, what is the degree of both confidence and uncertainty for each of these
working hypotheses and assumptions?
Physical ProcessesEvolution of Watershed Science and Technology from the 1990s through the first decade
of the 21st Century: Implications for Forest Management
tendencies (e.g., mean states) even though they are considered, conceptually, to be in dynamic equilibrium (small fluctuations around a stable mean condition). This perspective is one of de facto steady state (static) since temporal variability is not quantified and thus ignored. In addition, stream systems are viewed as broadly homogeneous (across specific channel types) within and among watersheds because of unresolved spatial variability in channel and riparian environ-ments. Evidence for a static and spatially homogeneous perspective in forest management and regulatory policies include: 1) uniform one size fits all streamside buffers, 2) disturbances (floods, fires, erosion, wind) viewed as dominantly destructive, 3) stream restora-tion using “design” [dream stream] standards, 4) use of single value (average) environmental thresholds for habitat quality and related watershed processes such as sediment, in-stream large wood and stream tempera-ture, and 5) the assumption of high levels of accuracy and precision in measurements of stream parameters in monitoring programs.
Improved Quantification of Dynamics and Variability in Watershed Processes
Despite the entrenched environmental paradigm of stable watershed environments (until perturbed by anthropogenic activities), the conceptual basis of watershed science particularly pertaining to stream systems, has been shifting from one characterized by average conditions and spatial homogeneity to one
34
GENERAL TECHNICAL REPORT PNW-GTR-830
that emphasizes physical dynamics (disturbance) and heterogeneity. This is due primarily to an increasing emphasis on watershed dynamics and variability in theories, field studies and analytical tools. Thus, it is recognized that physical disturbances (e.g., storms, fires, and floods) dynamically create and maintain certain attributes of habitats and positively influence aquatic ecosystems, particularly in upland terrains. Disturbance driven fluctuations in discharge, sediment supply and in-stream large wood in both managed and unmanaged watersheds lead to variable channel morphological conditions (Beschta 1984, Benda et al. 2003, Madej and Ozaki 1996, Reeves et al. 2003, Martin and Grotefendt 2007), some more favorable to aquatic organisms than others. The implications of watershed dynamics on aquatic ecology are significant including temporally varying habitat suitability and life history adaptations to dynamic environments such as straying and high fecundity (Reeves et al. 1995).
The importance of spatial variability in stream systems manifest over a range of spatial scales is also becoming a central tenet in aquatic ecology. Spatial variability of habitat forming features is driven by alternating canyons and floodplains, tributary conflu-ences, landslides, and log jams, among other factors (Townsend 1989, Bisson and Montgomery 1996). Consequently, new analytical tools and models are becoming available that highlight variability in aquatic habitats at the reach to watershed scale (Burnett et al. 2003, Miller et al. 2003, Buffington et al. 2004, Steel et al. 2004, Miller and Burnett 2007, Benda et al. 2007). Additionally, river network perspectives, in which tributaries and their confluences are viewed as major components of aquatic systems, are replacing more linear river perspectives (Fisher 1997, Benda et al. 2004, Rice et al. 2008). In an interesting parallel to the field of landscape ecology, meter to kilometer scale variability in aquatic habitats is forming the basis of a
landscape view of rivers, called “riverscapes” (Fausch et al. 2002). Thus, principles of dynamics and physical heterogeneity are underpinning current thinking in riverine ecology (Weins 2002).
Implications for Forest Management
One of the most dramatic changes in watershed science and technology related to watersheds that have occurred in the last decade are the advances in concepts and in analytical tools related to dynamics or disturbance (fire, erosion, mass wasting, floods) and physical heterogeneity of channel, riparian, and hill-slope environments. These advances are being aided by the increasing availability of: 1) more sophisticated models of watershed processes, including incorporat-ing a stochastic climate (hydrology, erosion, stream temperature, in-stream wood, aquatic ecology, etc.),
Figure 1—The use of central tendency and spatially homoge-neous environmental perspectives, in addition to an absence of analytical tools (until recently), encouraged the use of uniform one-size-fits-all protection measures, such as fixed width stream buffers along fish bearing channels (A). A similar approach is being considered for non fish bearing streams (B). Application of ecological concepts and analytical tools focusing on dynamics and heterogeneity may support a more diverse and patchy riparian-channel protection and management system (C,D).
35
Riparian Adaptive Mangement Symposium: A Conversation between Scientists and Managers
2) faster more powerful desktop computers, 3) geo-graphically extensive digital data covering topography, hydrography, climate and vegetation etc., 4) advanced GIS systems, and 5) visualization technologies like Google Earth.
There are a number of implications for forest management and environmental regulatory policies as a result of improved conceptual and theoretical frame-works and new analytical tools. These include:
New analysis tools are being used to identify spatial variability in aquatic habitats and in watershed processes concerning hydrology, erosion, riparian processes, vegetation, and road transportation systems. This is promoting a perspective for strategically target-ing protection in environmentally “hot” areas (e.g., high erosion potential with direct links to habitat) or in channel-riparian biological “hotspots” (such as tribu-tary confluences and wide floodplains). Application of this approach could result in a patchy and spatially variable stream-riparian protection system rather than a spatially uniform approach (e.g., fixed width buffers) (Figure 1);
Watershed dynamics or disturbance could be incorporated into forest management and regulatory policy, even if only conceptually. This may include managing for mass wasting sources of large wood (and sediment) to stream systems, designing riparian protection to limit fire and enhance food production (for aquatics), and managing headwater streams as a “population” of environments that may have tempo-rally varying forest characteristics;
The ‘process’ of habitat formation should be the focus rather than the ‘state’ of habitat condition that is oftentimes a moving target. For example, instead of measuring the number of pools at the scale of stream reaches over time, riparian forest ages can be monitored to evaluate the changing potential of wood-formed pools
at the scale of entire watersheds over decadal time periods;
It is not feasible to maintain a fixed set of envi-ronmental conditions over time. Forest and riparian management strategies should focus on ‘resilience’ or the ability of a watershed system to cycle through periods of low to high disturbance (e.g., fires, land-slides, floods, timber harvest etc.) to capitalize on the formative aspects of natural or even human modified disturbances.
Creating single value (e.g., average) quantitative regulatory thresholds for parameters such as sediment, turbidity, temperature, in-stream wood and applying them uniformly across streams and watersheds is problematic. Low levels of accuracy and precision in predicting watershed behavior should be acknowledged as well as the limits of in-stream detection.
A Challenge
Although various state and federal agencies and pri-vate resource management companies in the PNW are dabbling with one or more of the forest management implications of spatial heterogeneity and disturbance, there has been no comprehensive incorporation of these principles into resource management and regula-tory policy. The challenge is for an organization to incorporate the principles of watershed dynamics and physical heterogeneity into forest management policy including applying them to resource use, conservation, monitoring, restoration, and education.
PresentationWhat you heard in previous presentations reveals that there is a Riparian Management Paradigm. It’s basi-cally protecting the system, kind of uniformly. Fish bearing streams have been the focus, although the emphasis on state and private lands is moving to the headwaters. The feds have already gone there. You’ve seen the FEMAT curves; my view is that they remain
36
GENERAL TECHNICAL REPORT PNW-GTR-830
conceptually sound, but it doesn’t preclude creative options. Regarding diminishing returns; these curves define what proportion of something gets protected as you move away from the stream (woody debris for example). The FEMAT target is 100 percent contribu-tion; they go all the way out to a full tree height or two. For policies that take into consideration economic and other issues, the target is often not 100 percent so the curve shape is important.
I’m going to sketch a little bit of the big picture of the science. We have a history of looking at stream environments in a non-varying, broadly homogeneous way. Generally we include the river continuum in a linear perspective. There have been some interesting developments. Before 1990 the idea of watershed dynamics, not just fire and landslides, but also stream system dynamics was coming on line. Swanson and other in the region, Gordie in 1995, wrote some papers that were mostly qualitative and I did much of it myself in those days. There has been an increasing emphasis on quantifying the dynamic nature of watersheds. That is sort of new. The idea of spatial variability across scales; people were recognizing that in the late 80’s. Pete Bisson wrote a paper on spatially varying riparian zone management in 1987. It was still sort of qualita-tive. We didn’t have good ways to characterize it, including in the watershed analysis days. Now there’s a focus on river networks, the branches and tributar-ies confluences. Because it’s happening later in the sequence (2000 plus), it’s a quantitative perspective for the most part.
We have technology nuts and bolts; these are the things you can use to understand slope stability, landslides, stream temperature, wood recruitment. There have been some tweaks on those dials, but the major improvements have been increasing analytical detail because of fast computers and more informa-tion in them; more field studies, vast literature and
lots of data bases. The technology is cross pollinating with the conceptual framework, creating a whole new perspective and they are feeding back and forth with one another.
Watershed analysis came on line in Washington State and at the Forest Service in mid 1990. FEMAT was there after that. Washington Forest and Fish came along. Of course slope stability, stream buffer prescriptions started and continue on today. There was a tendency to create environmental regulation based on ‘average’ conditions. It is fundamentally, techni-cally wrong to do that, but nobody actually knew or had the ‘work arounds’ to do a different approach. That approach is still what people are working under today, but because of this movement toward quantita-tive analysis, I suspect that the central tendency in environmental regulations will have to go away, to be replaced by something else. This is why we are here: the implications for forest management because of this evolutionary trajectory.
So what makes the idea that you can take big pic-ture concepts, combine them with powerful analysis to show how things work in dynamic and spatially vari-able perspectives? It’s these things we are all familiar with, that we are being bombarded with everyday that is basically changing the way we live.
Advances in defining dynamics and variability are being accelerated by:
More sophisticated models of watershed processes (including dynamics),
Faster more powerful computers, Geographically extensive digital data (of every-
Advanced GIS systems, and Visualization software such as Google Earth
(satellite imagery etc.).
37
Riparian Adaptive Mangement Symposium: A Conversation between Scientists and Managers
To illustrate what these tools can do, (refers to slides) a fire model was applied to 400 sq mile in SW Washington. It shows the pattern of fire across the landscape. You can see the variation in the histogram forest ages. At times young forests dominate, at other times old growth forests dominate. These red dots are landslides occurring in known locations where the topography is seen by the computer. It creates debris flows, forest fires are raging and trees burn-ing along the stream. You can see there is the woody debris volume – the blue is low volume, the red is high volume. Even when you stop the movie, you can see how the models represent the effects of spatially varied topography, will give you amazing variability across the landscape. That’s just an illustration of where these tools are taking us.
Considering the whole system: with environmental variability everything is on the table and so in Cali-fornia the group of people assembled to look at the literature, were struck to look at the riparian function at these different nodes across channel dimension (buffer width), along channels. This issue of channels on the influence of headwaters on large streams and headwaters themselves, we can see that Forest and Fish are basically targeting these interactions. Example: for aquatics, the FEMAT curve can be adjusted based on site specific details and policy interpretations. The curves can’t be adjusted for policy, but the way you interpret them can be. You can take all the curves for wood, heat, biotic, erosion and if you know things about land forms, stream size, location and climate, you might be able to get a better handle on how these curves shift around. And you don’t have to if your target is 100 percent, but that is not generally how that’s factored among the state and private arena.
I’ll shift a little bit now, the whole issue of these new tools I was describing and the new databases that are readily available off the internet-it is really
the emerging issue for forestry and for any land management across the region: expanding open source databases and tools. They may be coming to a neigh-borhood near you by various agencies or we have our own thing we are working on as well. For example, there is an increasing spatial scale considered by the environmental initiative so in many regards the large scale regional policy focus is driving the need for large open source analysis tools and database. For example the Northwest Public Power Council, Bonneville Power Authority and Salmon Enhancement Recovery Board are looking at huge areas of twenty million acres. The Northwest Forest Plan is in there, actually overlaps some of the others and then you have Oregon Dept. of Forestry that is overlapped by Northwest Forest Plan. The private sector is scattered everywhere and then you have major NGOs that have taken an interest in the conservation of salmon at the multi-country scale-Wild Salmon, Ecotrust, are looking at the entire Pacific Rim. So they have conservation programs that extend from the San Francisco Bay Area into Far East Russia. They are driving the issue at an unprecedented scale.
What are the policy characteristics of these con-servation efforts? Certainly, increasing spatial scale. Forget the watershed: it’s the landscapes, hundreds of watersheds, entire states, regions, countries. It is multiple agencies and all the things that are embed-ded in that. Federal, state,watershed councils – it’s universal objectives and central planning. It would be counterproductive for these folks to have different tools and different databases although that has been the history and will continue to be the history for some time. There will be an evolution here; there will be a move toward universal systems, as you can see right now on the internet, digital elevation models on USGS, the national hydrology data set with stream layers, information on vegetation and on and on.
38
GENERAL TECHNICAL REPORT PNW-GTR-830
I’m going to give an example of something we’ve been working on that tries to address that policy-scale question. It’s a set of analysis tools that produce a watershed catalogue. It focuses on aquatic habitat and channel indices and you can see what some of those are; biological hotspots, habitat hazard potential (work by Kelly Brunet and others), models of habitats you find across entire states, habitat diversity core areas. It is interested in all the things that watershed analysis was interested in: sediment loading, wood loading, thermal loading and then different kinds of tools for forests and fires. In some area fire is obviously a big deal. And post fire conditions. It is a whole series of tools that are many of the things that classically, water-shed analysis covered. But watershed analysis only covered thirteen percent of Washington State and it is basically dead. Partly, because it was too expensive and not as good as it could have been, the technology wasn’t quite there and it took too long to do. We see now in ten years or more after, the technology has come to the point where if you did watershed analysis today it would be very different—increasing spatial scale—an example of an emerging watershed technol-ogy at geographically extensive spatial scale. What does this platform do?• Simplifies GIS Tasks, you don’t have to be a GIS
expert.• It creates uniform stream/hill data layers-this is
getting to be more and more interesting to people like FEMAT and Northwest Forest Plan people that want to have the same layer of data for Oregon as for Washington. It provides data to people who want to model other things. It contains analysis tools for utilizing spatial data. And this is an interesting aspect; this is the sort of Wikipedia concept emerging in various corners of the inter-net: everybody contributes to the tool develop-ment. Databases and tools constructed in a certain
location would immediately become a community tool that everybody gets access to. West Frasier Timber Company in Canada is having two million acres done with LIDAR and they want a whole series of tools and all those tools are available to everybody when they get done. The idea is that it’s a constantly growing set of tools funded by the community.
• It creates watershed databases that are primarily public but can be proprietary such as the example just mentioned in Canada.
Here is the current watershed catalogue developed over two years, in total, forty million acres in Wash-ington, Oregon, California, and far eastern Russia. These are the people who’ve contributed to it: • NOAA in eastern WA.• USFS (Shasta-Trinity, Siuslaw, Willamette,
Deschutes NFs) – their interest is to integrate it with fire models to look at effects of aquatics and water quality because it sits right at the head of California’s major water supply conduit. And the Forest Service wants to do some serious thinning up there but they’re constantly being stopped because they haven’t evaluated this or that. This is one way they want to move forward.
• Oregon Dept. Forestry (all lands) • EPA (TMDL), Mad R. –• Private (watershed analysis, Mattole-PL) –• Private (HCP) –• Watershed Councils –• West Fraser (Alberta, Canada) –• Wild Salmon Center (Hoh River) –• WSC (Sakhalin Island, Russian Far East)
The key objectives are to increase detail of water-shed properties such as habitat, roads, fire hazard etc. and to simplify watershed and landscape analysis and to make it less costly. We want to create consistent
39
Riparian Adaptive Mangement Symposium: A Conversation between Scientists and Managers
information across large areas; a uniform data struc-ture. This is important for large environment policies across the region-it gets everyone on the same page. We create a self-sustaining and renewing watershed science databases, not a classic watershed analysis where someone does an analysis with a consultant and you get a report that gets put in your desk. Then a fire happens or other big storm or they log and it and it becomes immediately out of date and nobody can re-do it because it’s too expensive. This software goes with the program; all stakeholders can update it themselves and change data values if they validate it in the field. Ultimately, all that spatial data should be an issue of diversity of resource management options – how this gets translated to policy is critical.
Increasing, resolution of spatial data and analysis broken into segments 10M long segments nails down the confluences and indentifies the local contributing hill slope-very small slices of land. You can really find out where your potential risky areas are. It routs all that information downstream. So this is an evolution: 1990 it was ninety meter, in the mid 90’s is was thirty meter and today it is at ten meter. This is not great, but it’s a good screening tool. You could look at Coho spawning habitat over the whole state and get a pretty good sense-it’s not too bad, but this is where we’re headed; within five years, a big chunk of the region will have two meter LIDAR or better. Once you have that, these tools become more powerful.
We now have improved analysis of spatial data. Here’s your stream in one hundred meter stream segments. You know your incoming hillside on both side, but you also know what’s on the slope. You know if there are roads, stream crossing, erosion potential, fires risk, burn severity, vegetation age, clear cut. You know all that information is queried and translated into the stream. So you have a stream map with roads, road density, culvert numbers, fire risk, burn severity. You
also have all the aquatic parameters in there and now you are able to do a spatial overlay analysis that you’ve never been able to do before. ‘Where is highest fire risk overlapped with highest erosion with the highest and most sensitive aquatic habitat?’ You can look at one million acres and get a map. It’s not perfect but it’s a good screen at that scale.
People are making automated, open source tools. They are on the web. Everything is menu driven to create habitat, to look at landslides, to search for road crossings, for culverts. I’ve done 30 watershed analy-ses over the years-I’m quite aware of the limitations we were faced with. In the future you’ll get increasing detail. You can look at the entire watershed in terms of fire risk, and then you can take the tools and ask for aggregate values at any sub watershed scale. Imagine taking this at a national forest scale, looking for habitat potential, erosion potential, and fire risk. For riparian environments specifically, these tools will go through and look for areas that technical people can agree that have influence on riparian processes such as conflu-ence or sections, valleys, transition, sedimentation zones. These are areas you’d expect to have charac-teristics where you may do things differently. The 10 meter scale isn’t too bad for this, but with LIDAR you’re able to see a lot.
What do we mean by hotspots? Take wood recruit-ment rate as an example. Things are well behaved and then we detect a spot where we have an abrupt change in gradient, the valley floor widens, the channel bumps against the hill, stream side land sliding in these areas occurs that would be considered interesting by a geomorphologist and be biologically interesting. In the Sacramento River we are using these tools to analyze high erosion potential, sediment delivery potential, river sedimentation and confluence effect to create maps like this. Even though the standard approach is about uniform – one size fits all buffers-there is a lot
40
GENERAL TECHNICAL REPORT PNW-GTR-830
of special variability evident because flood planes are being mapped, channel migration zones, mass wasting areas are being mapped. You could expand on that. For example with post fire environments, there is a burn severity map. This map of the Methow fire shows 4000 square kilometers, 25 percent of it burned in six years in an area that is important for threatened and endan-gered Steelhead and possibly other species. These tools take this map and translate all the information into the channels so you have a map of fish bearing streams that are reflecting the sum of the severity of the water-shed. You can take that information and look at other things like tributaries to help design either firebreaks or address other kinds of gaps. This same technology can be used to design responses to “gaps”.
The headwater issue is most challenging. In practical terms, this is where the application of spatial variability concepts and tools may prove to be most effective. For slope instability in the old days, using watershed analysis you’d do it by hand. The maps could not evolve; they just sit in a report. In the last five to ten years there have been great improvements in how we look at variation. You can also overlay mass wasting with fish habitat. If you do that on the Hoh, you find something interesting, if you overlay debris flow with intrinsic potential for Coho, where do you get hotspots? There are lots of potential sites that have direct connection to fish habitat. But overall if you look at these hot spots, there’s not that much connec-tion to the main Coho habitat. However, if there are off channels that would not get picked up by the DEM. Of course everything has to get field validated. It’s a larger scale planning tool.
Headwaters have highly variable wood transport distances. We did an analysis for a private timber com-pany on the coast. People were saying: ‘wood comes out of these headwaters and we want you to protect the whole headwater’. We conducted some studies in that
area and we used the public wood transport model and we plugged in that map and produced that image. That gets people thinking ‘maybe it matters what headwater stream I’m looking at’.
The same approach is valid for thermal loading. Only in the last year or so have there been basin scale temperature screening tools that don’t require a lot of careful calibration. We built a tool that puts a full force or direct sun on and then it takes it all off. You say ‘which channels are sensitive to thermal loading’; we use the hottest part of the day in our tool. It’s sensi-tive to topographic shading, tree height, stream size and orientation. It’s a very crude screening tool about where you might want to think about headwaters in term of thermal loading.
Headwaters can be “upland” sources of LWD. This is in the upper Sacramento-this is wood delivery potential. If you run this tool over the whole river basin it’s a minor proportion of the whole area that is important as a LWD source. It would be a much higher proportion in the Olympics or the Oregon coast. It’s a way to start thinking of upland sources of wood and how you can protect them. You take these images and export to Google earth for enhanced visualization.
There are also tools for roads. The upper Sacra-mento has four thousand road crossings-how do you prioritize something on that scale? There are a series of tools that look at the intersection characteristics between streams and the roads. Once you overlay a habitat map, you are going to look at all the intersec-tions and classify them according to that combined data. It also can calculate the cumulative habitat length above each road crossing; that’s interesting if you are thinking about expanding access to streams. A Canadian company wants a tool that every time they hit their cursor on a road, it tells them how many road stream crossings above and below have occurred.
41
Riparian Adaptive Mangement Symposium: A Conversation between Scientists and Managers
Here is the question that I’ll leave you with: what is benefit versus risk? There are surely elements out there that find this scale of analysis to be a highly political risk and I totally sympathize with that. I think there are lots of benefits from my technical point of view. I find these tools a great help because I take them in the field with GPS and can do all kinds of things with them. It is much better and more complete information than I had before. However, I can see that some elements may feel that it’s risky to provide more information because there has been a history of using information as a club. I sympathize with that. The databases and the tools are all becoming Open Source and are becoming improved in accuracy. So it’s a happening thing and the question is how do you deal with it to make it a benefit as opposed to a risk? I’ll give you a concept; the idea is that you want to enhance communication and collaboration. People get burned out with the idea of more communica-tion and collaboration among stakeholders because it never works, it won’t work, but think outside the box. For all stakeholders in the mix, regardless of what platform you use or who organizes it, there will be a universal data structure watershed catalogue and a set of tools that are community based and that everybody contributes to. The cost for creating and maintaining new tools drops as people share the internet. This is the web/internet model. The question is: can you bring it here. I would argue, you would want to bring it here because it’s going to come. The real question is-how do you get involved to form it?
ReferencesBenda, L.; Miller, D.J.; et al. 1998. Dynamic Landscape
Systems. River Ecology and Management: Lessons from the Pacific Coastal Ecoregion. Naiman, R.J. and Bilby, R.E., Springer-Verlag. Chapter 11: 261–288.
Benda, L.; Miller, D.J.; Andras, K.; Bigelow, P.; Reeves, G.; Michael, D. 2007. NetMap: A new tool in support of watershed science and resource management. Forest Science 52: 206–219.
Benda, L.; Veldhuisen, C.; Black, B. (2003a). Tributary confluences, debris flows, and channel morphology, Olympic Peninsula, Washington, Geological Society of America Bulletin, 115: 1110–1121.
Benda, L.; Miller, D.; Dunne, T.; Poff, L.; Reeves, G.; Pollock, M.; Pess, G. 2004. Network dynamics hypothesis: spatial and temporal organization of physical heterogeneity in rivers. BioScience 54: 413–427.
Beschta, R.L. 1984. River channel response to accelerated mass soil erosion. Pages 155–164 in Proceedings, Symposium on Effects of Forest Land Use on Erosion and Slope Stability. East-West Center, Honolulu.
Bisson, P.A.; Montgomery, D.R. 1996. Valley segments, stream reaches, and channel units. Pages 23–52 in Hauer, F.R., and Lamberti, G.A. editors. Methods in Stream Ecology. Academic Press, N.Y.
Burnett, K.; Reeves, G.H.; Miller, D.; Clarke, K.; Christiansen, K.; Van-Borland, K. 2003. A first step toward broad scale identification of freshwater protected areas for pacific salmon and trout in Oregon, USA. In Beumer, J.P., Grant, A., and Smith, D.C., editors. Aquatic Protected Areas: What Works Best and How Do We Know? Proceedings of the World Congress on Aquatic Protected Areas. Austrain Society of Fish Biology, North Beach, WA, Australia, Cairns, Australia.
Fausch, K.D.; Torgersen, C.E.; et al. 2002. “Landscapes to riverscapes: Bridging the gap between research and conservation of stream fishes.” BioScience 52: 483–498.
Fisher, S.G. 1997. “Creativity, idea generation, and the functional morphology of streams.” Journal of North American Benthological Society 16(2): 305–318.
Madej, M.A.; Ozaki, V. 1996. Channel response to sediment wave propagation and movement, Redwood Creek, California, USA. Earth Surface Processes and Landforms 21: 911–927.
42
GENERAL TECHNICAL REPORT PNW-GTR-830
Martin, D.; Grotefendt, A. 2007. Stand mortality in buffer strips and the supply of woody debris to streams in Southeast Alaska. Canadian Journal of Forest Research 37: 36–49.
Miller, D.J.; Luce, C.H.; Benda, L.E. 2003. Time, space, and episodicity of physical disturbance in streams. Forest Ecology and Management 178: 121–140.
Miller, D.J.; Burnett, K.M. 2007. A probabilistic model of debris-flow delivery to stream channels, demonstrated for the Oregon Coast Range, U.S.A. Geomorphology 94: 184–205.
Poff, N.L.; Allan, J.D.; Bain, M.B.; Karr, J.R.; Prestegaard, K.L.; Richter, B.D.; Sparks, R.E.; Stromberg, J.C. 1997. The natural flow regime: A paradigm for river conservation and restoration. BioScience 47: 769–784.
Reeves, G.H.; Benda, L.E.; et al. 1995. A disturbance-based ecosystem approach to maintaining and restoring freshwater habitats of evolutionary significant units of anadromous salmonids in the Pacific Northwest. Symposium on Evolution and the Aquatic System: Defining Unique Units in Population Conservation, American Fisheries Society.
Reeves, G.; Burnett, K.M.; McGarry, E.V. 2003. Sources of large wood in the mainstem of a fourth-order watershed in coastal Oregon. Canadian Journal of Forest Research 33: 1352–1362.
Reid, L.M.; McCammon, B.P. 1993. A procedure for watershed analysis. Review draft prepared for the Interagency Forest Ecosystem Management Assessment Team, July 14, 1993. 139 p.
Sedell, J.R.; Dahm, C.N. 1984. Catastrophic disturbances to stream ecosystems: volcanism and clear-cut logging. Pages 531–539 in Klug, M.J. and Reddy, C.A., eds. Current perspectives in microbial ecology. Michigan State University, East Lansing and American Society of Microbiology, Washington, D.C.
Steel, E.A.; Feist, B.E.; Jensen, D.W.; Pess, G.R.; Sheer, M.B.; Brauner, J.B.; Bilby, R.E. 2004. Landscape models to understand steelhead (Oncorhynchusmykiss) distribution and help prioritize barrier removals in the Willamette basin, Oregon, U.S.A., Canadian Journal of Fisheries and Aquatic Science, 61: 999–1011.
Swanson, F.J.; Kratz, T.K.; et al. 1988. “Landform Effects on Ecosystem Patterns and Processes.” BioScience 38(2): 92–98.
Townsend, C.R. 1989. The patch dynamics concept of stream community ecology. J. North Am. Benthol. Society 8: 36–50.
Washington Forest Practices Board. 1997. Board Manual: Standard Methodology for Conducting Watershed Analysis. Washington Department of Natural Resources., Olympia, Washington.
Weins, J.A. 2002. Riverine landscapes: taking landscape ecology into the water. Freshwater Biology 47: 501–515.
Questions and AnswersQ: People take the same data and come up with dif-ferent answers: how are you going to deal with that in your open source web tools portion of the scheme?
A: That does not have an easy answer. As you said, you can look at a debris flow hitting a stream. My perspective says, wow, this is going to be key habitat in five years and it’s going to last for 50. And yet somebody else looks at the landslide sitting in the stream and has complete heartburn – sees the same thing as resource damage. So inside these tools there are movies that show the dynamics; published papers that have CDs. In other words it’s an educational tool. The assumption that watersheds are really stable until you disturb them by logging and the fire disturbance paradigm is part of that problem too. So the public and some technical people subscribe to that view of things: either that or they use it to advance their agendas. If you don’t have enough information, that
43
Riparian Adaptive Mangement Symposium: A Conversation between Scientists and Managers
is an unwinnable fight-you’ll never win. But here is the thing, if you bring everybody along, in this case using the landslide example; there is lots of data out there, lots of evidence and models that illustrate what is going on. If you see a landslide sitting in the stream and you have a natural history perspective that it has some value, I think you can change the argument with better information. I don’t have a good answer but I’ll flip that back to you and say: how are you going to get out of that problem? How is the forest community of stakeholders going to get out of that except through education? One common situation is to build walls around your position. I’ve seen that done in certain sectors; I don’t think it’s a sustainable way.
Q: Think about ways we might be able to put some sideboards/referees into the system so that when we do accumulate that much data/information, eventually the preponderance of the information that weighs one way ought to be given some credibility.
A: Right, I agree. And so to answer with a little bit more detail: in the system that we’ve been building, every tool or parameter has a hyperlink, a technical manual associated with it. And you have it on your screen with a mouse click. It is 400 pages now and other people can contribute to it. It has all the refer-ences in there (for debris flows for example). It’s like if you get the data, you don’t need the technical support for it. But anybody else using can get the technical support; it says look at all this evidence for the fact that these things (landslides) can be constructive. It’s a way to force the hand of people in a direction that is technically supported.
Q: Does the tool provide references to the literature?
A: It does; not in great detail because we don’t have the resources. But right now it’s 400 pages and for example, for debris flows there might be 5–6 pages with 30 references. But you could expand on that as you know. It says landslides can be destructive, yet
there is a natural history perspective and here is the citation, here’s the evidence, here’s the field data. I think you could improve on that.
Q: How much of the references integrate these stud-ies, how much on components versus how much on integration?
A: It’s mostly reductionist by process; you know, wood recruitment is a process but then it has mortality, bank erosion, land sliding. Landslide prediction is a process. Of course there is reference to photos of post fire land sliding. Here are photos of a 1936 fire in the Olympics that caused all kinds of landslides. I would say that the documentation / technical reference that would go with the data would have to be improved and added upon by some users who would be considered part of the process, then it would become very robust. Right now there are only a handful of us assembling this.
Q: A follow up to that: could the system be used to present hypothesis, say to look at a landscape scale experiment?
A: There is some gaming potential now that is going to grow. So the wood budget that’s in there now has the ability to be gamed: you can change the forest age or input parameters. Some of those things are more sophisticated for people who are into that. But it was supposed to be designed for also a lighter touch. For example the BLM is running all kinds of simulation for wood recruitment because they want to inform their new forest plan in Oregon, to do some more aggressive harvesting. They’ll come up against some technical reviews and so they want tools that will allow them to look at woody debris and debris flows. And if they thin next to the stream is it at 5 percent or is it at 2 percent or is it a 50 percent. So the idea is that the platform is an evolution and will never stop. So if someone wants to game something, that tool will be built in.
44
GENERAL TECHNICAL REPORT PNW-GTR-830
Q: Does it have optimization potential?
A: Yes it does, but right now we are just scratching the surface. We anticipate opening up for interaction with people who can technically collaborate. That’s where we are at, at this point. It needs that-more intellectual power.
Q: What is the mechanism that this Netmap uses to display uncertainty about things that we don’t know? How are things displayed that are going to play out in the future such as climate change on physical pro-cesses?
A: It doesn’t have anything explicit to do that. It’s basically running off of general principles that you can find in literature. So actually, what it does is, it takes a relatively simplistic view, totally and admittedly it takes a relatively simplistic view. What we need to do, and it is in the pipeline, is to produce outputs in terms of probability distribution. If you changed the climate for example, you’re going to find a changing probability distribution of anything: flow, fire, wood, sediment. But there is no way the community at large, in my opinion, can deal with probability distribution. So we completely backed off on that. If you want to do a real sensitivity analysis for climate in a real sense, I would argue that the probability distribution is cor-rect. The problem is you’ve created a technology that nobody can use; you can use it in the Ivory Tower or at PNW and talk about the big picture. And then I would hope that with this more simple view of the world, those kinds of perspectives would overarch that. There is not any explicit detailed sensitivity analysis, it just goes in the literature, and virtually everything in here is published and supports the tools. It says “what is our general understanding of shallow seated land sliding, or wood recruitment or heating”? And I think if you wrote it down, you’d find out that we are pretty much in general agreement with the big picture. This is only supposed to take those ideas and make them manifest
with all the ideas for which we don’t have perfect science. It is an admittedly simple approach using accepted general principles which means there is lots of uncertainty still.
Q: Some of the physical processes are relatively well understood, some less well so, the temperature models for example, whether you get all the process right or not is a problem. How do you deal with displaying/understanding uncertainty and the limitations associ-ated with the physical process underneath some of them?
A: I think there is an underlying assumption of using what’s out there today even though it’s approximate. These tools are meant to be a screening tool. I don’t care if its 100 percent off. In fact you know anyone who works in geomorphology knows that if you are within 100 percent of anything you are doing great. In fact some people think in order of magnitude. General patterns are the focus. This is interesting, because of the underlying philosophy that says certain high levels of complexity in the watershed sciences are not going to be resolved; you just don’t go there. We are not ready to go there, and of course, people take that and beat you over the head with the uncertainty until they win the fight. But that uncertainty in some regards is unresolved and our objective is coarse screening. Now since this tool is supposed to continue to run and be alive, as soon as somebody finds a better way to do it – then the old would be yanked and the new one put it. The idea is that it will be a tool set that would never become outdated. As soon as LIDAR comes on, all the 10 meter goes out and the LIDAR comes in. But I agree, you are absolutely right that there is large uncertainty and you might be getting a wrong answer for erosion or land sliding. Like deep seated land slid-ing; you go to the literature and there’s no good tools. Massive landslides during last year’s rain storms; we can’t work on that, we don’t know enough to predict
45
Riparian Adaptive Mangement Symposium: A Conversation between Scientists and Managers
or prevent it. They’re applying LIDAR data to that assessment problem but I still suspect that we will not be able to move beyond an extremely large amount of uncertainty, maybe never, because of subsurface interactions that are driving these things. But that’s OK to admit that and move on. Some things we won’t be able to handle at all well.
Q: I’ll provide some feed back to that from a land management standpoint: incorporating that uncertainty in your models would have value, especially if you are looking at management to achieve trust responsibili-ties and through the public review process. There is growing need to demonstrate that you have addressed the uncertainty. There would be value in incorporating that; there is a growing audience that would see value in that.
A: With the hyperlink manuals, I could see an entire set on uncertainty. But that would require other expertise, time and efforts to do, and we don’t do that very much.
Q: You mentioned modifying the FEMAT curves across the landscape. How would you use a tool like Netmap to do that?
A: If you want to consider upslope sources of wood for example, including debris flows, these tools can do that. If you want to adjust for temperature, these tools can do that or you can go to USGS website, download their steam temp model and use that. Some headwater streams would be sensitive to thermal loading and some aren’t. In FEMAT if you read the most recent material on FEMAT that Gordie authored, it’s full of information on disturbance and variability. The forest service just hasn’t taken it to that step. It’s conceptu-ally in there, it just isn’t done. If you wanted to start messing with things like the width of the riparian recruitment zone for mortality and bank erosion, you have to do what people are doing in California and
Alaska They go out and conduct field studies and mea-sure everything and find out that it is 100 feet and not 150 feet for say bank erosion mortality. But remember if the targets 100 percent (FEMAT target) you are basically at tree height. So you don’t even have to go out and measure it because it’s basically a tree height at the very farthest point. But in California, three timber companies for example, hired us to survey 100K of rivers/streams to determine where wood was coming from using new technologies that was developed in 2000. Headwaters, I think, is where the greatest benefit and gain is to be made.
Q: So back to mainly operating with the static stream idea; there was a concept to reference stream condi-tion. That was based on landscape position, slope and geology and with these we should be able to predict what a stream is supposed to look like in an unman-aged state. The type of work that you and Tom Dunne, especially considering the probability distributions that you talked about, is very valuable. Do you think that reference stream condition or that idea makes any sense anymore? I was shocked to see in the upcom-ing American Geophysical Union meeting in San Francisco, that there is an entire session on defining reference stream conditions.
A: The future into the past: I saw that too and was kind of stunned. Some people just have it in their mind, although I think you could go in there with a paper on probability distribution and say, this is the reference state. I think they might welcome it. Then the issue is there. It is an average condition for any channel, even if there is a probability distribution there is an average. But the only way to see that average, is to go to all the channels that are like oriented, and that might be hundreds of channels, measure them all and calculate the distribution and take the mean. It’s kind of useless at the site level because you might come to
46
GENERAL TECHNICAL REPORT PNW-GTR-830
the site and there’d be a big log or knot or landslide upstream 20 meters and then it looks different.
Q: I’m going to ask a completely unrelated question; your model says that large headwater streams don’t move wood very far maybe 30 meters. If you leave a buffer on a stream like that and a significant portion of the buffer blows over, what is the value of leaving a whole bunch of big wood on a little stream that’s not going to move it anywhere?
A: I don’t know; that’s kind of separate question of what’s the role of wood. You have more experience here on the Olympics on that very question. Somebody said that the wood piece made scale with the stream size, that smaller pieces do the work on smaller streams, you get that aspect., There is another aspect coming out of the Oregon Coast Range, mostly, but even in the Olympics, is that if it’s a debris flow prone stream you want the bigger pieces.
Q: If it’s not a debris flow prone stream?
A: Yes, I think there is an argument made that small material might function there and you actually have some data to show some of that, I mean absolutely.
47
Riparian Adaptive Mangement Symposium: A Conversation between Scientists and Managers
PresentationI was assigned to talk about riparian processes and aquatic habitat and response of aquatic populations. But what I really want to talk about is what I’ve listened to here. And I will spend a little time talking about riparian functions and effects on streams.
I want to talk about the evolution of forest prac-tices in Washington-George Ice touched on that this morning but I took a slightly different look at it and looked at it through the perspective of how have we used science over the last 30 years to inform changes in forest practices here in Washington and I would argue it equally applies to Oregon. I’m not as familiar with the forest practices in California and Idaho. I’m going to talk about disturbance and I think you’re probably going to get a lot of it today. And then finally, and this is somewhat cynical, but you’ll see where I’m coming from when I get to this final section-I am going to talk about all this attention to riparian man-agement of forest lands and does it really matter for some of the aquatic resources we are most interested in protecting.
Managing aquatic habitat on forest land-the folks this morning were supposed to talk about key hypothesis. And George and Gordie did spend some considerable amount of time talking about a whole set of hypothesis that are sort of the underlying basis for forest management here in the Pacific Northwest. But really our management for aquatic systems applies not just to the forestland. There is a key underlying assumption that we can identify in the landscape,
specific locations that interact most intensely with streams systems and that by protecting those few loca-tions we are going to be able to create and maintain aquatic habitat conditions that are sufficient to sup-port healthy populations of native aquatic biota. That really is the underlying assumption to the approach we choose for aquatic system management, not just some forest lands. This underlying assumption has a couple of corollary assumptions associated with it.
The areas requiring protection in order to protect aquatic systems are relatively small. If you are in commercial timber management this leaves a lot of the watershed area where you can practice commercial forestry while still maintain good aquatic habitat.
The second assumption here is that we can actu-ally design effective Best Management Practices that will protect the functional interaction between that sensitive location on the landscape and it’s relation to aquatic systems.
So really I think these are the underlying assump-tions for our approach to managing aquatic habitat here in the northwest.
Riparian influences on stream habitat: there is a laundry list and in a minute I’m going to show the FEMAT curves too, so I’m covering all the bases. Clearly we fully appreciate the important role that riparian systems play in maintaining, creating and modifying aquatic habitats. Everything from water temperature, trophic dynamics, litter input, stream primary production, bank stability, sediment delivery,
Bob Bilby, Weyerhaeuser Company
In light of current scientific understanding, what is the degree of both confidence and uncertainty for each of these
working hypotheses and assumptions?
Aquatic Habitat – Populations and Riparian Processes
48
GENERAL TECHNICAL REPORT PNW-GTR-830
habitat, in-channel wood, channel form and material transport (sediment, organic matter, nutrients).
Here are the FEMAT curves; we’ve spent some time talking about them today. As I get into a dis-cussion about the history of forest practices here in Washington State, I think the relevance of these curves will become more evident. I see the publication of these curves as really being a watershed event, if you will, and particularly in regulatory discussions about forest practices throughout the northwest. Before these curves were published we tended to think about individual factors like water temperature, and focus on that single factor. Here now we have a couple of thing going on. First, a more comprehensive identification with a full range of factors in the way in which ripar-ian zones influence stream systems. And second, an explicit recognition that the intensity of these interac-tions varies with distance back from the channel, and that the shape of that curve varies depending on the function that you are talking about. Gordie talked this morning about having good data to actually generate these curves when they were doing the NW Forest Plan. I agree that there are certainly empirical data for some of these and we’ve seen some of that today. But there are some for which we don’t have good empirical information. Certainly water temperature has been well studied. There are two obvious differences in the water temperature data for samples taken on the South Central Coast of Oregon; you get higher maximum temperatures and you get high temperature fluctua-tions. You see two obvious differences here – one is you get higher maximum temperature and you get high temperature fluctuations. We pretty much understand the relationship between buffer width and shade pro-vided to the channel. But as people look at this, it has become apparent that there is some variation, spatial variation, caused by a variety of factors. Different stand ages, different stand types; all have an effect on
the shape of this particular curve. Wood debris, and I’m not going to belabor this, certainly there has been enough work done on wood in streams, the important role that it plays, that nobody questions anymore the important role of wood in streams. But it has a funda-mental effect on the material transport system, whether you are talking about sediment transport or organic matter storage and there has been ample evidence that there is also a response in the biota in the streams to the availability of wood.
There have been umpteen experiments where wood has been manipulated in some way, removed or added to the channel, and people have looked at the response in the biota. These are two examples; Bruce Wallace / Georgia, removed wood from stream and looked at the response of the invertebrate population and they saw not only changes in abundance, but fundamental changes in taxomic populations as well. Some work that Curt Fouts did in British Columbia a number of years ago, where they added wood to a stream channel and compared systems that had a large amount of wood and small amounts of wood and saw a large difference in fish biomass in those systems. Clearly wood is important.
These are my interpretation of McDade Curves, but you’ve seen a number of these already. We do have good empirical evidence on buffer width and delivery of wood from the stream side buffer. And again we are only talking about delivery of wood from that one source. Basically the rate of input decreases with distance from the channel. Trees close to the channel have a higher probability of winding up in the stream when they fall, but again, even with wood input there is a high degree of spatial variability. Things like stand conditions, topography, rate of channel migration; all have influences on wood input and its relationship with distance to the channel. There is less sound
49
Riparian Adaptive Mangement Symposium: A Conversation between Scientists and Managers
information, empirical information, on some of these other functions.
One afternoon, about three or four years ago, we were talking about the FEMAT curves and what evidence was available to populate those various rela-tionships. We started talking about litter input. What factors do you want to consider to actually generate a litter input curve, what are some of the factors you have to account for? It turns out that this function is complicated: we’ve made the assumption that if you provide for wood and you provide for shade, you’ve got most of the other ones covered. Maybe that’s not true. With litter delivery, we decided that wind speed would be very important. Once a litter detaches from a tree, the distance that it travels is going to be greatly influenced by wind speed. Wind speed also influences litter production: after a big windstorm you have to go out and rake your lawn. Type of litter can have an effect on distance traveled: aerodynamically needles and leaves are different. Wind Direction can influ-ence litter contribution to a stream; wind blowing perpendicular to the channel can deliver litter from a substantial distance. With winds parallel to the chan-nel, only trees that are adjacent to or overhanging are going to be effective at delivering litter. Seasons will make a difference; more litter falls at certain times of year than other times per year. Forest characteristics are going to play a key role as well. For example tree height-a piece of litter that’s released forty meters off the ground has a potential at a given wind speed to travel much further than a piece of litter that’s pro-duced twenty or fifteen feet off the ground. And also canopy architecture may play a role in this as well, in terms of the way it influences wind speed.
We should have probably left it at this…said ‘OK, we’ve hashed it through thoroughly’ but like many things, it got completely out of hand. We went out in the woods and decided-let’s see if we can actually
document some of these relationships. And the way that we did this was by taking a nylon sack, filling it with litter, either alder leaves or Douglas fir needles, and hoisting it up into the canopy, waiting for a particular wind speed and then pulling on two lines that opened a Velcro-closure at the bottom of the bag, releasing that litter and then capturing that material in these litter traps that were arrayed at set distances downwind from the location of the release site. We did this at numerous locations at a variety of stand loca-tions. What we found was that clearly, wind speed and travel distance were related but we found that we got much greater travel at any given wind speed when we were talking about mature stands: large trees 140-160 years old. In those stands we were releasing the litter at the bottom edge of the canopy, thirty meters off the ground. Contrast this with second growth conifer or hardwood stands where the bottom edge of the canopy was about fifteen meters off the ground. Travel distance was substantially less at a given wind speed in those younger stands. Alder leaves, in general, tended to travel further than fir needles in a given wind speed. We also characterized litter production as a function of wind speed. We saw the relationship we sought: it’s not very good but it was statistically significant. When you get more wind you get more litter produced. So we took this information, combined it with some published information on seasonal production of litter, then we took two wind data records that we had generated by placing anemometers at two sites. One was in a riparian area in an intact stand in the Wash-ington Cascades. The other was about two kilometers downstream from that site in a stream side buffer. We took half hour wind speeds, applied these relationships that I just talked about to those wind records and then generated these curves. What we found was there was difference in cumulative litter input by stand type. Litter input occurred further away in the older stands.
50
GENERAL TECHNICAL REPORT PNW-GTR-830
But also interestingly, we saw there was a difference in litter delivered in the buffer and in the intact stand. In the buffer, as a result of the removal of the upslope stand you had consistently higher wind speeds, litter delivery actually occurred from greater distance then was the case in the intact stands. But the point here is that we saw significant amount of variability just look-ing at these two wind records in terms of difference with stand condition-the difference between needles and leaves, the difference between the buffered and the unbuffered site. But as we stared to think about this it became apparent that if we started to take a look more broadly across the landscape, across the region, a whole bunch of other factors which would contribute to spatially variation. Things like variation in wind behavior, variation in prevailing wind directions, topography of the riparian area-steeper sites are going to deliver litter from considerably greater distances, were affected. Essentially, the height above the channel is what you are interested in, in terms of affecting litter delivery.
The point here is that we are talking about highly variable functions: the relationship between stream side buffer width and these various functions is very, very variable, spatially. It’s variable temporally too. But as everyone has said already-a one size fits all buffer configuration, a riparian zone management strategy, probably is not well founded on a technical basis. Also it raises the question of the whole idea that assuming there is some optimum riparian conditions that we need to find-assuming that if we can achieve the condition uniformly across the landscape, we’ll have the optimum for biological diversity and produc-tivity. That does not seem to be the case based on what we’ve learned so far about riparian interactions with stream systems.
A historical context: I wanted to bring this up because to my benefit-or maybe the curse-of having
a very long perspective on this issue in Washington State, I think we’ve done a reasonable good job of incorporating new understanding about riparian stream interactions into the rules over the last 30 years. Partly these changes have been driven by improved understanding of the interactions between streams and their watersheds. But I’d be remiss if I didn’t’ men-tion there were some pretty powerful policy drivers as well that contributed to the evolution of the forest practice rules in Washington. The Clean Water Act, Endangered Species Act, Boldt Decision on tribal fisheries which also applied to habitat condition-all have been a primary driver in Washington as well. Basically the way the changes have occurred is that as we have understood better what some of the functional interactions are between riparian zones and streams, those functional interactions have been incorporated into rules and the rules have been changed accord-ingly. Back in the 1970’s, at that time there were not requirements for buffers along any stream. This is what a typical harvest looked like (slide) but with the enactment of the forest practice rules in 1975 in Washington, they decided that they needed to include something to address water temperature. Those initial rules only applied to streams that were below a certain elevation (2000 feet). You did not need to put buffers on streams above 2000 feet—they were not considered to be temperature sensitive and also you didn’t have to leave a buffer if there was some risk that blow down might occur. They were relatively modest rules required at that time.
It was with the recognition of the role that wood played in channels that we really began to change the way we thought about riparian zones and the way that DNR started to protect streams. Before that time, (slide) this is what a typical commercial forest planta-tion would look like in western Washington. Manage-ment has occurred right down to the channel edge—as
51
Riparian Adaptive Mangement Symposium: A Conversation between Scientists and Managers
a result of that kind of management approach, there was less wood in streams in managed forests then there were in natural, unmanaged stands. There is a variety of work that has been done to demonstrate that.
So in the 1980’s there was a substantial revision of the rules in Washington through the Timber Fish Wildlife process. One of the major changes in terms of how they managed riparian zones was to incorporate considerations for wood input and increase in buffer width. More importantly there was consistent appli-cation of buffers on streams throughout the state-it wasn’t just applying to these temperature sensitive streams anymore. The biggest changes in rules, however, have occurred since the early to mid 1990’s, starting with the development of watershed analysis and moving through the Forest and Fish process. Here we again see an expansion in the proportion of the drainage network that receives buffers, part of this expansion is due to improved understanding of how fish are distributed in watersheds. Initially we had greatly underestimated the headword extent of fish. Fish streams tend to get bigger buffers than non fish streams. The other thing that happened in Washington is now we do actually require buffers on larger non fish streams, those that have perennial flow. This is a pretty good comparison of the application of the rules (slide) pre Forest and Fish with some retention on non merchantable timber in the stream bottom, and what it looks like after we have 50 foot buffer on streams.
The other thing – and this gets back to the whole question of disturbance that Gordie brought up-we’ve extended protection beyond the riparian zone, recog-nizing that there are other locations on the landscape that do interact intensely with stream systems, at least periodically. Clearly one of the big ones is unstable hill slopes.
I’m going to talk a little bit about the role of distur-bance, but right now I think the general opinion among
many folks doing work in this area is that many of the characteristics of our stream systems are dictated to a large extent by rare, high intensity disturbance events and then the process of recovery that occurs after that disturbance. Take a look at a fairly typical disturbance sequence-this is a fairly consistent response-time is on a log scale (slide) the disturbance itself typically causes disruption of habitat conditions, direct moral-ity of critters living in the stream system, a decline in productivity that last for relatively short period of time—usually—followed thereafter by a rapid rebound in productivity that is caused primarily by increase light reaching the channel, increased availability of nutrients. As a result, increased primary production and an increase in productivity that lasts a relatively short period of time (ten years or so) until the canopy closes over the stream channel again, reducing light input. And then you get a long slow period of increas-ing habitat condition, improving habitat condition, as the materials that were deposited in the channel as a result of that disturbance are worked by the stream and developed into high quality habitat which occur 140–200 years post disturbance in many cases with a diminution in habitat quality thereafter.
Using a debris torrent example, immediately after the event, things don’t look so good. This is the state where you see some direct morality, reduction in pro-ductivity but within four to five years as that material is worked by the stream you begin to see development of more defined habitat, more complex habitat condi-tion, channel conditions, open canopy, lots of light reaching the channel and in this state you typically see relatively high levels of biological productivity that lasts until the canopy closes (example of data slide). Three streams in Mount St. Helens – immediately following the eruptions you see very low levels of productivity, but within three to four years afterwards, these three streams, two of which were in the blast
52
GENERAL TECHNICAL REPORT PNW-GTR-830
zones, one of which was in the mud flow, show a rapid increase in Coho production, to a very high level when compared with other streams in the region. And then a slow decline through time as those sights shaded over. The mature forest systems where we typically see, from a physical standpoint, the highest quality habitat, here you have abundant wood provided by the initial disturbance event, plus you have riparian stands that are now beginning to contribute some wood. You have lots of the other inorganic material that were provided by the disturbance still being worked over by the stream and a lot of these low gradients that typically are associated with debris torrent deposit still persist in the stream channel even 100–200 years after the occurrence of the disturbance event. This is where we typically see peak habitat conditions and as you move into true old growth conditions you see much of that material that was contributed by the disturbance being removed from the channel and a gradual decline in habitat conditions.
Again the system now is set up for another dis-turbance to improve habitat, improve aquatic habitat. Obviously old forests provide habitat for things other than the aquatic system so there is certain value to them as well. But the point here is the stream channels are going to vary. They are highly variable-they are going to vary two ways, the first of which is spatial: they will vary due to basic physical characteristics of stream channel, gradient, confinement, in valley form. And then overlaying those basic spatial differences and underlying characteristics of this system is this whole pattern of disturbance followed by recovery, temporal differences. As a result over a wide area, a watershed, a region, you are going to have highly variable condi-tions regardless of whether or not humans have inter-vened in that landscape. This is what Lee Benda said doesn’t really work as a way of characterizing desired future conditions – a probability distribution. But in
fact it’s the most realistic way to take a look at water-shed condition, here using temperature as an example. So in a relatively unimpacted, unmanaged watershed, you can expect to see a range of mid-summer tempera-ture as a result of disturbance, differences in channel conditions. Some sites are going to naturally exhibit relatively high temperatures, because they’ve been recently disturbed. Others are going to be quite cold. In a system where humans have impacted watershed conditions, you’ll see a shift in that distribution of conditions, in this case to the right toward warmer temperatures. So this might best represent the kinds of conditions that you’d like to see in a watershed if you are successfully protecting aquatic habitat. If you had this conditions, one way to monitor your progress back toward your desired conditions, is to take a look at the shift of the entire frequency distribution, in this case water temperature, but you can apply this to any other habitat attribute that you want.
So going back to the key hypothesis: disturbance is truly important, and I don’t think there is much doubt about that in determining the conditions of aquatic systems. How do we actually incorporate that into our approach to forest management, aquatic protection of forest systems? The forest service has had some experience with this (slide): they took a look at Agustus Creek-fire frequency, the distribution of hazardous slope stability across the basin, and then said what we’re going to do is identify those location where we shouldn’t be cutting trees because of poten-tial slope stability issues. And then on the rest of the area we are going to implement a harvest program that has sufficiently long periods of time, sufficiently long rotation times, so essentially timber harvest emulates the natural disturbance regime in the watershed. On public lands this may well be a viable approach. It’s probably not economically viable on commercial timberlands, but here in Washington, what we’ve
53
Riparian Adaptive Mangement Symposium: A Conversation between Scientists and Managers
evolved towards through time is a set of protective measures that include the riparian zone. So we have moved in the direction of accounting for disturbance to a certain extent in the application of forest practices here in Washington state by identifying and protecting unstable slopes. Probably you’ve got some additional work to do in determining whether or not we are adequately identifying unstable slopes and whether or not those unstable slopes when they do fail have the desired effect on the channel. We certainly have at least identified that this is a process that needs to be accounted for in forest management.
To finish this up I wanted to bring in what has become a favorite hobby horse of mine in the last several years. We can argue how we ought to be managing streams and forested lands in the Pacific Northwest and I would raise the question-does it really matter? Particularly if we’re talking about the retention of some of the most charismatic aquatic organisms – salmon. This quote here is only the first half-“rearranging the deck chairs on the Titanic”-this is a phrase that a fellow who had an office next to mine used to use quite frequently. It’s applicable to a lot of things that Weyerhaeuser does, but it’s applicable in this situation, I think, and Gordie raised this issue earlier, because the process we are attempting to do in the Pacific Northwest is to address a lot of the environ-mental issues that we’re faced with in the region on our forestlands. Certainly on Forest Service lands, but it’s also true to a certain extent, on private forest as well. So we took a look at the relationship between salmon population and land use in eighty-four watersheds.We had consistent data from 1984-2001. Our question was ‘do we see changes, not in the absolute number of spawning fish, but in their distribution across those eighty-four sites through time as land use change within those watersheds changed? Now we are not looking at absolute numbers but looking for changes in
distribution. What we found is that we had twelve or fourteen watersheds, of those eighty-four, which over that period of time experienced urban development. Forests were replaced with high density residential or some kind of commercial development. Of those fourteen sites at the beginning of that period-the mid 1980’s they in total were responsible for supporting somewhere around 20–25 percent of the total spawn-ing aggregation of the eighty-four sites. By 2001, those fourteen watersheds were supporting about 5 percent of the total spawning aggregation. We also saw a statistically significant decline in those watersheds where there was an increase in agricultural land use, although that represented a very small proportion of the total area. With rural residential increase use; there was a slight positive trend. But by far the great-est positive trend is seen in those areas that remained in forests. Those forested sites went from supporting 20–30 percent of the total spawning aggregation, to at the end of the study, supporting about 60 percent of the total spawning aggregation. Essentially as we converted land from forest, whether federal, state or private forest lands, into the more intensive human land uses we essentially lost the salmon from those watersheds and lost them very rapidly based on what these data showed.
Private and state land forest conversion-everything in western Washington, except federal lands-is occur-ring at a rate of about 0.37 percent/year, about 25,000 acres/year from 1988–2004. It may have slowed some in the last six months. Nonetheless it represents a fairly substantial rate of conversion from forest to other land uses, particularly in the Puget Sound counties: King County, Pierce County, Snohomish County, these are especially showing very rapid rates of conversion. But there’s actually something even more insidious going on here-take a look at the four watersheds where we did our Coho study which ranged from Lake
54
GENERAL TECHNICAL REPORT PNW-GTR-830
Washington in the south to the Skagit in the North. About 70 percent of the land in those four watersheds is actually restricted now for some kind of forest land use. It is federal forest, state forest or it’s private forest land restricted to forest use. This sounds good. But if you take a look just at those areas that are accessible to salmon, below blockages, you get a very different story. Only 35 percent of the lands adjacent to channels that are accessible by salmon actually are zoned and designated forest. Sixty-five percent is already zoned in such a way that it could be converted at some time in the near future.
Essentially what we’ve done is we directed forest conversion to those areas that are most important to supporting salmon. So we’ve got a problem not only with conversion. We’ve got a problem with where we are actually directing that conversion. If we’re going to retain salmon in the Pacific Northwest, the kind of discussions we are having here, I think, are important. But we need to understand what contribution forest lands can ultimately make to salmon and overall aquatic health. But I think that looking at forest land management alone is going to be insufficient. We need to really think very carefully about forest conversion and try to develop strategies that are going to help minimize the impact conversion will have.
I don’t think it’s realistic to assume we can stop conversion or even slow it in any substantial way. I suggest one way of doing this is to identify those specific locations within a watershed, regardless of what the zoning is right now or what the prevailing land use is, that have high biological potential, that have high potential to support aquatic resource char-acteristics that we are primary interest in and move to protect these from human impacts. Conversely that would mean steering development into other areas, the areas that have low biological potential, are not gong to be very productive or maybe they are already
compromised by current human land use within that location. Clearly this represents a substantial change in the way that we manage aquatic systems in the region today. Right now, we do it piecemeal, this set of rules for forest, this set of rules for agriculture, this set of rules for urban. But nobody’s taking a comprehensive look across all land uses and trying to come up with a strategy that’s going to enable us to identify and protect the most important sites.
Basically the key points I’ve made here today are that we have seen changes over the past thirty years and I would contend those changes have improved our understandings of how aquatic systems work and how aquatic resources respond to the application of forest practice rule changes. We still have some way to go, but we have made substantial improvements. There is still some need, I think, to explicitly include some con-sideration of disturbance mechanisms in the way we manage the stream. We’ve even made some improve-ment, I’d contend, along those lines. Increasingly, however, the future conditions of our aquatic systems in the Pacific Northwest are going to depend in large part on how we deal with this conversion issue. Right now it’s a pretty scary thing particularly given the fact we tend to be focusing conversion in exactly the wrong places. Right now I don’t see that there is an easy fix for that.
Questions and Answers Q: I enjoyed your exercise looking at litter quality; taking some theoretical ideas to a practical task. You can actually model that with an EPA approved model so you could confirm your results. I wonder-it seems like we have a fixation on large wood rather than litter. A couple of reasons-large wood takes a long time to get back. So the time factor is one. And then there is substitution in that you lose litter contributions with some riparian disturbance but you get increased primary production.
55
Riparian Adaptive Mangement Symposium: A Conversation between Scientists and Managers
A: The first one: I’d be interested in seeing how the EPA models actually compare to some of the empirical data that we collected. The one difference that we’re actually looking at is drift underneath the canopy. There is probably a lot more variability in the wind speed that the litter experiences rather than in a more open situation. The other question: this balance between in- channel primary productivity and litter and the role that plays in supporting productivity. Really the high levels of primary production are preva-lent only for a relatively short period of time imme-diately following the disturbance, or (in the old days) immediately following cutting to the channel edge. It’s a relatively short window of very high level of primary production. Primary production, of course, continues even in very low light levels, but at much reduced levels. In small headwater streams, even third or fourth order streams, litter terrestrial organic matter is the primary fuel for the trophic process in the channel.
Q: One thing that has occurred to me, when you look around the room, you ask yourself who is invited to this symposium and it’s either watershed policy folks or it is aquatic scientists. I believe that over the years that I’ve been involved, that we haven’t done a very good job of working with our wildlife colleagues on this whole question of riparian management. Yet as we start to examine our research over the broad scale, we start to appreciate more of the interactions that take place between aquatic and riparian plants and animals. You see that with the state of work on the importance of fish carcasses during the 90’s but what I suspect is, we still have a long way to go in terms of understand-ing the relationships between the riparian wildlife and aquatic resources. I’d like to get your take on it: what can be done to make policymakers appreciate the importance of studying these as an integrated ecosys-tem versus just having an aquatic orientation to our issues or a wildlife orientation to the issues?
A: It’s not just the policy folks. We are partly to blame for that partition as well. We aquatic folks work together, the wildlife folks work together; we talk to them sometimes. But I can count the number of times I’ve sat down and tried to design a study with some of the wildlife folks on less than one hand. But one place where we have recently had some success with some integration from a study perspective is with these intensively monitored watersheds. I’m involved in one in Oregon on the headwaters of the Trask; the Forest Service is involved as well. We have actually got some of the wildlife folks interested in that study and what we’re looking at is harvest on very small headwater channels and how harvest on them influences down-stream conditions. We got the wildlife folks interested in looking at bird populations along these headwater channels and asking the question ‘does change in habitat structure and the change in food type and potentially food availability have some fundamental influence on the productivity of the bird population as well as species composition’. There’s an example of where we can use one experimental platform to bring in some of the wildlife questions as well as some of the aquatic questions.
Q: Is wildlife the only missing element to be addressed on these sites?
A: Well, more or less as an afterthought we added riparian associated mollusks. With the sampling technique we were using we captured millipedes. We had no clue what they were-we sent them off, we had something like 5 species and a new genus. We have no idea what’s out there-there’s still oceans of things to learn about: the fauna and flora of these areas-especially the micro fauna and micro flora of these headwater areas.
Q: If you took the general notion that some of the food for the fish is coming off the land, that’s a fairly important function. The reason that works is because
56
GENERAL TECHNICAL REPORT PNW-GTR-830
are probably going to harvest the most productive sites because they’ll rotate faster, so does that mean we’re going to be harvesting right on top of the best fish sites? There really was no correlation, but there was a really strong correlation with one thing and that was the percent of hardwood in the riparian area.
A: I agree with you Ken in that we haven’t done a very good job in terms of riparian management in thinking about trophic processes. It’s essentially been ignored. The whole question about alder and the role it may play in promoting watershed productivity is one that is particularly relevant because we’ve been involved in a very aggressive program of eliminating alder and planting confer because it is a superior source of large wood. We have not considered the role that alder plays in terms of enhancing trophic productivity.
Q: There are very few studies out there that consider the forest management regime for improving fish productivity through the food chain. We came up with some wild ideas: creating gaps, promoting alder growth, and identified landscape or landforms where alder were more likely to be present. But as Ken also said: there’s no information and I think this would be interesting for ONRC to look at. How big of a gap, where would you put it? You might want to experi-ment with that, it has to be meaningful for the stream. Where would you put it on the landscape so you aren’t compromising large woody debris? We considered stuff like a certain size of a stream, aspect, junctions versus flood plains and stuff like that. It’s a very relevant question but also a relevant research subject to delve into for riparian management.
of the rapid growth of the alder-in fact it’s a nitrogen fixer. That really neat study on litter delivery, it took a lot of work and I can appreciate trying to do that sort of thing, so there’s delivery and then entrainment and then utilization as far as litter goes. Why do we really care about litter: the assumption is we care about litter because it has something to do with food for the fish. I’m reminded of the fact that most of the fish-centric evolved based on habitat: it’s always been the assump-tion that if you get the habitat right, the fish will come. Yet the very best salmonid fish growth that we know about occurs in place where there’s no habitat at all: hatcheries. In a hatchery it’s about food and yet we never seem to get food considered. And the idea that if you can measure how well the litter floats to the surface of the water, then the next thing is how well is it retained. Large wood comes into that for a lot of other things. The things that cause it to actually be incorporated into the organic cycle of a long or short stream reach or even a watershed; those are important considerations and yet I’ve yet to see any kind of management plan that has anything to do with food, whether terrestrial or aquatic. For example, we ask questions about site productivity from a forestry point of view. We are seeing that site productivity somehow translates into stream productivity, so we set out to measure site productivity in the upland site of the riparian area using alder as the metric; we measured the site productivity in the riparian and the upslope area, using typical forestry techniques. For the fish point of view it was age or weighted age as a measure of how well they’re doing. The concern was, OK we
57
Riparian Adaptive Mangement Symposium: A Conversation between Scientists and Managers
AbstractRiparian habitat plays a critical, but poorly defined, role in the maintenance of viable populations of many terrestrial species in forests of the Pacific Northwest. In general, riparian zone management has focused on the production and maintenance of high quality aquatic habitat, including wood recruitment, sediment storage, and water quality, to benefit in-stream populations, pri-marily fish. However, the way in which different ripar-ian management strategies influence the population dynamics of terrestrial wildlife is less well understood. I discuss 3 case studies to illustrate the difficulties in assessing population responses to management when temporal and spatial scales of research and manage-ment are not aligned: the responses of passerine birds to different buffer sizes, population changes in snag-dependent birds in response to intensive forest management, and occupancy dynamics of stream-associated amphibians. Numerous research results exist for these topics, but very few studies have uncov-ered causal mechanisms that describe the link between management actions and population responses. In part, these results may be attributed to research methods that were poorly suited to questions of interest, but also because sampling of local populations cannot capture dynamics that may influence regional populations. Also, I discuss how current management-characterized by uniform, localized disturbances, primarily harvest of individual stands-has been substituted for historic disturbances-such as volcanic eruptions and forest fires-that are characterized by patchy effects that occur
A.J. Kroll, Weyerhaeuser Company
In light of current scientific understanding, what is the degree of both confidence and uncertainty for each of these
working hypotheses and assumptions?
Riparian Habitat / Populations
over thousands of acres. Most riparian management strategies do not recognize the role of disturbance events that occur on larger scales, and instead focus on retaining small scale disturbances, such as debris flows, to provide in-stream habitat features. As implemented, current forest practices rules dictate novel landscape patterns and our research base is not prepared to address the consequences of these practices.
PresentationWe have a broad group of policy and science folks here today, and we can grasp intuitively the concept of populations, but as far as placing our physical hands on a population and calculating reliable estimates of population size, we are still stumbling around in the dark. People’s thoughts today are mainly focused on what’s going on in the stream system. We have wood recruitment, sediment storage, and water quality as the primary issues that drive management and policy actions.
For riparian species- my focus today- we have amphibians as a regulated group and as far as the riparian wildlife side of things is concerned, they have to have a backbone: no insects. Also, I am primarily talking about species that are terrestrial in nature. Besides the amphibians, which I’ll get to at the end of my talk, certain ecological functions in these riparian areas must be considered. Primarily, one is interested in short-term refugia in the riparian zones during the actual operations when the forested uplands are
58
GENERAL TECHNICAL REPORT PNW-GTR-830
being removed. Bridge habitat may occur where these organisms are staying in riparian areas for a certain time until the succession starts in the upland area. And finally landscape connectivity, something we’ve heard about today, an extensive riparian network exists, and species are using the network to move around in the landscape; exactly how they are doing it, for the majority of species, we don’t know. So, ultimately, I will focus today on the implications of these different strategies for populations, what we do know, what we’ve learned in the fifteen years since FEMAT, and what we still would like to learn.
Primarily, the focus is on the concept of source populations. Populations that, on an annual per capita basis, are net exporters of individuals as opposed to having individuals enter riparian areas and not doing as well in riparian areas as they do in other habitats. This is the notion of ecological traps; species pref-erentially selecting habitat that looks good and then suffering reduced reproductive success and survival in those areas.
So what has changed in fifteen years? I’d say we have an adequate understanding of riparian obligates species: species that require riparian habitat to fulfill their life history. That is something that was on the way to being developed fifteen years ago and we’ve done a good job in that area. Part of it involves distri-bution by stream orders-in larger order streams you’ll have things like river otters that you won’t find in first or second order streams. The natural question to ask here is whether fish buffers are adequate for the main-tenance of riparian obligate species? That’s something people ask me, and that is one of the issues I’m going to talk about today. By and large, we don’t really know. I’m going to focus on the exact habitat elements that these species are responding to in riparian areas as well as upland areas. Essentially this discussion is based on the implementation of Forest Practice Rules
and what this means to the distribution of these ripar-ian obligate populations.
I think one of the key developments over the last fifteen years is essentially a golden age of quantitative methods. A lot of wildlife folks have worked on this issue. They’ve provided a set of tools that allow us to have greater insight into these populations than we had fifteen years ago.
Primarily the way I look at the problem is that one has riparian populations and this framework for understanding them revolves on three key areas: 1) the habitat structure of these riparian areas: what habitat elements occur in those areas, what exists for management; 2) the ecology of the species that occur there (life history and distributions); and 3) this is the main focus of what I do at Weyerhaeuser, the research design, sampling, and analysis, how to establish stud-ies that answer important questions. What I see far too often is that statisticians are being brought into these projects once the data is collected and by and large that is an extreme form of triage; in a lot of cases it just isn’t going to help.
In general, our knowledge base about riparian species and how they interact with habitat varies in quality. We have some very good studies and we have some studies that aren’t so good: they don’t provide much insight. Generally, the knowledge base is insuf-ficient in size; we don’t have as much information as we’d like. One of the key aspects of the knowledge base is our ability to separate process and sampling uncertainty. Again, this has been a common theme throughout the talks today. This problem was quite large 20 years ago; the techniques to describe different sources of uncertainty as part of the research design just weren’t available. There have been some key papers that have come out in the last seven or eight years that have pioneered techniques to allow us to do that. However, I still think it’s possible, at this point,
59
Riparian Adaptive Mangement Symposium: A Conversation between Scientists and Managers
for us to ask what I would consider to be reasonable questions about populations based on studies that have been completed, data that’s available out there, and good ecological theory.
Populations: most biologists measure abundance. This is the pattern that appears within a population that varies in size over time and space. But abundance is really a function of four different processes: the birth and death of individuals and immigration and emigration: individuals who are exiting the population, individuals who are entering the population. Again, another issue that we’ve developed a better apprecia-tion for is the influence of density-dependence. How many or how few individuals are in a population; how abundance changes and how those four processes mentioned are working together. We have a large body of evidence (over 90 percent of the evidence of wildlife and habitat use is just habitat use information) describ-ing where one finds the species, how many, how they are distributed over time and space. A very small percentage of those studies look at habitat selection, why certain organisms preferentially select habitat, and how that selection affects their reproductive success and survival, as well as those top four processes. I’d say those few studies are more valuable because they do provide some insight into those populations, but again that is something that has only been recently reinforced over the last five to six years.
Rather than provide a broad survey of what’s changed over the last 15 years, I’m going to focus on three key areas because I think that will open up some questions among the group. I’m going to focus on three distinct taxonomical groups that I think have received the preponderance of the research interest in the Pacific Northwest.
The first issue I will talk about is buffers and birds. A study came up at the end of Bob Bilby’s talk with the idea of integrating upland areas and the riparian areas. Scott Pearson and Dave Manuwal published a study in a 2001 article in Ecological Applications1; it was part of the CMER riparian buffer studies. They were evaluating buffers and their influence on the bird community on 2nd and 3rd order streams in Washing-ton. They found that buffers approximately 30 meters on each side of the stream did not retain all the species that were found on unharvested areas. They were concerned primarily with five species: black-throated gray warbler, golden-crowned kinglet, Pacific-slope flycatcher, brown creeper, and winter wren. They determined that there was a drop in abundance of these species and they recommended that a buffer greater than 45 meters be in effect on each side of the stream; this was their most conservative recommenda-tion to retain these species. And their conclusion is that an unfavorable edge effect existed along these streams; these birds were declining in abundance. We know abundance changed-this was a relatively short term study (less than five years)-but why abundance changed is difficult to assess in a case like this. What happened, exactly?
This is one of the best forest management papers I’ve seen in a long time-certainly one of the best in the Pacific Northwest-but again it just gives us information about the pattern and not the process. However, we have access to data especially in the Western US which allow us to say something about the potential popula-tion level consequences.
The natural question is: what is happened to the birds? Where did these birds go; they weren’t killed by logging. As soon as the equipment rolls in, they are
1Pearson, S.F. and Manuwal, D.A. 2001. Breeding bird response to riparian buffer width in Pacific Northwest Douglas-fir forests. Ecological Applications 11:840-853.
60
GENERAL TECHNICAL REPORT PNW-GTR-830
going to leave. Did they go to nearby riparian areas, did they go further away to more suitable habitat, did some of them die in moving across the landscape, did they have an inability to access suitable resources or find sites? We just don’t know. We notice some short-term consequences with these different buffer strate-gies as far as abundance declining over a couple years of study. It would be interesting ten years later to go back to these sites and see what the abundance looks like and there has been some effort to do that.
The government (USGS) maintains long-term transects across the United States on which they have been monitoring birds for a long time.2 We have data for 1968–2005. These data can help us to understand what might be going on with these populations in the long-term. I don’t want any of my presentation here today to suggest a cause and effect relationship, but these data are one tool that might allow us to under-stand the cumulative effects of some of these practices, especially for birds that we know are influenced by for-est management. We have forty years of data, includ-ing how many birds occur per transect. The data are rolled up every year to calculate a per transect count (an average count per year over time).
Example: American Robin in Illinois, this com-mon bird is found throughout the United States; along these transects, they’ve been increasing over these forty years. The important thing I’d note is that look-ing at the trend line, one does not see a ton of variation along the trend line: there are lots of them (robins), there have always been lots of them, and there’s more and more with each year.
This is a bird the federal government is worried about: the Cerulean Warbler in West Virginia. This bird is not nearly as abundant as the robin and it’s
clearly declining in abundance. The data shows a little variance in its population from year to year, and they are very worried about this bird in the East.
Here are data for the Black-throated Gray Warbler in the northern Pacific Rainforest region, forty years of data, including southern British Columbia, Washing-ton, northwest Oregon; the areas west of the Cascade Crest. The first thing you note is that there is a ton of variation year to year in the count. Again, like the Cerulean Warbler, it’s never been a very abundant bird but if you were to go in on any time sequence and try to punch out five years to study this bird, you are going to get a lot of variation. Essentially you are going to be sampling from a population that displays a large amount of annual variation in abundance.
2All figures from: Sauer, J.R., Hines, J.E., and Fallon, J. 2008. The North American Breeding Bird Survey, Results and Analysis 1966–2007. Version 5.15.2008. USGS Patuxent Wildlife Research Center, Laurel, MD
Pacific-slope Flycatcher: in southwest Washington, you can’t go to a riparian area that has conifer over-story and not hear a Pacific-slope Flycatcher. They are fairly abundant; trending upwards over time. There’s been a little dip in the last six years-again a lot of year to year variation.
61
Riparian Adaptive Mangement Symposium: A Conversation between Scientists and Managers
Winter Wren: same thing. The amount of variation is even worse. If someone showed me this and asked me to do a four to five year study of Winter Wrens, I’d say not in a million years: you need to study them for decades. Say not in a million years:
Brown Creeper: the data look a lot better. For some reason the species has been trending up. It could be they are doing a better job of detecting it along the routes, but I doubt it.
Golden-crowned Kinglet: this bird is one we have concerns about. You can see that when surveys began 40 years ago, it used to be all over the place, but varia-tion is narrowing as the overall bird population goes down. That bird is in some kind of population decline.
Next, I want to talk about the retention of habitat elements, which is critical for retaining species. Populations of wildlife don’t respond to habitat types. They don’t respond to Western Hemlock forest per se or Douglas-fir forest. They are responding to the structural elements of the habitat that we can man-age, including snags, downed logs, shrubs, over- and midstory canopies, etc. Riparian areas provide all of the elements; in some cases they provide a lot of these elements. One of the natural questions to ask is ‘If we provide enough elements in riparian areas, do we not have to worry about habitat elements in the uplands?’ That has been a key assumption in a lot of riparian management strategies. One of the things that is lost in these strategies is that we don’t really have a very good understanding of how the spatial context of these
62
GENERAL TECHNICAL REPORT PNW-GTR-830
elements influences how the wildlife populations are using those elements and whether populations are going up or down or not changing as a result.
Again, there is the upland versus riparian element of the issue: where is the transition? In arid parts of the west, over 90 percent of the terrestrial vertebrates are using riparian areas for some aspect of their life his-tory. Obviously, water’s not as limiting as one moves west of the Cascade Crest so that number goes down quite a bit. But a lot of species are riparian obligates west of the crest. And finally, we just don’t have a very good handle of the landscape context. Most of our strategies are stand-based strategies: these strategies are paired with forest practice rules, and applied to the landscape. We change that landscape and we really just don’t know what that does to populations.
We know that snag numbers have been greatly reduced. We can follow the same exercise with bird population implications relative to snags that we did with riparian buffers. Snags have been reduced in riparian areas and upland areas over the last fifty years. Large snags, snag-rich patches, primarily in low elevations – we’ve eliminated those features. As we trend up in elevation, the picture gets a little bit better. I think anyone would expect, before becoming involved with any kind of study, that with the dramatic decline we see in these snags, that you would expect cavity-dependent birds to follow those decline trends. These birds are nesting and, in a lot of cases, foraging in snags.
But when one examines the data, it’s just not indicating that a significant decline is happening.
For the Pileated Woodpecker (a bird not well sampled with this method due to its very large territories) you can see they never detected more than an average of one bird per route in the forty years that they’ve been collecting data.
Nonetheless, it does provide a general index. Hairy Woodpecker: same thing, you see a little bit of an upward tick in abundance.
63
Riparian Adaptive Mangement Symposium: A Conversation between Scientists and Managers
Red-breasted Nuthatch: again a lot of year to year variation-there seems to be a little bit of an upward trend.
Chestnut-backed Chickadee: there’s tons of these birds out in the woods, but again if you look at the annual variation, it seems to be declining over the last decade.
There is one bird I have some concern about: the Red-breasted Sapsucker. This bird spends a lot of time in the alders. See what has happened over time –whether this has something to do with a bias toward alder I am not sure—but it doesn’t just like upslope alder patches, it likes riparian alder patches.
What’s happening in all of these examples? Food limitation, territorial dynamics, basic indirect competi-tion, issues on wintering grounds with other birds who are cavity-dependent, seasonal movements-we don’t really know. The way to track this issue is by banding birds, but the recapture rates for a lot of these birds are terrible so it’s hard to determine what is going on. An assumption that is overlying all of these graphs is that these routes are providing reliable samples-that people are identifying these birds correctly and also that the specific habitat along these routes isn’t chang-ing from the general habitat at the landscape level. An OSU professor published a paper to show that this very thing is occurring back east. There’s no doubt over the last ten to fifteen years in the Pacific Northwest that we’ve had some tremendous changes in the habitat of the forested and rural areas. And the question of how
64
GENERAL TECHNICAL REPORT PNW-GTR-830
relevant these routes are to providing inferences about these populations is a good one.
Also, snags are only one resource that we’re dealing with when we study what controls population numbers. This graph has been in the wildlife literature for fifty years. The Y axis is the percent contribution to the maximum population we could have on a target landscape or a planning area. Along the X axis is the number of snags. At some point you can continue to dump snags or any other resource into an area and you’re not going to move that population at all. At some place in this target region, it ceases to be a science question: it is a management question. Where do you want to set that target? We can provide some information about that but for 98 percent of the verte-brates out there we don’t know where that graph goes. A good opportunity for research.
Questions about habitat elements remain and for quite a few of them we don’t have answers. For most species, a good understanding of the relationship of what habitat elements they are using has not been achieved. The question is: how many do we need, what kind of spatial or temporal distributions do we want? The question about landscape patterns is the elephant in the room, including the proximity to older forest types. This is especially relevant when you are dealing with checkerboard landscapes. We have more of those down in Oregon than we do in Washington. Check-erboard landscapes create fragmentation because of forest practices and again, patch context.
A relevant example of what I’m talking about is shown on this slide. This is a typical forest stand, recently harvested; we’ve got a geology leave area there, also an upslope unstable leave area. You can see the buffer along the fish bearing stream. The first question: can you put some of the habitat elements found along the steam in the upslope area? For some species, they are only going to use habitat elements if
they are in an upslope area. We could shift some of the riparian habitat to the geology leave patch, although again we don’t have a lot of information on how that would work. Certainly for species that react adversely to increased edge to area ratios it’s going to work a lot better than sticking them out there where there’s no habitat area, no forested area. Or you could put habitat for species in the riparian area; I’ve put a heavy yellow arrow (there) because that is where they are going.
We are engaged in a very large landscape engi-neering project with regard to wildlife, the long-term consequences of which are primarily unknown. I think this is an interesting area-what would happen if we left trees in a whole contiguous patch? What if we took some of these trees along the riparian buffer and added them there (between geology leave area and riparian area). As far as the operator is concerned, the same amount of trees are left, but you would have a continu-ous habitat configuration there. You aren’t getting any operational fall-down-you can see from the skid trails that logs were pulled in either direction. Engineering and unit layout can be the primary obstacle in many cases.
We are having a hard time in the scientific com-munity, the wildlife community, getting people to understand the statistical issues. We’ve made headway, although the example I’m going to focus on is one we could have handled thirty to thirty-five years ago. There is just unwillingness on the part of practitioners to address this issue. I don’t want to focus on say-ing a particular study is right or wrong; science is an incremental gain of knowledge, some of it more reliable, some less so. One of the things we can do constructively, what we’ve developed since FEMAT, is to conduct critical reviews. We can start asking some legitimate questions about how much of this knowl-edge we continue to bring forward or how much will be regarded as merely anecdotal. How can that be done
65
Riparian Adaptive Mangement Symposium: A Conversation between Scientists and Managers
in an objective way that satisfies all the stakeholders, I wouldn’t know.
People are often interested in the population total for a particular species. They’ve relied on sampling to provide the count – some kind of index of that population size. And that is not actually correct. This quantity beta provides an estimate of the detection probability and permits an estimate of the population size and a measure of precision: a standard error with a 95 percent confidence interval around the population total. Why does detection vary? In the case of trying to count chickens, you might have different kinds of chickens; they might be more likely or less likely to be counted, certain chickens you are going to see every time. Further, we have good reason to expect that detection probability will vary by species, gender, age, habitat types and other factors
MacKenzie and Kendall (2002) are probably as responsible as anyone for a lot of these advances in quantitative techniques. They stated the following in a recent paper: that “detection probability tends to vary over time and space, and therefore the burden of proof should be on showing that it is equivalent, not the opposite”. We’ve operated, as wildlife biologists for the last fifty years, under the assumption that the probability is one, or does not vary over time and space. MacKenzie and Kendall are saying that ‘your assumption should be that it’s not one and you need to show that the assumption of no variation in detection probability is equivalent to one is correct. What does this mean for previous research? I don’t know – but whenever you read results of previous research, you should be thinking about MacKenzie and Kendall.
The same is true for sampling communities as for sampling populations. Again, we’ve always treated populations as distinct groups that are living together, but we know from ecological dynamics that competi-tion, predation, density-dependent factors and so forth
are causing these populations to interact in different ways over space and time. As a result, your individual and species detection rates are going to vary. It’s been shown in a couple of recent papers and will continu-ally be shown that methods that do not account for the source of variation can be severely biased. Again we are back to sampling our chickens, you add predators to the community, you get fewer chickens, you might also have different kinds of chickens that are now able to move into that space. Again, a good framework for addressing these issues has not existed in the past.
Finally I’m going to get talking about actual stuff that lives in riparian areas for most of the time. And that’s the Forest and Fish rule amphibians, the Tailed Frog, the Torrent and Van Dyke’s Salamanders. Amphibians in western Washington are the one taxa we spend a lot of time worrying about. We have an extensive body of research about these amphibians. Not so much Van Dyke’s, but for the Torrent Sala-manders and Tail Frogs, twenty-five years’ worth of research, well over one hundred published papers are available. We have no information about historic distribution or numbers, we have no idea where they used to be or how many there used to be in different areas. Estimating abundance for these species is not trivial, and that is why I was just focusing on our disappearing and reappearing chickens: not a single published study provides us with an estimate of how many of these things are out there or how many you find in individual streams. We have a bunch of counts. A paired watershed study, the Trask study that Bob Bilby is taking the lead on, is electro-fishing for these species, which is kind of a novel concept and I think it’s going to work. They are going to be providing an estimate of abundance with their research.
We have a Type N Buffer study here in Washing-ton where we are looking at variable width buffers and the effects on water quality and amphibians. We’re
66
GENERAL TECHNICAL REPORT PNW-GTR-830
going to be incorporating a method of estimating abundance. What we are finding is, not surprisingly, even before you begin the treatments you have a wide range of spatial variation in the abundance for these species. We have no information about population sizes and overall our statistical inference about what’s going on, especially with regards to forest practices, is weak.
What do we ‘know’ about forests and fish and amphibians and buffers? Stoddard and Hayes did a study in the Central Oregon Coast Range and found that there was a positive effect of buffers greater than 46 meters when they sampled sixteen 2nd order basins. I published a paper earlier this year with some colleagues where we sampled about one hundred and forty streams from Central Oregon to Snoqualmie Pass in the Cascades and the Coast Range. We found no association whatsoever between buffers and the species occupancy for these amphibians in second and third growth forest; none at all. We sampled a range of stands from stands that were harvested the year before the study began to stands that were about ninety years old. No effect there at all.
Positive and negative responses to buffers-some research suggests that leaving partial buffers in place is going to increase the primary productivity of streams and this change will benefit amphibians. We have an experimental study occurring in Washington that will evaluate that question. Certainly, having a buffer in place will alleviate the decking of slash and logs, which I can’t imagine is going to do anything but help these taxa. The question remains whether these amphibians actually need buffers. Obviously, I would say that their numbers (not their populations, because again that type of comment is inconsistent with what has been done in the past to study them) one should
ask whether these buffers actually help maintain in-stream conditions, that is, appropriate substrates for these taxa,, large cobbles, cold water, low sedi-ment levels. There is some connection between these amphibians and wood-again, what exactly is hap-pening – I don’t think anyone is really sure, it is all correlative evidence. It’s important to note, we didn’t have any buffers present during the first and second harvest and most of the forest across the heart of the range of the species has been harvested twice. What we are finding, (we just did a third order complete basin survey over the last two years for about seventy-five basins) is that the occupancy rates are still pretty high for most of these species. They are still in all of these third order basins. The natural question to ask is: how does that compare to the historical numbers? The natural response is, ‘we don’t know and we’re never going to know’.
Research does not support extensive buffer net-works. Dede Olson3 and some of her colleagues pub-lished a paper last year where they asked, as a working hypothesis how would one implement buffer networks on the landscape and study responses over time?
The ecology of Forest and Fish rule and amphib-ians is very much a gray area. We are still, in the literature, arguing too much over the forest practices effect on these taxa. We’ve gotten slowed down by that quite a bit over the last decade. One must also consider interactions with fish, because the exact nature of these interactions is not well understood. Someone men-tioned the issue of insect populations, and insects are what the amphibians are eating. They don’t eat wood, they don’t eat rocks; they are eating insects. Any study that evaluates whether bottom-up control of these populations is occurring would be a fantastic piece of information.
3Olson, D.H., Anderson, P.D., Frissell, C.A., Welsh, Jr., H.H., and Bradford, D.F. 2007. Biodiversity management approached for stream-riparian areas: perspectives for Pacific Northwest headwater forests, microclimates, and amphibians. Forest Ecology and Management 246: 81-107.
67
Riparian Adaptive Mangement Symposium: A Conversation between Scientists and Managers
Finally, connectivity across the landscape – do these things disperse within streams, do they disperse across the stands? There are implications for what you are going to be leaving for both riparian and upland areas. Dede Olson asked whether fish impede disper-sal; that’s an excellent question. We’re not sure. And what about geographic variation on the landscape? All these responses that I’ve talked about are relevant for the birds as well, any kind of wildlife taxa. We are talking about the implications from forest practices that are being implemented over millions of acres.
The last issue that I will discuss is disturbance. I’m going to provide some pictures to drive home the importance-or what we perceive is the importance for amphibians. Implications of disturbance, as other people have talked about today, tend to be dependent on scale, with small, medium and large disturbances. The bigger the disturbance, the more disruptive it is. We are talking about stand-replacing fires like the Yacolt and Tillamook Burns. The eruption of Mount St. Helens. Finally, Bob Bilby showed some pictures of debris torrents which occur frequently. The histori-cal range of variation for all these events; we have developed an understanding of that concept. But what historic range of variation means for these populations,
the return rate over time and the correlation between the size and the intensity of the event and its influence on populations, is not clear.
This is an example from Mount St. Helens – it went off in 1980. The West Fork of Schultz Creek, the picture on the top, was taken in 1985. The picture on the bottom was taken in 2000. You can see the wood bridge for reference.
This area was in the blast zone, super-heated air cooked everything. There is a hard-rock barrier downstream of this picture. Cutthroat trout were found above that barrier, so they somehow survived the super-heated blast. It’s likely some of the amphibians survived too. When I started with Weyerhaeuser, I went back to the old fish survey notebooks and sure enough, they started incidentally shocking juvenile Dicamptodons (Pacific Giant Salamanders) five years after the eruption, then both juvenile and adult Tailed Frogs eleven years after. This was at a time when the going belief was that tail frogs were old-growth depen-dent. Well they weren’t finding old-growth conditions 11 years after Mount St. Helens erupted. And they weren’t just incidental-this wasn’t a declining popula-tion, like Bob Bilby talked about with regards to fish,
Mount St. Helens, Schultz Creek 1985.
Mount St. Helens, Schultz Creek 2000.
68
GENERAL TECHNICAL REPORT PNW-GTR-830
crews were finding adults and juveniles. This was a recovering population. Of course, the natural question is: were they there before or not? We don’t know, but they certainly came back after and they are still there. When they go up every year and shock these fish—you can look at the notebooks—they are getting adults and juvenile Dicamptodons. Some of the biggest terrestrial
Dicamptodons that I’ve ever seen are shocked by fish-survey crews. Again these were incidental captures in ‘86 and ’92; if the fish technicians were actually looking for these things, they might have found them
earlier. They might have found them the year after the blast.
That’s Schultz Creek in 2006–2007—an enormous amount of recovery is evident in this photograph. As most people in this room know, these systems are pretty resilient.
This is a different picture: the important thing to note here is that you can see what Mount St. Helens did to everything around there. It’s all flattened, the streams, the slurry, the upland areas completely destroyed. Everything is on the ground, there are no snags. And this occurred over hundreds and hundreds of square miles.
This is a picture of the Tillamook Burn – very similar except the fact that a lot of trees are still stand-ing because there wasn’t a 250 mph wind gust follow-ing the blast.
And finally these are recent pictures of coastal areas in Oregon and Washington. On the left you have a first order stream, on the right you have a third order channel. They provided quite a bit of wood to the channel.
This debris torrent also delivered a lot of fairly coarse substrates. You can see the surrounding stands really haven’t been influenced at all, unlike those
Mount St. Helens, Schultz Creek 2007.
Mount St. Helens 1980.
Tillamook Burn
69
Riparian Adaptive Mangement Symposium: A Conversation between Scientists and Managers
previous pictures where the surrounding stands are gone. This is a riparian-constrained disturbance as opposed to the other disturbances, where the distur-bance impacted both riparian and the upland area. There’s some large wood in the upland area, but by and large, you have a lot more continuity between these environments after severe disturbances then after smaller ones. This is our contemporary land-scape disturbances. Smaller patch sizes, there isn’t as consistent an effect across the landscape, obviously because we just went in and harvested and removed the trees. We didn’t cook the whole place like we used to do—broadcast burn the slash. There is a lot quicker recovery from disturbance but again, I would say for most species the consequences of this kind of land-scape management are largely unknown.
Debris torrent, Oregon Coast Range. Debris torrent, South west Washington.
How riparian areas fit into that equation is critical, but poorly defined. We don’t have a good understand-ing of the population-level consequences of riparian management strategies. It’s that simple. Buffer size is obviously the main thing on everyone’s mind. For some species it’s not a question of whether buffers should be left, but only how large should buffers be? Again, available scientific information is going to take us only so far. Do buffer requirements scale with stream size? That is something that comes up a lot: if a species occurs in first or fourth order streams or uses those kinds of streams, does the buffer have to scale with the wetted width of the stream chan-nel? Some people might consider that question to be esoteric when talking about a landscape that is being repeatedly managed; however, there are a lot of dollars involved with that question.
70
GENERAL TECHNICAL REPORT PNW-GTR-830
Again, across stream orders, how are these popula-tions distributed as far as their population sizes is a gray area. I was interested that other people suggested staggered designs before I did. It might be that we can come up with some different ways for wildlife, for leaving the same number of trees but not hav-ing this continuous buffer so we can reduce some of these negative edge effects. Again, that would take a fairly comprehensive research program, and a lot of people working together across ownerships to achieve something like that. It’s important to note that a lot of these designs preclude harvest of sufficient volume. Now, this isn’t just one biologist working for a timber company that is pointing out this issue. I thought that one interesting aspect of the Olson et al. paper from 2007 was that they didn’t really talk to an engineer to determine if, given their buffer prescriptions, they could still pull any logs out of those units at all. The question becomes ‘if you say we need to leave this type of buffer,’ then someone will say ‘then it is not practical to take any trees’ so there is no question of buffers. You are just not going to harvest those stands, which gets very much to the strategies that people talked about before. Maybe we just start saying that in some of these second and third order watersheds, in places, we are just not going to harvest.
One thing, especially for the policy people to keep in mind-mainly what we are doing is using stand-based strategies. We don’t have landscape strategies per se. But as this picture indicates, this is a landscape pattern that is a result of stand-based strategy. It’s very much something that needs to be kept in mind, especially when you are integrating riparian areas into the overall picture. That’s the final thing: how do riparian areas interact with those contemporary patterns that we are forcing onto the landscape? We really don’t have a context, looking back over time, to see how these
landscapes developed as far as their disturbance pat-terns are concerned.
Questions and AnswersQ: Burden of Proof-where does the burden lie? I think that is an important issue that gets glossed over in many of these discussions. We should be very explicit in where the burden of proof lies. My sense is that you want to get up and argue that the literature doesn’t show an effect. Or conversely, could you show that it does have an effect? Depending on where that burden is, it’s going to dictate how your policies go and the type of actions you follow. Often stakeholders come to the table with two different burdens of proof. And yet we never address that and we end up arguing past each other. It’s one of the things we should be think-ing about in the policy arena. Where are we asking the burden of proof to be put? One could argue very strongly, that yes, if I look at the literature I could not cite the literature that demonstrates there is an effect, I cannot prove that there is an effect; therefore what we’ve done is OK. Conversely can you show what you’ve done is OK; can you go back and have the same standard and prove that what you’ve done has not had an effect. I think that is a very important issue that is glossed over and often time contributes to a lot of confusion and contentiousness that we have here.
A: Conflicting reports. Someone brought up earlier the idea that we have one paper here and two papers over here that are in conflict. So I can see what you are talking about; it could be a very good study, but we all talk about variability. In the end, large, robust studies such as the Forest Service might conduct across the United States is better then using a single, less robust study when it comes to referencing “proof”.
Q: Have the courts weighed in on where the burden of proof lies for the Forest Service? There is the Ninth Circuit Court decision that established that the Forest
71
Riparian Adaptive Mangement Symposium: A Conversation between Scientists and Managers
Service doesn’t have to prove “no harm” in all the management decisions.
A: Well it’s important to know that scientific proof and legal proof are two different things. That’s a new concept to a lot of people unfortunately.
Q: I have a question about the birds: do you know if there are programs in place to monitor the presence of persistent organic pollutants in any of these forest dwelling birds? I say that because my sense is that the use of forest chemicals is gone down over the last decades, but now with outbreaks of bark beetles it may be on the upswing. Do you know if there are any monitoring programs in place to look at that?
A: Not that I’m aware of. That is probably going to come up as a concern with regards to amphibians. There have been recent studies of indirect effects from the use of agricultural pesticides increasing the populations of snails that harbor a parasite that infects amphibians and causes limb deformities and also in some cases death. The reason I also bring that up is we don’t have any information about the amphibians we have in the Pacific Northwest as far as their populations. We do know on a world wide scale the populations of amphibians are absolutely being crushed. One of the things we haven’t seen in the Pacific Northwest, with the exception of issues with Spotted Frogs and Bullfrogs—some direct impacts that we know are causing populations to go down—is any sudden decline in our amphibians. When I say Pacific Northwest I’m talking about Oregon and Washington; certainly in places in California, in the Sierra, the Yellow-legged Frog has got chytrid fungus. Chytrid has been in a lot of other populations and they’re all gone, literally. So it’s something that I think people are really missing the boat on. We are spending a lot of time talking about the Forest Practices Act, with some reason in certain areas, with regards to these amphibians; however, we should be monitoring the
populations in areas even where there aren’t any forest practices going on, so that if chytrid or anything else enters these systems, we are aware of it. It hasn’t been found in salamanders in the Pacific Northwest.
What is going to happen? Certainly the organic pollutants are part of that problem-it’s already been demonstrated to have some indirect effects. We do use a range of different herbicides to manage forests in the Pacific Northwest; what are the potential consequences of that is anyone’s guess. This chytrid problem came out of nowhere-that should be a cautionary tale.
Q: Are there any new studies using banding going in riparian areas where you can actually get directional movement of birds?
A: Yes, they have the migratory pathway for a lot of these things. Where a lot of these birds go is fairly well established. There is a caveat to that: one of the hard things that they’ve tried to understand, especially for warblers and tropical migrants, is the migratory circuit. They know where they nest here in the US, but they don’t know where that specific group of individu-als is going to winter. Also they’ve found other ones that they’ve banded on the winter grounds but they are not quite sure where they’re going to nest. So they know where they’re going as far as their temporal movements, and we have long term population moni-toring that’s in place from banding studies. But again, it’s extremely variable just because of low recapture rates. You have examples of individual birds being caught three or four times, but that is extraordinarily rare. Most birds get banded and they aren’t seen again.
Q: What about night sensing for amphibians for example the Tailed Frog?
A: Yes, scientists at Green Diamond, have had great success with that. In fact, what it kind of reminded me of is when you black light the desert for scorpions. They are everywhere! On our company’s ownership (Weyerhaeuser), if I were to suggest it-that would be
72
GENERAL TECHNICAL REPORT PNW-GTR-830
it. It’s not something that we’re going to discuss doing because of safety concerns, but it’s probably the best way to look for adult tail frogs. In the summer time when you want to be surveying for them, absolutely no doubt about it. Again, you have some problems with detection, because not every one of those Tail Frogs is looking at you. If you just want to know if they are there or not, it is the best way to go looking for them.
Q: I agree with you that most of these salamanders are pretty hardy in Oregon and Washington. But how do you explain the fact that we never catch enough Van Dyke’s to know anything about them.
A: I have no idea. That one is going to take some concerted effort. The first thing we have to do on that one we already discussed. Contemplating the study over the next couple of years, we have to develop different methodologies that might actually work that are unbiased methodologies, and sample during the appropriate time of the year. Phil Peterson says that sampling should be done in the Spring, other people want to do it at low water time. We have to figure it out before we actually start a study. You are absolutely right; the literature on Van Dyke’s is probably less than 12 papers and it’s all ‘I found a few here’ or ‘I found a nest of Van Dyke’s, there is no comprehensive study of them that exists. Nevertheless, they are a regulated species.
Q: Bird species and frogs and other species in the riparian zone and the headwaters – are there other spatial pattern that are discernable at the watershed or landscape scales, vegetation age notwithstanding, like topographic position, slope steepness, what have you?
A: The one consistent thing you see for the stream dwelling amphibians, is that there is some kind of stream gradient/population relationship. People have said: ‘that’s because you go out in these areas where forestry dumped all the sediment in the streams, it’s only flushed them out of high gradient channels’. But they went and looked for these things in Olympic Nat’l Park-obviously they don’t have forest manage-ment there-and they found the same relationship. Salamanders want to be on these gradients. Now with these amphibians we also find something with channel order. Torrent salamanders definitely like headwater channels. For others, we find that there is a pretty pronounced distribution of abundance through fourth, third, second and first order channels. Why that is, nobody knows.
Q: And for birds?
A: In this part of the world, we don’t have a ripar-ian obligate per se. We have a lot of bird species that favor those areas. I mean, the Pacific-slope Flycatcher I always think of as the buffer bird. When we leave those Forest and Fish Report buffers out in SW WA, you’ll see one of those birds. But there is no work out there that shows that one is more likely to find it in first order as opposed to the third or fourth order channels. Is there some change? There’s got to be, because there is a habitat amount effect that’s tucked in there as you are moving down from large order streams: you are increasing of the amount of available habitat. So you’d have to separate that somehow. I’m sure there is some kind of pattern in there.
73
Riparian Adaptive Mangement Symposium: A Conversation between Scientists and Managers
PresentationWhat I want to do is talk about both spatial and temporal scale because I think this is something that often gets lost and we haven’t, again, recognized that it has some real importance in terms of what we’re doing for management.
Turning to our terrestrial counterparts and think-ing about how they look at the world-I talked about the idea of succession and that there’s an ingrained way the terrestrial people think—that there is this change in time both in terms of physical and biological processes. They think about this at the small scale and what they also recognize is that this has implications at the large scale. At this small scale, one can argue that the range of variability that we’re dealing with is great. This is some work from Tom Spies and Mike Wim-berly in Corvallis where they are looking at a certain perspective. Imagine being suspended above a stand for 500 years or 3000 years in this case, and what you would see is everything from no old growth trees to 100 percent old growth. So at small scales there’s a really large level of variation going on here.
Now if you take that up to the landscape scale, you end up having quite a different perspective on the world, because you know all parts of the landscape aren’t going to be experiencing the same successional trajectories as the others. Again, there’s going to be quite a bit of variation. You have these patches and if I could have set the movie up you’d have seen how the patches moved around this landscape over time. The idea is that as you move up in scale, you adjust your
expectations in terms of what you would expect to see. So if you are looking at the large scale, you wouldn’t expect that landscape would be all old growth at some point in time, or no old growth.
In the Oregon Coast Range, Spies and Wimberly estimated that the amount of old-growth ranged from 30–60 percent of that landscape. So the range of varia-tion, the amount of variation you saw, is dependent on the scale at which you looked at. If you think about where we are in terms of how we’ve approached the problem of scale from an aquatic perspective, we’ve been very comfortable at a relatively small scale. We talked about the reach and maybe we started to talk about watersheds. And we focus on the responses of individual organisms and then maybe the population. And yet we haven’t recognized what that means-there seems to have been, again, the assumption that when we talk about streams and the variation, we assume that there is some idealized set of conditions out there that exist. This is illustrated in the concept of ‘Properly Functioning Condition’, and the Rosgen classifica-tion. This is the way we’ve tended to view streams at relatively small scale.
One of the things that happens when we start to deal with ESA issues is that we’ve been forced to start thinking bigger. We’re talking about these major evo-lutionary groups, the ESUs and so on. We’ve started thinking at a much larger spatial scale. And yet what I would argue we’ve done is we’ve brought that small scale thinking up into that large scale – we haven’t adjusted for the difference in scale.
Gordon H. Reeves, US Forest Service, PNW Research Station
In light of current scientific understanding, what is the degree of both confidence and uncertainty for each of these
working hypotheses and assumptions?
Considerations of Spatial and Temporal Scales
74
GENERAL TECHNICAL REPORT PNW-GTR-830
I would argue that this is how we view the landscape: we view the landscape as expecting some idealized set of conditions all of the time, everywhere. People say ‘no, no, we don’t do that’; I would say, ‘OK, what’s the way we talk about salmon?’ ‘In the good old days, there were so many salmon you could have walked across creeks on their backs. Everybody talks about a creek that would have had salmon everywhere. Think about what happened-we’ve come up with a set of stream metrics: three pieces of wood, four pools, and so on and so forth. And, we do a stream survey, and we come back and say that a particular stream or stream reach is not in good shape because it doesn’t have this set of conditions in it. I would say either consciously or unconsciously we have this expectation that everything should be in some idealized set of conditions everywhere at some point in time.
I think this has led to what I call the illusion of failure, because we have an unrealistic set of expecta-tions because we haven’t recognized the fact that each level of organization has its own set of expectations in terms of variation. You can’t take what we know at the small scale and apply those assumptions to the large scale. It doesn’t work that way.
Now our terrestrial counterparts have been very good at this, but I would say that we’ve really missed the boat here, particularly if we are moving into considering aquatic ecosystems as dynamic Again, I’ll come back to this point, one of the main reasons I think this happens is the concept of “time” is missing here. Of all the paradigms that we have relative to stream systems, none include time. Again, Rosgen is absent time. We go out there and find a C channel, and you look in Rosgen, in a C1 channel you should have this sinuosity you should have this X and you should have this Y. If you don’t have it you assume it’s not healthy, or we have to do something about it. The River Continuum even with all good points (as much as I
love Ken) does not consider time. It doesn’t talk about variation and I think these types of things have led us to erroneously make some assumption about what we expect at different spatial scales.
Now I want to talk about levels of organization. Let’s start at the small scale at the range of an indi-vidual. We say we want to have healthy streams and I would say ‘healthy streams mean we’ve got to have some idealized set of conditions’, well let’s think about a healthy individual which is a parallel idea. A healthy individual gets sick periodically. It doesn’t have ideal temperature and so on and so forth. But we know that you can be healthy, but you may not be healthy all the time. You’re going to go through periods of feeling well and not well, but you can recover. So that’s the idea here – we need to be thinking what is the range of conditions that the streams are going to experience at these small scales and can they begin to recover. If we go out and look at it-one of the interesting things is we go out to streams and we can see the history of variation. This is an example from Eastern Oregon. You looked in the banks and you see the history of fire, with charcoal and the coarse gravels and so on and so forth. We know that this particular stream has experienced a range of conditions but it went to a set of conditions. There is an example from Coastal Oregon which is analogous with some of the things that Bob was talking about. I’m going to tell you right up front, this is a leap of faith, the idea here is to show the range of conditions. Lee and I spent the best part of three to four years looking for places where we could go out and find streams that were at different points in time from disturbance. We found three streams that illus-trate that point. These were all within a stone’s throw of each other. If you were on the ridge between these streams, you could look down into each one of these. Here’s one in the Oregon Coast we guessed is about 80 or so years out from a major disturbance event. Look
75
Riparian Adaptive Mangement Symposium: A Conversation between Scientists and Managers
at this channel, completely inundated with sediment-two-four meters of sediment. Very little wood showing in this system. Water is subsurface during the summer-if I was looking for a ‘reference condition’ I’m not sure that this would be what we would point to. The boul-ders are buried. There are a few coho in this system and that is it. Literally, right next door is this system that looked like it burned roughly 140–160 years ago…those were interesting numbers that George was coming up with here. This, I would say, is the most productive stream that we saw in terms of diversity of fishes: it had cutthroat, coho and steelhead in it. There is a fair amount of wood in it and it had a range of substrates in it. Much of the wood was the legacy, disturbed from this big fire that happened. Often times those things are buried in here and they become excavated. Interestingly, if you compare this stream to the properly function condition numbers, it didn’t even come close-it was way off. But I would put this up against any “good” stream in terms of its production. Finally, we went over to old growth systems, a system that hadn’t had a major fire or disturbance for probably 250-300 years. There were tremendous amounts of wood in it and some boulders, but not much else. So if you ask: what is the reference condition for streams in the Oregon Coast Range, take your pick. I would argue that at the small scale, there is no reference condition-there are different conditions.
Think about it: this is analogous to a person who experiences a range of conditions always thinking that a healthy one has the potential to recover. We need to be thinking differently when we establish these things and what we expect. This goes into what we expect buffers to do – there are major implications here.
We move up to the watershed scale – again, we tend to drag along these small scale expectations and we assume that because we know something at the
small scale, we can apply it to the next level of orga-nization. We know if we have a group of people- that group can be healthy but everybody in the group does not need to be healthy at the same time. In some ideal-ized set of conditions, what we would expect is that the group as a whole is healthy but any individual could experience an unhealthy condition. You see some frequency distribution going on there.
When we get to the large scale, I would contend that what we’ve done is assumed an idealized set of conditions here that applies at the small scale and then apply it even at the large scale., What we would expect in a healthy population, again, is not every individual is going to be healthy, but the population as a whole can be healthy, even though each individual is not.
One of the things we need to keep in mind as we move across these levels of organization and we articu-late what we expect-you can’t start at the bottom and automatically drag those set of assumptions and expec-tations up as you move. In fact, I would argue that the landscape that we’re looking at and trying to manage is similar to patches of upland conditions we saw with our terrestrial counterparts-a landscape that was much more heterogeneous than we expect, historically for fish. We’ve done back-of-the-envelope calculation as part of the CLAMS project where we used what we assumed were the best set of conditions at 140 year old type of forest as the best indicator-we estimated what fraction of the Oregon Coast Range area probably had productive fish habitat at any point in time. By our best calculations it was probably somewhere between 30–60 percent of that landscape at any point in time historically – what we would consider to be ‘in good condition’. It wasn’t 100 percent and so people say ‘we never expect 100 percent’ and I say ‘nonsense’-we are trying to make everything good, at least that seems to be a goal of many of our policies. We can’t accept the fact that during some time periods or at any given
76
GENERAL TECHNICAL REPORT PNW-GTR-830
point in time, some fraction of our landscape is not going to be productive for fish. That’s a hard thing for policy makers to accept, it’s a hard thing for the public to accept in many cases.
One of the things we need to be thinking about, particularly as we move into this new deliberation about policy, is how we express our expectation. The first thing we have to do is start talking about distribu-tions of conditions and how we expect those distribu-tions to change over time. We are not shooting for something to be ideal at some point in time when we would declare victory. In other words, there is going to be a range of conditions out there on the landscape. The key will be, as the ones that are currently in good condition transition to poor, are there ones that are in poor condition that can transition to good? We need to be rethinking about how we apply these concepts and policies.
What are some of the barriers here? I think in the aquatic community of scientists and probably in the general public as they might consider aquatic issues, there is a general lack of recognition of the organiza-tion of hierarchy. We don’t understand that as you move through these different levels of organization that each has its own set of rules and expectations. That has never been fully articulated.
Many of our paradigms have this static perspective to it and that really shapes our perceptions and expec-tations. Then we look at current policies and laws: the Clean Water Act-it was a laudable goal to say we want everything fishable and swimmable, but I would venture to guess if the EPA was around 400 years ago, some tribes would be getting 303D listings.
Cumulative effects; one of the problems is that we think at these small scales. Under the guise of quote ‘protecting things’, we think we know how far we can go, just to the edge, and that if we just back off everything will be OK. Again, that’s this whole idea
of trying to maintain everything in good condition. We’ve got some real issues there.
It’s easy to say why we have problems in a large scale system, but then we come to apply solutions to mixed ownership patterns. That’s going to be some-thing we’ll have to wrestle with and ask ourselves how we begin to deal with that.
A quick summary-what I’ve done is assume that ecosystems are complex and dynamic in space and time and I think the timeframe is something we really need to start to consider. When we start talking about what we mean, there is very little consideration of time and how things change through time. It’s a very natural thing for terrestrial people to think about, but it’s not intuitive right now for the aquatic side. Each level of organization has its own set of rules and we need to recognize that. We need to start to describe and identify the range of variation for each level of organization. It’s interesting how you toss around these terms – historic range of variation – natural range of variation – and assume we can talk about it like it just means one thing. One of the reasons I think we have problems, is because everybody has their own way of looking at those things. We very seldom consciously articulate what we mean. It’s really imperative upon people when we start tossing around these terms; that we talk about specific levels of organization and how historic range of variation applies to it.
It’s going to be real crucial for us to talk about how we establish these desired results for each level of organization. I would say for higher levels we’d start talking about distributions. What are the distributions of conditions we want to see out there? What level is really what we are shooting for? I’d argue right now that one of the problems we have is there is an expecta-tion that when we recover fish everything is going to be good-we are going to make every watershed have three pieces of wood and four boulders and whatever
77
Riparian Adaptive Mangement Symposium: A Conversation between Scientists and Managers
else it has. That never happens-it never happened his-torically, and we’re never going to make it happen now. I call that the illusion of failure. The goalpost is so far out there that we feel like we’re never making progress towards it. If the goal post was at 30 or 60 percent, if we start making some small gains, we look like we’re moving. If it’s 100 percent-we feel like we’re spinning our wheels and not making it anywhere.
I think it’s really going to be incumbent upon us—the science community and for policy maker—to recognize that what we need to be thinking about is establishing realistic goals and expectation for each level of organization so we can start making progress. Otherwise, I think what’s going to happen is that we will feel like we’re failing, society will feel like we’re failing and at some point people will start giving up.
Questions and AnswersQ: Going back to the slide where you show what percentage of the watershed that is productive
A: This is just to illustrate the point; it doesn’t have the exact 30 to 60 percent.
Q: Typically we’d expect to find a mixture like that?
A: Right.
Q: I wonder what it was like before the decades to a century of ‘bad logging’ / bad forestry. It seems like a lot more of these were in poor condition and some of them have been healed and some are still in the process. That is one of the things that bothers me-the elephant in the room- that legacy of bad forestry. There were some bad choices made for quite a number of years/decades. That stuff will heal over time, maybe not like it was before, but heal to a reasonable condi-tion perhaps. But where are we in that process?
A: I’m going to guess we’re not as low as 30 percent, but I bet you we are a lot closer to 30 percent than we are to 100 percent.
Q: Was this just to show an example, or did you actu-ally do some calculations?
A: What we did, we took this, and said ‘this seemed to be the time frame in which to work’. We assumed that watersheds are predominately in 120–160 year old vegetation pattern; based on what we learned in the CLAM effort. We projected historical conditions. We took snapshots of this through time and took a long term average. We ran these models; these are more stochastic than deterministic so you get some range. We were looking at the percent of healthy conditions as we defined them on the landscape. If you run this long enough and believe the output it would say: 95 percent of the time those conditions would be somewhere between 30–60 percent of the landscape. We assume fire and a legacy from fire was present. We took that number, and as part of the Technical Recovery Team for the Oregon coast Coho, we wanted to estimate historical numbers for the whole coast. Before this, we had historical numbers for given river systems, because they were using cannery records for each river system. We made some assumptions using intrinsic potential and projected historic numbers on the Oregon Coast range for coho. We assumed that 60 percent of the landscape at any point in time produced Coho, not the whole. There were at 95 to 96 percent correlations between the numbers that were projected by the cannery records and what we got. So we felt pretty good about the numbers but it really suggested maybe we were on to something in terms of how we were thinking.
Q: When you look at the wind driven environment on the west side of the Peninsula-various factors come in to play-you start to see that a rotation age is about 110–120 years. I’m with you on the idea of using this as a way of setting expectations for what would be occurring over the landscape. I could see same strate-gies set up to deal with this. How would you take that
78
GENERAL TECHNICAL REPORT PNW-GTR-830
information, take this dynamic, and develop strategies for managing your landbase: either to manage your risk or take advantage of it for habitat?
A: One of the major things we have to do here is to shift our expectations for quote ‘buffers’. If you are moving toward a dynamic perspective like this, the buffers are not there to protect existing conditions. The buffers are there to protect an important ecologi-cal process which is that when these big events come through and things fall apart, you have the building blocks to re-establish the desired conditions. The 140 years does not represent what you want to keep. It’s not important what’s there now. It was what was left over from that previous disturbance event and the legacy of those 140 year old stands and how much time it took for that system to work with it. It could have started at 80 years, it could have started at 70 years, there is probably some window in there-but the idea is that you’ve got those pieces in place, so that when those big disturbance events happen, the potential to recover is there. Going back to this slide: a healthy person may not have ideal conditions all the time, but he has the potential to recover. When we get hit by these big disturbance events (they set the stage for long term influences) do we have the legacy that’s left over from that event and sufficient time to allow the expression of those conditions? We identify where you are most likely to see those influences and then we see that the staggered versus fragmented type of setting is really worth a re-visit. Under the dynamic perspective, we may be better off focusing activities in some place, then leave that system alone for awhile, expect that it’s going to get hit by a big event and that it has the potential to recover.
Q: Gordon Grant did a paper on that a few years back in the Water Resource Journal. He looked over several centuries of that staggered disturbance. It was very interesting.
A: Right. Gordon Grant did an analysis of looking at peak flows in those settings and found that you got the same peak flow at the bottom of those four watersheds if you did the staggered or the fragmented type of set-ting. Ecologically there may be different options then distributing the impact across the landscape as we’ve been doing.
Q: What do you do with that information? If that’s driven by a stochastic fire model, if your model is sensitive to topography (which it can be based on empirical data) and you run those models, you wind up with different probability distributions of forest age as a function of topographic position. So if you are inter-ested in the headwaters, in Southwest Washington, the predictions say, for example, that for 25–30 percent of the headwater streams the vegetation age class is less than 60 years old. And as you go down into the larger valley floors, big and wide , then it becomes 5 percent because fires don’t like to come into those wet areas according to the empirical vegetation data that went into the models. If you were trying to target a natural disturbance pattern, you would have a mix of forest age classes and you could pattern your management after that.
A: Some of this stuff sounds pretty academic. We’ve actually backed away from the Probability Distribu-tion approach. Because it seems like it’s a hard thing to get across and to manage for in some regards., We are working on a paper (Gordie, Ken and myself and a couple of other people) and we are realizing that these things that Gordie is talking about have real world implications for TMDL, properly functioning condi-tions and any kind of single value central tendency tar-gets in streams-sediment, temperature, turbidity-these are all standard across many federal and state agencies. They are all problematic because none of them respond to this problem. And if they did and they ran these models, you would find out that this notion of TMDLs
79
Riparian Adaptive Mangement Symposium: A Conversation between Scientists and Managers
and calculating the average for a 40 year period of sediment and then projecting that forward for the next 40 years and you try to regulate the load from various land uses—this is completely indefensible. And the same thing with properly functioning conditions. And so it has real world impacts-what was not discussed in this group is the whole environmental regulatory framework built around this; that is a house of cards. We are talking about making interesting changes on the riparian prescriptions-at the same time if that were to move forward-the house of cards (regulatory framework) would have to come down. And when it does, it’s going to be a totally different paradigm on how you evaluate environmental conditions and it may be highly quantitative because some of us say, that’s a very complicated model and it depends on how you tweak the dial, which is very true. So you might go into a more qualitative understanding of landscapes and back off from the hard core analytical approach. That is just the reality of it, even though it might be unsatisfying for people who are highly quantitative and want a single number.
Q: How then do we deal with TMDLs and PFC?
A: TMDLs are a single number, as are PFCs. In the paper we document many cases where that is so. What happens is that agencies come to the roadblock and they realize the insanity of it all, that they can’t do it (the TMDL is 100 tons and here’s the waste allocation load-it’s 30 tons). We all know it’s a house of cards. Someone might say, “Kate, write up a narrative and fix some roads” That’s not good enough; it allows disin-formation to permeate the public, the environmental community and everybody else. It is not good enough to say, “do this at this accuracy level, or I’ll hit you in the head with this hammer”. The house of cards has to come down, and it will come down to where Kate said; back to a qualitative BMP with some analysis.
Q: Thinking about the condition of the watershed as a distribution: can you get there with existing models (actually get at what those distributions should be) or is it too complex to try to go there yet?
A: We are at the stage where we can make some stab at where they were historically, but the question is ‘can we get back to those’ and I think we are not going to go back to historic conditions.
Q: The question is not ‘can you get back to those’; the world changes, climate is changing, but can you get a realistic picture of what those distributions will be? Do you think we are anywhere near the capacity to begin to do that (with physical models)?
A: I think we can make a first approximation. The key is to understand how you transition from one state to the other; what does it take for that to happen. And then trying to say, under the current management disturbance regime (which is timber harvest) is there the potential for those systems to evolve through time. That becomes the question I ask about these things.Even if it’s not highly accurate, it’s still better than if that map was painted all dark green, or if all the streams in it were painted yellow.
Q: Looking at the 30–60 percent, have you guys ever gone back and looked realistically, given land use and ownership…we’ve got areas that are never going to recover. You’ve got a whole percentage of watersheds probably off the board to start with. If you look realistically at the ability to get back to a percentage of good watersheds, where does the onus lie for recover-ing those watershed conditions? Have we had realistic opportunities?
A: CLAMS was shut down because an agency didn’t like the results and so we literally have been shut off and have not been able to do that, but given the CLAMS projections and some other things, we could easily do that and that is an important next step.
80
GENERAL TECHNICAL REPORT PNW-GTR-830
Q: Are you saying that the goal of riparian manage-ment and buffers (rather than mitigating short term negative effects) should be setting up a system so that over the long term, when extreme events occur, you can realize the positive effects of them?
A: Yes, that’s a very good way of putting it.
Q: I would like to rise to the defense of the river continuum concept. I think it’s an important perspec-tive that we haven’t heard yet today. People forget that even though the architects of the river continuum concept would agree that disturbance ecology had not been fully developed as a science at that time, the fundamental idea that aquatic communities are (at least in part) structured on the transport of materials from upstream to downstream is valid. That’s still a core concept that’s important. We forget, quite often, that the transport of materials downstream has a profound effect on the estuary, the beaches and the ocean. We haven’t, for a decade, asked ourselves the question: ‘how are our land management activities affecting the fundamental ecology of our estuaries, beaches and oceans?’ You go back to a piece that Jim did that I think was a real contribution-that points out how important large wood is to the ocean.
A: I think the continuum is great-Ken and I have had these discussions. The problem is the way it’s been applied isn’t quite the way it was intended. I’m not trying to negate it here.
Q: That whole perspective (the continuum) has fallen off the radar.
A: I appreciate that; you are absolutely right. If you look at the landslide delivery issue, there’s a point in Knowles Creek, even if you had a landslide it was going to come down and most likely it was going to be transported downstream to the ocean-we called it the Jim Donation Zone. When big wood came in, that was the wood that was going to get to the beaches.
Q: Passing by the continuum, would you call that resilience? Would you subscribe to that term?
A: That would be my vision of aquatic resilience.
Q: I think what was said earlier is that your view is fundamentally not a Clean Water Act concept. That’s the issue. Kate’s point about who gets to be the light green is important because the Clean Water Act con-cept is based on justice fundamentally, that’s good for everybody because it controls risk for everybody. And that’s the paradigm that you’re talking about changing.
A: It was interesting what people said about maybe learning something from the terrestrial folks. That’s really the key and it’s sort of scary to think that maybe the ESA is a more acceptable legal policy paradigm than the Clean Water Act, but it takes away that safe bargain that the linear protection has provided for the last 30–40 years. To me that’s what we’ll talk about more tomorrow.
Q: A few weeks back, I looked at a paper from 2004 that Ray Hilbom and his colleagues put together with the Bristol Bay salmon fishery and, not being a fishery biologist, the main message that I think he’s getting across is: we have this landscape that changes on its own, we are not managing it at all, but nevertheless at any given time you have a life history strategy, a run of fish that can go in and capitalize on those conditions. And, again, not knowing what other fishery biologists thought about that concept in general, what do we do when we get down to an area like Oregon where we know we’ve lost these lineages in the past? You’ve got this mosaic of conditions that are occurring, but we know in the background that we’ve extinctions of life history strategies that might be capitalizing on some of those changes. Could that be one of the reasons we’re making modifications and we are not seeing any change in the salmon populations-that there is nothing we are going to do at this point, because the fish do not
81
Riparian Adaptive Mangement Symposium: A Conversation between Scientists and Managers
exist anymore to capitalize on what we are doing as far as management to improve their population?
A: What he is referring to in Ray Hillborn’s paper which talked about biocomplexity. Looking at Bristol Bay, there are four or five sub basins in which he found that sockeye populations waxed and waned. The total numbers remained fairly stable, but if you look at any one part of the landscape, it bounced around quite a bit and there were different life histories associated with different parts of the system. My feeling is that if we give these guys (salmon) half a chance-they’re going to be back. They are incredibly resilient fish. Look at their genetics-they’ve got an extra set of genes, they’re triploids for a reason. That allows for incred-ible adaptability. I remember at Knowles creek, as an example, they cut the fishery off one year back in the 80s. It turned out that, instead of a spawning window two weeks wide, we had fish coming back literally for three to four months. It changed the whole pattern of smolt output and everything else. I think if we set up a broader range of conditions on the landscape for these fish to exploit and use, my guess (and it is a guess) is that we would see a response quite quickly in terms of the life history variation coming back into these sys-tems. Have we really looked at that? We haven’t really looked at life history variation in terms of how man-agement affects it. We are still hung up on numbers: we want more smolts and we want more adults. One of the measures we should be looking at is more diversity in terms of life history and going out and looking at that in the landscape. I think it’s an important part of it but it hasn’t really entered in to the picture very well.
Q: Several times today, you’ve used the concept of these ecologically functional units. If you were presenting information, this is a terrestrial thing, life history literature, and you weren’t talking about the currency that works off of selection that’s causing adaptation and the way that’s working together, the
papers just wouldn’t be getting published. I have a hard time seeing how people can be using-an agency can be working off- ecological units of that level without looking at life history variations as one of their met-rics. It just seems fundamentally inconsistent to me.
A: You aren’t going to get an argument from me. One other point, if you look at the Technical Recovery Team report for the Oregon Coast, we identified source-sink populations. If you look at this, basically there are watersheds that always were the sources and others that were the sinks. Again, taking this approach of protecting and preserving everything everywhere, some places just never had the potential to be major fish producers and others did yet we haven’t gotten strategic in how we look at the landscape. We’re just marching forward, one size fits all at the riparian zone, one size fits all at the watershed, and one size fits all at the landscape. We are missing some real important variability that’s costing us both socially and economi-cally and it is probably costing us ecologically.
Q: I’d like to point out that we have looked at the Life History Variation as a very strong component that’s associated with topographic relief, with elevation, with stream size, with temperature-with all kinds of things. We’ve lost the capacity to produce some life history and to represent some life history because it’s urbanized (a point Bob made earlier). If we designate some places to be light green continually, we are going to lose life history diversity. So we do know quite a bit about variability, if you’re going to talk about the distribution of conditions, it’s not necessarily the whole place; you have to stratify that as well.
Q: These are great ideas and I like them a lot, but there is also the practicality of managing diverse ownerships, state systems, federal systems-so what I come away with so far is how to practically put this in practice because there is a lot of practicality especially
82
GENERAL TECHNICAL REPORT PNW-GTR-830
at the state level or local level and also within indi-vidual companies and that sort of thing. As a manager, shouldn’t I have the allowance to let the disturbance happen as it may—and everyone will forgive me when it happens? How else can we do it?
A: I am asking at what cost are we doing it now? We keep doing this and, think of it, every five years we come back and say ‘we need more’, we need a bigger buffer, look at the history of it. We started off with something less. Than we keep coming back to how big do we need to make the buffers…how many time can we come back to the well?
Q: That’s what I’m saying-it’s that or every time it fails – allow us to fail?
A: I agree-I’m pointing out at some time we call ‘Non-sense’ and say it’s time to call timeout, really go back to fundamentals and ask why are we in this predica-ment. I contend it’s not because of buffers – if we make the buffers 50 feet bigger, are we going to get out of it? I say no, we aren’t going to get out of it. We have to go back and go through a fundamental questioning of our core assumptions that we’ve made about these systems and how they operate. Is that the right paradigm we want to be entering into this-what do we need to do? To save time we say, ‘we know something now that we didn’t know 50 years ago-everybody cannot produce fish. Some people can and some people can’t. Now can we design policies that remedy that situation? Those are not science policies-those, to me, are social /politi-cal decisions. And then how do we get creative to do it: do we provide tax incentives, we’ve been looking (in Coastal Oregon) at high quality fish habitat and are asked to forego some x volume of timber. Why don’t we turn to the federal government whose doing thin-ning up there, and have it compensate the landowner with the volume of wood from the federal land? You can keep going back in 5 or 10 years and someone will
be asking for another 100 feet of buffer; I’m just saying look at the history, what have we gained? We haven’t, and why haven’t we? Maybe we are looking at the problem in the wrong way.
Q: The strongest implications to me, at this point, that I feel you could act on, is your end game goals and expectations. But it’s still difficult to know how to manage diverse ownerships and regulatory responsi-bilities against that mosaic.
A: I totally agree, but that’s the challenge. We have to surface that question and ask that question otherwise it gets buried and we march along not achieving success.
Q: I think we are making a mistake in thinking that we have to answer these questions in the near term. I hope my great grandchildren are here in the Pacific Northwest arguing about what the buffers should be, because that’ll mean we are still growing trees and we’ve still got salmon. We need to have some more policy flexibility so different owners can try some essentially, different working hypothesis on how to manage these riparian buffers and these landscape, so 20 years from now we can look back and say Weyerhaeuser did this and Port Blakely did this, DNR did this and Forest Service did this in these areas and here are the operational problems and here’s what the results have turned out to be. I think we need to look at a longer term in terms of figuring this out.
A: (Response from audience member) I think there is a sense of urgency because there are salmon populations that have a decade or two left and we have solutions that are going to take several decades. It would be lovely if we could figure out where those situations are so we could do something about it. We still think we are smart enough to fix things and not make it worse. But we do have a sense of urgency in that a lot of these populations are declining.
83
Riparian Adaptive Mangement Symposium: A Conversation between Scientists and Managers
Introductory CommentsThis morning we are going to have a panel of repre-sentatives of management and policy makers. We are going to be asking them how changing the underlying assumptions or working hypothesis have implications for management strategies and policy goals.
After that we are going to open the discussion for a second session for all participants-not just the speak-ers. We want input from all of you on this; that’s going to be the discussion: What Are Critical Assumptions in Terms of Both Scientific Uncertainty and Management and Policy Implications. On that topic, we want to get down to specifics.
I want to summarize what we covered yesterday. What I am going to try and do is simplify what I heard yesterday-please correct me if I haven’t done justice to what you said.
Brian started out by telling us that policymakers draw the lines that give managers the guidelines in terms of meeting society’s goals and expectations. It is scientists’ roles to tell them what the consequences are of drawing the lines, that is, among the alternatives what are the various consequences particularly in the environment and the case we are talking about here.
Gordie and George told us somewhat about the history of the development of riparian management. We looked at policies and the strategies; at least from what I was hearing, they both more or less agreed on some of the basic assumptions: the basic science that underlay those policies and management of actually all three: federal, state and private lands. To simplify what the assumptions were: basically that we need to maintain key watershed functions; that mature forests provide a model of what desirable riparian conditions are; and that we can approximate those mature forests
conditions with buffers or riparian management zones, but that these need to vary by site class, by stream size and by stream type. There are differences and nuances in the actual application of these three different kinds of land ownership classes within this state and that most of those are primarily reflecting of the political and practical realities of managing on those three dif-ferent types of land. They both recognize that dynamic or disturbance, whichever term you want to use, is an important factor in riparian areas. There is also an assumption that dynamic processes are vital in riparian areas.
In the afternoon we talked about what is the degree of confidence in those basic underlying assumptions. We talked about the physical processes-we starting right off by pointing out that FEMAT was based largely on averages (the FEMAT curves) but that we now have the capability of being more specific-we can ‘modify the FEMAT curves for different points in the landscape’. And if we are going to be more flexible in terms of managing, being able to modify the curves for different parts of the landscape is an important capability, because the details of those curves become more important the closer you manage to the edge of the stream. If we are going to have flexibility we need to understand what some of those details are. Lee also pointed out, but didn’t go into great depth, the fact that we now have the capability of simulating some of the extreme events, the disturbances that George was talk-ing about. That is what the dynamic map he showed up there indicated.
Bob Bilby talked about riparian processes; a lot of those have to do with the biological part of the system. He said we know quite a bit about several of the key riparian processes and talked about wood,
Douglas F. Ryan, US Forest Service PNW Research Station
Recap of Day One and Overview and Desired Outcomes for Day Two
84
GENERAL TECHNICAL REPORT PNW-GTR-830
temperature, shade and other things. But, he said, there are some others we don’t know so much about and he brought up the examples of wind and fine leaf litter. He also agreed with Lee that the average FEMAT curves don’t fit all sites; there actually are variations in them as you move around in the landscape. Bob also asked the ‘so what question’: So what if we are managing forests, if there are other changes in the landscape that are having much bigger effects on fish? He brought up the example of conversions to more intense type of land use in the most productive portion of the watershed; forest into either urban areas or types of agriculture areas and pointed out that they have much bigger consequences for the fish. From that, he suggested maybe we need to consider those kinds of land use changes; obviously they wouldn’t only have to do with forest practices. They’d have to be in other land use arenas. Another obvious part is those kind of things don’t really apply directly on federal or state lands: we are primarily talking about private land (although certainly what happens in adjoining private land does affect what occurs in riparian conditions on both federal and state lands).
A.J. Kroll told us about riparian habitats and populations, primarily talking about wildlife. He said that one of the big assumptions in FEMAT which was setting up riparian areas to protect fish was the assumption that buffers also protect a whole suite of wildlife species that are either dependent or associated with riparian areas. He said the story is still out on that-there have only been a few species and a couple of gilds, things like amphibians and birds, where it’s been tested and then in only relatively few places. In general, that particular assumption has not been very thoroughly tested. There could be reasons why we may want to test it; for example, if some of those other species were to become listed as threatened or endan-gered.
Gordon H. Reeves talked about the consideration of time and space. There’s kind of a two sided story here: he agreed with the other speakers that the basic assumptions have largely been supported by the science in the last fifteen years but that some parts of them have been significantly clarified over time. One of them is that it is probably mature forests that provide the most productive fish habitat as opposed to old growth. Another is that average conditions are not necessarily adequate to describe what’s going on at a lot of places in the landscape. He further went on to say that applying average conditions everywhere actually could limit the potential to restore fish habitat. He said that this is the result of an unspoken assumption which is that we can apply the results from small scale studies and management efforts, to all the watersheds and across large scales. The problem with that assumption is that it ignores the important role that time plays in the process of producing productive fish habitat. When you look around the landscape, you find the most productive fish habitat is often the product of extreme events that occurred sometime in the past-things like floods or fires or wind disturbance or landslides. By setting static goals (that is average conditions everywhere) current management and policy may be mitigating for short term negative effects but it is not setting up riparian systems that can capture the positive effects of those extreme events. It is not producing the resilient ecosystems that we’re seeking. Trying to capture the benefit from those kinds of events, would require different kinds of manage-ment goals. Gordie suggested things like looking at the distribution of riparian conditions across the landscape as a potential way of capturing that goal. It would also require flexibility in applying rules to managing ripar-ian areas; probably some changes in the policy guide-lines as well. Another thing Gordie pointed out was what Lee had brought up-we have tools for looking at,
85
Riparian Adaptive Mangement Symposium: A Conversation between Scientists and Managers
simulating, what the effects of these kinds of extreme events can have on the large scale (at the landscape level) so that there is the potential for generating hypotheses about how the landscape actually behaves in response to these kinds of extreme events. To me, those seem to be some of the new working hypotheses that were suggested yesterday. What I’d like the next panel to talk about is: in thinking about those working hypothesis, are there specific policies or management guidelines that may have to be re-thought. We really want to get into what are the specifics. How do those actually make us re-think what some specific policies are?
For the second discussion: Are there implications, in turn, for science? Are there areas where we need to clarify more what those underlying assumptions are so that we can apply them to either new policies or new management practices?
222
GENERAL TECHNICAL REPORT PNW-GTR-802
This page is intentionally left blank.
Panel Discussion If there is scientific consensus to revise underlying
assumptions or working hypotheses, would this revision have important consequences for management
strategies or policy goals?
222
GENERAL TECHNICAL REPORT PNW-GTR-802
This page is intentionally left blank.
89
Riparian Adaptive Mangement Symposium: A Conversation between Scientists and Managers
Introductory Comments to Panel DiscussionWe have five folks to talk to you on the receptivity of the management and policy environment to the scien-tific ideas, especially new scientific ideas. Each panel member will speak for 10–15 minutes, then I sug-gest we spend time allowing the panelists to ask one another questions and then we’ll close with audience questions. Bear in mind, we have the last two hours of the symposium strictly for your own discussion.
I want to return back to the idea: the name of this conference is Riparian Adaptive Management. I want to talk a little bit about adaptive management and say what it is. Adaptive Management is a management approach to uncertainty. There are other approaches. For example, another approach to uncertainty that we hear a lot about is the Precautionary Principle. It’s a much more conservative approach to uncertainty than Adaptive Management is. Adaptive Management says let’s go ahead and do stuff and learn about it as we go in a very deliberate way and build that learning into the decision making. The Precautionary Principle says that although the legal system is based on the idea of innocent until proven guilty, maybe that’s not neces-sarily the best way to run our science based decision making. If you think about guilt as the presence of a cause/effect relationship that’s important to a decision, the Precautionary Principle says maybe if the crime is serious enough and the alleged offender might go on repeating and the punishment is just, we might flirt with the idea of guilty even if not proven guilty. You have probably thought about the Precautionary Principle, and have ideas about it; I know I have. There are other approaches to uncertainty. ‘Let’s go out and do what we decide to do and do some perfunctory monitoring if we can afford it and depending on who
retires maybe we’ll learn something or maybe we won’t, but we won’t worry too much about it’ that’s one approach to uncertainty. A very structured approach to risk assessment is another approach to uncertainty. You know this. Adaptive management is just one approach to uncertainty and it’s based on the idea that we can employ science to reach relevant conclusions; A.J. posed a question ‘Can we ask relevant questions?’. That’s one of the key points of Adaptive Management. Good science alone may not be sufficient for Adaptive Management-the results have to be fairly conclusive with regard to critical management question. That’s not a foregone conclusion. Then we have to have decision making institutions that are listening and are willing to change the decision based on conclusive science. The literature on Adaptive Management says that it is talked about a lot, but it’s hardly ever done-at least in any kind of complete or large scale way. I think about that a lot-some of you have been at this your whole careers and I heard an evolution of management response to science over the last 35 years that sounded fairly adaptive over that kind of professional career time scale, but nevertheless, the literature suggests that it doesn’t really happen. It doesn’t really happen because of failure in one or the other or both of those key features: either we can’t do science that is con-clusive in any kind of time scale or spatial scale that’s relevant to decision makers, or the decision makers really don’t care-it doesn’t matter what science tells them. Scientists usually have a pretty jaundiced view of why that’s the case. My view of why that is the case is that there is an awful lot of sunk investment into big management and policy decisions. There is a lot of investment-sunk cost. Most senior bureaucrats and elected decision makers that I know are not really in the business of being associated with failures.
Craig Partridge, Washington State Department of Natural Resources
Introductory Comments to Panel Discussion
90
GENERAL TECHNICAL REPORT PNW-GTR-830
They don’t really value even fascinating, instructive failure, the same way science institutions might value it. Also, usually a lot of money has been invested in policy decisions. There is kind of an ingrained lack of receptivity; that’s more the default setting-a lack of receptivity to science that may offer really interesting new ideas about decisions around which a lot of sweat and tears and letter writing and voting went into.
I think if you turn back to science, you’ll see there are some of the same constraints on science seeking to reach policy relevant conclusive decisions. What kind of science are we talking about? These are the ques-tions I’ll be posing to the panelists as well. I heard a lot about longitudinal large scale studies yesterday, and careers and budgets in the science realm sometimes mitigate against those kinds of studies.
These are the questions for the first half of the morning: What does it take to have a scientifically conclusive study? What can our on-the-ground science
institutions like the Olympic Experimental State Forest or the Forest Service Adaptive Management Areas or CEMR; what can they do to help? Are adaptive institutions really open to change based on science? You probably have opinions as to whether they are or they aren’t. I’m going to ask us all to think about—if they aren’t—is there anything we can do to open them up to be more adaptive? If they are, if that career scale adaptation I might have heard a thread of yesterday is actually occurring, what did it take to make them adaptive? What makes a conclusive study; what makes an adaptive decision making organization – against a setting in which neither of those things happen very often and we don’t really have adaptive management going on very often—adapt?
The speakers are going to take a first run from their perspective and then we’ll open it up and have more discussion.
91
Riparian Adaptive Mangement Symposium: A Conversation between Scientists and Managers
AbstractPolicy is formed through a process that includes sci-ence, social behaviors and values, religion and morals, education and acceptance of new ideas and technolo-gies, resources and economic conditions, costs and benefits, health and safety, environmental effects, and the efforts of leaders to bring about changes in policy and implementation. In Washington State riparian management policies are formed in the context of the Forest and Fish Agreement which is science-based but also includes numerous public policy goals. Policy-makers and scientists need to start by asking the right questions if science is to appropriately inform policy. Science must examine both the direct relationships and the larger scale system-wide relationships in water-sheds. The political realities facing private forest land-owners include both the need to maintain our social license and to operate within the legal framework of the Forest Practices Act, HCP, and Clean Water Act. Revisions to management policies and goals have to be made within those contexts.
PresentationScience informs policy, but does not dictate policy. I know that may sound sacrilegious to some of you, and please understand that I deeply respect the scientific process, discipline, and benefits that science continu-ally brings to society. But policy is formed through a process that includes science, social behaviors and values, religion and morals, education and acceptance of new ideas and technologies, resources and economic
conditions, costs and benefits, health and safety, envi-ronmental effects, and the efforts of leaders to bring about changes in policy and implementation.
So, in answer to the question at hand, “If there is scientific consensus to revise underlying assump-tions or working hypotheses, would this revision have important consequences for management strategies or policy goals?” The answer is yes, but only as part of a complex policy-making and adopting process.
Now let me focus in on riparian management policies resulting from a new scientific consensus, particularly from the perspective of a private indus-trial forest land owner. In Washington State riparian management policies are formed, regulated and implemented through the Forest Practices Act. I’m sure you are all aware of the Forest and Fish Agreement, Habitat Conservation Plan, adaptive management process, Cooperative Monitoring, Evaluation and Research (CMER) that are components of the forest practices policy and regulatory system. Treaty rights are also significant policy drivers. I don’t intend to give you a description of that system or discuss the pros and cons. But, the realities of state law mean that forest policy, and particularly riparian management policy formation, regulation and implementation happen within that context. The Forest and Fish Agreement is science-based; at least 30 percent is based on biological and physical science, with the remainder being politi-cal science. The federal Endangered Species Act and Clean Water Act are dominant aspects of these policies and rules.
Norm Schaaf, Merrill & Ring Company
If there is scientific consensus to revise underlying assumptions or working hypotheses, would this revision have important consequences for management strategies or policy goals?
Private Lands Perspective
92
GENERAL TECHNICAL REPORT PNW-GTR-830
Policy-makers and scientists need to start by asking the right questions if science is to appropriately inform policy. Natural systems are complex over time and space and do not easily conform to strict scientific rigor at the large scales in which these systems exist. We tend to think in terms that are absolute, black or white, and expect instant gratification from our deci-sions and actions. Our inability or perhaps just a lack of patience to examine natural systems at the neces-sary large scales and time horizons focuses research efforts on distinct individual parameters. This focus is not wrong in and of itself, but if we only focus on the short range we risk missing the big picture that is inherent in natural systems.
The short range focus has limited necessary moni-toring of the effectiveness and validation of many of the assumptions we have made about riparian systems. Let’s look at some of those assumptions and the associ-ated regulations in the forest practices rules:
• Fish need cool water, so the rules require shade over streams.
• Streams need large wood for complexity, so we provide buffers intended to grow into a desired future condition.
• Sediment is bad for fish, so unstable slopes require special protection.
Now if we step back and examine those assump-tions and the rules that are in place to achieve those goals, we can find potential conflicts in systems, not to mention larger societal issues. What are some of these conflicts?
• Many of the insects that fish eat are more abundant in streams that have more light and algae growth.
• Large streams (in my experience wider than about 20’) seldom have large woody debris forming pools, because the stream energy flushes the wood to the sides or downstream.
• Fish spawn in gravel, which in many streams has been flushed downstream, and landslides are a significant, if not dominant source of gravel and wood.
For science to appropriately inform riparian management policy it must examine both the direct relationships and the larger scale system-wide relation-ships in watersheds. The short range focus leads to conflicting conclusions and recommendations that arise from dueling scientists. It is like the story of the blind men describing an elephant: they were all accurate in their descriptions, but at the same time all wrong because each only told part of the story. Peer reviews of scientific research may help to ensure that scientific findings are viewed within the larger context.
Policy changes in our democratic society and government are generally slow and incremental as opposed to significant paradigm shifts. The rate of change may be even slower in forest and riparian management policies because of the inherently slow changes in these natural systems. Science can more effectively inform and influence policy in an adaptive management context. This is not to say that research should not challenge old beliefs and hypotheses. In fact, in our prescriptive and highly regulated manage-ment environment adaptive management research may be the only acceptable and allowable venue for chal-lenging assumptions and taking risks. Researchers can benefit from the experience and anecdotal information of field foresters, biologists and hydrologists. As a group we have a long history and experience base, have tried lots of different ideas, some of which have failed and some of which have succeeded, and have observed the forests and streams we work in change over time and through various practices.
Assuming, then, that there is scientific consensus to revise underlying assumptions or working hypoth-eses, how would these revisions influence management
93
Riparian Adaptive Mangement Symposium: A Conversation between Scientists and Managers
strategies or policy goals? Here we move from the relatively clean and sterile science environment to the sausage factory floor of policy development and implementation. Speaking still from the private forest landowner perspective we start by asking several ques-tions. First, do we believe, trust and accept the science? We’re of course more likely to believe and accept if the science supports our way of doing business. But even where that is not the case if the science has met the conditions that I have just discussed, that is asking the appropriate questions, examining the larger context as well as the more distinct, direct relationships, looking at incremental adaptive changes but also willingly taking some risks, management strategies and policies can be influenced by science. Policy makers need both information and the educated opinions of scientists, but it is also important to understand which is which.
The second question we ask, assuming we accept the science, is “how would revisions to policy and practices affect our business?” Will the changes reduce or add to costs? Will the changes make more or less timber available for harvest? How will changes affect our competitiveness in a local, regional and global marketplace? The most recent policy and regulatory changes contained within the Forest and Fish Agree-ment have been very costly in terms of both lost timber resource and operating costs. In western Washington the average industrial forest landowner sacrificed 10–15 percent of its potentially available timber to comply with riparian and slope protection rules. Road maintenance activities required by the Road Main-tenance and Abandonment Plans are costing around $100 per acre across all lands. Many other operating costs have increased because of the complexity of the regulatory system and on-site implementation require-ments. Any proposed revisions to policies or practices that increase complexity and cost or further reduce the availability of timber will receive strong resistance.
On the other side of that coin, proposed revisions that reduce costs or add to timber availability will be widely supported by landowners. Proposed policy and rule revisions must consider regional competitiveness. Riparian management strategies can’t succeed unless the entire riparian environment and fisheries manage-ment are included. Changes should reflect equity with other land uses and industries that affect ripar-ian conditions and fisheries. As a society we should conduct cost/benefit analyses of proposed activities to make sure we are appropriately and effectively utiliz-ing scarce resources.
The political realities facing private forest land-owners include both the need to maintain our social license and to operate within the legal framework of the Forest Practices Act, HCP, and Clean Water Act. Revisions to management policies and goals have to be made within those contexts. The obligations and expectations for private land are not the same as for public lands, particularly within the Endangered Species Act. We have a legal requirement to avoid “take”, but primary responsibility for recovery of species belongs within federal land management and permitting processes. Private lands are very diverse in ownership structure and goals, size of tracts, and don’t easily conform to broad landscape or watershed level management strategies. This doesn’t mean we shouldn’t seek to implement new science, but will have to determine how implementation can occur within the diversity of owners. The adaptive manage-ment framework of the Forest and Fish Agreement provides for rule changes to be made based on new peer-reviewed science. This is not limited to CMER, but can come from any source. But again, science alone is insufficient to require rule changes. The agreement and the Forest Practices Act also state that policy and rule changes must consider the impact of those changes on the forest products industry, so there
94
GENERAL TECHNICAL REPORT PNW-GTR-830
is a sort of balance that occurs. The balance point may shift depending on the political leanings of Olympia and Washington, D.C., regional and national economic conditions, public opinion and probably on the strength and conviction of the science that is informing policy makers. This social license ultimately determines how new science will be implemented on private lands.
95
Riparian Adaptive Mangement Symposium: A Conversation between Scientists and Managers
AbstractWashington’s Department of Natural Resources (DNR) produces income for a number of state trust benefi-ciaries (mostly the public schools and universities, and Westside counties). They are represented by the Board of Natural Resources, which establishes policy to guide the activities of the department regarding land management.
Two major policy documents define the depart-ment’s management objectives: the 2006 Policy for Sustainable Forests and the 1997 Habitat Conservation Plan. The board’s guidance and direction attempts to find a balance between competing interests: habitat conservation, public access, and income-generation for the trust beneficiaries. Tradeoff analysis is a critical step in finding this balance, and must be explicit to ensure that costs and benefits are understood. There is an ‘opportunity cost’ for each new initiative selected, as it may consume the resources needed for another, possibly more beneficial strategy. Criteria must be developed to establish priorities for research, adap-tive management and conservation initiatives. Those criteria include the potential magnitude of the benefits, public acceptability, and organizational capacity.
Several speakers have noted that ‘one size fits all’ stream buffer targets may not be the best approach to stream protection. Fixed standards that incorporate, for example, a single target such as age, trees per acre, or a standard buffer width may result in sub-optimization of resource allocation. Furthermore, standards designed to be applied at the reach scale may
not fully consider processes and responses that occur at the watershed scale. An example of a more flexible approach in another arena is the Old Growth habitat index, which incorporates a weighted index to identify old growth stand conditions at multiple scales (Van Pelt, R. 2007). In addressing the concerns posed by our speakers, much of our discussion has focused on more comprehensive, landscape approaches. Symposium scientists have noted that increased modeling capac-ity and more robust resource information than was available in past decades do allow a more sophisticated approach to developing more flexible strategies. These tools can help us evaluate tradeoffs among strategies. These modeling tools can also be an important tool for communication with the public. To implement new, more flexible strategies the symposium speakers rec-ognized the critical need for a landscape perspective, understanding of natural range of variation and robust adaptive management and monitoring. This will take many years, communication with stakeholders and a strong scientific partnership.
PresentationI’m going to talk a little bit about the Department of Natural Resources so you understand the context we are working from; I’m going to talk a little bit about money, because of course money comes into what we choose to do and not do; and I’m going to connect that to the underlying assumptions that I believe DNR is very interested in which we’ve heard from the scien-tists about and attractive thoughts we heard yesterday.
Gretchen Nicholas, Washington State Department of Natural Resources
If there is scientific consensus to revise underlying assumptions or working hypotheses, would this revision have important consequences for management strategies or policy goals?
Public Lands Perspective
96
GENERAL TECHNICAL REPORT PNW-GTR-830
The DNR policy is guided by the Board of Natural Resources and it consists of representatives of the beneficiaries of the income we generate from our land, so income production is important in the DNR. We also have habitat related goals, most of those our carried out through our habitat conservation plan. Our riparian strategy on the majority of Department of Natural Resources lands does not duplicate FEMAT, but is structured to have many of the concepts that are in FEMAT. Our HCP was put together in 1996, shortly after FEMAT. And those FEMAT-like strategies are applied across most of the DNR lands that are covered by the Habitat Conservation Plan with the exception of the Olympic Experimental State Forest, which allows more flexible landscape strategies that we have been talking about, which is a really exciting opportunity. It also carries with it responsibilities for research and validation effectiveness monitoring; should we reach our goal, we’ll be able to make real the promise of adaptive management, because that is what it’s all about.
In talking about money, I’m going to belabor the obvious. The Board of Natural Resources expects us to produce an income; they also have validated our environmental goals but they’ve made it clear they expect us to get the biggest bang for our ecological buck. They want us to spend their money wisely. I’m going to talk a little bit about opportunity costs.
I have a diagram here: DNR has a certain amount of land and human capital and capital that it can put into producing environmental benefits. Let’s pretend it’s $100.00. Let’s pretend there is Strategy A = 3 E’s, B= 2 E’s, and C= 4 E’s each of which costs $50. The DNR can spend $100. Now, these E’s represent units of environmental output. Obviously, if you were going entirely by the science and you had the ability to calculate environmental units of output, what you would choose is Strategies A and C. The reasons I
choose the things I’m going to talk about with regard to assumptions is that often, through social, regulatory or other constraints (most often through the use of averages which Lee talked about extensively) we find ourselves spending our money on A and B because B is required for some reason-we’ve used an average to establish a target. For example, we find we can’t get rid of that last ten feet of buffer on a certain stream and place it on another place that we think is more important because we’ve used these averages. We use the concepts of Opportunity Cost a lot, without necessarily being explicit about it. We also use those ideas when we’re thinking about incremental gain from any strategy. Again, someone might argue that the item with five E’s after it produces so much-why not add $60.00 so it will produce even more. We know it doesn’t always work that way. In fact George Ice mentioned the important contributions scientists made in the early days of predicting downed wood contribu-tion by building the FEMAT curves (of course it didn’t include the contribution by landslide), but still it is an example of scientists providing information that can be used in making those tradeoffs. We need improvement in being more explicit in using those concepts.
In our Marbled Murrelet conservation strategies we’ve built the Species Habitat Model and when we tradeoff between strategies we will look at the number of Marbled Murrelet units we produce as a result of different strategies. You’re familiar with Sustainable Harvests Calculations that produce an amount of money that will be produce from a given strategy as well as the amount of habitat; you can make those tradeoffs, and indeed that is how we did the sustain-able harvest calculation. I have to say that Lee Benda’s model showed a lot of promise for doing that type of thing for riparian systems. DNR has used the concept of expert knowledge driven models to give quantita-tive results. We know they are not answer machines,
97
Riparian Adaptive Mangement Symposium: A Conversation between Scientists and Managers
but they do help us make more explicit the trade-offs we are making. We have experience with that type of model. We’ve recently implemented something called The Environmental Management System for doing our trade-offs with regard to Northern Spotted Owl habitat.
Opportunity Cost comes up when we consider research project selection. It is going to happen out here at OESF; there are a million things we’d like to do. Jim Hotvedt and Mark Teply‘s job is to narrow it down to the things that are going to give us the biggest bang for the buck.
There is an organizational capacity issue to be considered when you are implementing any new policy. Brian Boyle hit the nail on the head when he said ‘policy is driven by myth’. When we are going to implement a new policy, especially one that goes against the social myth, we have a price to pay organizationally in training and in working with the public to get that to be accepted and to happen. We have the saying around work: ‘you pay now or pay later’; you cannot go barreling in to a new strategy that your stakeholders don’t accept or your staff don’t understand. So the rate at which we go is somewhat determined by our organizational capacity and what we can tackle socially.
Given that, I’m going to try and categorize the underlying assumptions that were tackled yesterday. George Ice outlined some of the major ones; George and Gordon H. Reeves hit the three big ones. The first one is the concept of one-size-fits-all, which was espe-cially applied to buffer strategies. The second assump-tion is the idea of standardized targets. The third idea is the landscape versus stream reach approach. Those three items all have an impact, because they all do not recognize natural variation-by recognizing natural variation, we can target our protection to where we get the biggest bang for the buck.
With regard to one-size-fits-all buffers- we have made some baby steps in the direction of buffer vari-ability. Again, we at DNR don’t rush from one side of the ship to another. The steps are not landscape scale yet, but Richard Bigley who is in our audience, has been working on a headwater strategy for DNR. Part of those concepts under consideration are to use exist-ing protections on streams that we are already commit-ted to and move either those stream protections or the leave tree protection to the critical area on headwaters. So instead of adding new protections we are shifting existing protections using foresters’ judgment about prioritization about the most important places to put that buffer investment. I think that is a very good step in the right direction for us.
With regard to standard targets, I think George Ice brought this up first, when he talked about basal area targets. I have to say that we have been bedeviled by standardized targets such as basal area targets or criteria based on age for old growth or trees per acre. It’s one of the reasons we’ve been bedeviled with old growth issues. We all know that trees reach an old growth forest structure at different ages; similarly habitat targets for owls, which often focus on things like trees per acres, number of snags per acre, number of downed logs per acre-you know that snags are pretty rare to your inventory, it’s going to have a huge confidence interval around snags. You can end up with something designated for habitat, that when you go out and look at it, you know it’s not habitat and you know it should be managed in some way to make it habitat. Or conversely, something looks like habitat or functions well as habitat but it doesn’t hit the habitat target because it doesn’t have the snags. One way we’ve addressed that problem when trying to define old growth, is we’ve developed an index. We have a book out on it; we took the four biggest predictive elements in older forests that predict whether or not the
98
GENERAL TECHNICAL REPORT PNW-GTR-830
stand could possibly achieved old growth structure and we give it a weighted scoring system. By the weighted scoring system, if it’s over 60 it’s most likely (not nec-essarily, but most likely) old growth. If it’s between 50 and 60 in the scoring system it could be (old growth) and we go out and look at it. That gets to the whole concept of narrative, because we do have to verify on the ground that even our scoring system works. We find it’s a lot more accurate and I’d like to see us apply those concepts elsewhere.
That gets me to the discussion that Lee Benda had on Central Tendency Targets. I’d argue that the probability distributions that you talked about that you don’t think we’d like is actually attractive. I think that there is a lot of potential for that; I think that we could use that concept within DNR. Whether you use it to communicate with the public or not is a different subject. We do use narrative, at times, so perhaps it would be narrative that we use to communicate with the public.
On to the landscape versus reach approach; Gordon Reeves talked about a tendency to translate a stand to landscape scale—he is very right. It’s going to be a big leap for us to move on to a truly landscape level of planning.
In my ‘bright and shiny idea section’ I’ll talk about some of the things you all talked about yesterday that I think will help us.
Under the stand-scale approach one of the things I question: is it an underlying assumption (only brought up by George Ice), the idea of the utility of stream typing? I don’t know the answer to this yet, but when I was out with Richard and some other folks the other day, looking at the new headwater strategy, I wondered about the amount of time we spent determining the break between the Type 4 and 5 stream (1996 Forest Practices Rules). The amount of time the forester had spent on that and utility of that, versus training the
forester about what would be the biological hotspots and important things along that stream reach to protect and have him or her spend his/her time on that instead.
I do think the concept of a “natural disturbance regime”, that both Reeves and Bilby talked about, and the range of watershed conditions are very important and critical and also have the big possibility of getting us a lot of bang for the buck. I think natural distur-bance regimes are going to be a hard sell to the public. I don’t see us just barreling into that particular area. I do think it’s important.
I think on even a higher policy level that both Reeves and Bilby talked about the larger landscape context; about finding the areas that have the greatest potential for fish production. I think on an agency level that’s something we should be pursuing in the social context, that is, the issue of conversion of forest land to other uses.
For my last five minutes, I’m going to do my bright and shiny ideas that I picked out of yesterday’s talk.
Lee Benda talked about adjusting the FEMAT curves: I like that as it plays into my thoughts about opportunity costs and tradeoffs. I was a little torn between that idea and the idea of using more sophisti-cated models.
A.J. Kroll said ‘this is the golden age of quantita-tive methods’: I couldn’t agree more. I think that we have way more sophisticated models and a more sophisticated approach that takes us past where we were in the 1990s. It just so happens that in the 80’s and early 90’s there wasn’t that much organizational sophistication nor was there the type of data there is now. We have a full complement of very sophisticated people at our agency. We have experience with mod-els, we have the computer capacity and we have the databases. Not only the digital elevation models but LIDAR and very thorough inventories are available. I think that is going to help us a lot. I believe the open
99
Riparian Adaptive Mangement Symposium: A Conversation between Scientists and Managers
source data and planning software that Lee was talking about is an idea whose time has come. Certainly, open source software is important-the US Forest Service has done that with FDS and that’s the model we use. DNR is currently working with the Nature Conservancy to build a cross landscape database. Those are baby steps in that direction, but I think they are ideas whose time has come. I think that some of that information and ability is what allows us to move forward with Adap-tive Management. I am optimistic.
Some last comments: the OESF, how are we going to select strategies? That’s simple-Mark Teply is going to do it! We will most likely select those strategies where the DNR has something unique to contribute. All of us scientists in this room need to contribute to the direction we go because there are not enough resources to spread over every single subject we are interested in. We are going to have to cooperate and find a single focus. These things will take years and years to implement.
222
GENERAL TECHNICAL REPORT PNW-GTR-802
This page is intentionally left blank.
101
Riparian Adaptive Mangement Symposium: A Conversation between Scientists and Managers
PresentationI’m going to talk about how changing scientific assumptions can affect policy and management. I’ll also talk a little bit about some of the experiences we had organizationally in adopting an aquatic conserva-tion strategy that Gordie talked about. I’ll talk specifi-cally about how it has manifested itself in management within riparian reserves. I’ll finish by addressing areas that I see as needs or opportunities for the future.
I’ve been around long enough, that I actually got to work in the good old days. That was a time when each forest was governed by a forest plan and, almost without exception, each forest had a different set of scientific information that they drew upon. Consequen-tially, none of the riparian directions on forests were similar. You could go from the Willamette to the Mt. Hood and it was a significantly different approach to how to manage.
Along came 1994, a change of management was driven by political issues that slowed everything to a halt: PacFish, NFish and the Northwest Plan. What that resulted in, was a generally similar aquatic conserva-tion strategy management direction for all of the for-ests in Oregon and Washington. At that point in time, this was unheard of. As I mentioned, we were going from little fiefdoms which each defined management to a regionally consistent approach that incorporated the best science. That happened quickly, and frankly a lot of people were left with their heads spinning trying to figure out how to implement it.
It introduced some major changes. It is interesting today how we’ve forgotten how big a paradigm shift occurred when we adopted that conservation strategy. Some big things that changed: • The way we looked at and thought about scale; we
went from a site specific, stream reach base way of looking at the world, to a watershed landscape scale approach. We were required to do watershed analysis to set the context for any project level management decisions.
• We went from thinking about specific onsite conditions to being forced to considering processes and trends.
• Disturbance-in general we previously ignored disturbance in designing projects. We were moved to a point of having to anticipate disturbance and think about how it influence processes and trends.
• In terms of management, we had been very happy independently managing national forest system land, and were suddenly told to collaborate-to work with our neighbors and other federal agencies and give up some of that independence to come up with a more collaborative approach to manage-ment. As you might expect that set a bunch of things in motion.
• One of the big ones Gordie touched on in the Aquatic Conservation Strategy. It is the identifica-tion of what was called Riparian Reserves. This is a transition zone from upland to aquatic; it includes more than just the riparian ecosystem. Two things were critical about that. One is that
Dave Heller, USDA Forest Service, Region 6
If there is scientific consensus to revise underlying assumptions or working hypotheses, would this revision have important consequences for management strategies or policy goals?
Public Lands Perspective
102
GENERAL TECHNICAL REPORT PNW-GTR-830
it was an actual land allocation that had some specific goals to emphasize the protection and management of riparian dependent resources. It was an acknowledgement that managing these riparian areas included not just streams but also lakes, reservoirs, seeps and springs and wetlands. Those were all included in the riparian reserve. We were expected to manage those in a special way to emphasize production of riparian dependent resources and ecosystem services.
• The other thing we talked about yesterday was that suddenly, with that land allocation, the burden of proof for activities shifted. The question became: was an activity going to serve to maintain or enhance riparian dependent resources rather than having to prove damage to determine whether or not a management activity would move forward.
There are a lot of people looking at the document provided by the planners, trying to figure out how to implement it. I would say that on a good forest, it took maybe five years to swallow, process, and put it into motion. And frankly, that is remarkably fast from what I expected to see. By and large, people took it on and learned how to implement it. I think it demonstrated some things. Science assessment and synthesis can have a profound change on management and policy. There weren’t a lot of people advocating for change, but we got it and had to live with it. It did make a tremendous difference in how we thought and how we managed. It really demonstrated that it takes time; in the case of our region, I would say we are still learning how to fully implement that strategy. I think it shows that timing is critical-the social and political situation made it ripe for significant change in how we thought and how we managed. I think, also, it showed that often times the biggest barriers aren’t science. The situation was ripe for us to get some new information; some of the biggest barriers were the organizational
and capacity issues on how to begin to institute brand new processes-a whole new way of trying to manage the landscape.
Looking at riparian reserves; it’s a little different on National Forest System land. They are not buffers. They are a land allocation for riparian resource man-agement. Early on, the idea was that there would be a default width and we would go out and through water-shed analysis adjust it to the conditions on the ground. One of the problems we ran into (much like your talk about the lack of scientific consensus with stakeholders and other regulatory agencies) was trying to shift those boundaries; it gained its own momentum. What ended up happening is that people decided to quit haggling about the width of the riparian reserve and talk about what the appropriate management within it should be. That is really what has gone on. Anymore, there is very little effort to adjust the width of the boundary and the effort goes into what is appropriate manage-ment activity within it.
Gordie talked about the terminology of Riparian Reserve – it took five years for everyone to swallow this whole thing. And then we began to see a hands off approach – we didn’t do any cutting in there, we did very little. Five years out-we began to see people say ‘we probably ought to do something with the vegeta-tion’. You began to see some initial efforts at thinning in the riparian reserve. I would say that today (I’ve done some checking) every one of our forests does some level of pre-commercial thinning. Many of them are doing commercial thinning. It’s not a lot of the acreage, but everybody is doing it. The trend is up. It’s being done to accelerate the production of large wood, to reduce fire risks on the East Side and in some of our Southern Oregon forests, and (a little bit) to look for riparian stand structure to benefit riparian dependent wildlife species.
103
Riparian Adaptive Mangement Symposium: A Conversation between Scientists and Managers
In most areas we are going with a no-touch area between the stream or the lake or the wetland and where the activities are occurring. Typically the regulatory agencies are asking for a much wider area than our people on the ground would like to do and think is appropriate. One of the biggest things we’ve found as we’ve moved forward, particularly in vegeta-tion management and the riparian reserves, is that a big obstacle isn’t getting or incorporating new science-it is an issue of personal values oftentimes occurring with individuals within the regulatory agencies. Many times the arguments that we have are not based on science; they may be selective use of science. It winds up loggerheads between individuals. From my point of view, often times, it is how well people get along that results in what happens. At this point, it is not heavily dependent on new science.
Asking the question: Can changing scientific assumptions affect management? I think our adop-tion of the aquatic conservation strategies is pretty ample proof that it can have profound effect. The last fifteen years have introduced some interesting areas of need; some of those were talked about yesterday. In my mind, some of the needs are not more research; but how to take finding from research and get it in the hands of people in a form that they can use. Gordie talked about synthesis and scientific assessment, integrating it into management. I would have to say, that is probably the biggest area of need that we have. The statement that ‘science is ahead of policy’ is true; there is no question about that. The days are past when our biologists were able to sit back and read research reports and figure out how to integrate them into management; if they do that, it is on the weekend at home. It is very tough for our folks to stay current with science, let alone how to put it into a form they can use.
Also, I think the world has gotten so busy that having a strategic and systematic approach to identify-ing needs and developing operational approaches with our science arm of the Forest Service has become very uneven. It’s difficult to get that time and sit down to figure out where we are going together-and then figur-ing out how to come up with the resources to make that happen. It is becoming harder and harder.
Yesterday, when folks were talking, I picked up some specific bright things that Gretchen was talking about – here are four or five areas where we could likely use additional information and techniques for dealing with today’s challenges: • The first one is a better understanding of landscape
patterns and the relative role of riparian areas-not just streams, but lakes, wetlands, seeps and springs-in landscapes. What role do the functions and resources we find in riparian areas play within the larger landscapes? The landscape scale is big-ger than a watershed.
• Improved understanding of desired and target conditions at various scales and over various time frames is a huge issue. We know there is distur-bance, we know there is variability; but how to deal with that at different scales and timeframes is no simple task. It is a real challenge.
• Improved understanding and analytical tools that help us look at watershed health or resiliency over time is something we could use. We are getting better at it, but it takes a fare amount of time and money-both of which we have less and less of.
• A big area for needed improved is our understand-ing and integration of riparian dependent wildlife and other organisms into our management of riparian areas. I talked about the fact that riparian reserves are an area to manage riparian dependent resources; unfortunately, in many cases fish and
104
GENERAL TECHNICAL REPORT PNW-GTR-830
water tend to be the primary drivers of manage-ment decisions in those areas. This is not to say that the other resource advocates don’t participate. That is an area in which we have a lot of room to grow and become more proficient at in terms of how to integrate the other element into our man-agement.
• Another one is tracking systems to monitor the response of our management to disturbance. We’ve tried to anticipate disturbance – in Washington we’ve had some major flood events and wind-storms. How to track change over a large scale is something we could use help with. We are doing it, but it is not a consistent protocol and there may be ways of looking at that and being able to see what has been the response to 15 years of manage-ment when we get these disturbance events. We had ideas about what things would look like after major disturbance-but going out and looking at those over a large areas is something that would be helpful.
• One final area: that would be climate change. We are in the midst of an actual revision of our aquatic conservation strategy. It’s required by law, but I call it adaptive management. We are doing a minimal job of trying to incorporate climate
change into our aquatic conservation strategies and knowing how it should best effect our future management.
Brian said an improvement in science, policy, com-munication and understanding is going to be critical. It is tough to communicate, to share information. This symposium has been a great chance to do that. Within the Forest Service we need to learn how to do a better job of that. It’s going to take extra effort and com-mitment to make it happen because people’s time is becoming scarce.
Kathy O’Halloran: I want to make one point that Dave and I talked about earlier; there have been so many great ideas and concepts discussed here, par-ticularly the discussion about what is really going to make a difference. Bob Bilby did a great job in his talk about ‘So What’-regarding salmon, we are spending a lot of time looking at forestry, but if the real issue is land conversion how do we get that addressed? With the Puget Sound Partnership the action agenda is about to come out. I encourage you to watch the web for this because that is where a lot of these concepts and ideas can create that interface with science and policy. This is an area where a lot of the decision makers will be looking; what makes a difference and where should the investment be made.
105
Riparian Adaptive Mangement Symposium: A Conversation between Scientists and Managers
AbstractIf there is scientific consensus to revise underlying assumptions or working hypotheses, would this revi-sion have important consequences for management strategies or policy goals?
Scientific consensus is elusive if not impossible in the debate around scientific proposals in the natural resource community. It has been the Foundation’s experience working through the last decade on the development of the Family Forest Habitat Conservation Plan that consensus has been unattainable even with the use of a collaborative, transparent and structured independent scientific review process.
One of the biggest roadblocks is the philosophical opposition to active forest management embodied by many in the conservation/environmental community.
True adaptive management processes are difficult to employ in political arenas where there is tremendous political capital invested in the status quo.
Given these challenges, a process where the preponderance of scientific evidence can be employed to inform policy decisions is needed. With out such a process, policy makers and researchers are left with a “dueling scientist” scenario which does little to further scientific knowledge or policy processes.
PresentationMy task is to address the question: If there is scientific consensus to revise underlying assumptions or work-ing hypotheses, would this revision have important consequences for management strategies or policy goals?
I intend to walk the fine line between policy and science, particularly as it relates to a habitat conserva-tion plan that has been in development by the Family Forest landowners in Lewis County.
I’m going to assume that most of you know what a Habitat Conservation Plan is. I first heard about habitat conservation plans in a class taught by Nalini Nad-karni at the Evergreen State College and from Jerry Gorsline, who was a field representative for the Wash-ington Environmental Council. I worked on an HCP for my family’s forest for about five years; there was another landowner in the county working on the same thing. The federal services approached us, suggesting it would never work on a one-at-a-time basis due to lack of small landowner resources and agency capacity and proposed working together on a programmatic approach to habitat conservation planning.
We tried hard to work together in a collaborative process with multiple stakeholders; affected tribes; state agencies; and county governments, and we thought the independent scientific review process would be a useful tool for us. We found out early on the approach that we were taking was controversial amongst the resource protection agency stakeholders and looked at the independent scientific review process as a way to provide assurances. I’m going to try to cover twelve years worth of process and experience in fifteen minutes.
We finally submitted an HCP and an administra-tive draft environmental impact statement to the federal services on September 4, 2007. The documents
Steve Stinson, Family Forest Foundation
If there is scientific consensus to revise underlying assumptions or working hypotheses, would this revision have important consequences for management strategies or policy goals?
Family Tree Farm Perspective
106
GENERAL TECHNICAL REPORT PNW-GTR-830
are over 1000 pages-that’s good that we covered a lot of bases, it’s bad in the fact that people rarely read it. We put close to $4,000,000 of federal, state, private and county funds into this project. We really wanted to follow the rules of science, use best available science, put together the “A team” to put together this Habitat Conservation Plan. Marty Vaughn, of Biota Pacific, is the lead habitat conservation plan writer on this HCP. We have an excellent document which we’d like to get across the finish line.
I think that science is ahead of policy and that we have a lot of work to do in our policy arena to take advantage of the tools including the internet open source software concept mentioned by Lee yesterday. I’m going to make the argument that policy is not yet ready for that level of information. My point is that in Washington we often wind up on the ground in front of a few large trees arguing about their specific effect on riparian function. That’s way down in the weeds.
We must attempt to think in a broader perspective. We’ve got the Pacific Ocean and salmon – the fish come in the Columbia River system and travel back to the ocean. We have Washington, Oregon, and Idaho that we deal with here with different riparian regula-tions. In this particular case, we are dealing with a perennial, fish bearing stream buffer zone, bank-full width of nine feet, and a site index of II. In Washing-ton State, we have a 50 foot no cut zone and a 100 foot managed zone on each side of the stream. (Those of you familiar with Forestry and Fish know it’s a lot more complicated than that, but that’s the basics.) In Oregon, that same stream—same fish—has a 50 foot managed zone; 40 square feet of basal area must be retained. In Idaho, we have a 30 foot riparian zone at slope distance where you have to retain 140 trees per acre in the three to eight inch diameter class. In Wash-ington State we also have the alternate plan system;, we’ve seen ‘no cut prescriptions from ten to fifty feet
in that planning system that have been approved under Forest and Fish.
I’m going to show you what the Family Forest Foundation HCP would propose for this stream, but before I do that, I’ve learned I should provide a little geographical context of where this plan would apply. It would apply to Lewis County forestlands that are owned by Family Forest landowners who are defined by this state as people who harvest less than two million board feet of timber on an annual basis. Lands in this category are usually low elevation, dry Doug-las fir forests, with low gradient stream systems; 85 percent of the streams are less than 10 feet in bank-full width with gradients less than 4 percent. It is not an area where landslides are a significant factor in the LWD recruitment process. Historically we have stand replacing fires, with a fire return interval somewhere between 50 and 100 years.
The Family Forest HCP would put a 40 foot ‘no cut’ and a 40 foot managed zone for a combined 80 feet on that fish bearing stream.
We were having trouble getting our science assessment to be accepted by the federal regulatory agencies, so we used the independent scientific review process. We entered into that on a collaborative basis; NOAA Fisheries, US Fish and Wildlife Service, and Family Forest Foundation. We adopted a consensus process and jointly picked a pool of reviewers, jointly developed a set of questions. We attempted to make the process transparent; we used Sustainable Ecosystems Institute, Dr’s Steven Courtney and Deborah Brosnan; they have the federal contract for peer review for the US Fish and Wildlife Service. We got a very positive review or our proposed conservation strategies. Dr. Courtney actually said the review was the closest to achieving consensus among forest scientists he has seen in his history of running scientific review processes. The federal services didn’t care: NOAA
107
Riparian Adaptive Mangement Symposium: A Conversation between Scientists and Managers
fisheries staff independently contacted the reviewers, outside of the transparent process. Those same staff provided anecdotal reports to the stakeholders saying: ‘when we told them what you were really going to do with the data set, they changed their minds’. I cannot get any of this in writing.
There are two aquatic biologists at NOAA fisheries science center who disagreed with the forestry ques-tions that were addressed in the independent scientific review process. After another year of back and forth, there are six PhD Forest Ecologists that agree with the referents condition methodology, and two NOAA PhD Aquatic Riparian Scientists that disagree. There is no format within which to resolve that disagreement.
As you might imagine, there are politics behind this debate. Political pressure was brought to bear. I’ve been accused of being politically adept at manipulating the political system-we have a great story and I like to tell it. There is another group that is very adept at political pressure in this state: the Washington Forest Law Center. I try to bring the Family Forest Habitat Conservation Plan to the attention of the public and the media. Reporters who follow up with a call to the Washington Forest Law Center are given headlines like this: ‘just trying to exercise their God-given right to log down to the edge of the stream’, or ‘science isn’t good enough for salmon’.
I have a letter of support for the Habitat Conserva-tion Plan signed by Senator Murray, Senator Cantwell, Congressman Dicks, Congressman Baird – no small feat. Washington Forest Law Center gets that letter; they fly to Washington DC and verbally abuse staff-ers, accuse them of trying to influence the scientific process. They filed public disclosure requests with all three state agencies regarding the Habitat Conservation Plan. They did not file the Freedom of Information Act requests with the federal agencies.
The latest action is a series of letters to NOAA Fisheries that claim that the CMER Desired Future Condition validation study (about 115 plots of very fine work) is the only set of data that can be used to define a reference condition in Washington State.
Given the technical concerns, the Federal Regula-tory Services refused to move the HCP review process forward to public comment under NEPA, which is our current ask.
The logic that I hear is that we have technical issues. This is a quote from the federal service:
“A+B+C+D=E. We don’t like E, so we went back to find out what is wrong with A,B,C and D”. It’s a process from which you cannot get escape or resolve.
What are we going to do? I feel strongly about the scientific approach; I feel like we’ve addressed the scientific issues the best that they can be addressed. We still have no refereed format in which to resolve the scientific issues. It’s clear that people are uncom-fortable with the risk; I think there are things in our implementation agreement that we can do to reduce the level of risk and we are going to continue to urge the Federal Services to move forward and put the docu-ment out for public comment.
What is scientific consensus? I am not sure that it exists; I’m not sure that it’s achievable. We ought to think about what that means. If we cannot achieve scientific consensus because of different value systems or different agency perspectives, what other processes might be available to find a way forward?
Will public comment under NEPA provide an opportunity to reach scientific consensus? I doubt it. What can we do to the independent scientific review process that would improve it in terms of reaching consensus? My experience with the independent scientific review process has not been very positive. We need to think hard about what that means and how that process can be improved. Can we even reach
108
GENERAL TECHNICAL REPORT PNW-GTR-830
scientific consensus in a political world? I don’t think so. Lacking consensus, what process is there that will allow us to move new scientific information forward? I think that’s the key. I’ll reiterate what I stated earlier: Science is way ahead of policy. If we are to benefit from science, we need to think hard about what kind of policy procedures and mechanisms can be adjusted, modified and put into place to allow the work that you (scientists) are doing to get it out into the real world where people can take benefit from it.
109
Riparian Adaptive Mangement Symposium: A Conversation between Scientists and Managers
Craig Partridge: This question is for our panelists: What I learned from the discussions here so far is that despite what the literature says about adaptive management never happening, these guys all think it does. There is adaptive receptivity in the policy arena for new scientific assumptions except maybe in the case of the Family Forest HCP. Although policy change happens slow, except when it’s fast, and although there isn’t really any money for it, and although it really doesn’t matter if we just talk about the forest because the real impacts to fish habitat are going to happen elsewhere; with those caveats there is a dynamic recep-tivity in the policy arena to the needed changes that yesterday’s contributors told us about. My question to the panelists is to sort of turn Question number 3 around and say: ‘if there is an opportunity for conse-quences in management and policy as a result of new scientific assumptions; what is the one quick thing that would be necessary from the science in your view? If you had to say what the one thing of consequence, what would that new science have to provide?’
Norm Schaaf: My first reaction would be for scientists to provide a range of alternatives on how new informa-tion could be incorporated into management. Not rec-ommending policy, but offering up some approaches where the new information could be incorporated into ongoing programs.
Steve Stinson: One of the useful things that would apply in this situation would be to have a common lan-guage. I think often when new science comes out; it’s not understandable by policy makers, stakeholders and
the public in general. If I were to pick one consequen-tial thing that would be different in how we presented science it would be to have some common language.
Gretchen Nicholas: There is some foundation to the current science that we’ve already talked about; but there is the issue of the number of studies, replicates, repeatability…the foundation of good science. It is difficult for an organization to adopt new policy in the face of evolving scientific information [because you have to validate the assumptions behind that change]. As Lee Benda described, [you can help validate assumptions by] pulling together an expert system like the US Forest Service’s Environmental Management System or something similar that will use enough of the new research to back up assumptions and make them plainly understood in terms of developing new policy. [If scientists are] doing some of that footwork it really helps in making tradeoffs [and making assump-tions clear in the policy development].
Dave Heller: I think the thing coming from science that could help us with the greatest consequence is an understanding of the dynamics of the situations we are dealing with. We look for a quick solution, an absolute answer, even though we deal in a system that we know is inherently dynamic. When it gets down to policy making and writing regulations and working within those, we want something that is absolute out there; safe. That’s a tough place for us to be.
Craig Partridge: So that’s essentially what they (panelists) are asking from you (scientists) and now is the time to talk about what you (audience) have
Which are the critical assumptions in terms of both scientific uncertainty and management/policy implication?
Question, Answer, Comment Session moderated by Craig Partridge, WA DNR
110
GENERAL TECHNICAL REPORT PNW-GTR-830
concluded as a result of the discussion so far; what do you consider to be the critical scientific assumptions that ought to have the potential for changing manage-ment and policy. How those might best be translated or structured into further research programs that would influence policy and what you think the key aspect of policy leverage that have struck you from the discus-sions of yesterday and today. You can start by asking questions of the panelists, but we are going to quickly open it up for people to comment and question one another.
Pete Bisson: Let me give a short preamble: Ten years ago I attended a fisheries conference on Science/Policy Interface. Angus Duncan was a speaker at the conference; he was the initial chairman of the Northwest Power Planning council. At that time it was the nation’s most expensive ecological restoration program. My question to him was: has science sold you down the river? Of course this was an audience of scientists so Angus’s initial response was ‘no’. But then he said: ‘There’s something that really bothers me; there are scientists on one side of the table with excel-lent scientific credentials, and they are arguing with one point of view. And on the other side of the table are scientists with equally impressive credentials who are arguing for the opposite point of view. And I don’t know who to believe’. So my question for the panel is: Based on your experience, or for that matter, what you’ve heard over the last day, where do you think are some of the key pinch points now, where there is not scientific consensus particularly as it relates to the issue of riparian management?
Steve Stinson: I think it’s pretty clear that we have a division in camps; active management versus passive restoration perspectives; the precautionary principle versus folks that would like to dive in to replicating or imitating, to the extent possible, natural historic dis-turbance regimes. Until we can make a common sense
case for conservative active management approaches, we are going to have a difficult time overcoming that ‘foresters are bad-keep them the hell out of the riparian zones’ perspective that is embodied by folks that want a larger no-cut buffer. That to me is one of the real obvious ones that we’ve got to overcome right away if we are going to make any progress on the kinds of things that were discussed in this room today or yester-day, which were quite exciting from my perspective.
Gretchen Nicholas: I agree that the whole issue of uncertainty with regard to thinning and riparian buffers is important. We have people who want a lot of certainty of outcomes if we are going to propose changes. People are concerned that the uplands silvi-culture that we know about can’t be translated to the riparian areas. They are worried about blow down; about how much opening up the stand will impact shade. It’s problematic for us; I guess the best thing to happen in the scientific community is to take those small steps forward with the experimental sites and all of us together getting people out to those sites to see them. I find that you can publish all the papers in the world, but taking people out to those experimental sites can get the idea across in a very short amount of time.
Norm Schaaf: One of the things we could benefit from is better measures of the effectiveness of rules and rule implementation; are we achieving the desired results that we have set out to achieve? We set up science to support policy and then rule implementation, but we very seldom look back in the other direction to see if we have achieved the results we are looking for. If rules are effective in achieving some goal, is that goal then getting us to the larger strategies that we are hoping for? If we create shade and we create cooler water, will that bring back more fish? Is there a bigger part of the picture that we are not looking at? How do
111
Riparian Adaptive Mangement Symposium: A Conversation between Scientists and Managers
we validate the conservation practices implemented through rules?
Craig Partridge: To remind people: which are the pinch points, those assumptions that seem to drive people into their trenches, which we could use more clarity on?
Jim Peters: I think part of the difficulty is how stake-holders interpret different studies and what their risk level is. In some instances I have a lot of respect for this person over here and I have a lot of respect for this person over there, and who do I believe? When it gets filtered out it is like this: this person has interpreted data slightly differently and is willing to have a higher risk versus this person over here who doesn’t want any risk at all. I think in that type of scenario, being able to filter some of that stuff out and being able to really understand where they are coming from would help us make better judgments. It amazes me all the time; we think we have all the science and the literature to back it up. Then you’ll find somebody coming out with a total different perspective on that science because of a totally different risk assessment.
Gordon Reeves: In terms of having dueling scientists, we wind up looking at the track record that led up to the disagreement. A lot of times that has a lot to say about relevance and the stature of the comments that we get. I would agree, too, on the need for demon-strating effectiveness. I think tracking the results of applying science is particularly difficult. I mentioned earlier that we’ve really gone from talking site specific to watershed resiliency. We do have a monitoring system that is pretty good-but there are real questions on whether or not we can show results.
Craig Partridge: You may have been asking for the substantive questions that drive people into their trenches, but what we’ve uniformly heard is that it’s not so much about the substantive questions; it’s about the risk tolerance of different scientists or scientific
communities. It’s the difference in risk tolerance that drives people on any scientific question. Is that an acceptable answer, Pete, or do you want to pursue it more?
Pete Bisson: Actually, I thought Steve has come the closest with his answer on active versus passive man-agement; that is a hot topic and one over which there is a lot of disagreement. But to the others, from your particular vantage point, if you have ideas or topics or issues that you feel are scientific hot buttons or there isn’t consensus on – we as scientists would like to know what those are.
Gretchen Nicholas: Given that we are getting ready to do validation monitoring, I’ve heard some pretty hot arguments over the validity of paired watershed studies. I’ve also heard some pretty hot arguments on how you do validation monitoring for salmon. Do you measure the smolts coming out of one small area? Gordon H. Reeves suggested there is some kind of an ear bone that you can use to study the whole life cycle of the salmon. How exactly do you approach that? If we are going to undertake an expensive program, we want to do one that works.
Dave Heller: I’d toss out too, I think climate change is a huge one-at least on national forest system lands we’ve got a pretty robust strategy laid out and I think there are some significant questions. If we look ahead, some of the modeling I’ve seen, there are some real strategic implications that maybe we need to be con-sidering and we are scrambling right now with how to incorporate them into our management. Gordie talked a lot about disturbance and scale. I think we are really struggling with how to mesh natural disturbance and man-caused disturbance at various scales; how do we incorporate that into our management.
Kathy O’Halloran: One of the topics that we briefly touched on yesterday is alder and alder manage-ment. With the release of the information associated
112
GENERAL TECHNICAL REPORT PNW-GTR-830
with Puget Sound hypoxia and specifically the Hood Canal—I’m not sure which was number one and which was number two—but septic systems and alder were the two greatest source of nitrogen in Puget Sound.Craig Partridge: So alder is not quite the hero we heard about yesterday then?
Kathy O’Halloran: No; it seems like it would be very nice to have some ecologists, foresters and ocean type people all come together and talk about alder. I feel like my head is spinning; depending on which group I’m with, alder is either wonderful or horrible. It would be very nice to have at least a thread of consistency.
Gretchen Nicholas: I want to comment on that alder study because that caught our attention. In the case of this alder study, certainly these are preliminary results, this is one study. We know that alder creates a flux of nitrogen. That is not surprising-it creates nitrogen in the streams. The amount of impact on the Puget Sound system is still in question. When I talked to the study author, he said he never meant it to be extrapolated as broadly as it was. That points to the problem we have with sensationalism of one study. It could end up being true, but the study’s author tells me that he would need more studies because he had to extrapolate data from some watersheds to other watersheds. The jury is still out on that-it’s an example of running with data that is not conclusive.
Pete Heide: I think I’ve heard enough here today to say that we are ready to take a look at some sort of a landscape approach to how we put our riparian strate-gies together. Representing large private landowners, I’ll tell you that there are almost no large private landowners out there that are one bit interested in any kind of a rule change effort or major change in the way they are operating. We just learned how to oper-ate with what we are doing now, but because we have this wonderful facility here and because we have this
organization with the Dept. of Natural Resources in managing large blocks of land, and because they are interested in learning more about how they can man-age those lands better, I think this is a terrific oppor-tunity to begin testing some of the mechanics of how you would go about first developing the techniques for identifying what these landscapes looked like and the tools to manage them.
You also have another wonderful organization at the University of Washington, called the Precision Forestry Cooperative. They are quite interested in applying the science that is coming along in the way of remote sensing. I think this is a great opportunity to begin testing, not only how do we identify what these areas look like, but the real opportunity, I think, and Doug convinced me of this, is to use these tools to revive what we were doing with watershed analysis in an economical way; I think it would be terrific. My suggestion is that we look at this as an opportunity to test some new tools and test some new processes to begin to figure out how we can economically imple-ment this notion that the environment is variable and we ought to be considering it as variable when we apply our treatments.
Steve Stinson: I’d like to try to tie a few things together. I agree with much of what I’ve heard over the last two days. In thinking out of the box in a safe environment here; we’ve got climate change, we know that we’ve got forest conversion (my conversion numbers are about double of Dr. Bilby’s and I think you can justify both of them) and we’ve got a need for common language. And we were just asked about the key aspects of policy leverages. Is it possible to leverage the concern over climate change, which most everybody understands the direct linkage between it and forests, and a subset of that is our conversion issue, with some of the new tools and datasets that we have, to broaden the public’s perceptive on a couple of key
113
Riparian Adaptive Mangement Symposium: A Conversation between Scientists and Managers
issues? One key issue would be the dynamic nature of the ecosystems that we are working with. I think that most of the general public views the forest as a static system-I think that’s a key place where these tools we have could inform the public. The second issue is using on-the-ground results that we can use to broaden the public’s perception of the dynamic nature of the forest and riparian systems. The third thing that could come out of this is this notion that the assumption is that the current regulatory system is a house of cards in the sense that the science is ahead of the regulations.
Craig Partridge: My understanding of the public perception of change in forests, is that they do under-stand that forests change; they just think it is all human caused and a bad thing. Maybe to rephrase it: How can we help stakeholders and the general public under-stands that not all forest change is a bad change? That may be the bigger challenge.
Norm Schaaf: A comment to Pete’s suggestion-there is a real opportunity to set in place some landscape level studies. We have a very nice laboratory in the Olympic Experimental Forest. Perhaps we start at the headwaters on Forest Service and work down through State and private lands, capturing the opportunity to look at different management histories and goals. There are a range of prescriptions and management applications and techniques. Those all can meet this larger goal of fish production and healthier riparian habitats.
Craig Partridge: Any other response to the idea of a large landscape scale experimental program?
Bruce Rieman: The idea has been around a long time, and there’s been a lot of discussion in the scientific community about the need for these big experiments. They are big spatially, but they are also long term and it’s going to cost a lot of money. Finding the collabora-tive means and will to do it through the time scales
that are necessary would be a huge challenge. Is that something that is really feasible?
Craig Partridge: Sometimes that means spanning the scientists’ life time career.
Gordon Reeves: A follow up to what Bruce just said: one of the things we need to keep in mind is the real test of these shifts is going to be the next big natural event. We don’t know when that’s going to happen. If we are indeed trying to manage for dynamics, I think we need to understand that big event sets the stage for the long term productivity of the system. I think in designing these types of things we can’t present the idea that in five years we are going to have the answer. It may take five years, ten years for this big event to happen. It’s not something we can guarantee we’ll have an answer in five years. That’s really important in terms of setting up the expectations with policy mak-ers and the public. This is not a nice tidy experiment that we are going to be able to tell you ‘yes’ or ‘no’ in two years.
Kate Sullivan: Large scale experiments also suffer from the problem that everyplace is unique; large scale studies are difficult to replicate. You have to have a lot of agreement on what you are learning while you are conducting it in one place, to extrapolate to other places. You have to avoid the problem of paired water-sheds, now you have paired landscapes. Well, you have no pair. Really we need to have some good process understanding of how things are working while you are doing those studies to extrapolate well.
Craig Partridge: Can you give us examples of the characteristics of that kind of process?
Kate Sullivan: I have a slightly different view of the same problem that Gordie and Lee are talking about. It’s all about how much sediment gets into rivers and how well it sticks and the mechanisms by which it is delivered. You can still study those things, and their
114
GENERAL TECHNICAL REPORT PNW-GTR-830
rates, in the context of this landscape. You can still understand fundamental processes and how stream temperature works within the context of this land-scape. You can’t lose track of that-if you think that watershed paired studies have a problem; landscape scale is really going to have a problem.
A.J. Kroll: One thing that concerns me when I hear these kinds of discussions between the science and policy folks is that a lot of the ideas that we consider as scientists might include strategies with large up-front commitment of resources that society at large is just not willing to consider. Gordie pointed out that he had an idea that instead of going into some of these watersheds on a periodic basis, you might go into a watershed and do extensive harvest in a short temporal window (if I was interpreting it correctly). I know we realize there is enormous operational efficiencies for large landowners doing that, but the suggestion that we might go into a watershed and take out five or six hundred acres at a time, even with proper buffers-it is just not going to happen. It’s not going to be con-sidered in Washington in spite of some of the larger scale historic disturbances that might have occurred. Even if you could find some way to balance the harvest impacts that you know exist, we are just not going to start taking out watersheds any more.
Craig Partridge: Our watershed associated protec-tion standards are uniform for a reason and they are uniform because people want uniformity as an equity guarantee. That underlies what you are saying.
A.J. Kroll: Yes, that’s right, you could put together a blue ribbon panel of scientists that reports that in the state of Washington the best strategy is to knock down 700–800 acres at a time and only go into a watershed every 60 or 70 years and the public is not going to go for it. So why even study it? I think there is something very disingenuous about taking public money to study
something that the public is never going to allow you to implement.
Pete Bisson: There is a group of very capable, core scientists here, who are looking way ahead. My sug-gestion is-we’ve got new tools, we do understand that the landscape is variable. We have good indications that we shouldn’t be doing the same thing everywhere-that we should be customizing our treatments to the landscape features. I’m suggesting that we test those tools and begin to adapt to this way of doing business, this idea about being very specific about our prescrip-tions. That may tie into a longer term study about very large landscape comparison-but that is not what I was suggesting.
Steve Stinson: Thanks for the clarification Pete; I thought that was what you said. It broadened into a landscape level experiment discussion, which rein-forces the point that I was trying to make earlier-we’ve got great tools, but the science is ahead of the policy. Before you are ever going to be able to implement even Pete’s notion, we’ve got to get back to the basics of broadening the public’s perception on some key issues or we are never going to have the public support as A.J. so aptly noted. We are never going to be able to get the kind of funding that it takes to sustain that kind of research over time.
Doug Martin: I thought we would discuss the incre-mental approach in a bit. Lee touched on it at the beginning of his talk-the four elements of riparian management: buffer width for fish barring waters; buffer length for fish barring waters (e.g., how long are the reaches you may be managing); headwater buffer length (e.g., what length of headwater buffer will mitigate influence on downstream fish habitat); and management BMPs for headwaters themselves. We actually have a lot of questions about what are the characteristics of those elements that would make the best sense to address given the spatial variability
115
Riparian Adaptive Mangement Symposium: A Conversation between Scientists and Managers
across the landscape, potential productivity, intrinsic potential, etc. You could develop a suite of experiments and investigations simply dealing with those 4 ele-ments and getting an understanding of the risks. Once we have an understanding of the risks you can translate that back to the public. Like Pete said-incrementally.
Gordon Reeves: I think one thing to keep in mind is that we could use models to do a lot of this landscape stuff. One of the key things is to understand the assumptions that go into the models and then playing the ‘what/if’ game with the model to make predictions. If we are going to be looking at large scale and we want to talk about long time period, we can use model-ing. A lot of the terrestrial stuff is based on that; we can again, draw the parallels there. We need to really be clear about where the weakest part of the model is, or where we went out on a limb to make an assumption and start to work to refute or to support these types of assumptions. We can start using these models and modeling efforts that provide policy makers some insight into what is going to potentially happen if you institute these big types of changes without waiting for 100 years for the answer.
Craig Partridge: Do we need to do actual on-the-ground large scale studies?
Gordon Reeves: I think you can. You can make predictions but again, I think the models are going to give you some real insights into what you would expect out there and start to build the confidence with the public. I think we have to throw the idea out to start the discussions and one of the ways we can start to do that is through modeling; to instill some confidence with the public.
Pete Bisson: Kate raised a very interesting point, which was the challenges that we face in trying to design or implement some large scale learning effort at the watershed scale or the landscape scale. I think
there is another barrier, too, that we haven’t talked about much. It has to do with the institutional barriers to being able to put in place large scale learning oppor-tunities on the land. Several of us here were involved in the initial TFW effort. Who wasn’t at that table; the feds. When I was involved with FEMAT and then the Interior Columbia Basin Analysis-who wasn’t at the table? State and private. There has been this traditional wall between the various land management organiza-tions and being able to actually sit down and work out a way to test hypothesis on a broad scale because we operate under a different set of mandates, we operate under a different set of requirements, of laws. The problem is that we have a landscape scale problem. Until we start to break some of those walls down, we aren’t going to be able to implement the learning experiments that we need to do.
Craig Partridge: So someone in Boston has a right to care about an acre of National Forest land, but not the acre of state or private land next door to it in the same landscape. That’s the nature of the barrier we run up against.
Doug Ryan: If we are going to get a chance to take advantage of where the science is leading us, one of the things we’ve got to face up to is that it is telling us that extreme events provide a lot of positive benefits – in fact, they provide the long term habitat that fish need to be sustainable. One of the tough things we are going to have to get over is the public perception of extreme events. If you look at the media and see the coverage we get if there is a flood or a wildfire, I’ll bet over 90 percent of it is negative. It’s either the devastation or the cleanup of the devastation. We are finally getting a little good media on fires where you actually hear, occasionally, that there are positive benefits of fire. We hardly ever hear anything like that for aquatic systems. That may be critical, if we are ever going to get the public to accept the fact that we are actually managing
116
GENERAL TECHNICAL REPORT PNW-GTR-830
it to make extreme events a positive thing in terms of fish production and sustainability.
Craig Partridge: Can you think of any ways to make headway there?
Doug Ryan: Yes-as scientists we can do studies of what those effects are for extreme events and how they play out over the long term for fish habitat. Another one is the communications efforts: when there are these big events, ensure that there is a message put out that over the long run our fish need these events. Yes, we have to deal with short term negative con-sequences, but we also need the long term positive consequences.
Craig Partridge: On fire, it’s been a painful process; in the forest health and fire policy arena we have to be very careful that we say ‘uncharacteristic fire’ or ‘unnaturally large fire’-and people are still not neces-sarily hearing it. I think it’s really an excellent point —it’s a big request.
Doug Ryan: This is really important in the policy arena because the public has to be prepared for these things.
George Ice: It seems as if we are always looking for the wooden stake to drive into the heart of the questions we are looking at-I think there are so many different approaches to these questions, whether it be modeling, whether it be paired watershed studies. As many of you know we are involved in a watershed research cooperative. The idea is to have replica-tion; science is about testing hypothesis and having reproducible results-so that you have patterns that are not unique to one watershed, but are found in multiple watersheds. That’s really at the heart of the watershed research cooperative in Oregon – to test and replicate in the watersheds. Also to replicate in time; in the Alsea Watershed where we can look at past practices and look at current practices and look over
a long period of time to see those responses. We had an experience where we had a tour by representatives of EPA to Hinkle Creek several months ago. They presented one of the challenges we have in developing these types of studies. When they looked at the study design they said: you are testing the Oregon Forest Practices Rules for headwater streams but how about testing some other approaches; leave certain buffer widths along some streams and don’t leave buffers on others? We thought about that, but that would have reduced our statistical power. It would reduce our abil-ity to have replication, which would have made it more difficult to say something about the results.
So we are faced with this problem of replication, and I think this may get back to some of our earlier discussions about burden of proof. How accurate do we need to be in key questions? Which ones do we need to be really focused and accurate about and which can we be plus or minus 100 percent in our response and still have a favorable result for habitat and water quality. Those are some of my ideas.
Craig Partridge: In my experience scientists who are in the business of generating truth—to them 95 percent confidence seems reasonable—would be aghast at the confidence level that’s acceptable to policy makers. For policy, the preponderance of the evidence works, rather than “beyond all reasonable doubt”.
Lee Benda: I want to comment about the paired land-scape studies, which I completely agree with Kate on. I also want to throw a pitch in for the idea that if you use these tools in a systematic way in one landscape like the Olympics and that you have similar tools and similar databases across the region you have the ability to go into the Coast Range of Oregon or Look Out Creek or the Wenatchee where all these studies have been done and it’s called “Comparative Analysis” of a style that no one has been able to do before because there has been no uniform set of tools, parameters or
117
Riparian Adaptive Mangement Symposium: A Conversation between Scientists and Managers
databases. You can look at the debris flow potential here in the Olympics and you can contrast it with the Oregon Coast Range, or the Fred Swanson’s Look Out Creek study. The ability to learn how these land-scapes are different is critical. You can leverage Fred Swanson’s study of earth flows and Gordie’s study of debris flows and the study of huge sediment loads in the Redwoods. Through the Comparative Analysis approach, your ability to understand this landscape is going to skyrocket. And the principles you attain in one region can be extrapolated to other places. But unless you have the system in place that allows you to grab Redwood or grab Lookout or grab Knowles Creek and run a model here and look at model results for the Olympics, you are not going to make progress. It is an amazingly powerful situation to leverage knowledge that has been generated in the last 50 years.
Craig Partridge: Are you suggesting synthesis studies in ways that haven’t been done?
Lee Benda: Yes. The other thing with regard to public education; I completely agree with the comments. In these tools that we built, we actually have a movie generator because the tools are deterministic, they don’t do stochastics. However there are movies in there of fire, landslides, woody debris, sediment routing-you could take that and even go further in a way the public might get access to in order to get that educational message across. I think people are receptive because they see it every day on the Weather Channel.
My last comment-I don’t know much about this experimental forest (Olympic Experimental State Forest) or this facility (Olympic Natural Resources Center), but this facility might have a large oppor-tunity to become a learning center where you could bring people in, even from different landscapes and from different agencies operating with a similar set of tools and analysis basis. There is enough coverage now across the region where there is a large amount
of people who would potentially show up to a learning situation. Also, they would contribute by leaving their own landscapes-the idea of comparative landscape analysis is totally new, only because there are no tools. Scientists sit on one landscape; they spend their career in one place, one region. If you drag them somewhere else, they are hard pressed to do something there because they see everything through a lens of 30 years of research in the Cascades of Oregon or Coast Range. I’m guilty myself. But you can break those barriers down. I think you can even drag in policy people.
John Calhoun: ONRC as a learning center; it is part of our mission, but it really needs to be coupled with the Olympic Experimental State Forest to achieve maximum effectiveness. I think that’s what you meant: the Center and the Experimental Forest to function as a learning center. There is a tremendous opportu-nity here and a lot of the barriers that we’ve talked about—watershed scale ownership, regulatory con-straints—that keep us from implementing some of the things we feel are desirable are already addressed with the DNR’s HCP situation on the OESF. Fifteen years ago, when Craig Partridge was working on the OESF plan and I was working on the DNR HCP, we col-laborated and integrated into existing policy some key principles here. We explicitly recognized a dynamic natural system at work here in our conservation and research plan; we explicitly understood that it was disturbance recovery ecology that was the focus of our interest; we explicitly said we were going to manage on a landscape scale rather than a reach by reach scale; we explicitly said we were going to use active manage-ment to achieve conservation and restoration goals. And we achieved a regulatory flexibility in managing riparian areas apart from the normal set of regulations both on state and federal lands. It just seems to me that this is what encouraged us to bring you all together here, to help us take the next steps because DNR is at
118
GENERAL TECHNICAL REPORT PNW-GTR-830
that point where they are going to be making commit-ments to the approach to their research plan for ripar-ian areas and the remainder of the forest as well. There is a tremendous opportunity here to do that and DNR is willing to do that; they cannot do it all at once-they have constraints of capacity and funding. But they don’t have to do it all at once; they can sketch out their intentions and vision and aspiration. That is what we are here to help them do.
Craig Partridge: So, not to the exclusion of cross-boundary studies, or not to the exclusion of cross-region synthesis, but any thoughts in response to John about what we might be able to do on a large single ownership where we have fifteen years ago addressed some of those barriers.
Steve Stinson: I think Gretchen and John have hit on some things, particularly when we get to this land-scape approach. I think the missing component, and a difficult component to include, has been the Family Forest landowner component. On private lands here on Washington State, that is roughly half of the acreage. If you were going to overlay your biological hotspots, key Coho areas etc., I’m sure you would come up with some pretty interesting information. In this state we now have the capacity to do that; we have spatially explicit dataset of forestland ownership in this state, actually all ownerships in this state. I’m looking at this as a pretty unique opportunity from the Family Forest landowner perspective.
Is there going to be an opportunity to follow up? Can we identify short-term analysis that can be implemented with these tools that have been identified, and the idea of meeting again to further the effort? I like the idea of having a clearing house of knowledge that’s relevant to policy and science. I think the first step in that is to develop the key questions that need to be addressed – we’ve done half of that within the capacity of this group over the past couple of days. I
think that following up with this group of people or an expanded set including some policy makers would be an excellent idea. I’m willing to put whatever scarce resources Family Forest landowners have in support of that effort, John.
Mark Teply: I want to follow up on the comment about OESF as the area to do landscape investiga-tions. I think there is value in looking at, not only the lands we manage, but also the lands that are managed over the entire Olympic Peninsula because from our perspective, the pattern of our ownership varies as you go north to south, east to west. How we may view a landscape strategy is going to change whether we are in the Dickey or in the Clearwater. That’s another pitch for looking at landscape level approach; that kind of collaboration needs to be looked at as well.
Rhett Jackson: Right after Forest and Fish came out, I heard Pete Heidi say at a conference that what we had essentially done was come up with one working hypothesis and then ran with it across the whole state. I think, to me, that has been a continuing frustration. At the time Forest and Fish came out, we really had not done a lot of studies on headwater streams themselves. We basically made some guesses about refugia, some guesses about temperature and then we just applied them. One thing I’m frustrated about is that I think we need to be going forward with several sets of working hypotheses on buffer and riparian management. For example, maybe we shouldn’t be putting linear buffers on non fish bearing streams that are likely to blow down. Maybe we should be creating some gaps on the smaller fish bearing streams to increase primary productivity locally. I like the experimental forest idea here, that you can do some of these things and try them out but I’m frustrated that the Forest Service isn’t doing this, that the DNR can’t do this elsewhere. I respect that the private landowners want to be left alone and have some regulatory certainty for awhile;
119
Riparian Adaptive Mangement Symposium: A Conversation between Scientists and Managers
maybe we shouldn’t pick on them. But we need to be trying out some other things and see how they work.Craig Partridge: I want to pose a similar question you might be thinking about: What is the baby you don’t want to throw out with the bathwater? What do we need to keep?
Gordon Reeves: In response to Rhett’s comment-one thing you may want to look at is Bernard Borman’s Five Rivers study where a whole host of treatments were tried. Unfortunately, none were riparian because we couldn’t get away from regulatory agencies to do anything different in riparian areas. There were more upslope treatments, but there’s a good model out there. I have to say a red flag went up in my mind with this meeting and it’s dealing with the science. I heard today, that if the science doesn’t agree with my view-point, I don’t have to accept it. What I want to know is, if we are going to conduct science and it’s not going to fit into somebody’s biases, is it going to be acceptable? Why would I want to be involved in it, invest time and energy, into designing an experiment, conducting the studies, putting the results out there only to have someone say ‘You know what-it doesn’t fit my bias so I don’t care.’
Craig Partridge: Well, and the “someone” might be the general public, as A.J. pointed out earlier.
Kathy O’Halloran: Talking about change, I think some of the things that have been talked about here today – we touched on the idea that there may be some fundamental need to go back and look at the Clean Water Act, and there may be a need to look at some of the premises of the Endangered Species Act-these are fundamental acts that are near and dear to probably everyone’s heart in this room and certainly to the pub-lic. When you are talking about making fundamental changes, you have to expect to have that idea treated roughly. I’m heartened that some of these things are being talked about. Frankly, there seems to be such a
difference of thoughts floating around the room right now-Pete you talked about how after some of the meetings with the tribes and DNR, everybody had different perceptions-I bet you if everyone of us was out in the parking lot right now, we’d each have a dif-ferent perception of what was said in here. The thing that I think is good is that there were some ideas that were brought forward and I think that this could be the beginning of some kind of changes. I don’t know what it’s going to mean, which way it’s going to go. But it is these kinds of discussions that have to occur in lots of different forums, before there is ever going to be any kind of change. The thing that keeps screaming out to me at this whole conference is cultural, there’s got to be some kind of cultural change within agencies and within the public. That only happens through multiple discussions and having the ideas chewed on for awhile.
Dave Heller: If you get a good science finding and it’s relevant and timely, it ends up getting into policy one way or the other. It may end up being a lawsuit for it to be incorporated, or somebody on a local level starting to apply it and we look at it and go, “wow”. There are a lot of good examples; I think back to large wood. That was not very convenient, certainly for the Forest Service. We got loggers out there with rakes sweeping up needles in a creek, and now we are talking about dumping trees back in. I think good science that’s relevant is going to happen. I think there are enough people that care about what is going on that it will find its way into policy.
Craig Partridge: And as we said before, policy change is slow except when it’s fast.
Gretchen Nicholas: I don’t think we said we weren’t ready to implement scientific findings, but there are a couple of factors that need to be considered. One is cultural readiness, which A.J. brought up. The other is funding to implement any given thing; of course we are going to prioritize what we implement at any given
120
GENERAL TECHNICAL REPORT PNW-GTR-830
time. Finally, one data point probably isn’t adequate to make a change. We’ve talked about replicates and how much you can extrapolate the data to another place, whether or not it’s repeatable. In the case of the alder study I was talking about, that was one of my concerns because it was extrapolated pretty broadly. It was a very good study but it needed to be expanded.
Doug Ryan: I’m going to get back to the public perception question. We actually had a major shift in public perception occur in the last two years; primarily having to do with climate change. What happened? I can remember inviting George Woodwell to talk about it thirty years ago. All he had was one dataset, which was Co2 on Mauna Loa. No one is going to listen to that. It was like the one data point analogy. So what’s happened recently? Well, six years ago the IPCC rated their confidence in their global climate models at about 70 percent. They came out with another report a year ago, five years later, saying they had over 90 percent confidence-that made a big difference to policy mak-ers. That was the stamp of scientific credibility. The reason I bring this up is we are talking about large scale landscape experiments, which are going to be very difficult to either replicate or even validate in a lot of ways. We are going to be dependent on models. Not all that different from climate change work. We ought to be thinking about what it took to get the credibility in this last go-around that the IPCC did. A lot of it was, five years ago they said-‘Where are the big uncertainties in the modeling effort?’-And they put a huge amount of effort into running those things into the ground. And that is what got the scientific community to finally increase their level of confidence in it. I’d suggest that we need to consider that kind of approach as we go out into these bigger landscapes and bigger issue. Otherwise, we are going to get all the way back to that paired watershed debate.
Kate Sullivan: I’d like to follow up on that comment. We are going to get very excited about models; they are going to be very sexy looking; the computer tools are great. But we have, as a scientific profession, had to be very disciplined about working and testing those models. At the same time, we’ve had discussions today about how we don’t have money to spend looking at anything in the environment, but we are going to ‘model it’…so, as a person who has been involved with modeling, you have to work it real hard so the public can gain some confidence in it. We are going to have to spend some money looking at the landscape for real.
Bruce Rieman: I want to follow up on two things. We had a discussion yesterday about the models and adding complexity and details to the models and there is clearly a point of diminishing returns; you are overwhelmed by complexity very quickly. How far you can go with that is a serious science question – something that needs to be explored. The other thing that Craig brought up about throwing out the baby with the bath water: these ideas have been around for quite awhile. Gordie’s paper was in ’95, the first stuff that was commonly out for discussion by people in the For-est Service was before that. There have been literally hundreds of papers that have responded to it, tried to take it apart, looked at it in different ways; it’s become a very influential idea. It’s very strong in the scientific community.
The application of it still has a long way to go. It’s not just experiments, but thinking all of it through. I’m concerned a little bit that some of the appeal of watershed scale approaches comes across with this simplicity of, and the assumption that there are a few key places we can really limit where we apply protec-tion and have a big impact on the system. The problem with that is biological systems are more complicated than that. It isn’t just biological hotspots; it isn’t just these critical ‘nick points’ or something like that-but
121
Riparian Adaptive Mangement Symposium: A Conversation between Scientists and Managers
species like salmon use networks of habitats. You have to assemble those; there is a biological scale issue that has not been addressed very well yet. There are a lot of biological complexities here and some missing pieces that the biologists and the science still have to explore. I think the idea of that going hand in hand with man-agement, rather than waiting another fifteen years to resolve all that – moving through it together – is a powerful idea that needs some further exploration.
Ken Cummins: I’d like to quote one of Donald Rumsfeld mystery statements: ‘There are things we know and things we don’t know, things we know we don’t know, and there are things we don’t know we don’t know.’ As an example, a water quality issue: Nationally the EPA set up a special study because they were concerned about vulnerability of certain areas to environmental change. They felt it would be easy; they had a database that weights every county in the lower 48 relative to compliance with the ’72 Clean Water Act. They also used the National Heritage Map of Bio-diversity and the USFW Map of Endangered Species. They expected to look at the counties in compliance to see if it’s really working… there was no correla-tion whatsoever. Either we don’t have very good data on biodiversity or endangered species or the things that get you qualified for being in compliance with the Water Quality Act are not in any way related to biodiversity in Endangered Species. The other possibil-ity that Lee brought up is that if the resolution scale is at the county level, it only takes one bad stream in the county to rate it as out of compliance for that county. Again, we are right on back to the scale issue. I think the things ‘we don’t know, we don’t know’ – that is where a lot of really good science happens. The polio vaccine can be traced directly to two guys working on viruses of tobacco plants. Who’s going to predict that?
The last thing, the one thing that is discouraging is that if it’s really true that the public can’t be sold on
the right idea with the appropriate delivery – if that is really the answer, it’s very discouraging. I believe thor-oughly, that if you have a logical argument and present it correctly, that they’ll get it. The climate change thing is a really good example. I wouldn’t downplay at all Al Gore’s role in that because I think it is a major role with the public.
The thing I think we should take away is that public health example that Gordie had; I can’t imagine a group anyplace that could not grasp that idea. You could have spots that don’t crash the whole system no matter what scale you are at. I think there’s hope out there – I’d like to be optimistic. I’m still trying to get over the alder problem.
Pete Bisson: The example that Doug brought up about climate change and it’s acceptability to the public is an excellent example in this context. Gordie made the point that maybe one of the strongest tools we have to test some of the ideas that we are thinking about in terms of protecting aquatic resources and manag-ing riparian zones is modeling. That’s true, and what Kate said is true also: we need to be very careful and judicious with our use and application of models. But if you don’t do monitoring to test those models then you get into public credibility difficulties, because it’s just a bunch of scientists playing games and there is no data to back it up. What’s missing from our current pro-grams: monitoring. What’s the most expensive part of our programs: monitoring. My guess is that to get the kind of budget we need to do the kind of monitoring to answer the big picture questions that we are asking is going to take top-down pressure. It took the guy in the White House coming to Portland in ’93 to provoke the kind of effort it took to develop and implement the Northwest Forest Plan and the monitoring system that followed from that. I think it’s going to take the same kind of top down pressure; I don’t think you can get support for monitoring from the bottom up. We
122
GENERAL TECHNICAL REPORT PNW-GTR-830
can argue till the cow comes home that we need more monitoring, but until we sell that idea to the folks at the top, I don’t think it’s going to happen.
Craig Partridge: There has been a big debate con-necting the confidence level to the dollar. As long as the monitoring systems are set up to provide the 95 percent confidence that is important for produc-ing knowledge, it’s going to have hard times. But if you can accept a 75–80 percent confidence as good enough for a monitoring system, it costs a heck of a lot less and it’s a little bit more acceptable.
Pete Bisson: We should also be thinking about what we monitor. Maybe the scientists haven’t done enough thinking about developing the kind of coarse scale metrics that are really useful at these larger scales.
Gordon Reeves: I think one of the problems we are talking about here is replication and the confidence we can put into the results. But that is not just a public issue; that is a scientific issue because we are dealing with a scientific paradigm based on controlled experi-ments and other stuff and we can do the replication. If you look in the literature you will find all kinds of struggles dealing with landscapes, dealing with watersheds; they conclude that you simply can’t do it. Trying to gain credibility for that type of effort is very difficult. I think it is just not a policy issue. For the policy makers to be asking how much confidence can you give me is problematic; we are never going to get there because we are dealing with questions that can’t be replicated. We’ve got a landscape we are not going to find anywhere else-I don’t care where we go --we aren’t going to find it.
Craig Partridge: Maybe we need new models of confidence building?
Gordon Reeves: Partly, again, it’s an education pro-cess. It’s conveying to policy makers and to the public that the issues we are dealing with don’t conform to a
scientific method. I think it is really important that we bring these dilemmas to the surface not only for policy makers but in the scientific arena. One other thing I have to relay about trying to sell this whole idea: after the ’96 storm I was asked to testify before the Oregon Board of Forestry about landslides. But just before me was a lady who was testifying about watching her husband get washed out of his chair in his living room and going down the Umpqua River. So I get up there and they say ‘OK Dr. Reeves, what do you think about landslides?’ and this lady is sitting right behind me as I mumble ‘they’re OK’. It’s not a comfortable position to be in with the public perceptions the way they are.
Harry Bell: A while ago, John Calhoun asked what ONRC might do. What I’ve also heard from folks is this whole riparian strategy thing; one size fits all doesn’t make sense. One of the things I think John may be able to do is start to establish a track record of alternate plans that are done on the landscape so we can start to take advantage of what we very con-sciously built in both TFW and Forest and Fish, which was the element of alternate plan process on private lands, which we haven’t really taken advantage of. That might by an example of an operational thing we could do.
I have another broader question that has to do with the role of scientists and policy people in character-izing risk, and also communicating that risk between them: What role should each of the two groups of people-scientists versus policy people-play in looking at, characterizing and assessing risk and dealing with it in policy form?
Craig Partridge: Who would like to respond to either of Harry’s comments, either the use of the alternate plans under the Washington State Forest Practices system, or this broader question about the roles of scientists and policy makers in communicating risk to the public?
123
Riparian Adaptive Mangement Symposium: A Conversation between Scientists and Managers
Steve Stinson: We actually have legislation passed in 1999, House Bill 2091, that directs DNR to address the cumulative effects and monitor alternate plans at the watershed scale. If we have any collaborative clout amongst us, we might suggest that they do what the legislation told them to do.
Gretchen Nicholas: Our scientists at DNR have come up with a very good method of characterizing risk when it comes to geological landforms and it is a pretty simple matrix. Basically, when they are assess-ing potentially unstable landforms, they have on one axis, the risk of failure (which is High, Medium, or Low) and on the other axis the risk to public resources. Of course, back to the person Gordie was talking about that got landslide damage to their house, if there is even a small risk of a landslide going through some-one’s house obviously we are going to be way more cautious. That is a really good example of a scientist using a mechanism to guide and characterize how decisions are made internally.
Craig Partridge: That is a good example of classic risk assessment-a combination of probability and impact.
Jim Peters: On the policy side, it is something similar. If I’m looking at a watershed that is in a depressed condition, I don’t want a whole lot of risk in that sce-nario. If it is in pretty good condition, then I’m more willing to have more risk. You just can’t do it across the board; you have to look at all the factors that are involved – what do the scientists say, what conditions are you trying to protect or rebuild.
Craig Partridge: Let me pose this more sharply-Har-ry’s question about what are the roles of scientists and policymakers, combined with that earlier realization that nothing gets them into their trenches faster than different viewpoints on risk. So if you are starting out with diverse viewpoints on the acceptability of differ-
ent levels of risk-what’s the public going to do?Unidentified Speaker: My comment is that science can articulate the nature of the risk, maybe the severity and duration. I think that at the policy level, you have to apply that risk to the management objectives that will be affected. They are not all equal.
Craig Partridge: So not all slides are created equal – it depends on what they are sliding into-and where they are sliding. The vulnerability can be a human vulnerability; it can also be a particularly vulnerable watershed because a fish stock is depressed.
Pete Heide: A little story that has to do about risk, it has to do with water typing under the Forest and Fish Agreement. We had gotten an agreement to do a modeled approach to water typing so the state could create a map which would tell everybody where there fish waters were. Then everybody could conduct their forest practices accordingly. Scientists would study the map over time and maybe make some periodic changes. It’s a good idea, not done yet, but the policy folks said, ‘OK, we want this map to be correct 95 per-cent of the time. And we want the risk of error shared equally above and below, so that if there is an error above, it will be balanced by a similar error below someplace else. It sounded good in a policy discussion and everybody positively agreed with that. Scientists went out, spent somewhere in the area of $2,000,000 with computers and modeling, brought the map out, and everybody uniformly hated it. The technical folks were not able to understand what ‘correct 95 percent of the time’ or ‘sharing the risk 5 percent over, 5 percent under’ really meant. I never understood why-but they kept telling me they couldn’t figure it out. The math was wrong in some places. Wherever it was wrong the people who owned the property or had an inter-est in the fish on the property were very vocal about explaining where it was wrong and why they hated it. We had, what I think, was some pretty doggone good
124
GENERAL TECHNICAL REPORT PNW-GTR-830
science that went out and validated the model—at least in a pilot validation test—which indicated the model was working fairly well. But since everybody hated it, nobody wanted to spend the money to do the full validation test. They wouldn’t accept the pilot, so they obviously wouldn’t accept the results that might come out of a full test.
Craig Partridge: So there are two things I draw from this; one is to recognize that models are always wrong and what do you do about that. And the second thing is, what I raised yesterday, the science is telling us that nature is variable, but society doesn’t want variable. They want uniformity; they want predictability for whatever their interest is. The challenge here is how to convey the ‘learn to love it’ around large scale variable natural processes.
John Calhoun: We came together to help DNR and others work on developing a research plan in support of adaptive management for riparian practices. I think we’ve provided a lot of information here. I want to sug-gest, from what we’ve learned, one path forward for DNR. I think one of the main things that came to my mind is that research and adaptive management is the classical way we have always dealt with uncertainty. We conduct research to try and develop better informa-tion for those areas we were uncertain about and then when we were satisfied with that, we incorporated the new information into our management practices. This is thinking from fifteen years ago. Now we understand we have the tools to do sophisticated modeling that in some ways can substitute for the basic research that we’ve been doing and really allow us to move forward in a more responsive way. One approach DNR could take to their riparian management practices is to set out to take a system scale approach based on the objec-tive of achieving watershed resiliency for the life of the HCP. They would look at the whole watershed systems; resilience is the objective and the timeframe is 50
to 80 years of the HCP. Identify the modeling tools and knowledge and techniques to develop alternative actions, approaches and treatments. Select one that we think meets our purposes, and then set out a long term monitoring program to try and validate the assump-tions in the models. I think DNR could do that on the Olympic Experimental State Forest. Through time they would be making a great contribution to riparian resource management. That is the kind of framework I think will help DNR to go forward-it might not be exactly the way, but it is an example of a way to go forward.
Kate Sullivan: Why not make a goal of productiv-ity a well as resiliency? Aquatic productivity of your watershed and resilience is a quality that you would like to maintain in your watershed, as opposed to just resilience? The whole goal in most of our HCPs is to help fish and wildlife get better-so why not set goals like that, but understanding that resilience in system disturbance will happen, and resilience is part of what you are trying to manage for, not just make that the goal. It’s a fuzzy, esoteric goal.
Craig Partridge: So productivity that goes up and down over time?
Kate Sullivan: Yes, you may have it 100 years; you may not have a huge event to be resilient from. I bet you our definitions of what an event is will change over time also.
Lee Benda: I want to comment to Pete Heidi’s descrip-tion of the modeling problem, which I think is a good example. I could raise a lot of examples too; for example let’s predict sediment transport of wood down from a landslide and see how it affects fish habitat. It can’t be done. There are so many complexities that you can’t actually model it precisely. Similarly you can’t model disturbance precisely. So in the example that Pete is using, it’s very likely that people are using models for the wrong thing. You would never use
125
Riparian Adaptive Mangement Symposium: A Conversation between Scientists and Managers
a model to precisely locate the end of fish bearing stream-that is fundamentally the wrong thing to do particularly at 10 meters and probably even at LIDAR scale. An analogy is: we run landslide and debris flow models, but you don’t then, take that result and say ‘Here is what you have to do’ at that specific point. A geologist goes out and evaluates the site and 50 percent it might be right and 50 percent it might be wrong. There might be other factors; for example, a landslide could have occurred two years ago and there is no soil there anymore. Or there are big cracks in the ground that you can’t see with LIDAR. We use it to screen large landscape differences and maybe one critical site per mile squared and another basin has five. If you were going to sell forestland, and someone was going to buy it, that is really an important difference. But to go to one landslide site and expect it to be predicted-no one has ever been able to predict a landslide. There is all the information you don’t have: in the fish bearing stream case there is no information on a three meter high waterfall. In a landslide case, there’s no informa-tion on soil duff. And there will never be information on soil duff, even if you LIDAR the heck out of it.
Residual tools and models really have to be condi-tioned by how you use them and the kind of informa-tion that you gain from them. If you start off with the wrong idea, right off the get-go, the whole thing is torpedoed. I would never do it that way and expect to find the end of fish or expect to find if this prediction says this is a landslide site and that is exactly what it is or it has a probability of .02 and that is reality; not at all.
I’ll make one more comment on this fish business: if you have a modeling system in place, not just for research, but for application, you anticipate making corrections continuously. So you go to the end of fish bearing stream and you find out that you are 200 meters off, you just go into the model and you change
it. Or someone says ‘I have a better DEM or a better analysis of where that is’; you immediately unplug one module and you plug it back in. These things have to be able to grow and live over time. It’s not a fixed system.
Craig Partridge: I want to ask the panelists if any of them have questions of the audience.
Steve Wondzell: I’ve been sitting here for the bet-ter part of two days listening about lots of different viewpoints and opinions and things and when I sit and listen for a long time, little things get stuck in the back of my head and wake me up in the middle of the night and I lay there and think about them. And the one that I’ve been thinking a lot about is kind of a sense of patience that maybe we should bring to these questions. It strikes me that we’ve only embarked on the strategies we’re talking about over the last two days, in the last ten or maybe twenty years. We are talking about systems. I think George Ice threw out that the high point in the mature forest is 140 years; if we’ve got ten or twenty years of the current strategy under our belt, we are only 10 percent of the way of recovering to 140 years. I’ve heard the statement that the science is way ahead of the policy but I wonder: can science even tell us if the strategies implemented in the Northwest Forest Plan are going to be success-ful in meeting their objectives? Gordie just recently published a ten year look-back. We saw some changes, but are they going to get to the objectives that we are looking for?
This whole meeting is about trying to rewrite the game plan, to say that we’ve learned stuff and can do things better; it’s true, we have learned stuff. And it’s true, science is out there and maybe it is ahead of policy. But it’s not necessary ahead of policy in know-ing the answers. It’s just ahead of policy in knowing better questions. It seems we need to approach what we are talking about here with a lot of patience. I don’t
126
GENERAL TECHNICAL REPORT PNW-GTR-830
know exactly how you translate that into something practical-I think we all want to do a better job at the things we are already doing-as a scientist it is always fun to be out at the forefront with new ideas, but at some point you have to slow down and wait for the natural systems to catch up with us.
George Ice: What I am trying to get at is this notion of this 140 year thing. I think we heard in spades yes-terday the systems are dynamic; 140 years is just one point in time. For some reason there is a magic concept for some people that it is some optimal thing. I seri-ously question that it is not-there is no science to sug-gest that is optimal for anything other than some small association of organism or whatever. And there are a whole bunch of conditions that are more optimal that we know as scientists if you want to just manage for fish. I would challenge the notion; I actually challenge the relevance of the question of Desired Future Condi-tion. There is a desired future condition concept: what does that imply? Does that imply that you know the desired condition, and yet at the same time, scientists know there is this huge variability in time and space and it’s constantly changing? So are we managing for some desired condition that is only going to be there for some short period of time? Are we going to push to that, when if fact, that doesn’t exist everywhere? I think I hear from Gordie that only 30–60 percent of the time (this is only a rough estimate) do you expect all of the watersheds in some large landscapes to be in that condition. Is there some assumption there that those are the ones supporting the fish, only that 30–60 percent? I’m just throwing this out-what about the 40–70 percent that is in the LDC-less desired condi-tion. These concepts are rummaging around in my head. We have to be careful about those kinds of ter-minologies; they mean things to different people, yet here we are talking about all this variability over time. I don’t know that we are managing for a condition-I
think we talked about managing for processes that we might consider favorable or desirable.
Craig Partridge: Which come from variable condi-tions?
George Ice: Yes
Gretchen Nicholas: Is there a way to do validation monitoring that is reasonably priced, gets decently quick results and is reasonably valid? I’m thinking of validation monitoring of salmonids in streams as a result of whatever strategies we select.
Mark Teply: To put that question in context, in the DNR HCP, one of the obligations that we have is to do validation monitoring on salmonids and on spotted owls, both in the OESF-it is a very relevant question for us.
Unidentified Speaker: I’m going to answer your ques-tion with a question back-my question to you is what is reasonable? What is considered reasonably valid from your standpoint?
Gretchen Nicholas: Reasonably valid is something that is determined by scientists. Gordie is telling me I really can’t expect to meet all the traditional criteria of validity, like repeatability and replication in experi-ments like these. I would have to rely on the scientific community to say a conclusion makes reasonable sense given what we know about salmon life dynam-ics. Quick results-I’m told twenty years for any kind of validation monitoring, so I believe that is probably true but something quicker than that would be nice. With regard to reasonably priced-something in the realm of $500,000 a year or less.
Pete Bisson: I’ll go back to an old story. When I was 28–29 years old, a graduate student at Oregon State, there was a meeting I attended where we were talk-ing about long term monitoring. One of the attendees at that meeting was Ken Cummins. Ken had written a paper that we all loved to cite, because it was an
127
Riparian Adaptive Mangement Symposium: A Conversation between Scientists and Managers
important theoretical paper that conceptualized what was going on at the time. The topic of discussion at this meeting at OSU was how long it would take to answer certain questions-we were kicking around the idea of twenty to thirty years or so. And Ken made a comment that if we’d started ten years ago, we’d be half to a third of the way there already. And yet nobody wants to get on the train and start. Somebody has to start, it’s kind of scary, but somebody has to start answering the questions. It’s going to slop over to the next scientific generation-but you still have to get on the train.
Gretchen Nicholas: That is what we did with the Stand Management Cooperative. So I’ll take twenty years-but who is bidding $500,000 or less?
Lee Benda: Maybe fish is the ultimate thing you would monitor and I can’t speak to that but from a physical point of view, if you had forest that were cut and the logs had been yanked out of the stream and you write on the back of the envelope a simple, little wood input budget related to tree growth-you shouldn’t have any response in that stream, with pool develop-ment for maybe 100 years. So when you say twenty years-that’s problematic.
The other thing is, regarding the value of a model, some have constructed stochastic models. There are no fish, but there is sediment being thrown down-it’s a very messy signal downstream, even though it is certainly just a simplification of nature. But you have a stochastic fire storm sequence based on the empiri-cal record, you’ve got thousands of landslide sites and debris flows in this kind of country, they are triggering off at various rates then they sit there for fifty years before they move again. They’re behind a log jam. Of course you are sitting at the bottom of the watershed monitoring someone making a clear cut up there or over here, and if you were to put this in a state-of-the-art stochastic model, you’d find out quickly that it
would be virtually impossible to sort out these issues of what was causing what, unless maybe you clear cut the entire thing like they did in Alsea and then they burned it. That was a small watershed and they stood at the bottom and measured outputs. This problem was recently laid out by Lee Macdonald and Drew Coe in a paper in 2007 and Lee Macdonald is one of the czars of cumulative effects. He’s spent his entire career thinking about his problem-he’s recently come out and said you can’t do the problem. You can’t walk to the bottom of the stream and start measuring stuff because there are thousands of these lag times and sites for erosion (he’s talking more erosion in this case). Monitoring is going to deal with physical geomorphic properties.
I actually think that the idea of monitoring is a paradigm linked to a non-dynamic system, particularly when it involves stream systems. I’m not speaking biologically because I don’t know anything about that, but monitoring is a paradigm. It has become a para-digm unto itself even though it is completely in avoid-ance of the whole dynamical nature of the system. A gross example: without understanding the landscape, people will put a monitoring site in actually the wrong location. They’ll stick it right by a tributary junction. At tributary junctions, even in natural system (I’m not even talking about debris flows now), all kinds of stuff happens there. So they put it in and want to measure stability of the gravel bed. In fact, they picked a point in the network that is the most unstable point. What you are going to see are the most fluctuations, even naturally, right there. I would say we are ill equipped, even to engage monitoring, particularly at this holistic watershed scale; you should go right to the point. Kate’s previous years identified this – you go to the point. Lee Macdonald said this in the 2007 paper. If you are worried about roads or particular clear cuts, you go there. You then try to measure something there
128
GENERAL TECHNICAL REPORT PNW-GTR-830
which you have a reasonable shot at, and then maybe extrapolate across the network.
I do think monitoring in many ways is a child of this non-dynamic watershed approach. If you had a dynamic watershed approach with simulations and movies running, I think you’d design it quite differ-ently.
Craig Partridge: Is this modeling versus monitoring?
Lee Benda: Modeling is a crude instrument-I totally admit that-you would probably design expectations and monitoring approaches quite differently now. Maybe some of the people in this room certainly get that. But there is a huge army of technicians out there monitor-ing and it is a complete waste of time and money.
Rhett Jackson: Lee is one of the most brilliant people I know; I’ve learned more from him than just about any of my colleagues, but I completely disagree with him on this. I think he is right in terms of sediment, that the time scale is wrong for the monitoring. But I think he’s wrong in terms of extrapolating that to fish. I’ll give you a simple example: Svante Arrhenius predicted climate change by simple model in 1896, but no one paid any attention till the monitoring of CO2 on Mauna Loa. I think you can actually learn a lot by monitoring smolts. I’m going to leave it to the fish biologists, but I think there are really good cases for monitoring that don’t imply stationary. So extrapolat-ing the problems of monitoring sediment dynamics to monitoring fish is erroneous.
Gordon Reeves: First of all, Lee doesn’t know one end of a fish from the other and I can testify to that. But just an observation for monitoring; I think one of the things, again, is we are going to have to think outside the box. We’ve been involved with two long term monitoring efforts. We monitored smolt production from the Clackamas River-Fish Creek in particular-where a major restoration occurred, for over twenty years in order to say what happened with
the restoration effort. Two things happened: with Steelhead we couldn’t show numbers changed, but the size of the fish increased. But that didn’t count. What was counted was the number of fish that went up. The other thing is the patterns involved here. In Elk River for example, you can see different life history patterns from the smolt records. We were asking about life history diversity-other ways of measuring impacts or successes of activities other than the numbers game. One of the things to keep in mind is we can look for other ways of doing monitoring to get beyond some of the problems that we’ve faced here. But again, we have to articulate those expectations up front, not after the fact. Oftentimes I think with these monitoring programs we start with no idea of what we are going to do. We get results and puzzle over how to explain them. There are some ways we can look into this that would get beyond some of the traditional things. I think there are some real valuable things about the fish that come back, the adults. Those are the ones we want to look at. We count the carcasses, but there is a record there that is invaluable that we have ignored for years and that’s called the otolith-a daily record of what that fish did. If we can start to look at the life history patterns of the fish that were successful we could gain some valuable insights. That is all going back into the system and starting all over again. That small little bone could be really invaluable.
Kate Sullivan: Like Rhett, I like what Lee is working on, but I disagree with his comments here. I am in the position where I have an HCP which requires me to do watershed scale monitoring and we are doing it in earnest. I have about a 16,000 acre watershed and I have ten different water quality sites. We monitor the streams. This is about a $100,000 to $150,000 invest-ment to start and it costs around $150,000 per year. But the most important thing we’ve invested in, that I say people really avoid doing, is we have constructed
129
Riparian Adaptive Mangement Symposium: A Conversation between Scientists and Managers
very detailed sediment budgets. We’ve inventoried all of our roads. We have a whole road inventory that is about 50 pages long on every site that’s out there. We track their status as to what their current construction standard is as we upgrade our roads. We inventoried all of our landslides; we’ve walked our creeks. I’ve counted every piece of wood in the streams. I figure that is the best way to monitor. I send the staff up the stream for two miles and they count everything. We take photo points; we do lots of stuff. We’ve invested not just in the back end but in the front end. And we use that information in our daily management plans also as we go through sediment restoration, so we have a pretty tight loop. But I would say, in building that sediment budget, even though I fully understand what Lee is talking about in terms of the complexity of sediment, it’s remarkable how the sediment going out of the watershed matches what we estimate is going in. I’m surprised how close it is at times, and I don’t think some of the particular streams I’m talking about are that much different than some of the ones I’ve measured here in Washington. I think it can be done. It is taking time. One of the biggest challenges is sorting out, in time, the natural variability in the climate and that has a lot to do with how much sedi-ment goes by a watershed every day. Temperature is much nicer to monitor-you can put that story together pretty quick and with some well set hypotheses you can nail that down pretty quickly I think. Sediment is a trickier problem, but it can be done. We are six to ten years into that but just looking at the annual variability is the more frustrating part and trying to sort out a signal within a lot of natural variability’s is the biggest problem.
George Ice: To support the power of real measure-ments – this is a story about California’s Mattole Watershed where there were accusations that acceler-ated harvesting of forests in the upper basin was
causing an increase in nitrate concentration resulting in eutrophication of the reservoir. A very rapid synop-tic survey of measurements throughout the basin was able to reveal that 90 percent of the nitrate was com-ing from a region below the timber harvest area – a geologic source. And so just going out and collecting some real data provided illumination to a problem and answered a real question.
Craig Partridge: Are there any other questions of the room from the panel?
Steve Stinson: Going back to the question: If scientific consensus is necessary-how do we achieve it? If it can’t be achieved, can you describe an alternative process that can move science forward in the presence of public opinion?
Gordon Reeves: Kelly Burnett in Oregon just went through a process-like a preponderance of evidence review. They were looking at the effect of wood placement in streams and the effect on fish. They went through and said-here are the ideas, here’s what we are using as criteria to evaluate the argument and they laid them out very clearly and then they looked at the papers and the assumptions behind the various papers. They did this incredible arrangement to come to a con-clusion, but it was all laid out-the ground rules for what was included, for how the assumptions were made-to me that gets away from perceived biases. Oregon Dept. of Forestry funded this effort and in fact I sent it down to the folks in California after our meeting last week-in order to avoid some of the problems raised at the Sacramento meeting. That is a model you might want to look at. I would encourage you to look at that as an example – they had both the pros and the cons. The criteria were laid out up front so you understood how the process works.
Steve Stinson: I’m interpreting that as scientific consensus is not necessary and that there is an alterna-tive process?
130
GENERAL TECHNICAL REPORT PNW-GTR-830
Gordon Reeves: Yes, we might agree on very general issues. But when the rubber hits the road and you get down to the ground, that’s when your consensus is going to break apart. That type of process helps people know the plus and minus, the bumps and the warts of all the stuff we’ve done and not done.
Rhett Jackson (addressing Steve): You are dealing with federal regulators right? They’re not really sci-entists, they are science users. Think about a FEMAT curve-what you are really talking about is applying some values to figure out what’s a marginal benefit of pushing the buffer a little bit farther versus the marginal cost of pushing the buffer a little bit farther. You, the landowner, are bearing the cost of pushing it farther-the federal government regulator doesn’t bear any cost, nor do they personally take any risk because they are so far removed from the political process. Whereas if you are dealing with a county level employee-the political feedback through the county commission back to that person is much tighter. The problem is that if you are dealing with NOAA-they don’t give a darn. There is no time cost, no risk cost, they’ll wait you out for fifty years.
A.J. Kroll: I want to make a pitch; it was interesting you brought up this MacDonald and Coe paper. I cited it a couple of months ago in a rebuttal manuscript I’m writing with some colleagues from Fish and Wildlife in Washington (the Washington Department of Fish and Wildlife) against this idea of how you can do monitoring and use correlative evidence to say we are going to manage physical features of the habitat and get a population response. I read that paper and thought, this isn’t looking good if you believe in Macdonald and Coe if you feel there is data sup-porting their argument-or again the preponderance of the evidence suggests that what these two people are arguing in this paper is true. One thing that can happen, is people should regularly support scientists
getting together and interacting in a critical fashion. Unfortunately, even in the time of my career (less than a decade) there has been a reduction in the amount of critical review that appears in the literature-scientists have gotten very lax in the criticism of others. I don’t know what causes that. There was a time in the 70’s—when you look back to the debate that the top ecologists had at that time—and the way they tore into each other in the best journals and they did it in a data driven process. You’ll be very hard pressed to find a corollary now. It’s either not permitted by reviewers and editors or there’s just a gentleman/gentlewoman agreement not to do that. Unfortunately, that stalls scientific progress. That is what science should be about-a rigorous selection of the best ideas supported by the best evidence. This better evidence will inform your management programs.
Gordon Reeves: We need to keep in mind, that once a fish has gone on the Endangered Species list, it has never come off. It only comes off when it goes extinct. We are fighting an uphill battle here if you are look-ing at the preponderance of evidence to show that we can do these things. I totally agree that there is some unreasonableness there, but if you step back and look at the record, it’s not a good one in terms of recovery. So if you are looking at the big picture, the evidence isn’t there to show that we can back away from scien-tific certainty.
Doug Ryan: I wanted to make a comment on the Cali-fornia review-it has a synthesis as well as a response to numerous questions. It was a good first step, unfortu-nately it was not completed in the context that it should have been—revised in light of the critical review. But there was a consensus that we were going in the right direction in terms of looking at spatially variable ripar-ian management and using different ways of analyzing these spatially variable watershed landscape scale processes. That is all in there and I invite you to look
131
Riparian Adaptive Mangement Symposium: A Conversation between Scientists and Managers
at that. But think cautiously, especially, I know my fellow scientists have no problem with tearing things apart or seeing the problems, but mainly the policy and management people will read this in that context. Read the introduction actually, because it gives the context of why it was created.
John Calhoun: What the planning team is going to do now is produce a report, we may do some sort of synthesis on this. If any of you have any lingering thoughts or statements that you want to make sure are included in this process just provide them to someone on the planning team.
Thank you all very much.
222
GENERAL TECHNICAL REPORT PNW-GTR-802
This page is intentionally left blank.
133
Riparian Adaptive Mangement Symposium: A Conversation between Scientists and Managers
Mark TeplyOESF HCP Research ManagerLand Management DivisionWashington State Department of Natural [email protected]
Steven WondzellResearch Riparian EcologistUSDA Forest ServicePNW Research StationOlympia Forestry Sciences [email protected]
135
Riparian Adaptive Mangement Symposium: A Conversation between Scientists and Managers
Kevin ZobristForest Stewardship EducatorWashington State UniversitySnohomish and Skagit County [email protected]
Pacific Northwest Research Station
Web site http://www.fs.fed.us/pnwTelephone (503) 808-2592Publication requests (503) 808-2138FAX (503) 808-2130E-mail [email protected] address Publications Distribution Pacific Northwest Research Station P.O. Box 3890 Portland, OR 97208-3890
138
GENERAL TECHNICAL REPORT PNW-GTR-830
U.S. Department of Agriculture Pacific Northwest Research Station 333 SW First Avenue P.O. Box 3890 Portland, OR 97208-3890