UNIVERSITY OF SOUTHERN QUEENSLAND FACULTY OF HEALTH, ENGINEERING AND SCIENCES SCHOOL OF AGRICULTURAL, COMPUTATIONAL AND ENVIRONMENTAL SCIENCES Riparian woodland condition in relation to lippia (Phyla canescens (Kunth) Greene) and fire management, southern Queensland A thesis submitted by Lucy M.E. Galea In partial fulfilment of the requirements for the degree of Bachelor of Science (Honours) Submitted: October 2014
Transcript
UNIVERSITY OF SOUTHERN QUEENSLAND
FACULTY OF HEALTH, ENGINEERING AND SCIENCES
SCHOOL OF AGRICULTURAL, COMPUTATIONAL AND ENVIRONMENTAL SCIENCES
Riparian woodland condition in relation to lippia (Phyla canescens (Kunth) Greene) and fire management,
southern Queensland
A thesis submitted by
Lucy M.E. Galea
In partial fulfilment of the requirements for the degree of Bachelor of Science (Honours)
Submitted: October 2014
i
ABSTRACT
The implementation of inappropriate management regimes encourages alien species invasion
into native ecosystems. Disturbances, such as fire, flooding and grazing, create a unique window
of opportunity for invasive species to colonise areas not previously invaded. Fire regimes can be
changed through the introduction of foreign species and may induce detrimental ecosystem
effects including increased tree mortality, an increase in bare ground and further invasion by
foreign species.
Phyla canescens (lippia) is an invasive introduced species covering over 5.3 million hectares of
the Murray-Darling Basin. Many potential control methods have been attempted. However, the
response of lippia to fire as a potential management tool has not previously been studied.
The general question of this research was: what is the effect of a prescribed fire on lippia, the
vegetation structural components and the soil seed bank of a vegetation remnant in a highly
modified agricultural landscape? This research examined the following specific hypotheses: that
there is no difference in the abundance of lippia between burnt and unburnt treatments, six
months after a prescribed burn; that there is no difference in the abundance of other vegetative
structural components between burnt and unburnt woodlands, six months after a prescribed burn;
that the fire has resulted in no change in the seedling emergence of lippia seeds stores in the soil
seed bank; and, that the fire has resulted in no change of pseudo-species (not taxonomically
identified species) richness within the seed bank.
Ten sites, (5 burnt, 5 unburnt) were sampled within each of the two woodlands: Eucalyptus
camaldulensis and Eucalyptus populnea, six months after a prescribed burn. At each site, a
500 m2 quadrat was established to determine general disturbance measures (using a 0–4 scoring
method) and the abundance and percentage cover of vegetative structural components. Within
each 500 m2 quadrat, the density of the following vegetative structural components were
ii
measured: trees > 20 m; trees 10–20 m; trees < 10 m; standing stags > 20 m; standing stags 10–
20 m; standing stags < 10 m; stumps; logs 6–13 cm; logs 13–35 cm; logs 35–90 cm; and logs
90–150 cm. The percent cover of each of the following vegetative structural components was
also measured: trees; stags; stumps; logs; grasses/sedges; herbs/forbs; lippia; lippia litter; fine
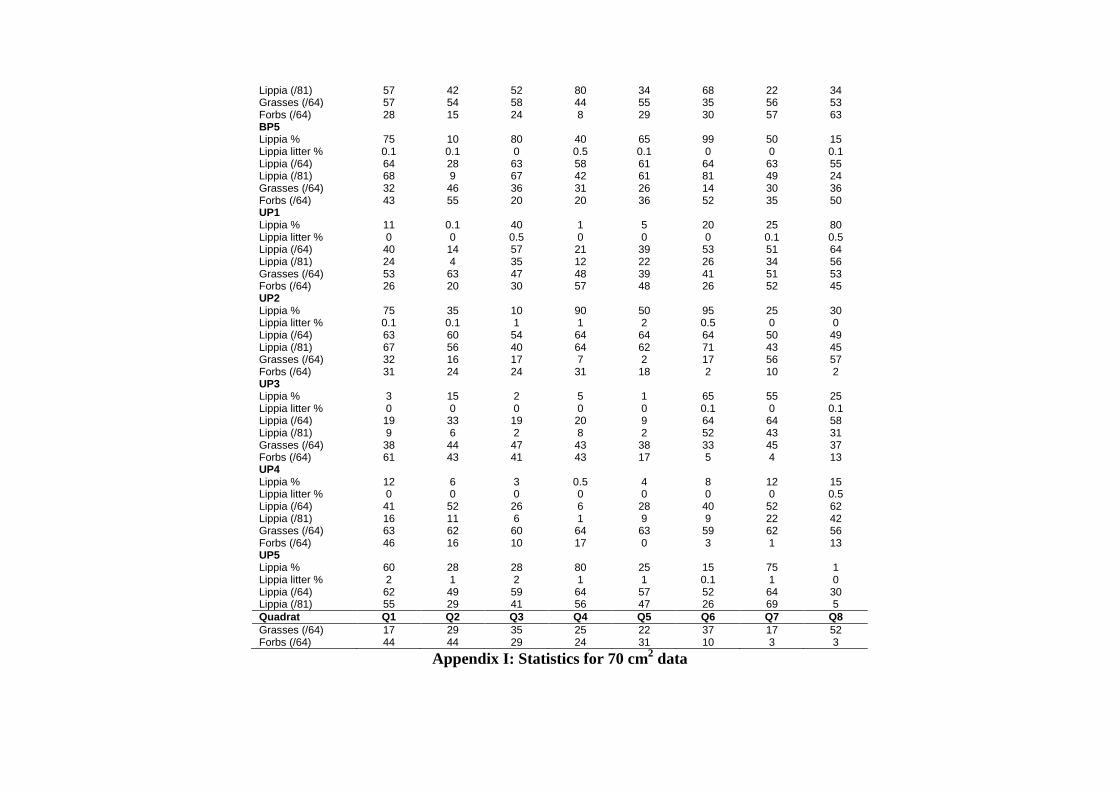
litter; bare ground. Within each 500 m2 quadrat, eight 70 cm2 sub-quadrats were placed along a
16 m transect to determine the cover abundance of lippia, grasses and forbs at a finer scale. Soil
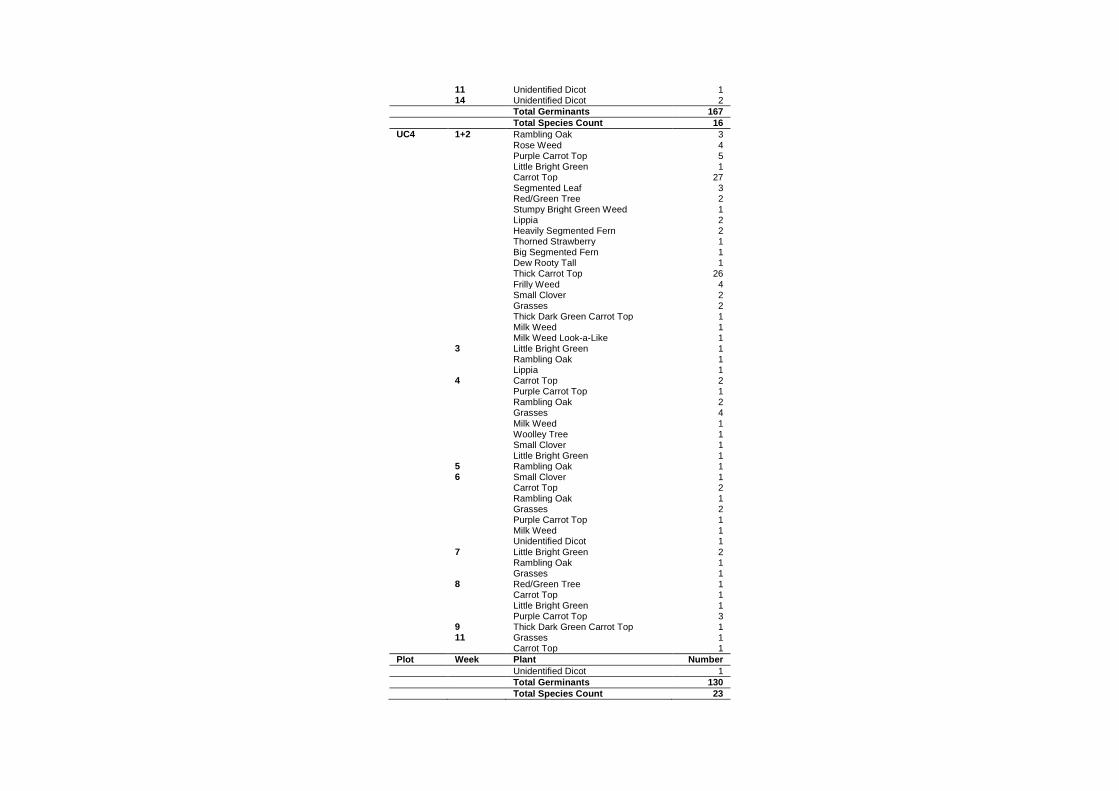
samples were also collected at each site for the glasshouse seed germination trial. Samples were
kept in the glasshouse for 14 weeks to determine total germination and pseudo-species richness
of each site and treatment. Independent T-tests determined whether there were any significant
differences of variables between treatments. The Levene’s Test for Homogeneity was used to
determine homogeneity.
There were no significant differences in the abundance and cover of lippia or vegetation
structural components between burnt and unburnt woodlands, six months after a prescribed burn
at either the broad (500 m2) or finer scale (70 cm2) (T-test, p > 0.05). The only exception to this
finding was a significant difference in forb cover between burnt and unburnt Eucalyptus
populnea woodlands (T-test, p < 0.05). There were no significant differences in seedling
emergence or pseudo-species richness between burnt and unburnt treatments within each
woodland (T-test, p > 0.05).
This research shows that fire may not be a suitable control method for lippia invasion. The
results found for structural components and the seedling germination trial were consistent with
previous literature. Lippia’s response to fire in this study and the lack of positive effect that fire
had on the invasive weed at St Ruth Reserve, has begun to fill an identified knowledge gap in the
control methods for lippia. This study shows that fire may not be a useful management tool for
lippia.
iii
DECLARATION
I certify that the work reported in this thesis is entirely my own effort, except where otherwise
acknowledged. I also certify that the work is original and has not been previously submitted for
assessment in any other course of study at this or any other institution.
…………………………..
Signature of Candidate
…………………………
Date
Endorsement
Supervisor: Dr Andy Le Brocque Co-Supervisor: Dr Kate Reardon-Smith
Name Name
Senior Lecturer in Ecology & Sustainability
Research Fellow, International Centre for Applied Climate Sciences
Position Position
Signature Signature
Date Date
iv
TABLE OF CONTENTS
ABSTRACT ................................................................................................................................. i
DECLARATION ........................................................................................................................ iii
TABLE OF CONTENTS ............................................................................................................ iv
ACKNOWLEDGEMENTS ....................................................................................................... viii
Department of National Parks Recreation Sport and Racing 2012). Historic indigenous burning
patterns in the area have created and helped to maintain the balds for a long period of time
(Queensland Government: Department of National Parks Recreation Sport and Racing 2012).
Approximately one-quarter of the Bunya Mountains balds have been degraded over the past fifty
years due to encroachment from surrounding woodland or rainforest (Queensland Government:
Department of National Parks Recreation Sport and Racing 2012). Fire regimes have been
implemented within the area to maintain the existing balds and to help control advances by
woody native species (Queensland Government: Department of National Parks Recreation Sport
and Racing 2012; Queensland Government: Department of Environment and Heritage Protection
2014). The current implemented fire regime includes a low to high intensity fire at any time of
the year after rain, with biennial to triennial burns in areas where woody invasion has occurred
(Queensland Government: Department of Environment and Heritage Protection 2014). A lack of
fire encourages the growth of shrubs/vines as well as encouraging a change in ecosystem type to
a Eucalyptus woodland, notophyll or microphyll vine forest (Queensland Government:
Department of Environment and Heritage Protection 2014). However, sometimes the
introduction or re-introduction of fire to an ecosystem, can have detrimental effects for the
invasion of new species.
1.2.2 Fire and Alien Species Invasion
Fire provides an ideal window of opportunity for invasive grasses, forbs, shrubs and woody
species to colonise areas not previously invaded (Hobbs & Huenneke 1992). This opportunity is
created by the short term enhancement of both light and nutrient availability (Hester & Hobbs
1992). In studies reviewed by D'Antonio (2000), fire reduced or eliminated an introduced species
in some 20% of cases.
12
Much research has documented the vast changes that occur when an alien species invades the
landscape after a fire regime has been altered (Brooks et al. 2004; Pierson et al. 2011; Keeley &
Brennan 2012). A well-documented study of post fire landscape change, is that of the Hawaiian
submontane area. This area was invaded post fire by three alien grass species, Melinis
minutiflora, Andropogon virginicus and Schizachyrium condensatum (Hughes et al. 1991;
D'Antonio et al. 2010). These invasive grasses maintain an extremely high dead to live biomass
ratio throughout most of the year, resulting in high amounts of moisture (80-90%) and fine litter
particles which causes increased fire frequency (Hughes et al. 1991). These introduced species
also exhibit rapid post fire recovery rates (Hughes et al. 1991). Hughes et al. (1991) found that
post-fire, the total cover of exotic grasses increased while the cover and diversity of native
vegetation sharply declined as the native species germinants were not able to grow past the dense
stand of exotic grasses established soon after the fire (Hughes et al. 1991). D'Antonio et al.
(2010) conducted a study 17 years after the Hughes et al. (1991) study to observe native
ecosystem recovery. Sites that were burnt 17 and 37 years earlier, had little native species
recovery, with no evidence of recruitment of the two dominant native tree species that are found
at unburned sites (D'Antonio et al. 2010).
Alien species invasions can change an ecosystem to the extent that it can alter the natural fire
regime of the area (D'Antonio & Vitousek 1992). The modification of the fire regime will
depend on properties possessed by the plants, both native and introduced. The most important
factors that will change a fire regime are the properties of the fuel, both intrinsic and extrinsic
(Brooks et al. 2004). Researchers have identified five factors that can change the fuel of a fire
and consequently the fire regime of the area: 1. moisture content of plant tissues; 2. chemical
composition of the plant tissues; 3. fuel loads; 4. fuel continuity; and 5. fuel packing ratio
(Brooks et al. 2004). These five properties could eventually change the natural fire regime of an
area through either the suppression or enhancement of fire.
13
The promotion of fire has also been documented in invasive woody species such as Hakea
sericea and Acacia saligna due to higher fuel loads and decreased moisture content (Mack &
D'Antonio 1998). However, not all invasive species promote fire. The suppression of fire by
alien species is not well documented, with research involving invasive woody species such as
Mimosa pigra (Mack & D'Antonio 1998). The invasive forb Phyla canescens (lippia) has been
listed in the ‘Victorian Weed Risk Assessment’ as an invasive weed that is able to decrease the
intensity of fire and potentially reduce fire frequency (State Government of Victoria 2011).
Limited literature has been published on the use of fire to manage weeds that are not of a woody
nature. Based on this finding, the current literature does not explore the use of fire on invasive
forbs, in particular lippia. This lack of understanding motivates the contributions that this project
will make to the current literature.
1.3 Characteristics of Lippia
Lippia is an invasive prostrate forb originally from Argentina that has been introduced and
recorded in over thirty-three countries including Australia (Leigh & Walton 2004). The species
was introduced to Australia through multiple introductions (Xu et al. 2010) in the early
nineteenth century as an ornamental plant (Sosa et al. 2008). Lippia’s current distribution covers
all states and territories in Australia, excluding the Northern Territory (Earl 2003). This current
distribution covers an estimated 5.3 million hectares of the Murray-Darling basin alone, with
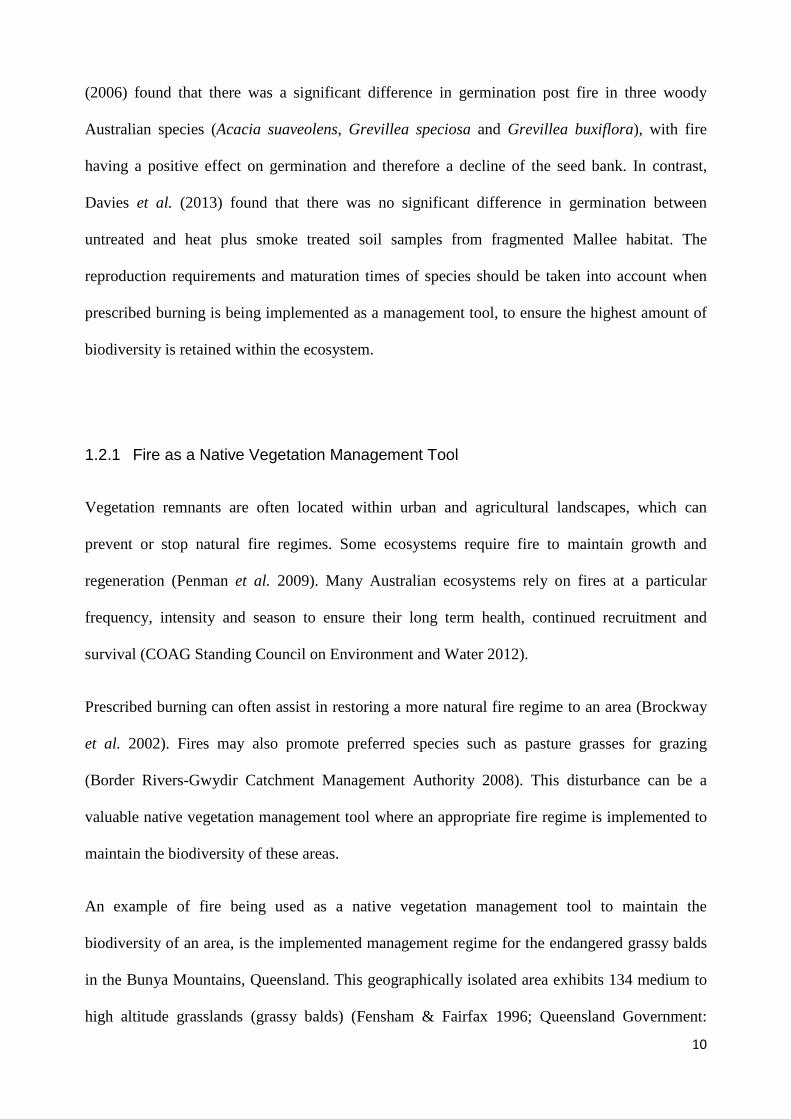
expansion likely under climate change (Figure 1). Lippia is most abundant in frequently flooded
areas such as wetlands, floodplains and the riparian zone of waterways which includes several
Ramsar and other protected wetlands (van Klinken & Julien 2010). This invasive species
predominately affects pastoral production and mixed farming enterprises (van Klinken &
Lawrence 2008).
14
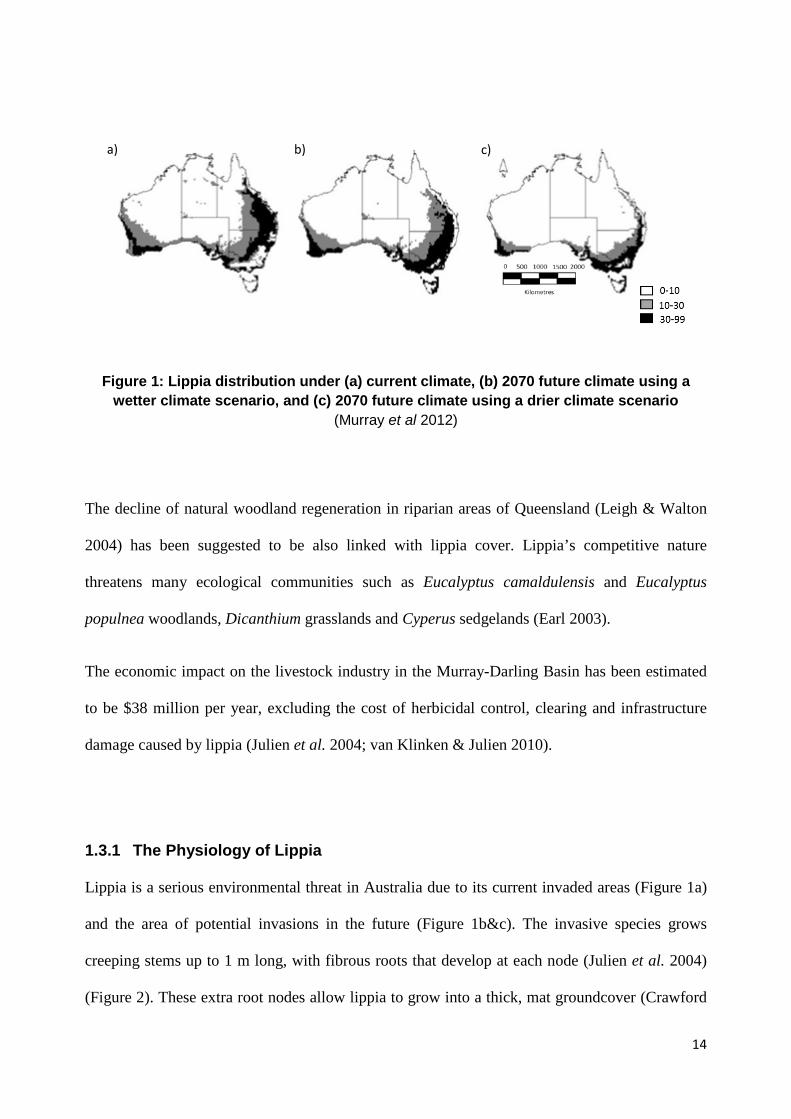
Figure 1: Lippia distribution under (a) current climate, (b) 2070 future climate using a wetter climate scenario, and (c) 2070 future climate using a drier climate scenario
(Murray et al 2012)
The decline of natural woodland regeneration in riparian areas of Queensland (Leigh & Walton
2004) has been suggested to be also linked with lippia cover. Lippia’s competitive nature
threatens many ecological communities such as Eucalyptus camaldulensis and Eucalyptus
populnea woodlands, Dicanthium grasslands and Cyperus sedgelands (Earl 2003).
The economic impact on the livestock industry in the Murray-Darling Basin has been estimated
to be $38 million per year, excluding the cost of herbicidal control, clearing and infrastructure
damage caused by lippia (Julien et al. 2004; van Klinken & Julien 2010).
1.3.1 The Physiology of Lippia
Lippia is a serious environmental threat in Australia due to its current invaded areas (Figure 1a)
and the area of potential invasions in the future (Figure 1b&c). The invasive species grows
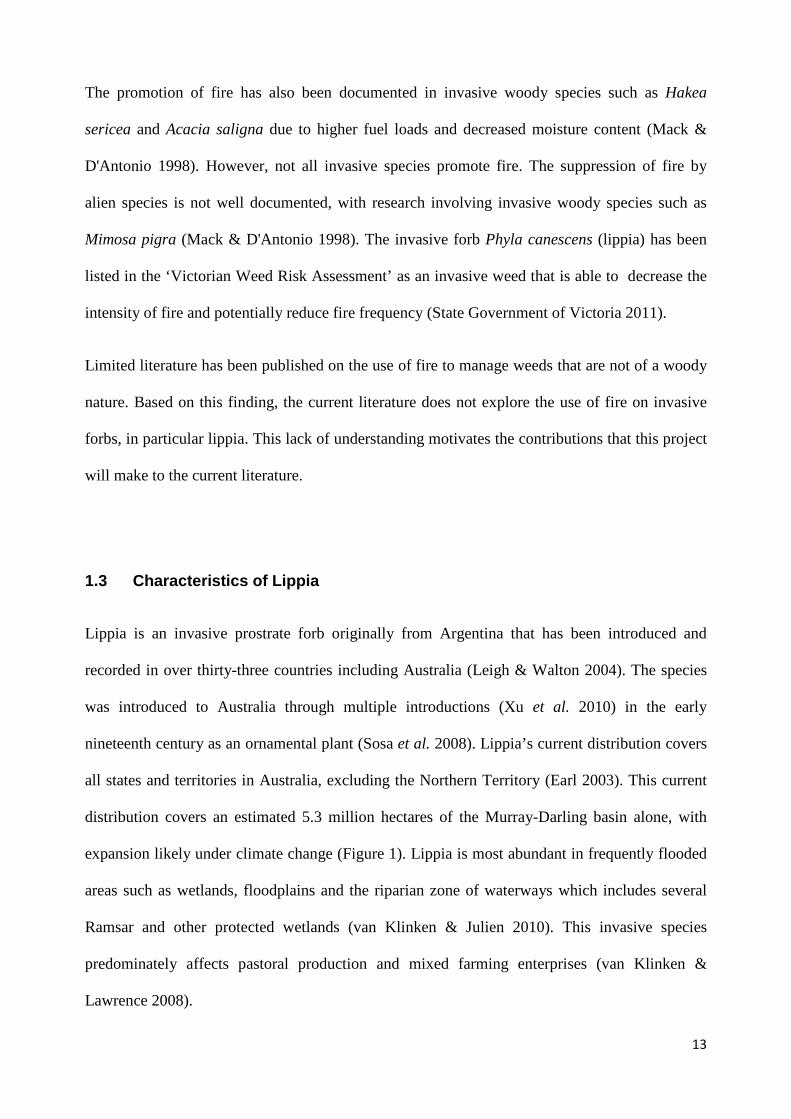
creeping stems up to 1 m long, with fibrous roots that develop at each node (Julien et al. 2004)
(Figure 2). These extra root nodes allow lippia to grow into a thick, mat groundcover (Crawford
a) b) c)
15
2008) which does not allow other ground covers, grasses, shrubs or trees to establish (Earl 2003).
Lippia also grows a deep tap-root, up to 80 cm long (Figure 2), which has the ability to reach
deep moisture reserves (Julien et al. 2004). This extensive root system dries out floodplain clay
soils and causes soil, banks, dam walls and roads to crack and become unstable (Leigh & Walton
2004). This increased erosion may have a flow-on effect in increasing the eutrophication in river
systems as a result of higher nutrient levels in the water (Leigh & Walton 2004).
Figure 2: 14 week old lippia seedling (source: Lucy Galea)
Lippia reproduces both vegetatively and sexually, which allows it to gain an advantage over
other plants in the area (Xu et al. 2012). Both seed and vegetative fragments have the capability
of floating and spreading with floodwaters (Julien et al. 2012b), which helps to distribute lippia
throughout its current range (Taylor & Ganf 2005). Despite vegetative reproduction being a
favoured strategy within local colonies (Price et al. 2011b), field, genetic and morphological data
1cm
16
suggests that sexual reproduction is favoured in the Australian distribution of lippia compared to
the native Argentinian range (Macdonald 2008; Price et al. 2010; Xu et al. 2010). In Australia,
lippia seed bank estimates have been approximated to be 25 439 ± 4901 /m2 seeds directly
underneath adult plants (Price et al. 2011b).
Recent research has shown that lippia seeds require water, light and fluctuating temperatures for
germination (Macdonald et al. 2012). Diurnal temperatures provide enough fluctuation in
temperature to help create the correct germination environment (Macdonald 2008).
17
Table 2: Summary of lippia traits
Lippia trait References
Above-ground growth form - Creeping stems up 1m long
- Thick, mat groundcover
(Julien et al. 2004)
(Crawford 2008)
Below-ground growth form - Up to 80cm-long taproot
- Fibrous roots at each node
(Julien et al. 2004)
(Crawford 2008)
Reproduction - Vegetative fragments dispersed by floodwaters
- Sexual reproduction
(Taylor & Ganf 2005; Julien et al. 2012b)
Flowers - Spring to Autumn
- Small tubular white, pink or lilac
(CSIRO 2007)
(Julien et al. 2004; Crawford 2008)
Seeds - Two seeds – dispersed by natural falling & floodwaters
1T-test statistic for non-homogeneous variances as indicated by Levene’s Test; * significant difference (p < 0.05)
49
3.3 Soil Seed Bank Germination Across Burnt/Unburnt Woodlands
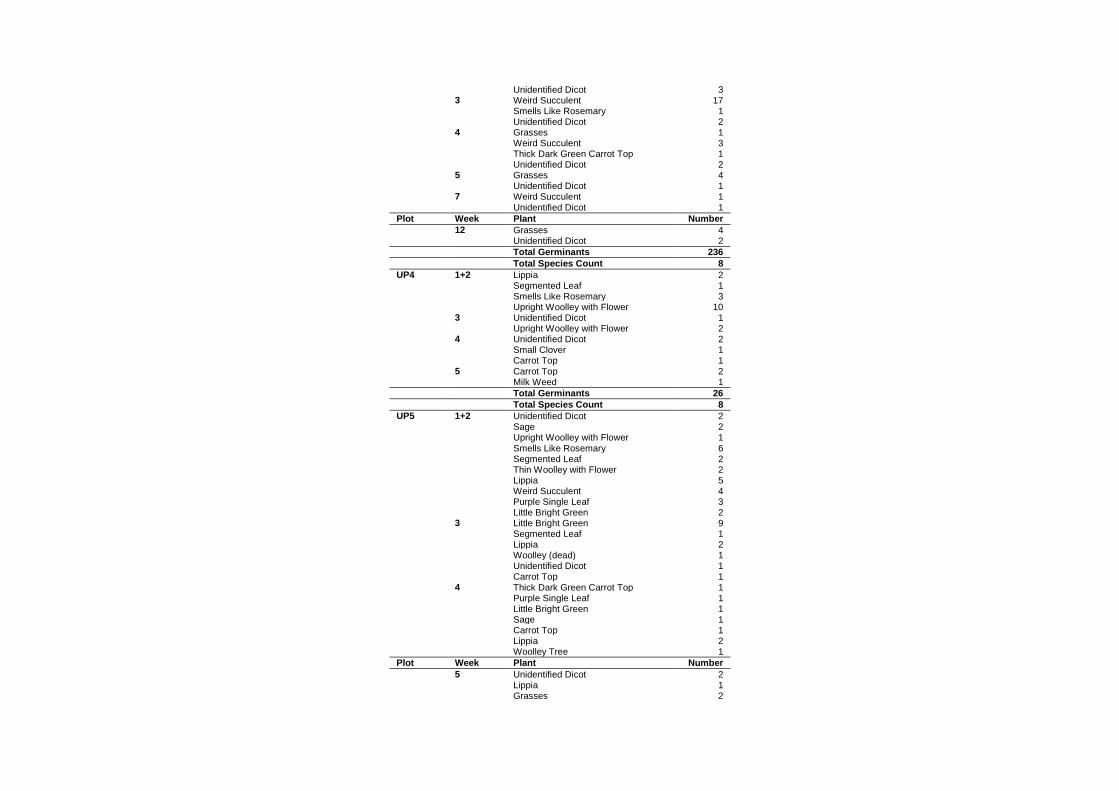
3.3.1 Germinant Emergence
The average total germinant emergence over the 14 weeks for all treatment and woodland
combinations was 108.6 germinants (SE ± 16.1) with a range from 25 to 305 germinants.
Monocot germination ranged from 0 to 30 germinants across all treatment and woodland
combinations (Appendix J).
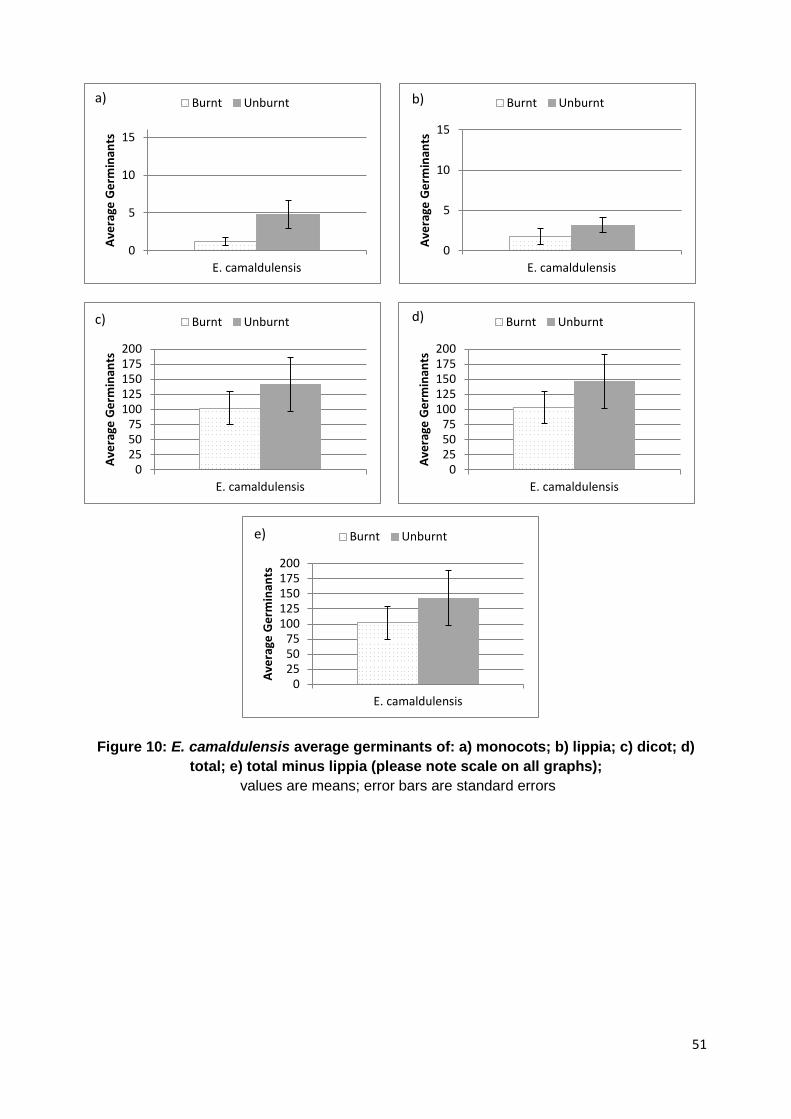
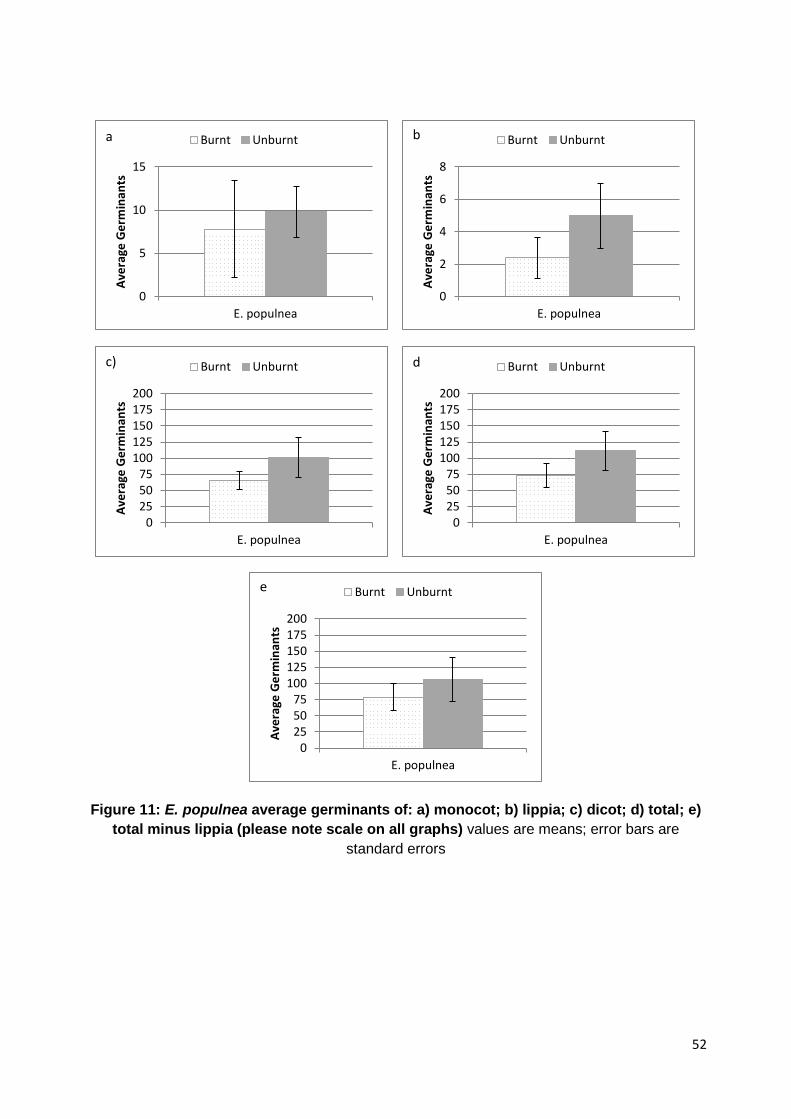
Total germinants were higher in unburnt plots than burnt plots over both woodlands. The
germination and emergence of lippia was low over both E. camaldulensis and E. populnea
woodlands and burnt and unburnt treatments. Lippia did not have any significant effect on the
total sample germination, with total germinants minus lippia being minimally less than total
germinants (Table 10; Figures 10 & 11).
50
Table 10: Mean and standard error of average germination
Average Germination Burnt Unburnt
Mean ± SE Mean ± SE
E. camaldulensis
Monocots 1.20 0.49 4.80 1.85
Dicots 102.00 26.84 141.40 44.33
Lippia 1.80 0.97 3.20 0.97
Total germinants 103.20 26.86 146.20 45.90
Total germinants minus
lippia 101.4 27.50 143.00 45.36
E. populnea
Monocots 7.80 5.60 9.8 2.92
Dicots 65.6 13.85 101.6 30.96
Lippia 2.40 1.25 5.00 2.00
Total germinants 73.40 18.48 111.4 33.40
Total germinants minus
lippia 71.00 17.74 106.4 34.30
51
Figure 10: E. camaldulensis average germinants of: a) monocots; b) lippia; c) dicot; d) total; e) total minus lippia (please note scale on all graphs);
values are means; error bars are standard errors
0
5
10
15
E. camaldulensis
Aver
age
Ger
min
ants
Burnt Unburnt
0
5
10
15
E. camaldulensis
Aver
age
Ger
min
ants
Burnt Unburnt
0255075
100125150175200
E. camaldulensis
Aver
age
Ger
min
ants
Burnt Unburnt
0255075
100125150175200
E. camaldulensis
Aver
age
Ger
min
ants
Burnt Unburnt
0255075
100125150175200
E. camaldulensis
Aver
age
Ger
min
ants
Burnt Unburnt
a) b)
c) d)
e)
52
Figure 11: E. populnea average germinants of: a) monocot; b) lippia; c) dicot; d) total; e) total minus lippia (please note scale on all graphs) values are means; error bars are
standard errors
0
5
10
15
E. populnea
Aver
age
Ger
min
ants
Burnt Unburnta
0
2
4
6
8
E. populnea
Aver
age
Ger
min
ants
Burnt Unburntb
0255075
100125150175200
E. populnea
Aver
age
Ger
min
ants
Burnt Unburntc)
0255075
100125150175200
E. populnea
Aver
age
Ger
min
ants
Burnt Unburntd
0255075
100125150175200
E. populnea
Aver
age
Ger
min
ants
Burnt Unburnte
53
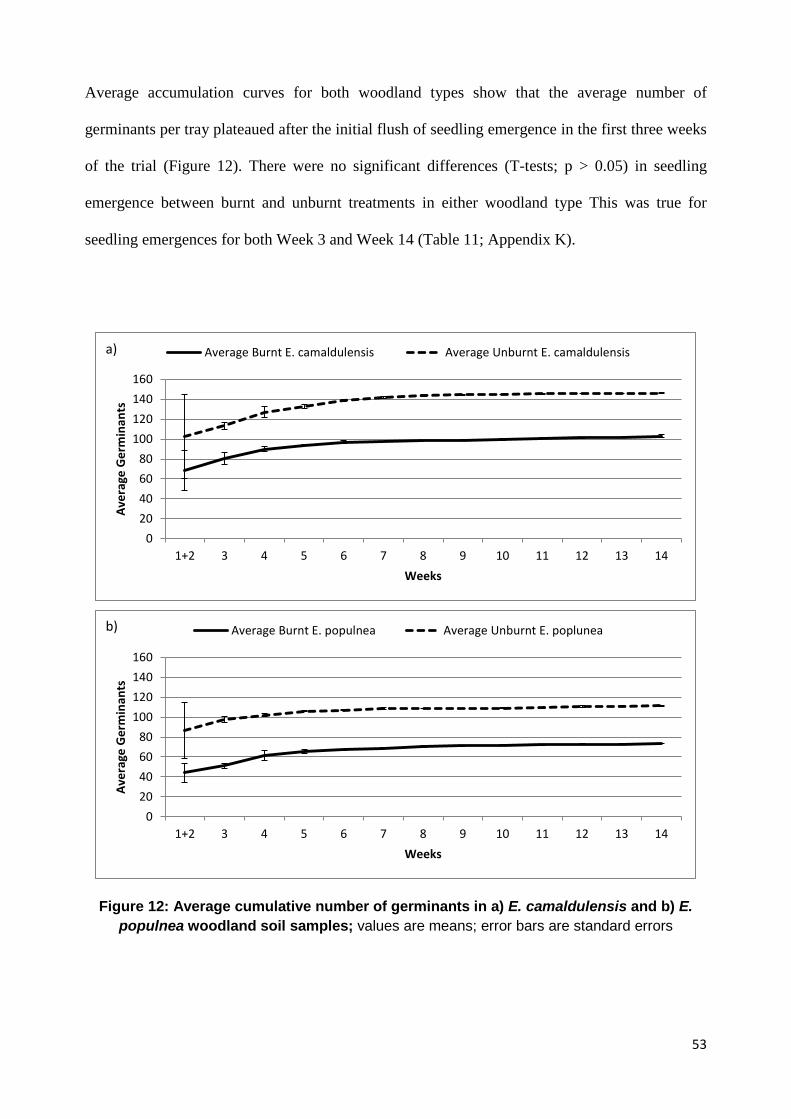
Average accumulation curves for both woodland types show that the average number of
germinants per tray plateaued after the initial flush of seedling emergence in the first three weeks
of the trial (Figure 12). There were no significant differences (T-tests; p > 0.05) in seedling
emergence between burnt and unburnt treatments in either woodland type This was true for
seedling emergences for both Week 3 and Week 14 (Table 11; Appendix K).
Figure 12: Average cumulative number of germinants in a) E. camaldulensis and b) E. populnea woodland soil samples; values are means; error bars are standard errors
020406080
100120140160
1+2 3 4 5 6 7 8 9 10 11 12 13 14
Aver
age
Ger
min
ants
Weeks
Average Burnt E. populnea Average Unburnt E. popluneab)
020406080
100120140160
1+2 3 4 5 6 7 8 9 10 11 12 13 14
Aver
age
Ger
min
ants
Weeks
Average Burnt E. camaldulensis Average Unburnt E. camaldulensisa)
54
Table 11: Summary data for glasshouse germinants in seedbank trial (all means were log10(1+x) transformed before analysis)
Levene’s Test for Homogeneity
T-Value df Significance
F stat Sig
E. camaldulensis Woodland (T=3)
Total Germinants 0.13 0.913 -1.617 8 0.145
Total Germinants (minus lippia) 0.013 0.912 -0.521 8 0.617
Lippia Germinants 0.174 0.687 -1.416 8 0.195
E. populnea Woodland (T=3)
Total Germinants 0.007 0.933 -0.600 8 0.565
Total Germinants (minus lippia) 0.44 0.840 -1.243 8 0.249
Lippia Germinants 0.054 0.822 -0.964 8 0.363
E. camaldulensis Woodland (T=14)
Total Germinants 0.007 0.935 -0.636 8 0.542
Total Germinants (minus lippia) 0.008 0.930 -0.619 8 0.396
Lippia Germinants 0.298 0.600 -1.000 8 0.347
E. populnea Woodland (T=14)
Total Germinants 0.040 0.847 -1.086 8 0.309
Total Germinants (minus lippia) 0.318 0.588 -0.729 8 0.487
Lippia Germinants 0.202 0.665 -0.899 8 0.395
T = weeks since start of germination trial
55
Average accumulation of lippia emergence shows a similar pattern to that of the total germinants
(Figure 13). Burnt sites in both woodland types had approximately half the number of lippia
seedlings compared to the unburnt sites. However, when statistically analysed this difference
was not significant (p > 0.05) for either woodland (Table 11). In all treatments and woodland
types there was an eventual plateauing of lippia germination.
Figure 13: Average accumulation curves for lippia in a) E. camaldulensis and b) E. populnea woodlands; values are means; error bars are standard errors
00.5
11.5
22.5
33.5
4
1+2 3 4 5 6 7 8 9 10 11 12 13 14
Aver
age
Ger
min
ants
Weeks
Average Burnt E. camaldulensis Average Unburnt E. camaldulensisa)
0
1
2
3
4
5
6
1+2 3 4 5 6 7 8 9 10 11 12 13 14
Aver
age
Ger
min
ants
Weeks
Average Burnt E. populnea Average Unburnt E. popluneab)
56
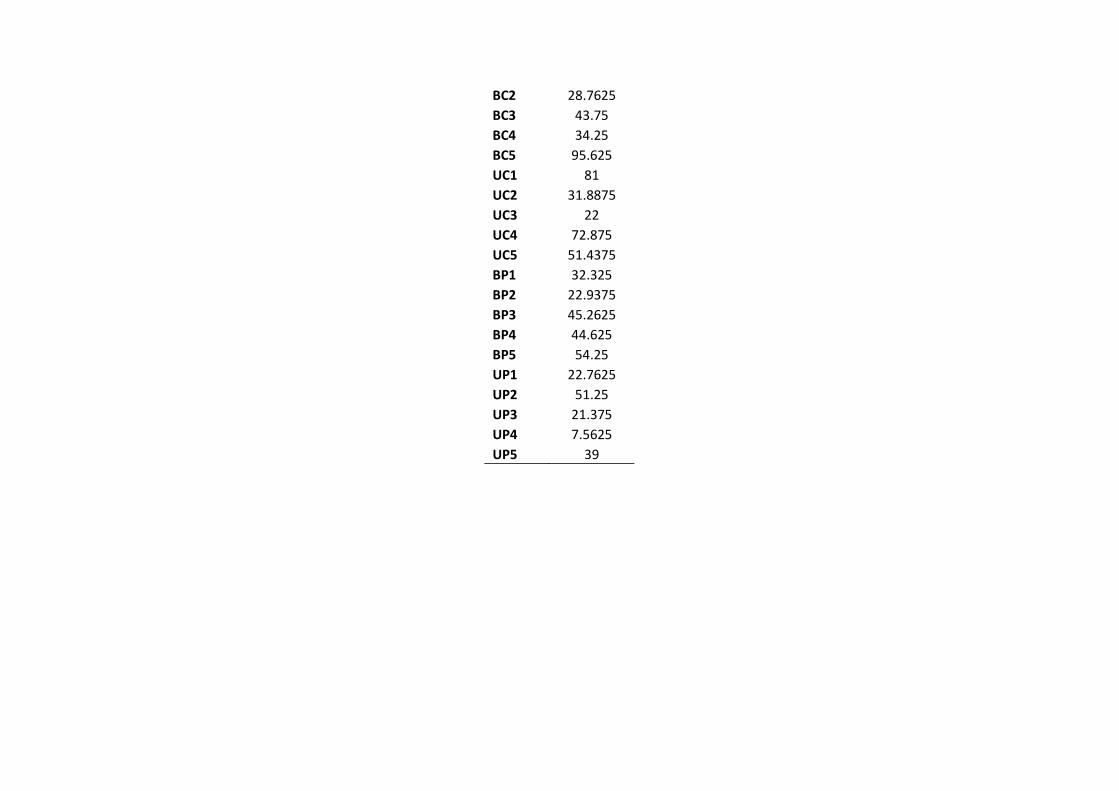
3.3.2 Pseudo-Species Richness
Pseudo-species richness ranged from 5 pseudo-species to 25 pseudo-species across both
woodlands and treatments. The average pseudo-species richness of burnt E. camaldulensis was
10.2 pseudo-species (SE ± 2.1) compared to the average pseudo-species richness of unburnt
treatments of 17.8 pseudo-species (SE ± 2.6) (Figure 16a). The average pseudo-species richness
of burnt treatments in E. populnea woodland was 15.4 pseudo-species (SE ± 1.9) compared to
the unburnt richness of 12.6 pseudo-species (SE ± 2.2) (Figure 16b) (Appendix L).
The pseudo-species richness between the burnt and unburnt samples from the E. camaldulensis
woodland was significantly different (p < 0.05), with burnt treatment plots exhibiting lower
pseudo-species richness (see Figure 16a). However, when plot BC5 (n = 5) was removed from
the data and the analysis re-run, the difference between the treatments was no longer significant
(p = 0.091; p > 0.05). Pseudo-species richness was not significantly different (p > 0.05) between
burnt and unburnt samples of the E. populnea woodland (Figure 16b and Appendix L).
57
1.
Figure 14: Average pseudo-species richness of each woodland a) E. camaldulensis; b) E. populnea; values are means; error bars are standard error
0
5
10
15
20
25
E. camaldulensis
Aver
age
Pseu
do-S
peci
es R
ichn
ess
Burnt Unburnta)
0
5
10
15
20
25
E. populnea
Aver
age
Psed
uo-S
peci
es R
ichn
ess
Burnt Unburntb)
58
Chapter 4: DISCUSSION
4.1 Similarity of Burnt/Unburnt Plots Prior to Fire
Disturbance (as determined by the subjective disturbance scores) was relatively uniform across
both burnt and unburnt treatment types of both Eucalyptus camaldulensis and Eucalyptus
populnea woodlands. The broad structural similarity of each site clearly shows that all treatments
and woodlands were structurally similar. The uniformity of disturbance and dominant stand
structure across all sites shows that any potential confounding effects have been reduced and that
any main patterns can be attributed to fire, not experimental errors.
4.2 Vegetation Response
Structural components of the vegetation in both woodlands were not significantly different
across the treatments. Personal observations soon after the fire indicated that tree mortality, stag
mortality and fire scars had increased in burnt woodlands and therefore it was expected that a
significant difference may be found in tree and stag structure. In a study of riparian woodlands
in Kruger National Park, showed that two months after a low intensity fire in a riparian
landscape, 33% of riparian trees had been killed by the burn. Overall, when the data was
collected at St Ruth Reserve, trees were of a higher average frequency in unburnt plots over both
woodlands, with minimal variation in stag cover between burnt and unburnt treatment in either
woodland. No significant difference was found for either variable. The relatively small quadrat
sizes used in the field (500 m2), as well as the low number of replicates for each treatment type,
could be influencing the lack of difference between the treatment types found here. An increase
in the number of replicates, as well as an increase in the quadrat size could help capture any
differences in vegetation response between burnt and unburnt treatments in either woodland.
An increase in bare ground in burnt plots was expected, as Kutt and Woinarski (2007) had found
that bare ground increased significantly in burnt, grazed sites and burnt, ungrazed sites.
59
Schmalzer and Hinkle (1992) found that a prescribed burn in Palmetto scrub in Florida,
increased mean bare ground cover from a 0 to 23 percent. Bare ground cover at St Ruth Reserve
did not increase in burnt treatments as was observed in these other studies: there was no
significant difference between burnt and unburnt treatments in either woodland. This lack of
change could be due to St Ruth Reserve already being a highly disturbed system and therefore
the ecological processes occurring within the reserve, such as increased edge effect in the
remnant patch and fast lippia growth (Macdonald 2008), may have been influential on the cover
of bare ground when the study was taken.
Forb cover has been observed in many studies to increase post fire. Laughlin et al. (2004) found
that annual and biennial forb richness increased post fire with a significantly greater change rate
than unburnt old-growth ponderosa pine forest sites. In a study observing the impact of grazing
and fire on tropical savanna woodland vegetation, Kutt and Woinarski (2007) also found that
there was a significant difference in forb cover over the four treatment combinations of: no fire
and grazing; fire and grazing; no fire and ungrazed; and fire and ungrazed. Forb cover was most
extensive in burnt and grazed treatments (Kutt & Woinarski 2007).
In the present study an increase in forb cover at burnt sites was observed at both the coarse
500 m2 scale and the fine 70 cm2 scale. This change was significant in E. populnea woodlands on
a fine scale but not a coarse scale. The change was not significant on either scale in E.
camaldulensis woodlands even though the average frequency ranged from 12.6 to 48.4 on a fine
scale. It is important to note that lippia was not included in any forb count during this study and
therefore analyses of forb frequency and cover is of forbs excluding lippia. This result agrees
with the literature that shows that fire can change the ground cover abundance of forbs. The
difference between burnt and unburnt forb abundance may have been increased further if Nardoo
was included in the forb cover count rather than being included in the grass cover count. Nardoo,
a fern, was originally included in the grass count due to its rhizomal growing form, similar to
60
many grasses. However, on reflection it is now believed that this plant would have been better
classified as a forb given its possible similar ecological function to that growth form.
A recent study in grasslands at Yarralumla, Australia, showed that there was a significant decline
in native grass cover four months after more than 10% of the area was burnt (Ross & Macris
2012). White and Loftin (2000), whose study was conducted in the semiarid grasslands of New
Mexico, found that although grass cover did decline post fire, it was not a significant decrease. In
contrast, some studies show that there are no significant differences in grass cover between
unburnt and burnt vegetation of sagebrush rangeland and grasslands, regardless of time since fire
(Nelle et al. 2000; Drewa & Havstad 2001). The results of Nelle et al. (2000) and Drewa and
Havstad (2001) are consistent with the results found at St Ruth Reserve as there was no
significant difference in grass cover between burnt and unburnt treatments in either woodland.
The contradictory findings of these studies may be due to the different ecosystem types being
studied, seasonality of study or the type of data collection method being used.
The response of lippia to disturbance was documented in Macdonald (2008) where the soil was
mechanically disturbed to a depth of 10 cm and vegetation cover, including lippia, was removed.
Each season, one replicate at each site was mechanically disturbed. It was found that following
spring disturbances, lippia reached 50% cover within 85 days of disturbance. This was not
significantly different from the control plots (Macdonald 2008). Summer disturbance plots
returned to control levels after 216 days (Macdonald 2008). However, winter disturbed plots
remained significantly lower than control plots, indicating that lippia does not grow well in
cooler conditions (Macdonald 2008). The disturbance in the current study occurred in late spring,
so therefore the results could be correlated with the spring results of Macdonald (2008).
It was noted by Macdonald (2008) that the recovery of lippia cover in disturbed plots came from
the surviving tap-roots, buried plant fragments and vegetative expansion from outside the
disturbance areas. It is likely that these influences were present post fire and helped lead the
61
regeneration of lippia after the November 2013 fire. Lippia is known to reduce the fire risk of
invaded areas (Leigh & Walton 2004). This means that the prescribed fire may not have burnt
the entire landscape as hoped it would, owing to the lack of flammable ground cover species, and
therefore the burn may have resulted in patches of live lippia remaining in the landscape. The
potential for propagule survival would have ensured that enough vegetative material was left
behind for vegetative reproduction to commence as soon as the plant had recovered from the
effects of the fire. The added potential for lippia seed germination could also contribute to the
recovery of lippia cover post fire.
4.3 Seed Germination Response
Research from small fragmented Mallee habitat on Kangaroo Island that had not been burnt for
more than thirty years, found that germination both native and introduced shrubs, grasses, forbs
and non-grass graminoids, was not significantly different between unburnt and heat plus smoke
treated samples (Davies et al. 2013). Although different vegetation types, the broad site ecology,
highly fragmented remnant vegetation in an agricultural matrix, and previous use, grazing and
other land uses, at the Kangaroo Island study are similar to that of St Ruth Reserve and therefore
the findings are reflective of those found at St Ruth Reserve. A study by Auld and Denham
(2006) found that there was a significant difference between the seed bank before and after a fire.
However, the species studied in this study, Acacia suaveolens, Grevillea speciosa and Grevillea
buxiflora (Auld & Denham 2006) were very different to those studied in the current study and in
the Davies et al. (2013) study. These studies show that although there is some similarity
throughout the previous literature to the current study, there are also conflicting studies which
may indicate that seed response is dependent on the species’ requirements for germination.
The post fire species richness of a site is important for the future vegetative composition of the
ecosystem. A previous study found that there was no overall significant trend in species richness
62
as a function of fire regimes or site effects in heathland vegetation (Bradstock et al. 1997). This
result was supported by a study by Pettit and Naiman (2007), who also found no significant
difference in the species richness between burnt and unburnt quadrats in a semi-arid riparian
ecosystem in South Africa.
The current study partially followed this trend, with the pseudo-species richness of E. populnea
plots not significantly different between burnt and unburnt treatments. The initial difference
between burnt and unburnt treatment pseudo-species richness in E. camaldulensis samples was
found to be significant. However, this significance is likely due to an outlier of very low pseudo-
species richness in one replicate (BC5), which had a pseudo-species richness of five. High levels
of lippia (average of 95%; Appendix M) at this site may have prevented other plants from
emerging and setting seed within the area. Ironically, lippia was not one of the species that
emerged in this tray. When the outlier was removed from the dataset and the data was
reanalysed, the E. camaldulensis pseudo-species richness was not significantly different between
burnt and unburnt plots. This result then follows the current literature on species richness post
fire.
Overall, it does not appear that the prescribed burn had any significant effect on either the
germination or pseudo-species richness of the soil seed bank at St Ruth Reserve, consistent with
previous literature.
4.4 General Discussion
The results from this research show that there were no significant effects of the prescribed fire on
lippia cover, vegetation structural components and the soil seed bank in a vegetation remnant in
a highly modified agricultural landscape. The only exception to this conclusion is the significant
increase of forbs in burnt E. populnea woodlands which was anticipated from the prevailing
63
literature. In particular, this study shows that fire may not be a successful management tool to
control lippia abundance.
This study showed that the vegetative structure of both woodlands and treatments at St Ruth
Reserve were the same, even though it was anticipated that the tree and stag cover may have
declined in burnt areas. This result allows the first hypothesis to be accepted, that there was no
difference in vegetation structure post fire.
This study also shows that bare ground, grass or lippia cover were not significantly different in
burnt woodlands compared to unburnt woodlands. The result for bare ground was inconsistent
with previous literature. However, this could be attributed to the already highly disturbed state of
the vegetation at St Ruth Reserve and therefore a difference may not have been detected using
the preliminary study applied here. The literature is generally inconclusive as to whether fire
induces a significant change in grass cover, although the result observed here for lippia was
consistent with other lippia disturbance studies (e.g. Macdonald 2008).
The results of the ground cover study allow the second sub hypothesis, that there is no difference
in the abundance of other ground cover species between burnt and unburnt woodlands, six
months after a prescribed burn to be partially accepted in terms of grass cover. Forb cover at the
fine scale of 70cm2 was significantly different in E. populnea woodland but not in
E. camaldulensis woodland, even though there was a large range of cover. The significant result
was consistent with prevailing literature on forb growth post fire (Masocha et al. 2011).
However, further research is needed on the apparent differential response of components of the
ground cover and woodland differences in the Eucalyptus woodlands at St Ruth Reserve.
These results were reflected in the ex situ germination study. Germination trials showed that
burning did not have any significant impact on the species richness or germination of soil seed
banks, consistent with previous literature (Pettit & Naiman 2007; Davies et al. 2013). However,
64
this could be extended by taxonomically identifying the species that germinated and comparing
them to species found in the field at the same time post fire. The results of the germination trial
allow the third and fourth sub-hypotheses of that there is no significant difference in the seedling
emergence or species richness of seeds stored within the soil seed bank to be accepted.
The low germination of lippia seeds in the glasshouse trials was consistent with Macdonald
(2008), who found that the most successful germination method could only germinate
approximately 27% of seeds being tested. Adding to this hypothesis, approximately half the
seeds (from two sites) used by Macdonald (2008) were not viable. This shows that the quick
regeneration of lippia in summer, in the in situ study is most likely from vegetative fragments
and taproots left behind after the fire (as per MacDonald 2008) and allows the hypothesis: that
vegetative regeneration may be the preferred method of regeneration at St Ruth Reserve, to be
drawn. These results could have an impact on the management decisions to be made regarding
lippia’s control (see Section 4.4.2).
Although this study has provided expected results, there are some experimental limitations. The
study design could be improved by sampling both before and after the fire to achieve the greatest
comparison. A design that would help to improve the current design of the present study is that
of the MBACI design – multiple before, after, control, impact (Keough & Quinn 2000). The
MBACI design increases statistical rigour and power through the use of multiple, randomly
selected control and treatment locations (Miao et al. 2009). In turn, the ability to detect impacts
from the treatments are increased and the confounding effects are minimised (Miao et al. 2009).
However, the opportunistic nature of the present study meant that sampling prior to burning was
not possible. The comparatively simple spatial ‘snap-shot’ approach taken here is relatively
common in fire ecology studies (Gosper et al. 2011; Lewis et al. 2012) although it does limit the
generalisations that can be made (Williams et al. 1999). The nature of this study also meant that
65
there were many time constraints and therefore there are temporal limitations to the study (see
below).
4.4.1 Limitations and Future Directions
The independence of study plots in this study was limited due to each treatment (control and
burnt) being nested within one large treatment plot (St Ruth Reserve). Ideally, the study would
employ the MBACI design (see Section 4.4), multiple, independent sites where half the sites are
burnt and half are kept as controls. More study sites would increase the statistical power and
rigour of the study whilst enabling any differences between treatments to detected (Miao et al.
2009). Vegetative structure, ground cover and floristic surveys would be conducted at all sites
both before and after the fire. As the study was opportunistic, it was not possible to have a
control site, independent to the burnt site of St Ruth Reserve. Therefore, conclusions made from
this study are specifically for St Ruth Reserve and may limit generalisations (Woinarski et al.
2004). This improved experimental design would help to further identify whether fire is not a
successful control method for lippia and whether there are any changes in vegetation structure
and ground cover.
Time-since-fire has an important role in the change of vegetation structure. Morrison et al.
(1995) found that within the first year after a fire, early-colonising annuals comprised half the
vegetation in a Mediterranean-climate chaparral and scrub. Herbs, annuals and small shrubs have
been found to decrease in abundance with increasing-time-since fire, with vegetation moving
back toward the vegetation structure of an unburnt site (Morrison et al. 1995; Keeley et al.
2005). These results show that the time since fire does impact upon the vegetative community.
The ‘snapshot study’ here sampled only six months post fire and therefore may only be
indicative of early colonisers, not the full spectrum of present species or richness. This small
timeframe limits the conclusions able to be made about the full complement of species and
changes that may occur within a lippia invaded ecosystem. However, invasive species such as
66
lippia could potentially stop the natural vegetative progression of the site due to the aggressive
mat growth form and extensive root system of the invasive weed (Earl 2003). This study is a
good indicator of the changes that can occur six months after fire, especially as the results found
in this study were consistent with the previous literature.
The extension of the monitoring time frame would help researchers and managers to understand
the vegetative succession of the reserve post fire. Some studies have extended to a twenty-three
year period (Woinarski et al. 2004), with other studies re-examining sites twelve months (Pettit
& Naiman 2007) or thirty months post fire (Milberg & Lamont 1995). Follow up studies allow
the natural vegetation succession to be followed over a longer period of time, rather than the
snapshot provided in this study.
A successor project would be able to document the changes in lippia growth as well as
vegetation cover and ground cover in respect to time since fire at St Ruth Reserve. The impact of
other environmental factors such as drought and flood, which appear to influence lippia cover
(Macdonald 2008), could also be included in a longer time frame.
The short time frame of this study also limited the length of time that the glasshouse trials could
be run. In previous literature, seedling emergence has been monitored for 24 weeks (Gashaw et
al. 2002) and 30 weeks (Hill & French 2003). After the 24 weeks, Gashaw et al. (2002) removed
all germinants, disturbed the soil and then left the tray for another month for further germination
to occur. Even though germination did plateau in this study, the effect of the season, in particular
the strength of light over the autumn/winter period in which the study was run, may mean that
with changed conditions in spring/summer there may be a period of renewed germination in the
new season. Either 24 or 30 weeks would allow for multiple seasons to occur and for seeds with
varying germination conditions to emerge.
67
To encompass the wider effects of the fire, such as larger changes in ecosystem structure, for
example burnt and fallen stags, a larger quadrat size would be required to encompass all
potential changes post fire. This meant that in this research study, the broad scale vegetation
effects were not able to be determined and are therefore their response to fire is unknown. The
size quadrat used in this study (500 m2) was large enough to encompass coarse changes in this
small area. A common size used in fire studies is 1000 m2 (0.1 ha) (Keeley et al. 2005;
Ainsworth & Kauffman 2013). Larger quadrat sizes have been used including 2500 m2 (0.25 ha)
(Woinarski et al. 2004) and 3600 m2 (0.278ha) (White & Loftin 2000). To enable future studies
to assess as much vegetative structural and broad scale vegetation change post fire as possible, it
is recommended that a much larger study quadrat, such as those used by Woinarski et al. (2004)
and White and Loftin (2000), be used. However, the 500 m2 quadrat used in this study was
sufficient to measure all variables required.
A future study into the floristic composition of the ground cover would allow more subtle
differences between burnt and unburnt treatments to be explored. Floristics studies are often
included in fire ecology studies to determine the full extent and impact of the fire in the field
(e.g. Milberg & Lamont 1995; Bramston 2003)
Taxonomic identification could also be completed if the glasshouse trials were able to continue
beyond the 14 weeks of this study. The continuation of the trial would greatly assist in
determining whether many of the germinated species are in fact native or invasive. After
monitoring seedling emergence for 30 weeks, Hill and French (2003) allowed the trays to be left
in the glasshouse for another eight months to allow plants to flower. This allowed further
identification of the species to occur (Hill & French 2003). If the time was available, this type of
extended glasshouse trial would help to identify what species have emerged as well as whether
the germinants are native or invasive species. The continuation of the glasshouse trials would
then create a broader picture of the seed bank at St Ruth Reserve. The taxonomic identification
68
of the species would also create an opportunity to be able to compare this data to the published
literature more closely than has been possible in this study. This would allow the species
richness and composition of the field study to be compared to the species richness and
composition of the glasshouse trials.
The soil samples used in the germination trials were collected six months after the prescribed
burn, which meant that some species may have had an opportunity to recolonise the seed bank
before the soil was sampled. In a future study it would be beneficial to sample the seed bank
immediately after the fire and then each season after the fire (Gashaw et al. 2002), to determine
if there is a difference in post fire response in relation to time since fire. Given time constraints
for this study and that the vegetation field study was taken at the same time as the soil for the
glasshouse trial, it can be seen that the seed bank is a reflection of the current state of the above
ground vegetation at St Ruth Reserve.
4.4.2 Management Implications
Prescribed fires may not always enhance the native species of the area. Penman and Towerton
(2008) reported that in an autumn fire, only two plots out of forty, reached between 80oC and
100oC, which is considered to be the necessary trigger for germination in many Australian fire-
adapted plants. It has been found that the mean number of species in a study in a Cumberland
Plain Woodland near Sydney, is significantly different in treatments that have been exposed to
80oC heat compared to unheated samples with litter left on top of the seed trays (Hill & French
2003). Grasses, graminoids, herbs and shrubs all germinated in the Hill and French (2003) study.
These findings may provide an insight into the future native species succession or lack thereof, at
St Ruth Reserve. If managers were to continue to burn the reserve, the potential lack of native
69
germinants due to the low temperature of the fire, may increase the number of invasive species in
the area, in particular species that can successfully reproduce vegetatively, such as lippia.
The results for lippia cover at St Ruth Reserve indicate that the use of fire has not been
successful in controlling lippia. The fast growth rate from vegetative reproduction and previous
literature also showing fast vegetative regrowth after disturbance (Macdonald 2008) helps to
support the hypothesis that disturbance such as fire, may not be effective in the management of
this invasive species. Therefore, it is not recommended that the Western Downs Regional
Council continue to pursue the burning of St Ruth Reserve, with the sole purpose of controlling
lippia. The broader ecological impacts that may not have been enumerated in this study,
including the decline of trees and stags post fire (Pettit & Naiman 2007), also need to be
considered if burning is contemplated again.
4.5 Conclusion
This research has shown that there are no significant effects of a prescribed fire on lippia,
vegetation structural components (except for a significant increase of forbs in burnt Eucalyptus
populnea woodlands) or the soil seed bank at St Ruth Reserve. There have been no studies to
date that have documented the change in lippia cover and abundance post fire in Australia. These
results are consistent with previous studies that have examined the effects of fire on vegetation
cover. This study also shows that fire does not have any significant impact on the seedling
emergence or pseudo-species richness of the soil seed bank, six months after a prescribed burn.
These conclusions are significant in that they show that fire is not an effective control method for
lippia and therefore it is not recommended to be used as a management tool within the St Ruth
Reserve in the future until other possible detrimental ecosystem effects are researched. Further
research needs to be conducted to expand this experiment both temporally and spatially so that
70
recommendations and conclusions can be expanded to the wider distribution of lippia and
vegetative remnants.
71
Chapter 5: REFERENCES
Ainsworth, A & Kauffman, JB 2013, 'Effects of repeated fires on native plant community
development at Hawaii Volcanoes National Park', International Journal of Wildland
Fire, vol. 22, no. 8, pp. 1044-54.
Atwell, BJ, Kriedemann, PE & Turnbull, CGN (eds) 1999, Plants in Action: Adaptation in
Nature, Performance in Cultivation, MacMillian Education Australia Pty Ltd, South
Yarra, Victoria.
Auld, TD & Denham, AJ 2006, 'How much seed remains in the soil after a fire?', Plant Ecology,
vol. 187, pp. 15-24.
Batterham, M. 2008, 'The resilience of Eucalyptus populnea woodlands', Unpublished BSc.
(Hons) thesis, University of Southern Queensland, Toowoomba.
Bendix, J 1997, 'Flood disturbance and the distribution of riparian species diversity ',
Geographical Review, vol. 87, no. 4, pp. 468-83.
Bond, WJ & Keeley, JE 2005, 'Fire as a global ‘herbivore’: the ecology and evolution of
flammable ecosystems', Trends in Ecology & Evolution, vol. 20, no. 7, pp. 384-94.
van Klinken, RD & Julien, M 2010, Biological Control of Lippia, Rural Industries Research and
Development Coporation, Canberra.
Whelan, RJ 1995, The Ecology of Fire, Press Syndicate of the University of Cambridge,
Cambridge, UK.
White, CS & Loftin, SR 2000, 'Response of 2 semiarid grasslands to cool-season prescribed fire',
Journal of Range Management, vol. 52, pp. 52-61.
Williams, RJ, Cook, GD, Gill, AM & Moore, PHR 1999, 'Fire regime, fire intensity and tree
survival in a tropical savanna in northern Australia', Australian Journal of Ecology, vol.
24, no. 1, pp. 50-9.
Woinarski, JCZ, Risler, J & Kean, L 2004, 'Response of vegetation and vertebrate fauna to
23 years of fire exclusion in a tropical Eucalyptus open forest, Northern Territory,
Australia', Austral Ecology, vol. 29, no. 2, pp. 156-76.
Xu, CY, Julien, MH, Fatemi, M, Girod, C, Van Klinken, RD, Gross, CL & Novak, SJ 2010,
'Phenotypic divergence during the invasion of Phyla canescens in Australia and France:
evidence for selection-driven evolution', Ecology Letters, vol. 13, no. 1, pp. 32-44.
Xu, CY, Schooler, SS & Van Klinken, RD 2012, 'Differential influence of clonal integration on
morphological and growth responses to light in two invasive herbs', PLoS One, vol. 7,
no. 4.
Appendices
Appendix A: GPS data points for sites
South East
BC1 Burnt E. camaldulensis rep 1 27o20'0.3722" 151o14'38.037" BC2 Burnt E. camaldulensis rep 2 27o20'0.140" 151o14'43.766" BC3 Burnt E. camaldulensis rep 3 27o20'8.91" 151o14'46.6" BC4 Burnt E. camaldulensis rep 4 27o19'58.577" 151o14'34.784" BC5 Burnt E. camaldulensis rep 5 27o19'49.711" 151o14'45.254" UC1 Unburnt E. camaldulensis rep 1 27o19'45.522" 151o14'47.527" UC2 Unburnt E. camaldulensis rep 2 27o19'42.642" 151o14'11.198" UC3 Unburnt E. camaldulensis rep 3 27o19'51.845" 151O14'13.55" UC4 Unburnt E. camaldulensis rep 4 27o19'59.232" 151o14'17.177" UC5 Unburnt E. camaldulensis rep 5 27o20'3.230" 151o14'20.346" BP1 Burnt E. populnea rep 1 27o20'8.5" 151o14'50.83" BP2 Burnt E. populnea rep 2 27o20'6.621" 151o14'54.819" BP3 Burnt E. populnea rep 3 N/A N/A BP4 Burnt E. populnea rep 4 27o19'52.867" 151o14'59.619" BP5 Burnt E. populnea rep 5 27o19'46.995" 151o14'59.08" UP1 Unburnt E. populnea rep 1 27o19'43.94" 151o14'49.089" UP2 Unburnt E. populnea rep 2 27o19'47.255" 151o14'38.830" UP3 Unburnt E. populnea rep 3 27o19'44.471" 151o14'33.142" UP4 Unburnt E. populnea rep 4 27o19'46.039" 151o14'28.957" UP5 Unburnt E. populnea rep 5 27o19'37.853" 151o14'23.142"
Appendix B: Toothpick colours for week of emergence
Toothpick Colour Week No Colour 1&2 Purple 3 Purple & Red 4 Watermelon 5 Red 6 Fluoro Orange 7 Devine 8 Green 9 Nude 10 Gold 11 Gold & Purple 12 Red & Green 13 No Toothpick 14
Appendix C: Pseudo-species list
Pseudo-species name Stumpy Bright Green Weed Chive Thing Big Segmented Fern Lippia Eucalypt Frilly Weed Segmented Leaf Upright Woolley Milk Weed Look-a-Like Red/Green Tree Fuzzy Thin Leaf Little Bright Green Carrot Top Weird Succulent Woolley Tree Milk Weed Thick Stem Dark Green Weed 4 o'clock Small Clover Daisy Large Clover Lime Green Weed Singled Leaf Thick Dark Green Carrot Top Dew Rooty Tall Sword Plant Thorny Weed Unidentified Dicot 4 o'clock Woolley Weed Purple Backed Thistle Sage Purple Carrot Top Wahlenbergia Small Clover Smells Like Rosemary Rose Weed Thick Carrot Top Thin Woolley Upright Woolley with Flower Fluffy with Weird Flower Red/Green Succulent Grasses Tall Skinny Leaf Upright Woolley with Flower Thick Woolley Segmented Leaf Purple Single Leaf Thin Woolley with Flowers Purple Backed Thistle Woolley (dead) Smells Like Rosemary Furry Small Tree Thorned Strawberry Heavily Segmented Fern Glossy Green Weed Cabbage Weed Maple Carrot Rambling Oak Chive Thing Upright Woolley Rose Weed Little Bright Green Dark Green Fuzzy (with Flowers)
Fluffy Carrot Top with Weird Flower
Appendix D: Raw data from disturbance scores
Site Grazing Clearing Logging Erosion Weeds Feral Animals