Abstract Field and laboratory studies have been conducted to investigate the effect ofsurrounding buildings on the plume rise from low-level buoyant sources, such as distributedpower generators. The field experiments were conducted in Palm Springs, California, USAin November 2010 and plume rise from a 9.3 m stack was measured. In addition to thefield study, a laboratory study was conducted in a water channel to investigate the effectsof surrounding buildings on plume rise under relatively high wind-speed conditions. Differ-ent building geometries and source conditions were tested. The experiments revealed thatplume rise from low-level buoyant sources is highly affected by the complex flows inducedby buildings stationed upstream and downstream of the source. The laboratory results werecompared with predictions from a newly developed numerical plume-rise model. Using theflow measurements associated with each building configuration, the numerical model accu-rately predicted plume rise from low-level buoyant sources that are influenced by buildings.This numerical plume rise model can be used as a part of a computational fluid dynamicsmodel.
Keywords Distributed power generator · Field study · Numerical modelling · Plume rise ·Urban air quality · Water channel
1 Introduction
The ground-level concentrations of pollutants emitted from a stack are extremely sensitiveto plume rise. Since the 1950s, many studies have been made in an attempt to provide accu-rate numerical and analytical models to predict plume rise from large centralized powerplants (Halliday 1968), or sources located far away from urban environments with stackheights of 200–300 m (Fay 1973). In 1963, the Tennessee Valley Authority (TVA) initiated
S. Pournazeri · M. Princevac (B) · A. VenkatramDepartment of Mechanical Engineering, University of California Riverside, Riverside, CA 92521, USAe-mail: [email protected]
123
288 S. Pournazeri et al.
a comprehensive plume rise study with relatively tall stacks (approximately 150 m) duringstable, neutral, and slightly unstable conditions (Carpenter et al. 1968). Analysis of the dataobtained from this field study revealed that wind speed and stack heat emission rate are themost significant parameters determining the plume rise from large power-generating stations.Halliday (1968) carried out field measurements of plume rise from a 76.3 m stack in orderto verify plume rise equations developed by Priestley (1956), Bosanquet (1957), and Lucaset al. (1963). Halliday (1968) measured the plume rise by taking photographs of the plumeonly when the wind direction was perpendicular to the camera lens orientation. For caseswhen the wind direction was not perpendicular to the camera orientation, they were not ableto measure the plume rise correctly. In other studies, Hamilton (1967) and Bacci et al. (1974)also measured plume rise using lidar and related their data to the meteorological variablesand power-station operating conditions to show that the plume-rise measurements were inagreement with the models developed by Lucas et al. (1963) and Briggs (1969).
The recent increase in the use of distributed power generators (DPGs) has raised con-cerns of the possible air-quality problems created in urban areas, as DPGs are stationednear businesses, schools, restaurants, and hospitals. Unlike large, centralized power plants,exhausts from DPG sources are released from relatively short stacks, with a typical heightof approximately 10 m, and can be captured in the wakes of surrounding buildings. Over thelast decade, many studies focused on the air-quality impact of DPGs in urban areas in termsof emission rates and intake factors (Greene and Hammerschlag 2000; Allison and Lents2002; Hadley and Van Dyke 2003; Rodriquez et al. 2006; Heath et al. 2006). Intake factorsare dimensionless numbers representing the ratio between the amounts of pollutants inhaledby the population to that released from the source (Heath et al. 2006). Several studies havealso addressed the impact of these emissions on ambient ground-level concentrations underrealistic emission scenarios (Venkatram et al. 2004a; Jing et al. 2009, 2010). However, Jinget al. (2010) showed that the performance of US Environmental Protection Agency (EPA)recommended dispersion model, AERMOD (Cimorelli et al. 2005), in explaining these con-centrations was limited and not satisfactory, since it tends to underpredict the ground-levelconcentrations associated with these sources, especially at night. One of the reasons for thislimitation may be the formulation of plume rise (Briggs 1984; Weil 1988) in AERMOD,which is designed primarily for elevated emissions from large power plants. This plume-riseformulation neglects building effects, as well as the effects of the variations of meteorolog-ical parameters with height that govern the plume rise for near-surface DPG sources. Theheat recovery deployed by DPGs in order to increase the efficiency, lowers the exhaust gastemperature and subsequently results in lower plume rise, which is consequently much moreaffected by surrounding buildings. This can further increase the uncertainty of simple models(e.g. Briggs 1984; Weil 1988) in predicting the plume rise associated with DPGs, since theyhave no capability of incorporating building effects.
The modern dispersion models, such as AERMOD-PRIME (Schulman et al. 2000) andADMS (Carruthers et al. 1994), contain the plume-rise modules that are capable of account-ing for the effects of vertical wind shear and streamline ascent and descent. Wind-tunnel andfield datasets were used for evaluations of these modules (Robins et al. 1997a; Carrutherset al. 1999; Schulman et al. 2000). However, the modules are designed to calculate the plumerise from sources near isolated large buildings (Robins et al. 1997b; Schulman et al. 2000;Robins and McHugh 2001), and hence they do not necessarily perform well when the flownear the stack is affected by surrounding buildings. No studies have specifically focussed onthe effects of surrounding buildings on plume rise from low-level buoyant sources. Hence,our study was motivated by the need for a better understanding of the plume rise from suchsources. As the first step toward satisfying this need, a field study was conducted in Palm
123
Rise of Buoyant Emissions from Low-Level Sources 289
Springs, California, USA. Plume rise from a DPG located in Sunrise Park in the centralarea of the city of Palm Springs was measured using a new plume-rise photographic methodwhere, unlike the previous photographic methods applied by Halliday (1968) and Bringfelt(1968), plume rise was correctly measured even if the wind direction was not perpendicularto the camera lens’ orientation.
Since field studies are specific to the site geometry and meteorological conditions, itwould be difficult to extrapolate the plume-rise results from Palm Springs study to otherurban settings. In addition, conducting field studies for various wind conditions at differentsites would be prohibitively expensive. However, results from these studies can be used todevelop scenarios that can be tested in the laboratory. For these reasons, in addition to thefield study, a systematic laboratory investigation was performed, and plume rise under severaldifferent upstream and downstream building geometries was measured in a custom-designedwater channel. Simulated flows and emissions in water channels are the most efficient waysof studying the plume motion due to the relative simplicity of generating stably stratifiedflows and making visualizations using fluorescent dyes (Arya and Lape 1990; Contini andRobins 2001). The use of water channels for such applications can be found in Hoult andWeil (1972), Snyder (1985), Ohba et al. (1990), Hunter (1992), Contini and Robins (2001,2004), Contini et al. (2011) and will not be discussed here. Using the measurements fromthe laboratory study, the performance of a newly developed numerical plume-rise model thataccounts for the effect of surrounding buildings on plume rise was examined.
Field measurements are explained in Sect. 2, followed by the laboratory and numericalstudy in Sect. 3, and a summary and conclusions are presented in Sect. 4.
2 Field Study
In November of 2010, a field study was conducted in Palm Springs, California, USA, in whichthe plume rise from a DPG, located in Sunrise Park, with a stack height of 9.3 m and stackdiameter of 0.3 m was measured under different source conditions. Sunrise Park is located inthe central area of Palm Springs, close to the downtown, between Ramon Road and E. BaristoRoad. The park consists of 15.3 ha of grassy area and is surrounded by a residential areawith mostly single storey (≈5–7 m height) buildings and 10–15 m tall palm trees. The sitehas an approximate aerodynamic roughness length z0 = 0.5 m, a zero-plane displacementdh = 2.5 m (dh = 5z0 based on Britter and Hanna 2003), and a Bowen ratio Bo = 1.5 witha surface albedo of 0.22. These surface parameters correspond to those recommended by theSouth Coast Air Quality Management District, which are obtained by applying AERSUR-FACE (EPA 2008) model to the Palm Springs urban area (SCAQMD 2009). The DPG wassurrounded by the Palm Springs swim centre (a single storey L×W ×H = 50 m×30 m×7 mbuilding) to the south, a baseball stadium to the north-east, and a playground to the west.The plume-rise measurements were accompanied with basic meteorological measurements,which are described below.
2.1 Meteorology
Two meteorological stations, a tower (with two sonic anemometers at 3 and 8 m above groundlevel), and a tripod (with a sonic anemometer at approximately 4 m above the rooftop of theDPG, i.e. 11 m from the ground) were deployed. The tower was set up in the Sunrise Parkparking lot (within 100 m of the DPG facility), and the tripod was set up on the roof of the
123
290 S. Pournazeri et al.
DPG building. Three components of wind speed and the ambient virtual temperature weremeasured by sonic anemometers at the rate of 10 samples per second. Using these measure-ments, mean and turbulent wind speeds, and surface heat flux were calculated and averagedover periods of 15 min (9,000 samples).
Figure 1 shows the meteorological parameters (i.e. wind speed, turbulent velocity com-ponents, and sensible heat flux) measured from 7 November to 10 November 2010 fromthe sonic anemometer located on the roof of the DPG at 11 m above the ground. The datashow that wind speeds are less than 1 m s−1 for most days, making Palm Springs a lowwind-speed case compared to other urban areas, where wind speeds mostly exceed 3 m s−1
during the day (Rotach et al. 2004; Venkatram et al. 2004b; Allwine and Flaherty 2006). Itcan be observed that the wind direction is variable, standard deviations of the vertical tur-bulent velocity (Fig. 1d) are approximately 0.25 m s−1, and for the lateral turbulent velocity(Fig. 1c) generally higher around 0.5 m s−1, indicating that the site in Sunrise Park has rela-tively high turbulent intensities of approximately 25% in the vertical direction and about 50%in the horizontal direction. In addition, as the wind direction changes substantially (Fig. 1b),plume meandering can play a major role in the dispersion of pollutants released from theDPG. A comparison between data from different sonic anemometers showed that there isno significant spatial variation of micrometeorological parameters between the roof of theDPG and the tower site. In addition, it has been observed that wind direction does not changesubstantially with height up to 11 m from the ground where the highest sonic anemometer islocated.
2.2 Plume Rise
In order to visualize the plume released from the DPG, smoke oil (Super*Dri� AviationSmoke Oil) was injected into the stack 4 m below the stack exit to allow for oil evaporationand mixing, producing a thick white smoke visible to the naked eye. Consecutive images ofthe plume (Fig. 2a) were taken from different locations close to the stack using commercialdigital cameras that were then used to construct the 5-min averaged plume images with thebackground image (an image that was taken from the same location when there was no visibleplume exiting the stack) subtracted (Fig. 2b). After the contrast enhancement, only the regionof the highest smoke concentration (i.e. the plume centrelines) remained on the image. Theheight from the stack of the line passing through the centre of this region (the green linein Fig. 2b) represents the average plume rise, i.e. averaged location of the plume centre-lines. The horizontal and vertical distances (L) of the plume centreline can be calculatedas,
L = L image(Hs-field/Hs-image
)(1)
where L image is the distance (horizontal or vertical) of the plume centreline measured onthe averaged image and Hs-field and Hs-image are the heights of the stack in the field and theimage, respectively. However, it must be noted that the calculation of the plume centrelineheight from such an image is only accurate when the plume direction (i.e. wind direction)is perpendicular to the camera lens orientation. For cases where the wind direction wasnot perpendicular to the camera orientation, corrections were made to calculate the correctplume rise. The following section describes the correction method for the discrepancy inwind direction and camera orientation.
123
Rise of Buoyant Emissions from Low-Level Sources 291
Fig. 1 Meteorological measurements of a wind speed U (m s−1), b wind direction, c lateral turbulent velocityσv (m s−1), d vertical turbulent velocity σw (m s−1), and e sensible heat flux ρCpw′T ′(W m−2) (data pre-sented by green dots correspond to the time of the plume-rise measurements on 9 November 2010 from 1400to 1500 Pacific standard time)
123
292 S. Pournazeri et al.
Fig. 2 Measurement of plume rise associated with the Palm Springs DPG, a example of an instantaneousphotograph of the plume released from the DPG, and b the averaged image of the plume with the backgroundsubtracted and contrast enhanced. This is considered as the region of the plume centrelines. The mean plumecentreline is shown as a green line
2.2.1 Correction Method
According to the schematic given in Fig. 3, the plume centreline plane (brown line in Fig. 3)in general does not overlap with a plane that is normal to the camera orientation and passesthrough the stack (Normal plane in Fig. 3), and it deviates from the Normal plane by anangle θ1. Considering that the camera is located at a distance Dstack from the stack, Xm isthe downwind distance of the plume centreline calculated from the averaged plume imagesthrough Eq. 1 (assuming that the plume direction is perpendicular to the camera lens orienta-tion), Lcam is the distance of the camera to the Normal plane, and λ is the angle between theNormal plane and the line connecting the stack to the camera, the corrected plume centrelinedownwind distance Xreal can be calculated as follows:
Xreal = Xm (cos θ1 + sin θ1 tan θ3) (2)
where θ3 = θ1 + θ2, and
θ2 = tan−1(
Xm − Xcentre
Lcam
)(3)
where Xcentre is the distance in the field from the stack to the centre of the image and
Lcam = Dstack sin(λ). (4)
Assuming that plume rise measured from the averaged image is Zm, the corrected plumerise, Zreal, is calculated as follows,
Zreal = Zm (L real/Lcam) (5)
where L real = Lcam + Xreal sin(θ1). By utilizing this method, the numerical value for plumerise was corrected for all wind directions measured by sonic anemometers located at the roofof the DPG. The downside of this method is the inability to incorporate the change in thewind direction with height. Since our measurements of the plume rise were limited to 35 mfrom the ground and the wind-direction measurements at three different heights (up to 11 m)did not differ significantly, we assumed that there is no significant variation in wind directionover the observed plume. The mean difference between the wind directions at three differentheights did not exceed 10◦.
123
Rise of Buoyant Emissions from Low-Level Sources 293
Fig. 3 Schematic used for the correction technique for the case when the plume centreline (brown line) isdeviated from the normal plane of the camera lens (blue line)
Table 1 The distance of eachcamera from the stack and theirorientation relative to the north
Camera Distance from stack (m) Camera orientation from north (◦)
CAM 1 119 125
CAM 2 67 100
CAM 3 67 35
CAM 4 67 65
CAM 5 34 275
Table 2 Stack properties for two DPG power setting
Stage # Time interval Stack exit temperature (◦C) Stack exit velocity (m s−1) DPG output (kW)
1 1400–1420 248.5 15.4 600
2 1425–1440 210.7 9.5 300
2.2.2 Field Measurements
Plume-rise measurements were conducted on 9 November 2010 when the wind direction wasmostly from the west (Fig. 1); however, its deviation from the mean was relatively large andthus most cases required correction.
In order to have full coverage of the plume under different wind angles, plume-rise datawere gathered by five cameras at different locations relative to the stack. These camerascaptured images at the rate of approximately 1 image per second; the orientation of eachcamera and their distance from the stack are given in Table 1.
Experiments were conducted for two power settings of the DPG, which resulted in differ-ent stack exit velocities and temperatures that were measured using a pitot tube and a K-typethermocouple, respectively. Details of the parameters involved in each DPG power setting aresummarized in Table 2. For each DPG power setting, the average plume rise was measuredin intervals of 5 min and compared with the Briggs (1984) plume-rise formulation,
123
294 S. Pournazeri et al.
hp =(
3
2β2
Fbx2
U 3 + 3
β2
Fmx
U 2
)1/3
, (6)
which assumes a bent-over plume in a neutrally stratified atmosphere with a constant hori-zontal wind speed U where no updrafts and downdrafts exist. Due to the vigorous mixing thatoccurs in the daytime urban boundary layer, the potential temperature gradient just above theroof level is close to zero (Cermak et al. 1995) and hence, the neutral stability assumptionfor simulating the daytime plume rise using Briggs (1984) is mostly valid. Here, x is thedistance from the stack, β = 0.6 (Hoult and Weil 1972) is the entrainment parameter, andFb and Fm are the buoyancy and momentum flux parameters, respectively, expressed as
Fb = gb20Vs
(Tp − Ta
Tp
), (7)
Fm = b20V 2
s
(Tp
Ta
)(8)
where b0 = 0.15 m is the radius of the stack, Vs is the stack plume exit velocity, Tp is thetemperature of the exhaust plume, and Ta is the ambient temperature.
2.3 Results
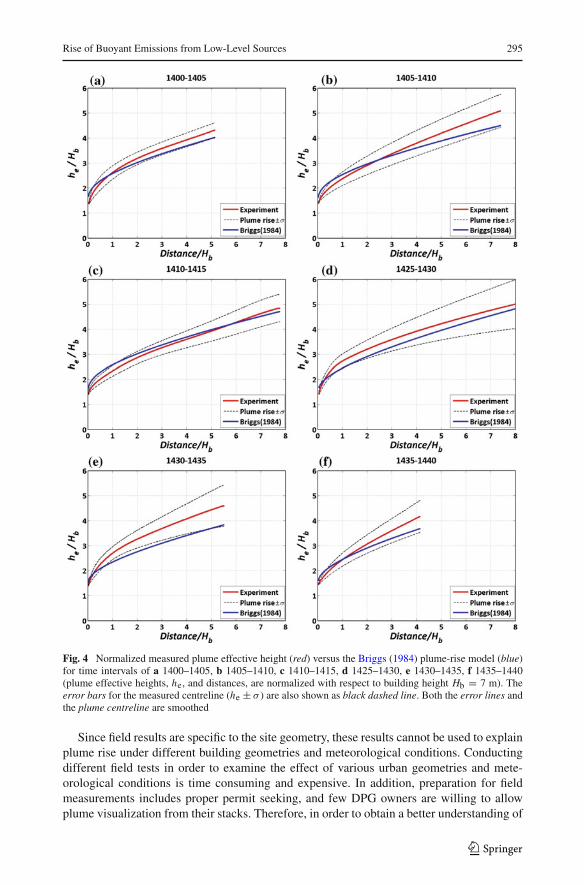
The results of plume-rise measurements and associated uncertainties are compared (Fig. 4)with the predictions from the Briggs (1984) formulation, employing the measured windspeed at the roof of the DPG building (11m from the ground). Here, the uncertainties (σ )were obtained by calculating the standard deviation of the height of plume centrelines fromthe averaged and contrasted plume images (e.g. Fig. 2b). In most cases, the predictions madeusing the Briggs plume-rise model are in good agreement with the observations from thefield experiment, and most predictions lie within observed plume-rise error lines (he ± σ ).All results are shown in terms of the plume effective height (he = hp + Hs, where Hs is theheight of the stack).
Although the experimental uncertainties are relatively higher than the differences betweenthe observations and predictions, in most cases it can be seen that plume rise is slightly over-predicted close to the stack, and underpredicted by the Briggs formulation further downwind.The primary reasons for these differences are likely the lower wind speed at the stack exit(z = 9.3 m) and the effect of the ambient turbulence on the plume rise at larger downwinddistances. Lower wind speeds allow the plume to rise higher near the stack, and ambientturbulence suppresses the plume rise at larger distances. Although these effects can slightlymodify the plume-rise behaviour, Briggs’ formulation appears to perform reasonably wellin predicting the plume rise. As was shown in Fig. 1a, the location at Palm Springs wasdominated by low wind speeds with a mean value of approximately 1 m s−1 and a maxi-mum of 1.5 m s−1 for most days. This allowed the plume to rise relatively high, making theeffect of nearby buildings on the plume rise non-existent. Also, because the Palm Springsurban morphology consists of mostly low rise (single storey) buildings of approximately thesame height as the DPG, the plume is not expected to be affected by complex flows causedby buildings (e.g. updrafts and downdrafts) in the region where it tends to rise. Hence, weexpect that for cases of higher wind speeds, where the stack building is closely surroundedby relatively tall buildings, the Briggs plume-rise formulation will fail, and different methodsare needed to predict the plume rise.
123
Rise of Buoyant Emissions from Low-Level Sources 295
Fig. 4 Normalized measured plume effective height (red) versus the Briggs (1984) plume-rise model (blue)for time intervals of a 1400–1405, b 1405–1410, c 1410–1415, d 1425–1430, e 1430–1435, f 1435–1440(plume effective heights, he, and distances, are normalized with respect to building height Hb = 7 m). Theerror bars for the measured centreline (he ± σ ) are also shown as black dashed line. Both the error lines andthe plume centreline are smoothed
Since field results are specific to the site geometry, these results cannot be used to explainplume rise under different building geometries and meteorological conditions. Conductingdifferent field tests in order to examine the effect of various urban geometries and mete-orological conditions is time consuming and expensive. In addition, preparation for fieldmeasurements includes proper permit seeking, and few DPG owners are willing to allowplume visualization from their stacks. Therefore, in order to obtain a better understanding of
123
296 S. Pournazeri et al.
plume rise in the presence of upstream and downstream obstacles near the source under morecontrolled stack and wind conditions, a laboratory study was performed. Unlike the PalmSprings field study, where low wind speeds were considered, the laboratory study exploresplume rise under relatively high wind speeds.
3 Laboratory Study
3.1 Laboratory Set-Up and Experiment
The laboratory study to understand the effect of nearby buildings (upstream and downstream)on the plume rise was conducted in a custom-designed water channel. The water channel hasa test section that is 1.5 m long, 1 m wide and 0.5 m deep. Water circulates through the channeltest section using a 15 kW axial pump (Carry Manufacture, Inc.), which produces a maximummean velocity of 0.5 m s−1 in the test section. The pump flow rate is controlled through avariable frequency controller. Flow conditioning is achieved with the profiled honeycombsand custom-built perforated screens, which are used to generate desired inflow velocity pro-files. The channel has flow control capability to maintain a desired velocity profile, includingthe classical logarithmic and linear profiles. The water channel is equipped with the particleimage velocimetry (PIV, TSI Inc.) system for velocity measurements that can be used to mea-sure detailed velocity fields in the vertical or horizontal plane. PIV measurement techniquesare well established and widely used for fluid flow investigations (Adrian 1988, 1991, 1997;Prasad et al. 1992) and will not be discussed here. More details on the water-channel facilitycan be found in Princevac et al. (2010). Fluorescent dye (Uranine) is used as the tracer dye forflow visualizations, and desired plume buoyancies are achieved by mixing the tracer dye withwater and alcohol (specific gravity, SG = 0.8). The dyed plume is recorded through long expo-sure imaging. This technique gives us the average behaviour of the plume, which is used tomeasure the plume rise under different buoyancies, flow conditions, and building geometries.
In order to investigate plume rise associated with DPGs, a DPG building similar to the PalmSprings DPG (L ×W × H=15 m×15 m×7 m) with stack height of 9.3 m and stack diameterof 0.3 m (stack is located in the middle of the building) was modelled in the water channel at ascale of 1:100. It must be mentioned that the laboratory study shown herein does not representthe scaled problem from the Palm Springs field study, except for the geometry. In order toobserve the effect of surrounding buildings on plume rise, arrays of buildings (two rows andthree columns) of two different heights (single and double storey, with Hsingle = 100 mmand Hdouble = 200 mm, respectively) were created using Lego blocks, and were situatedas follows: (1) upstream of the DPG building; (2) downstream of the DPG building; and(3) upstream and downstream of the DPG building (Fig. 5). The upstream and downstreambuilding arrays were located at a distance of 150 mm from the upwind and downwind sidesof the DPG building, respectively. We are aware of the fact that the building configurationsused in the laboratory study do not necessarily resemble a typical urban environment. How-ever, since a hot plume rises above the urban canopy in a relatively short distance from thestack, its rise would be mainly affected by the nearby buildings rather than the overall urbangeometry. We should note that the background micrometeorology that governs the plumerise near the stack is dependent on the urban morphology (e.g. Luhar et al. 2006; Princevacand Venkatram 2007; Venkatram and Princevac 2008) and will not be discussed here.
Plume rise was measured under two different buoyancies (SG = 0.98 and 0.96). Theseplume buoyancies were selected in order to observe how plume rise affected by buildingschanges with an increase in buoyancy (buoyancy associated with a tracer of SG = 0.96 is
123
Rise of Buoyant Emissions from Low-Level Sources 297
Fig. 5 a Schematic of the buildings configuration. Model of the DPG and surrounding buildings situatedupstream (b, e), downstream (c, f), both upstream and downstream (d, g). Single storey (b, c, d) and doublestorey (e, f, g) buildings are investigated
equivalent to twice that of a tracer with SG = 0.98, since the buoyancy is proportional to1 − SG).
In scaling the freestream velocity, the most important similarity requirement is to satisfy aReynolds number independence criterion. Following Snyder (1981) and Yee et al. (2006), inorder to satisfy this criterion, the reference Reynolds number (Re), based on the freestreamvelocity (v∞) and characteristic building frontal length scale, H∗
b (length scale based on theobstacle frontal area; H∗
b = (W H)1/2) should be larger than 4,000. In the water channel,this is obtained for velocities larger than 0.039 m s−1, and in order to scale the field velocityof 3−4 m s−1, a velocity scale of 3:200 was used. This velocity scale was selected to havesufficiently high velocity flow to satisfy Re independence and at the same time to have a smallenough flow velocity to allow for accurate measurements of plume rise. Using this velocityscale, the average stack exit velocity (Vs) of 12.5 m s−1 in the field was scaled and modelledin the laboratory. Details of experimental conditions are given in Table 3.
3.2 Results
In the following section, the results obtained from these measurements are compared with theplume-rise measurements from a single DPG without any buildings in the vicinity (Pournazeri
123
298 S. Pournazeri et al.
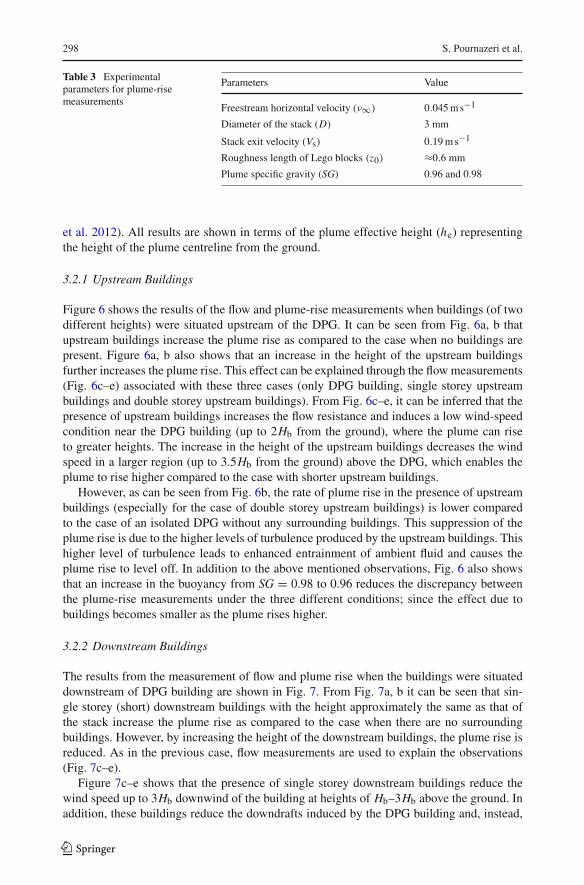
Table 3 Experimentalparameters for plume-risemeasurements
Parameters Value
Freestream horizontal velocity (ν∞) 0.045 m s−1
Diameter of the stack (D) 3 mm
Stack exit velocity (Vs) 0.19 m s−1
Roughness length of Lego blocks (z0) ≈0.6 mm
Plume specific gravity (SG) 0.96 and 0.98
et al. 2012). All results are shown in terms of the plume effective height (he) representingthe height of the plume centreline from the ground.
3.2.1 Upstream Buildings
Figure 6 shows the results of the flow and plume-rise measurements when buildings (of twodifferent heights) were situated upstream of the DPG. It can be seen from Fig. 6a, b thatupstream buildings increase the plume rise as compared to the case when no buildings arepresent. Figure 6a, b also shows that an increase in the height of the upstream buildingsfurther increases the plume rise. This effect can be explained through the flow measurements(Fig. 6c–e) associated with these three cases (only DPG building, single storey upstreambuildings and double storey upstream buildings). From Fig. 6c–e, it can be inferred that thepresence of upstream buildings increases the flow resistance and induces a low wind-speedcondition near the DPG building (up to 2Hb from the ground), where the plume can riseto greater heights. The increase in the height of the upstream buildings decreases the windspeed in a larger region (up to 3.5Hb from the ground) above the DPG, which enables theplume to rise higher compared to the case with shorter upstream buildings.
However, as can be seen from Fig. 6b, the rate of plume rise in the presence of upstreambuildings (especially for the case of double storey upstream buildings) is lower comparedto the case of an isolated DPG without any surrounding buildings. This suppression of theplume rise is due to the higher levels of turbulence produced by the upstream buildings. Thishigher level of turbulence leads to enhanced entrainment of ambient fluid and causes theplume rise to level off. In addition to the above mentioned observations, Fig. 6 also showsthat an increase in the buoyancy from SG = 0.98 to 0.96 reduces the discrepancy betweenthe plume-rise measurements under the three different conditions; since the effect due tobuildings becomes smaller as the plume rises higher.
3.2.2 Downstream Buildings
The results from the measurement of flow and plume rise when the buildings were situateddownstream of DPG building are shown in Fig. 7. From Fig. 7a, b it can be seen that sin-gle storey (short) downstream buildings with the height approximately the same as that ofthe stack increase the plume rise as compared to the case when there are no surroundingbuildings. However, by increasing the height of the downstream buildings, the plume rise isreduced. As in the previous case, flow measurements are used to explain the observations(Fig. 7c–e).
Figure 7c–e shows that the presence of single storey downstream buildings reduce thewind speed up to 3Hb downwind of the building at heights of Hb–3Hb above the ground. Inaddition, these buildings reduce the downdrafts induced by the DPG building and, instead,
123
Rise of Buoyant Emissions from Low-Level Sources 299
Fig. 6 Results from measurements of the plume effective height (he) associated with a DPG with and withoutupstream buildings for a SG = 0.96 and b SG = 0.98 (distances in horizontal and vertical directions are nor-malized with respect to the height of the DPG model building Hb = 0.07 m). Flow measurements associatedwith c only the DPG building, d the DPG building with single storey upstream buildings, and e the DPGbuilding with double storey upstream buildings (the blue vector lines show the velocity <0.01 m s−1 and thedark red vector lines show the velocity ≥0.05 m s−1 corresponding to approximate velocity of 3.5 m s−1 inthe field)
create slight updrafts in the vicinity of the DPG. Due to these two effects, the plume riseshigher when single storey downstream buildings are present. However, the effect of build-ings on plume rise is significantly different when the height of the downstream buildingsis doubled. As the general flow approaches the double storey downstream buildings, flowabove the stagnation point passes over the buildings and produces an updraft, but most ofthe flow is deflected towards the ground and produces a strong downdraft (Fig. 7e). Thiseffect has also been studied by Oke (1987) who mentioned that the stagnation point occursat approximately 2/3 the height of the building. The result from our flow measurements inFig. 7e shows this stagnation height at 3/4 of the building height. For the present analysis,knowledge of the exact stagnation height is not critical. Depending on whether the plumeapproaches the updraft above the stagnation height of the downstream building or the down-draft below this height, it may rise higher or lower. In the case of our laboratory study, due tothe low buoyancy and high wind speeds, the plume does not reach above the stagnation heightand pass over the downstream buildings. Therefore, the plume approaches the region whereit is dominated by downdrafts, which results in a lower plume rise. This effect becomesmore apparent when the buoyancy is decreased from SG = 0.96 to 0.98. The plume riseassociated with the double storey downstream buildings becomes slightly lower than for thecase when no surrounding buildings are present. Since the plume passes through the array ofdownstream buildings, no accurate plume rise measurements were possible in the vicinity ofthese buildings (discontinuity in the green line in Fig. 7a, b).
123
300 S. Pournazeri et al.
Fig. 7 Results from measurements of the plume effective height (he) associated with a DPG with and withoutdownstream buildings for a SG = 0.96, b SG = 0.98 (since for the case of tall, double storey, downstreambuildings, plume passes between the buildings, no measurements of plume rise were available in this region.This explains the discontinuity of the green line). Flow measurements associated with c only the DPG build-ing, d the DPG building with single storey downstream buildings and e the DPG building with double storeydownstream buildings
3.2.3 Upstream and Downstream Buildings
Figure 8 shows the results from the flow and plume rise measurements when both upstreamand downstream buildings were present. From Fig. 8a, b, it can be observed that a combina-tion of both upstream and downstream buildings causes the plume to rise higher; this increasein plume rise becomes larger when the height of the buildings is doubled. As in the previouscases, flow measurements were used to explain the observed effects.
Figure 8d shows that in the case of the single storey buildings, the presence of the upstreambuildings slightly reduces wind speed downwind of the DPG building from Hb to 2.5Hb abovethe ground. In addition, the downstream buildings reduce the downdrafts caused by the DPGbuilding. The reduced wind speeds and weaker downdrafts cause the plume to rise higher. Inthe case of the double storey buildings (Fig. 8e), the upstream buildings significantly reducethe wind speed close to stack, allowing the plume to rise to relatively greater heights withina short distance from the stack.
Unlike the case where only downstream buildings are present, the plume reaches abovethe stagnation height of the downstream buildings, where updrafts contribute to the plume’srising higher. Because of these two complementary effects (lower wind speed and updrafts),comparing to other test cases, the plume rise becomes maximum when both double storeyupstream and downstream buildings are present. It is interesting to note that, in the case of thedouble storey upstream and downstream buildings, plume rise does not change significantly
123
Rise of Buoyant Emissions from Low-Level Sources 301
Fig. 8 Results from measurements of plume effective height (he) associated with a DPG with and withoutupstream/downstream buildings for a SG = 0.96 and b SG = 0.98. Flow measurements associated with c onlythe DPG building, d the DPG building with single storey upstream and downstream buildings, and e the DPGbuilding with double storey upstream and downstream buildings
when the buoyancy is increased from SG = 0.98 to 0.96, since the plume rise is dominated bythe stack momentum (due to the relatively large Vs/v near the stack, where v is the ambientwind speed) and updrafts induced by the downstream buildings in close vicinity of the DPGbuilding. In addition, these buildings increase the ambient turbulence, which dominates theentrainment of ambient air into the plume and causes the plume to rise less at larger distancesfrom the stack.
3.3 Comparison with Numerical Plume-Rise Model
The results from the plume-rise measurements discussed previously are also compared withthe predictions from a new numerical plume-rise model (Pournazeri et al. 2012). This modelsolves the plume-rise governing equations developed by Hoult et al. (1969) modified toaccount for both vertical and horizontal wind-speed components, instead of only horizontal.This modification allows us to include the effects of updrafts/downdrafts induced by build-ings in the plume-rise model. Here we briefly introduce the essential features of the model,whose modified governing equations represent the conservation of mass flux,
d
ds(πb2uρ) = 2πbρ0
[α |u − v cos(γ ) − w sin(γ )| + β |v sin(γ ) − w cos(γ )|] , (9)
the conservation of momentum flux—along the plume centreline,
d
ds(πb2u2ρ) = (v cos(γ ) + w sin(γ ))
d
ds(πb2uρ) + (ρ0 − ρ)πb2g sin(γ ), (10)
123
302 S. Pournazeri et al.
Fig. 9 Schematic for a plume in a two-dimensional flow. Here, u is the velocity of the plume along itscenterline, v and w are the horizontal and vertical ambient velocities, respectively, s is along the centrelinecoordinate, γ is the plume centreline inclination, b is the averaged plume radius, ρ is the plume density, Tis the plume absolute temperature, Hs is the height of the stack, hp is the plume rise, and he is the plumeeffective height
the conservation of momentum flux—normal to the plume centreline,
πb2u2ρdγ
ds= − (v sin(γ ) − w cos(γ ))
d
ds(πb2uρ) + (ρ0 − ρ)πb2g cos(γ ), (11)
and the conservation of buoyancy flux,
d
ds(πb2u(ρ − ρ0)g) = −πb2uρ0
(g
θa
dθa
dz
)sin(γ ), (12)
where ρ is the plume density, ρ0 is the density of the ambient air, u is the velocity of theplume centreline, v and w are the horizontal and vertical ambient velocities, respectively, γ
is the plume centreline inclination, and θa is the ambient potential temperature. The entrain-ment coefficients for normal to and along the plume centreline are taken as β = 0.6 andα = 0.11, respectively (Hoult and Weil 1972). See Fig. 9 for schematics of the plume riseand parameters involved.
Following Eqs. 9–12, plume parameters b, u, ρ and γ as functions of s (distance on theplume centreline) can be numerically calculated and the plume rise hp and distance x asso-ciated with it can be found as,
hp =s∫
0
sin(γ )ds, (13)
x =s∫
0
cos(γ )ds. (14)
This model accounts for the influence of updrafts and downdrafts induced by buildings onthe plume rise by interpolating the velocity components v and w at any position x and z usingthe measured velocity fields shown in Sect. 3.2.
123
Rise of Buoyant Emissions from Low-Level Sources 303
In addition to the above-mentioned properties, this model also accounts for the effect ofambient turbulence by assuming that at large distances from the stack, where the entrainmentdue to the velocity difference between the plume and ambient is relatively small, the entrain-ment process becomes dominated by the plume growth due to ambient turbulence (Schulmanet al. 2000). As in Schulman et al. (2000), this effect can be modelled as,
d
ds(πb2uρ) = max
[d
ds(πb2uρ)entrainment, 2πbρ0v
(db
ds
)
amb.turb.
], (15)
where(
db
ds
)
amb.turb.
=√
π
2
σw
v, (16)
and is negligible for distances close to the stack with relatively small turbulent intensities(σw/v). However, in cases with relatively high turbulent intensities, ambient turbulence canreduce the plume rise at large distances. In Pournazeri et al. (2012), this model is eval-uated for the case where only the DPG building is present. In this study, using the flowmeasurements shown in the previous section, the plume effective height (he = hp + Hs)associated with the DPG model under different surrounding building geometries has beenpredicted and compared with the plume effective height measured in the laboratory (Fig. 10).This shows the results where the plume specific gravity is SG = 0.96 and the results frommodel comparison under the buoyancy of SG = 0.98 are given in the Appendix. It can beseen from Fig. 10 that the numerical plume-rise model performs reasonably well in pre-dicting the plume rise, as it accounts for the flow modifications induced by the surroundingbuildings. Similar results have also been obtained for a plume buoyancy with SG = 0.98(Fig. 11). The problem with this model is that it requires measured flow velocities as inputdata, which are not usually available. However, even when the full flow field data are notavailable, linear interpolation of limited available flow data points can be sufficient to con-struct the required inputs, although the results may not be as accurate as if the detailed flowvelocities were available. For the complex flow conditions that include updrafts, downdrafts,regions of increased and decreased flow velocities, one cannot expect a simple plume-riseformulation to perform satisfactorily. This plume-rise model can be easily implemented inan urban computational fluid dynamical (CFD) model for accurate calculations of the plumeheight.
4 Summary and Conclusion
The rapid increase in distributed power generation has raised concerns on the impact of DPGson the air quality in urban areas. The pollutants produced due to the combustion process inDPGs are released at relatively low heights (about 10 m) in urban areas in the vicinity ofbusinesses, schools, hotels, and hospitals where they can be captured in the wake of sur-rounding buildings, increasing the ground level concentrations and human exposure. Theprocess of DPG heat recovery decreases the exhaust temperature, leading to a lower plumerise and even higher ground-level concentrations. Therefore, realistic modelling of plumerise from DPGs plays a major role in determining the ground-level concentrations associatedwith these sources. In this study, laboratory and field measurements have been conducted toinvestigate the plume rise associated with these low-level buoyant sources under differentmeteorological conditions and surrounding building geometries.
123
304 S. Pournazeri et al.
Fig. 10 Comparison of the plume effective height (he) observations (blue) with the numerical plume-risemodel (red) for plume buoyancy of SG = 0.96. Comparisons were done for cases a with an upstream singlestorey building array; b with an upstream double storey building array; c with a downstream single storeybuilding array; d with a downstream double storey building array; e with upstream and downstream sin-gle storey building arrays; and f with upstream and downstream double storey building arrays. Distances inthe horizontal and vertical directions are normalized with respect to the height of the DPG model buildingHb = 0.07 m
Initially, we described the field study conducted in November of 2010, where the plumerise associated with a DPG located at Palm Springs, California, USA was measured. Meteo-rological parameters, such as the mean and turbulent wind speeds, and the sensible heat flux,were measured using sonic anemometers. On 9 November 2010, the plume rise was mea-sured for a 40-min period (1400–1440), and was compared with the results from the Briggs
123
Rise of Buoyant Emissions from Low-Level Sources 305
(1984) plume-rise model. The Briggs plume-rise prediction was in good agreement with theobservations from the field study, which show that the relatively sparse and small buildingssurrounding the DPG do not have a significant impact on plume rise. The low wind speeds atPalm Springs allow the plume to rise to greater heights relative to the stack, avoiding possibletrapping by the updrafts and downdrafts caused by the DPG and surrounding buildings. Thegreater the plume rise, the smaller are the effects of the buildings on plume rise.
The Palm Springs field study represented a low-wind case that might not be necessarilya general case in urban environments. In order to have a more generalized understandingof the plume rise affected by buildings, experiments under relatively high wind-speed con-ditions are required. Since conducting multiple field studies is prohibitively expensive andtime consuming, laboratory simulations are an efficient means of studying such a problem.Thus, we described water-channel simulations that were conducted to observe the effectsof nearby buildings (upstream and downstream) on plume rise under relatively high windspeeds (≈3–4 m s−1). Plume rise from a DPG model was measured under different surround-ing building geometries and source conditions. Arrays of buildings (2 × 3) of two differentheights (single and double storey) were created and situated upwind and downwind of theDPG building (Fig. 5). Due to the lack of complexity of these building geometries, theydo not necessarily represent a typical urban environment, and the plume-rise measurementsdemonstrate a first-order sensitivity of the plume to surrounding buildings rather than urbaneffects. However, it must be noted that, due to their relatively high momentum and buoyancy,such plumes tend to rise rapidly close to the source. As a result, they are only affected bythe updrafts and downdrafts of the buildings within relatively short distances from the stack.However, it must also be mentioned that the upwind micrometeorological conditions thatgoverns the plume rise near the stack is dependent on urban morphology and is not limitedto nearby buildings.
The results from laboratory measurements show that, in most cases, the presence of sur-rounding buildings increases the plume rise, since buildings reduce the wind speed close tothe stack and induce updrafts in the region where the plume tends to rise. As mentioned ear-lier, these results do not declare the urban influence on plume rise; however, they provide veryuseful data for analyzing the plume rise in urban areas where geometries are significantlycomplex.
Finally, the results from the plume-rise measurements in the laboratory were comparedwith the results from the newly developed numerical plume-rise model. Using the flow mea-surements described in Sect. 3.2, plume rise associated with each laboratory case study waspredicted and compared with the measured plume-rise experiments conducted in the waterchannel. It is observed that this model is able to accurately predict the plume rise, as it accountsfor the effect of surrounding buildings. To apply this plume-rise model to the field case, mea-surements of building caused flows are needed. However, with the significant improvementin CFD models throughout the past decade, future work will combine this plume-rise modelwith a CFD model and evaluate it with field measurements.
Acknowledgments The authors are very grateful to two anonymous reviewers and Mr. Trevor Maynardfor careful reviews and helpful comments. This work was supported by the California Energy Commission,contract number 500-08-055. We would like to thank Karim Alizad, Christian Bartlome, Si Tan, Nico Schulte,Senyeung Shu, Manuel Michael, Eric Gutierrez, and Qiguo Jing for their help in the field and laboratorystudies. Special thanks go to the City of Palm Springs for their support of this study. Field assistance fromMr. Steven Vinci and logistic assistance from Mr. Jan Anderson of the City of Palm Springs, Department ofFacilities were invaluable.
123
306 S. Pournazeri et al.
Appendix
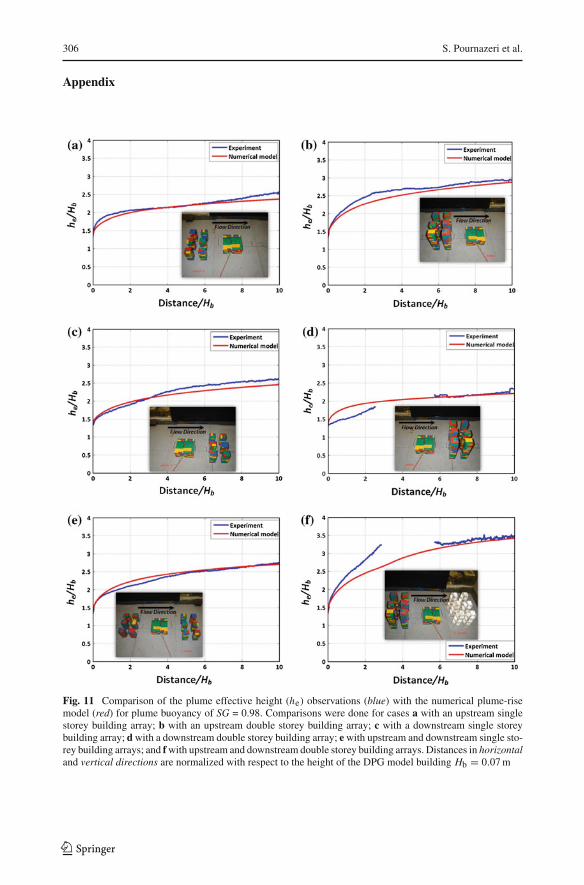
Fig. 11 Comparison of the plume effective height (he) observations (blue) with the numerical plume-risemodel (red) for plume buoyancy of SG = 0.98. Comparisons were done for cases a with an upstream singlestorey building array; b with an upstream double storey building array; c with a downstream single storeybuilding array; d with a downstream double storey building array; e with upstream and downstream single sto-rey building arrays; and f with upstream and downstream double storey building arrays. Distances in horizontaland vertical directions are normalized with respect to the height of the DPG model building Hb = 0.07 m
123
Rise of Buoyant Emissions from Low-Level Sources 307
References
Adrian RJ (1988) Review of particle image velocimetry research. In: The symposium on optical methods inflow and particle diagnostics, 6th international congress on applications of lasers and electro-optics, SanDiego, CA. Opt Lasers Eng 9:317–319
Adrian RJ (1991) Particle-imaging techniques for experimental fluid-mechanics. Annu Rev Fluid Mech23:261–304
Adrian RJ (1997) Dynamic ranges of velocity and spatial resolution of particle image velocimetry. Meas SciTechnol 8(12):1393–1398
Allison KE, Lents J (2002) Encouraging distributed generation of power that improves air quality: can wehave our cake and eat it too?. J Energy Policy 30(9):737–752
Allwine KJ, Flaherty JE (2006) Joint urban 2003: study overview and instrument locations. PNNL-15967,Prepared for the U.S. Department of Homeland Security under a related services agreement with theU.S. Department of Energy under contract DE-AC05-76RL01830. Pacific Northwest National Labora-tory, Richland
Arya SPS, Lape JF (1990) A comparative study of the different criteria for the physical modeling of buoyantplume rise in a neutral atmosphere. Atmos Environ 24(2):289–295
Bacci P, Elisei G, Longhetto A (1974) Lidar measurement of plume rise and dispersion at Ostiglia powerstation. Atmos Environ 8(11):1177–1186
Bosanquet CH (1957) The rise of a hot waste gas plume. J Inst Fuel 30:322–329Briggs GA (1969) Plume rise. U.S Army Environmental Centre critical review series. Report number TID-
25075. USAEC Technical Information Centre, Oak RidgeBriggs GA (1984) Plume rise and buoyancy effects. In: Randerson D (ed) Atmospheric science and power pro-
duction, DOE/TIC-27601 (DE84005177). Office of Research, US Department of Energy, Washington,pp 327–366
Bringfelt B (1968) Plume rise measurements at industrial chimneys. Atmos Environ 2(6):575–598Britter RE, Hanna SR (2003) Flow and dispersion in urban areas. Annu Rev Fluid Mech 35:469–496Carpenter SB, Frizzola JA, Smith ME, Leavitt JM, Thomas FW (1968) Full-scale study of plume rise at large
electric generating stations. J Air Pollut Control Assoc 18(7):458–465Carruthers DJ, Holroyd R, Hunt J, Weng WS, Robins AG, Apsley D, Thomson D, Smith F (1994) UK-ADMS:
a new approach to modelling dispersion in the earth’s atmospheric boundary layer. J Wind Eng Ind Aer-odyn 52:139–153
Carruthers DJ, Mckeown AM, Hall DJ, Porter S (1999) Validation of ADMS against wind tunnel data ofdispersion from chemical warehouse fires. Atmos Environ 33:1937–1953
Cermak JE, Davenport AG, Plate EJ, Viegas DX (1995) Wind climate in cities, proceedings of a NATOAdvanced Study Institute, NATO ASI Series E, 277. Kluwer, Dordrecht, 772 pp
Cimorelli AJ, Perry SG, Venkatram A, Weil JC, Paine RJ, Wilson RB, Lee RF, Peters WD, BrodeR (2005) AERMOD: a dispersion model for industrial source applications. Part I: General model for-mulation and boundary layer characterization. J Appl Meteorol 44:682–693
Contini D, Robins A (2001) Water tank measurements of buoyant plume rise and structure in neutral crossflows. Atmos Environ 35(35):6105–6115
Contini D, Robins AG (2004) Experiments on the rise and mixing in neutral crossflow of plumes from twoidentical sources for different wind directions. Atmos Environ 38:3573–3583
Contini D, Donateo A, Cesari D, Robins AG (2011) Comparison of plume rise models against water tankexperimental data for neutral and stable crossflows. J Wind Eng Ind Aerodyn 99(5):539–553
EPA (2008) AERSURFACE user’s guide, EPA-454/B-083-001. U.S. Environmental Protection Agency,Research Triangle Park
Fay JA (1973) Buoyant plumes and wakes. Annu Rev Fluid Mech 5: 151–160. doi:10.1146/annurev.fl.05.010173.001055
Greene N, Hammerschlag R (2000) Small and clean is beautiful: exploring the emissions of distributed gen-eration and pollution prevention policies. Electr J 13(5): 50–60. doi:10.1016/S1040-6190(00)00118-4
Hadley SW, Van Dyke JW (2003) Emissions benefits of distributed generation in the Texas market. Preparedfor the United States, Department of Energy under contract No. DE-AC05-00OR2272, Report numberORNL/ TM-2003/100. Oak Ridge National Laboratory, Oak Ridge
Halliday EC (1968) Measurements of the rise of hot plumes. Atmos Environ 2(5):509–516Hamilton PM (1967) Paper III: Plume height measurements at Northfleet and Tilbury power stations. Atmos
Environ 1(4):379–387Heath GA, Granvold PW, Hoats AS, Nazaroff WW (2006) Intake fraction assessment of the air pollutant
exposure implications of a shift toward distributed electricity generation. Atmos Environ 40(37):7164–7177
Hoult DP, Weil JC (1972) Turbulent plume in a laminar cross flow. Atmos Environ 6(8):513–530Hoult DP, Fay J, Forney L (1969) A theory of plume rise compared with field observations. J Air Pollut Control
Assoc 19:585–590Hunter GC (1992) The behaviour of plumes from point sources in stratified flows. Ph.D. Thesis, National
Power Research and Technology Department, 275 pp. Available from British Library Document SupplyCentre DSC: DX172355
Jing Q, Pankratz D, Princevac M, Venkatram A (2009) Modeling dispersion of buoyant releases in an urbanarea. In: 89th AMS annual meeting, 11th conference on atmospheric chemistry, special symposium onaerosol–cloud–climate interactions, 89th annual meeting, Phoenix, AZ, January 2009
Jing Q, Venkatram A, Princevac M, Pankratz D, Qian W (2010) Modeling dispersion of buoyant emissionsfrom low level sources in an urban area. In: 90th AMS annual meeting, 16th conference on air pollutionmeteorology, Atlanta, GA, January 2010
Lucas DH, Moore DJ, Spurr G (1963) The rise of hot plumes from chimneys. Int J Air Water Pollut 7:473–500Luhar AK, Venkatram A, Lee SM (2006) On relationships between urban and rural near-surface meteorology
for diffusion applications. Atmos Environ 40(34):6541–6553Ohba R, Kakishima S, Ito S (1990) Water tank study of plume rise and diffusion in a stably stratified layer
under calm conditions. Il Nuovo Cimento C 13(6):1017–1028Oke TR (1987) Boundary layer climates, 2nd edn. Routledge, London, 435 ppPournazeri S, Princevac M, Venkatram A (2012) Scaling of building affected plume rise and dispersion in
water channels and wind tunnels—revisit of an old problem. J Wind Eng Ind Aerodyn 103:16–30. doi:10.1016/j.jweia.2012.01.006
Prasad AK, Adrian RJ, Landreth CC, Offutt PW (1992) Effect of resolution on the speed and accuracy ofparticle image velocimetry interrogation. Exp Fluids 13(2–3):105–116
Priestley CHB (1956) A working theory of the bent-over plume of hot gas. Q J Roy Meteorol Soc 82(352):165–176. doi:10.1002/qj.49708235203
Princevac M, Venkatram A (2007) Estimating micrometeorological inputs for modeling dispersion in urbanareas during stable conditions. Atmos Environ 41(26):5345–5356
Princevac M, Baik J, Li X, Pan H, Park S (2010) Lateral channeling within rectangular arrays of cubicalobstacles. J Wind Eng Ind Aerodyn 98(8–9): 377–385. doi:10.1016/j.jweia.2009.11.001
Robins AG, McHugh C (2001) Development and evaluation of the ADMS building effects module. IntJ Environ Pollut 16(1–6):161–174
Robins AG, Carruthers DJ, McHugh CA (1997a) The ADMS building effects module. Int J Environ Pollut8:708–717
Robins AG, McHugh CA, Carruthers DJ (1997b) Testing and evaluating the ADMS building effects module.Int J Environ Pollut 8(3–6):708–717
Rodriquez MA, Carreras-Sospedra M, Medrano M, Brouwer J, Samuelsen GS, Dabdub D (2006) Air qualityimpacts of distributed power generation in the South Coast Air Basin of California 1: scenario develop-ment and modeling analysis. Atmos Environ 40(28):5508–5521
Rotach MW, Gryning SE, Batchvarova E, Christen A, Vogt R (2004) Pollutant dispersion close to an urbansurface—the BUBBLE tracer experiment. Meteorol Atmos Phys 87(1–3):39–56
SCAQMD (2009) 26 Sites with AERMOD-ready meteorological data, South Coast Air Quality ManagementDistrict, Diamond Bar, CA. http://www.aqmd.gov/smog/metdata/AERMOD_Table2.html. AccessedNov 2011
Schulman LL, Strimaitis DG, Scire JS (2000) Development and evaluation of the PRIME plume rise andbuilding downwash model. J Air Waste Manag Assoc 50:378–390
Snyder WH (1981) Guidelines for fluid modeling of atmospheric diffusion. Report number EPA-600/8-81-009.Environmental Protection Agency, Research Triangle Park, 200 pp
Snyder WH (1985) Fluid modeling of pollutant transport and diffusion in stably stratified flows over complexterrain. Annu Rev Fluid Mech 17:239–266
Venkatram A, Princevac M (2008) Using measurements in urban areas to estimate turbulent velocities formodeling dispersion. Atmos Environ 42(16):3833–3841
Venkatram A, Isakov V, Yuan J, Pankratz D (2004a) Modeling dispersion at distances of meters from urbansources. Atmos Environ 38(28):4633–4641
Venkatram A, Isakov V, Pankratz D, Heumann J, Yuan J (2004b) The analysis of data from an urban dispersionexperiment. Atmos Environ 38(22):3647–3659
Weil JC (1988) Plume rise. In: Venkatram A, Wyngaard JC (eds) Lectures in air pollution modeling. AmericanMeteorological Society, Boston pp 119–166
Yee E, Gailis RM, Hill A, Hilderman T, Kiel D (2006) Comparison of wind-tunnel and water-channel simu-lations of plume dispersion through a large array of obstacles with a scaled field experiment. Boundary-Layer Meteorol 121(3):389–432


![[Food Processing] Milk Dairy Sector, Supply Chain, Upstream Downstream Issues, Amul Model, Operation Flood « Mrunal](https://static.documents.pub/doc/80x56/563dba60550346aa9aa51952/food-processing-milk-dairy-sector-supply-chain-upstream-downstream-issues.jpg)


