6/20/2013 1 Risk Analysis Workshop Risk Analysis Workshop Presented by: Greg Davis, P.E., State Estimates Engineer and Kurt Lieblong, P.E., State Project Review Administrator Risk Analysis Process Training
Transcript
6/20/2013
1
Risk Analysis WorkshopRisk Analysis Workshop
Presented by:Greg Davis, P.E., State Estimates Engineer and Kurt Lieblong, P.E., State Project Review Administrator
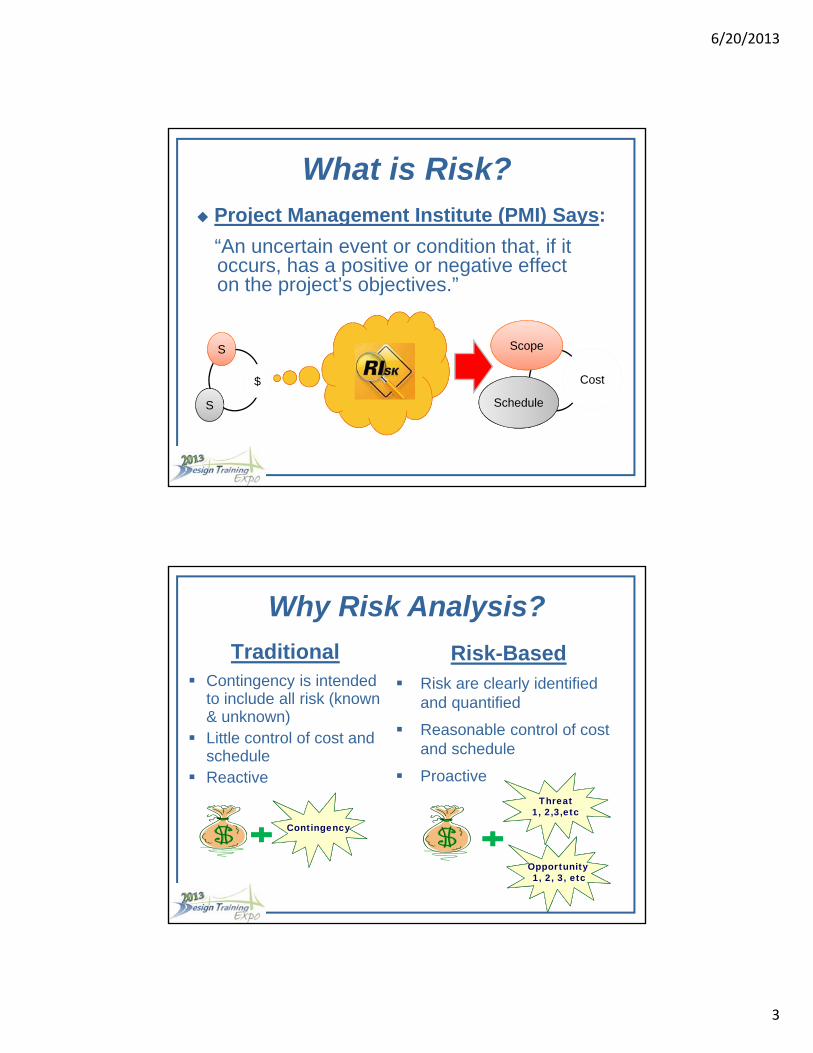
What is Risk? Project Management Institute (PMI) Says:
“An uncertain event or condition that, if it occurs, has a positive or negative effecton the project’s objectives.”
$
S
S
Scope
Schedule
Cost
Why Risk Analysis?
Traditional Contingency is intended
to include all risk (known & unknown)
Little control of cost and schedule
Reactive
Risk-Based Risk are clearly identified
and quantified
Reasonable control of costand schedule
Proactive
ThreatThreat1, 2,3,etc
OpportunityOpportunity1, 2, 3, etc
ContingencyContingency
6/20/2013
4
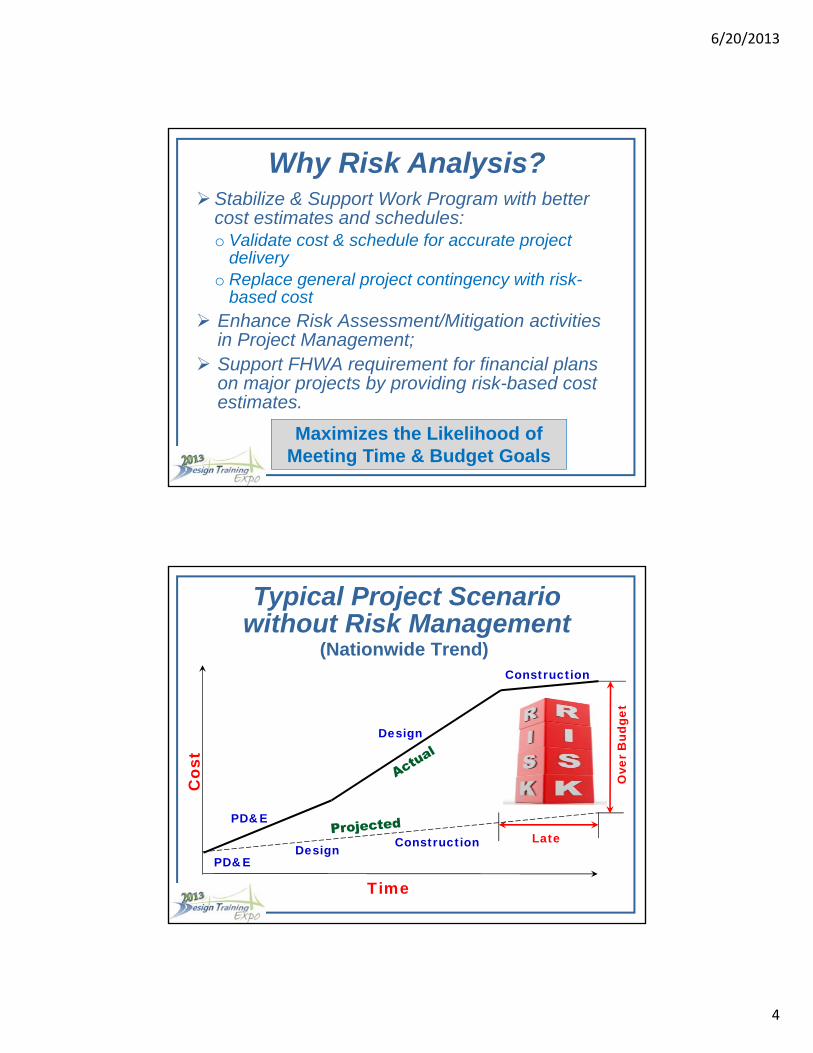
Why Risk Analysis?Stabilize & Support Work Program with better
cost estimates and schedules:o Validate cost & schedule for accurate project
delivery o Replace general project contingency with risk-
based cost Enhance Risk Assessment/Mitigation activities
in Project Management; Support FHWA requirement for financial plans
on major projects by providing risk-based cost estimates.
Maximizes the Likelihood of Meeting Time & Budget Goals
PD&E
Design
Construction
Late
Ove
rB
udge
t
Cos
t
TimePD&E
Design Construction
Typical Project Scenario without Risk Management
(Nationwide Trend)
6/20/2013
5
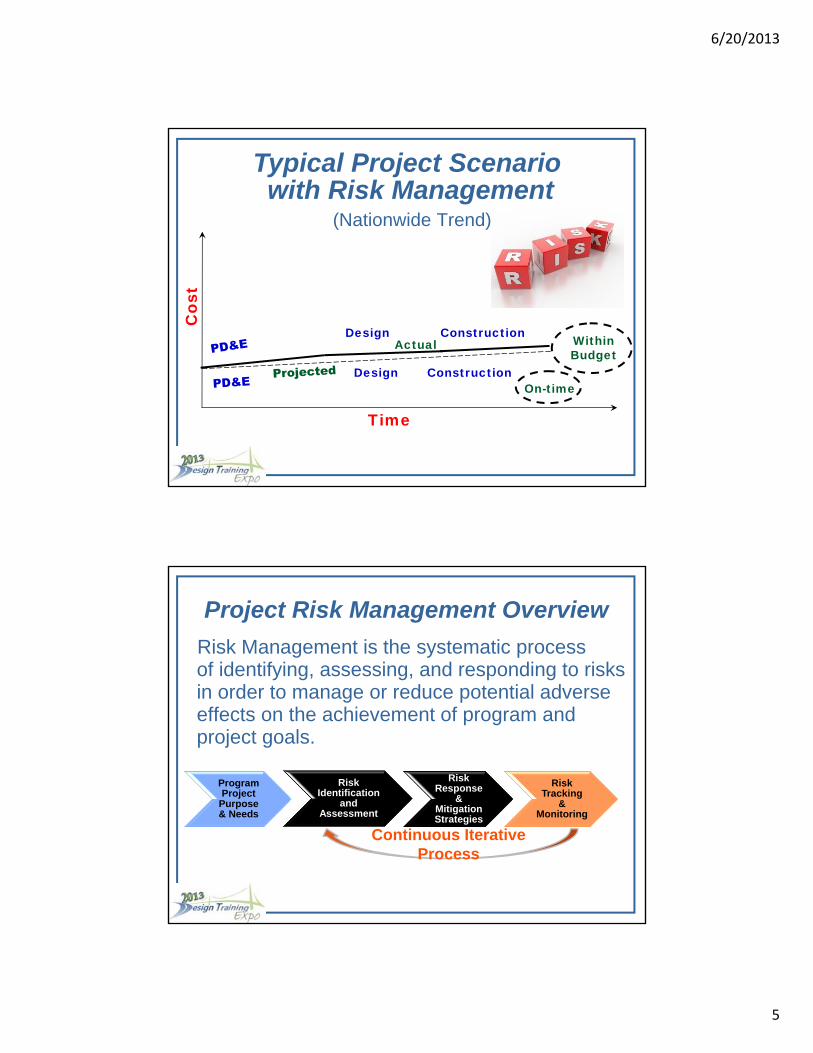
Cos
t
Time
Design Construction
Typical Project Scenariowith Risk Management
Design ConstructionActual
On-time
Within Budget
(Nationwide Trend)
Program Project
Purpose & Needs
Risk Identification
and Assessment
Risk Response
& Mitigation Strategies
Risk Tracking
& Monitoring
Project Risk Management Overview
Risk Management is the systematic processof identifying, assessing, and responding to risks in order to manage or reduce potential adverse effects on the achievement of program and project goals.
Continuous Iterative Process
6/20/2013
6
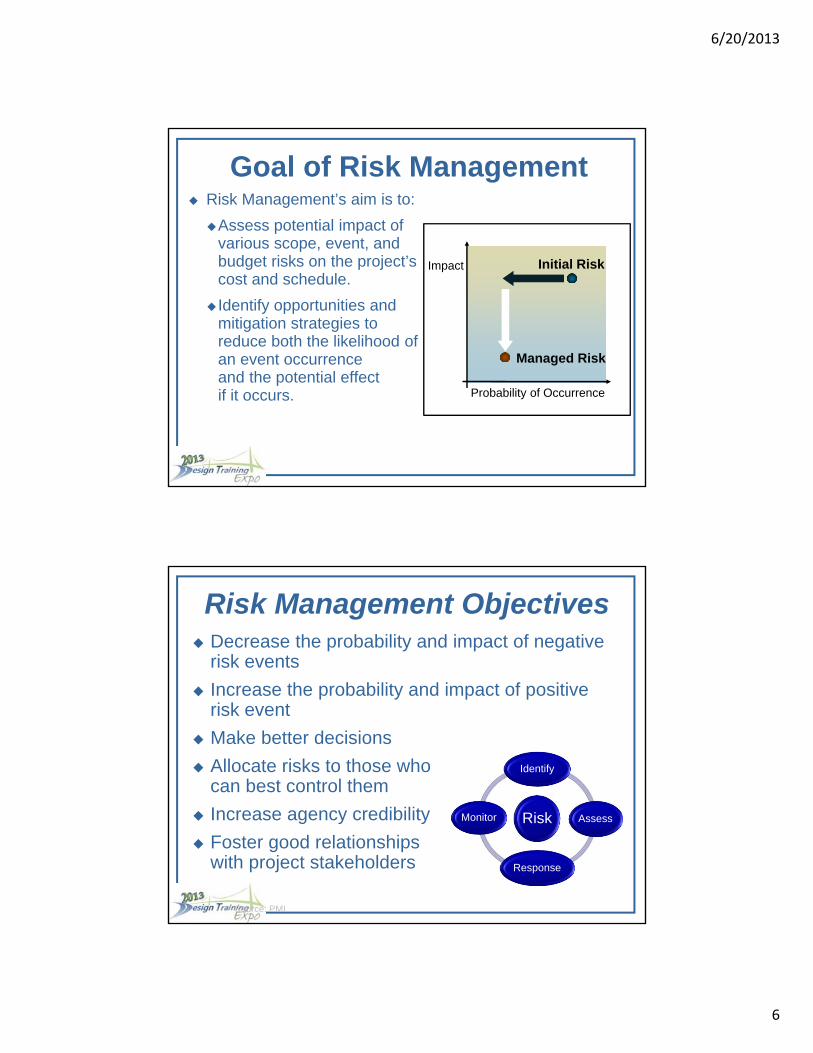
Goal of Risk Management Risk Management’s aim is to:
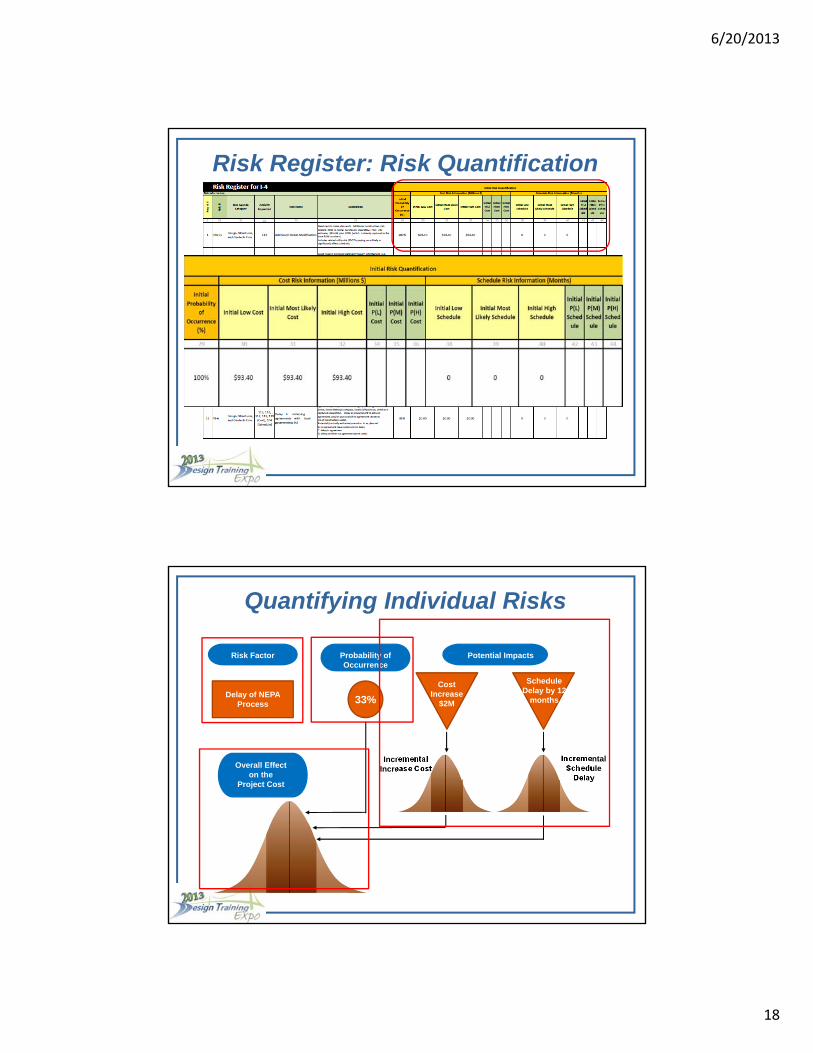
Assess potential impact of various scope, event, and budget risks on the project’s cost and schedule.
Identify opportunities and mitigation strategies to reduce both the likelihood of an event occurrenceand the potential effectif it occurs. Probability of Occurrence
Impact Initial Risk
Managed Risk
Risk Management Objectives Decrease the probability and impact of negative
risk events
Increase the probability and impact of positive risk event
Make better decisions
Allocate risks to those whocan best control them
Increase agency credibility
Foster good relationshipswith project stakeholders
* Source: PMI
Risk
Identify
Assess
Response
Monitor
6/20/2013
7
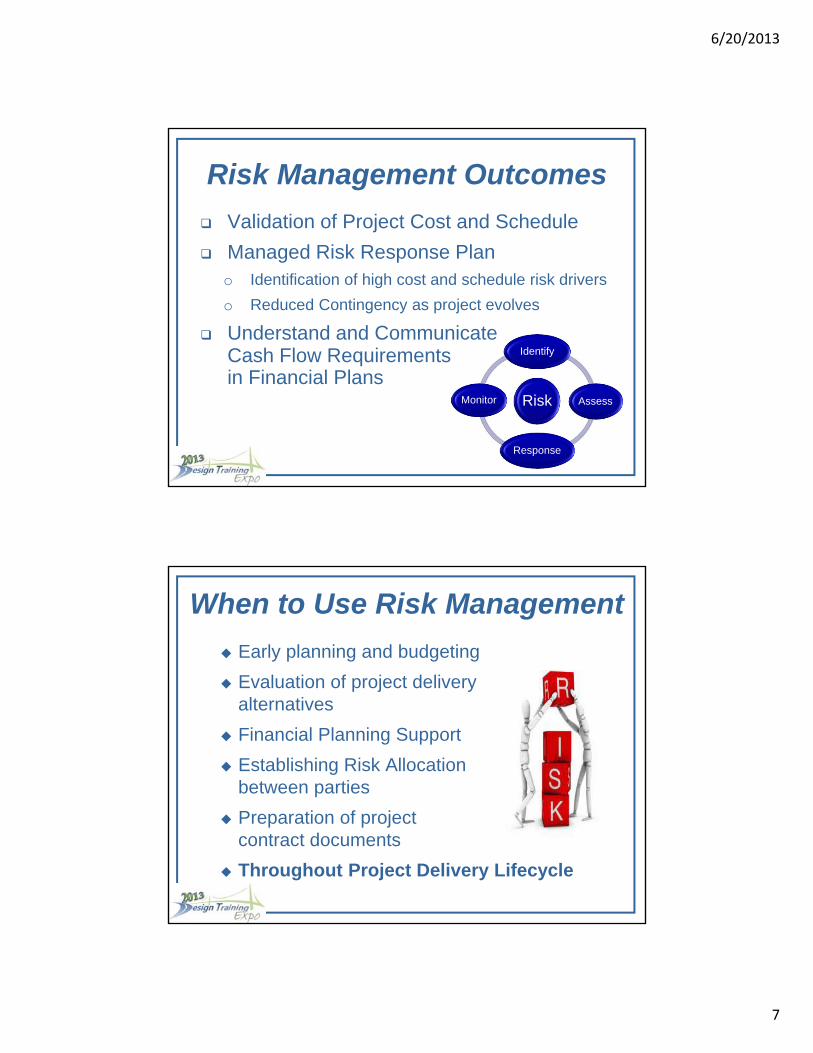
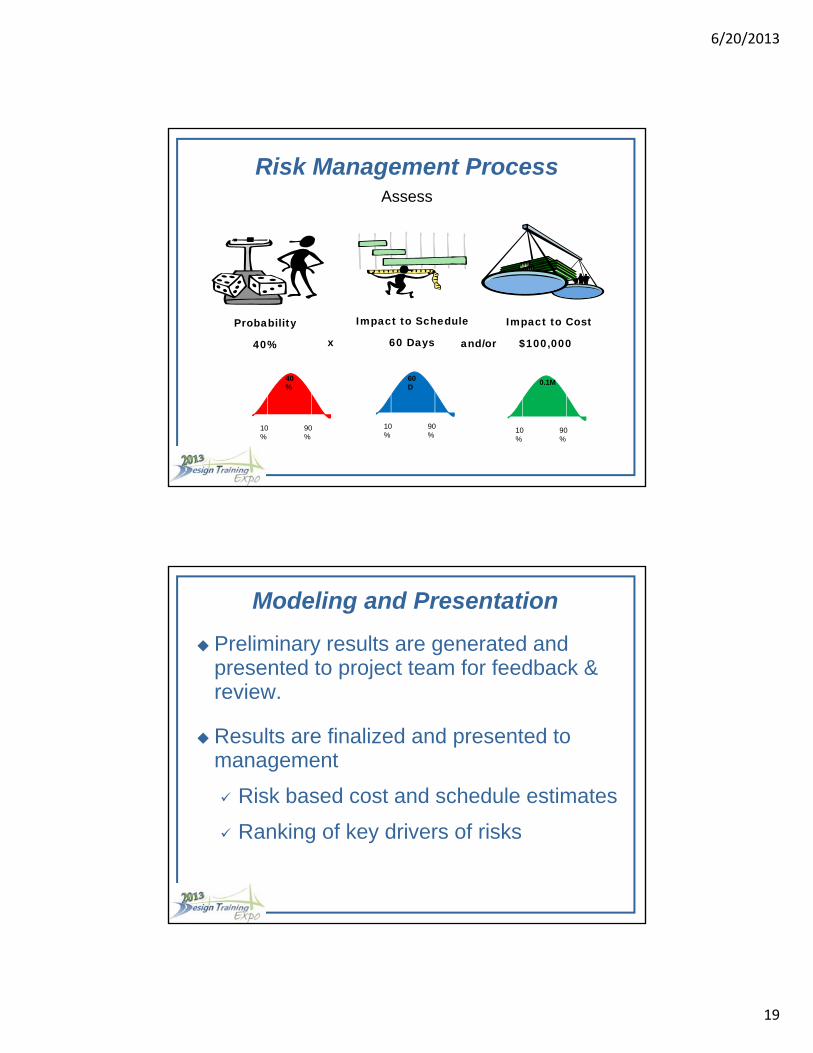
Risk Management Outcomes
Validation of Project Cost and Schedule
Managed Risk Response Plano Identification of high cost and schedule risk drivers
o Reduced Contingency as project evolves
Understand and CommunicateCash Flow Requirementsin Financial Plans
Risk
Identify
Assess
Response
Monitor
When to Use Risk Management
Early planning and budgeting
Evaluation of project deliveryalternatives
Financial Planning Support
Establishing Risk Allocationbetween parties
Preparation of projectcontract documents
Throughout Project Delivery Lifecycle
6/20/2013
8
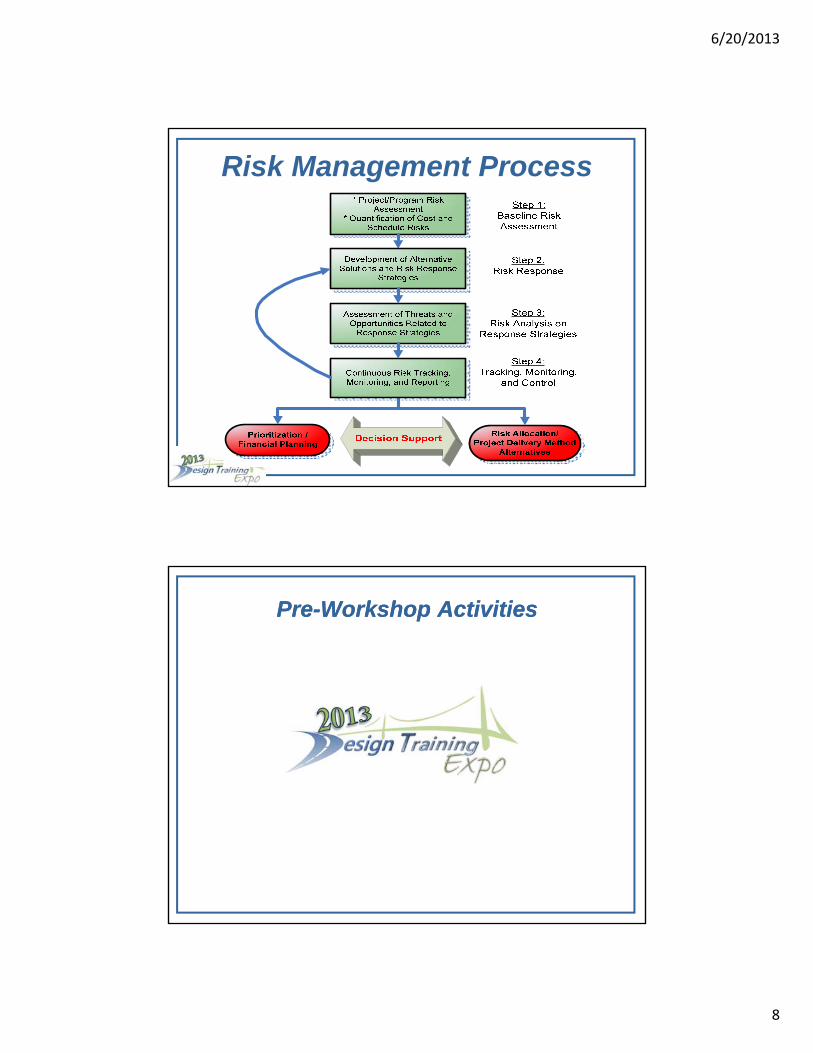
Risk Management Process
Pre-Workshop ActivitiesPre-Workshop Activities
6/20/2013
9
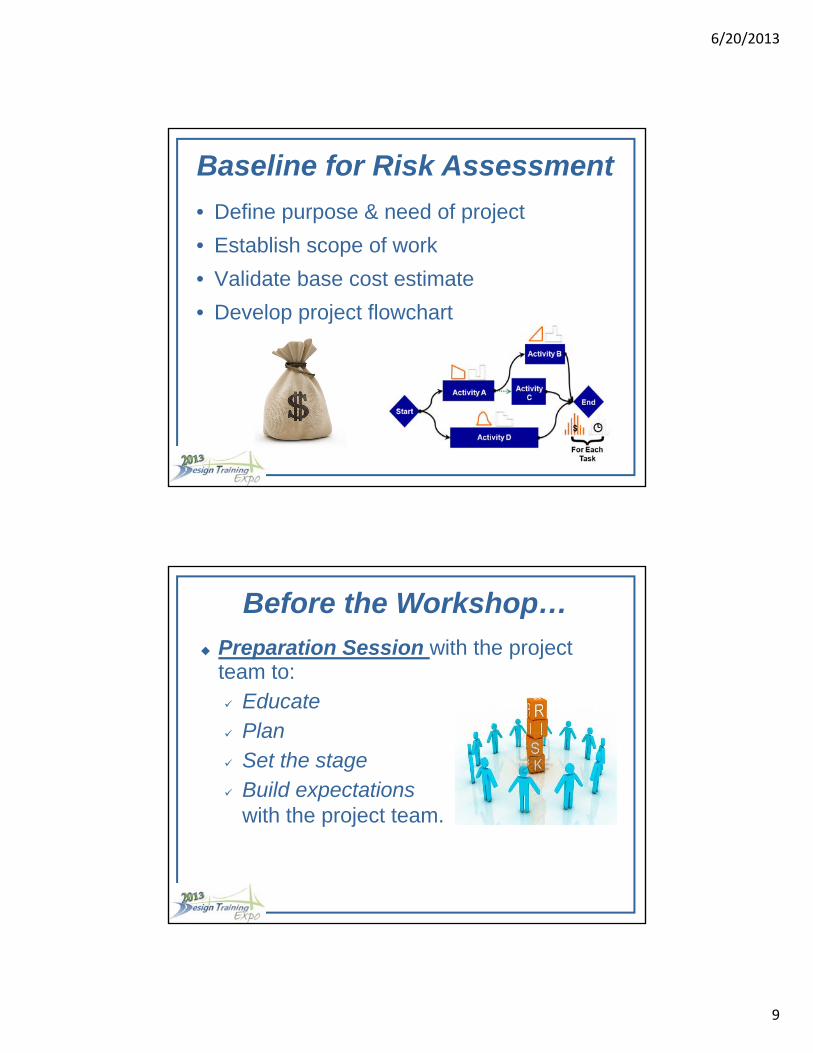
Baseline for Risk Assessment
• Define purpose & need of project
• Establish scope of work
• Validate base cost estimate
• Develop project flowchart
Before the Workshop…
Preparation Session with the project team to: Educate Plan Set the stage Build expectations