25
Danish Maritime Authority and Royal Danish Administration of Navigation and Hydrography Risk Analysis of Navigational Safety in Danish Waters June 2002
| Date post: | 22-Apr-2018 |
| Category: |
Documents |
| Upload: | phungkhanh |
| View: | 228 times |
| Download: | 4 times |
Danish Maritime Authority and Royal Danish Administration of Navigation and Hydrography
Risk Analysis of Navigational Safety in Danish Waters
June 2002

Danish Maritime Authority and Royal Danish Administration of Navigation and Hydrography
Risk Analysis of Navigational Safety in Danish Waters
June 2002
Report no. P-054380-2
Issue no. 1
Date of issue 17 June 2002
Prepared AFH
Checked JOV
Approved AFH
Risk Analysis of Navigational Safety in Danish Waters
P:\54380A\PDOC\Aflevering juni 2002\Summary.DOC
1
Table of ContentsTable of ContentsTable of ContentsTable of Contents
1 Introduction 2 1.1 Objective 2 1.2 Background 2 1.3 Methodology 3 1.4 Limitations and assumptions 3
2 Analysis 5 2.1 Step 1: Selection of locations for further analysis 5 2.2 Step 2: Accident scenarios and risk control options 6 2.3 Step 3: Selection of RCOs for further analysis 7 2.4 Step 4: Existing navigational safety 7 2.5 Step 5: Risk reduction factors 8 2.6 Step 6: Costs of RCOs 9 2.7 Step 7: Costs per averted spill 10 2.8 Step 8: Acceptance criteria 12
3 Conclusion 15
4 References 17
5 Appendix A: Maps 18
Risk Analysis of Navigational Safety in Danish Waters
P:\54380A\PDOC\Aflevering juni 2002\Summary.DOC
2
1 Introduction This report is a summary of the analysis report "Risk Analysis of Navigational Safety in Danish Waters" (in Danish). The reports have been prepared by COWI A/S on behalf of the Danish Maritime Authority and the Royal Danish Administration of Navigation and Hydrography. The work has been carried out from October 2001 to June 2002.
1.1 Objective The objective of the risk analysis is to establish a basis for deciding the imple-mentation of measures which can reduce the risk of oil spills in Danish waters. The analysis also forms a basis for prioritising the individual measures (risk control options). Finally, guidelines are provided for the permissible costs of a risk control option so that a reasonable relationship between costs and risk re-duction is ensured.
1.2 Background The collision between the tanker 'Baltic Carrier' and the cargo ship 'Tern' south-east of the island Møn on 29 March 2001 resulted in a spill of approximately 2,700 tons of heavy fuel oil. The public subsequently raised questions about the navigational safety in Danish waters and about the emergency preparedness for this type of accident.
Thereafter a series of measures were launched to improve the navigational safety. In September 2001 a meeting was held within the framework of HEL-COM. The following measures were decided:
1. The Deep Water route southeast of Møn will be extended into the traffic separation scheme "South of Gedser"
2. The use of pilots in the Sound and in the Great Belt will be increased 3. The use of electronic chart display systems (ECDIS) will be increased 4. No later than 2005, a land-based system for surveillance of the traffic in the
entire Baltic area will be established. It will be based on Automatic Identi-fication System (AIS)
5. Single hull tankers will be phased out 6. Port state control will be intensified

Risk Analysis of Navigational Safety in Danish Waters
P:\54380A\PDOC\Aflevering juni 2002\Summary.DOC
3
In addition, the Danish Maritime Administration and the Royal Danish Admini-stration of Navigation and Hydrography have initiated the present analysis of the navigational safety and risk-reducing measures.
1.3 Methodology The risk-reducing effect of implementing various risk control options (RCOs), such as Vessel Traffic Service (VTS) centres, are assessed. The risk reduction is calculated relative to the present navigational safety.
The present navigational safety is expressed as the expected annual number of spills of oil, gas or chemicals. The risk reduction resulting from each RCO can thus be expressed as the number of averted spills if the measure is imple-mented.
The initial cost and the operating costs of each RCO are estimated. By compar-ing the costs to the number of averted spills, the costs of averting a spill can be computed. This number expresses the cost-effectiveness of the RCO. When the costs of averting a spill have been computed for all RCOs and all locations, it is possible to identify the RCOs which have the largest risk reduction for the money spent.
In order to find a reasonable price to pay for averting a spill, the cost of the RCO is compared to the costs associated with occurrence of a spill. The cost of an occurrence can be divided into direct and indirect costs, of which only the direct costs have been assessed in this report.
The introduction of AIS (Automatic Identification System) and other planned RCOs has a significant impact on the cost-effectiveness of new RCOs. This is because the absolute safety gain (and thereby the cost-effectiveness) of an RCO is low if the present risk level is low. Since the planned RCOs are being im-plemented gradually over a longer period of time, the cost-effectiveness of the individual new RCOs will decrease accordingly. Therefore the cost-effectiveness is assessed both for situation 2001 and for a hypothetical future situation (situation 2008). The year 2008 has been chosen because implementa-tion of AIS is expected to be completed in 2008. It should, however, be men-tioned that international work is in progress for an earlier implementation.
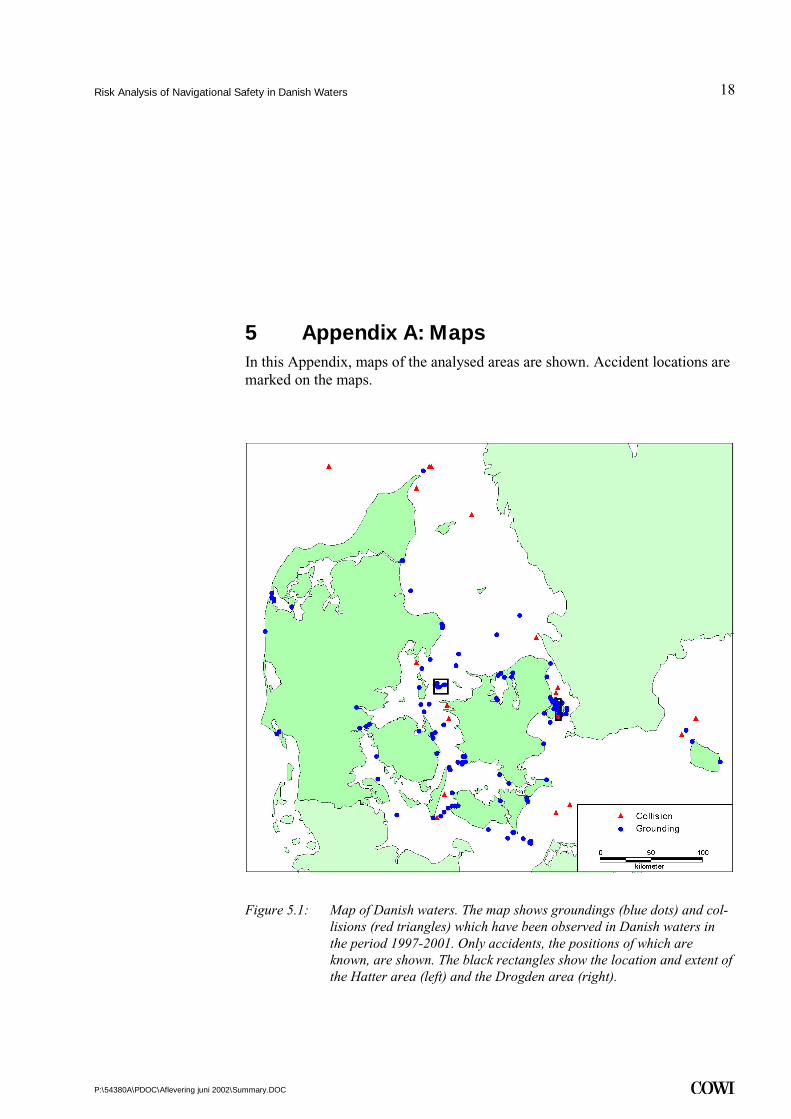
1.4 Limitations and assumptions The first step of the analysis identifies a number of locations in Danish waters which have a high accident frequency. See Figure 5.1. The remaining part of the analysis focuses exclusively on these locations.
The analysis regards the event of spill caused by ship-ship collision or ground-ing. Illegal oil discharge because of tank cleaning etc. is therefore not included. The spill risk is defined as the expected number of annual spills of oil (cargo or bunker), gas or chemicals.

Risk Analysis of Navigational Safety in Danish Waters
P:\54380A\PDOC\Aflevering juni 2002\Summary.DOC
4
Accidents involving ships smaller than 50 gross tons (GT) are not included. Collision accidents are thus included only if both ships are larger than 50 GT.
The analysis is based on the assumption of an unchanged traffic pattern, i.e. as the present situation. However, the analysis includes the effect of each location having its own individual traffic composition. It also takes into account that the spill probability in case of an accident varies with the ship type.
The costs associated with each RCO are rough estimates and should not be con-sidered a budget.
The analysis takes into account the IMO decision that larger ships shall be equipped with Automatic Identification System (AIS), as well as the HELCOM decision about implementation of land-based surveillance systems in the Baltic countries. In addition, the effect of increased use of electronic charts and phase-out of single hull tankers is accounted for.

Risk Analysis of Navigational Safety in Danish Waters
P:\54380A\PDOC\Aflevering juni 2002\Summary.DOC
5
2 Analysis The analysis consists of 8 steps, which are described below:
2.1 Step 1: Selection of locations for further analysis Risk-reducing measures will be more effective on locations where the existing risk is high, i.e. where the accident frequency and thereby the spill probability is high. In step 1 accident statistics for all Danish waters are considered, and a selection of locations which contribute the most to the spill risk is carried out. The selection is made on the basis of collected accident statistics for the 5-year period 1997-2001. The data is primarily obtained from Søværnets Operative Kommando (SOK) and the Danish Maritime Administration. The accident da-tabase includes 206 accidents of which 170 are groundings and 36 are colli-sions.
An area is only subject to further analysis if the potential spills are of a certain size, i.e. if the area is in the vicinity of a main shipping route with a certain per-centage of tanker traffic. A further condition for selection is that other circum-stances, such as narrow passage or intense crossing traffic, are present. The fol-lowing locations have been chosen for further analysis (see maps in Appendix A):
1. Drogden (between Amager and Saltholm from Drogden lighthouse to the lighthouse at Middelgrunds Fort)
2. Langelandsbælt (area between Lolland/Sealand and Langeland from the southern to the northern tip of Langeland)
3. Hatter area (the area around Hatter Rev and Hatter Barn close to Samsø)
4. Kadetrenden (traffic separation scheme "south of Gedser")
5. The Sound north (traffic separation scheme "in the Sound")
These locations represent a total of 73 accidents, which is approximately 35 % of the registered 206 accidents.

Risk Analysis of Navigational Safety in Danish Waters
P:\54380A\PDOC\Aflevering juni 2002\Summary.DOC
6
2.2 Step 2: Accident scenarios and risk control options
This step identifies accident scenarios and risk-reducing measures (RCOs) for each of the selected locations. The typical accident scenarios have been identi-fied by interviews with pilots, captains and VTS operators as well as by general inspection of accident reports. RCOs are mainly identified from interviews. As-sessments are based on expert judgement compiled from several sources. Key information about navigation in the selected areas is given below, together with a short description of the analysed RCOs. For maps of the considered locations see Appendix A.
2.2.1 Drogden The Drogden channel between Amager and Saltholm is frequented by ap-proximately 40,000 ships annually. The channel is narrow (300 m) and has no traffic separation scheme. In the 5-year period considered, 9 collisions and 9 groundings have occurred. In the area north of the channel between Nordre Røse and Middelgrunds Fort 20 groundings and no collisions have taken place. For this area the possibility of introduction of a VTS centre has been investi-gated. Moreover it is possible to establish surveillance exclusively on the basis of AIS. This alternative has also been investigated. The effect of doubling the width of the channel (but not altering the depth) and introducing a traffic sepa-ration scheme has also been analysed.
2.2.2 Langelandsbælt Route T passes Langelandsbælt, which is therefore frequented by the largest ships that can negotiate the Danish straits. There is a deep water route for the ships with the largest draft and a route (H) for other ships. The deep water route has many bends which means that the ships must change course 10 times dur-ing passage of Langeland. In the period of time considered, 9 groundings and 3 collisions have occurred. The traffic is approximately 22,000 passages per year. The option of incorporating this area into the VTS Great Belt surveillance area has been investigated. This option appears logical since the area is directly ad-jacent to the present VTS area and thus to a large extent is frequented by the same ships. The possibility of establishing surveillance exclusively on the basis of AIS from the present VTS Great Belt operator room has also been investi-gated.
2.2.3 The Hatter area At Hatter Rev and Hatter Barn the traffic is separated into a deep water route (DW route) and a main route. The DW route is narrow and has a sharp bend which can be difficult to negotiate, especially when meeting ships on an oppo-site course. In the period of time considered, 11 groundings and 1 collision have occurred. An RCO which incorporates the Hatter area into the VTS Great Belt surveillance area is analysed because the Hatter area is located relatively close to the VTS Great Belt surveillance area and furthermore is frequented by roughly the same ships. In addition, the possibility of surveillance on the basis
Risk Analysis of Navigational Safety in Danish Waters
P:\54380A\PDOC\Aflevering juni 2002\Summary.DOC
7
of AIS is treated. The option of dredging the main route to a minimum depth of 19 m is analysed. This would make the DW route superfluous. Finally, the analysis comprises an alternative which replaces the sharp bend on the DW route with two longer bends and more space for navigation. This implies partial removal of the Hatter Barn shoal.
2.2.4 Kadetrenden With some 63,000 annual passages, Kadetrenden is the most densely trafficked of the analysed locations. The space available for navigation is sufficient, but many west-going ships are mistaken about the water depth when leaving the DW route and entering the traffic separation scheme. In the period of time considered, 10 groundings but no collisions have occurred. In addition to a separate VTS centre for this location, the possibility of repeated temporary sur-veillance of the area is analysed.
2.2.5 The Sound northern part In the traffic separation scheme "In the Sound" there is an intense north-south traffic (approx. 40,000 annual passages) as well as an intense east-west ferry traffic. This is expected to amount to an increased collision risk although in the considered 5-year period of time only one grounding and no collisions have occurred.
For this location the relevance of forming a VTS centre is analysed. Moreover, the measure of equipping the mid-channel buoy M1 with Racon is considered.
2.3 Step 3: Selection of RCOs for further analysis In this summary report the result of this selection is placed under step 2.
2.4 Step 4: Existing navigational safety In this step the expected number of annual spills is estimated for each of the selected locations. This is done by first estimating the grounding and collision frequencies per ship passage for each location. These estimates are based on the collected accident database. To obtain a reasonable statistical basis it has in some cases been necessary to consider a longer period of time than the 5-year period used in step 1.
Next, the probability of a spill is estimated for each of the two accident types. It has been taken into consideration that different ship types have different prob-abilities of a spill given an accident and that the traffic composition varies with the location.
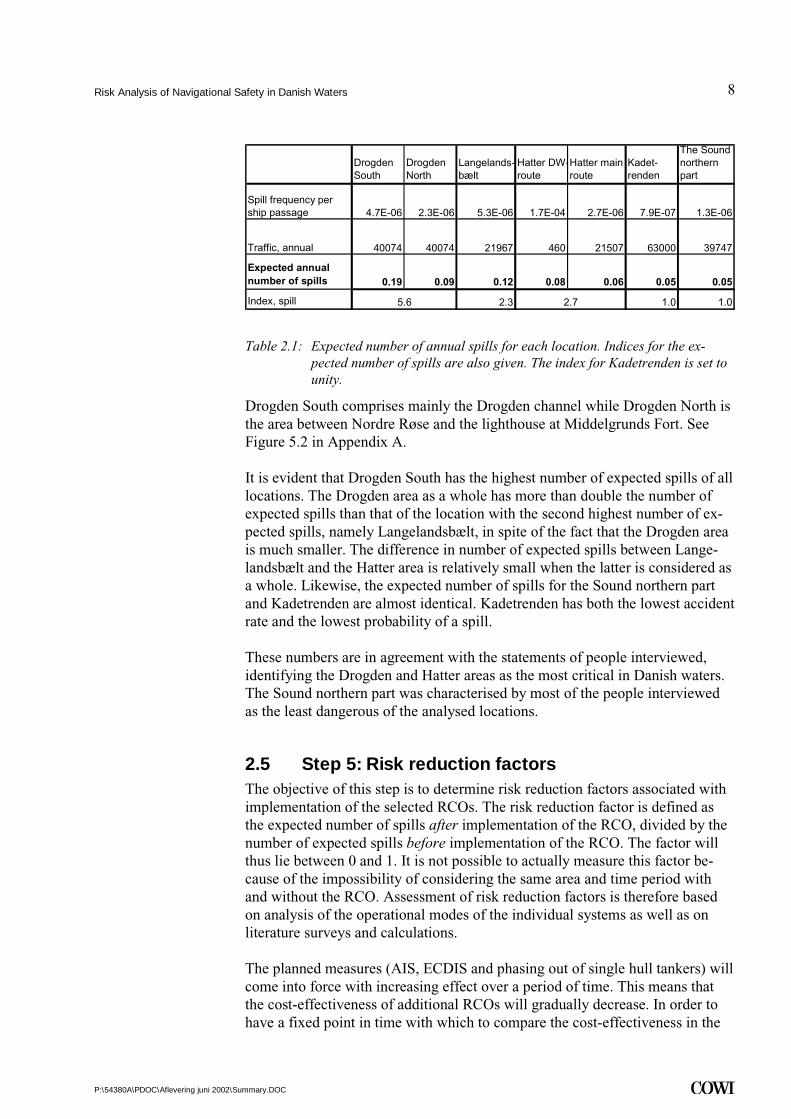
By multiplying the spill frequencies per ship passage with the number of pass-ing ships, the expected number of spills per year is obtained for each location. This is shown in Table 2.1.
Risk Analysis of Navigational Safety in Danish Waters
P:\54380A\PDOC\Aflevering juni 2002\Summary.DOC
8
Drogden South
Drogden North
Langelands-bælt
Hatter DW-route
Hatter main route
Kadet- renden
The Sound northern part
Spill frequency per ship passage 4.7E-06 2.3E-06 5.3E-06 1.7E-04 2.7E-06 7.9E-07 1.3E-06
Traffic, annual 40074 40074 21967 460 21507 63000 39747
Expected annual number of spills 0.19 0.09 0.12 0.08 0.06 0.05 0.05
Index, spill 2.3 1.0 1.05.6 2.7
Table 2.1: Expected number of annual spills for each location. Indices for the ex-pected number of spills are also given. The index for Kadetrenden is set to unity.
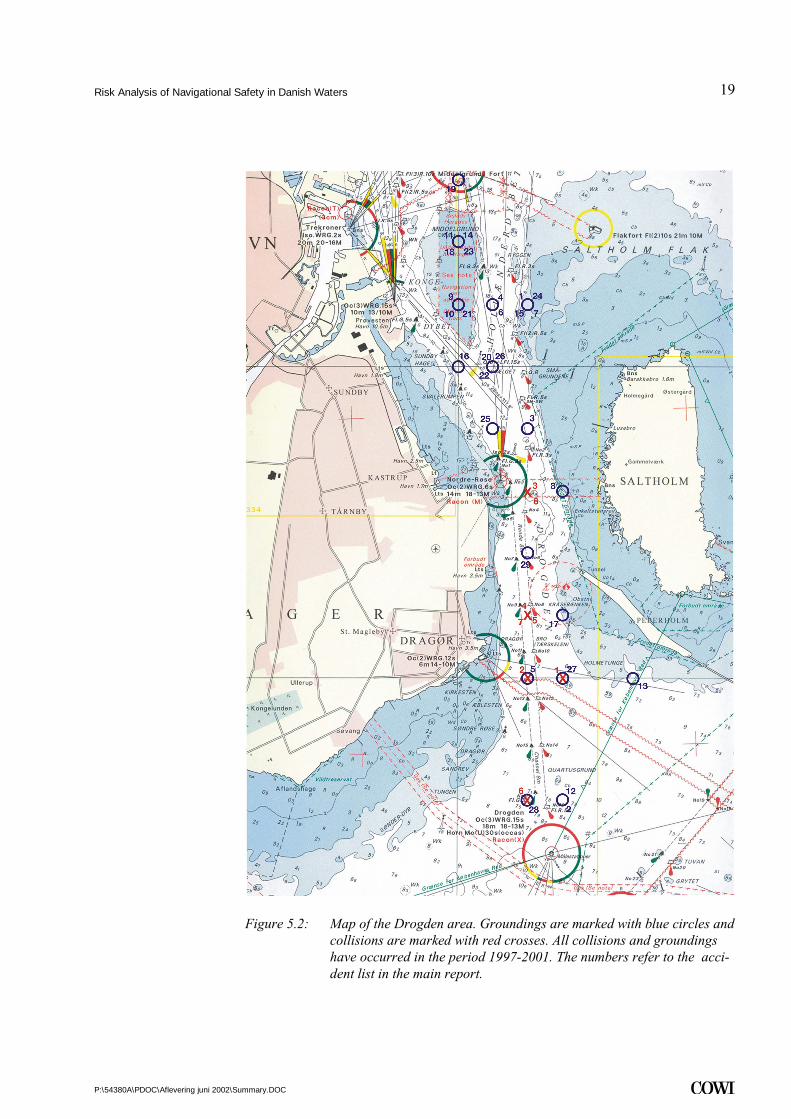
Drogden South comprises mainly the Drogden channel while Drogden North is the area between Nordre Røse and the lighthouse at Middelgrunds Fort. See Figure 5.2 in Appendix A.
It is evident that Drogden South has the highest number of expected spills of all locations. The Drogden area as a whole has more than double the number of expected spills than that of the location with the second highest number of ex-pected spills, namely Langelandsbælt, in spite of the fact that the Drogden area is much smaller. The difference in number of expected spills between Lange-landsbælt and the Hatter area is relatively small when the latter is considered as a whole. Likewise, the expected number of spills for the Sound northern part and Kadetrenden are almost identical. Kadetrenden has both the lowest accident rate and the lowest probability of a spill.
These numbers are in agreement with the statements of people interviewed, identifying the Drogden and Hatter areas as the most critical in Danish waters. The Sound northern part was characterised by most of the people interviewed as the least dangerous of the analysed locations.
2.5 Step 5: Risk reduction factors The objective of this step is to determine risk reduction factors associated with
implementation of the selected RCOs. The risk reduction factor is defined as the expected number of spills after implementation of the RCO, divided by the number of expected spills before implementation of the RCO. The factor will thus lie between 0 and 1. It is not possible to actually measure this factor be-cause of the impossibility of considering the same area and time period with and without the RCO. Assessment of risk reduction factors is therefore based on analysis of the operational modes of the individual systems as well as on literature surveys and calculations.
The planned measures (AIS, ECDIS and phasing out of single hull tankers) will come into force with increasing effect over a period of time. This means that the cost-effectiveness of additional RCOs will gradually decrease. In order to have a fixed point in time with which to compare the cost-effectiveness in the

Risk Analysis of Navigational Safety in Danish Waters
P:\54380A\PDOC\Aflevering juni 2002\Summary.DOC
9
present situation, a fixed date in the future is chosen for which the risk reduc-tion of the planned measures can be computed. AIS is expected to be fully de-veloped in 2008. Therefore it is chosen to consider a scenario for this year (situation 2008) as well as a scenario for the present situation (situation 2001).
2.6 Step 6: Costs of RCOs The objective of this step is to estimate the costs associated with implementing and operating the selected RCOs.
For the VTS centres the estimates are based on literature surveys and experi-ence from VTS Great Belt and the temporary VTS Drogden, which was estab-lished in connection with the construction of the Øresund fixed link.
The estimate for the measure "Wider Drogden channel" is based on results from [CPH Port 01]. The dredging costs for the Hatter area are estimated by a con-tracting company. For the remaining RCOs the cost estimates are based on in-quiries to various authorities.
The costs are computed for the entire lifetime of the individual investments and are compared to the expected number of averted spills in the same period of time. Hereby the costs of averting a spill can be computed. All prices are in fixed 2001 prices.
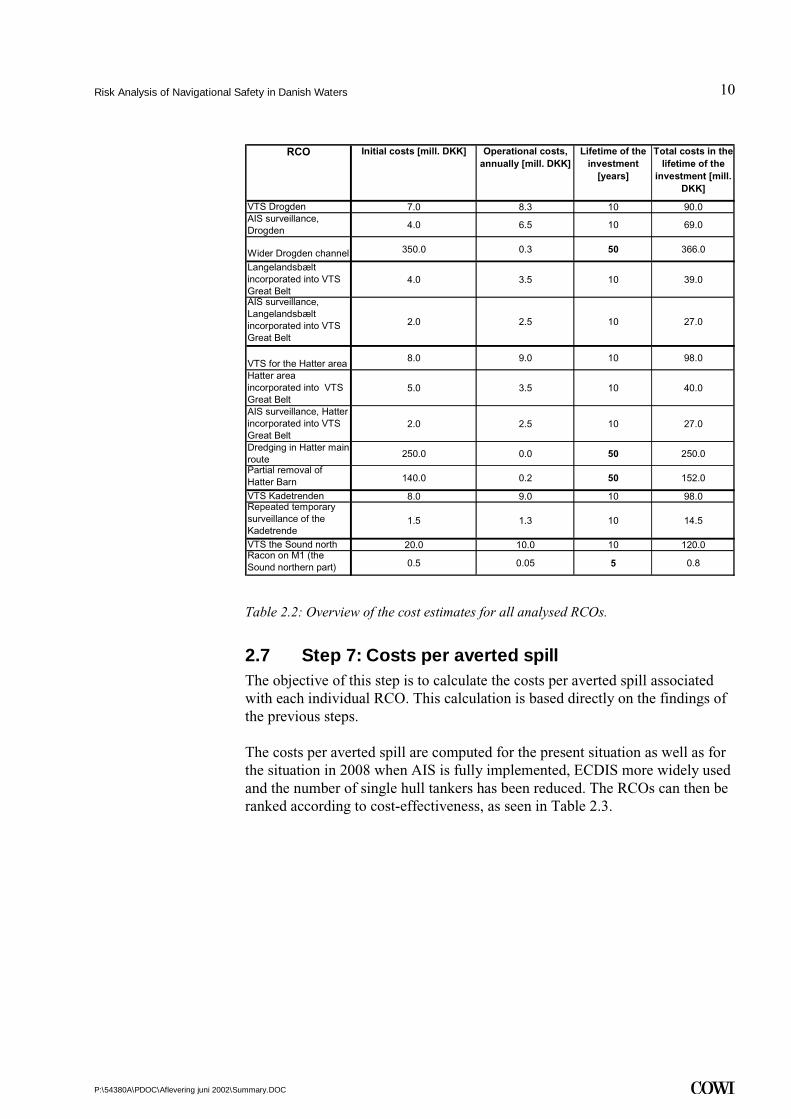
In Table 2.2 an overview of the applied cost estimates is given for each of the analysed RCOs.
Risk Analysis of Navigational Safety in Danish Waters
P:\54380A\PDOC\Aflevering juni 2002\Summary.DOC
10
RCO Initial costs [mill. DKK] Operational costs, annually [mill. DKK]
Lifetime of the investment
[years]
Total costs in thelifetime of the
investment [mill. DKK]
VTS Drogden 7.0 8.3 10 90.0AIS surveillance, Drogden 4.0 6.5 10 69.0
Wider Drogden channel 350.0 0.3 50 366.0
Langelandsbælt incorporated into VTS Great Belt
4.0 3.5 10 39.0
AIS surveillance, Langelandsbælt incorporated into VTS Great Belt
2.0 2.5 10 27.0
VTS for the Hatter area 8.0 9.0 10 98.0
Hatter area incorporated into VTS Great Belt
5.0 3.5 10 40.0
AIS surveillance, Hatter incorporated into VTS Great Belt
2.0 2.5 10 27.0
Dredging in Hatter mainroute 250.0 0.0 50 250.0
Partial removal of Hatter Barn 140.0 0.2 50 152.0
VTS Kadetrenden 8.0 9.0 10 98.0Repeated temporary surveillance of the Kadetrende
1.5 1.3 10 14.5
VTS the Sound north 20.0 10.0 10 120.0Racon on M1 (the Sound northern part) 0.5 0.05 5 0.8
Table 2.2: Overview of the cost estimates for all analysed RCOs.
2.7 Step 7: Costs per averted spill The objective of this step is to calculate the costs per averted spill associated with each individual RCO. This calculation is based directly on the findings of the previous steps.
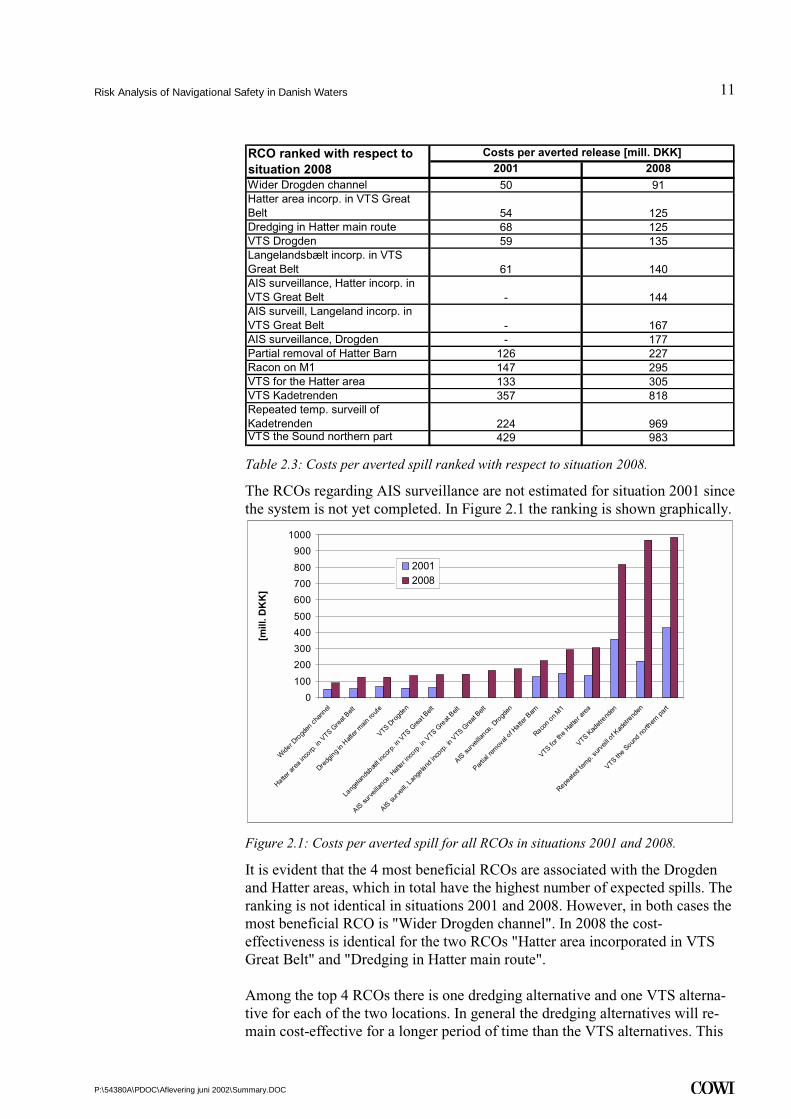
The costs per averted spill are computed for the present situation as well as for the situation in 2008 when AIS is fully implemented, ECDIS more widely used and the number of single hull tankers has been reduced. The RCOs can then be ranked according to cost-effectiveness, as seen in Table 2.3.
Risk Analysis of Navigational Safety in Danish Waters
P:\54380A\PDOC\Aflevering juni 2002\Summary.DOC
11
2001 2008Wider Drogden channel 50 91Hatter area incorp. in VTS Great Belt 54 125Dredging in Hatter main route 68 125VTS Drogden 59 135Langelandsbælt incorp. in VTS Great Belt 61 140AIS surveillance, Hatter incorp. in VTS Great Belt - 144AIS surveill, Langeland incorp. in VTS Great Belt - 167AIS surveillance, Drogden - 177Partial removal of Hatter Barn 126 227Racon on M1 147 295VTS for the Hatter area 133 305VTS Kadetrenden 357 818Repeated temp. surveill of Kadetrenden 224 969VTS the Sound northern part 429 983
RCO ranked with respect to situation 2008
Costs per averted release [mill. DKK]
Table 2.3: Costs per averted spill ranked with respect to situation 2008.
The RCOs regarding AIS surveillance are not estimated for situation 2001 since the system is not yet completed. In Figure 2.1 the ranking is shown graphically.
0
100
200
300
400
500
600
700
800
900
1000
Wide
r Dro
gden
chan
nel
Hatter a
rea
incorp
. in V
TS Gre
at B
elt
Dredg
ing i
n Hatt
er m
ain ro
ute
VTS Dro
gden
Lang
elands
bælt i
ncor
p. in
VTS Gre
at Belt
AIS su
rveil
lance
, Hat
ter i
ncorp
. in V
TS Gre
at B
elt
AIS su
rveil
l, Lan
geland
inco
rp. in
VTS G
reat
Belt
AIS su
rveil
lance
, Dro
gden
Partia
l rem
oval
of Hatte
r Bar
n
Racon o
n M1
VTS for t
he Hat
ter a
rea
VTS Kad
etre
nden
Repeat
ed te
mp.
surv
eill o
f Kad
etre
nden
VTS the
Sound
north
ern pa
rt
[mill
. DK
K]
20012008
Figure 2.1: Costs per averted spill for all RCOs in situations 2001 and 2008.
It is evident that the 4 most beneficial RCOs are associated with the Drogden and Hatter areas, which in total have the highest number of expected spills. The ranking is not identical in situations 2001 and 2008. However, in both cases the most beneficial RCO is "Wider Drogden channel". In 2008 the cost-effectiveness is identical for the two RCOs "Hatter area incorporated in VTS Great Belt" and "Dredging in Hatter main route". Among the top 4 RCOs there is one dredging alternative and one VTS alterna-tive for each of the two locations. In general the dredging alternatives will re-main cost-effective for a longer period of time than the VTS alternatives. This
Risk Analysis of Navigational Safety in Danish Waters
P:\54380A\PDOC\Aflevering juni 2002\Summary.DOC
12
is due to two circumstances. Firstly, a widening/deepening of a channel, which measure does not require maintenance, is an investment with very little opera-tional costs, whereas the operational costs are high for the VTS alternatives. This means that the dredging alternatives with time become increasingly cost-effective compared to the VTS alternatives. Secondly, the dredging alternatives yield a passive risk reduction which is independent of other RCOs and which will reduce the risk irrespectively of the ships' state, equipment level and crew. The RCO is thus independent of all electronic devices and the crew's ability to operate the equipment and comply with regulations. It is a low-tech measure and therefore very reliable. In addition, dredging does not require international approval in IMO whereas introduction of, or extension of, VTS centres do.
VTS Great Belt is in the process of upgrading the equipment. If the Hatter area is to be incorporated into its surveillance area, this will change the conditions for the upgrading project. Therefore an extraordinary effort is needed in order to incorporate the extension in the upgrading project. "VTS Drogden" will affect a larger area than "Wider Drogden channel". "VTS Drogden" will therefore also be an attractive RCO, especially in the short term. In the long term, the effect will be limited because electronic systems will give the ships access to much of the information a VTS centre would offer. How-ever, the compulsory reporting and the general surveillance will have an addi-tional effect because a VTS centre will intervene if a ship fails to report or is heading towards danger. Compared to a VTS centre which protects a fixed structure there will generally be less time for intervention because of the width of the dredged channel.
When prioritising the RCOs, it should be considered that both the costs of the individual RCOs and the number of averted spills are uncertain. The uncer-tainty on the cost estimates can be reduced substantially by closer investigation. In comparison, it is hardly possible to reduce the uncertainty on the number of averted spills.
There is also uncertainty regarding the ranking of the dredging alternatives rela-tive to the VTS alternatives. This is because the risk reduction is brought about in two different ways. This uncertainty is larger than the uncertainty regarding the ranking of the dredging alternatives alone, and larger than the uncertainty regarding the ranking of the VTS alternatives alone.
2.8 Step 8: Acceptance criteria In the previous steps the costs of averting a spill were computed for various RCOs. In this step it is assessed how much it is reasonable to pay for averting a spill. This is done by comparing the costs associated with the occurrence of a spill to the costs of averting a spill. This knowledge is used together with po-litical and other considerations to determine whether or not an RCO should be implemented.
Risk Analysis of Navigational Safety in Danish Waters
P:\54380A\PDOC\Aflevering juni 2002\Summary.DOC
13
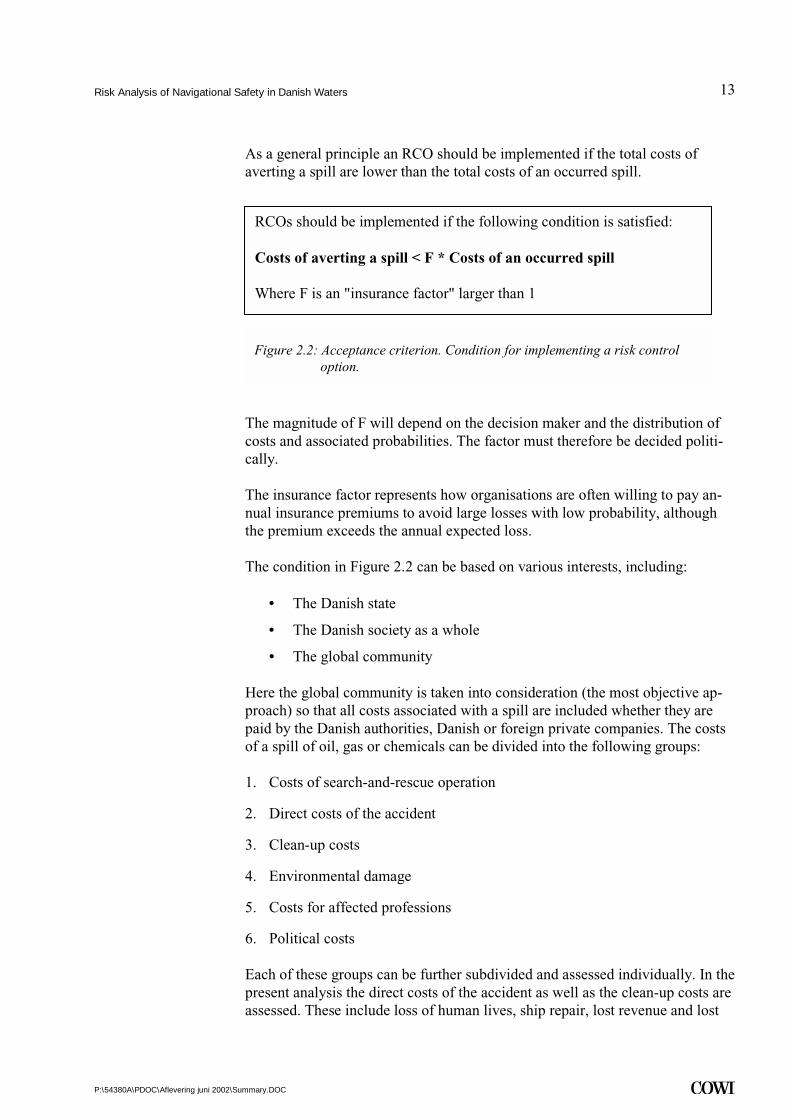
As a general principle an RCO should be implemented if the total costs of averting a spill are lower than the total costs of an occurred spill.
The magnitude of F will depend on the decision maker and the distribution of costs and associated probabilities. The factor must therefore be decided politi-cally.
The insurance factor represents how organisations are often willing to pay an-nual insurance premiums to avoid large losses with low probability, although the premium exceeds the annual expected loss.
The condition in Figure 2.2 can be based on various interests, including:
• The Danish state
• The Danish society as a whole
• The global community
Here the global community is taken into consideration (the most objective ap-proach) so that all costs associated with a spill are included whether they are paid by the Danish authorities, Danish or foreign private companies. The costs of a spill of oil, gas or chemicals can be divided into the following groups:
1. Costs of search-and-rescue operation
2. Direct costs of the accident
3. Clean-up costs
4. Environmental damage
5. Costs for affected professions
6. Political costs
Each of these groups can be further subdivided and assessed individually. In the present analysis the direct costs of the accident as well as the clean-up costs are assessed. These include loss of human lives, ship repair, lost revenue and lost
RCOs should be implemented if the following condition is satisfied: Costs of averting a spill < F * Costs of an occurred spill Where F is an "insurance factor" larger than 1
Figure 2.2: Acceptance criterion. Condition for implementing a risk control option.

Risk Analysis of Navigational Safety in Danish Waters
P:\54380A\PDOC\Aflevering juni 2002\Summary.DOC
14
cargo. These costs are roughly assessed to be an average of 50 mill. DKK per spill, corresponding to an average spill of 400 tons of oil.
In addition, the cost of search-and-rescue operations, environmental and politi-cal costs should be considered. These comprise for instance damage to natural resources and damage to flora and fauna. Consequences for professions such as fishing, aquaculture and tourism should also be taken into consideration as well as the political effects in terms of lost goodwill and the reputations of the re-sponsible politicians and authorities. Furthermore, large amounts of investiga-tive work generated by occurred accidents can be expected as well as additional work generated by critical questions from the media and the public. The magni-tude of these costs has not been quantified in the present analysis but it is esti-mated that their contribution is not insignificant in comparison to the 50 mill. DKK, which have been assessed as direct and clean-up costs.
The right-hand side of the condition in Figure 2.2 is thus determined by the fac-tor F, the assessed costs (50 mill. DKK) and a contribution which has not been quantified. The political work with respect to the navigational safety in Danish waters therefore, in principle, consists of making the decision of which RCOs satisfy the condition in Figure 2.2. This can be done by directly or indirectly determining the factor F as well as the contribution which has not been quanti-fied.
From the above it appears that this can be based on many different considera-tions depending on which interests are given priority.

Risk Analysis of Navigational Safety in Danish Waters
P:\54380A\PDOC\Aflevering juni 2002\Summary.DOC
15
3 Conclusion The present analysis has established a basis for making a decision about im-plementation of risk-reducing measures. The basis for this decision consists of two parts: A prioritisation of the RCOs with respect to cost-effectiveness (i.e. the costs per averted spill) and the sketched criterion for the decision of when to implement an RCO. The criterion is a comparison of the costs associated with averting a spill to the societal costs of the occurrence of a spill.
When prioritising the RCOs, it should be considered that both the costs of the individual RCOs and the number of averted spills are uncertain. The uncer-tainty regarding the cost estimates can be reduced substantially by closer inves-tigation. By comparison it is hardly possible to reduce the uncertainty regarding the number of averted spills. There is also an uncertainty regarding the ranking of the dredging alternatives relative to the VTS alternatives. This is because the risk reduction is brought about in two different ways. This uncertainty is larger than the uncertainty regarding the ranking of the dredging alternatives alone, and larger than the uncertainty regarding the ranking of the VTS alternatives alone.
If it is decided to make an effort to increase the navigational safety in Danish waters, the basis for such a decision as established within this report allows for selection among the RCOs so that maximum risk reduction for the money spent is achieved. The analysis indicates that the following 4 RCOs are the most cost-effective, in that their costs of averting a spill in 2001 will be between 50 and 68 mill. DKK and in 2008 between 91 and 135 mill. DKK.
1. Widening of the Drogden channel
2a. Incorporation of the Hatter area into the VTS Great Belt surveillance area
2b. Dredging of the main route at Hatter Barn to a minimum depth of 19 m
3. Introduction of a VTS centre for the area around the Drogden channel
Alternative 2a and 2b are equally cost-effective. It should be noted that the dredging alternatives do not require international approval in the IMO whereas the VTS alternatives do. Moreover, it will require a special effort to incorporate the Hatter area into the surveillance area of VTS Great Belt. This is because an upgrade project is already in progress.

Risk Analysis of Navigational Safety in Danish Waters
P:\54380A\PDOC\Aflevering juni 2002\Summary.DOC
16
The direct costs of an occurred spill are estimated at approximately 50 mill. DKK, corresponding to an average spill of 400 tons of oil. In addition, political costs, environmental costs and costs for affected professions should be consid-ered. These are not judged to be insignificant compared to the direct costs, but they are not assessed explicitly in the present report.
The political work with respect to the navigational safety in Danish waters therefore, in principle, consists of making the decision of which RCOs satisfy condition in Figure 2.2. This can be done by directly or indirectly determining the factor F as well as the contribution which has not been quantified.
Prioritising the RCOs with respect to cost-effectiveness presents a recom-mended implementation sequence if cost-effectiveness were the only criterion. There are, however, other criteria which affect the final choice of RCO, for in-stance political objectives, co-funding of measures with other interested parties, consideration of natural resources, flora and fauna, professional and industrial bodies and the public. Finally the initial investment of the individual RCOs dif-fers substantially. This may also have an impact on the preferences of the deci-sion maker.
Risk Analysis of Navigational Safety in Danish Waters
P:\54380A\PDOC\Aflevering juni 2002\Summary.DOC
17
4 References [CPH Port 01] Drogden Feasibility Studie, activity 3.9 and 3.12, September 2001, Cerup & Friis.
Risk Analysis of Navigational Safety in Danish Waters
P:\54380A\PDOC\Aflevering juni 2002\Summary.DOC
18
5 Appendix A: Maps In this Appendix, maps of the analysed areas are shown. Accident locations are marked on the maps.
Figure 5.1: Map of Danish waters. The map shows groundings (blue dots) and col-lisions (red triangles) which have been observed in Danish waters in the period 1997-2001. Only accidents, the positions of which are known, are shown. The black rectangles show the location and extent of the Hatter area (left) and the Drogden area (right).
Risk Analysis of Navigational Safety in Danish Waters
P:\54380A\PDOC\Aflevering juni 2002\Summary.DOC
19
Figure 5.2: Map of the Drogden area. Groundings are marked with blue circles and collisions are marked with red crosses. All collisions and groundings have occurred in the period 1997-2001. The numbers refer to the acci-dent list in the main report.

Risk Analysis of Navigational Safety in Danish Waters
P:\54380A\PDOC\Aflevering juni 2002\Summary.DOC
20
Figure 5.3: Map of Langelandsbælt. Groundings are marked with blue circles and collisions are marked with red crosses. All collisions and groundings have occurred in the period 1997-2001. Apart from the shown collisions one has occurred the position of which is unknown. The numbers refer to the accident list in the main report.
Risk Analysis of Navigational Safety in Danish Waters
P:\54380A\PDOC\Aflevering juni 2002\Summary.DOC
21
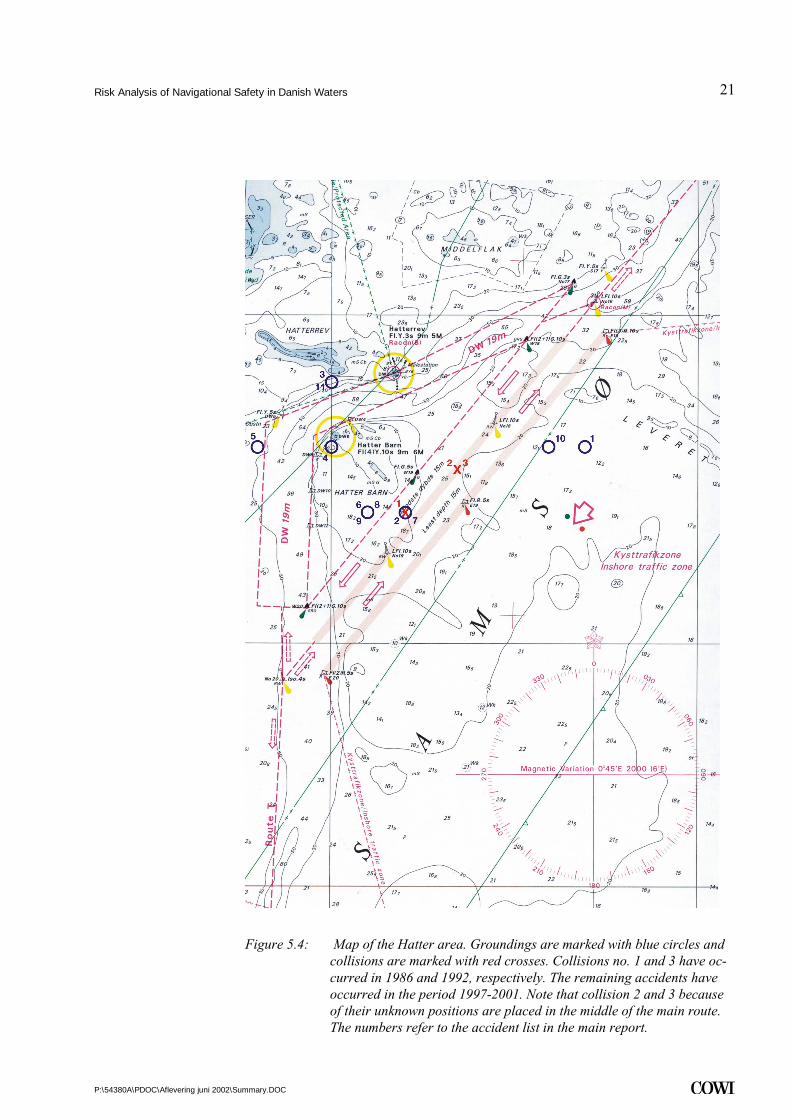
Figure 5.4: Map of the Hatter area. Groundings are marked with blue circles and collisions are marked with red crosses. Collisions no. 1 and 3 have oc-curred in 1986 and 1992, respectively. The remaining accidents have occurred in the period 1997-2001. Note that collision 2 and 3 because of their unknown positions are placed in the middle of the main route. The numbers refer to the accident list in the main report.

Risk Analysis of Navigational Safety in Danish Waters
P:\54380A\PDOC\Aflevering juni 2002\Summary.DOC
22
Figure 5.5: Map of Kadetrenden. Groundings are marked with blue circles. All groundings have occurred in the period 1997-2001. The numbers refer to the accident list in the main report.

Risk Analysis of Navigational Safety in Danish Waters
P:\54380A\PDOC\Aflevering juni 2002\Summary.DOC
23
Figure 5.6: Map of the Sound (northern part). Groundings are marked with blue circles and collisions are marked wit red crosses. Collisions no. 4, 5 and 10 have occurred in 1980, 1982 and 1991, respectively. Ground-ings no. 3, 6 and 7 have occurred in 1987, 1994 and 2001, respectively. Note that the positions given for groundings no. 3 and 6 are erroneous. Apart from the shown accidents 4 groundings and 8 collisions the posi-tions of which are unknown have occurred. See accident list in the main report.


