Division of Investment Management Risk and Examinations Office Private Funds Statistics Second Calendar Quarter 2016 January 17, 2017 This is a report of the Staff of the Division of Investment Management’s Risk and Examinations Office (REO) of the U.S. Securities and Exchange Commission. The Commission has expressed no view regarding the analysis, findings, or conclusions contained herein.
Transcript
Division of Investment Management
Risk and Examinations Office
Private Funds Statistics
Second Calendar Quarter 2016
January 17, 2017
This is a report of the Staff of the Division of Investment Management’s Risk and Examinations Office
(REO) of the U.S. Securities and Exchange Commission. The Commission has expressed no view
regarding the analysis, findings, or conclusions contained herein.
January 17, 2017 Risk and Examinations Office
Introduction
This report provides a summary of recent private fund industry statistics and trends, reflectingdata collected through Form PF and Form ADV filings.1 Form PF information provided in thisreport is aggregated, rounded, and/or masked to avoid potential disclosure of proprietaryinformation of individual Form PF filers.
This report reflects data from Third Calendar Quarter 2014 through Second Calendar Quarter2016 as reported by Form PF filers.2 Please see the Appendix for information on the categories ofForm PF filers, the definitions of capitalized terms, a description of the boxplots used in severalfigures, as well as other technical descriptions.
Form PF is still a relatively new reporting requirement for advisers to private funds.The Staff continues to work with the data and filers to identify and correct filing errors.In some instances, the Staff has made adjustments to the summary statistics presentedhere to correct what appear to be clear filing errors. In addition, the Staff has employedcertain assumptions in aggregating the data. Future adjustments to these methodologiescould lead to changes in reported statistics.
If you have any questions or comments about Second Calendar Quarter2016 Private Funds Statistics, please contact:
Tim Dulaney, PhD, FRM or Tim Husson, PhD, FRM at [email protected] with subject line “SecondCalendar Quarter 2016-Private Funds Statistics”.
1Only SEC-registered advisers with at least $150 million in private fund assets under management must report to theCommission on Form PF. SEC-registered investment advisers with less than $150 million in private fund assets undermanagement, SEC exempt reporting advisers, and state-registered investment advisers are not required to file Form PF,but report general information about the private funds they manage on Form ADV.2The Commission began receiving Form PF filings from Large Hedge Fund Advisers in July 2012. A full data set was
not received until March 2013. This report relies upon the Form PF database constructed and maintained by the Officeof Research and Data Services in the Division of Economic and Risk Analysis.
Table 1: Number of FundsThe “Total” row shows the total reported, and will not equal the sum of the preceding rows,
because the rows are not mutually exclusive.
Fund Type 2014Q3 2014Q4 2015Q1 2015Q2 2015Q3 2015Q4 2016Q1 2016Q2
Private Equity Fund 7,629 8,243 8,305 8,341 8,258 9,615 9,684 9,686Hedge Fund 8,684 8,682 8,856 8,873 8,929 8,775 8,915 8,922Other Private Fund 3,752 4,244 4,234 4,217 4,236 4,156 4,132 4,146Section 4 Private Equity Fund 2,209 2,387 2,391 2,390 2,364 2,733 2,739 2,741Real Estate Fund 1,534 1,794 1,792 1,794 1,798 2,058 2,095 2,094Qualifying Hedge Fund 1,499 1,538 1,560 1,592 1,625 1,640 1,597 1,608Securitized Asset Fund 1,196 1,328 1,348 1,349 1,351 1,411 1,426 1,422Venture Capital Fund 438 508 505 506 508 636 635 646Liquidity Fund 70 70 69 68 67 65 65 66Section 3 Liquidity Fund 44 45 42 42 40 41 36 37
Total 23,177 24,805 25,028 25,083 25,064 26,652 26,862 26,899
Table 2: Number of Advisers Advising Each Fund TypeThe “Total” row shows the total reported, and will not equal the sum of the preceding rows,
because the rows are not mutually exclusive.
Fund Type 2014Q3 2014Q4 2015Q1 2015Q2 2015Q3 2015Q4 2016Q1 2016Q2
Private Equity Fund 867 921 922 925 924 1,013 1,017 1,015Hedge Fund 1,599 1,664 1,668 1,666 1,665 1,685 1,688 1,681Other Private Fund 526 559 561 561 561 570 564 564Section 4 Private Equity Fund 195 210 209 209 209 242 243 243Real Estate Fund 244 262 262 264 264 288 290 289Qualifying Hedge Fund 505 524 525 528 537 535 525 525Securitized Asset Fund 141 153 155 155 156 157 159 157Venture Capital Fund 70 85 85 85 86 97 97 98Liquidity Fund 34 36 35 35 34 37 37 37Section 3 Liquidity Fund 23 24 22 22 21 21 19 19
Total 2,583 2,719 2,720 2,722 2,718 2,822 2,823 2,816
3In this report, “Funds” means all private funds reported on Form PF and “Advisers” means all SEC-registeredinvestment advisers that file a Form PF to report private funds. Please see Appendix E for definitions of other capitalizedterms used in this report.
4
January 17, 2017 Risk and Examinations Office
II Gross and Net Assets
A Aggregate Assets by Fund Type over Time
Table 3: Aggregate Private Fund Gross Asset Value (GAV) ($ Billions)As reported on Form PF, Question 8.
The “Total” row shows the total reported, and will not equal the sum of the preceding rows,because the rows are not mutually exclusive.
Fund Type 2014Q3 2014Q4 2015Q1 2015Q2 2015Q3 2015Q4 2016Q1 2016Q2
Hedge Fund 6,115 6,027 6,432 6,353 6,246 6,073 6,167 6,333Qualifying Hedge Fund 5,032 4,922 5,312 5,278 5,194 4,990 4,991 5,101Private Equity Fund 1,838 1,887 1,890 1,893 1,854 2,056 2,057 2,058Section 4 Private Equity Fund 1,274 1,352 1,352 1,351 1,337 1,472 1,473 1,473Other Private Fund 960 999 994 982 980 976 969 976Securitized Asset Fund 357 378 382 383 383 417 421 420Real Estate Fund 334 351 351 351 351 397 405 405Liquidity Fund 286 274 290 265 274 286 274 287Section 3 Liquidity Fund 281 272 287 263 267 283 247 258Venture Capital Fund 30 39 39 39 39 55 55 56
Total 9,880 9,934 10,350 10,253 10,106 10,247 10,332 10,519
Table 4: Aggregate Private Fund Net Asset Value (NAV) ($ Billions)As reported on Form PF, Question 9.
The “Total” row shows the total reported, and will not equal the sum of the preceding rows,because the rows are not mutually exclusive.
Fund Type 2014Q3 2014Q4 2015Q1 2015Q2 2015Q3 2015Q4 2016Q1 2016Q2
Hedge Fund 3,361 3,402 3,581 3,594 3,480 3,459 3,412 3,441Qualifying Hedge Fund 2,657 2,669 2,838 2,867 2,762 2,736 2,653 2,669Private Equity Fund 1,694 1,745 1,749 1,751 1,713 1,880 1,880 1,881Section 4 Private Equity Fund 1,209 1,275 1,274 1,273 1,259 1,377 1,378 1,378Other Private Fund 831 890 896 878 876 875 868 875Securitized Asset Fund 126 114 115 116 116 136 138 138Real Estate Fund 265 279 279 280 280 319 323 323Liquidity Fund 283 272 287 264 274 285 273 285Section 3 Liquidity Fund 279 271 284 262 267 282 246 256Venture Capital Fund 28 37 37 37 37 52 52 53
Total 6,551 6,719 6,915 6,907 6,758 6,995 6,935 6,982
5
January 17, 2017 Risk and Examinations Office
Figure 1: GAV and NAV DistributionsSee Appendix C for an explanation of boxplots.
As reported on Form PF, Questions 8 and 9.
2014
Q3
2014
Q4
2015
Q1
2015
Q2
2015
Q3
2015
Q4
2016
Q1
2016
Q2012345678
GA
V ($
Billi
ons)
(a) Qualifying Hedge Fund GAV
2014
Q3
2014
Q4
2015
Q1
2015
Q2
2015
Q3
2015
Q4
2016
Q1
2016
Q2012345678
NA
V ($
Billi
ons)
(b) Qualifying Hedge Fund NAV
2014
Q3
2014
Q4
2015
Q1
2015
Q2
2015
Q3
2015
Q4
2016
Q1
2016
Q20
200400600800
1000120014001600
GA
V ($
Mill
ions
)
(c) Section 4 Private Equity Fund GAV
2014
Q3
2014
Q4
2015
Q1
2015
Q2
2015
Q3
2015
Q4
2016
Q1
2016
Q20
200400600800
1000120014001600
NA
V ($
Mill
ions
)
(d) Section 4 Private Equity Fund NAV
6
January 17, 2017 Risk and Examinations Office
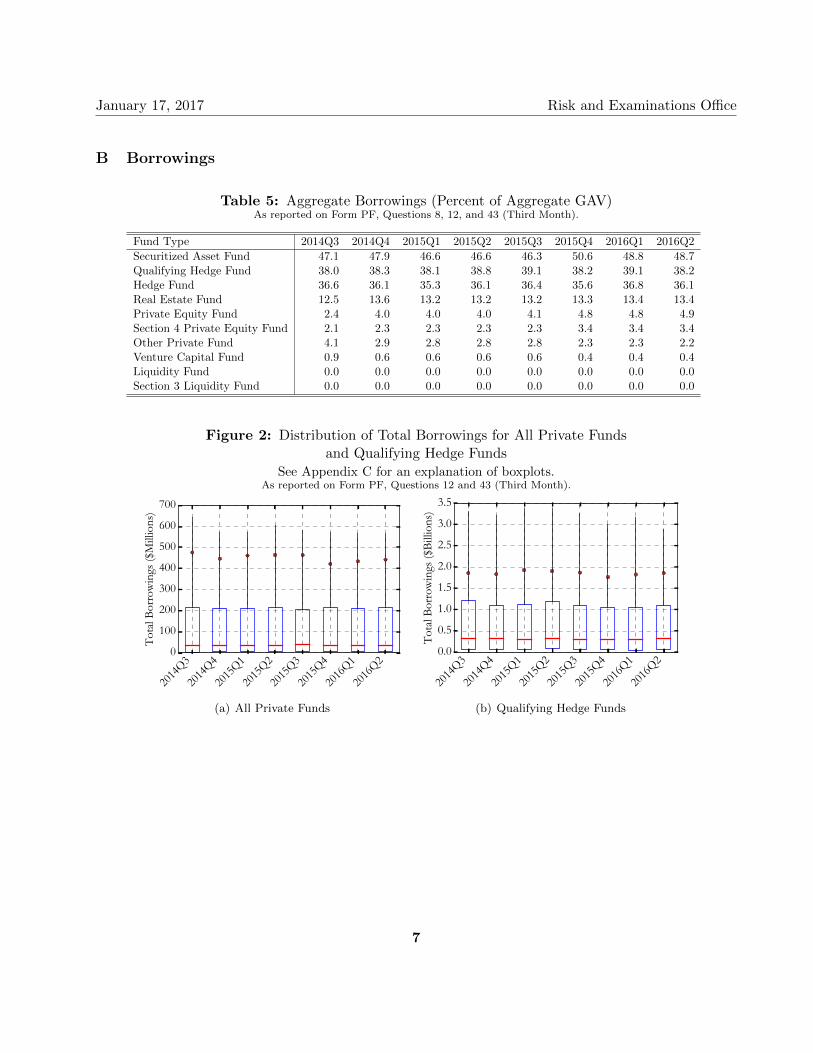
B Borrowings
Table 5: Aggregate Borrowings (Percent of Aggregate GAV)As reported on Form PF, Questions 8, 12, and 43 (Third Month).
Fund Type 2014Q3 2014Q4 2015Q1 2015Q2 2015Q3 2015Q4 2016Q1 2016Q2
Securitized Asset Fund 47.1 47.9 46.6 46.6 46.3 50.6 48.8 48.7Qualifying Hedge Fund 38.0 38.3 38.1 38.8 39.1 38.2 39.1 38.2Hedge Fund 36.6 36.1 35.3 36.1 36.4 35.6 36.8 36.1Real Estate Fund 12.5 13.6 13.2 13.2 13.2 13.3 13.4 13.4Private Equity Fund 2.4 4.0 4.0 4.0 4.1 4.8 4.8 4.9Section 4 Private Equity Fund 2.1 2.3 2.3 2.3 2.3 3.4 3.4 3.4Other Private Fund 4.1 2.9 2.8 2.8 2.8 2.3 2.3 2.2Venture Capital Fund 0.9 0.6 0.6 0.6 0.6 0.4 0.4 0.4Liquidity Fund 0.0 0.0 0.0 0.0 0.0 0.0 0.0 0.0Section 3 Liquidity Fund 0.0 0.0 0.0 0.0 0.0 0.0 0.0 0.0
Figure 2: Distribution of Total Borrowings for All Private Fundsand Qualifying Hedge Funds
See Appendix C for an explanation of boxplots.As reported on Form PF, Questions 12 and 43 (Third Month).
2014
Q3
2014
Q4
2015
Q1
2015
Q2
2015
Q3
2015
Q4
2016
Q1
2016
Q20
100
200
300
400
500
600
700
Tota
l Bor
row
ings
($M
illio
ns)
(a) All Private Funds
2014
Q3
2014
Q4
2015
Q1
2015
Q2
2015
Q3
2015
Q4
2016
Q1
2016
Q20.0
0.5
1.0
1.5
2.0
2.5
3.0
3.5
Tota
l Bor
row
ings
($Bi
llion
s)
(b) Qualifying Hedge Funds
7
January 17, 2017 Risk and Examinations Office
C Parallel Managed Accounts4
Table 6: Number of Funds with Parallel Managed AccountsAs reported on Form PF, Question 11.
The “Total” row shows the total reported, and will not equal the sum of the preceding rows,because the rows are not mutually exclusive.
Type 2014Q3 2014Q4 2015Q1 2015Q2 2015Q3 2015Q4 2016Q1 2016Q2
Hedge Fund 704 712 718 704 710 701 698 696Other Private Fund 340 398 388 391 393 415 413 413Private Equity Fund 197 210 210 213 211 248 248 248Qualifying Hedge Fund 218 227 233 246 246 246 233 235Section 4 Private Equity Fund 57 60 63 63 63 82 82 82Real Estate Fund 46 51 51 51 51 49 52 52Securitized Asset Fund *** *** *** *** *** *** *** ***Liquidity Fund 17 16 17 17 15 14 16 15Section 3 Liquidity Fund 15 14 15 15 12 13 15 15Venture Capital Fund *** *** *** *** *** *** *** ***
Total 1,332 1,419 1,415 1,406 1,404 1,453 1,454 1,454
Table 7: Aggregate Value in Parallel Managed Accounts ($ Billions)As reported on Form PF, Question 11.
The “Total” row shows the total reported, and will not equal the sum of the preceding rows,because the rows are not mutually exclusive.
Type 2014Q3 2014Q4 2015Q1 2015Q2 2015Q3 2015Q4 2016Q1 2016Q2
Hedge Fund 797 723 774 701 665 656 617 634Other Private Fund 1,272 1,443 1,413 1,411 1,403 1,333 1,325 1,311Private Equity Fund 124 107 106 106 106 96 96 96Qualifying Hedge Fund 418 516 544 528 489 478 437 458Section 4 Private Equity Fund 17 16 16 16 16 19 19 19Real Estate Fund 11 11 11 11 11 10 11 11Securitized Asset Fund *** *** *** *** *** *** *** ***Liquidity Fund 339 349 363 347 278 250 321 306Section 3 Liquidity Fund 335 345 359 343 271 245 316 306Venture Capital Fund *** *** *** *** *** *** *** ***
Total 2,601 2,727 2,750 2,659 2,544 2,495 2,521 2,508
4Certain data points in the tables in this section and other sections may be masked to avoid possible disclosure ofproprietary information of individual Form PF filers.
8
January 17, 2017 Risk and Examinations Office
Figure 3: Parallel Managed Account Value DistributionsSee Appendix C for an explanation of boxplots.
As reported on Form PF, Question 11.
2014
Q3
2014
Q4
2015
Q1
2015
Q2
2015
Q3
2015
Q4
2016
Q1
2016
Q20.00.51.01.52.02.53.03.54.04.5
Para
llel M
anag
ed A
sset
s ($B
illio
ns)
(a) All Private Funds
2014
Q3
2014
Q4
2015
Q1
2015
Q2
2015
Q3
2015
Q4
2016
Q1
2016
Q20.00.51.01.52.02.53.03.54.0
Para
llel M
anag
ed A
sset
s ($B
illio
ns)
(b) Qualifying Hedge Funds
9
January 17, 2017 Risk and Examinations Office
III Fund Domiciles and Adviser Main Offices
Table 8: Fund Domicile (Percent of NAV)As reported on Form PF, Question 9 and Form ADV.
All Private Funds
Country 2014Q3 2014Q4 2015Q1 2015Q2 2015Q3 2015Q4 2016Q1 2016Q2
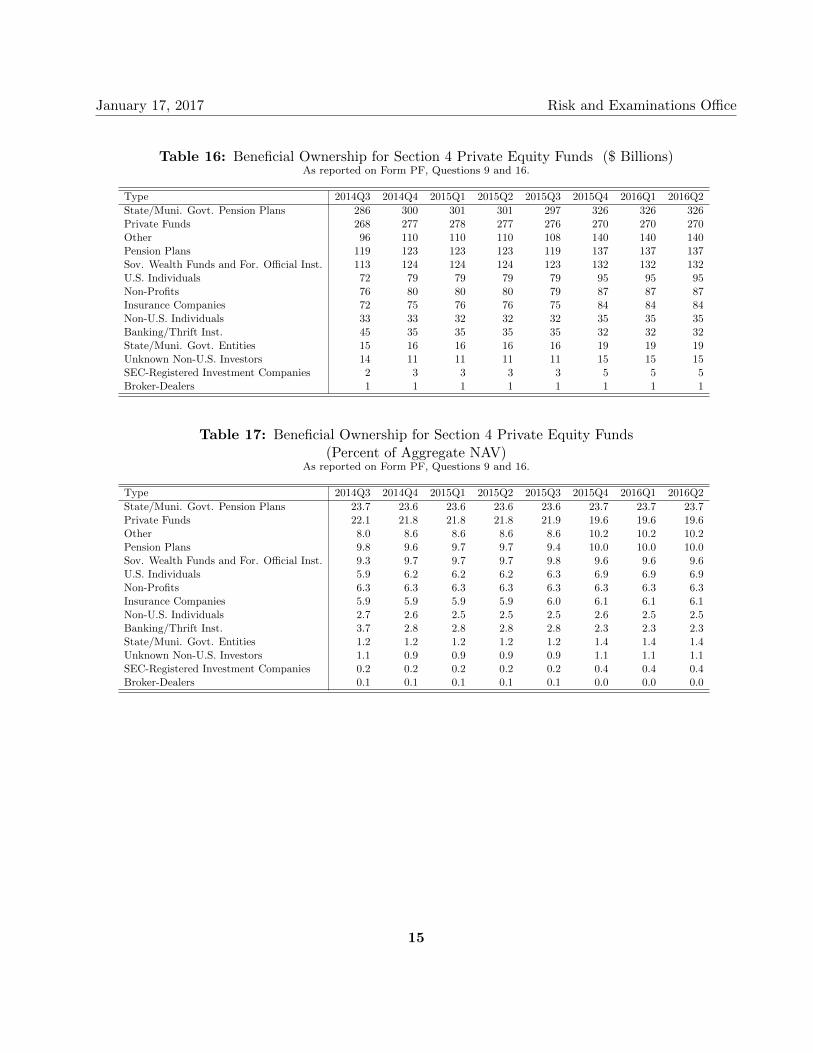
Table 18: Aggregate Derivative Notional ($ Billions)As reported on Form PF, Questions 13 and 44 (Third Month).
The “Total” row shows the total reported, and will not equal the sum of the preceding rows,because the rows are not mutually exclusive.
Type 2014Q3 2014Q4 2015Q1 2015Q2 2015Q3 2015Q4 2016Q1 2016Q2
Hedge Fund 15,921 14,584 14,452 13,787 14,032 12,960 13,910 15,193Qualifying Hedge Fund 14,314 13,118 13,123 12,550 12,785 11,852 12,716 12,817Other Private Fund 101 127 121 106 107 99 99 99Private Equity Fund 48 66 69 71 73 54 54 54Section 4 Private Equity Fund 43 60 60 60 60 42 42 42Real Estate Fund 12 13 13 13 13 21 21 21Securitized Asset Fund 45 27 29 29 28 12 11 11Liquidity Fund 0 *** *** *** *** *** *** ***Section 3 Liquidity Fund 0 0 *** *** *** *** *** ***Venture Capital Fund 0 *** *** *** *** *** *** ***
Total 16,106 14,800 14,667 14,007 14,253 13,145 14,095 15,382
Table 19: Aggregate Derivative Notional (Percent of Aggregate NAV)As reported on Form PF, Questions 9, 13, and 44 (Third Month).
Type 2014Q3 2014Q4 2015Q1 2015Q2 2015Q3 2015Q4 2016Q1 2016Q2
Hedge Fund 473.7 428.7 403.5 383.6 403.2 374.7 407.7 441.6Qualifying Hedge Fund 538.6 491.4 462.4 437.8 462.9 433.2 479.2 480.2Other Private Fund 12.1 14.3 13.5 12.1 12.3 11.3 11.4 11.3Private Equity Fund 2.8 3.8 3.9 4.0 4.3 2.9 2.9 2.9Section 4 Private Equity Fund 3.5 4.7 4.7 4.7 4.7 3.1 3.1 3.1Real Estate Fund 4.4 4.6 4.6 4.6 4.6 6.7 6.7 6.7Securitized Asset Fund 35.6 23.4 25.4 25.1 24.4 8.5 8.2 7.7Liquidity Fund 0.0 *** *** *** *** *** *** ***Section 3 Liquidity Fund 0.0 0.0 *** *** *** *** *** ***Venture Capital Fund 0.2 *** *** *** *** *** *** ***
Total 245.9 220.3 212.1 202.8 210.9 187.9 203.3 220.3
16
January 17, 2017 Risk and Examinations Office
Figure 4: Distribution of Derivative Notional ValuesSee Appendix C and Appendix D for an explanation of boxplots and winsorization.
As reported on Form PF, Questions 13 and 44 (Third Month).
2014
Q3
2014
Q4
2015
Q1
2015
Q2
2015
Q3
2015
Q4
2016
Q1
2016
Q20.00.20.40.60.81.01.21.41.61.8
Tota
l Der
ivat
ive
Valu
e ($
Billi
ons)
Win
soriz
ed (l
imits
=[1
%,9
9%])
(a) All Private Funds
2014
Q3
2014
Q4
2015
Q1
2015
Q2
2015
Q3
2015
Q4
2016
Q1
2016
Q20
2
4
6
8
10
12
Tota
l Der
ivat
ive
Valu
e ($
Billi
ons)
Win
soriz
ed (l
imits
=[1
%,9
9%])
(b) Qualifying Hedge Funds
VI High Frequency Trading
Table 20: Number of Hedge Funds UsingHigh Frequency Trading (HFT) Strategies
As reported on Form PF, Question 21.
Fraction of NAV 2014Q3 2014Q4 2015Q1 2015Q2 2015Q3 2015Q4 2016Q1 2016Q2
0% 7,001 7,182 7,323 7,342 7,408 7,373 7,450 7,466Less than 100% 53 45 39 39 33 40 63 64100% or More 28 28 25 24 10 8 6 7
Table 21: Hedge Fund Assets Managed Using HFT Strategies ($ Billions)As reported on Form PF, Questions 9 and 21.
Fraction of NAV 2014Q3 2014Q4 2015Q1 2015Q2 2015Q3 2015Q4 2016Q1 2016Q2
0% 3,259 3,300 3,470 3,479 3,365 3,336 3,284 3,318Less than 100% 37 35 41 43 43 77 84 83100% or More 30 32 34 36 34 2 2 2
17
January 17, 2017 Risk and Examinations Office
VII Information Reported by Large HedgeFund Advisers
A Economic Leverage
Figure 5: Ratio of Hedge Fund Gross Notional Exposure to Net Asset ValueSee Appendix C and Appendix D for an explanation of boxplots and winsorization.
As reported on Form PF, Questions 3(a) and 26.
2014
-09
2014
-12
2015
-03
2015
-06
2015
-09
2015
-12
2016
-03
2016
-060
2
4
6
8
10
12
14
Ratio
of G
NE
to N
AV
Win
soriz
ed (l
imits
=[0
%,9
8%])
(a) Gross Exposure with Interest Rate Derivatives (IRDs)
2014
-09
2014
-12
2015
-03
2015
-06
2015
-09
2015
-12
2016
-03
2016
-060
2
4
6
8
10
12
14
Ratio
of G
NE
(w/o
IRD
s) to
NA
V W
inso
rized
(lim
its=
[0%
,98%
])
(b) Gross Exposure without IRDs
18
January 17, 2017 Risk and Examinations Office
Figure 6: Ratio of Hedge Fund Long Notional Exposure (LNE) andShort Notional Exposure (SNE) to Net Asset Value Distribution
See Appendix C and Appendix D for an explanation of boxplots and winsorization.As reported on Form PF, Questions 3(a) and 26.
2014
-09
2014
-12
2015
-03
2015
-06
2015
-09
2015
-12
2016
-03
2016
-060
2
4
6
8
10
Ratio
of L
NE
to N
AV
Win
soriz
ed (l
imits
=[0
%,9
8%])
(a) Long Exposure with IRDs
2014
-09
2014
-12
2015
-03
2015
-06
2015
-09
2015
-12
2016
-03
2016
-060
2
4
6
8
10
Ratio
of L
NE
(w/o
IRD
s) to
NA
V W
inso
rized
(lim
its=
[0%
,98%
])(b) Long Exposure without IRDs
2014
-09
2014
-12
2015
-03
2015
-06
2015
-09
2015
-12
2016
-03
2016
-060
2
4
6
8
10
Ratio
of S
NE
to N
AV
Win
soriz
ed (l
imits
=[0
%,9
8%])
(c) Short Exposure with IRDs
2014
-09
2014
-12
2015
-03
2015
-06
2015
-09
2015
-12
2016
-03
2016
-060
2
4
6
8
10
Ratio
of S
NE
(w/o
IRD
s) to
NA
V W
inso
rized
(lim
its=
[0%
,98%
])
(d) Short Exposure without IRDs
19
January 17, 2017 Risk and Examinations Office
B Industry Concentration
Table 22: Large Hedge Fund Adviser Asset and Exposure Concentration(Percent of Total Reported)
As reported on Form PF, Questions 3(a) and 26.
Month Top 10 Advisers (NAV) Top 20 Advisers (NAV) Top 10 Advisers (GNE) Top 20 Advisers (GNE)
Investment in other funds Subtotal 52 49 50 49 48 45 40 42
Total Total 4,248 4,254 4,544 4,576 4,459 4,329 4,426 4,487
5Form PF Question 20 requires advisers to indicate which strategies best describe the reporting fund’s strategiesincluding a good faith estimate of the reporting fund’s allocation among strategies, and provides a list of investmentstrategies for this purpose. Form PF does not define the investment strategies listed by Question 20.
24
January 17, 2017 Risk and Examinations Office
Table 29: Exposures of Hedge Funds (Percent of NAV)As reported on Form PF, Questions 9 and 20.
X Section 4 Private Equity Fund Specific Information
A CPC Industry Concentration
Table 40: Gross Assets in CPC Industries (Percent of Total)As reported on Form PF, Questions 8 and 77.
Type 2013Q4 2014Q4 2015Q4
Oil & Gas Extraction 7.5 7.5 5.8Software Publishers 3.0 3.8 4.7Electric Power Generation, Transmission & Distribution 4.0 3.6 3.7Telecommunications Data Processing Services 2.6 2.3 2.6Pipeline Transportation 2.3 2.4 2.2Other Information Services 2.1 2.1 1.9Other Financial Investment Activities 1.9 1.7 1.7Data Processing, Hosting, & Related Services 3.7 2.2 1.7Limited-Service Eating Places 1.0 1.3 1.7Custom Computer Programming Services 0.9 0.9 1.4Pharmaceutical & Medicine Mfg 0.9 1.2 1.4Activities Related to Credit Intermediation 1.4 1.2 1.3Educational Services 1.1 1.0 1.2Support Activities for Mining 1.2 1.5 1.2Electronic Shopping & Mail-Order Houses 0.8 1.5 1.1Management, Scientific, & Technical Consulting Services 1.0 1.1 1.0
31
January 17, 2017 Risk and Examinations Office
B CPC Financial Leverage
Figure 11: Distribution of Ratio of Aggregate CPC Current Liabilitiesto Total Liabilities of Section 4 Private Equity Funds
See Appendix C for an explanation of boxplots.As reported on Form PF, Questions 71 and 72.
2013
Q4
2014
Q4
2015
Q40
10
20
30
40
50
60Ra
tio o
f Por
tfolio
Com
pany
Cur
rent
L
iabili
ties t
o To
tal L
iabili
ties (
%)
Figure 12: Distribution of CPC Payment-in-Kind orZero Coupon Borrowings to Total Borrowings Ratio
See Appendix C for an explanation of boxplots.As reported on Form PF, Question 73.
2013
Q4
2014
Q4
2015
Q40
10
20
30
40
50
CPC
Paym
ent-i
n-K
ind
Borr
owin
gs
to T
otal
Borr
owin
gs R
atio
(%)
32
January 17, 2017 Risk and Examinations Office
C CPC Investments by Region and Country
Table 41: Aggregate Gross Value of Private EquityInvestments by Region ($ Billions)
As reported on Form PF, Questions 70 and 78.
Region 2013Q4 2014Q4 2015Q4
North America 5,274 4,501 4,132Europe EEA 1,423 1,259 941Asia 571 462 447South America 75 85 58Supranational 65 67 23Europe Other 25 9 21Africa 20 12 12Middle East 8 12 9
Table 42: Private Equity CPC Investments by Region(Percent of Aggregate CPC Gross Asset Value)
As reported on Form PF, Questions 70 and 78.
Region 2013Q4 2014Q4 2015Q4
North America 70.7 70.2 73.2Europe EEA 19.1 19.6 16.7Asia 7.6 7.2 7.9South America 1.0 1.3 1.0Supranational 0.9 1.0 0.4Europe Other 0.3 0.1 0.4Africa 0.3 0.2 0.2Middle East 0.1 0.2 0.2
33
January 17, 2017 Risk and Examinations Office
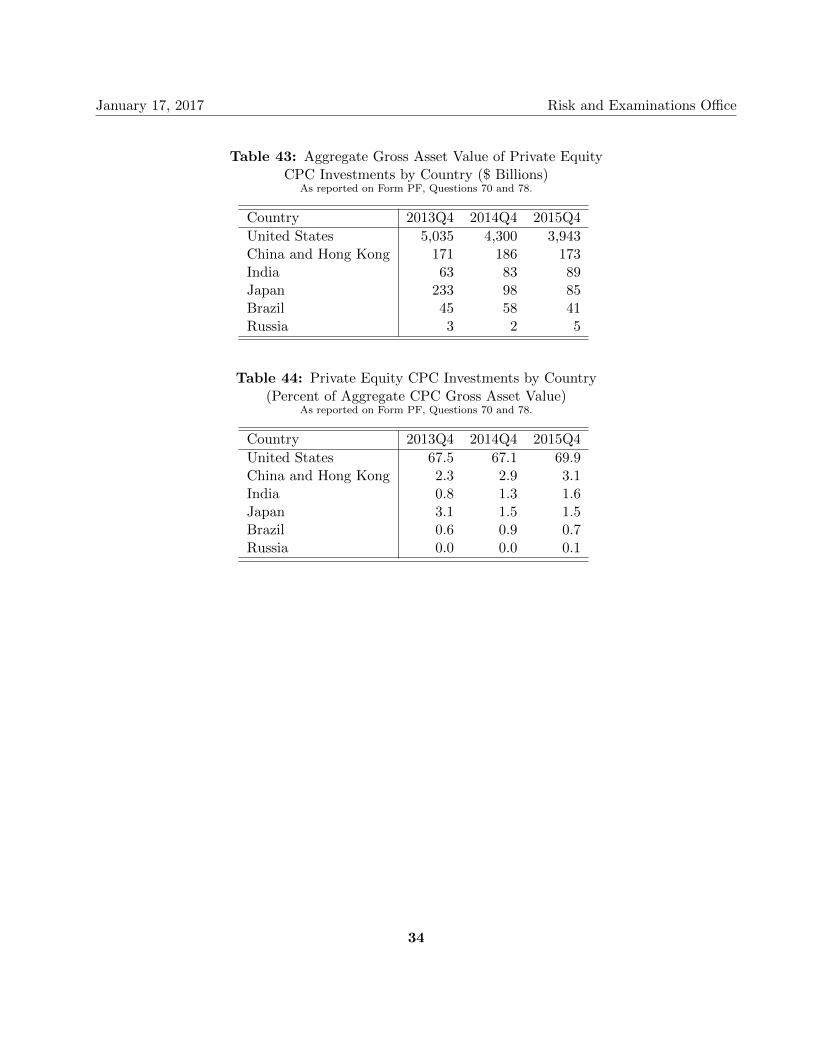
Table 43: Aggregate Gross Asset Value of Private EquityCPC Investments by Country ($ Billions)
As reported on Form PF, Questions 70 and 78.
Country 2013Q4 2014Q4 2015Q4
United States 5,035 4,300 3,943China and Hong Kong 171 186 173India 63 83 89Japan 233 98 85Brazil 45 58 41Russia 3 2 5
Table 44: Private Equity CPC Investments by Country(Percent of Aggregate CPC Gross Asset Value)
As reported on Form PF, Questions 70 and 78.
Country 2013Q4 2014Q4 2015Q4
United States 67.5 67.1 69.9China and Hong Kong 2.3 2.9 3.1India 0.8 1.3 1.6Japan 3.1 1.5 1.5Brazil 0.6 0.9 0.7Russia 0.0 0.0 0.1
34
January 17, 2017 Risk and Examinations Office
XI Appendices
A Form PF Filer Categories
The amount of information an adviser must report and the frequency with which it must reporton Form PF depends on the amount of the adviser’s private fund assets and the types of privatefunds managed. Reporting advisers must identify the types of private funds they manage on FormPF.
1 All Private Fund Advisers
SEC-registered investment advisers with at least $150 million in private fund assets undermanagement are required to file Form PF. Registered investment advisers with less than $150 millionin private funds assets under management, exempt reporting advisers, and state-registered advisersreport general private fund data on Form ADV, but do not file Form PF.6 Not all Form PF filersreport on a quarterly basis. Smaller private fund advisers and all private equity fund advisers fileForm PF on an annual basis, while larger hedge fund advisers and larger liquidity fund advisers filethe form quarterly.7 As a result of the difference in reporting frequency, information in this reportrelated to funds that are reported annually may be dated by several months.8
2 Large Hedge Fund Advisers
Large Hedge Fund Advisers have at least $1.5 billion in hedge fund assets under management.A Large Hedge Fund Adviser is required to file Form PF quarterly and provide data about eachhedge fund it managed during the reporting period (irrespective of the size of the fund).
Large Hedge Fund Advisers must report more information on Form PF about Qualifying HedgeFunds than other hedge funds they manage during the reporting period. A Qualifying Hedge Fund isany hedge fund advised by a Large Hedge Fund Adviser that had a NAV (individually or incombination with any feeder funds, parallel funds, and/or dependent parallel managed accounts) ofat least $500 million as of the last day of any month in the fiscal quarter immediately preceding theadviser’s most recently completed fiscal quarter. This report provides information about all hedgefunds reported by Large Hedge Fund Advisers, including Qualifying Hedge Funds and smaller hedgefunds. This report also provides an overview of certain data reported solely for Qualifying HedgeFunds.
6Note that these thresholds are on a gross basis. Exempt reporting advisers are advisers that rely on the exemptionsfrom SEC registration in Advisers Act section 203(l) for venture capital fund advisers and section 203(m) for advisersmanaging less than $150 million in private fund assets in the U.S.7An adviser may be a large hedge fund adviser that must file quarterly to report data about the hedge funds it manages
as well as a private equity fund adviser that must file only annually to report data about the private equity funds itmanages.8In addition, because some Form PF filers have fiscal year ends that are not December 31, not all Form PF data is filed
as of a single date.
35
January 17, 2017 Risk and Examinations Office
3 Large Liquidity Fund Advisers
Large Liquidity Fund Advisers have at least $1 billion in combined liquidity fund and moneymarket fund assets under management. On a quarterly basis, such advisers report on Form PF dataabout the liquidity funds they managed during the reporting period (irrespective of the size of thefund). This report contains information about all liquidity funds reported by Large Liquidity FundAdvisers (referred to in this report as “Section 3 Liquidity Funds”).
4 Large Private Equity Fund Advisers
Large Private Equity Fund Advisers have at least a $2 billion in private equity fund assetsunder management. These advisers are required to file Form PF annually in connection with theprivate equity funds they managed during the reporting period. Smaller Private Equity FundAdvisers must file annually as well, but provide less detail regarding the private equity funds theymanage. This report provides information about private equity funds managed by Large PrivateEquity Fund Advisers (referred to in this report as “Section 4 Private Equity Funds”).
5 Other Private Fund Advisers
All advisers required to file Form PF that are not Large Hedge Fund Advisers or LargeLiquidity Fund Advisers must file Form PF annually to report data about each private fundmanaged by the adviser.9 These “annual filing advisers” include smaller fund advisers, Large PrivateEquity Fund advisers, and venture capital fund advisers. Annual filers must provide specificinformation about each of the private funds they manage on an annual basis.
9This includes “other private funds,” which are private funds that do not meet the Form PF definition of hedge fund,liquidity fund, private equity fund, real estate fund, securitized asset fund, or venture capital fund.
36
January 17, 2017 Risk and Examinations Office
B Handling Annual and Quarterly Data
Only a subset of filers (Large Hedge Fund Advisers and Large Liquidity Fund Advisers) arerequired to file Form PF quarterly; all other filings are made annually. Annual filings are typically,but not always, made at the end of the calendar year, as Form PF allows filings to be made at theend of an adviser’s fiscal year. In order to present the most complete and recent data possible, whileaccounting for differences in filing dates, we use the following procedure for determining which datato consider in any given quarter:
First, filings are grouped by their report date within their reported year:
• (Q1): February 15 to May 14
• (Q2): May 15 to August 14
• (Q3): August 15 to November 14
• (Q4): November 15 to February 14
Then, responses for funds that have no information are ‘filled forward’ — essentially, copiedfrom last reported values — up to a maximum of three quarters. Any fund that has no data fourquarters after its most recent date is no longer counted or included in any calculations.10
C How to Read a Boxplot
In these figures, the boxes extend from the twenty-fifth percentile to the seventy-fifth percentile,while the levels (the dashed vertical lines) extend from the tenth to the twenty-fifth percentile as wellas the seventy-fifth to the ninetieth percentile. Also shown as a red line within the box is the median(the fiftieth percentile) and the horizontal dashed line is mean of the distribution. See Figure 13 foran explanation of each feature.
Figure 13: How to Read a Boxplot
10Form PF has no requirement to inform the SEC if a fund liquidates or otherwise terminates operations. Therefore,liquidations or terminations may not be reflected on this report for up to one year after ceasing operations.
37
January 17, 2017 Risk and Examinations Office
D Mitigating the Effects of Outliers
Form PF data occasionally contains spurious outliers. While REO staff actively engages inoutreach to identify and correct such values, not all aberrant values have been corrected as of thiswriting. To reduce the effect of these outliers on the aggregate measures reported here, we havechosen to winsorize or trim some data sets.
Winsorization is a technique for reducing the effect of outliers by reducing the size of the largestand smallest values in a distribution.11 For example, to calculate a 95%/5% winsorized data set, allthe values above the ninety-fifth percentile are set to the value of the ninety-fifth percentile, and allthe values below the fifth percentile are set to the value of the fifth percentile. Effectively, thisprocedure makes the very largest values smaller (but still large), and all the smallest values larger(but still small). This approach can be more effective than trimming (simply removing the largestand/or smallest values) because it does not change the number of data points and does not changethe median or other percentile values within the 95%/5% range. All instances of winsorization ortrimming have been noted and include the affected percentiles.
11Such techniques are known as ‘robust statistics’, reviewed for example in Wilcox (2012), Introduction to RobustEstimation & Hypothesis Testing, 3rd Edition.
38
January 17, 2017 Risk and Examinations Office
E Definitions
Included by reference are all definitions included in the glossary of Form PF.
Aggregate Exposure A dollar value for long and short positions as of the last day in eachmonth of the reporting period, by sub-asset class, including all exposurewhether held physically, synthetically or through derivatives. Includesclosed out and OTC forward positions that have not expired, as well aspositions in side-pockets.
Borrowing In Form PF, borrowings include secured borrowings, unsecured borrow-ings, as well as synthetic borrowings (e.g., total return swaps that meetthe failed sale accounting requirements).
CPC Controlled portfolio company, as defined in Form PF.
Gross Notional Exposure (GNE) The gross nominal or notional value of all transactions that have beenentered into but not yet settled as of the data reporting date. Forcontracts with variable nominal or notional principal amounts, the basisfor reporting is the nominal or notional principal amounts as of the datareporting date.
Hedge Fund Any private fund (other than a securitized asset fund): (a) with respectto which one or more investment advisers (or related persons of invest-ment advisers) may be paid a performance fee or allocation calculatedby taking into account unrealized gains (other than a fee or allocationthe calculation of which may take into account unrealized gains solelyfor the purpose of reducing such fee or allocation to reflect net unre-alized losses); (b) that may borrow an amount in excess of one-half ofits net asset value (including any committed capital) or may have grossnotional exposure in excess of twice its net asset value (including anycommitted capital); or (c) that may sell securities or other assets shortor enter into similar transactions (other than for the purpose of hedg-ing currency exposure or managing duration). The definition of a hedgefund for Form PF purposes also includes any commodity pool an adviserreports on Form PF.
IRDs Interest rate derivatives, including foreign exchange derivatives used foreither investment or hedging.
Large Hedge Fund Adviser An adviser that has at least $1.5 billion in hedge fund assets undermanagement.
Large Liquidity Fund Adviser An adviser that has at least $1 billion in combined liquidity fund andmoney market fund assets under management.
Large Private Equity Fund Adviser An adviser that has at least a $2 billion in private equity fund assetsunder management.
Parallel Managed Account An account advised by an adviser that pursues substantially the same in-vestment objective and strategy and invests side by side in substantiallythe same positions as the reporting fund.
Qualifying Hedge Fund A hedge fund advised by a Large Hedge Fund Adviser that has a net assetvalue (individually or in combination with any feeder funds, parallelfunds, and/or dependent parallel managed accounts) of at least $500million as of the last day of any month in the fiscal quarter immediatelypreceding the adviser’s most recently completed fiscal quarter.
Section 3 Liquidity Fund A liquidity fund advised by a Large Liquidity Fund Adviser.
Section 4 Private Equity Fund A private equity fund advised by a Large Private Equity Fund Adviser.
Value For derivatives (other than options), “value” means gross notional value;for options, “value” means delta adjusted notional value; for all otherinvestments and for all borrowings where the reporting fund is the credi-tor, “value” means market value or, where there is not a readily availablemarket value, fair value; for borrowings where the reporting fund is thedebtor, “value” means the value you report internally and to currentand prospective investors.


![srkrec.edu.insrkrec.edu.in/3_R17_M.pdf · 1 [B17 CE 3101] III B. Tech I Semester (R17) Regular Examinations STRUCTURAL ANALYSIS – II CIVIL ENGINEERING MODEL QUESTION PAPER TIME:](https://static.documents.pub/doc/80x56/5e727c1dcaa029136f6ef285/1-b17-ce-3101-iii-b-tech-i-semester-r17-regular-examinations-structural-analysis.jpg)


