37
Risk and Reliability Assessments
for Improvement of Process Safety
Copyright 2011 MESA North American Conference
Subramanya Nayak & M. Sam MannanMary Kay O’ Connor Process Safety Center, Artie McFerrin Department of Chemical Engineering, Texas A&M University
Copyright 2011 MESA North American Conference
Outline• Introduction• Incidents that grab our attention• Risk• Risk Assessment
– Probabilistic Modeling + Reliability Assessment– Consequence Analysis
• Acceptable Risk• Concluding Remarks
Copyright 2011 MESA North American Conference
Introduction
• The growing concerns about the loss of life and environmental damage in the event of an incident have served to focus our attention on the hazards and risk involved in the manufacturing activities.
• In addition in the event of an incident there are also considerable financial losses and penalties.
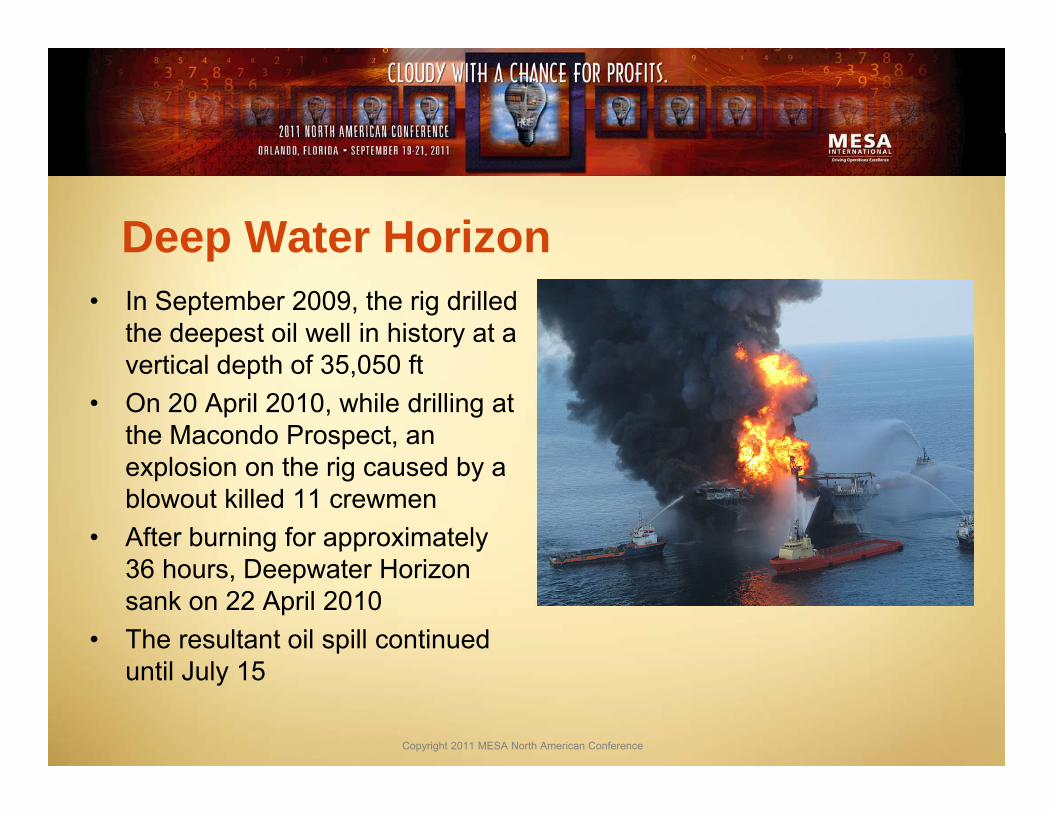
Deep Water Horizon• In September 2009, the rig drilled
the deepest oil well in history at a vertical depth of 35,050 ft
• On 20 April 2010, while drilling at the Macondo Prospect, an explosion on the rig caused by a blowout killed 11 crewmen
• After burning for approximately 36 hours, Deepwater Horizon sank on 22 April 2010
• The resultant oil spill continued until July 15
Copyright 2011 MESA North American Conference
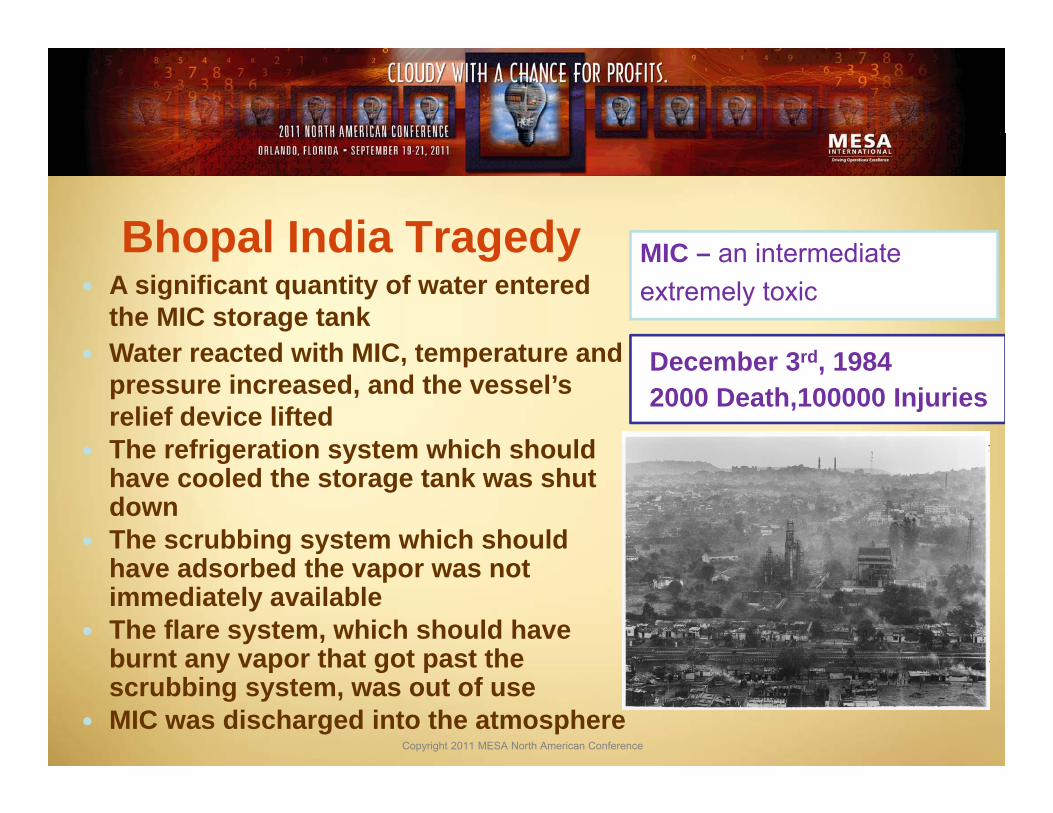
Bhopal India Tragedy A significant quantity of water entered
the MIC storage tank Water reacted with MIC, temperature and
pressure increased, and the vessel’s relief device lifted
The refrigeration system which should have cooled the storage tank was shut down
The scrubbing system which should have adsorbed the vapor was not immediately available
The flare system, which should have burnt any vapor that got past the scrubbing system, was out of use
MIC was discharged into the atmosphereCopyright 2011 MESA North American Conference
MIC – an intermediateextremely toxic
December 3rd, 19842000 Death,100000 Injuries
Texas City U.S. Explosion
Copyright 2011 MESA North American Conference
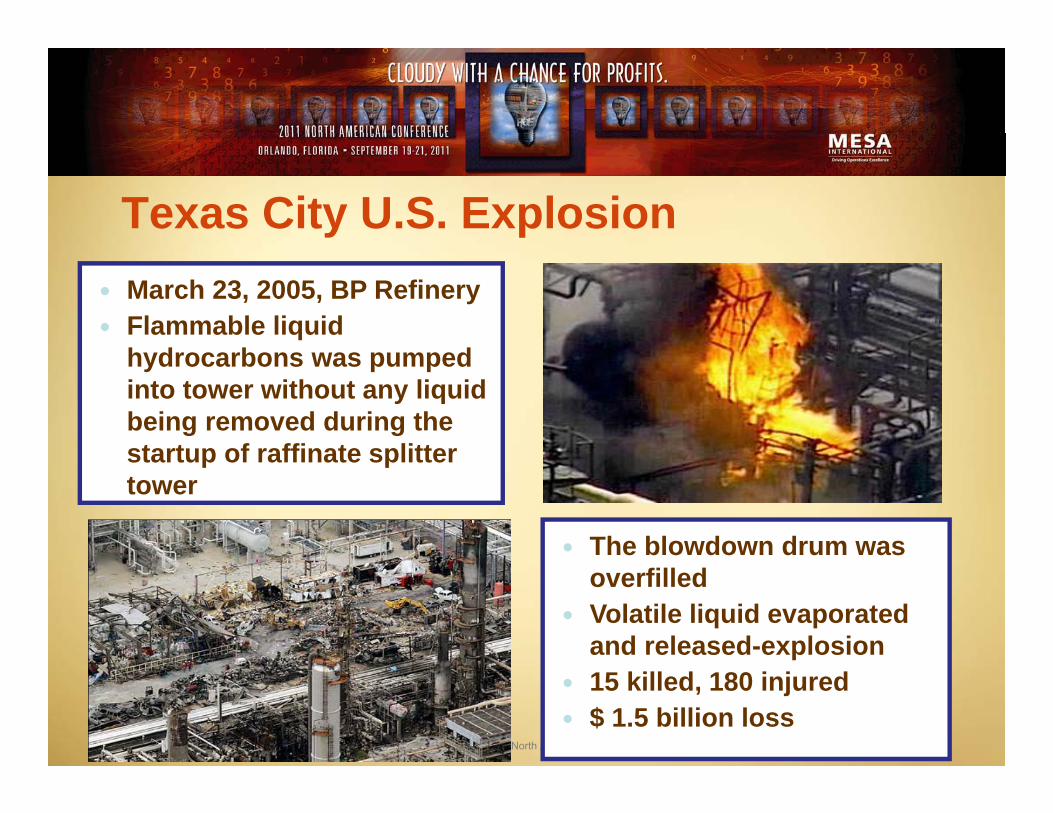
March 23, 2005, BP Refinery Flammable liquid
hydrocarbons was pumped into tower without any liquid being removed during the startup of raffinate splitter tower
The blowdown drum was overfilled
Volatile liquid evaporated and released-explosion
15 killed, 180 injured $ 1.5 billion loss
Did the incident happen occasionally?
• Over the intervening 33 years, other catastrophic incidents have grabbed the attention of the public and media
• These incidents happened all over the world threatening people’s lives and property
Copyright 2011 MESA North American Conference
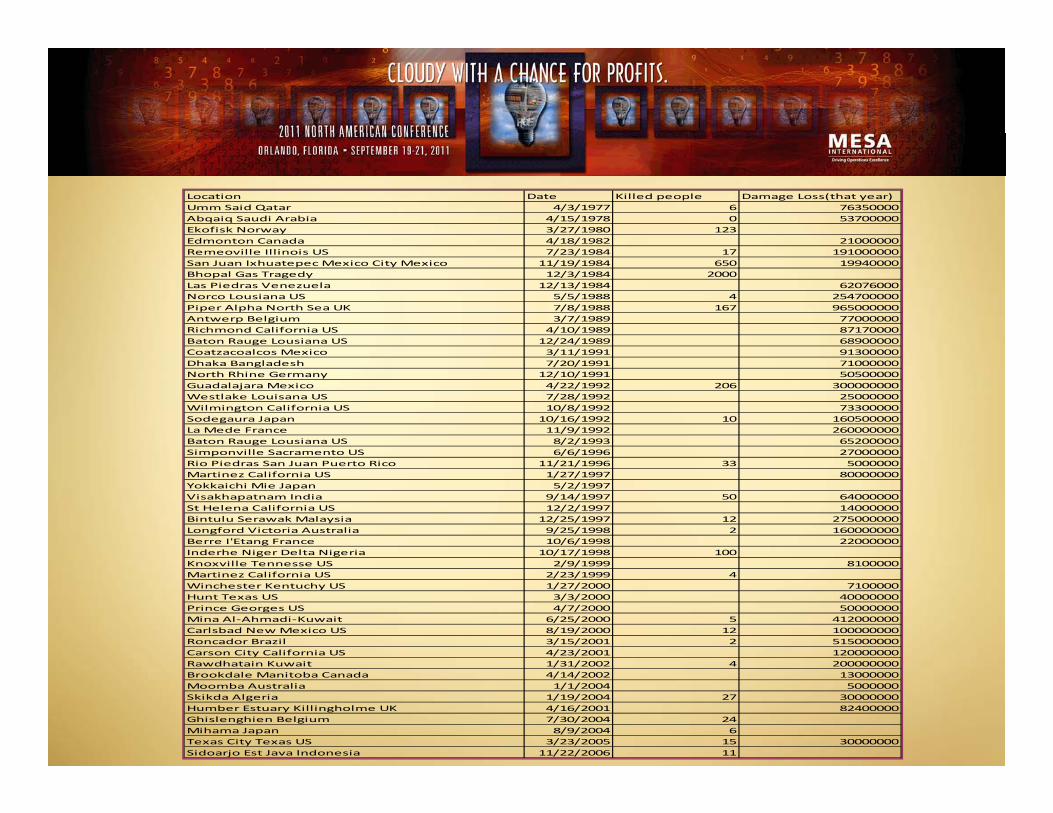
Location Date Killed people Damage Loss(that year)Umm Said Qatar 4/3/1977 6 76350000Abqaiq Saudi Arabia 4/15/1978 0 53700000Ekofisk Norway 3/27/1980 123Edmonton Canada 4/18/1982 21000000Remeoville Illinois US 7/23/1984 17 191000000San Juan Ixhuatepec Mexico City Mexico 11/19/1984 650 19940000Bhopal Gas Tragedy 12/3/1984 2000Las Piedras Venezuela 12/13/1984 62076000Norco Lousiana US 5/5/1988 4 254700000Piper Alpha North Sea UK 7/8/1988 167 965000000Antwerp Belgium 3/7/1989 77000000Richmond California US 4/10/1989 87170000Baton Rauge Lousiana US 12/24/1989 68900000Coatzacoalcos Mexico 3/11/1991 91300000Dhaka Bangladesh 7/20/1991 71000000North Rhine Germany 12/10/1991 50500000Guadalajara Mexico 4/22/1992 206 300000000Westlake Louisana US 7/28/1992 25000000Wilmington California US 10/8/1992 73300000Sodegaura Japan 10/16/1992 10 160500000La Mede France 11/9/1992 260000000Baton Rauge Lousiana US 8/2/1993 65200000Simponville Sacramento US 6/6/1996 27000000Rio Piedras San Juan Puerto Rico 11/21/1996 33 5000000Martinez California US 1/27/1997 80000000Yokkaichi Mie Japan 5/2/1997Visakhapatnam India 9/14/1997 50 64000000St Helena California US 12/2/1997 14000000Bintulu Serawak Malaysia 12/25/1997 12 275000000Longford Victoria Australia 9/25/1998 2 160000000Berre I'Etang France 10/6/1998 22000000Inderhe Niger Delta Nigeria 10/17/1998 100Knoxville Tennesse US 2/9/1999 8100000Martinez California US 2/23/1999 4Winchester Kentuchy US 1/27/2000 7100000Hunt Texas US 3/3/2000 40000000Prince Georges US 4/7/2000 50000000Mina Al‐Ahmadi‐Kuwait 6/25/2000 5 412000000Carlsbad New Mexico US 8/19/2000 12 100000000Roncador Brazil 3/15/2001 2 515000000Carson City California US 4/23/2001 120000000Rawdhatain Kuwait 1/31/2002 4 200000000Brookdale Manitoba Canada 4/14/2002 13000000Moomba Australia 1/1/2004 5000000Skikda Algeria 1/19/2004 27 30000000Humber Estuary Killingholme UK 4/16/2001 82400000Ghislenghien Belgium 7/30/2004 24Mihama Japan 8/9/2004 6Texas City Texas US 3/23/2005 15 30000000Sidoarjo Est Java Indonesia 11/22/2006 11
10
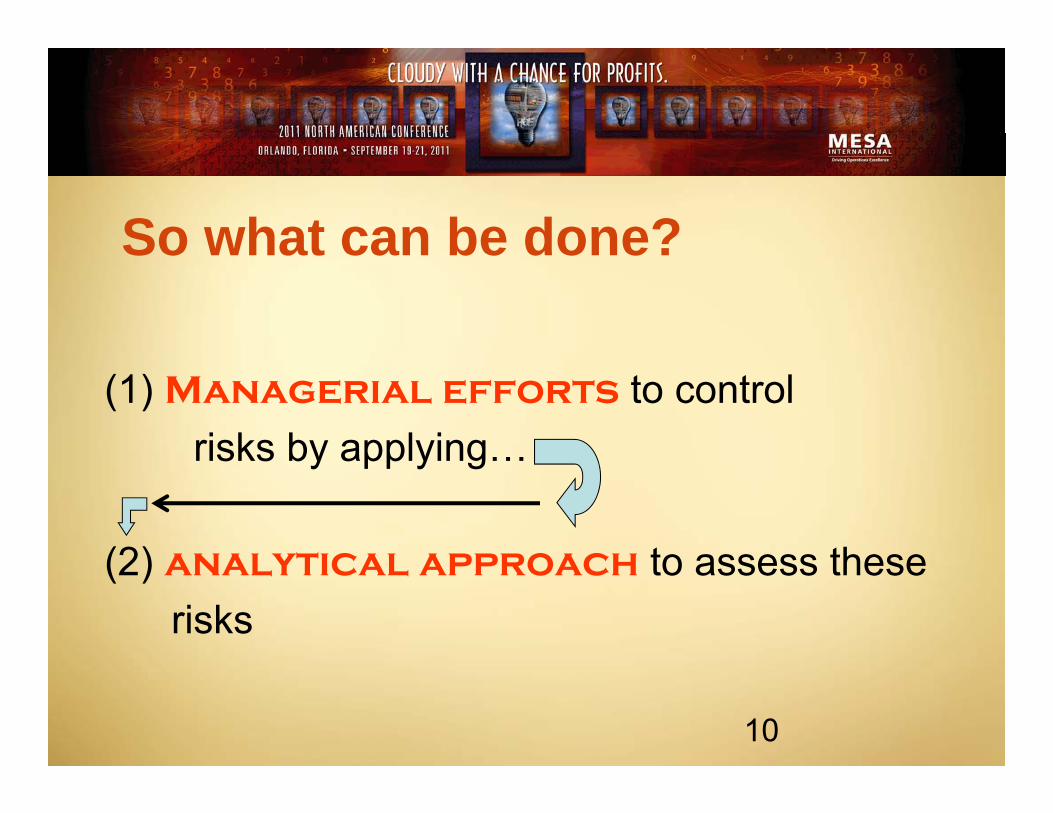
So what can be done?
(1) Managerial efforts to control risks by applying…
(2) analytical approach to assess these risks
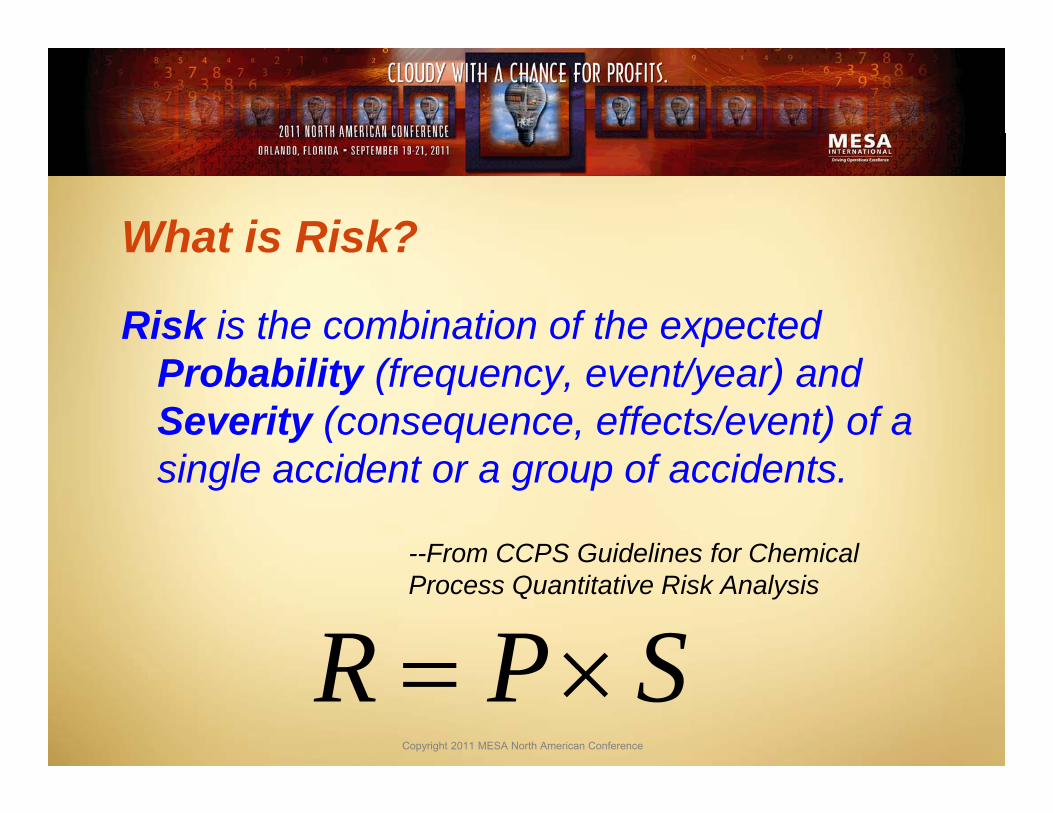
What is Risk?
Risk is the combination of the expected Probability (frequency, event/year) and Severity (consequence, effects/event) of a single accident or a group of accidents.
--From CCPS Guidelines for Chemical Process Quantitative Risk Analysis
Copyright 2011 MESA North American Conference
SPR
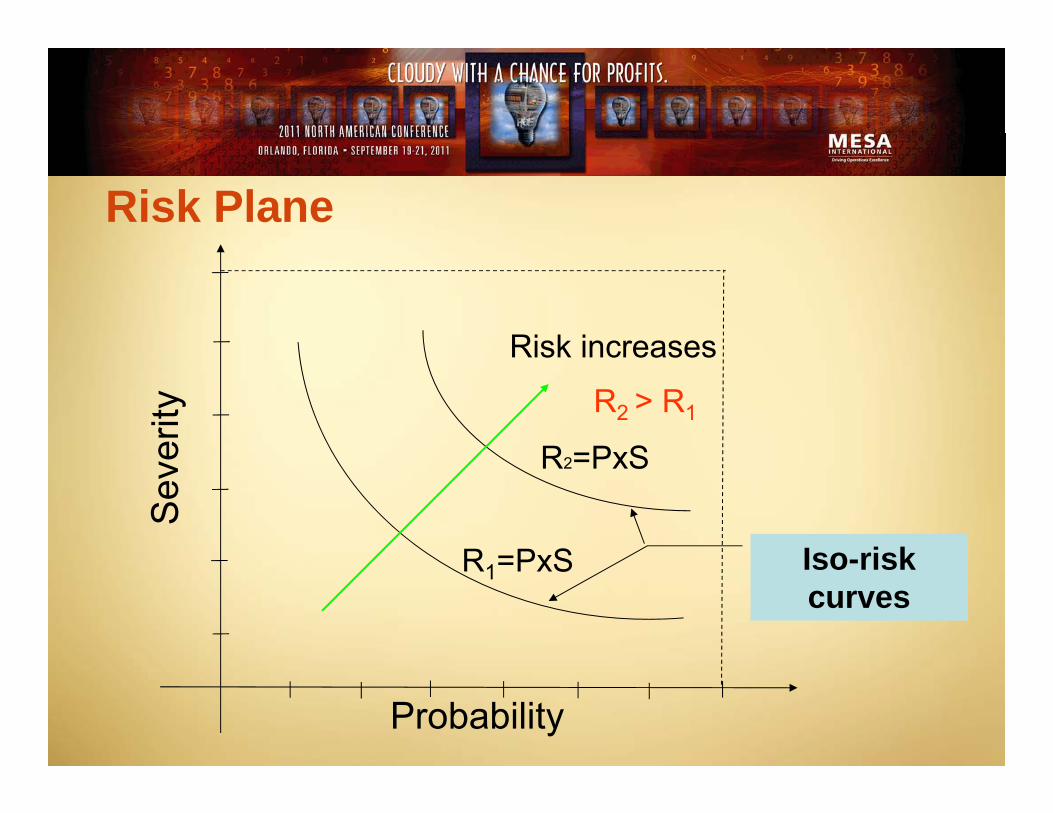
Risk increases
Iso-risk curves
R1=PxS
R2=PxS
R2 > R1
Probability
Sev
erity
Risk Plane
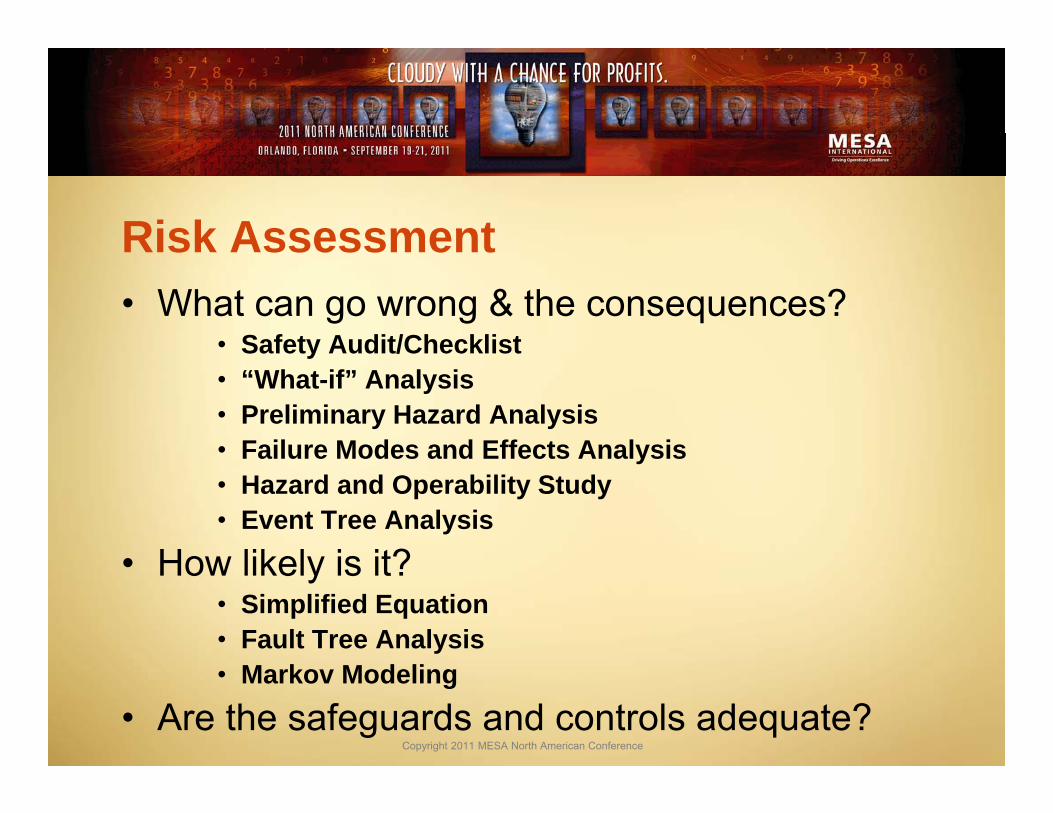
Risk Assessment• What can go wrong & the consequences?
• Safety Audit/Checklist• “What-if” Analysis• Preliminary Hazard Analysis• Failure Modes and Effects Analysis• Hazard and Operability Study• Event Tree Analysis
• How likely is it?• Simplified Equation• Fault Tree Analysis• Markov Modeling
• Are the safeguards and controls adequate?Copyright 2011 MESA North American Conference
Risk Assessment
• Both qualitative and quantitative methods are used in risk assessment
• Quantitative method is preferred when failure rate data is available
Copyright 2011 MESA North American Conference
Quantitative Risk Assessment, QRA
• QRA is a mathematical approach to estimate the risk in form of numerical probability (or frequency) of an event and the outcome consequence magnitude, and give guidance on appropriate means of minimizing them
Copyright 2011 MESA North American Conference
Copyright 2011 MESA North American Conference
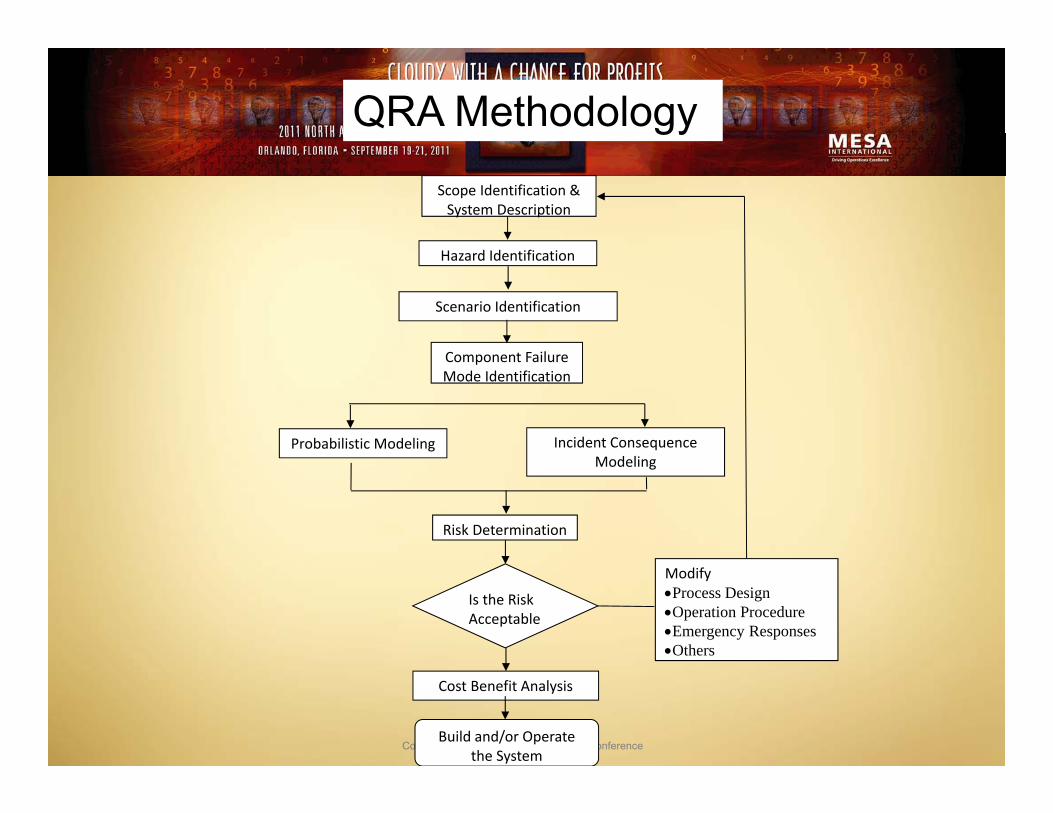
Scope Identification & System Description
Hazard Identification
Scenario Identification
Component Failure Mode Identification
Probabilistic Modeling Incident Consequence Modeling
Risk Determination
Is the Risk Acceptable
ModifyProcess DesignOperation ProcedureEmergency ResponsesOthers
Cost Benefit Analysis
Build and/or Operate the System
QRA Methodology
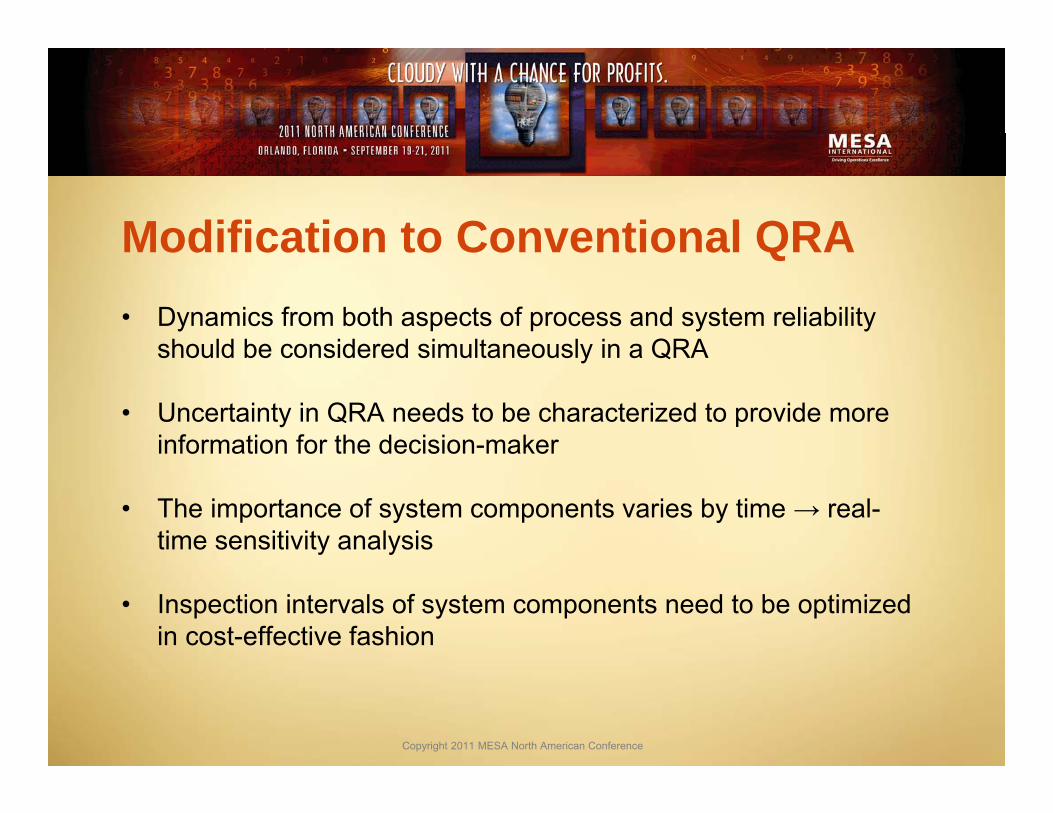
Modification to Conventional QRA
Copyright 2011 MESA North American Conference
• Dynamics from both aspects of process and system reliability should be considered simultaneously in a QRA
• Uncertainty in QRA needs to be characterized to provide more information for the decision-maker
• The importance of system components varies by time → real-time sensitivity analysis
• Inspection intervals of system components need to be optimized in cost-effective fashion
Copyright 2011 MESA North American Conference
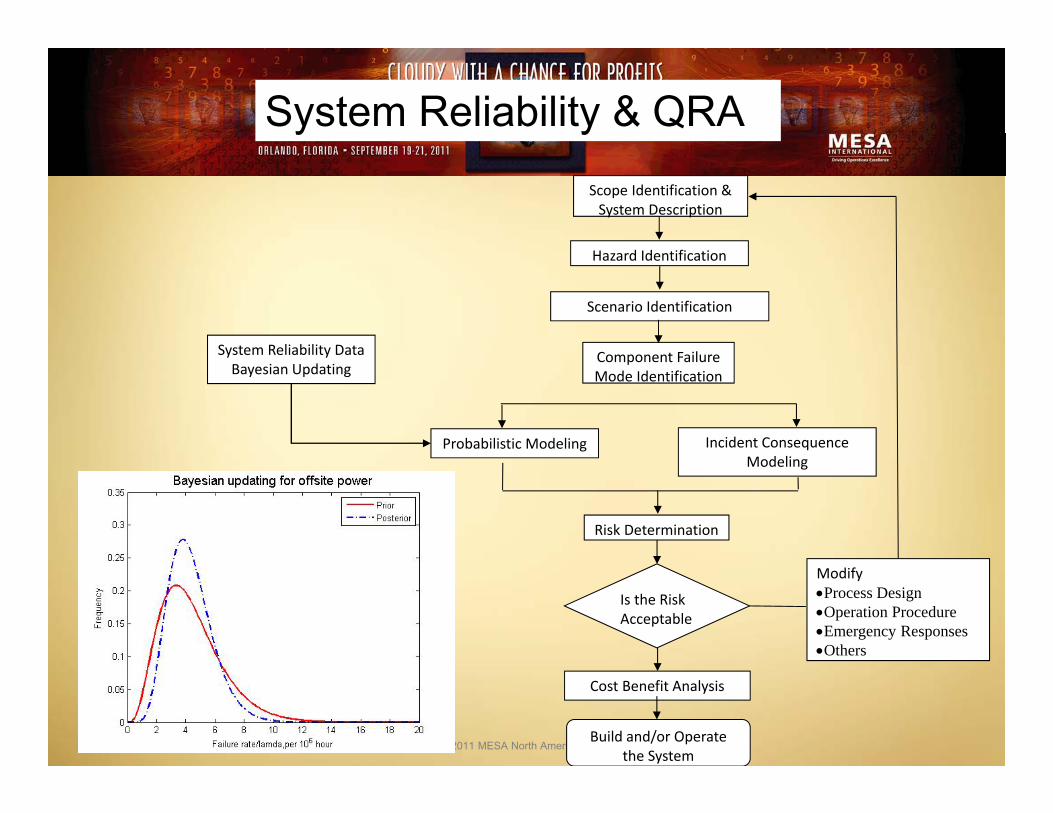
Scope Identification & System Description
Hazard Identification
Scenario Identification
Component Failure Mode Identification
Probabilistic Modeling Incident Consequence Modeling
Risk Determination
Is the Risk Acceptable
ModifyProcess DesignOperation ProcedureEmergency ResponsesOthers
Cost Benefit Analysis
Build and/or Operate the System
System Reliability & QRA
System Reliability DataBayesian Updating
Copyright 2011 MESA North American Conference
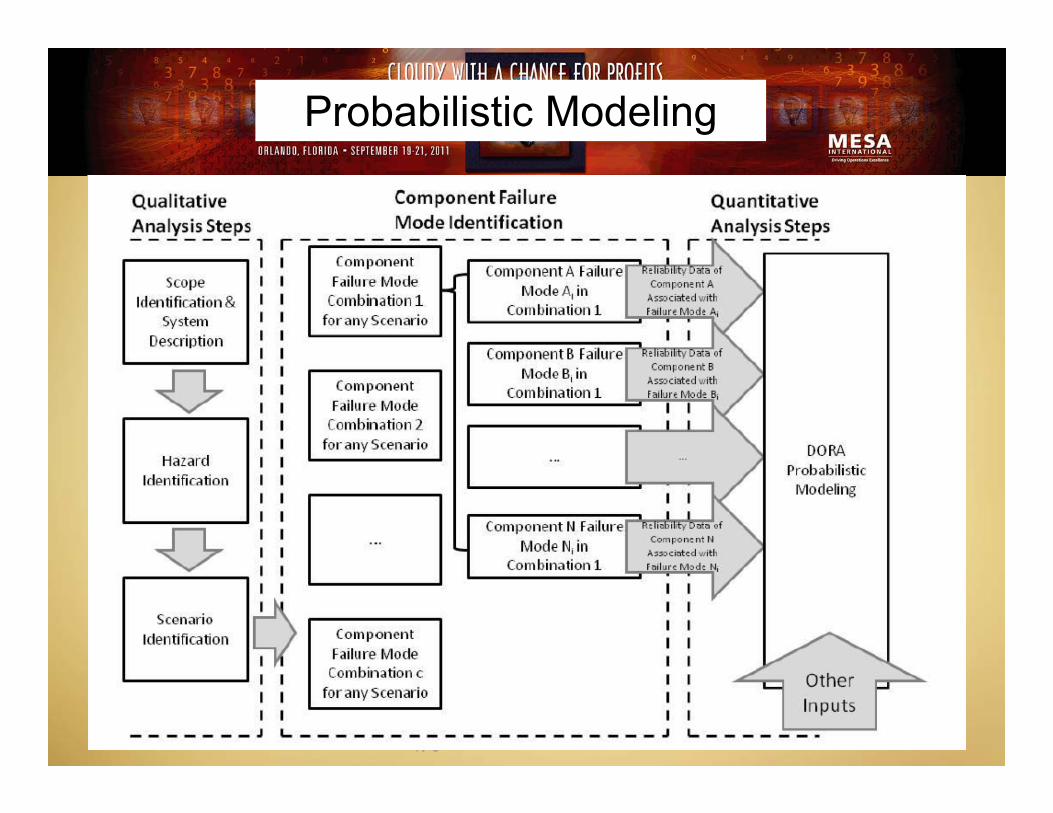
Probabilistic Modeling
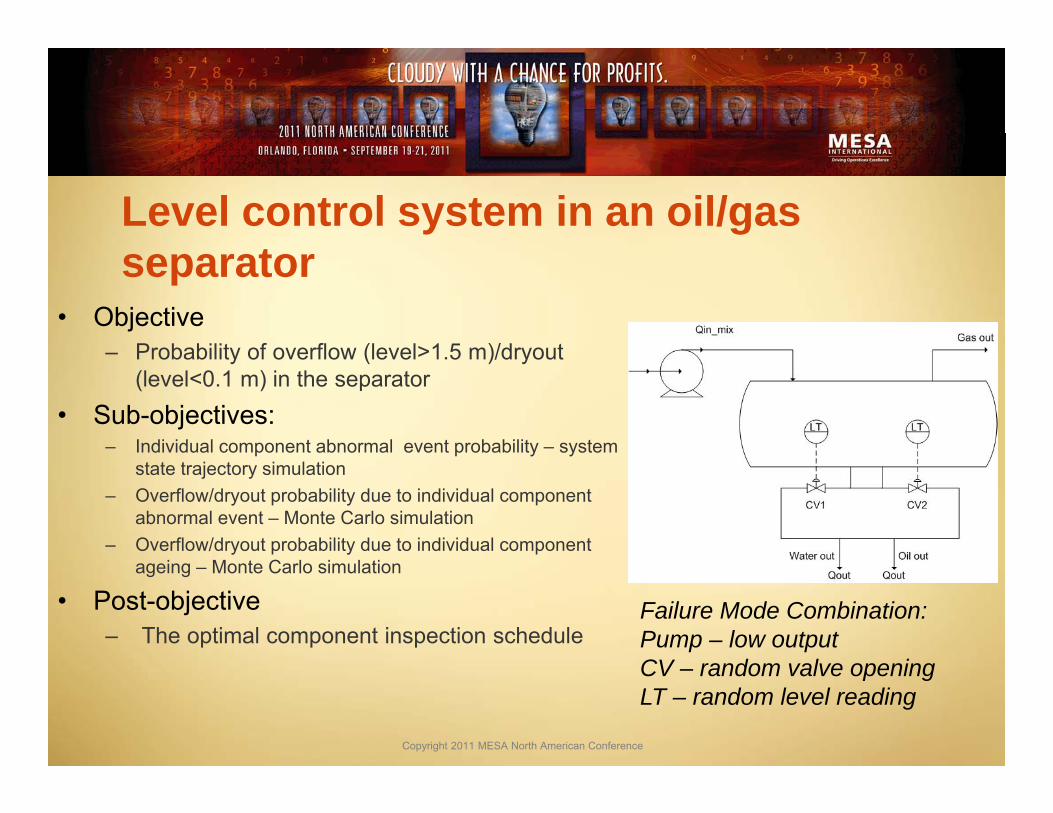
Level control system in an oil/gas separator
• Objective– Probability of overflow (level>1.5 m)/dryout
(level<0.1 m) in the separator• Sub-objectives:
– Individual component abnormal event probability – system state trajectory simulation
– Overflow/dryout probability due to individual component abnormal event – Monte Carlo simulation
– Overflow/dryout probability due to individual component ageing – Monte Carlo simulation
• Post-objective– The optimal component inspection schedule
Copyright 2011 MESA North American Conference
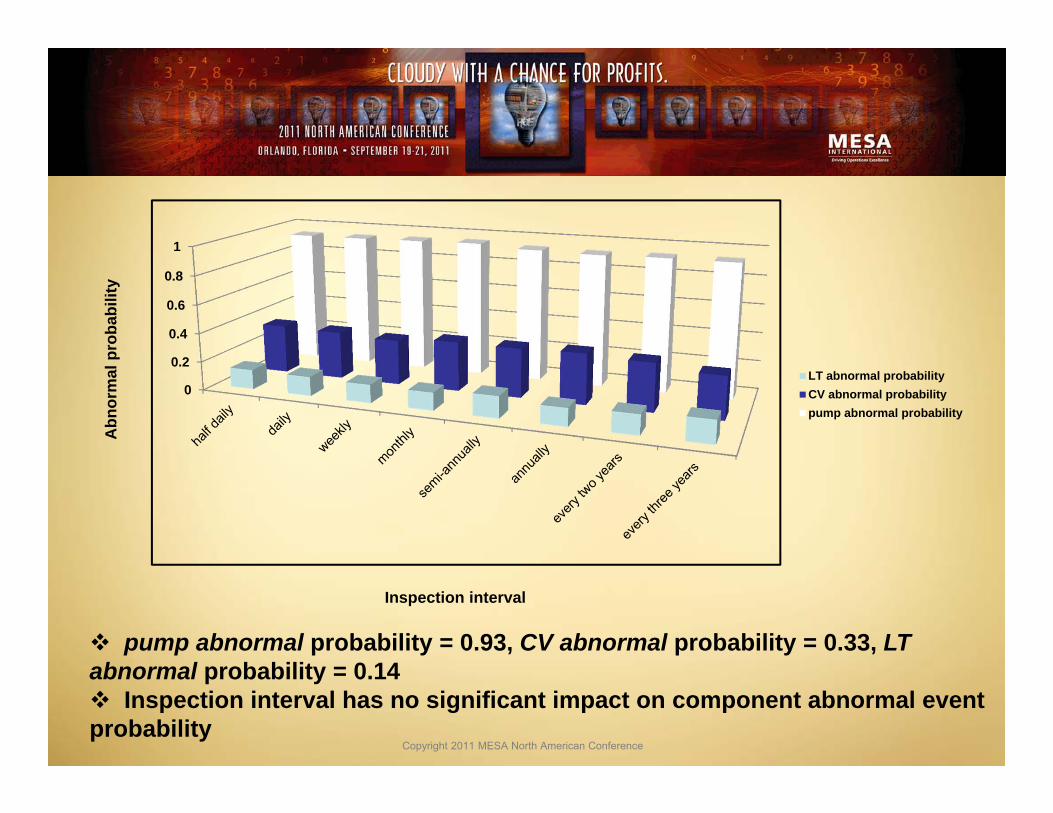
Failure Mode Combination:Pump – low outputCV – random valve openingLT – random level reading
Copyright 2011 MESA North American Conference
0
0.2
0.4
0.6
0.8
1
LT abnormal probabilityCV abnormal probabilitypump abnormal probability
Inspection interval
Abn
orm
alpr
obab
ility
pump abnormal probability = 0.93, CV abnormal probability = 0.33, LT abnormal probability = 0.14 Inspection interval has no significant impact on component abnormal event probability
Copyright 2011 MESA North American Conference
0
0.1
0.2
0.3
0.4
0.5
0.6
0.7
0.8
0.9
1
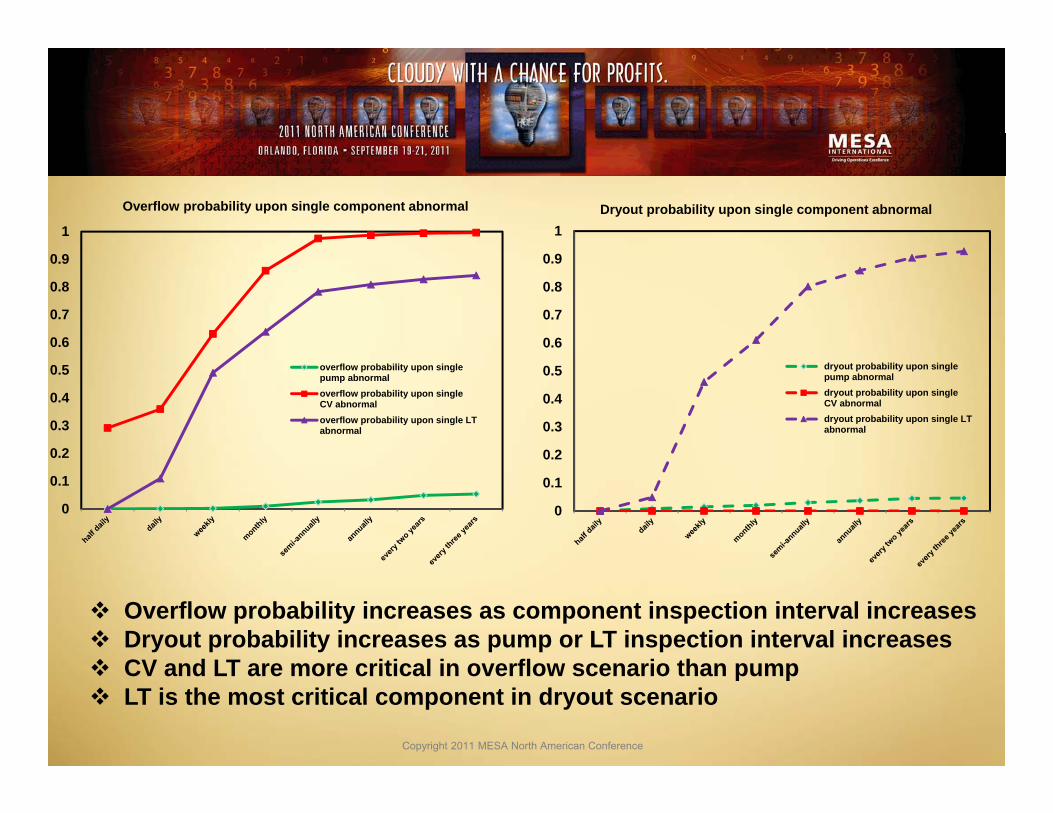
Overflow probability upon single component abnormal
overflow probability upon singlepump abnormaloverflow probability upon singleCV abnormaloverflow probability upon single LTabnormal
0
0.1
0.2
0.3
0.4
0.5
0.6
0.7
0.8
0.9
1Dryout probability upon single component abnormal
dryout probability upon singlepump abnormaldryout probability upon singleCV abnormaldryout probability upon single LTabnormal
Overflow probability increases as component inspection interval increases Dryout probability increases as pump or LT inspection interval increases CV and LT are more critical in overflow scenario than pump LT is the most critical component in dryout scenario
Copyright 2011 MESA North American Conference
0
0.1
0.2
0.3
0.4
0.5
0.6
Half Daily Daily Weekly Monthly
Prob
abili
ty o
f Dry
out
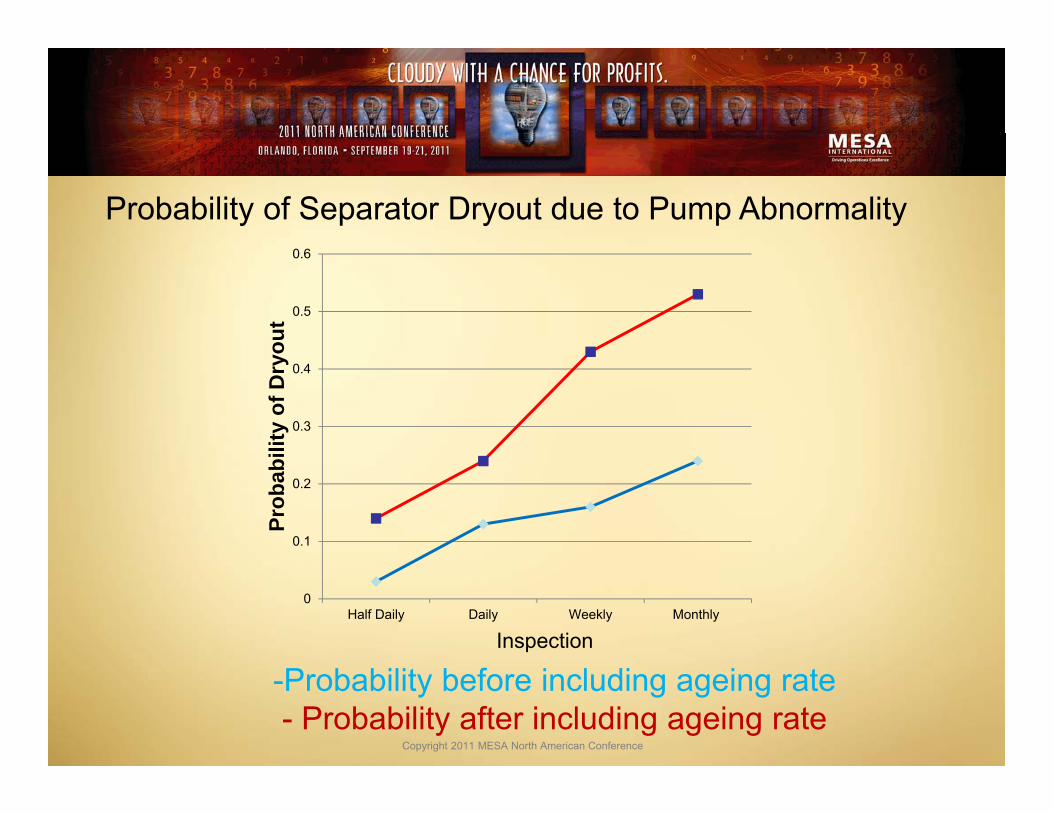
Probability of Separator Dryout due to Pump Abnormality
-Probability before including ageing rate- Probability after including ageing rate
Inspection
Consequence Analysis
• The physical effects of potential hazards– Discharge– Dispersion – Thermal radiation– Vapor cloud explosions– Fire Damage– Toxic Damage
Copyright 2011 MESA North American Conference
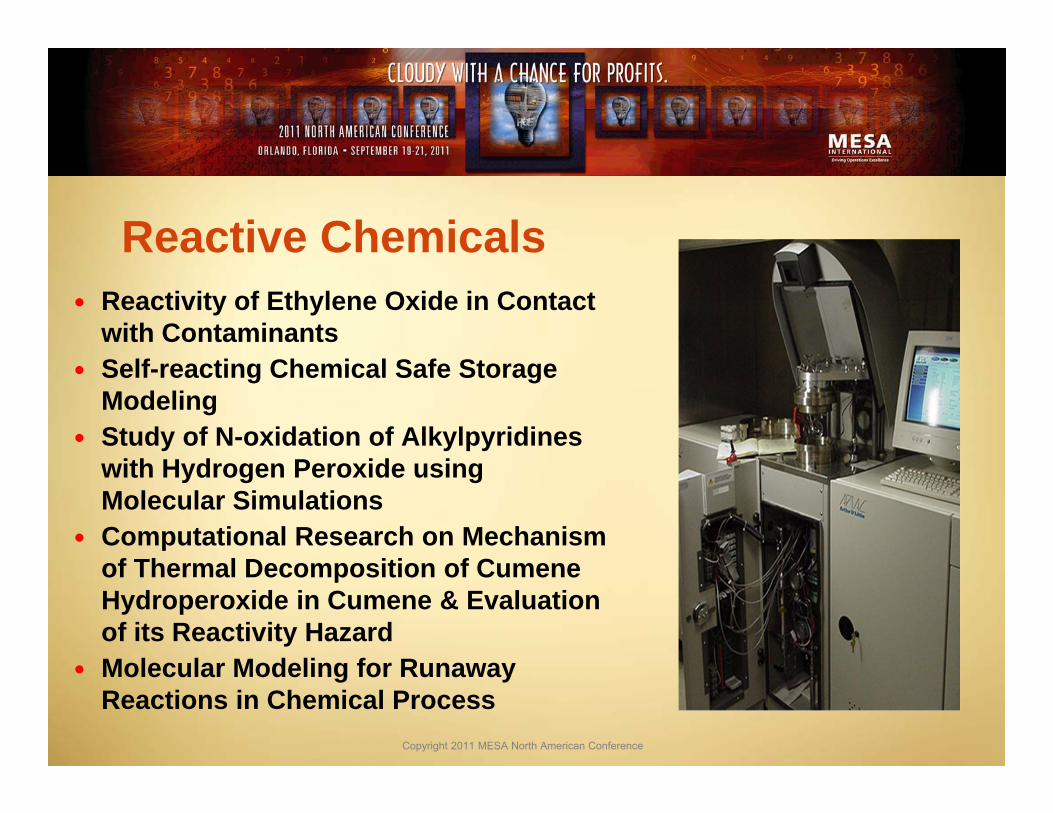
Reactive Chemicals Reactivity of Ethylene Oxide in Contact
with Contaminants Self-reacting Chemical Safe Storage
Modeling Study of N-oxidation of Alkylpyridines
with Hydrogen Peroxide using Molecular Simulations
Computational Research on Mechanism of Thermal Decomposition of CumeneHydroperoxide in Cumene & Evaluation of its Reactivity Hazard
Molecular Modeling for Runaway Reactions in Chemical Process
Copyright 2011 MESA North American Conference
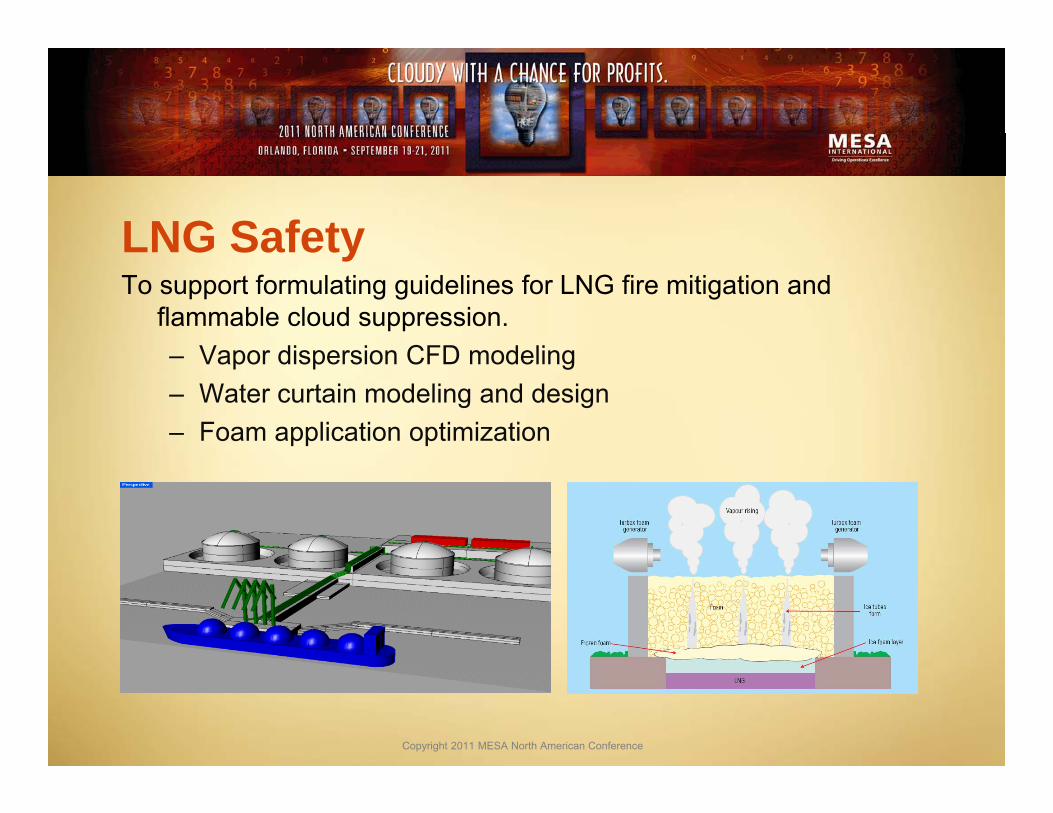
LNG SafetyTo support formulating guidelines for LNG fire mitigation and
flammable cloud suppression. – Vapor dispersion CFD modeling– Water curtain modeling and design– Foam application optimization
Copyright 2011 MESA North American Conference
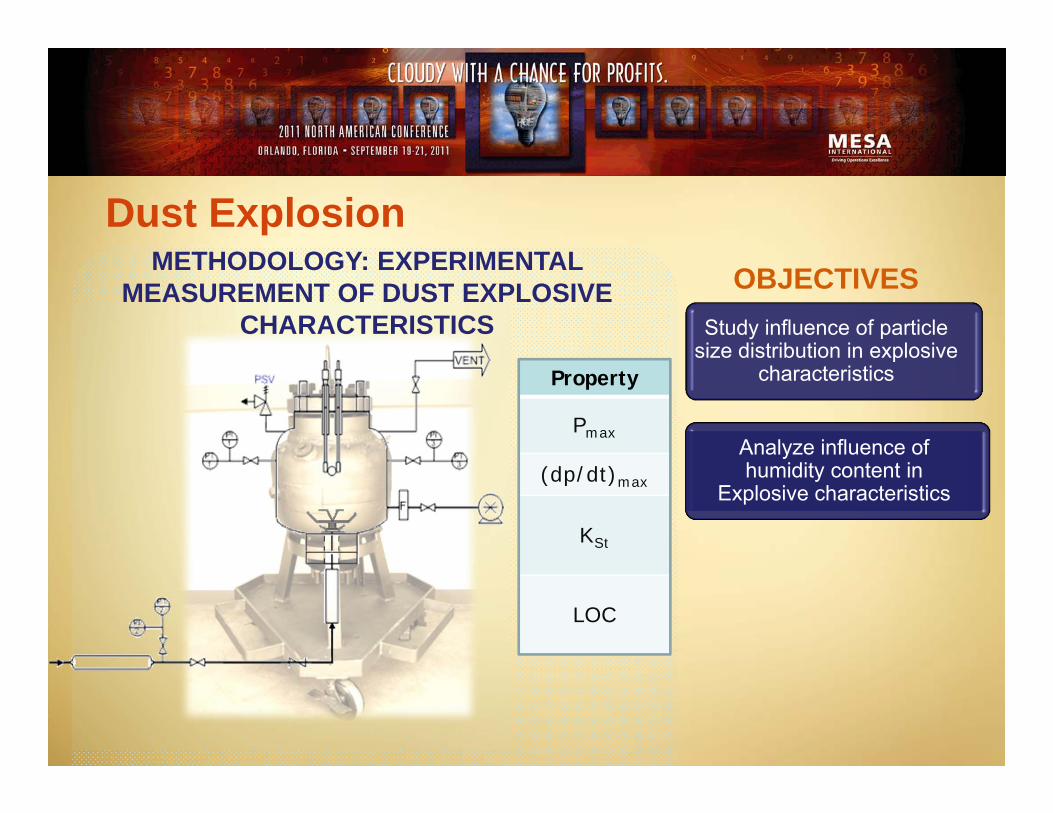
Property
Pmax
(dp/dt)max
KSt
LOC
Study influence of particle size distribution in explosive
characteristics
METHODOLOGY: EXPERIMENTAL MEASUREMENT OF DUST EXPLOSIVE
CHARACTERISTICS OBJECTIVES
Analyze influence of humidity content in
Explosive characteristics
Dust Explosion
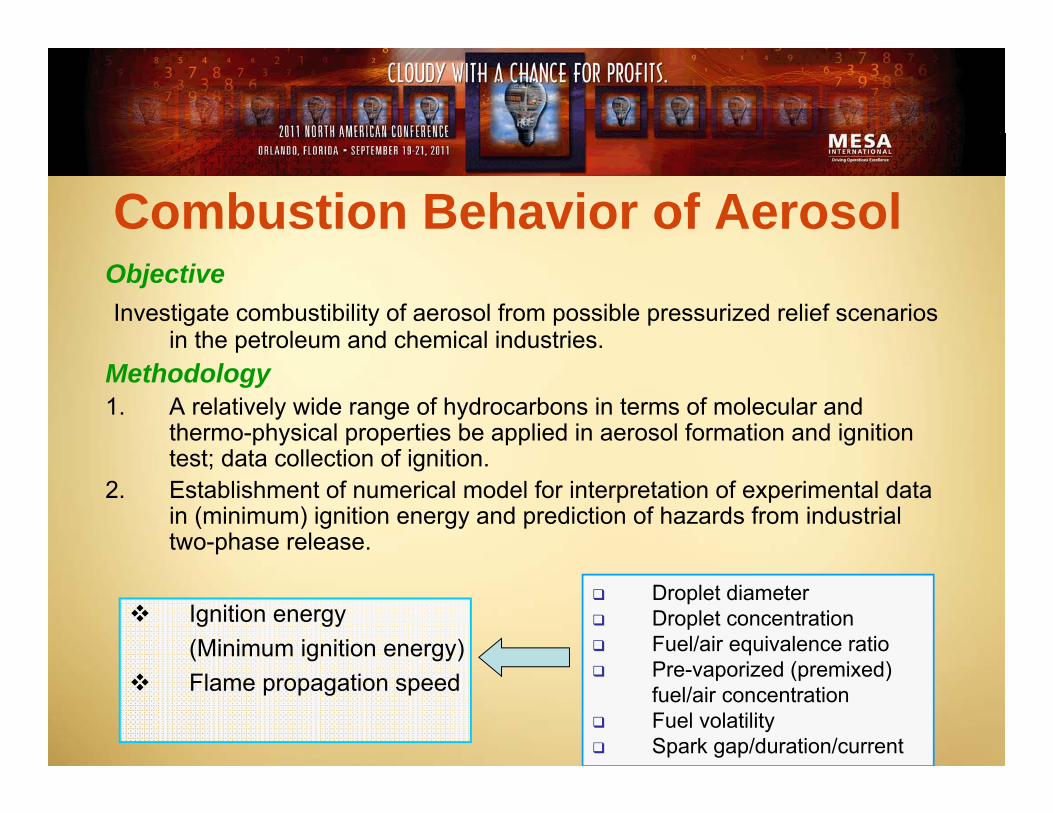
Combustion Behavior of AerosolObjectiveInvestigate combustibility of aerosol from possible pressurized relief scenarios
in the petroleum and chemical industries.Methodology1. A relatively wide range of hydrocarbons in terms of molecular and
thermo-physical properties be applied in aerosol formation and ignition test; data collection of ignition.
2. Establishment of numerical model for interpretation of experimental data in (minimum) ignition energy and prediction of hazards from industrial two-phase release.
Droplet diameter Droplet concentration Fuel/air equivalence ratio Pre-vaporized (premixed)
fuel/air concentration Fuel volatility Spark gap/duration/current
Ignition energy (Minimum ignition energy)
Flame propagation speed
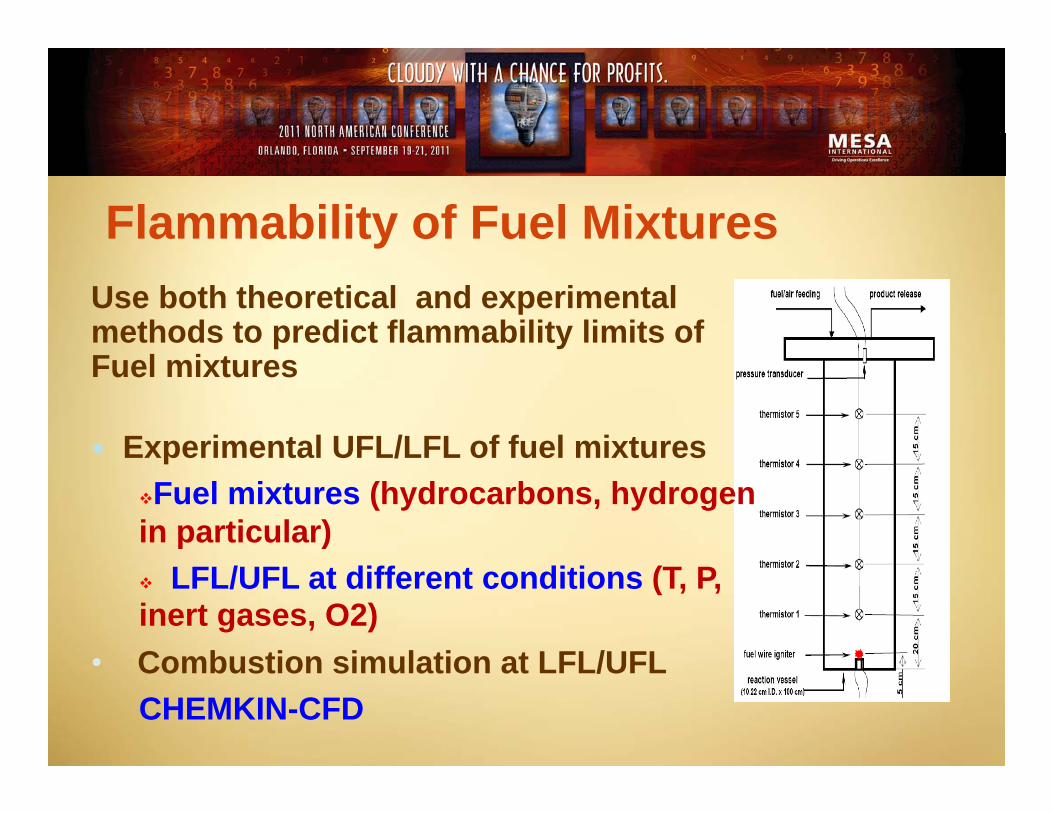
Flammability of Fuel MixturesUse both theoretical and experimental methods to predict flammability limits of Fuel mixtures
Experimental UFL/LFL of fuel mixturesFuel mixtures (hydrocarbons, hydrogen in particular) LFL/UFL at different conditions (T, P, inert gases, O2)
• Combustion simulation at LFL/UFLCHEMKIN-CFD
WHAT IS AN ACCEPTABLE RISK?
Copyright 2011 MESA North American Conference
How should we know?
• We accept risk(s) in three cases:
– We do not know it exist– It’s insignificant low– When it’s worth it (??????)
Copyright 2011 MESA North American Conference
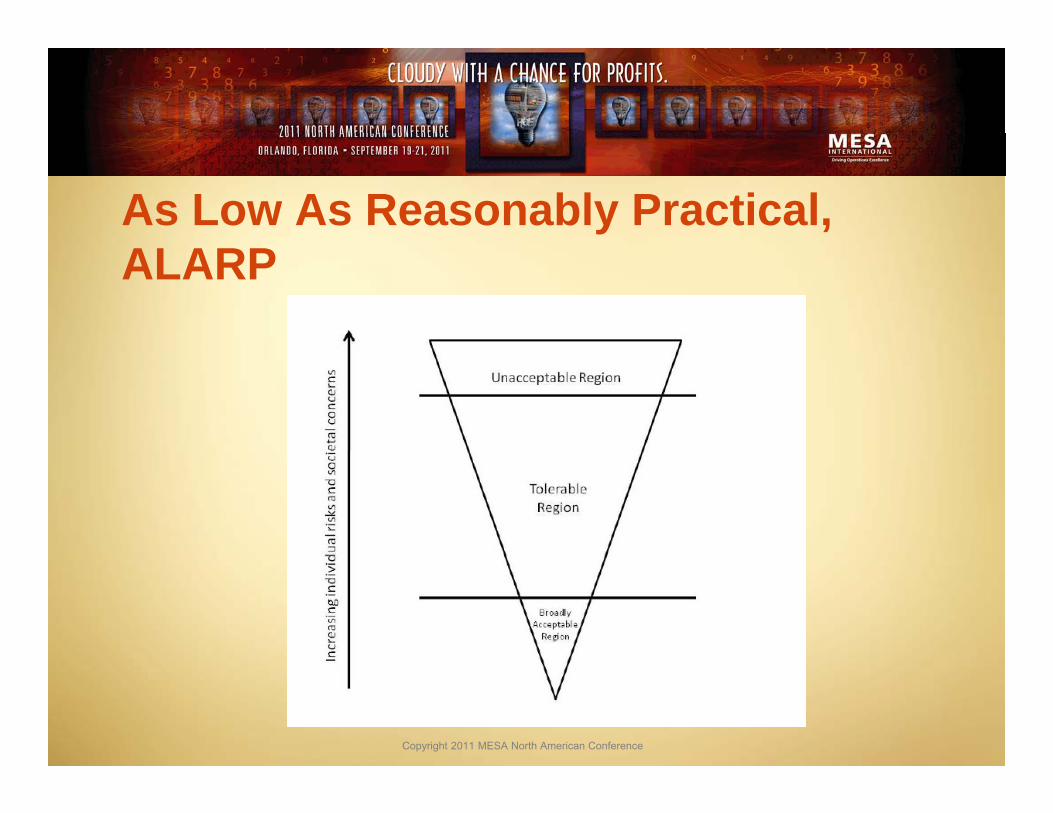
As Low As Reasonably Practical, ALARP
Copyright 2011 MESA North American Conference
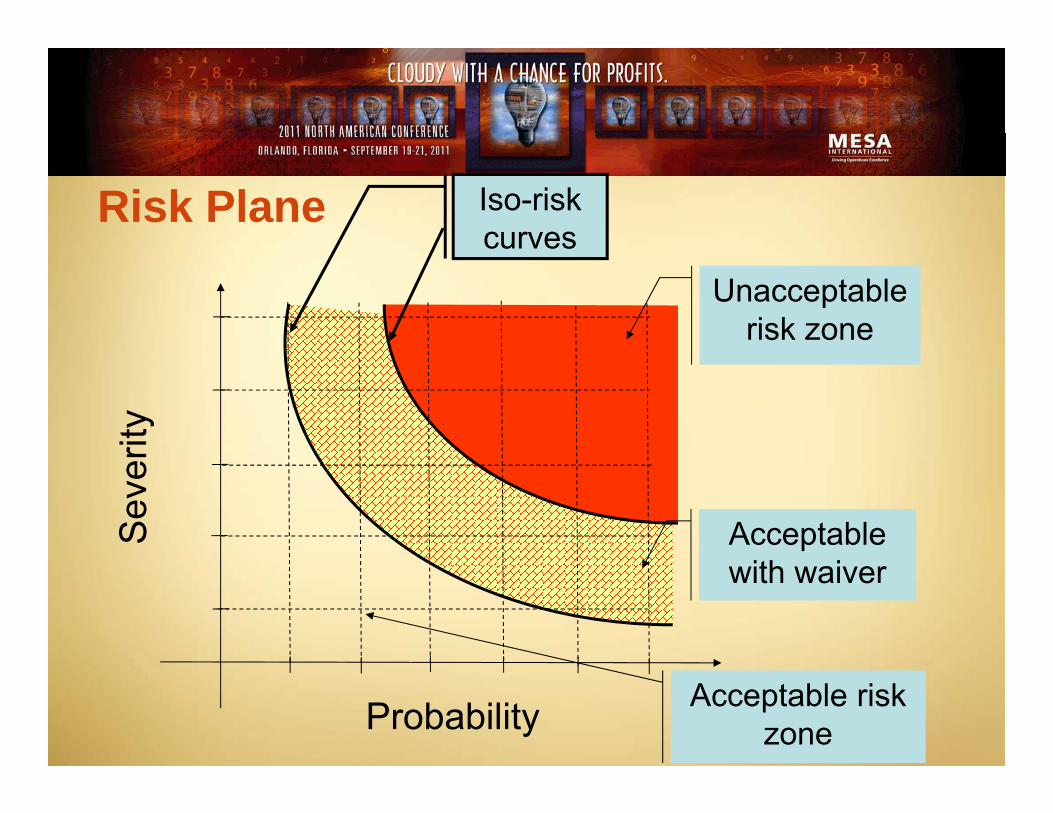
Probability
Sev
erity
Iso-risk curves
Unacceptable risk zone
Acceptable with waiver
Acceptable risk zone
Risk Plane
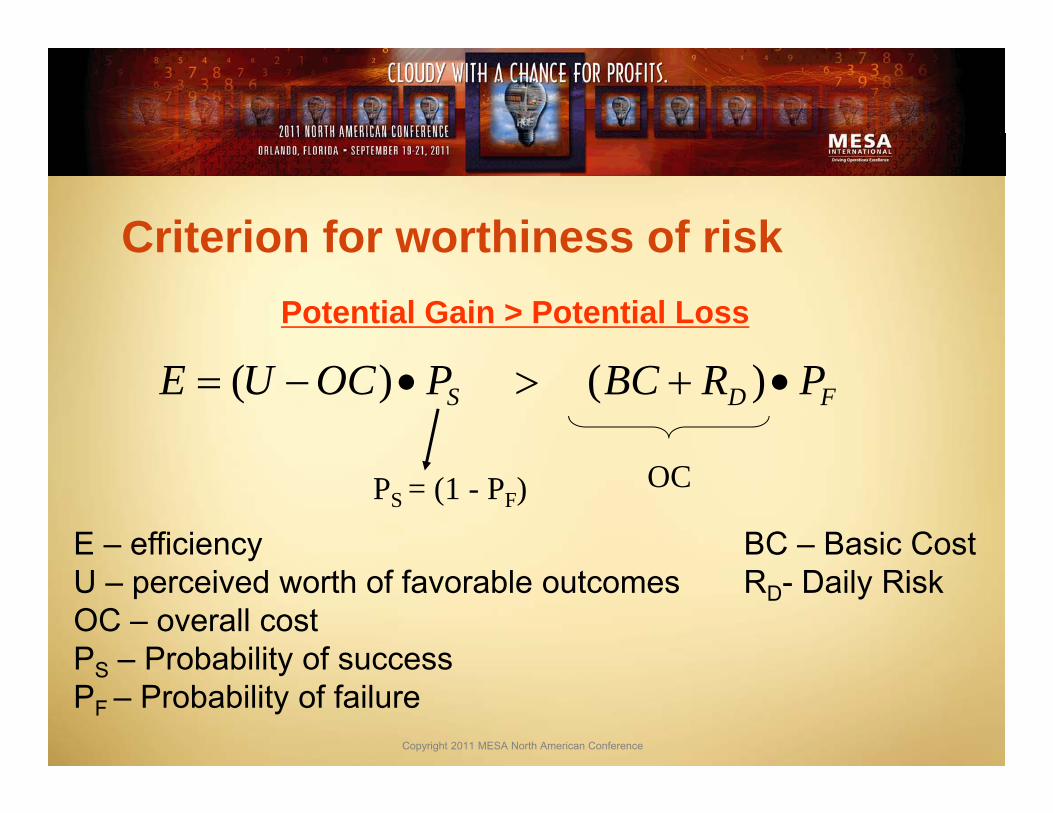
Criterion for worthiness of risk
Copyright 2011 MESA North American Conference
FDS PRBCPOCUE )()(
OCPS = (1 - PF)
Potential Gain > Potential Loss
E – efficiency BC – Basic CostU – perceived worth of favorable outcomes RD- Daily RiskOC – overall costPS – Probability of successPF – Probability of failure
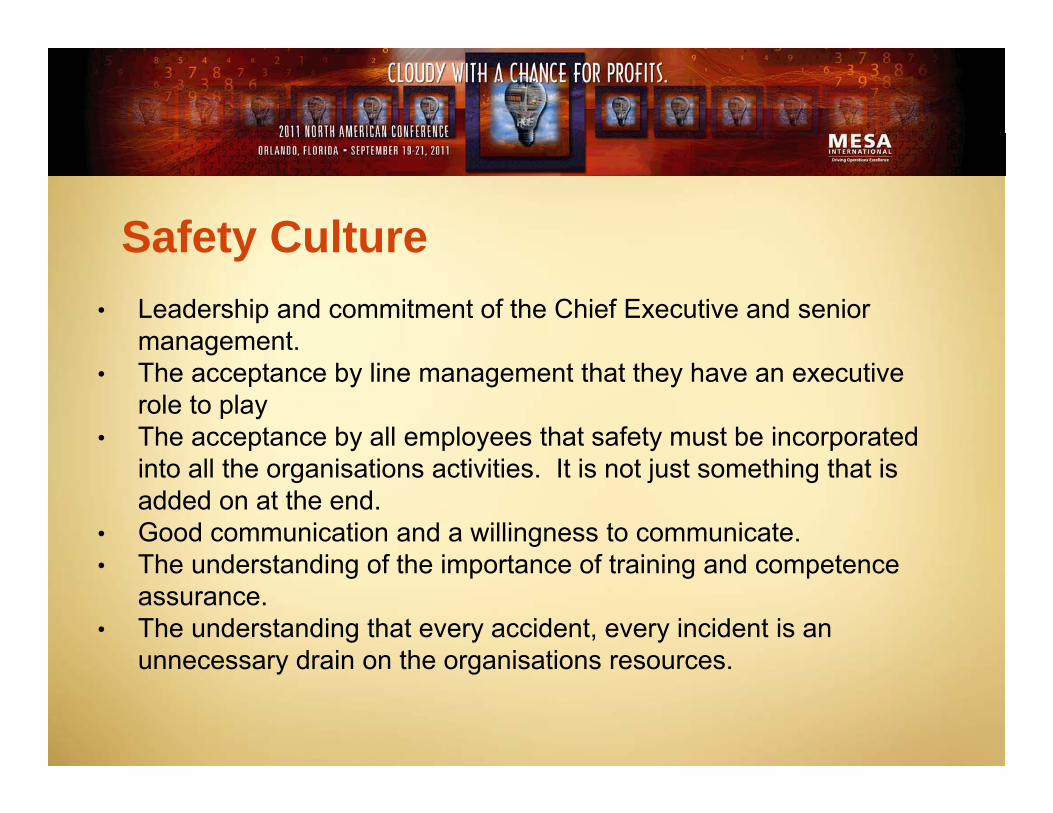
Safety Culture• Leadership and commitment of the Chief Executive and senior
management.• The acceptance by line management that they have an executive
role to play• The acceptance by all employees that safety must be incorporated
into all the organisations activities. It is not just something that is added on at the end.
• Good communication and a willingness to communicate.• The understanding of the importance of training and competence
assurance.• The understanding that every accident, every incident is an
unnecessary drain on the organisations resources.
Concluding Remarks
Companies cannot be sustainable without successful safety and risk management programs. And thus by extension, it is impossible for society to reach the goals for “engineering for sustainable development” without successful safety and risk management programs.
Copyright 2011 MESA North American Conference
Thank You
Subramanya Nayak, PhDAssistant Research EngineerMary Kay O Connor Process Safety Center Texas A&M University [email protected]://process-safety.tamu.edu
Copyright 2011 MESA North American Conference
Making Safety Second Nature


![The Effect of Hindered Phenol Stabilizers on Oxygen Induction … · hydrogen atom from another polymer chain to form a hydroperoxide [ROOH]. The hydroperoxide can The hydroperoxide](https://static.documents.pub/doc/80x56/5cc1221488c993ed078b9533/the-effect-of-hindered-phenol-stabilizers-on-oxygen-induction-hydrogen-atom.jpg)


![Chapter 4shodhganga.inflibnet.ac.in/bitstream/10603/35843/12... · ), tertiary butyl hydrogen peroxide (TBHP) and Cumene hydroperoxide (CHP). Besides these, aluminum [43, 44], copper](https://static.documents.pub/doc/80x56/5f318d4c4479b6276c09aff3/chapter-tertiary-butyl-hydrogen-peroxide-tbhp-and-cumene-hydroperoxide-chp.jpg)

