156


HOMELAND SECURITY STUDIES AND ANALYSIS INSTITUTE
The Homeland Security Act of 2002 (Section 305 of PL 107-296, as codified in 6 U.S.C. 185), herein referred to as the “Act,” authorizes the Secretary of the Department of Homeland Security (DHS), acting through the Under Secretary for Science and Technology, to establish one or more federally funded research and development centers (FFRDCs) to provide independent analysis of homeland security issues. Analytic Services Inc. operates the HOMELAND SECURITY STUDIES
AND ANALYSIS INSTITUTE as a FFRDC for DHS under contract HSHQDC-09-D-00003.
The Institute provides the government with the necessary expertise to conduct: cross-cutting mission analysis, strategic studies and assessments, development of models that baseline current capabilities, development of simulations and technical evaluations to evaluate mission trade-offs, creation and evolution of high-level operational and system concepts, development of top-level system and operational requirements and performance metrics, operational analysis across the homeland security enterprise, and analytic support for operational testing evaluation in tandem with the government’s acquisition process. The Institute also works with and supports other federal, state, local, tribal, public and private sector organizations that make up the homeland security enterprise.
The Institute’s research is undertaken by mutual consent with DHS and is organized as a set of discrete tasks. This report presents the results of research and analysis conducted under
Task 10-01.03.16-01, Risk Resilience Relationship
The purpose of this task is to define and measure resilience in practical terms, and to examine the relationship between risk and resilience in the homeland security context, with potential value for policy makers and planners. The results presented in this report do not necessarily reflect official DHS opinion or policy.

HOMELAND
SECURITY
STUDIES AND
ANALYSIS
INSTITUTE
RISK AND RESILIENCE:
EXPLORING THE RELATIONSHIP
22 November 2010
Prepared for Department of Homeland Security Directorate of Science and Technology
Jerome Kahan Task lead
Andrew Allen
Justin George
Jonathan Solomon
Will Frankenstein
Mark Hanson
Division Manager
Robert Tuohy
Deputy Director

Risk and Resilience: Exploring the Relationship
ii
ACKNOWLEDGEMENTS
The task team wishes to acknowledge the contributions of Allan Kaku, who interned at HSI during the summer of 2010.
For information about this publication or other HSI research, contact
HOMELAND SECURITY STUDIES AND ANALYSIS INSTITUTE
Analytic Services Incorporated
2900 S. Quincy Street
Arlington, VA 22206
Tel (703) 416-3550 • Fax (703) 416-3530
www.homelandsecurity.org
Publication Number: RP10-01.03.06-01

Risk and Resilience: Exploring the Relationship
iii
Table of Contents
Executive Summary .........................................................................................................................1 Overview ..........................................................................................................................................3
Setting the Stage…………………………………………………………………………………...3
Research and Analytic Approach…………….……………………………………………………5
The Meaning of Resilience…………………………..…………………………………………….7
Measuring Resilience……………………………………………………………………………..11
Qualitative Risk-Resilience Relationships………………………………………………………..14
Quantitative Risk-Resilience Relationships………………………………………………………19
Overall Conclusions and Recommendations……………………………………………………..29
Appendix A The Meaning of Resilience ................................................................................... A-1 Appendix B Measuring Resilience ..............................................................................................B-1 Appendix C Qualitative Risk-Resilience Relationships ..............................................................C-1 Appendix D Quantitative Risk-Resilience Relationships ........................................................... D-1 Bibliography

Risk and Resilience: Exploring the Relationship
iv
Risk and Resilience: Exploring the Relationship
1
Executive Summary
The purpose of this task is to explore the potential relationship between risk and resilience – two key homeland security concepts that drive major policy and operational decisions. Our aim is to conduct a preliminary analysis of this issue that can yield potential practical benefits for DHS and a wide array of homeland security stakeholders.
The Problem
Homeland security risk analysis has been a central element of policy and planning to make the nation safer. However, in both government and non-government realms, the concept of resilience has steadily emerged as another key element of homeland security. Yet risk and resilience tend to be treated as independent elements of homeland security with little if any linkages between them.
This task questions the absence of alignment between risk and resilience and seeks to discover whether, and how, the two concepts are related. By describing any such relationships, this task can help DHS formulate policies and implement programs that integrate risk and resilience. This can result in more consistent and effective solutions to homeland security problems, with prospective benefits for all stakeholders.
The Approach
The underlying premise of this HSI effort is that there is an important relationship between risk and resilience. Our analytic efforts are designed to test this hypothesis, understand the nature of the relationship between these concepts, and identify the potential utility of these findings to homeland security policy makers and planners.
We developed four research questions – the first two address the need to better understand resilience and the second two deal with the relationship between risk and resilience: (1) What is the meaning of resilience? (2) How can resilience be measured? (3) How are risk and resilience related qualitatively? (4) Can risk and resilience be quantitatively related?
The Results
We produced a set of consolidated definitions for resilience. For each definition, we identified measures that are appropriate for systems and situations in four domains of interest: infrastructure, organizations, communities, and ecosystems. These pairs of definitions and measures can facilitate efforts by a variety of users to incorporate resilience into a range of systems in different domains facing a spectrum of threats, hazards, and other disruptions.
We derived a set of 11 features of resilience that apply to a broad range of systems across the four domains. We offered examples of ways and means (i.e., procedures and programs) to incorporate these features into a designated system to improve its resilience against anticipated challenges. These features, and the examples of how to incorporate them, may help planners and designers take practical steps to build resilience into new systems or retrofit resilience into existing systems if necessary.
Risk and Resilience: Exploring the Relationship
2
We created a simple resilience model, with measures and metrics, which generates a resilience profile that visually characterizes a given system’s performance against a specified adverse event. This model can help users, designers, and planners assess the level and types of resilience in existing systems and find solutions for improving resilience that best meet their needs and resource limitations.
We constructed a risk-resilience matrix that shows correlations between the risk variables of threat, vulnerability, and consequences and each of the identified resilience features. These interrelations can help system designers, planners, and policy makers see how the risks faced by a system are connected to the resilience of that system and how resilience initiatives impact those risks.
We formulated a proof of concept method for quantitatively relating risk and resilience. This method produced a conceptual – but nonetheless plausible – graph portraying a largely inverse relationship between these concepts. A fully validated graph along these lines could show system planners regions where cost-effective payoffs in risk reduction can be achieved through incremental improvements in resilience, and vice versa.
We concluded that the relationship between risk and resilience could be taken one step further by forging their respective policies, precepts, and programs into an integrated homeland security strategy. Such a strategy could exploit the synergies between risk and resilience while preserving their unique elements and fundamental purposes. An integrated strategy can assist policy makers in assuring that risk and resilience initiatives are mutually reinforcing, with the potential for greater overall impact across the enterprise.
The Way Ahead
The results of our analysis, applied and adapted as necessary, can help DHS officials and other stakeholders solve homeland security problems on the policy, planning, and operational levels. The full potential of these results will be realized through additional research and more comprehensive analytic methods to better address unresolved issues.
Risk and Resilience: Exploring the Relationship
3
Risk and Resilience: Overview The purpose of this task is to discover and demonstrate the relationship between risk and resilience. Our analytic efforts are designed to determine if there is such a relationship and to understand its nature and dynamics. Our aim is to conduct analyses that can yield potential practical benefits for DHS and other homeland security planners, policy makers, and operators. We also aim to identify directions for further research, as this is only a preliminary and limited effort.1 Setting the Stage Risk analysis has been the centerpiece of homeland security planning for many years. More recently, resilience has emerged as another driving principle of homeland security. Resilience has found its way into administration policy documents and been the subject of numerous congressional hearings. In academia, a rapidly evolving community of interest on the subject of resilience has been established within the United States and overseas.
Yet in both governmental and non-governmental circles, risk and resilience tend to be treated as independent concepts, with virtually no linkage between them. This task investigates the alignment between these two key homeland security concepts and seeks to develop insights into their relationship.
Risk and Homeland Security
Risk can be broadly defined as “the potential for an unwanted outcome resulting from an incident, event, or occurrence as determined by its likelihood and the associated consequences.”2 Risk assessment methods and risk management principles are relatively well understood within DHS and across the homeland security enterprise. Given the wide variety of problems to be addressed, however, stakeholders may employ different techniques for conducting risk analysis applied to their needs and circumstances.
An integrated risk management initiative is underway within the Department to form a more unified approach to risk assessment and management across DHS and the homeland security enterprise, while recognizing the need for different approaches in specific circumstances. Among the results of this initiative will be a DHS Directive for Integrative Risk Management, related governance documents, and an updated 2010 DHS Risk Lexicon (already been issued).3
1 HSI Core funded tasks, such as this effort, are limited in resources and level of effort and approved by our Executive Agent in DHS/S&T to investigate significant homeland security issues needing analytic attention. 2 U.S Department of Homeland Security. DHS Risk Lexicon. Washington, DC, September 2010, 2. 3 Bob Kolasky, “A Report on Integrated Risk Management from DHS’s Office of Risk Management and Analysis,” The Risk Communicator (monthly newsletter of the Security Analysis and Risk Management Association), September, 2010.

Risk and Resilience: Exploring the Relationship
4
Our analysis assesses risk as the product of threat, vulnerability, and consequences.4 This risk construct is used in appropriate contexts within DHS and by the wider group of homeland security stakeholders.
Thus, risk analysis has developed into a fairly mature discipline, although some lingering issues need to be resolved, such as dealing with uncertainties and incomplete data.
Resilience and Homeland Security
Researchers have articulated many reasons why resilience should be a central homeland security concept. These include:
The current “paradigm of protection” is unrealistic: since we cannot deter or prevent all threats and hazards, we should shift to resiliency.5
A more resilient target is less susceptible to disruption, can recover more quickly from adverse events, and tends to be less attractive to terrorist attack.6
Resilience will be a “competitive differentiator for companies and countries alike, [as] advancing resilience almost always provides a positive return on a relatively smaller investment.”7
At the governmental level, President Obama has explained that a resilient nation is “one in which individuals, communities, and our economy can adapt to changing conditions as well as withstand and rapidly recover from disruption due to emergencies.”8 The Quadrennial Homeland Security Review highlights the need for resilience – calling for “fostering individual, community, and system robustness, adaptability and capacity for rapid recovery” from natural disasters or terrorist attacks, and incorporating resilience into one of its five missions.9 The Secretary of Homeland Security recently spoke about the need to foster greater resilience “by taking important steps to help our state and local partners strengthen the resilience of their
4 DHS Risk Lexicon, 27, presents this formula as well as a more complex approach. 5 James J. Carafano, “Risk and Resiliency: Developing the Right Homeland Security Public Policies for the Post-Bush Era,” testimony before the Sub- committee on Transportation Security and Infrastructure Protection, Committee on Homeland Security, United States House of Representatives, June 24, 2008. 6 These issues are discussed in John. A. McCarthy, “Introduction: From Protection to Resilience: Injecting ‘Moxie’ into the Infrastructure Security Continuum,” in George Mason University School of Law: “Critical thinking: Moving from Infrastructure Protection to Infrastructure Resilience,” CIP Program Discussion Paper Series, February 2007, 1-7; and also in Stephen Flynn, The Edge of Disaster: Building a Disaster Resilient Nation (NewYork: Random House, 2007), 154. 7 Stephen Flynn, “America the Resilient,” Foreign Affairs (Mar/Apr 2008, Volume 87, Issue 2), 7, quoting from a June 2007 Report by the Council on Competiveness. 8 President Barak Obama, A Proclamation: National Preparedness Month, 2009, Office of the Press Secretary. September 4, 2009. 9 U.S. Department of Homeland Security, Quadrennial Homeland Security Review Report (Washington: February 2010), 15, 61.

Risk and Resilience: Exploring the Relationship
5
infrastructure, computer networks, and of their communities and citizens”…and by launching a series of resilience initiatives.” 10
The concept of resilience in the homeland security context has received considerable attention and the basic idea seems relatively straightforward. However, closer scrutiny reveals that this issue is inherently complex. There are many interrelated elements of resilience as well as disagreements on how to define, interpret, and implement the concept. Moreover, potentially significant issues may yet be identified.
In short, while homeland security risk is relatively well understood with wide areas of agreement, the concept of resilience is less developed and contains considerable areas of disagreement, ambiguities, and unanswered questions.
Why Explore the Relationship?
Discovering and demonstrating the relationship between risk and resilience can help DHS formulate policies and implement programs that better integrate these two central concepts. Doing so could lead to more consistent and effective solutions to homeland security problems. Beyond its potential value to DHS, a clear and credible relationship between risk and resilience can yield practical benefits for a wide range of homeland security policy makers, planners, and other stakeholders. Risk assessments may be able to define the resources required to achieve necessary levels of resilience. Conversely, resilience policies and programs may provide a framework of specific goals for risk reduction.
Research and Analytic Approach Apart from the inherent complexities of analyzing risk and resilience, the imbalance in the degree of analytic maturity for resilience further complicates any analysis of these two concepts. Thus, the team sought to clarify the concept of resilience prior to investigating how it might relate to risk.
To this end, the team formulated four research questions, the first two seeking to clarify important resilience issues, and the second two addressing the relationship between risk and resilience: (1) What is the meaning of resilience? (2) How can resilience be measured? (3) How are risk and resilience related qualitatively? (4) Can risk and resilience be quantitatively related?
Resilience Domains
Resilience plays a role in a diverse variety of contexts, covering such fields as economics, public policy, individual and group psychology, systems engineering, urban planning, ecology, and private businesses. A simple taxonomy is needed that arranges the issue of resilience under a few major domains.11
10 Janet Napolitano, “Rebuilding the Foundation for America’s Hometown Security,” New York City Emergency Operations Center, September 10, 2010 (remarks as prepared) http://www.dhs.gov/ynews/speeches/sp_1284133372649.shtm.
11 We found sources that addressed this issue, but none were fully suited to the scope and needs of this task. See the TOSE framework developed by MCEER, University at Buffalo, October 2006.

Risk and Resilience: Exploring the Relationship
6
Accordingly, the team developed four homeland security resilience domains to provide contextual structure: infrastructure, organizations, communities, and ecosystems. These domains are not mutually exclusive, as many dimensions of resilience overlap.12 Figure 1 illustrates our domain construct.
Figure 1. Resilience Domains
An elaboration of each domain follows:
Infrastructure: This domain encompasses engineered assets, systems, and networks, whether physical or cyber, as well as systems of systems with interconnected nodes (e.g., telecommunications or power systems). It is generally associated with the 18 critical infrastructure/key resource sectors outlined in the 2009 National Infrastructure Protection Plan.13 Infrastructure systems depend upon publicly or privately controlled, resources, which may be either natural or man-made.
Organizations: This domain includes private businesses, corporations, and enterprises as well as government departments and agencies and non-governmental organizations. These entities typically include functional subcomponents whose activities are focused on a discrete set of objectives, such as economic productivity, governance, or public service. Associated supply chains in both private sector and government arenas are included.
12 For example, businesses and physical assets are typically associated with the institutions and infrastructure domains, respectively. However, both may also reside within the community domain. 13 National Infrastructure Protection Plan 2009, U.S. Department of Homeland Security, preface, 8.

Risk and Resilience: Exploring the Relationship
7
Communities: This domain spans all aspects of society within a delineated community, such as a city with neighborhoods, larger municipalities, or smaller jurisdictions. It can include private individuals, families, community groups and organizations, businesses, and various buildings and facilities located within the purview of the broader community. It also includes “social capital,” that is, a sense of interconnectedness among individuals and groups of individuals within communities.14
Ecosystems: This domain covers living organisms, their physical environment, and their interrelationships in a particular location or area. Constituents of such natural ecosystems can include minerals, climate, soil, water, sunlight, plants, trees, and all other nonliving elements, as well as living members, from insects, to fish, to large animals. While of less obvious interest to the homeland community enterprise than other domains, ecosystems can be part of a broad interpretation of homeland security. Their viability can impact the safety and well-being of the nation in terms of affecting the food and fuel supply, preserving the environment, and even shaping our overall quality of life.
Sources and Entries
The team systematically searched for unclassified government and non-government sources to establish a database of documents that address resilience. We created a resilience research “entry” for those sources that addressed at least the first of our research questions: how to define resilience. Some sources satisfied this criterion and also offered ideas on how to measure resilience or discussed its relation to risk. Any such data was also included in the initial entry for these sources.
Each resilience entry was assigned to one or more domains. The team made this determination using an entry’s definition of resilience as a primary factor, with associated measures or risk relationships as secondary factors. In some instances, a single definition straddled multiple domains. The resultant database provides the research foundation for the analyses of each of the research questions. The following four sections deal with each of these analytic streams.
The Meaning of Resilience Defining resilience is a necessary first step to turn the concept into actions. To this end, the team developed a framework that offers a small number of basic resilience definitions with the potential to meet the needs of a wide spectrum of stakeholders. Users may select the most suitable definitions for their domain(s). Each definition can be scaled and tailored to meet the resilience objectives of the particular system and situation at hand.
Key Discriminators
Our research discovered over 119 different definitions for resilience, which were summarized in our set of entries. Such a large number of diverse definitions do not offer a practical basis for analysis. To address this problem, we developed a method for grouping this array of definitions into a small number of consolidated resilience definitions relevant to each of the four domains.
14 Cutter, et al, “Disaster Resilience Indicators for Benchmarking Baseline Conditions,” Journal of Homeland Security and Emergency Management (2010: Volume 7, Issue 1, Article 51), 6-9.
Risk and Resilience: Exploring the Relationship
8
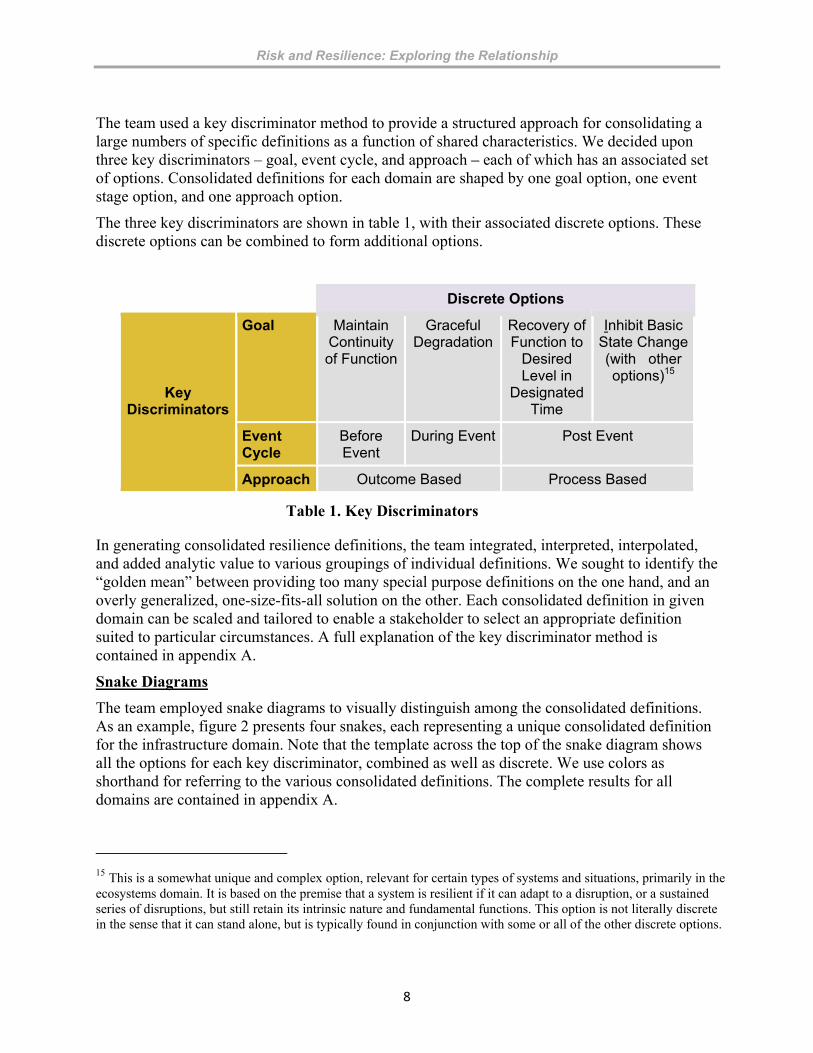
The team used a key discriminator method to provide a structured approach for consolidating a large numbers of specific definitions as a function of shared characteristics. We decided upon three key discriminators – goal, event cycle, and approach – each of which has an associated set of options. Consolidated definitions for each domain are shaped by one goal option, one event stage option, and one approach option.
The three key discriminators are shown in table 1, with their associated discrete options. These discrete options can be combined to form additional options.
Discrete Options
Key Discriminators
Goal Maintain Continuity of Function
Graceful Degradation
Recovery of Function to
Desired Level in
Designated Time
Inhibit Basic State Change (with other options)15
Event Cycle
Before Event
During Event Post Event
Approach Outcome Based Process Based
Table 1. Key Discriminators
In generating consolidated resilience definitions, the team integrated, interpreted, interpolated, and added analytic value to various groupings of individual definitions. We sought to identify the “golden mean” between providing too many special purpose definitions on the one hand, and an overly generalized, one-size-fits-all solution on the other. Each consolidated definition in given domain can be scaled and tailored to enable a stakeholder to select an appropriate definition suited to particular circumstances. A full explanation of the key discriminator method is contained in appendix A.
Snake Diagrams
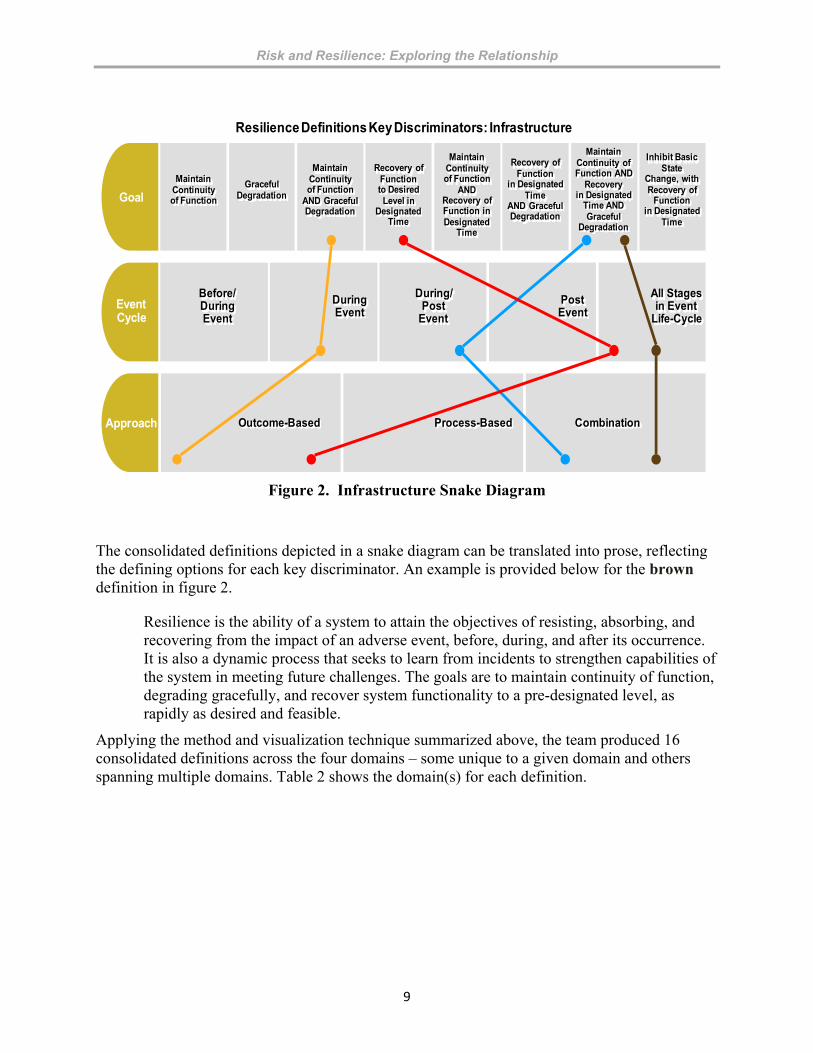
The team employed snake diagrams to visually distinguish among the consolidated definitions. As an example, figure 2 presents four snakes, each representing a unique consolidated definition for the infrastructure domain. Note that the template across the top of the snake diagram shows all the options for each key discriminator, combined as well as discrete. We use colors as shorthand for referring to the various consolidated definitions. The complete results for all domains are contained in appendix A.
15 This is a somewhat unique and complex option, relevant for certain types of systems and situations, primarily in the ecosystems domain. It is based on the premise that a system is resilient if it can adapt to a disruption, or a sustained series of disruptions, but still retain its intrinsic nature and fundamental functions. This option is not literally discrete in the sense that it can stand alone, but is typically found in conjunction with some or all of the other discrete options.
Risk and Resilience: Exploring the Relationship
9
Resilience Definitions Key Discriminators: Infrastructure
EventCycle
Before/DuringEvent
DuringEvent
During/Post
Event
PostEvent
All Stagesin Event
Life-Cycle
Goal
Approach Process-Based CombinationOutcome-Based
Maintain Continuity of Function AND
Recovery in Designated
Time AND Graceful
Degradation
Inhibit Basic State
Change, with Recovery of
Functionin Designated
Time
Maintain Continuityof Function
Recovery of Functionto Desired Level in
Designated Time
GracefulDegradation
Maintain Continuityof Function
AND GracefulDegradation
Recovery of Function
in Designated Time
AND GracefulDegradation
Maintain Continuityof Function
ANDRecovery of Function in Designated
Time
Figure 2. Infrastructure Snake Diagram
The consolidated definitions depicted in a snake diagram can be translated into prose, reflecting the defining options for each key discriminator. An example is provided below for the brown definition in figure 2.
Resilience is the ability of a system to attain the objectives of resisting, absorbing, and recovering from the impact of an adverse event, before, during, and after its occurrence. It is also a dynamic process that seeks to learn from incidents to strengthen capabilities of the system in meeting future challenges. The goals are to maintain continuity of function, degrading gracefully, and recover system functionality to a pre-designated level, as rapidly as desired and feasible.
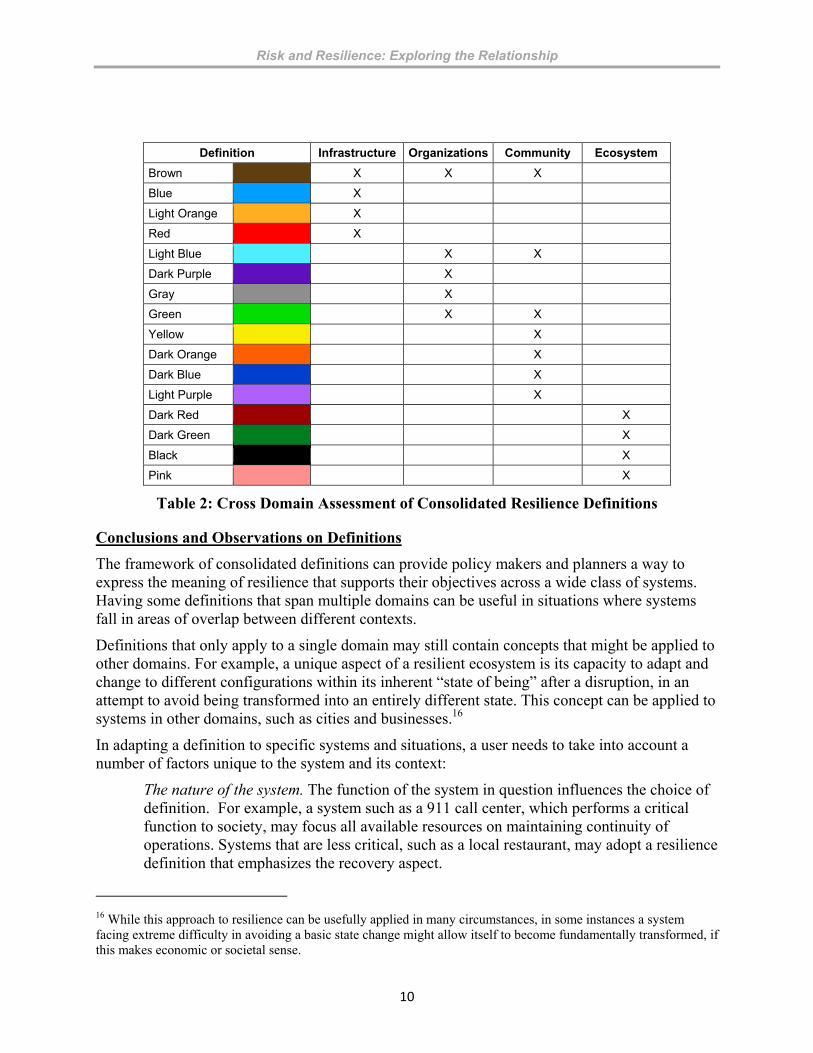
Applying the method and visualization technique summarized above, the team produced 16 consolidated definitions across the four domains – some unique to a given domain and others spanning multiple domains. Table 2 shows the domain(s) for each definition.
Risk and Resilience: Exploring the Relationship
10
Definition Infrastructure Organizations Community Ecosystem
Brown X X X
Blue X
Light Orange X
Red X
Light Blue X X
Dark Purple X
Gray X
Green X X
Yellow X
Dark Orange X
Dark Blue X
Light Purple X
Dark Red X
Dark Green X
Black X
Pink X
Table 2: Cross Domain Assessment of Consolidated Resilience Definitions
Conclusions and Observations on Definitions
The framework of consolidated definitions can provide policy makers and planners a way to express the meaning of resilience that supports their objectives across a wide class of systems. Having some definitions that span multiple domains can be useful in situations where systems fall in areas of overlap between different contexts.
Definitions that only apply to a single domain may still contain concepts that might be applied to other domains. For example, a unique aspect of a resilient ecosystem is its capacity to adapt and change to different configurations within its inherent “state of being” after a disruption, in an attempt to avoid being transformed into an entirely different state. This concept can be applied to systems in other domains, such as cities and businesses.16
In adapting a definition to specific systems and situations, a user needs to take into account a number of factors unique to the system and its context:
The nature of the system. The function of the system in question influences the choice of definition. For example, a system such as a 911 call center, which performs a critical function to society, may focus all available resources on maintaining continuity of operations. Systems that are less critical, such as a local restaurant, may adopt a resilience definition that emphasizes the recovery aspect.
16 While this approach to resilience can be usefully applied in many circumstances, in some instances a system facing extreme difficulty in avoiding a basic state change might allow itself to become fundamentally transformed, if this makes economic or societal sense.

Risk and Resilience: Exploring the Relationship
11
The particular threat of concern. Specific threats bear significant weight in determining an appropriate resilience definition for a system. For example, definitions that emphasize pre-event resistance activities are more likely to be suited for made-made threats, since little if anything can be done to actively resist a natural hazard.
The resource constraints. Available resources play a prominent role in determining a suitable resilience definition. Definitions that include achieving a higher number of goals may be ideal for a given system, but they may not be practical. Resilience planners need to take this into consideration.
During the course of our research and development of the consolidated definitions, we discovered a number of insights and observations about the meaning of resilience. These are offered in appendix A – as useful contextual and interpretive material for stakeholders planning to utilize the consolidated definitions, as well as to researchers in the field who wish to investigate further.
Measuring Resilience Making the definition of resilience meaningful requires understanding how to measure resilience. The question of how resilience can be measured, including associated metrics, has been addressed by a relatively large number of sources. As with the definitions of resilience, the team found a lack of agreement on this issue. Given this situation, our objective was to develop a relatively small set of synthesized measures that could be paired with the set of consolidated resilience definitions. These measures, as their paired definitions, would be scalable and applicable to broad classes of systems within a given domain. Development of Synthesized Resilience Measures
Of the research entries discussed earlier, slightly over half provided information on resilience measures. Many of these entries offered more than one resilience measure, resulting in over 340 separate resilience measures. We filtered each of these measures through a set of relevance and utility criteria. This allowed us to distill the measures into a small group that could be potentially associated with the set of definitions. In addition to their analytically useful and mature levels, we sought to identify measures that could be applied to the four discrete goal options, discussed in table 1 above, that are essential elements of all the consolidated definitions: maintain continuity of function; graceful degradation; recovery to desired level in designated time; and inhibit state change.17
Over 60 measures met these criteria, from which the team produced 21 domain-specific and goal- related synthesized measures. As was done for developing consolidated definitions, the team sought to add analytic value to the groupings of individual measures in producing the final set of synthesized measures for each domain. Appendix B outlines the process used in generating these outputs.
The full list of synthesized resilience measures is presented in annex 1 to appendix B. Two samples are presented below – for different combinations of domains and goals – each providing
17 Event cycle and approach options, by their very nature, are not meaningfully measurable for characterizing resilience and are not addressed by the sources offering ideas on resilience measures.
Risk and Resilience: Exploring the Relationship
12
a different example of how the measure could be applied, together with suggested metrics to fit the situation.
Infrastructure – Maintain Continuity of Function: Availability, in terms of readiness for usage, is a measure of the resilience of a system in this domain. How long a system must perform and at what level depends on the nature of the system and its specific objectives. For example, it might be the case that a desalination plant must be capable of supplying fresh water for 20 hours in a 24 hour period to be resilient in the face of a disruption.
Communities – Recovery of Function to Desired Level in Designated Time: A measure of resilience in this domain is the ability of a system – an entire community or elements such as individuals, families, organizations, and neighborhoods – to recover essential functions to a predetermined level of performance within a predetermined time. For example, a local volunteer service organization that provides low-cost meals to the homeless has the objective of supplying between 200 and 500 meals a day. Mortality in the local homeless population will begin to spike if delivery falls below 200 meals for more than 7 days. The organization would be resilient if it allowed no more than five days of meal service disruption, even in the event of a major disaster.
Alignment of Resilience Measures with Consolidated Definitions
In this analytic phase, we aligned the synthesized measures with the consolidated resilience definitions. This was done for each domain by linking all measures to the definitions by their goal options. More than one measure was capable of being aligned with the same goal option in a given domain. Due to the fact that measures are domain specific, a definition spanning more than one domain may not be aligned with the same set of measures in each domain.
Each measure for a definitional goal is supported by a different practical example, with associated metrics. Measures of resilience are relatively generalizable and may align with a variety of definitions within and across domains. In contrast, the metrics associated with those measures are closely tied to the specific system and the situation (e.g., the desalination and low-cost meal examples above). If measures for given resilience definition are to be applied to other systems and situations, tailored metrics would need to be developed.
The complete results of pairing consolidated resilience definitions and synthesized resilience measures – with examples of applications that include suggested metrics – are presented in annex 2 of appendix B. Each table contains a consolidated definition from a specified domain (identified by the color of its snake and presented in prose), one or more associated synthesized measures for each of the goals contained in that definition, and practical examples.
A sample of the material in annex 2 of appendix B is found in Table 3. Here we see a definition for a system in the infrastructure domain that focuses only on goal option 3 – recovery of function to desired level in designated time. This definition is paired with two corresponding measures and specified metrics: the first provides an example of measuring the resilience of a computer network; and the second offers an example of measuring the resilience of a land-line telephone service provider.

Risk and Resilience: Exploring the Relationship
13
Domain
Consolidated Definition “Snake”
Color
Consolidated Definition
Measurable Element of Resilience Definition
(Goal Option)
Corresponding Synthesized Measures
Infrastructure RED Resilience is the ability of a system to attain the objective of recovering from the impact of an adverse event, after its occurrence. The goal is to recover degraded system functionality to a pre-designated level, as rapidly as desired and feasible.
Goal Option: Recovery of Function to Desired Level in Designated Time
Resilience is measured according to the time required for a system to return to a pre-disturbance level of operation. Example: A computer network supporting a financial institution must process at least 20 million transactions per day to avoid disruption. Any event that disrupts the system‘s operations must be resolved within six hours. Resilience can be measured according to a system's mean Time To Repair (MTTR). Standard of repair is pre-established and represents normal level of function. This is essentially a binary measure. The system is either functioning at its standard level or it is non-functioning. Example: A land line telephone service provider provides communications services to a large community. Provider is contractually obligated to remedy all service disruptions within 6 hours The mean time required to repair the provider's telephone switching station, given a breakdown, cannot exceed 6 hours
Table 3. Infrastructure Domain Resilience Definition and Measure Pairing
Conclusions and Observations on Measures
Our framework provides a set of synthesized measures aligned with consolidated definitions for use by a spectrum of stakeholders. These pairs of definitions and measures can be scaled and tailored to reflect such operationally specific factors as the nature of the particular system of interest; the overall strategic context; the anticipated disrupting threats or hazards; and the policies, priorities, and resources of the planner, designer, or user. Specific findings include:
Most consolidated definition can be paired with synthesized measures that address each of the definition’s goal options for a given domain. We were not able to develop measures for two goal options in the ecosystems domain – graceful degradation and recovery to designated level of function in desired time. Nor could we develop measures
Risk and Resilience: Exploring the Relationship
14
for the goal of inhibit basic state change in the organizations domain. Further research and analysis can fill these gaps.
While the synthesized measures presented are relatively comprehensive and readily generalizable, the metrics for these measures tend to be uniquely connected to highly-specific systems and situations across different domains. For every set of measures, a stakeholder will need to develop metrics that suit the system and domain in question. Establishing guidelines for such metrics would be valuable.
Across all goals and domains, quantitative measures are the most prevalent. We found far fewer qualitative measures, and those we found varied widely in their level of sophistication. More rigorously qualitative measurement approaches may be a useful first step in addressing systems that may not be very well characterized. Quantitative measurements may follow, when the system’s performance is better understood.
Qualitative Risk-Resilience Relationships Given that our understanding of risk in homeland security is relatively mature, resilience can only be linked to risk once we know what it is and how it can be measured. Thus, our work in defining and measuring resilience – summarized above and detailed in appendices A and B – provides the groundwork for a qualitative analysis of how risk and resilience are related.
The Risk-Resilience Matrix
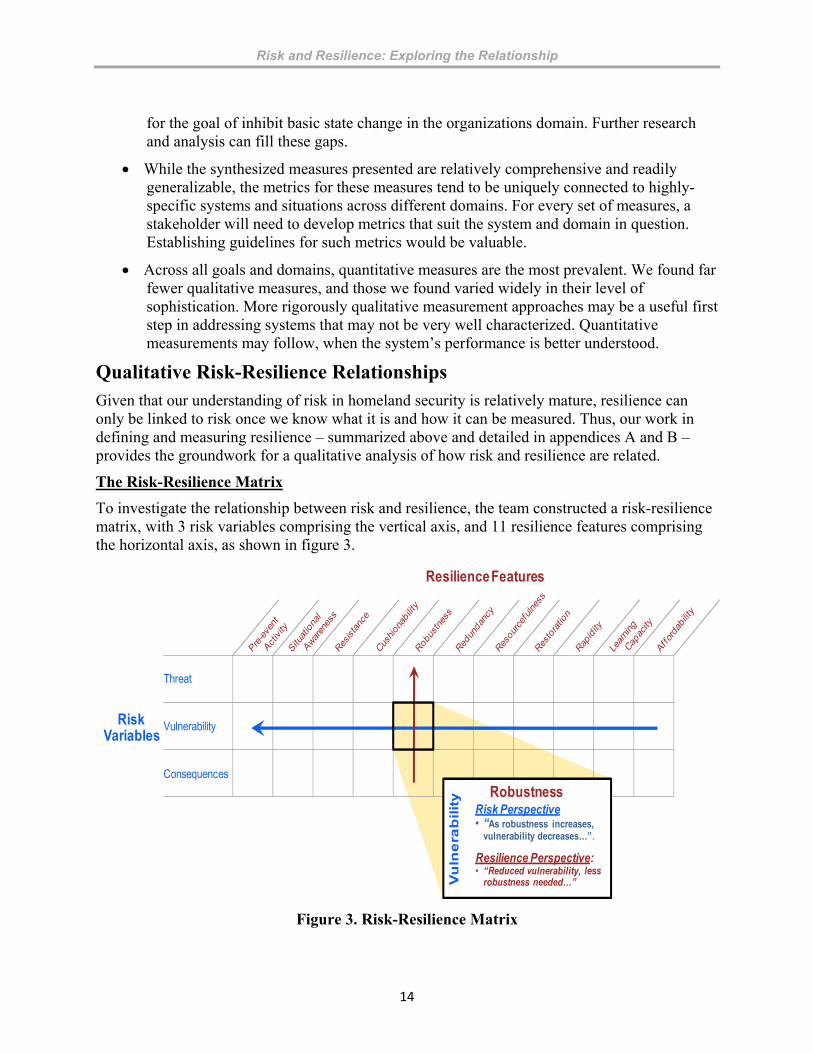
To investigate the relationship between risk and resilience, the team constructed a risk-resilience matrix, with 3 risk variables comprising the vertical axis, and 11 resilience features comprising the horizontal axis, as shown in figure 3.
Resilience Features
RiskVariables
Threat
Vulnerability
Consequences
Vu
lne
rab
ilit
y Robustness
Resilience Perspective: • “Reduced vulnerability, less
robustness needed…”
Risk Perspective • “As robustness increases,
vulnerability decreases…”.
Figure 3. Risk-Resilience Matrix
Risk and Resilience: Exploring the Relationship
15
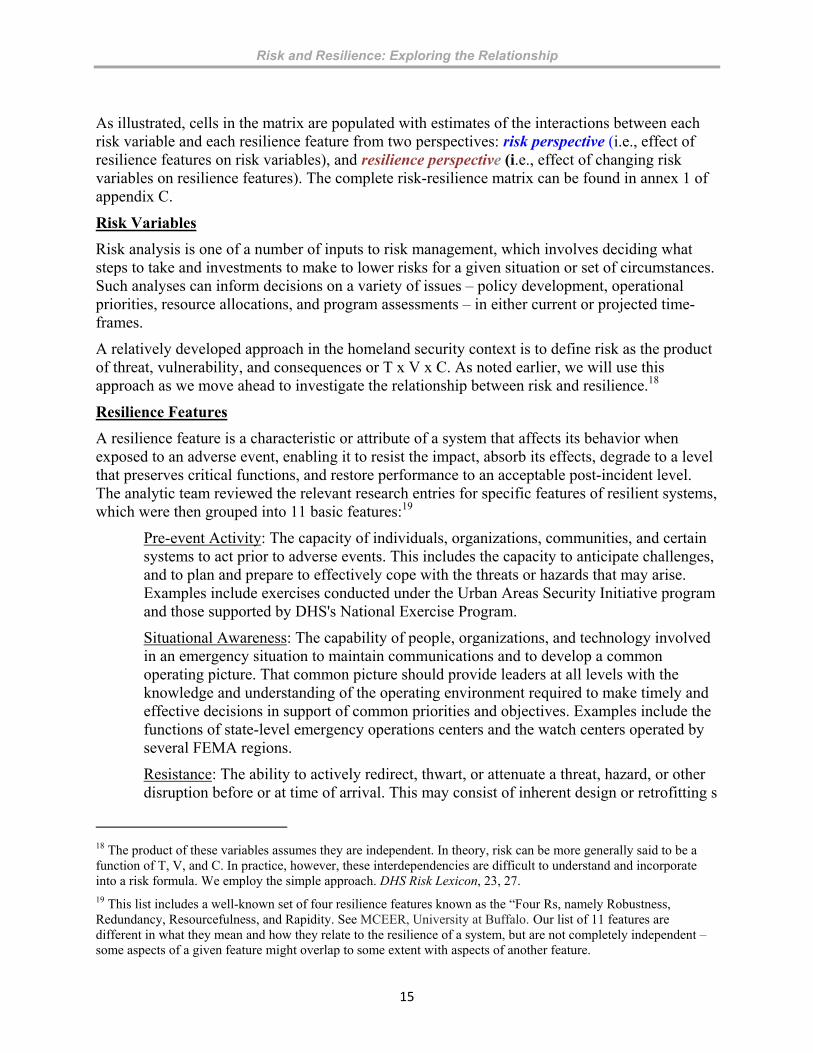
As illustrated, cells in the matrix are populated with estimates of the interactions between each risk variable and each resilience feature from two perspectives: risk perspective (i.e., effect of resilience features on risk variables), and resilience perspective (i.e., effect of changing risk variables on resilience features). The complete risk-resilience matrix can be found in annex 1 of appendix C.
Risk Variables
Risk analysis is one of a number of inputs to risk management, which involves deciding what steps to take and investments to make to lower risks for a given situation or set of circumstances. Such analyses can inform decisions on a variety of issues – policy development, operational priorities, resource allocations, and program assessments – in either current or projected time-frames.
A relatively developed approach in the homeland security context is to define risk as the product of threat, vulnerability, and consequences or T x V x C. As noted earlier, we will use this approach as we move ahead to investigate the relationship between risk and resilience.18
Resilience Features
A resilience feature is a characteristic or attribute of a system that affects its behavior when exposed to an adverse event, enabling it to resist the impact, absorb its effects, degrade to a level that preserves critical functions, and restore performance to an acceptable post-incident level. The analytic team reviewed the relevant research entries for specific features of resilient systems, which were then grouped into 11 basic features:19
Pre-event Activity: The capacity of individuals, organizations, communities, and certain systems to act prior to adverse events. This includes the capacity to anticipate challenges, and to plan and prepare to effectively cope with the threats or hazards that may arise. Examples include exercises conducted under the Urban Areas Security Initiative program and those supported by DHS's National Exercise Program.
Situational Awareness: The capability of people, organizations, and technology involved in an emergency situation to maintain communications and to develop a common operating picture. That common picture should provide leaders at all levels with the knowledge and understanding of the operating environment required to make timely and effective decisions in support of common priorities and objectives. Examples include the functions of state-level emergency operations centers and the watch centers operated by several FEMA regions.
Resistance: The ability to actively redirect, thwart, or attenuate a threat, hazard, or other disruption before or at time of arrival. This may consist of inherent design or retrofitting s
18 The product of these variables assumes they are independent. In theory, risk can be more generally said to be a function of T, V, and C. In practice, however, these interdependencies are difficult to understand and incorporate into a risk formula. We employ the simple approach. DHS Risk Lexicon, 23, 27. 19 This list includes a well-known set of four resilience features known as the “Four Rs, namely Robustness, Redundancy, Resourcefulness, and Rapidity. See MCEER, University at Buffalo. Our list of 11 features are different in what they mean and how they relate to the resilience of a system, but are not completely independent – some aspects of a given feature might overlap to some extent with aspects of another feature.
Risk and Resilience: Exploring the Relationship
16
as well as active and/or passive countermeasures. An example is the use of a firebreak to direct wild fires away from homes and businesses.
Cushionability: A system’s ability to absorb a blow and degrade slowly in response to such an event (i.e., "bend not break"). Degradation would be halted (i.e., performance "bottoms-out") at the highest feasible and warranted level. Examples include the strict fault tolerance in computer systems or low damage tolerance in structural systems.
Robustness: The inherent strength or capability of a system to withstand internal or external stress and maintain critical functions. The system copes effectively with deviance in system inputs, tolerating function degradation above some specified threshold and seeking to avoid failure. An example includes a “smart” grid that keeps power flowing to all consumers through real time redistributions and re-routings in the event of a disruption.
Redundancy: The absence of complete dependence on any one subsystem critical to system performance. Redundancy focuses on alternate options and substitutions, and includes purposeful diversification and/or decentralization of critical assets or resources. An example is supply chain diversification, where multiple vendors are available to provide raw materials or resources.
Resourcefulness: The capability of individuals and groups to improvise and innovate during and after an adverse event. It includes flexibility and adaptability. An example is discovering that an impacted facility can function using different fuels or power sources, enabling it to function during recovery and increasing energy sourcing options in preparation for a future disaster where traditional energy sources may not be available.
Restoration: The capability of a system to reinitiate operations after experiencing an event, at a level of performance at, below, or possibly above pre-event level. How well a system restores its functioning depends on its needs, practical constraints, and the ability to learn while dealing with impact. An example is refitting and retooling a manufacturing facility to increase production in the wake of a natural disaster such as an earthquake.
Rapidity: The length of time required for a system to recover to certain levels of performance after experiencing an adverse event. An example is the speed with which certain finance sector business were able to re-establish limited and then full operations after suffering enormous damage during the 9-11 attacks.
Learning Capacity: The capability of systems, organizations, organizations, and communities to routinely apply lessons learned from previous events to improve future performance under adverse conditions. An example is the Gulf Coast petrochemical industry’s adoption of standard operating procedures for preparing land-based refinery facilities to withstand tropical storms and hurricanes.
Affordability: The fiscal feasibility and practicality of capabilities designed into systems that enable them to cope with adversity. Optimally, this reflects a judgment regarding the threshold level of cost, investment, or resource burden at which the effort to maintain a system’s functional continuity is no longer tenable. At this threshold, the system is either allowed to fail or be subject to a change of state. An example is the investment-banking
Risk and Resilience: Exploring the Relationship
17
businesses that were allowed to fail or directed to reorganize in the wake of the financial crisis of 2008-2009.
Not all resilience features are relevant to addressing all of the resilience needs of given system. A system owner, user, or designer has a choice of options in defining what kind of resilience a given system requires. Such stakeholders must select which features need to be built into a system – while accounting for practical issues such as resource constraints.20
Ways and Means for Resilience Features
The team identified ways and means for incorporating resilience features into systems. Features set resilience requirements, while ways and means translate these requirements into real policies and programs.21
There are two broad types of ways and means, often working in concert:
“Soft” (e.g. policies, standards, and processes that increase a system’s resilience); and
“Hard” (e.g. physical equipment and mechanisms to increase a system’s resilience).
Certain ways and means promote specific resilience features. If a system in a specified domain is to be made more resilient in the face of anticipated disruptions, the owner or user should identify the desired features and apply the appropriate ways and means. Practically speaking, planners and policy makers have recognized that it is significantly easier and more cost effective to build resilience features into a system during the initial system design and creation, rather than retrofit a system once it is up and running.
From the review of relevant sources, the team gathered examples of hundreds of ways and means, both soft and hard. We selected a subset of these and assembled them into a table, with the specific resilience features they tend to promote. While not exhaustive, the information in this table illustrates how each of the 11 resilience features might be embodied into an appropriate system for a given situation, with appropriate scaling and tailoring. The table can be found in annex 2 of appendix C.
Observations on the Relationship between Risk and Resilience
The risk-resilience matrix provides the foundation for three levels of qualitative analysis conducted by the team to illuminate how risk and resilience are related. The method and results from the first two levels of analysis – cell level and aggregated level – are in appendix C.
The third level led to the development of the following high level propositions on the relationship between risk and resilience: (1) risk and resilience at the policy level are inversely related; and (2) risk and resilience can assist each other in planning and operations.
20 In real applications, certain features would typically be given more weight than others in improving overall system resilience, but, for analytic purposes, we assume that all features are equally important. It is also worth noting that high levels of resilience may not be a necessary or appropriate characteristic for all systems in all situations. 21 See Kahan et al, "An Operational Framework for Resilience,”24-26, for a discussion of ways and means.

Risk and Resilience: Exploring the Relationship
18
Risk and Resilience for Policy
An inverse relationship between risk and resilience suggests that more resilient systems are less at risk when faced with a given threat, hazard, or disruption than systems with lower resilience. On the other hand, less resilient systems face greater risk from a specified adverse event than those with higher resilience capacity.22 From the opposite perspective, reduced risk faced by a system for a specific adverse event tends to raise the overall effectiveness of that system’s resilience. Conversely, increases in that risk can cause the existing level of resilience for a given system to drop in connection with the same adverse event,
Given these relationships, risk and resilience can together form a mutually supporting and integrated homeland security strategy. Promoting resilience can help achieve the fundamental goal of reducing and managing risk, while risk assessments can inform resilience policies.
The proposition that risk and resilience are inversely related is simple in theory, where all relevant factors are assumed to remain equal. In practice, however, all relevant factors do not always remain equal. Moreover, different systems embody resilience features to different degrees. These considerations lead to the following observations:
Certain additions of feature-specific ways and means for resilience may yield less than expected return on investment for risk reduction due to saturation or over-investment in certain features. In certain situations, this can prevent investments in resilience from yielding a meaningful reduction in risk. While risk and resilience will always be inversely related, investment in one does not always yield equal return on investment in the other.
Even when improving overall resilience reduces overall risk, this does not necessarily equally reduce the risk of every specific threat, hazard, or disruption facing a system. For example, although applying certain resilience ways and means may reduce a system’s risk against fires, these actions may not lower its risk against tornados.
Risk and Resilience in Planning
Risk and resilience both involve operationalized planning and allocation of resources. Risk-informed resource allocation seeks to lower risk in cost effective ways. Likewise, resilience ways and means seek to allocate resources that increase resilience in cost effective ways.
Resilience planning can provide a framework for risk reduction that can be applied to risk assessment and management. Operationalizing resilience for systems of interest can be a mechanism for mitigating the value of the three risk variables, thereby helping shape risk-informed decision making.
From the opposite perspective, risk assessments can inform operational planning for system resilience by providing an understanding of the likelihood and consequences of the dangers facing those assets. Risk assessments may also be able to serve resilience
22 Many experts have recognized this relationship in particular context. One such statement is: “resilience is an important strategy to help mitigate the multitude of risk facing owners and operators of critical infrastructure.” National Infrastructure Advisory Council. “Critical Infrastructure Resilience: Final Report and Recommendation” (September 8, 2009), 8. Another statement is: “communities lacking resilience are at high risk … when disaster strikes.” Keith Tidball and Marianne Krasny, “From risk to resilience: what role for community greening and civic ecology in cities” Social Learning: Toward a Sustainable World, Chapter 7, 149.

Risk and Resilience: Exploring the Relationship
19
planning by delineating the level of resources required to achieve specific resilience objectives for a given system against a specific threat.
Quantitative Risk-Resilience Relationships The previous section introduced qualitative ways of relating risk and resilience, offering systematic, heuristically-based, and traceable analysis and insights. A related question is whether there is a credible way to quantitatively analyze the relationship between risk and resilience. Quantification through mathematical methods and models can enable analysts to better see complex interactions and conduct sensitivity tests to determine the most significant factors influencing outcomes. These tools can also inform resource allocations, supporting the needs of planners and policy makers.
Resilience Model and Parameters
In addition to its utility in resilience policy making and planning, a resilience model is necessary for developing a quantitative relationship between risk and resilience. We developed a set of parameters that define our resilience model, with associated measures and metrics to assess and compare the resilience of different systems for different situations.
Figure 4 depicts the model, which we call a resilience profile. The model uses straight lines as a first-order approximation to the “bathtub” shape that describes a system’s behavior after being impacted. 23 This simplification offers a useable and relatively accurate construct. We investigated more precise and complex models, but concluded that these are less user-friendly without necessarily adding significant benefits.
Performance(Percent)
100
80
60
40
20
0
D R
B
A
Bt
C
Time
Resilience ParametersD = Disruption to System
R = Capability to attenuate or mitigate effect prior to the event
A = Capability to absorb and degrade
B = Bottom out; Threshold Level
Bt = Length of time at bottom
C = Capability to reconstitute back to initial level
t1 t2 t3
Figure 4. Resilience Profile
23 “Bathtub” curves of various kinds appear in many sources, including Yossi Sheffi, The Resilient Enterprise (Cambridge, MA: The MIT Press, 2005). p. 65; T. D. O’Rourke. “Critical Infrastructure, Interdependencies, and Resilience” The Bridge (Spring 2007). p. 25; Mary Ellen Hynes. “Extreme Loading of Physical Infrastructure” presentation at the 4th DHS University Network Summit; and the March 11, 2010; and the MCEER Brochure cited earlier. Kahan et al. "An Operational Framework for Resilience," offers the construct of a “resilience profile,” p.24.
Risk and Resilience: Exploring the Relationship
20
In our model, the profile of a system’s resilience – whether actual or desired – is established by the parameters D, R, A, B, Bt, and C. Parameters R, A, B, Bt, and C, are internal system characteristics, which a system user can affect.24 The parameter D, on the other hand, is the event that impacts a system and is therefore an external force that cannot be directly affected by the user.25 These parameters are discussed more fully in appendix D.
The critical points in a typical resilience profile occur at time t1, when degradation stops and bottoms out to a threshold level, t2, when reconstitution begins, and t3, when full system performance is regained. 26 The equations that form the model are in annex 1 to appendix D.
The model is taken to be normative and representative. However, it can be scaled, scoped, and tailored to meet the needs and responsibilities of various stakeholders and their particular circumstances. More specifically, the model can be used to reflect different kinds and levels of systems, the domain(s) in which these systems operate, and the disruptions impacting these systems.
A key issue is to establish values for the various system performance parameters. The external parameter, D, can be estimated as the net force that impacts the system, after accounting for the system’s ability to mitigate or attenuate the external disruption before impact – the internal parameter, R. The five internal parameters need to be estimated by assessing the current or desired resilience capabilities of relevant system features and associated ways and means. These estimates influence the character of the straight lines that define the profile shown in figure 4. The correlations between the 11 resilience features and the 5 internal resilience parameters are shown in the parameters-features matrix at annex 2 to appendix D.
Proposed Measures and Metrics
Most sources we consulted did not offer measures that fully supported our resilience model. Thus, the team to developed two measures tailored to our needs: area and shape.
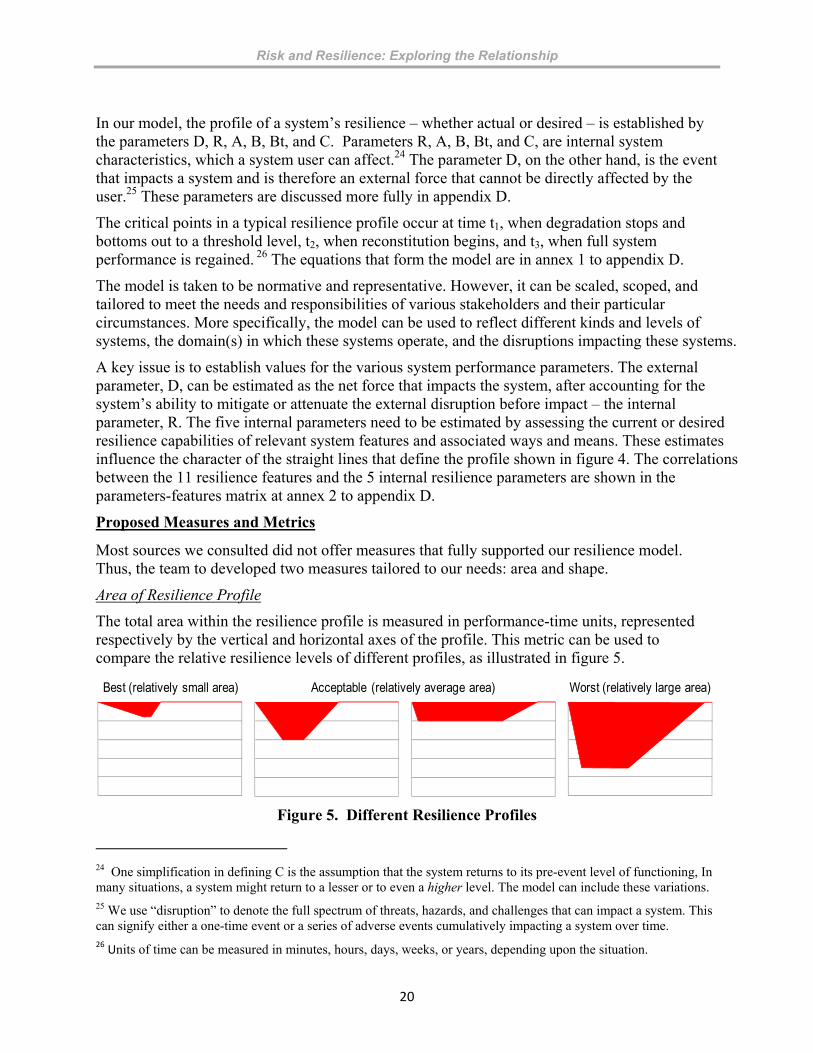
Area of Resilience Profile
The total area within the resilience profile is measured in performance-time units, represented respectively by the vertical and horizontal axes of the profile. This metric can be used to compare the relative resilience levels of different profiles, as illustrated in figure 5.
Best (relatively small area) Acceptable (relatively average area) Worst (relatively large area)
Figure 5. Different Resilience Profiles
24 One simplification in defining C is the assumption that the system returns to its pre-event level of functioning, In many situations, a system might return to a lesser or to even a higher level. The model can include these variations. 25 We use “disruption” to denote the full spectrum of threats, hazards, and challenges that can impact a system. This can signify either a one-time event or a series of adverse events cumulatively impacting a system over time. 26 Units of time can be measured in minutes, hours, days, weeks, or years, depending upon the situation.
Risk and Resilience: Exploring the Relationship
21
As shown in figure 5, the “worst” profile on the extreme right of this figure has the largest area, reflecting relatively low system resilience. The “best” profile on the extreme left has the smallest area, reflecting relatively high system resilience. The two middle profiles have the same area and reflect relatively average – or what might be generally acceptable – system resilience.
Area should not be the only factor in used to identity a resilience solution. For example, the two profiles with equal areas have very different shapes, each indicating a different type of system performance. This suggests that the area of a profile is a necessary, but not always a sufficient, indicator of preferred system resilience.
Shape of Resilience Profile
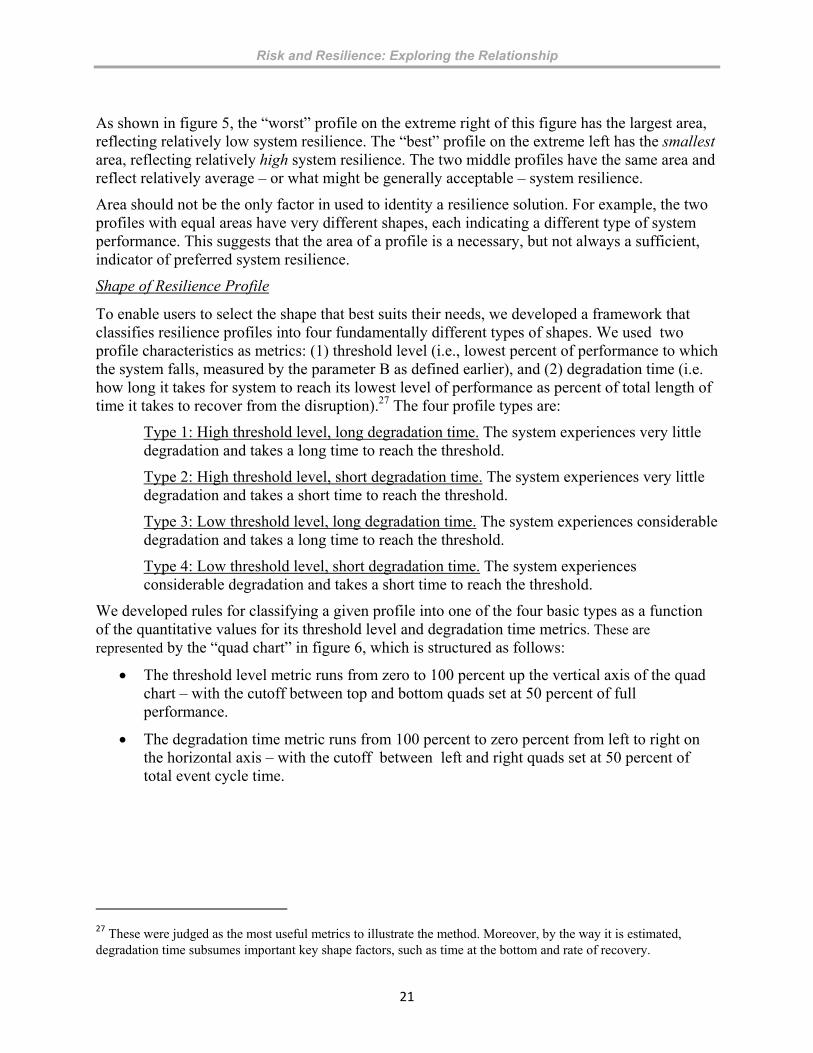
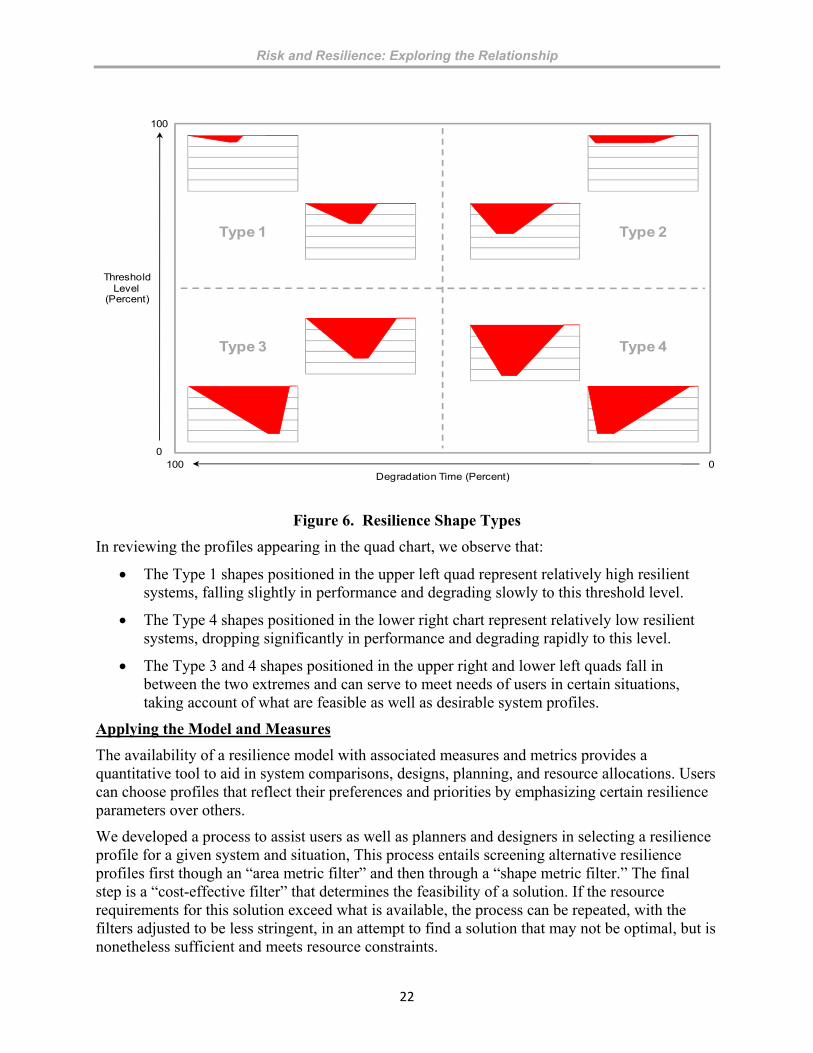
To enable users to select the shape that best suits their needs, we developed a framework that classifies resilience profiles into four fundamentally different types of shapes. We used two profile characteristics as metrics: (1) threshold level (i.e., lowest percent of performance to which the system falls, measured by the parameter B as defined earlier), and (2) degradation time (i.e. how long it takes for system to reach its lowest level of performance as percent of total length of time it takes to recover from the disruption).27 The four profile types are:
Type 1: High threshold level, long degradation time. The system experiences very little degradation and takes a long time to reach the threshold.
Type 2: High threshold level, short degradation time. The system experiences very little degradation and takes a short time to reach the threshold.
Type 3: Low threshold level, long degradation time. The system experiences considerable degradation and takes a long time to reach the threshold.
Type 4: Low threshold level, short degradation time. The system experiences considerable degradation and takes a short time to reach the threshold.
We developed rules for classifying a given profile into one of the four basic types as a function of the quantitative values for its threshold level and degradation time metrics. These are represented by the “quad chart” in figure 6, which is structured as follows:
The threshold level metric runs from zero to 100 percent up the vertical axis of the quad chart – with the cutoff between top and bottom quads set at 50 percent of full performance.
The degradation time metric runs from 100 percent to zero percent from left to right on the horizontal axis – with the cutoff between left and right quads set at 50 percent of total event cycle time.
27 These were judged as the most useful metrics to illustrate the method. Moreover, by the way it is estimated, degradation time subsumes important key shape factors, such as time at the bottom and rate of recovery.
Risk and Resilience: Exploring the Relationship
22
Degradation Time (Percent)
Type 1
ThresholdLevel
(Percent)
Type 2
Type 4Type 3
01000
100
Figure 6. Resilience Shape Types
In reviewing the profiles appearing in the quad chart, we observe that:
The Type 1 shapes positioned in the upper left quad represent relatively high resilient systems, falling slightly in performance and degrading slowly to this threshold level.
The Type 4 shapes positioned in the lower right chart represent relatively low resilient systems, dropping significantly in performance and degrading rapidly to this level.
The Type 3 and 4 shapes positioned in the upper right and lower left quads fall in between the two extremes and can serve to meet needs of users in certain situations, taking account of what are feasible as well as desirable system profiles.
Applying the Model and Measures
The availability of a resilience model with associated measures and metrics provides a quantitative tool to aid in system comparisons, designs, planning, and resource allocations. Users can choose profiles that reflect their preferences and priorities by emphasizing certain resilience parameters over others.
We developed a process to assist users as well as planners and designers in selecting a resilience profile for a given system and situation, This process entails screening alternative resilience profiles first though an “area metric filter” and then through a “shape metric filter.” The final step is a “cost-effective filter” that determines the feasibility of a solution. If the resource requirements for this solution exceed what is available, the process can be repeated, with the filters adjusted to be less stringent, in an attempt to find a solution that may not be optimal, but is nonetheless sufficient and meets resource constraints.

Risk and Resilience: Exploring the Relationship
23
Starting with a representative cross section of four profiles selected from the larger set of profiles, figure 7 portrays how the filtering process can be applied.
Time
0 10050
Performance(Percent)
0
100
Time
0 10050
Performance(Percent)
0
100
Time
0 10050
Performance(Percent)
0
100
Time
0 10050
Performance(Percent)
0
100
Area Filter
Shape Filter
Cost-Benefit Analysis
Time
0 10050
Performance(Percent)
0
100
Time
0 10050
Performance(Percent)
0
100
Time
0 10050
Performance(Percent)
0
100
Time
0 10050
Performance(Percent)
0
100
Time
0 10050
Performance(Percent)
0
100
Time
0 10050
Performance(Percent)
0
100
(Filters through all areas thatare ≤ 2,000 resilience units)
(Type preferences in descendingorder: 1, 3, 2, 4 …)
(What profile is cheapest tomaintain? Is this feasible?)
Figure 7. Filtering Resilience Profiles for Best Solution
The model can also examine the effects of different magnitudes of disruptions on the performance of a system, drawing different shapes for different types of disruptions. Understanding of the impact of a range of disruptions allows planners and designers can consider how to ensure resilience against a range of possible future disruptions.
Based on an analysis of the relationship between differing levels of disruptions and their effect on resilience profiles, we learned that the performance profile of a system experiencing different levels of disruptions changes non-linearly when a disruption changes linearly – that is, the

Risk and Resilience: Exploring the Relationship
24
resultant profiles are not proportionally smaller versions of the profile for the base case. Appendix D discusses this issue in more detail.
Vulnerability as a Key Link between Risk and Resilience
In our method, vulnerability plays a central role in formulating a quantitative link between risk and resilience. Vulnerability is a key element of risk and is also widely discussed in the literature as directly affecting the resilience of a system. In our approach, we investigate how changes in vulnerability affect each of a system’s resilience parameters, and thereby that system’s overall resilience profile. We also see how risk values for a given system and situation vary as a function of changes in vulnerability.
Risk as Function of Vulnerability
As previously mentioned, in our analysis we assess risk as the product of threat (T), vulnerability (V), and consequences (C).28 This formula is mathematically represented as Risk = Pa x (1 – Pe) x C, where Pa is the probability of a terrorist attack or natural disaster occurrence, 1- Pe is the probability of a successful attack or occurrence within a specified time period;29 and C is the resulting negative consequences in term of total dollar loss.30 The risk value is expressed in term of “expected dollar loss.” 31
To demonstrate risk as a function of different vulnerability probabilities we held the values of threat and consequences constant. 32 We set the value of T at 100 percent probability and C at 100 dollars. Under these circumstances, a vulnerability of 0.3 (i.e., 1 – Pe = 30 percent) corresponds to a risk value of 1.0 x 0.3 x $100, or 30 expected dollar loss.33 Table 4 shows the risk calculations for different vulnerability values under these conditions.
Vulnerability Probabilities
0 0.1 0.2 0.3 0.4 0.5 0.6 0.7 0.8 0.9 1
Expected Dollar Loss 0 10 20 30 40 50 60 70 80 90 100
Table 4. Risk Values as Function of Vulnerability
28 This simple multiplication formula considers T, V, and C as independent variables. An “extended” formulation considers risk as a complex function of T, V, and C, but this is difficult to apply in practice. DHS Risk Lexicon, 27. 29 Pe is the probability that countermeasures prevent a successful attack or occurrence, while 1-Pe us the probability that a given attack or occurrence is successful – i.e., the damage mechanism from the threat, hazard, or disruption actually “hits” the target. 30 Lives lost can be measured in dollars and added to economic damage to produce a total estimate of consequences in term of dollar loss. There are other types of consequences – injuries, mission failure, societal or psychological repercussions, loss of confidence in government, etc. – but these are difficult if not almost impossible to quantify. 31 This expression arises from the fact that threat and vulnerability are probabilities with values between zero and one, and consequences are presented as the expected value of statistical distributions in actual units such as dollars. The more generic expression of risk using this construct is “expected consequences.” 32 Threat and consequences can affect the resilience parameters and the overall resilience of a system. But because they are held at a constant value, they have no relative impact on changes in resilience as vulnerability changes. 33 We posit maximum dollar loss as 120, with a minimum of zero.
Risk and Resilience: Exploring the Relationship
25
Resilience as Function of Vulnerability
To calculate resilience as a function of vulnerability first required establishing mathematical relationships between vulnerability and each of the five system parameters R, A, B, Bt, and C. The resilience of the system can then be calculated in terms of the areas of the resilience profiles created by the combination of these five parameters for each vulnerability interval from 0 to 1.0. The resultant areas are expressed as performance-time units, as discussed earlier.
Finding a method for linking vulnerability to each of the five internal parameters that define a resilience profile presented a challenge. The team would have liked to conduct a systematic survey of alternative analytic methods to determine which approach or combinations of approaches would best do this job. Due to resource and time constraints, such a survey could not be accomplished under this task.
However, as proof of concept to illustrate the power of applying a quantitative approach to the characterizing the risk-resilience relationship, the team formulated a method it called “stacked matrices” that produced a representative output of the kind needed. Details are in appendix D.
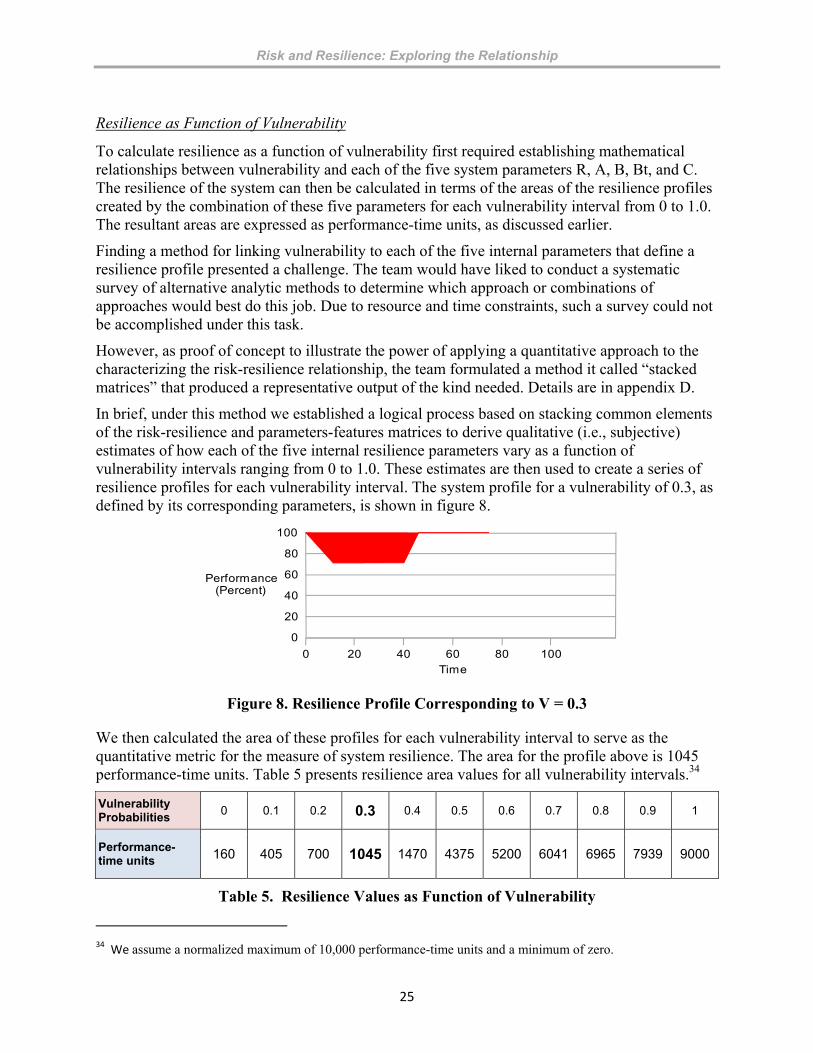
In brief, under this method we established a logical process based on stacking common elements of the risk-resilience and parameters-features matrices to derive qualitative (i.e., subjective) estimates of how each of the five internal resilience parameters vary as a function of vulnerability intervals ranging from 0 to 1.0. These estimates are then used to create a series of resilience profiles for each vulnerability interval. The system profile for a vulnerability of 0.3, as defined by its corresponding parameters, is shown in figure 8.
Time0 10020
Performance(Percent)
0
100
80
60
40
20
40 60 80
Figure 8. Resilience Profile Corresponding to V = 0.3
We then calculated the area of these profiles for each vulnerability interval to serve as the quantitative metric for the measure of system resilience. The area for the profile above is 1045 performance-time units. Table 5 presents resilience area values for all vulnerability intervals.34
Vulnerability Probabilities
0 0.1 0.2 0.3 0.4 0.5 0.6 0.7 0.8 0.9 1
Performance-time units 160 405 700 1045 1470 4375 5200 6041 6965 7939 9000
Table 5. Resilience Values as Function of Vulnerability
34 We assume a normalized maximum of 10,000 performance-time units and a minimum of zero.
Risk and Resilience: Exploring the Relationship
26
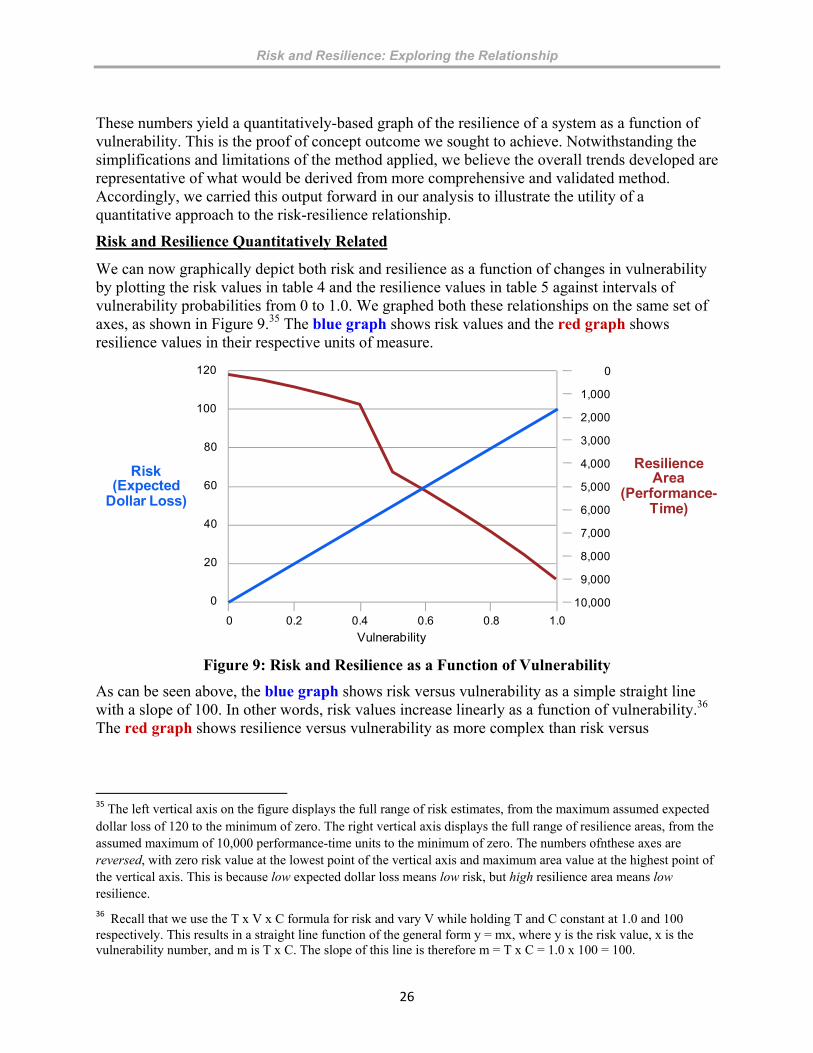
These numbers yield a quantitatively-based graph of the resilience of a system as a function of vulnerability. This is the proof of concept outcome we sought to achieve. Notwithstanding the simplifications and limitations of the method applied, we believe the overall trends developed are representative of what would be derived from more comprehensive and validated method. Accordingly, we carried this output forward in our analysis to illustrate the utility of a quantitative approach to the risk-resilience relationship.
Risk and Resilience Quantitatively Related
We can now graphically depict both risk and resilience as a function of changes in vulnerability by plotting the risk values in table 4 and the resilience values in table 5 against intervals of vulnerability probabilities from 0 to 1.0. We graphed both these relationships on the same set of axes, as shown in Figure 9.35 The blue graph shows risk values and the red graph shows resilience values in their respective units of measure.
Vulnerability0 1.00.2
Risk(Expected
Dollar Loss)
0
100
80
60
40
20
0.4 0.6 0.8
120
ResilienceArea
(Performance-Time)
0
1,000
2,000
3,000
4,000
5,000
6,000
7,000
8,000
9,000
10,000
Figure 9: Risk and Resilience as a Function of Vulnerability
As can be seen above, the blue graph shows risk versus vulnerability as a simple straight line with a slope of 100. In other words, risk values increase linearly as a function of vulnerability.36 The red graph shows resilience versus vulnerability as more complex than risk versus
35 The left vertical axis on the figure displays the full range of risk estimates, from the maximum assumed expected dollar loss of 120 to the minimum of zero. The right vertical axis displays the full range of resilience areas, from the assumed maximum of 10,000 performance-time units to the minimum of zero. The numbers ofnthese axes are reversed, with zero risk value at the lowest point of the vertical axis and maximum area value at the highest point of the vertical axis. This is because low expected dollar loss means low risk, but high resilience area means low resilience.
36 Recall that we use the T x V x C formula for risk and vary V while holding T and C constant at 1.0 and 100 respectively. This results in a straight line function of the general form y = mx, where y is the risk value, x is the vulnerability number, and m is T x C. The slope of this line is therefore m = T x C = 1.0 x 100 = 100.

Risk and Resilience: Exploring the Relationship
27
vulnerability. While representing an overall downward trend as vulnerability increases, this graph reflects bursts of non-linear behavior.37
While figure 9 shows risk and resilience varying independently as a function of vulnerability, figure 10 shows the direct relationship between risk and resilience by plotting their trends as one graph for different values of V. This combined risk-resilience graph displays non-linear behavior, due to the dynamics of the resilience model.
Resilience Area in Performance-Time Units
9,000 4,0008,000
Risk(Expected
Dollar Loss)
0
100
80
60
40
20
7,000 6,000 5,000
120
3,000 2,000 1,000 0
LowResilience
HighResilience
High
Low
Vulnerability = 1
V = 0.8
V = 0.6
V = 0.5
V = 0.4
V = 0.3
V = 0.2
V = 0.1
Figure 10: Risk and Resilience Relationship as Function of Vulnerability
The above graph shows an overall inverse relationship between risk and resilience, despite its areas of non-linearity. This quantitative outcome, while not based on complete or validated methods, certainly seems to suggest that our qualitative finding to this effect is credible.
Utility of Quantitative Risk-Resilience Relationship
A validated graph similar to the one in figure 10 can be potentially useful to a variety of system users, designers, and other stakeholders. While the general shape and overall trend of the risk-resilience graph will presumably stay the same for any system across the four domains facing broad categories of disruptions, particular characteristics will vary for specific cases.
If tailored for specific applications, this graph can offer a useful visual vehicle for informing decisions on resource allocations, supporting tradeoff analyses, and enabling comparisons of risk and resilience outcomes across a wide range of situations.
More specifically, such a graph reflects and measures how improvements in resilience can decrease risk, and, conversely, how lowering risk can make a system more resilient. By adding the cost of investments at each risk-resilience intersection point, this graph can help highlight
37 This behavior is not surprising, given that vulnerability affects each resilience model parameter individually and the combination of these parameters affects the area and shape of the profile in a complicated, non-linear manner.

Risk and Resilience: Exploring the Relationship
28
where incremental resilience compensation in a system can offset risk increases in risk. This can help system users make tradeoffs to find the best solution.
Examples of how the graph in figure 10 can assist planners include the following:
Planners can look for “sweet spots,” where relatively small improvements in resilience can have relatively high payoffs in reducing risk. In the above graph, risk values starting at the 40 dollar loss level will drop sharply with further improvements in system resilience.
Planners can identify regions reflecting “saturation effects,” where changes in system resilience do not have significant impact on risk values. In the above graph, improvements in system resilience between 4,500 performance-time units and 1,500 performance-time units have marginally little effect on lowering risk.
Findings and Next Steps on Quantitative Relations
We developed a preliminary approach to quantifying the risk-resilience relationship by applying a series of simplified and illustrative assumptions and limitations. Despite these constraints, our approach can result in potential benefits for DHS and the wider homeland security community.
Useful and Useable Model for Resilience
A major benefit of our quantitative approach is the development of a simple model of the generic behavior of a resilient system and a standard set of measures and metrics for resilience based on system performance. As a tool, the model’s generality is an asset: it provides planners across DHS with a common approach for analyzing system resilience that can be scoped and tailored to fit different scenarios. How best to apply the model across the four domains is a question worthy of further investigation.
Our resilience model offers a framework for evaluating the relative resilience of different systems and for selecting preferred profiles. The resilience profiles produced by the model can help planners identify tradeoffs and investment opportunities that can enhance the resilience of a range of systems. It would be useful to explore how the model works in real world situations, with the goal of identifying appropriate refinements and interpretations for different classes of systems and situations.
Additional analyses could also identify methods for translating the 11 resilience features into values for the parameters of a system’s resilience profile. Such profiles could be used to portray the status of a system’s resilience, identify changes that will improve system behavior in response to disruptions, and measure and monitor how these objectives are achieved.
Risk-Resilience Graphs for Planning and Resource Allocation
If validated and tailored to specific systems and situations, the graph in figure 10 that mathematically relates risk and resilience is a potentially useful tool. It can provide a visual vehicle for informing decisions on resource allocations, supporting tradeoff analyses, and enabling comparisons of risk and resilience outcomes across a wide range of situations. For example, this graph might help a planner find potentially cost-effective ways to leverage risk reductions to improve resilience. Other uses might be to discover non-productive regions of the graph where incremental resilience improvements do not have a major impact in reducing risk.

Risk and Resilience: Exploring the Relationship
29
Risk and resilience analyses are inherently uncertain, given their complexities and the difficulty of obtaining accurate data. This is particularly true where there is a lack of historical information or when the threat is from intelligent adversaries, as in the case of terrorists. In risk analyses, experts often examine a wide range of risk variables and use sensitivity analyses to determine key drivers and significant effects on outcomes. The availability of a quantitative model for resilience can enable similar sensitivity analyses to be performed with resilience parameters. Comparing the results of a risk sensitivity analysis and a resilience sensitivity analysis may better assist policy makers in evaluating alternatives and arriving at more informed decision.
Our approach to demonstrating a quantitative relationship between resilience and risk was limited by time and resource constraints. We only used vulnerability as the risk-resilience linkage factor and only applied 2 of the 11 resilience features in producing a relationship between vulnerability and the 5 internal resilience profile parameters. To validate the risk-resilience mathematical relationships developed under this task, our proof of concept would need to be extended to consider all 3 risk variables and all 11 resilience features.38 Equally important is the need to identify and evaluate more rigorous and proven analytic methods, which can either validate our results or generate modified or alterative outputs.
Overall Conclusions and Recommendations
This task conducted a preliminary investigation of the qualitative and quantitative relationship between risk and resilience. The results have potentially useful applications to homeland security decisions and can also serve as a foundation for further research.
Illuminating Resilience
The task team’s efforts to better understand resilience produced results that may help bolster resilience activities across a broad range of systems and domains. Examples of the potential utility of our findings on resilience include:
The formulation of a taxonomy that divides the homeland security mission space into the four domains of infrastructure, organizations, communities, and ecosystems. This taxonomy can offer decision makers a framework that takes account of the principle that resilience policies, plans, and programs tend to be domain specific.
The production of a basic set of consolidated and scalable definitions for resilience that may be tailored to specific systems, domains, and scenarios. These definitions can assist users and planners in better understanding and more effectively implementing the concept of resilience for a variety of types and levels of systems.
The development of a group of scalable, synthesized resilience measures aligned the consolidated definitions. The measures also include examples of applications and metrics. Users can tailor and apply these measures as a step toward operationalizing resilience actions for their particular system and situation.
38 A further refinement of this proof of concept approach would be to move beyond considering each risk variable independently and consider combinations of T, V, and C as they uniformly increase or decrease, and analyze their impact on the resilience parameters. More complicated still would be to allow all the variables to vary randomly.

Risk and Resilience: Exploring the Relationship
30
The establishment of 11 features of resilience that may be built into or retrofitted onto systems. The team also identified a series of ways and means (i.e., policies, procedures, and programs) can to make these features operational. The features and their associated ways and means can support practical steps by users, planners, and system designers to implement resilience while taking account of resource and other limitations.
The creation of a quantitative model for resilience expressed as a resilience profile with associated defining parameters and performance measures. Resilience profiles can enable users, designers, and planners to more rigorously select, assess, and compare the resilience of different systems to find the solution that best meet their needs and resources.
Value of the Risk-Resilience Relationship
Once we gained a better understanding of resilience, we analyzed relationships between risk and resilience on qualitative and quantitative levels. Though our results require additional validation, they nonetheless produced plausible outputs and insights that are potentially useful to homeland security policy makers and planners. Examples of the potential utility of our findings include:
The creation of the risk-resilience matrix as a basis for assessing risk and resilience on the level of variables and features. The matrix can help system designers see how the risks faced by a system are connected to the resilience of that system.
The generation of a qualitative proposition that risk and resilience are inversely related and mutually supportive. Understanding this relationship can help planners and policy makers address a variety of system problems from both the risk and resilience perspectives, leading to consistent strategies and more effective operations.
The development of a graph endorsing a largely inverse relationship between risk and resilience. This visual representation of the risk-resilience relationship can inform decisions on resource allocations, support tradeoff analyses, and enable comparisons of risk and resilience outcomes across a wide range of situations.
The ability to use graphs relating risk and resilience for conducting sensitivity analyses to determine key drivers and varying effects on outcomes. This can help policy makers arrive at a better informed decisions regarding risk and resilience priorities, trade-offs, and resource allocations.
Integrated Risk-Resilience Strategy
As suggested at the outset of this report, risk and resilience tend to be seen as important but separate elements of homeland security. The analytic work in this task demonstrates that risk and resilience are interrelated homeland security constructs.
As a result of our analyses, we developed the view that there may be important benefits to DHS and the overall homeland security community if risk and resilience were forged together into an integrated strategy. Such a strategy would need to build upon DHS’s existing efforts to reduce risk and enhance resilience. These efforts include:
The integrated risk management initiative currently underway. This initiative will develop a common understanding of risk, offer a set of best practices, improve

Risk and Resilience: Exploring the Relationship
31
information exchange, and ensure that risk assessments are used to inform homeland security decisions.39
The series of resilience integration initiatives being developed. Eleven such initiatives are in various stages of maturity and an overall policy framework is in the draft phase undergoing coordination.40
An integrated risk-resilience strategy would combine major elements of these initiatives. The concepts identified in this report could provide an analytic basis for such a process by showing how risk and resilience policies and programs can work together to create more effective solutions to homeland security problems.
DHS could take the lead in developing and coordinating such a strategy, but a Presidential Directive on this matter, formulated by the National Security Council in conjunction with the Department, would bolster the credibility and significance of this strategy.
Going Forward
We did not expect our work to lead to full solutions for all issues surrounding the risk-resilience relationship. Instead, our aim was to analyze and develop insights about this relationship – even if preliminary or limited – that would be useful to a variety of homeland security stakeholders. We believe we have met this goal. We see potential practical value for DHS and the broader homeland security enterprise of our insights, observations, and findings, as summarized above.
This task addressed an inherently complex and multi-layered problem, and a number of unresolved issues will require additional research. Examples of such research include:
Using case studies to investigate how the framework of consolidated resilience definitions can be scoped and tailored to meet specific needs in practical settings.
Filling the remaining gaps in resilience measures for the set of consolidated definitions, and developing guidelines for metrics across a spectrum of system types, disruptions, and domains.
Assessing in depth the set of resilience features and associated ways and means that enable resilience to be operationally incorporated into systems.
Validating and possibly extending and improving the credibility and applicability of the quantitative model for generating resilience profiles.
Exploring how the 11 resilience features can be translated into values for the parameters that define a system’s resilience profile.
Revisiting and improving the qualitative relationships between risk and resilience and the derived implications for policy and planning.
39 Kolasky, Report on IRM. 40 Janet Napolitano, “Rebuilding the Foundation for America’s Hometown Security.” Among these initiatives are a community resilience registry and updated grant guidance that encourages applicants to increase resilience at the local level. The policy framework is being formulated by a resilience IPT coordinated by the DHS Office of Policy.
Risk and Resilience: Exploring the Relationship
32
Extending our proof of concept for graphing the relationship between risk and resilience as well as identifying and applying more rigorous quantitative methods to validate or modify these results.
Demonstrating on a practical level the utility of quantifying the risk-resilience relationship for policy makers and planners, with an emphasis on how this can facilitate investment trade-offs.
Systematically exploring the potential content, structure, processes, and value of developing an integrated risk-resilience homeland security strategy.

Risk and Resilience: Exploring the Relationship
A‐1
Appendix A
The Meaning of Resilience
Defining resilience is a necessary first step to turn the concept of resilience into actions. The purpose of this appendix is to introduce a framework that offers a relatively small number of basic resilience definitions to meet the needs of a wide spectrum of public and private homeland security stakeholders. Users would select the most suitable definition for their domain(s), which can then be scaled and tailored to meet the objectives of a particular system and situation.
Key Discriminators
The approach we followed used a key discriminator method, which provided a structured approach for grouping large numbers of specific definitions as a function of shared characteristics. We decided upon three key discriminators – goal, event cycle, and approach – each with an associated set of options. Each discriminator is expressed as a question, with the options providing answers. Every consolidated definition is uniquely shaped by one goal option, one event stage option, and one option.
The three key discriminators are shown in table A-1, with their discrete options. These discrete options can be combined to form additional options.
Discrete Options
Key Discriminators
Goal Maintain Continuity of Function
Graceful Degradation
Recovery of Function to
Desired Level in
Designated Time
Inhibit Basic State Change (with other
options)
Event Cycle
Before event
During Event Post Event
Approach Outcome Based Process Based
Table A-1. Key Discriminators
A full explanation of this method follows, including how consolidated resilience definitions are formed. We begin with a discussion of the options for each key discriminator.
Goal: What is trying to be achieved through resilience actions?
Maintain Continuity of Function. Retain the same level of functionality as the pre-event level or a degraded, but minimally acceptable level. The acceptable performance threshold is the lowest level at which a user, or other responsible entity, judges that the critical/essential operations/functions of the system in question are preserved. The user would accept less than ideal system performance when it comes to other options, if necessary, in the interest of realizing this option.
Graceful Degradation. System functionality degrades slowly over time in response to event, with no precipitous drop in level of function. This embodies the concept of “bend

Risk and Resilience: Exploring the Relationship
A‐2
but not break.”41 If selected, this option can be independent of, and take priority over, the functionality level to which this degradation falls. If faced with a choice, the user would be willing to accept a level of system operations below the critical level to ensure slow degradation in performance.
Recovery of Function to Desired Level in Designated Time. System typically restores to its full pre-event level of functioning as rapidly as desirable and feasible. Returning the system to its original level of performance is the standard interpretation of this option. However, the system might be restored to less than its full pre-event level, if unable to restore fully or if this is no longer the preferable post-event level due to changed requirements or resource constraints. Alternatively, the system could return to an even higher level of functioning, as a result of creative and adaptive pre-event planning and experiences during and in immediate aftermath of an event. In all cases, the user would specify the level of functionality to which the system should return – and the preferred time to recover – taking account of what might be feasible as well as desirable.
Inhibit Basic State Change (with other options). Make it difficult for system experiencing a disruption from transitioning into an entirely different state. This is a somewhat unique and complex option, relevant for certain types of systems and situations.42 It is based on the premise that a system is resilient if it can adapt to a disruption, or a sustained series of disruptions, but still retain its intrinsic nature and fundamental functions. A system would not be resilient, no matter how adaptable, if disruptions forced it to irreversibly cross a functionality threshold or boundary into an entirely new essential state – different in kind, not degree, from its former context.43 This option is not literally discrete, in the sense that it can stand alone, but is typically found in conjunction with some or all of the other discrete options, depending on the situation.
Event Cycle: When in the event cycle are resilience actions taking place?
Before Event. Actions taken prior to impact by the system itself, including its owners and operators, to actively resist the threat, hazard, or disruption. These actions can be aimed at thwarting, attenuating, or redirecting the adverse event. They need to be clearly distinguished from traditional pre-event planning designed to better prepare the system to absorb and recover from an adverse event, once it occurs.
During Event. Actions taken to absorb and mitigate damage while the disruption is occurring and also in the immediate aftermath of an event, when systems are still experiencing significant degradation. The stage for this option lasts until significant damage from the event is no longer occurring.
41 Brad Allenby and Jonathan Fink. “Toward Inherently Secure and Resilient Societies,” Science. Volume 309, number 5737, (August 12, 2005), 1034 – 1036. 42 Tends to be associated with ecosystems resilience, but can be applicable in other domains, as will be discussed. 43 Outside intervention by humans could seek to prevent such a fundamental state change, but can also accept its inevitability or potential desirability, possibly facilitating such a change. For example, if a local park is under severe stress and efforts to adapt to such encroachments are failing, it might be best for the municipality to encourage its transformation into a well -designed commercial complex with green areas, rather than risk it turning into an unattractive and useless space with no economic or societal value.

Risk and Resilience: Exploring the Relationship
A‐3
Post Event. Actions taken during the recovery stage to mitigate consequences and ensure rapid restoration of functions. This stage begins when no further significant damage is occurring but after effects of the disruption are still present. The reconstitution period covered in this option can cover long as well as short term recovery actions.
Approach: How are resilience objectives achieved?
Outcome Based. Attaining one or more fixed end- states or satisfying a set of stable objective, such as capabilities to resist, absorb, and recover.44
Resist means that the system can actively thwart, attenuate, redirect, or otherwise mitigate the potential impact of a hazard through actions taken during the pre-event stage of an event.45
Absorb means that the system can “take a hit” and loose some functionality, but maintain at least minimal essential (i.e. critical) functions while experiencing a damage causing event and in the immediate aftermath.
Recover means that the system can restore or reconstitute to regain key functions after a damage-causing event during the post-event recovery stage.
Process Based. Dynamic processes with evolving end-states or objectives designed to enhance and maintain resilience across all stages experienced by an event. This encompasses personnel, procedures, equipment, and training, all focused on being flexible, resourceful, adaptive, and having a system-wide resilient culture.46 Learning from each event can also prepare a system to be more resilient when experiencing the next hazard.
Combining the Options.
As suggested, the option selected for each key discriminator could either consist of either one of the discrete options or be comprised of combinations of these distinct option. The combined options are listed below:
Combined Goal Options 47
Maintain Continuity of Function and Graceful Degradation
44 These objectives are from Kahan et al, "An Operational Framework for Resilience.” See also Myron Fiering, “A Screening Model to Quantify Resilience” Water Resources Research, Volume 18, Number 1 (February, 1982), 27-32. 45 Active resistance, which takes place in the pre-event stage of the cycle, as noted, is a somewhat controversial concept, with a minority of definitions including this objective. We agree that not all systems can or should by ready to conduct pre- event active resistance, which in many cases is the responsibility of entities outside the system (e.g., intelligence community or border guards). In some cases, however, this action is a necessary and feasible organic part of a system as it seeks to reach out to thwart or limit a threat before it impacts the core of the system. 46 As put by one expert, if resilience is to take hold as a key element of homeland security policy and operations, it should be part of pre event planning and be aimed at developing what can be called a “culture of resilience” among homeland security stakeholders and across the nation. Yossi Sheffi, The Resilient Enterprise (Cambridge, MA: The MIT Press, 2005), 244. 47 Recall the special case of the state change goal, which is taken to include at least one of more of the three other discrete goals, and therefore is already “combined.”

Risk and Resilience: Exploring the Relationship
A‐4
Maintain Continuity of Function and Recovery of Function in Designated Time
Graceful Degradation and Recovery of Function in Designated Time
Maintain Continuity of Function and Recovery of Function in Designated Time and Graceful Degradation
Combined Event Cycle Options 48
During/Post Event
All Stages in the Event Cycle
Combined Approach Options
Both Process and Outcome Based
Including these combined options with the discrete options yields a total of eight goal options, five event cycle options to five, three approach options. See the annex to this appendix for a chart summarizing all key discriminators and options.
Applying the Method.
Analysts formed consolidated resilience definitions guided by the following principles:
Consolidated definitions are formed for each of the four domains: infrastructure, organizations, communities, and ecosystems. The nature of systems and situations vary as a function of domain. Indeed, most of the individual definitions researched are set within the context of a particular domain, although some address multiple domains.
Not all sets of three key discriminator options that define a unique resilience definition make logical sense. This is especially true when selecting goal and event stage options, since certain goals correlate with certain event stages. For example, a definition focused on the goal of maintaining continuity of function is only pertinent during and immediately after an event.
Individual source definitions are aimed at only informing, not determining, the content of a given consolidated definition. Analytic judgments, interpretations, interpolations, and creativity can be brought to bear.49 The root source of each contributing definition will not be identified or associated with any of the consolidated results. The number of individual sources associated with a consolidated definition does not necessarily correlated into the quality or potential utility of a resultant consolidated definition.
One specific definition can be part of only one group and it typically takes at least three related specific definitions with some common affinities to form the basis for a
48 The before event option, which entails a system seeking to thwart, redirect, or attenuate a threat, hazard, or other disruption through active resistance prior to impact, has “ripple-through” effects on both the during and post event stages, so it is not useful to form separate combinations of the pre-event stage with each of these stages. This is why we only show before event as part of the all stages combined option. 49 Analysts were encouraged to interpret, by context, such ambiguous terms as “mitigation” or “withstand” to determine when in the event cycle resilience actions are taking place. As a rule, these terms were not taken to include pre-event activities to thwart, attenuate, or redirect a threat or hazard before system impact, unless supporting language made it evident that this was indeed the meaning. Such clarifications could either be direct (e.g., pre-event mitigation measures) or indirect (e.g., resilience encompasses risk reduction or threat attenuation).
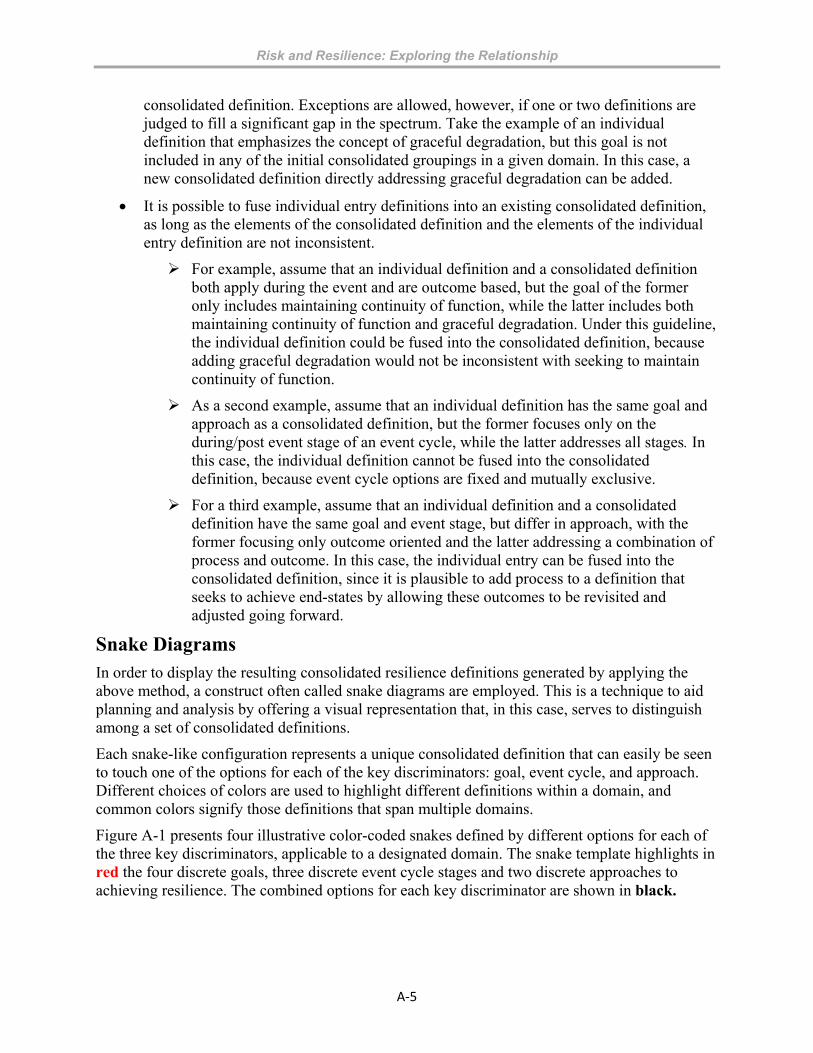
Risk and Resilience: Exploring the Relationship
A‐5
consolidated definition. Exceptions are allowed, however, if one or two definitions are judged to fill a significant gap in the spectrum. Take the example of an individual definition that emphasizes the concept of graceful degradation, but this goal is not included in any of the initial consolidated groupings in a given domain. In this case, a new consolidated definition directly addressing graceful degradation can be added.
It is possible to fuse individual entry definitions into an existing consolidated definition, as long as the elements of the consolidated definition and the elements of the individual entry definition are not inconsistent.
For example, assume that an individual definition and a consolidated definition both apply during the event and are outcome based, but the goal of the former only includes maintaining continuity of function, while the latter includes both maintaining continuity of function and graceful degradation. Under this guideline, the individual definition could be fused into the consolidated definition, because adding graceful degradation would not be inconsistent with seeking to maintain continuity of function.
As a second example, assume that an individual definition has the same goal and approach as a consolidated definition, but the former focuses only on the during/post event stage of an event cycle, while the latter addresses all stages. In this case, the individual definition cannot be fused into the consolidated definition, because event cycle options are fixed and mutually exclusive.
For a third example, assume that an individual definition and a consolidated definition have the same goal and event stage, but differ in approach, with the former focusing only outcome oriented and the latter addressing a combination of process and outcome. In this case, the individual entry can be fused into the consolidated definition, since it is plausible to add process to a definition that seeks to achieve end-states by allowing these outcomes to be revisited and adjusted going forward.
Snake Diagrams In order to display the resulting consolidated resilience definitions generated by applying the above method, a construct often called snake diagrams are employed. This is a technique to aid planning and analysis by offering a visual representation that, in this case, serves to distinguish among a set of consolidated definitions.
Each snake-like configuration represents a unique consolidated definition that can easily be seen to touch one of the options for each of the key discriminators: goal, event cycle, and approach. Different choices of colors are used to highlight different definitions within a domain, and common colors signify those definitions that span multiple domains.
Figure A-1 presents four illustrative color-coded snakes defined by different options for each of the three key discriminators, applicable to a designated domain. The snake template highlights in red the four discrete goals, three discrete event cycle stages and two discrete approaches to achieving resilience. The combined options for each key discriminator are shown in black.

Risk and Resilience: Exploring the Relationship
A‐6
Resilience Definitions Key Discriminators: Domain __
EventCycle
Before/DuringEvent
DuringEvent
During/Post
Event
PostEvent
All Stagesin Event
Life-Cycle
Goal
Approach Process-Based CombinationOutcome-Based
Maintain Continuity of Function AND
Recovery in Designated
Time AND Graceful
Degradation
Inhibit Basic State
Change, with Recovery of
Functionin Designated
Time
Maintain Continuityof Function
Recovery of Functionto Desired Level in
Designated Time
GracefulDegradation
Maintain Continuityof Function
AND GracefulDegradation
Recovery of Function
in Designated Time
AND GracefulDegradation
Maintain Continuityof Function
ANDRecovery of Function in Designated
Time
Figure A-1. Illustrative Snake Diagram
In developing consolidated definitions, analysts created overview charts, as in table A-2, to record how each solution corresponds to specified options for each of the key discriminators.
Table A-2. Illustrative Consolidated Definitions Overview Chart
The consolidated definitions also appear in prose. The example below is for the brown definition in table A-2 and associated brown snake in figure A-1.
Resilience is the ability of a system to attain the objectives of resisting, absorbing, and recovering from the impact of an adverse event, before, during, and after its occurrence.
Consolidated Definitions Goal Option Event Cycle Option
ApproachOption
Brown Maintain Continuity of Function AND Recovery of Function in Designated Time AND Graceful Degradation
All stages in the event cycle
Both Process and Outcome Based
Violet Maintain Continuity of Function AND Recovery of Function in Designated Time AND Graceful Degradation
All stages in the event cycle
Outcome Based
Blue Maintain Continuity of Function AND Recovery of Function in Designated Time AND Graceful Degradation
During Event/Post Event
Outcome Based
Green Maintain Continuity of Function During Event Outcome Based

Risk and Resilience: Exploring the Relationship
A‐7
It is also a dynamic process that seeks to learn from incidents to strengthen capabilities of the system in meeting future challenges. The goals are to maintain continuity of function, degrading gracefully, and recover system functionality to a pre-designated level, as rapidly as desired and feasible.
Consolidated Resilience Definitions Following are the results of applying the method and visualization technique summarized above. This framework can enable users to select a consolidated definition that represents the basic problem they are addressing. If and as appropriate, this definition can then be scaled and tailored to the specific set of circumstances, which can vary in terms of such factors as:
The scope and character of the system in question, whether single and simple or a complex System of Systems; comprised of individual assets, sectors, regions, cities, or jurisdictions; and reflecting physical, organizational, societal, or natural characteristics.
The types of human or naturally-caused threats, hazards, or disruptions faced by the system, whether individual powerful incidents, groups of incidents occurring in different locations at the same time, or a series of events with cumulating system impact over time.
The broader context within which a system’s resilience is of concern, whether infrastructure, organizations, communities, or ecosystems, or spanning multiple domains.
The level of responsibilities and resources of the stakeholder, whether user, owner, designer, or planner; operating at the federal, state, or local level for public stakeholders; or encompassing small, medium, or large enterprises for private sector stakeholders.
The framework for our consolidated resilience definitions is as follows. For each of the four domains we present: (1) consolidated definitions in the form of snake diagrams; (2) overview charts specifying the key discriminator options for each definition; (3) definitions expressed as sentences with options emphasized; (4) intra and inter-domain comparative analyses; and (5) potential value for users.
Infrastructure Domain: Four Consolidated Definitions Below is a snake diagram, figure A-2, and overview chart, table A-3, for the infrastructure domain, followed by the set of definitions in prose, domain assessments, and potential value to users.
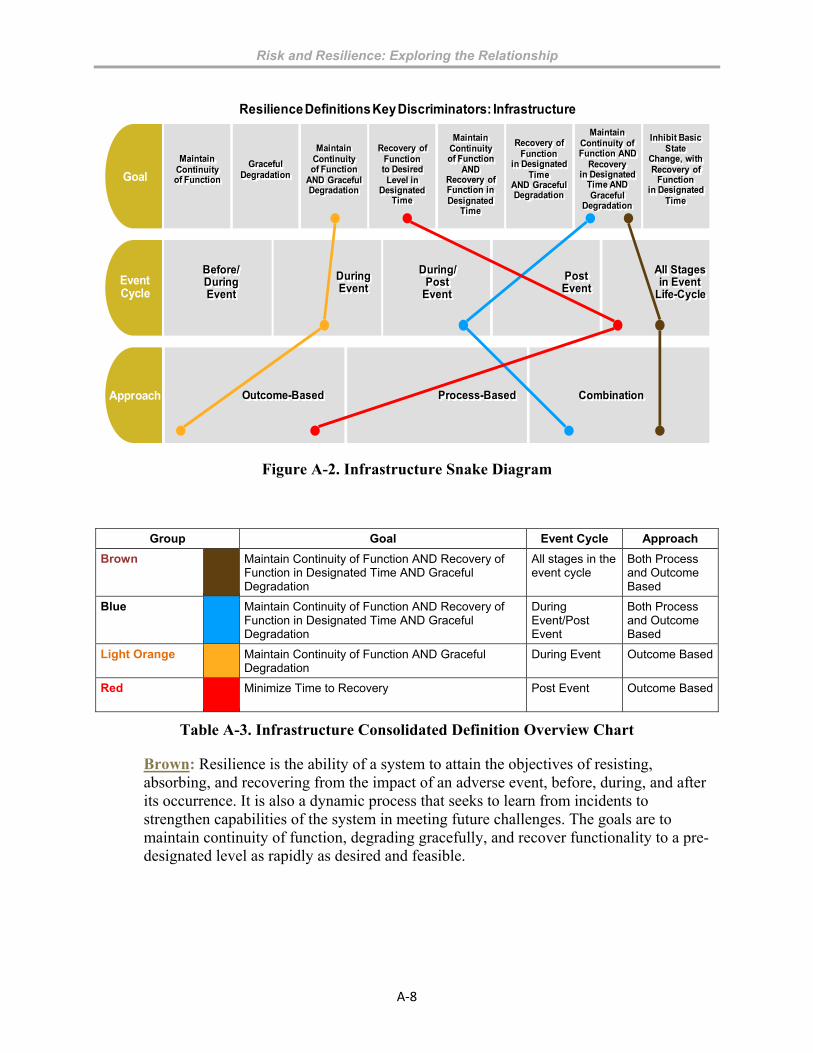
Risk and Resilience: Exploring the Relationship
A‐8
Resilience Definitions Key Discriminators: Infrastructure
EventCycle
Before/DuringEvent
DuringEvent
During/Post
Event
PostEvent
All Stagesin Event
Life-Cycle
Goal
Approach Process-Based CombinationOutcome-Based
Maintain Continuity of Function AND
Recovery in Designated
Time AND Graceful
Degradation
Inhibit Basic State
Change, with Recovery of
Functionin Designated
Time
Maintain Continuityof Function
Recovery of Functionto Desired Level in
Designated Time
GracefulDegradation
Maintain Continuityof Function
AND GracefulDegradation
Recovery of Function
in Designated Time
AND GracefulDegradation
Maintain Continuityof Function
ANDRecovery of Function in Designated
Time
Figure A-2. Infrastructure Snake Diagram
Group Goal Event Cycle Approach
Brown
Maintain Continuity of Function AND Recovery of Function in Designated Time AND Graceful Degradation
All stages in the event cycle
Both Process and Outcome Based
Blue
Maintain Continuity of Function AND Recovery of Function in Designated Time AND Graceful Degradation
During Event/Post Event
Both Process and Outcome Based
Light Orange
Maintain Continuity of Function AND Graceful Degradation
During Event Outcome Based
Red
Minimize Time to Recovery Post Event Outcome Based
Table A-3. Infrastructure Consolidated Definition Overview Chart
Brown: Resilience is the ability of a system to attain the objectives of resisting, absorbing, and recovering from the impact of an adverse event, before, during, and after its occurrence. It is also a dynamic process that seeks to learn from incidents to strengthen capabilities of the system in meeting future challenges. The goals are to maintain continuity of function, degrading gracefully, and recover functionality to a pre-designated level as rapidly as desired and feasible.
Risk and Resilience: Exploring the Relationship
A‐9
Blue: Resilience is the ability of a system to attain the objectives of absorbing and recovering from the impact of an adverse event, during and after its occurrence. The goals are to maintain continuity of function, degrading gracefully, and recover system functionality to a pre-designated level as rapidly as desired and feasible.
Light Orange: Resilience is the ability of a system to attain the objective of absorbing the impact of an adverse event during its occurrence. The goal is to maintain continuity of function, degrading gracefully to a pre-designated, acceptable level.
Red: Resilience is the ability of a system to attain the objective of recovering from the impact of an adverse event, after its occurrence. The goal is recover degraded system functionality to a pre-designated level as rapidly as desired and feasible.
Domain Assessments
Achieving specific end-states is a prominent concept in this domain. None of the definitions view the approach to achieving resilience as focusing solely on a dynamic process. Only one definition in this domain includes the concept of active resistance. None of the definitions in this domain focus on inhibiting basic state change.
Of the four consolidated definitions provided for the infrastructure domain, brown is the most comprehensive as it encompasses all the strategic differentiators, with the exception of the avoidance of state change.
The blue definition is similar to brown, but does not include pre-event activities (i.e. active resistance).
The other two definitions are narrower in scope, focusing on fewer goals.
The light orange definition focuses on maintaining continuity of function, degrading gracefully if necessary. This definition is focused on a specific end state of absorption, and occurs during only during the event.
The red definition is unlike the others in that it focuses on what occurs after the adverse event, emphasizing recovery of function in a designated time.
Value to Users
Stakeholders with different systems and resilience needs in the infrastructure domain may favor a particular consolidated definition, for example:
A potential application of the brown definition might be a large regional bank controlling major financial tools affecting the U.S. economy, addressing the threat of multiple IED attacks. There is the need for a comprehensive definition, across the spectrum of goals and stages, because of the vital nature of its operations (physical plant, equipment, personnel, and procedures), which needs to be as continuous as possible with the highest level of functioning as possible.
A potential application of the light blue definition might be to hedge against the prospect of experiencing a devastating tornado on a major dairy production complex servicing the needs of large urban area by seeking to keep some level of critical operations functioning during and after the event.

Risk and Resilience: Exploring the Relationship
A‐10
A potential application of the red definition might be reopening a major highway, after closing it due to a gas leak. Owners and operators of this infrastructure may not have the capacity to prevent such an event, and would focus on recovery after the leak has taken place.
Organizations Domain: Five Consolidated Definitions Below is a snake diagram, figure A-3, and an overview chart, table A-4, for the organizations domain, followed by the set of definitions in prose, a domain assessment, and potential value to users.
Resilience Definitions Key Discriminators: Organizations
EventCycle
Before/DuringEvent
DuringEvent
During/Post
Event
PostEvent
Goal
Approach Process-Based CombinationOutcome-Based
Maintain Continuity of Function AND
Recovery in Designated
Time AND Graceful
Degradation
Inhibit Basic State
Change, with Recovery of
Functionin Designated
Time
Maintain Continuityof Function
Recovery of Functionto Desired Level in
Designated Time
GracefulDegradation
Maintain Continuityof Function
AND GracefulDegradation
Recovery of Function
in Designated Time
AND GracefulDegradation
Maintain Continuityof Function
ANDRecovery of Function in Designated
Time
AllStages
in EventLife-
Cycle
Figure A-3. Organizations Snake Diagram
Definition Goal Event Cycle Approach
Brown
Maintaining Continuity of Function AND Minimizing Time to Recovery AND Graceful Degradation
All stages in the event life-cycle
Both Process and Outcome Based
Dark Purple
Maintaining Continuity of Function AND Minimizing Time to Recovery
All stages in the event life-cycle
Process Based
Light Blue
Maintaining Continuity of Function AND Minimizing Time to Recovery
During event/Post event
Both Process and Outcome Based
Green
Maintaining Continuity of Function During event Outcome Based
Gray
Inhibiting State Change Maintaining Continuity of Function AND Minimizing Time to Recovery
All stages in the event life-cycle
Process Based
Table A-4. Organizations Consolidated Definition Overview Chart
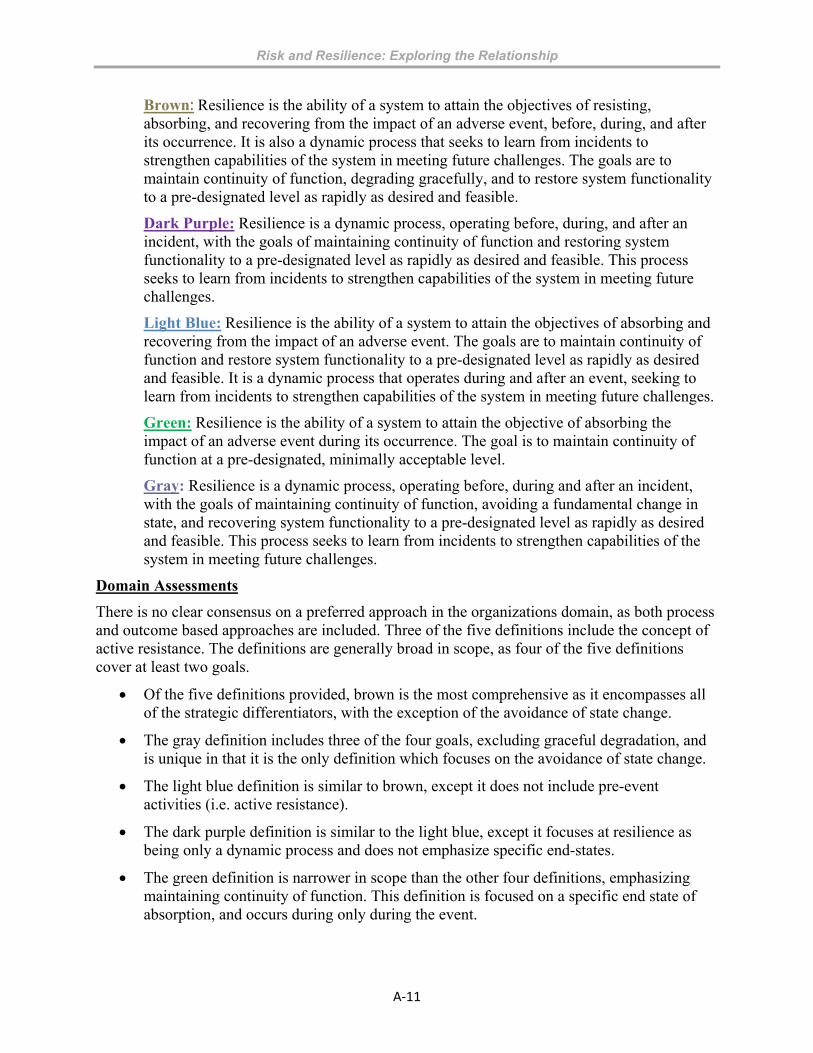
Risk and Resilience: Exploring the Relationship
A‐11
Brown: Resilience is the ability of a system to attain the objectives of resisting, absorbing, and recovering from the impact of an adverse event, before, during, and after its occurrence. It is also a dynamic process that seeks to learn from incidents to strengthen capabilities of the system in meeting future challenges. The goals are to maintain continuity of function, degrading gracefully, and to restore system functionality to a pre-designated level as rapidly as desired and feasible.
Dark Purple: Resilience is a dynamic process, operating before, during, and after an incident, with the goals of maintaining continuity of function and restoring system functionality to a pre-designated level as rapidly as desired and feasible. This process seeks to learn from incidents to strengthen capabilities of the system in meeting future challenges.
Light Blue: Resilience is the ability of a system to attain the objectives of absorbing and recovering from the impact of an adverse event. The goals are to maintain continuity of function and restore system functionality to a pre-designated level as rapidly as desired and feasible. It is a dynamic process that operates during and after an event, seeking to learn from incidents to strengthen capabilities of the system in meeting future challenges.
Green: Resilience is the ability of a system to attain the objective of absorbing the impact of an adverse event during its occurrence. The goal is to maintain continuity of function at a pre-designated, minimally acceptable level.
Gray: Resilience is a dynamic process, operating before, during and after an incident, with the goals of maintaining continuity of function, avoiding a fundamental change in state, and recovering system functionality to a pre-designated level as rapidly as desired and feasible. This process seeks to learn from incidents to strengthen capabilities of the system in meeting future challenges.
Domain Assessments
There is no clear consensus on a preferred approach in the organizations domain, as both process and outcome based approaches are included. Three of the five definitions include the concept of active resistance. The definitions are generally broad in scope, as four of the five definitions cover at least two goals.
Of the five definitions provided, brown is the most comprehensive as it encompasses all of the strategic differentiators, with the exception of the avoidance of state change.
The gray definition includes three of the four goals, excluding graceful degradation, and is unique in that it is the only definition which focuses on the avoidance of state change.
The light blue definition is similar to brown, except it does not include pre-event activities (i.e. active resistance).
The dark purple definition is similar to the light blue, except it focuses at resilience as being only a dynamic process and does not emphasize specific end-states.
The green definition is narrower in scope than the other four definitions, emphasizing maintaining continuity of function. This definition is focused on a specific end state of absorption, and occurs during only during the event.

Risk and Resilience: Exploring the Relationship
A‐12
Value to Users
Stakeholders with different systems and resilience needs in the organizations domain may favor a particular consolidated definition, for example:
A potential application of the brown definition is the Federal government of a country addressing a large scale terrorist attack. Given the magnitude of threat as well as the resources available, a comprehensive definition is appropriate.
A potential application of the gray definition for a local delicatessen specializes in pastrami sandwiches. In response to an adverse event, it adapts and specializes in a different type of sandwich, avoiding a move to a different business function altogether.
Communities Domain: Seven Consolidated Definitions
Below is a snake diagram, figure A-4, and an overview chart, table A-5, for the communities domain, followed by the set of definitions in prose, domain assessments, and potential value to users.
Resilience Definitions Key Discriminators: Communities
EventCycle
Before/DuringEvent
DuringEvent
During/Post
Event
PostEvent
Goal
ApproachProcess-
Based
CombinationOutcome-
Based
Maintain Continuity of Function AND
Recovery in Designated
Time AND Graceful
Degradation
Inhibit Basic State
Change, with Recovery of
Functionin Designated
Time
Maintain Continuityof Function
Recovery of Functionto Desired Level in
Designated Time
GracefulDegradation
Maintain Continuityof Function
AND GracefulDegradation
Recovery of Function
in Designated Time
AND GracefulDegradation
Maintain Continuityof Function
ANDRecovery of Function in Designated
Time
AllStages
in EventLife-
Cycle
Figure A-4. Communities Snake Diagram

Risk and Resilience: Exploring the Relationship
A‐13
Table A-5. Communities Consolidated Definition Overview Chart
Green: Resilience is the ability of a system to attain the objective of absorbing the impact of an adverse event. The goal is to maintaining continuity of function during the incident at a pre-designated, minimally acceptable level.
Yellow: Resilience is the ability of a system to attain the objectives of resisting, absorbing, and recovering from the impact of an adverse event, before, during, and after its occurrence. It is also a dynamic process that seeks to learn from incidents to strengthen capabilities of the system in meeting future challenges. The goals are to maintain continuity of function and restore system functionality to a pre-designated level, as rapidly as desired and feasible.
Brown: Resilience is the ability of a system to attain the objectives of resisting, absorbing, and recovering from the impact of an adverse event, before, during, and after its occurrence. It is also a dynamic process that seeks to learn from incidents to strengthen capabilities of the system in meeting future challenges. The goals are to maintain continuity of function, degrading gracefully, and restore system functionality to a pre-designated level, as rapidly as desired and feasible
Light Blue: Resilience is the ability of a system to attain the objectives of absorbing and recovering from the impact of an adverse event, during and after occurrence. It is also a dynamic process that seeks to learn from incidents to strengthen system capabilities in meeting future challenges. The goals are to maintain continuity of function and restore system functionality to a pre-designated level as rapidly as desired and feasible.
Dark Orange: Resilience is the ability of a system to attain the objectives of absorbing and recovering from the impact of an adverse event, during and after its occurrence. The goals are to maintain continuity of function, degrade gracefully, and restore system functionality to a pre-designated level as rapidly as desired and feasible.
Definition Goal Event Cycle Approach
Green
Maintaining Continuity of Function During event Outcome based
Yellow
Maintaining Continuity of Function AND Minimizing Time to Recovery
All stages in the event life-cycle
Both
Brown
Maintaining Continuity of Function AND Minimizing Time to Recovery AND Graceful Degradation
All stages in the event life-cycle
Both
Light Blue
Maintaining Continuity of Function AND Minimizing Time to Recovery
During event/Post event
Both
Dark Orange
Maintaining Continuity of Function AND Minimizing Time to Recovery AND Graceful Degradation
During event/Post event
Outcome based
Dark Blue
Minimizing Time to Recovery Post event Both
Light Purple
Inhibiting State Change and Minimizing Time to Recovery
Post event process
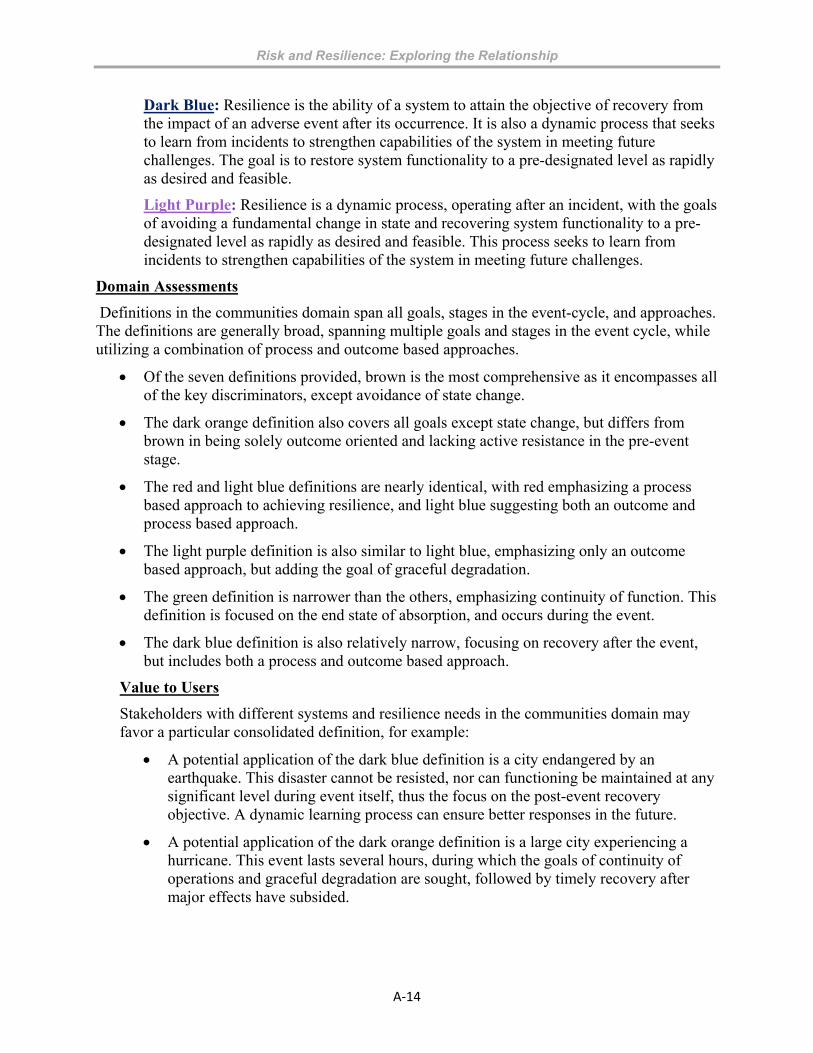
Risk and Resilience: Exploring the Relationship
A‐14
Dark Blue: Resilience is the ability of a system to attain the objective of recovery from the impact of an adverse event after its occurrence. It is also a dynamic process that seeks to learn from incidents to strengthen capabilities of the system in meeting future challenges. The goal is to restore system functionality to a pre-designated level as rapidly as desired and feasible.
Light Purple: Resilience is a dynamic process, operating after an incident, with the goals of avoiding a fundamental change in state and recovering system functionality to a pre-designated level as rapidly as desired and feasible. This process seeks to learn from incidents to strengthen capabilities of the system in meeting future challenges.
Domain Assessments
Definitions in the communities domain span all goals, stages in the event-cycle, and approaches. The definitions are generally broad, spanning multiple goals and stages in the event cycle, while utilizing a combination of process and outcome based approaches.
Of the seven definitions provided, brown is the most comprehensive as it encompasses all of the key discriminators, except avoidance of state change.
The dark orange definition also covers all goals except state change, but differs from brown in being solely outcome oriented and lacking active resistance in the pre-event stage.
The red and light blue definitions are nearly identical, with red emphasizing a process based approach to achieving resilience, and light blue suggesting both an outcome and process based approach.
The light purple definition is also similar to light blue, emphasizing only an outcome based approach, but adding the goal of graceful degradation.
The green definition is narrower than the others, emphasizing continuity of function. This definition is focused on the end state of absorption, and occurs during the event.
The dark blue definition is also relatively narrow, focusing on recovery after the event, but includes both a process and outcome based approach.
Value to Users
Stakeholders with different systems and resilience needs in the communities domain may favor a particular consolidated definition, for example:
A potential application of the dark blue definition is a city endangered by an earthquake. This disaster cannot be resisted, nor can functioning be maintained at any significant level during event itself, thus the focus on the post-event recovery objective. A dynamic learning process can ensure better responses in the future.
A potential application of the dark orange definition is a large city experiencing a hurricane. This event lasts several hours, during which the goals of continuity of operations and graceful degradation are sought, followed by timely recovery after major effects have subsided.

Risk and Resilience: Exploring the Relationship
A‐15
Ecosystems Domain: Four Consolidated Definitions Below is a snake diagram, figure A-5, and an overview chart, table A-6, for the ecosystems domain, followed by the set of definitions in prose, domain assessments, and potential value to users.
Resilience Definitions Key Discriminators:Ecosystems
EventCycle
Before/DuringEvent
DuringEvent
During/Post
Event PostEvent
Goal
ApproachProcess-
BasedCombination
Outcome-Based
7. Maintain Continuity of Function AND
Recovery in Designated
Time AND Graceful
Degradation
Inhibit Basic State
Change, Along with
Combination of goals 1, 5,
and 7
1. Maintain Continuityof Function
Recovery of Functionto Desired Level in
Designated Time
GracefulDegradation
Maintain Continuityof Function
AND GracefulDegradation
Recovery of Function
in Designated Time
AND GracefulDegradation
5. Maintain Continuityof Function
ANDRecovery of Function in Designated
Time
All Stagesin Event
Life- Cycle
Figure A-5. Ecosystems Snake Diagram
Table A-6. Ecosystems Consolidated Definition Overview Chart
Dark Red: Resilience is the ability of a system to attain the objective of absorbing the impact of an adverse event, during its occurrence. It is also a dynamic process that seeks to learn from incidents to strengthen capabilities of the system in meeting future challenges. The goals are to maintain continuity of function while avoiding a fundamental change in state.
Group Goal Event Cycle Approach
Dark Red
Maintaining Continuity of Function AND Inhibiting State Change
During event Both Process and Outcome Based
Dark Green
Maintaining Continuity of Function AND Minimizing Time to Recovery AND Graceful Degradation AND Inhibiting State Change
During event/ Post event
Both Process and Outcome Based
Black
Maintaining Continuity of Function AND Minimizing Time to Recovery AND Inhibiting State Change
During event/ Post event
Process Based
Pink
Maintaining Continuity of Function AND Minimizing Time to Recovery AND Graceful Degradation AND Inhibiting State Change
All stages in event-cycle
Both Process and Outcome Based

Risk and Resilience: Exploring the Relationship
A‐16
Dark Green: Resilience is the ability of a system to attain the objectives of absorbing and recovering from the impact of an adverse event, during and after its occurrence. It is also a dynamic process that seeks to learn from incidents to strengthen capabilities of the system in meeting future challenges. The goals are to maintain continuity of function, degrading gracefully, while avoiding a fundamental change in state, and to recover system functionality to a pre-designated level as rapidly as desired and feasible.
Black: Resilience is a dynamic process, operating during and after an incident, with the goals of maintaining continuity of function, avoiding a fundamental change in state and recovery of system functionality to a pre-designated level, as rapidly as desired and feasible. This process seeks to learn from incidents to strengthen capabilities of the system in meeting future challenges.
Pink: Resilience is the ability of a system to attain the objectives of resisting, absorbing and recovering from the impact of an adverse event, before, during, and after its occurrence. It is also a dynamic process that seeks to learn from incidents to strengthen capabilities of the system in meeting future challenges. The goals are to maintain continuity of function, degrading gracefully, while avoiding a fundamental change in state. It is also to recover system functionality to a pre-designated level, as rapidly as desired and feasible.
Domain Assessments
Inhibiting basic state change is a central concept within the ecosystems domain as all four definitions have it as one of their goals. Furthermore, all definitions include a process based approach, either alone or in combination with specific end states. One of the definitions in this domain focuses on pre-event mitigation (i.e. active resistance) activities.50
The dark red, pink, and dark green definitions are both outcome and processed based, with the black definition focusing solely on process.
The dark red definition focuses on actions only during the event-cycle, whereas the dark green, pink and black definitions also include post-event activities.
Value to Users
Stakeholders with different systems and resilience needs in the ecosystems domain may favor a particular consolidated definition, for example:
A potential application of the dark green definition is concern by local authorities over prospective deforestation in an important tropical rainforest due to increasingly widespread logging, risking a fundamental state change that will lead to the rainforest vanishing when it can no longer adapt to these sustained disruptions.
50 The active resistance concept is not prominent in the literature dealing with the ecosystem domain. However, the analytic team concluded this concept has significant utility in this domain because ecosystems are not independent entities (e.g. where a marsh always functions on its own) but are often intertwined with public or specific institutions (e.g. local government) who can be considered as caretakers or exploiters if not owners. These entities can institute pre-event activities such as regulating emissions or constructing barriers to prevent or mitigate damaging incursions, which, if impacting the system, can fundamentally alter its basic state.

Risk and Resilience: Exploring the Relationship
A‐17
A potential application of the pink definition is concerned environmentalists finding ways to actively resist, cope with, and respond to the ongoing threat of acidification of waters which cause deterioration of unique coral reefs and related plant and animal life dependent on these reefs. End-states are set and dynamic processes pursued to educate, learn, and improve the countermeasures applied.
Insights on the Meaning of Resilience During the course of our research, we discovered a number of insights and observations about the meaning of resilience. We assembled a selection of these materials as potentially useful for stakeholders planning to utilize the consolidated definitions and for academic experts seeking to identify issue to be further investigated.
What is Resilience?
We drew upon contributions from a wide variety of sources as a means of forming a small set of consolidated definitions for each domain. But many of the specific contributing sources offered particularly significant or creative definitions of resilience, which are worth highlighting on their own. Examples include:
A resilient nation is “one in which individuals, communities, and our economy can adapt to changing conditions as well as withstand and rapidly recover from disruption due to emergencies.” Resilience is “the ability to adapt to changing conditions and prepare for, withstand, and rapidly recover from disruption. We will not be able to deter or prevent every single threat. That is why we must also enhance our resilience... When incidents occur, we must show resilience by maintaining critical operations and functions [and] return ... to our normal life.” 51
Resilience ensures that a system can continue to function at a certain critical minimum level during and in the immediate aftermath of a disruption, degrade gracefully if necessary, reach a low (but minimally acceptable) point in performance, and restore its functioning to its pre-event capabilities. Resilience is not just about minimizing initial effects of an adverse incident, but also minimizing its longer term cascading effects. 52
Resilience… is “the ability of a system to accommodate surprise and to survive or even to recover and thrive under unanticipated perturbation… Brittle units tend to shatter when confronted with catastrophic shocks [while resilient systems are] ... poised to bounce back. A resilient system does not respond precipitously to surprise and tolerates system perturbations.53
Resilience is a holistic, integrated system process, which focuses on “systemic resilience” – i.e., the whole is more than the sum of the parts. It represents a shift from the old paradigm of experience and reaction to anticipation and adaption.” It is no longer a
51 Community and Regional Resilience Institute (CARRI), “Community Resilience Roundtable Meeting Summary”, December 1, 2009, 5; and the White House, The National Security Strategy of the United States of America, Washington, DC, 2010, 18-19. 52 U.S. Department of Homeland Security, Homeland Security Advisory Council. Report of the Critical Infrastructure Task Force, Washington, DC, January 2006, 5. 53 Myron Fiering, A Screening Model to Quantify Resilience, 27.
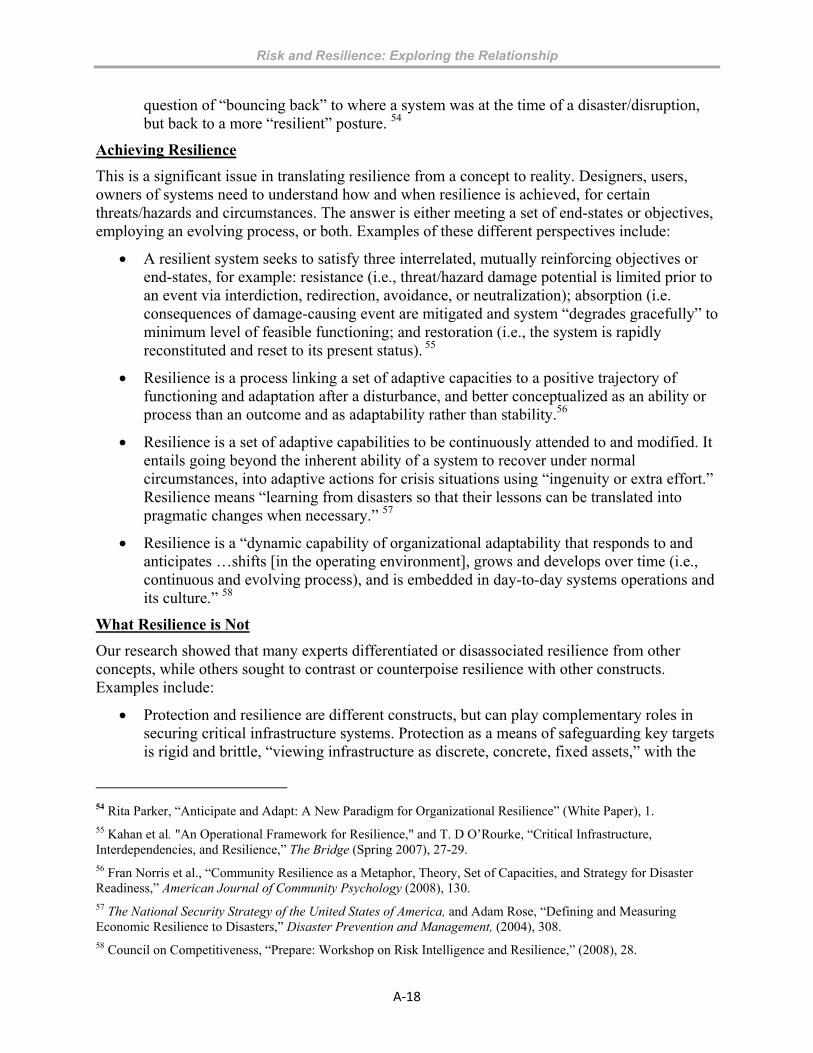
Risk and Resilience: Exploring the Relationship
A‐18
question of “bouncing back” to where a system was at the time of a disaster/disruption, but back to a more “resilient” posture. 54
Achieving Resilience
This is a significant issue in translating resilience from a concept to reality. Designers, users, owners of systems need to understand how and when resilience is achieved, for certain threats/hazards and circumstances. The answer is either meeting a set of end-states or objectives, employing an evolving process, or both. Examples of these different perspectives include:
A resilient system seeks to satisfy three interrelated, mutually reinforcing objectives or end-states, for example: resistance (i.e., threat/hazard damage potential is limited prior to an event via interdiction, redirection, avoidance, or neutralization); absorption (i.e. consequences of damage-causing event are mitigated and system “degrades gracefully” to minimum level of feasible functioning; and restoration (i.e., the system is rapidly reconstituted and reset to its present status). 55
Resilience is a process linking a set of adaptive capacities to a positive trajectory of functioning and adaptation after a disturbance, and better conceptualized as an ability or process than an outcome and as adaptability rather than stability.56
Resilience is a set of adaptive capabilities to be continuously attended to and modified. It entails going beyond the inherent ability of a system to recover under normal circumstances, into adaptive actions for crisis situations using “ingenuity or extra effort.” Resilience means “learning from disasters so that their lessons can be translated into pragmatic changes when necessary.” 57
Resilience is a “dynamic capability of organizational adaptability that responds to and anticipates …shifts [in the operating environment], grows and develops over time (i.e., continuous and evolving process), and is embedded in day-to-day systems operations and its culture.” 58
What Resilience is Not
Our research showed that many experts differentiated or disassociated resilience from other concepts, while others sought to contrast or counterpoise resilience with other constructs. Examples include:
Protection and resilience are different constructs, but can play complementary roles in securing critical infrastructure systems. Protection as a means of safeguarding key targets is rigid and brittle, “viewing infrastructure as discrete, concrete, fixed assets,” with the
54 Rita Parker, “Anticipate and Adapt: A New Paradigm for Organizational Resilience” (White Paper), 1. 55 Kahan et al. "An Operational Framework for Resilience," and T. D O’Rourke, “Critical Infrastructure, Interdependencies, and Resilience,” The Bridge (Spring 2007), 27-29. 56 Fran Norris et al., “Community Resilience as a Metaphor, Theory, Set of Capacities, and Strategy for Disaster Readiness,” American Journal of Community Psychology (2008), 130. 57 The National Security Strategy of the United States of America, and Adam Rose, “Defining and Measuring Economic Resilience to Disasters,” Disaster Prevention and Management, (2004), 308. 58 Council on Competitiveness, “Prepare: Workshop on Risk Intelligence and Resilience,” (2008), 28.

Risk and Resilience: Exploring the Relationship
A‐19
danger of complete failure of function (i.e., “single point” failure). Resilience offers the construct of absorbing a disruption, degrading “gracefully,” and restoring functionality.59
Resilience is not the same as stability, which means the “propensity of system to attain or retain a single equilibrium condition of steady state or stable oscillation.” Stability emphasizes “equilibrium, low variability, and resistance to and absorption of change.” High stability systems resist departure from a stable condition and, if perturbed, return rapidly to their initial stable condition with least fluctuation. Low stability can facilitate resilience by strengthening system against subsequent fluctuations.60
Resilience and sustainability are different. “Sustainability is a brittle state: Unforeseen changes (natural or otherwise) can easily cause its collapse. Resilience is all about being able to overcome the unexpected. Sustainability is about survival. The goal of resilience is to thrive.” 61
Pre-Event Resilience
There is disagreement on whether to include within the definition of system resilience various “active resistance” capabilities – i.e., pre-event efforts to thwart, attenuate, or redirect the threat/hazard/disruption before it impacts. If this is done, then attaining resilience during the event and post-boom is less demanding. However, most approaches do not include pre-event mitigation in their concept of system resilience, on the grounds that such activities are the responsibilities of forces exogenous to the system. Yet many approaches do encompass this element in their approach to resilience. Examples include:
Resilience can include “mitigation efforts before a hazard strikes, not only to close vulnerabilities and reduce consequences and response/recover operations, but also to avoid and lessen the impact of an incident,” which can in fact have the effect of reducing resultant damage and making recovery less difficult. This is a significant change from emphasis on response/recover, as there is now a need to balance mitigation and preparedness (i.e. before damage mechanism arrives) with response and recovery.62
A resilient system has the “capability to create foresight; to recognize, anticipate, and defend against [hazards/threats/disruptions]… before adverse consequences occur.” These capabilities have the effect of preventing, as well as minimizing, and recovering from adverse consequences. Indeed, resilience needs to encompass all four missions of
59 Lewis J. Perelman, “Shifting Security Paradigms: Towards Resilience” in George Mason University School of Law. “Critical thinking: Moving from Infrastructure Protection to Infrastructure Resilience.” CIP Program Discussion Paper Series, February 2007, 28. 60 C.S. Holling, “Article 3- The Resilience of Terrestrial Ecosystems” in Lance Gunderson et. al, Foundations of Ecological Resilience (Island Press: Washington, 2010) and C.S. Holling, “Article 1- Resilience and Stability of Ecological Systems” in Lance Gunderson et. al, Foundations of Ecological Resilience (Island Press: Washington, 2010), 75-76. 61 Jamais Cascio, “The Next Big Thing: Resilience.” Foreign Policy, vol. 88, no. 3 (May/June 2009), 2. 62 Department of Homeland Security. Quadrennial Homeland Security Review, 31.

Risk and Resilience: Exploring the Relationship
A‐20
prevent, protect, respond, recover – with the “prevent” mission actively seeking to avoid or attenuate a hazard prior to the event.63
Recovery Level
This deals with the issue of the level of functioning to which a system returns after experiencing a disruption. The “default” assumption is that the system returns to its pre-event level, but it could return to a better or worse position, depending upon what is feasible and/or possible. In certain cases, it seems logical that a system might return to a lower level of functioning then pre-event – if not out of choice (e.g., circumstances changed and the prior level is now too high for what the system does in a post event environment), than out of necessity (e.g., resources are limited and/or needs might have diminished in aftermath of major event). On the other hand, under certain conditions, the system might return to a higher and more effective level of functioning then before the event occurred. Examples of this not-so-evident construct include:
The capacity of a society to prepare itself, to contain and affectively manage major crises, to react in accordance with their severity and magnitude, and to 'bounce back' from this event expeditiously to an enhanced level functioning.64
The capacity of a system, community or society, potentially exposed to hazards, to adapt, by resisting or changing, in order to reach and maintain an acceptable and continually improving level of functioning and structure.65
Community resilience is defined as the community’s inherent capacity, hope, and faith to withstand major trauma, overcome adversity, and to prevail, with increased resources, competence, and connectedness.66
Infrastructure Domain Resilience
Resilience applied to physical systems, such as critical infrastructure and key assets, may be more realizable than incorporating resilience in the context of the other, more complex and less easily definable contexts, such as social units.
Critical Infrastructure Resilience (CIR) should be sought, not as a replacement for Crucial Infrastructure Protection (CIP), but as an integrating, quantitative objective designed to foster systems-level investment strategies. Stated another way, “infrastructure protection and resilience are complementary but distinctive concepts. Strengthening resilience policies and strategies builds on the successes of the infrastructure protection efforts.” 67
63 Yacov Haimes, On the Definition of Resilience in Systems Risk Analysis, (Volume 29, Number 4, 2009), 498, and Stephen Flynn, “Resilience,” Briefing presented to HSI, April 26, 2010. 64 Meir Elran, “Disaster Management Strategy: A Comparative Study The Israeli Case” (Working Paper), 10. 65 Ibid. 66 Judith Landau, “Enhancing Resilience: Families and Communities as Agents for Change,” Family Process, (Volume 46, Number 3, 2007), 352. 67 Homeland Security Advisory Council, Report of the Critical Infrastructure Task Force. Department of Homeland Security, Quadrennial Homeland Security Review, National Infrastructure Advisory Council, Critical Infrastructure Resilience: Final Report and Recommendation, James Carafano, Risk and Resiliency: Developing the Right Homeland Security Public Policies for the Post-Bush Era and George Mason University School of Law, “Critical
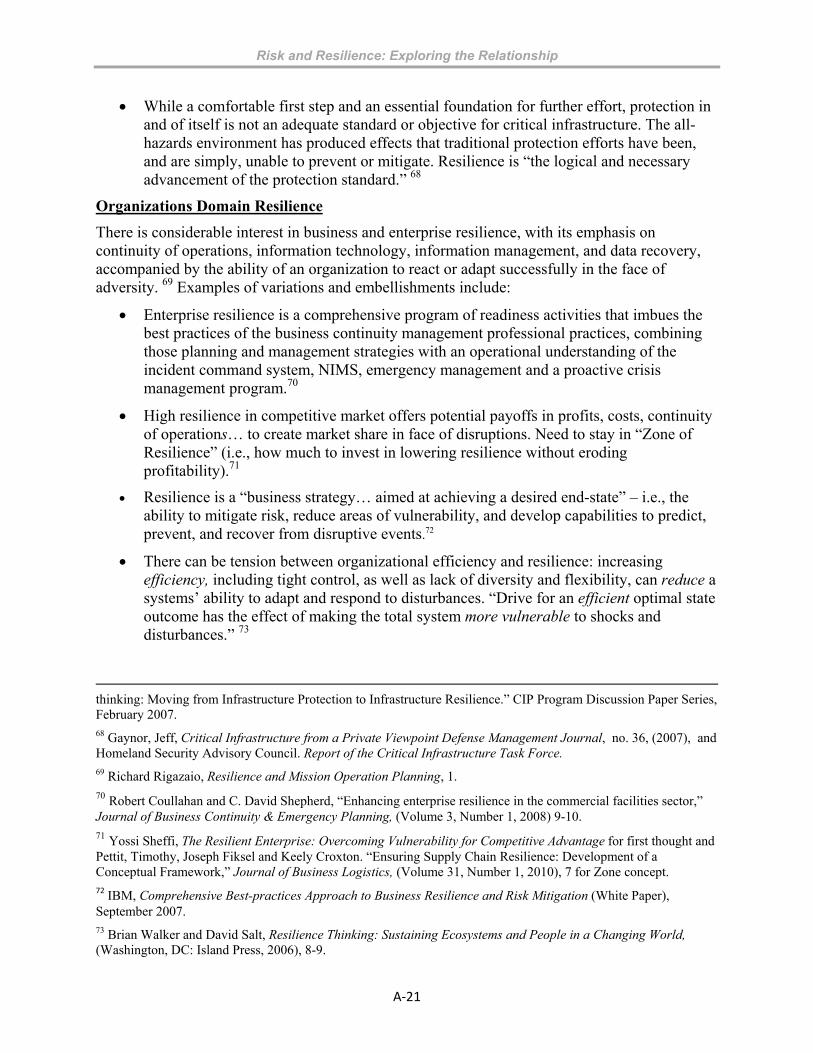
Risk and Resilience: Exploring the Relationship
A‐21
While a comfortable first step and an essential foundation for further effort, protection in and of itself is not an adequate standard or objective for critical infrastructure. The all-hazards environment has produced effects that traditional protection efforts have been, and are simply, unable to prevent or mitigate. Resilience is “the logical and necessary advancement of the protection standard.” 68
Organizations Domain Resilience
There is considerable interest in business and enterprise resilience, with its emphasis on continuity of operations, information technology, information management, and data recovery, accompanied by the ability of an organization to react or adapt successfully in the face of adversity. 69 Examples of variations and embellishments include:
Enterprise resilience is a comprehensive program of readiness activities that imbues the best practices of the business continuity management professional practices, combining those planning and management strategies with an operational understanding of the incident command system, NIMS, emergency management and a proactive crisis management program.70
High resilience in competitive market offers potential payoffs in profits, costs, continuity of operations… to create market share in face of disruptions. Need to stay in “Zone of Resilience” (i.e., how much to invest in lowering resilience without eroding profitability).71
Resilience is a “business strategy… aimed at achieving a desired end-state” – i.e., the ability to mitigate risk, reduce areas of vulnerability, and develop capabilities to predict, prevent, and recover from disruptive events.72
There can be tension between organizational efficiency and resilience: increasing efficiency, including tight control, as well as lack of diversity and flexibility, can reduce a systems’ ability to adapt and respond to disturbances. “Drive for an efficient optimal state outcome has the effect of making the total system more vulnerable to shocks and disturbances.” 73
thinking: Moving from Infrastructure Protection to Infrastructure Resilience.” CIP Program Discussion Paper Series, February 2007. 68 Gaynor, Jeff, Critical Infrastructure from a Private Viewpoint Defense Management Journal, no. 36, (2007), and Homeland Security Advisory Council. Report of the Critical Infrastructure Task Force. 69 Richard Rigazaio, Resilience and Mission Operation Planning, 1. 70 Robert Coullahan and C. David Shepherd, “Enhancing enterprise resilience in the commercial facilities sector,” Journal of Business Continuity & Emergency Planning, (Volume 3, Number 1, 2008) 9-10. 71 Yossi Sheffi, The Resilient Enterprise: Overcoming Vulnerability for Competitive Advantage for first thought and Pettit, Timothy, Joseph Fiksel and Keely Croxton. “Ensuring Supply Chain Resilience: Development of a Conceptual Framework,” Journal of Business Logistics, (Volume 31, Number 1, 2010), 7 for Zone concept. 72 IBM, Comprehensive Best-practices Approach to Business Resilience and Risk Mitigation (White Paper), September 2007. 73 Brian Walker and David Salt, Resilience Thinking: Sustaining Ecosystems and People in a Changing World, (Washington, DC: Island Press, 2006), 8-9.
Risk and Resilience: Exploring the Relationship
A‐22
Communities Domain Resilience
Communities resilience is the most complex to define and attain, entailing a mixture of interrelated individuals and societal elements, as well as communities-relevant infrastructures as well as economic and commercial ventures, which need to be made resilient in a consistent and synergistic manner. Examples of how resilience is addressed for communities include:
A resilient communities is one that is not only prepared to help prevent or minimize the loss or damage to life, property and the environment, but also [one with] the ability to quickly return citizens to work, reopen businesses, and restore other essential services needed for a full and swift economic recovery. More precisely, resilient communities can: absorb stress or destructive forces through resistance or adaptation; maintain basic functions and structures during disastrous events; recover or “bounce back” after an event; and experience minimum disruption to life and economy after a hazard event has passed.74
Resilience is the process and outcome of successfully adapting to difficult or challenging life experiences, especially highly stressful or traumatic events. It is an interactive product of beliefs, attitudes, approaches, behaviors, and, perhaps, physiology that help people fare better during adversity and recover more quickly following it. Resilient people bend rather than break during stressful conditions, and return to their previous level of psychological and social functioning following misfortune (some may even thrive from the experience.75
“Involvement by businesses, in communities’ resilience will help to shorten recovery time for the communities” and ….communities resilience “will help business withstand the effects of a major regional or national emergency and limit the time and extent of longer-term business disruption.” 76
Ecosystems Domain Resilience
A unique aspect of a resilient ecosystem is its capacity, after receiving a disruption, to adapt and change to different configurations within its inherent “state of being,” in an attempt to avoid being transformed into an entirely different state. Such a drastic state change, depending upon many factors, might not always reflect a negative outcome, but might be a positive result from a natural and/or human perspective. This notion can be applied in limited ways to communities and organizations, in circumstances where economic or disaster disruptions so impact a system that it cannot retain its essence and transforms into a new type of communities or different form of business. Examples of this construct include:
A resilient ecosystems system seeks system survival, without moving to other new qualitatively different stable states outside its home regime. Given the characteristics of
74 Louisiana Governor’s Office of Homeland Security and Emergency Preparedness (GOHSEP), “GOHSEP State and Community Resilience Guidance,” (April 2010), 4. 75 Homeland Security Institute, Public Role and Engagement in Counterterrorism Efforts: Implications of Israeli Practices for the U.S., April 2, 2009. Prepared for the Department of Homeland Security, Office of Science and Technology, 8. 76 John Collicutt, “Community resilience: The future of business continuity” Journal of Business Continuity & Emergency Planning, (Volume 3 Number 2, 2008), 145.

Risk and Resilience: Exploring the Relationship
A‐23
living environments, resilient ecosystems can adapt and move to a different stable state within its home regime, if necessary for survival. Ecosystems resilience focuses on system persistence, change, unpredictability, and maintaining existence of function during/after event.77
Multiple stable states exist in nature, so ecosystems can have multi-stable states within their “regimes of behavior.” When responding to disruptions, an ecosystems seek to maintain existence of its fundamental function, if necessary by “flipping” into one of a number of possible different states within its “regime of behavior” and avoiding moving into a fundamentally and qualitatively different state (e.g., morphs to become different types of marshes, but seeks to avoid becoming an empty lot).78
Resilience is the ability of system to maintain its structure/patterns of behavior in face of man-induced or natural disturbances via adaptive, variable, dynamic “succession” processes that provide ability to recover to many different stable structures in its “region of functioning.” 79
77 L.H. Gunderson, , C.S. Holling, and G.D. Peterson. “Resilience in Ecological Systems” in Handbook of Ecosystem Theories and Management, ed. Felix Muller, (CRC Press, 2000), 386. 78 C.S. Holling, “Article 2- Engineering Resilience versus Ecological Resilience,” in Lance Gunderson et. al, Foundations of Ecological Resilience (Island Press: Washington, 2010), 75- 76, 78, 80-82, 97- 98, 107. The example of the empty lot is original to the authors. 79 C.S. Holling, “Article 3- The Resilience of Terrestrial Ecosystems,” in Lance Gunderson et. al, Foundations of Ecological Resilience (Island Press: Washington, 2010), 75- 76, 78, 80-82, 97- 98, 107.

Risk and Resilience: Exploring the Relationship
A‐24

Risk and Resilience: Exploring the Relationship
A‐25
Annex to Appendix A Key Discriminators for Resilience Definitions
Key Discriminators
Options
Goal: What is trying to be achieved through resilience initiatives, programs, etc.?
Maintain Continuity of Function
• Retaining same level of system functionality, or, if not possible, retaining at least minimally acceptable level of critical functioning, regardless of rate of degradation.
• Minimally acceptable level is lowest level at which critical, essential operations are preserved. This level and critical operations must be predefined by responsible entity.
Graceful Degradation • System functionality
degrades slowly over time in response to event
• No precipitous drop in level of function
• Includes concept of “bend but not break”
• Independent of level to which this degradation falls (e.g. could fall below minimally acceptable level)
Maintain Continuity of Function AND
Graceful Degradation
Recovery of Function to Desired Level in Designated Time
• Recover desired level of system functioning in predetermined timeframe.
• Typically, restore system to full pre-event level of functioning if desired and feasible
• Might restore system to less than full pre-event level, preferably above minimally acceptable level of operation. • Might discover new approaches to return system to even higher than pre-event level of functioning
• Could emphasize time to recover to the minimum acceptable level, if system had fallen below this level.
Maintain Continuity of
Function AND
Recovery of Function in Designated
Time
Recovery of Function in Designated Time AND Graceful
Degradation
Maintain Continuity of Function AND Recovery of Function in Designated Time AND Graceful
Degradation
Inhibit Basic State Change with Combinations of Other Goals
• Make it difficult for system hit by disruption(s) from transitioning into entirely different state, if inhibition fails
• System is NOT resilient when it changes its basic state (i.e. its intrinsic nature) and crosses over a minimally acceptable critical threshold into a new kind of system functionality.
• Outside intervention could help prevent state change, but can also accept its inevitability and therefore facilitate it.
Event Cycle: Which period(s) in event cycle does the system need to be resilient in meeting certain objectives, as defined below?
Before/During Event • Resist and Absorb
During Event • Absorb
• Also, relevant in the immediate aftermath of an event, when systems are still experiencing significant degradation.
• Lasts until significant damage from event is no longer occurring.
During/Post Event • Absorb and recover
Post Event • Recover • No further significant damage
is occurring. • Effects of disruption are still
present
All Stages in Event Life-Cycle • Resist, absorb, recover
Approach: How to achieve resilience?
Outcome Based • Focuses on one or more fixed end states/set of stable objectives, such
as “resist, absorb, and recover”. • Resist- To thwart, redirect, or reduce/attenuate potential impact of
threat/hazard /disruption on a system through pre-event actions (not only planning). Other related phrases include prevent, pre-event mitigation, and “withstand” in part via pre-event activities.
• Absorb- To “take a hit” but maintain at least minimal essential (i.e.critical) functions while experiencing a damage causing event andin immediate aftermath. Other related phrases include withstand during impact, handle.
• Recover- To regain key functions after a damage-causing event. Other related phrases include restore, reestablish, reconstitute. Can return to pre-event level of functioning or lesser or greater levels, depending on requirements, preferences, resources.
A system reaches a specified resilient end state/objective by incorporating appropriate features of resilience (e.g., robustness, redundancy, diversity, etc) through practical ways and means (policies, procedures, programs).
Process Based • Dynamic processes that recognize evolving nature of hazards, systems,
and contexts for maintaining and enhancing resilience while anticipating and experiencing an event and also to be better positioned for the future.
• Can have objectives/end-states as benchmarks along the way, but not fixed or stable….they are revisited and revised over time as appropriate.
• Elements of this approach include: • Being flexible/resourceful/adaptable (adjust to new situations). • Having a resilient culture. • Training and practicing in advance to be prepared to be resilient. • Learning from experience (be more resilient next time)
Combination • Both process and outcome-based

Risk and Resilience: Exploring the Relationship
A‐26

Risk and Resilience: Exploring the Relationship
B‐1
Appendix B Measuring Resilience
Purpose and Overview
To make meaningful the definition of resilience requires an understanding of how to measure resilience.80 As in the case of definitions, the question of how resilience can be measured has also been addressed by a relatively large number of sources offering a wide variety of approaches, with a comparable lack of agreement on this issue as well.81
Our approach is to develop a relatively small set of synthesized measures to be paired with the set of consolidated resilience definitions in appendix A. Our objective is for these synthesized measures, as their companion definitions, to be scalable and generally applicable to broad classes of systems operating within a given domain – with appropriate tailoring to reflect specific systems and situations of concern to a variety of stakeholders.
Analysis of Resilience Measures During the research phase of the study, we identified 119 relevant source entries, all of which contained summaries of different resilience definitions. Of these, 65 also provided information on resilience measures.82 Many of these sources offered more than one measure, resulting in 341 separate candidate resilience measures. These were organized by their dominant resilience domain: infrastructure, organizations; communities; or ecosystems.
Establish Relevance of Candidate Measures
To establish relevance, each of the candidate measures was reviewed to determine whether it can be associated with the approach we followed in developing the consolidated resilience definitions, as discussed in appendix A. Although three key discriminators were developed for the definitions analysis, only goal, with its four discrete options, is relevant to our measures analysis. These options are: maintain continuity of function; graceful degradation; recovery of function to desired level in designated time; and inhibit state change (with other options)
80 A measure is any characteristic of a real system (e.g. a quality, dimension, or behavior) that we can look at to help describe or explain how or why it is resilient. Measures alone, however, are insufficient for description and explanation, as metrics are also needed to give a sense of the degree of scope, scale, strength, or duration in association with measures. Metrics are highly system and situation specific, and inherently unit-based. They can be either quantitative (e.g. meters of concrete, liters of water, hours to accomplish a task, kilos of steel, dollars of cost for a particular item) or qualitative (e.g. a heuristic scale such as high, medium, or low, for measuring any specific type of resilience effect). 81 In a recent report addressing how DHS is ensuring that resilience is incorporated into infrastructure systems, the GAO recommended that Homeland Security officials “develop performance measures to assess the extent to which asset owners and operators are taking actions to resolve resiliency gaps identified during the various vulnerability assessments.” In response, the Department (NPPD/IP) noted that efforts towards this end have already been initiated, with new performance metrics under review. U.S. Government Accountability Office, Critical Infrastructure Protection: DHS Efforts to Assess and Promote Resiliency are Evolving but Program Management Could be Strengthened. Washington, DC, September 2010, 32, 34. 82 The few sources that offered measures without a definition were not judged to be of value for our analysis.
Risk and Resilience: Exploring the Relationship
B‐2
If a given measure addresses one of these four discrete options, this is a necessary, if not sufficient, condition for that measure to ultimately contribute to the development of a set of synthesized resilience measures. Measures for discrete options can be combined to support definitions that contain combined options. Measures supporting a particular goal can potentially support all definitions that reflect this element within a given domain, even if these definitions differ in event stage and approach.
As it turned out, all of the 341 candidate resilience measures passed the relevance test. These were then divided into groups of measures as a function of goal options and domain.
Evaluate Against Analytic Utility Criteria
We judged the large number of candidate measures remaining after the relevance test as far too unwieldy for the purposes of forming a relatively small number of synthesized measures. To distill these measures down to a manageable number, we applied a set of Analytic Utility Criteria as filters to exclude from further consideration those candidate resilience measures that are not analytically useful for the purpose of operationalizing resilience definitions.
Is the measure a measure of effectiveness rather than a measure of performance? Both measures of effectiveness (MoEs) and measures of performance (MoPs) are traditional measures of merit useful in a wide variety of applications for scientific investigation or managerial evaluation and assessment. For this study, however, MoEs with associated metrics are what is needed, as we strive to identifying measures that can be linked to resilience definitions in order to help make them operational.83
Is the measure readily apparent to a reasonably informed observer with a basic understanding of resilience? In our research we encountered a wide variety of treatments of the topic of resilience measures that address a broad number of different areas of inquiry across a number of different disciplines. The concepts and technical vocabulary associated with the term resilience in these sources are equally varied. For the purposes of this study, we sought to find proposed measures of resilience that were relatively broad-gauged and readily clear to a variety of stakeholders, reflecting a well-informed understanding of current resilience and systems measurement concepts, and exclude those that presented highly specialized and technical approaches.
What is the measure’s analytic perspective? It was necessary for us to determine whether a measure embraced a quantitative or qualitative perspective. This represented a factor to consider in seeking to link a suggested resilience measure to one or more definitions. Understanding a measure’s analytic perspective was also critical to our ability to sort and combine similar measures to develop synthesized resilience measures. In applying this criterion, we asked two refining questions.
83 Measures of Effectiveness (MOEs) are used to assess a system’s effectiveness in the accomplishment of a task. Measures of Performance (MOPs) are used to gauge system or system component capabilities or characteristics. See Department of Defense, Recommended VV&A guide http://vva.msco.mil/Special_Topics/measures/default.htm Oct 19, 2010. In our research, we found that with regard to resilience, MoPs tend to be formulated to gauge the quantity or quality of discrete low level activities or behaviors that are narrowly relevant to very specific types of systems (e.g. hydro-electric dams, investment banking firms, government law enforcement agencies, traditional nuclear families, small towns, or coastal marshlands). Unlike MoPs, which tend to measure outputs of processes without judging relevance to meeting objective, MoEs seek to evaluate higher level outcomes that meet a set of objectives – in our case, how well a measure supports a consolidated resilience measure.
Risk and Resilience: Exploring the Relationship
B‐3
If the measure is quantitative, is it unit-based and reproducible? For a quantitative measure to be useful, it needs to explicitly or implicitly focus on some countable unit, or metric, that reflects the relative size, scope, or strength of some relevant characteristic of the system being evaluated. Furthermore, for quantitative resilience measure to have analytic utility it should be reasonably clear that it can be applied to the same measurement task multiple times and generate consistent answers. Quantitative measures and metrics that are not repeatable are assumed to be unreliable.84
If the measure is qualitative, is it heuristic and traceable? Qualitative measure and associate metrics are valuable in assessing outcomes and outputs generated by systems whose structure and internal relationships are not well characterized and cannot be easily quantifiable. In these cases, it is necessary to have an experience or judgment-based set of rules for sorting, filtering, or screening the qualitative data collected about system outputs and outcomes into meaningful categories. These are called “heuristic rules,” or simply “heuristics.” 85 The traceability of an explicit or implied qualitative approach needs to be established, with the method for formulating and applying the heuristic-based measures well documented and relatively free of bias or distortion. 86
Does the measure appear to be generalizable? As indicated above, MoEs with associated metrics generally provide the best fit with our study’s purpose. However, in our research, we found some MoEs address narrowly-defined outcomes or outputs for very specific types of systems.87 These MoEs are of minimal analytic utility in developing synthesized measures that can be meaningfully linked to the consolidated definitions we have derived. On this basis, we exclude highly specialized measures from further consideration. We seek measures that can be applied, with tailoring as needed, at least across overall domain(s) of the consolidated definition (s) they support, if not crossing domains. Tailoring will particularly need to focus on the metrics used in combination with measures. This is necessary because metrics (specific units of measurement) can be difficult to generalize, being often closely connected to the specific context where the measure is applied.
84 “Repeatability,” the term we use here, addresses the degree of conformity between repeated measurements obtained under comparable conditions. “Reproducibility” is the value below which the difference between two single test results, obtained under different conditions, may be expected to lie with a specified probability. See British Standards Institution. Precision of test methods, part 1: guide for the determination of repeatability and reproducibility for a standard test method. BS 5497, Part 1. London: BSI, 1979. 85 See James P. Ignazio, Introduction to Expert Systems: The Development and Implementation of Rule-Based Expert Systems, (McGraw-Hill, Inc.: New York, New York, 1991). 29. 86 “Traceability” means that, if other analysts apply the assumptions, constraints, and approach used by the authors of this report, they would understand, for example, how and why the results were developed and judge this logic to be understandable, even if they might not share the same assumptions or reach the same results. 87 See Lynn Goldman, “Resilience in the Face of Pandemics,” at https://www.orau.gov/DHSsummit/materials.htm.
Risk and Resilience: Exploring the Relationship
B‐4
Results of Applying Analytic Utility Criteria
As a result of applying the filtering criteria described above, 62 of the previously identified 341 measures remained for consideration in our analysis.88 Following are observations gleaned from the results of this filtering process – first dealing with the breakdown by goal and domain, and then addressing the balance between quantitative and qualitative measures.
By Goal and Domain:
Continuity of Function. Measuring this goal option is significant for systems in the infrastructure, organizations, and communities domains. Continued functioning of a system, while experiencing a disturbance and in the immediate aftermath – especially those functions judged to be critical – is the one of the highest objectives of resilience for systems in these domains. The relatively low number of measures supporting this option in the ecosystems domain suggests that systems in this category are either more adaptable than those in the other domains or better suited to tolerating failure for extended periods, an issue worth exploring in terms of potential applicability to systems in other domains.
Graceful Degradation. Measuring this goal option is important for infrastructure system resilience, but less so for systems in the organizations and communities domains. Measures for this goal are absent for ecosystems. These observations suggest opportunities for those examining the resilience of organizations and communities to conduct additional research on how the impacts of unavoidable threats or hazards n on systems in those domains may be effectively managed until responding entities reach the scene of disaster with additional resources to apply to mitigation efforts.
Recover to Designated Level of Function in Desired Time: Measuring this goal option is also a vital resilience objective for infrastructure, organizations and communities systems. This is consistent with the emphasis placed on graceful degradation across these domains in the following sense: if maintaining performance of critical functions above a minimum level is of central importance, then, if this fails to occur, the situation needs to be remedied swiftly. The absence of ecosystem resilience measures for this goal might be explained by the inherent complexity and dynamic nature of this domain, which make designated levels of functioning and identification of stable recovery alternatives difficult to calculate.
Inhibiting State Change (with other options). This goal option, as noted earlier, is different in kind from the other goals. Only in the ecosystems domain did we find measures embracing this goal to be strongly represented. This is not surprising, as ecosystems are composed of complex interwoven webs of living species, inert matter, energy, natural resources, and environmental conditions, which are inherently multi-dimensional and highly adaptable. Some measures to support state change definitions were found for systems in the communities and infrastructure domains, but none were found for systems in the organizations domain. A productive area of investigation would be to closely assess the applicability of the state change constructs to domains other than ecosystems.
88 The number of entries in which we identified these measures was 28, reduced from the previous 62 that had at least one measure that passed the goal relevance test.

Risk and Resilience: Exploring the Relationship
B‐5
By Analytic Type
Quantitative Measurement. Across all goals and all domains, measures embracing the quantitative analytic perspective appear to be the most frequent. Common quantitative units of measurement include time, system-dependent outputs and outcomes, and dollars. This makes sense, as decision makers across domains, seeking to set priorities and allocate resources, tend to place high value on the use of quantitative data to support their judgments. In this regard, the most sophisticated quantitative measurement approaches we found addressed types of systems for which framing decisions is likely to be challenging due to complex interdependencies and the stakes involved in decision making are likely to be high.
Qualitative Measurement. Overall, we found far fewer qualitative measures than quantitative ones. This can be explained by the fact that many qualitative measures did not meet our analytic utility criteria and those that did vary widely in level of sophistication. Application of many qualitative measures uses heuristic techniques that require subjective judgments about complex, technical matters. Given that interest in the topic of homeland security resilience has only recently grown to high levels, we might expect to see wider interest in applying more rigorously structured qualitative measurement approaches as an initial research step in addressing resilience problems that may not be very well characterized, and lack credible data. In such cases, quantitative measurement approaches might be reserved for later efforts when feasible quantifiable methods might be relevant.
Development of Synthesized Resilience Measures
The 62 measures that survived the initial filtering process still represented too large a number to be useful for our purpose. To achieve the goal of developing a relatively small and workable set of basic resilience measures that could be aligned with our consolidated definitions, it became clear that further distillation would be required.
To this end, we applied the following four step distillation process to each of the 62 measures that passed through the previous analytic filters:
Group similar measures within domains. With analytically unsatisfactory measures excluded, the surviving measures are grouped as an initial step leading to the development of a set of meaningful synthesized resilience measures and associated metrics. To occupy the same group, individual entry measures must (1) fall within the same domain; (2) connect to the same measurable resilience definition element (i.e., goals); and (3) reflect the same essential analytic perspective, quantitative and/or qualitative.
Choose “exemplar” measures within established groups. Within groups, we next identified those measures that have a high degree of maturity. By this we meant they were judged to have met our analytic utility criteria particularly well. Little or no inference or interpolation was required on the analysts’ part to identify these as understandable and reasonable MoEs – whether unit-based and repeatable if quantitative, or heuristic and traceable if qualitative. Furthermore, these measures were also readily generalizable to a variety of systems in their respective domains. Measures with these mature and relevant characteristics were labeled as “exemplars.”
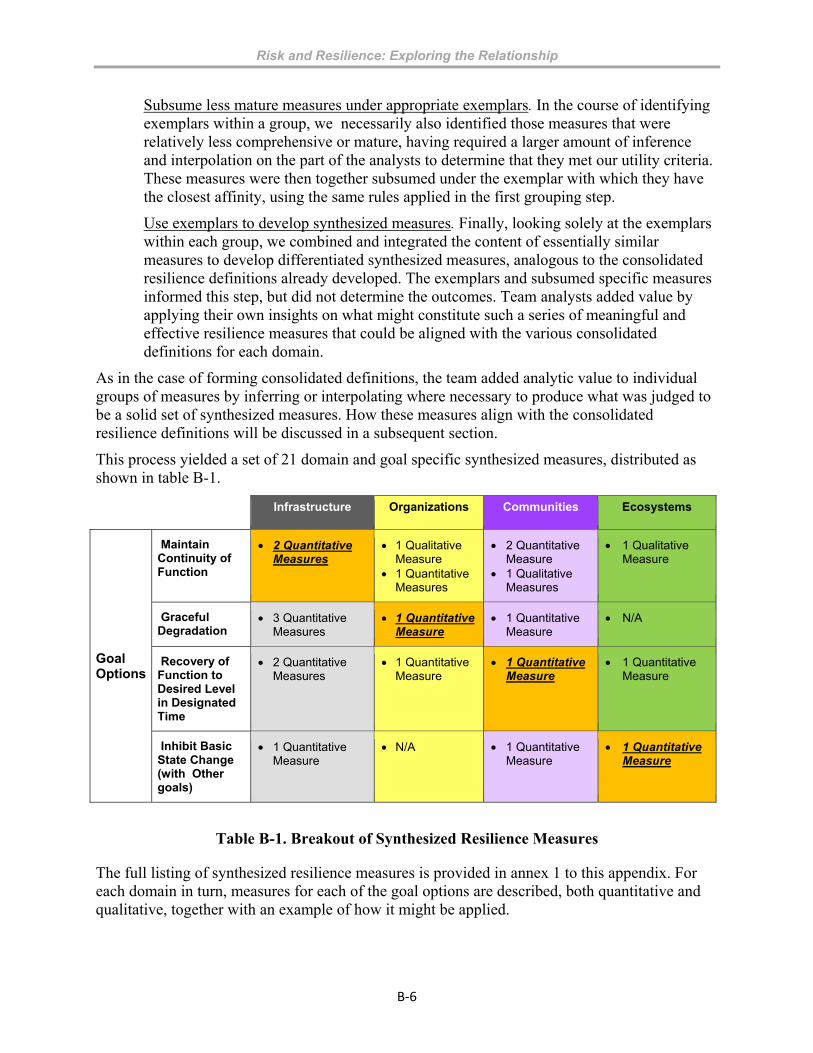
Risk and Resilience: Exploring the Relationship
B‐6
Subsume less mature measures under appropriate exemplars. In the course of identifying exemplars within a group, we necessarily also identified those measures that were relatively less comprehensive or mature, having required a larger amount of inference and interpolation on the part of the analysts to determine that they met our utility criteria. These measures were then together subsumed under the exemplar with which they have the closest affinity, using the same rules applied in the first grouping step.
Use exemplars to develop synthesized measures. Finally, looking solely at the exemplars within each group, we combined and integrated the content of essentially similar measures to develop differentiated synthesized measures, analogous to the consolidated resilience definitions already developed. The exemplars and subsumed specific measures informed this step, but did not determine the outcomes. Team analysts added value by applying their own insights on what might constitute such a series of meaningful and effective resilience measures that could be aligned with the various consolidated definitions for each domain.
As in the case of forming consolidated definitions, the team added analytic value to individual groups of measures by inferring or interpolating where necessary to produce what was judged to be a solid set of synthesized measures. How these measures align with the consolidated resilience definitions will be discussed in a subsequent section.
This process yielded a set of 21 domain and goal specific synthesized measures, distributed as shown in table B-1.
Table B-1. Breakout of Synthesized Resilience Measures
The full listing of synthesized resilience measures is provided in annex 1 to this appendix. For each domain in turn, measures for each of the goal options are described, both quantitative and qualitative, together with an example of how it might be applied.
Infrastructure Organizations Communities Ecosystems
Goal Options
Maintain Continuity of Function
2 Quantitative Measures
1 Qualitative Measure
1 Quantitative Measures
2 Quantitative Measure
1 Qualitative Measures
1 Qualitative Measure
Graceful Degradation
3 Quantitative Measures
1 Quantitative Measure
1 Quantitative Measure
N/A
Recovery of Function to Desired Level in Designated Time
2 Quantitative Measures
1 Quantitative Measure
1 Quantitative Measure
1 Quantitative Measure
Inhibit Basic State Change (with Other goals)
1 Quantitative Measure
N/A 1 Quantitative Measure
1 Quantitative Measure
Risk and Resilience: Exploring the Relationship
B‐7
Alignment of Resilience Measures with Consolidated Definitions
In this analytic phase, we aligned the synthesized measures with the consolidated resilience definitions developed in appendix A. This was done for each domain by linking all measures to the definitions by their goal options. More than one synthesized measure was capable of being aligned with the same definitional goal option in a given domain. Due to the fact that measures are domain specific, definitions spanning more than one domain would typically be associated with different measures for each of its domains.
For each pairing of a definition with one or more measure(s), we presented a practical example covering a range of different types and sizes of systems and problems, together with associated metrics suited for that situation. This was done to stress the following important point: while resilience measures are relatively generalizable and align with a variety of definitions within and across domains, the metrics associated with these measures are closely and often uniquely tied to the specific system and situation. If a user selects a consolidated definition-synthesized measure(s) pair from the results of our analysis, tailored metrics would need to be developed.89
In sum, the combination of consolidated resilience definitions and associated measures for each domain provides a scalable package that can be adapted and applied to address resilience problems across a spectrum of systems and for a variety of stakeholders at all levels.
The complete results of pairing consolidated resilience definitions and synthesized resilience measures can be found in the tables at annex 2 to this appendix. For each domain, these tables present a consolidated definition drawn from that domain (identified by the color of its snake and presented in prose) that is linked with one or more synthesized measures for each of the goal options in that definition. There are also practical examples of how these pairs might be applied, including metrics.
89 It would be helpful if a set of principles and guidelines were established to assist users in developing specific metrics for various classes of systems and situations.

Risk and Resilience: Exploring the Relationship
B‐8
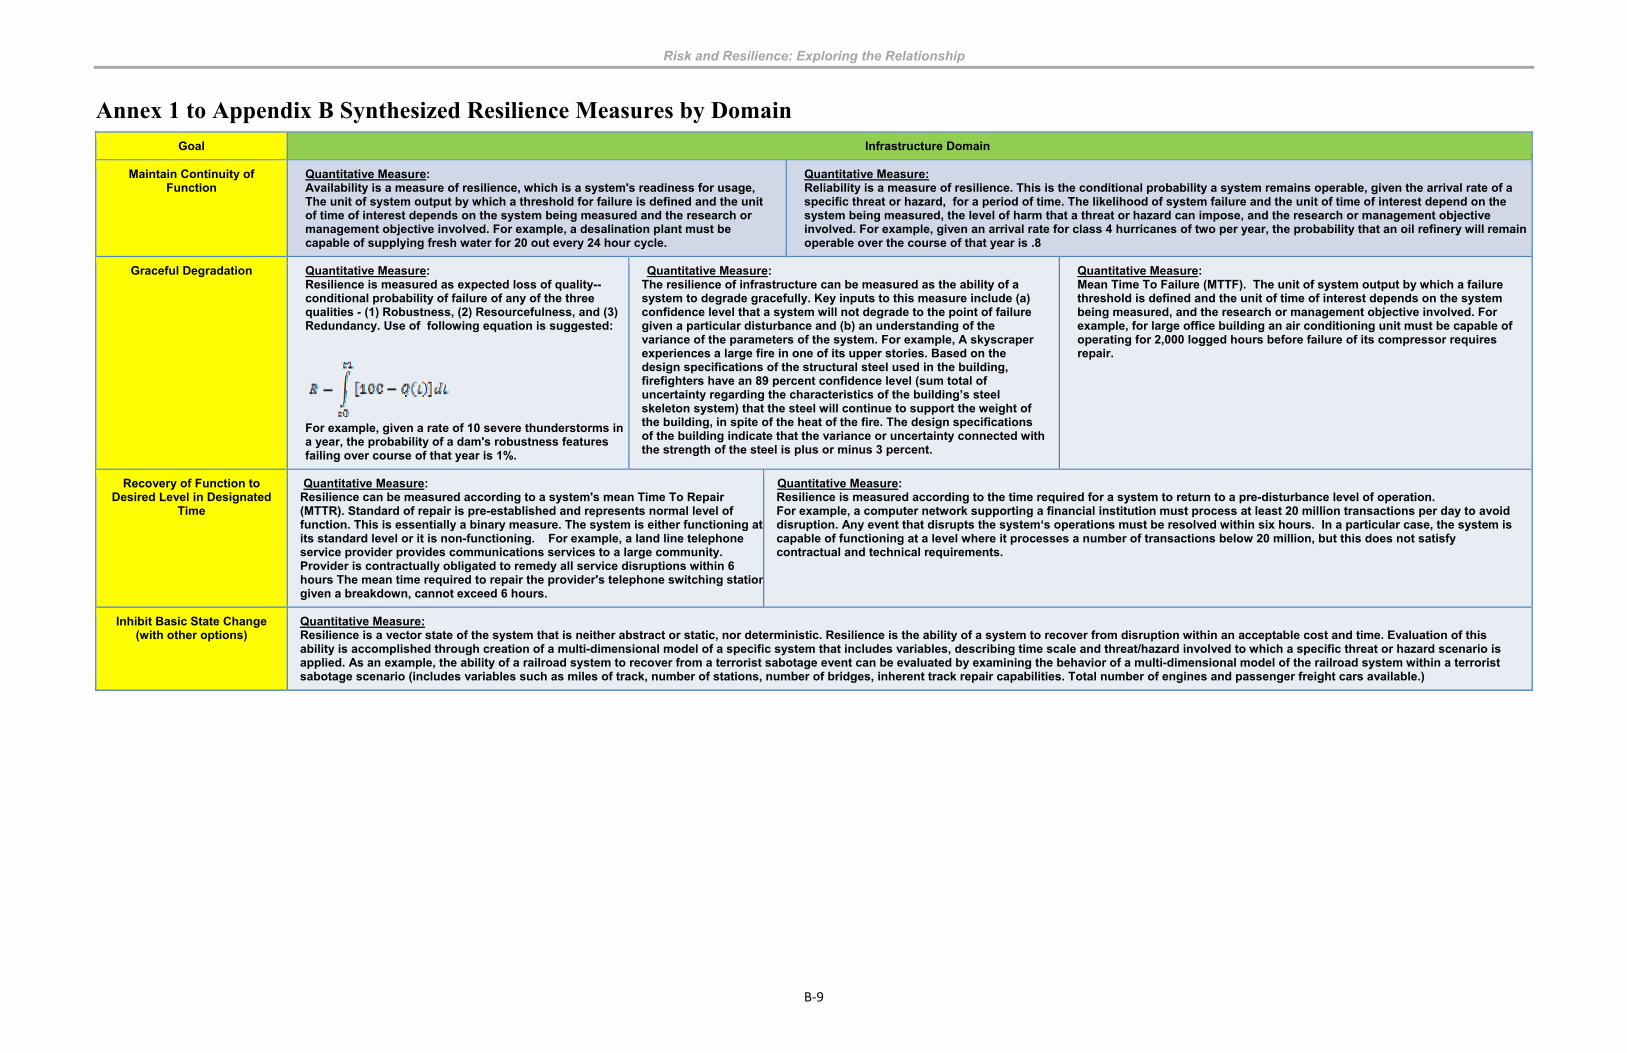
Risk and Resilience: Exploring the Relationship
B‐9
Annex 1 to Appendix B Synthesized Resilience Measures by Domain Goal Infrastructure Domain
Maintain Continuity of Function
Quantitative Measure: Availability is a measure of resilience, which is a system's readiness for usage, The unit of system output by which a threshold for failure is defined and the unit of time of interest depends on the system being measured and the research or management objective involved. For example, a desalination plant must be capable of supplying fresh water for 20 out every 24 hour cycle.
Quantitative Measure:Reliability is a measure of resilience. This is the conditional probability a system remains operable, given the arrival rate of a specific threat or hazard, for a period of time. The likelihood of system failure and the unit of time of interest depend on the system being measured, the level of harm that a threat or hazard can impose, and the research or management objective involved. For example, given an arrival rate for class 4 hurricanes of two per year, the probability that an oil refinery will remain operable over the course of that year is .8
Graceful Degradation
Quantitative Measure: Resilience is measured as expected loss of quality-- conditional probability of failure of any of the three qualities - (1) Robustness, (2) Resourcefulness, and (3) Redundancy. Use of following equation is suggested:
For example, given a rate of 10 severe thunderstorms in a year, the probability of a dam's robustness features failing over course of that year is 1%.
Quantitative Measure:The resilience of infrastructure can be measured as the ability of a system to degrade gracefully. Key inputs to this measure include (a) confidence level that a system will not degrade to the point of failure given a particular disturbance and (b) an understanding of the variance of the parameters of the system. For example, A skyscraper experiences a large fire in one of its upper stories. Based on the design specifications of the structural steel used in the building, firefighters have an 89 percent confidence level (sum total of uncertainty regarding the characteristics of the building’s steel skeleton system) that the steel will continue to support the weight of the building, in spite of the heat of the fire. The design specifications of the building indicate that the variance or uncertainty connected with the strength of the steel is plus or minus 3 percent.
Quantitative Measure: Mean Time To Failure (MTTF). The unit of system output by which a failure threshold is defined and the unit of time of interest depends on the system being measured, and the research or management objective involved. For example, for large office building an air conditioning unit must be capable of operating for 2,000 logged hours before failure of its compressor requires repair.
Recovery of Function to Desired Level in Designated
Time
Quantitative Measure: Resilience can be measured according to a system's mean Time To Repair (MTTR). Standard of repair is pre-established and represents normal level of function. This is essentially a binary measure. The system is either functioning at its standard level or it is non-functioning. For example, a land line telephone service provider provides communications services to a large community. Provider is contractually obligated to remedy all service disruptions within 6 hours The mean time required to repair the provider's telephone switching stationgiven a breakdown, cannot exceed 6 hours.
Quantitative Measure:Resilience is measured according to the time required for a system to return to a pre-disturbance level of operation. For example, a computer network supporting a financial institution must process at least 20 million transactions per day to avoid disruption. Any event that disrupts the system‘s operations must be resolved within six hours. In a particular case, the system is capable of functioning at a level where it processes a number of transactions below 20 million, but this does not satisfy contractual and technical requirements.
Inhibit Basic State Change (with other options)
Quantitative Measure: Resilience is a vector state of the system that is neither abstract or static, nor deterministic. Resilience is the ability of a system to recover from disruption within an acceptable cost and time. Evaluation of this ability is accomplished through creation of a multi-dimensional model of a specific system that includes variables, describing time scale and threat/hazard involved to which a specific threat or hazard scenario is applied. As an example, the ability of a railroad system to recover from a terrorist sabotage event can be evaluated by examining the behavior of a multi-dimensional model of the railroad system within a terrorist sabotage scenario (includes variables such as miles of track, number of stations, number of bridges, inherent track repair capabilities. Total number of engines and passenger freight cars available.)

Risk and Resilience: Exploring the Relationship
B‐10
Goal Organizations Domain
Maintain Continuity of Function
Qualitative Measure: • A key measure of institutional resilience effectiveness [MoE] is the survival of the system. Survival means that the system (private industry or government organization) continues to function at some level regardless of the stressors encountered and does not go out of existence. This measure can be addressed as a binary judgment (yes or no, the institution continues to exist or it does not). Measures can also be addressed with heuristic metrics that seek to gauge how well a system has survived (e.g., High-Medium-Low or five point Likert Scale). Judgments would need to be rendered by subject matter experts with significant domain knowledge of the system of interest. For example, the government of a state has experienced a large natural disaster and has lost a number of its social services functions but continues to exercise governance because its senior leadership and law enforcement and emergency services functions remain intact.
Quantitative Measure:A key measure of institutional resilience is the ability of systems to maintain productive functions in the face of large disruptions. Two metrics can be applied: the number of and availability of substitute resources that the system can apply to supporting its productivity goals after accounting for losses caused by damage or stress from man-made or natural disruption; and the amount of energy surge capacity (e.g. work or effort) that the system can bring to bear to apply to mitigating the effects of a disruption. For example, a machine tool manufacturing company requires 100 tons of sheet steel and 500 tons of mild steel bars per day to meet its productivity targets. The company's business plan cannot tolerate a break in production for more than 14 days. An earthquake disrupts the company's production operations for ten days and operations of its normal sheet steel and mild steel bar suppliers for four weeks. Having established contingency contracts with alternative sheet steel and mild steel bar suppliers, the company chooses to buy the steel it needs from the supplier best able to meet its demand in the shortest amount of time. To make up production shortfalls, the company draws on its cash reserves to pay its labor force overtime to meet the goals.
Graceful Degradation Quantitative Measure: Resilience of an institution can be measured according to how effective it is in containing degradation after encountering a disruption. Quantitative units for such a measure include time and level of institutional activities/functions in terms of inputs, throughputs, or outputs per unit of time. For example a municipal emergency medical response team's capability standard for responding to calls for service is 8 calls within a 24 hour period. Response to a call must be made within 4 minutes of receipt. Even in a severe city-wide emergency, such as blizzard conditions, the EMR Team's capacity will not reduce by more than 2 calls per 24 hour period and call response time will not grow by more than three minutes per call per 24 hour period.
Recovery of Function to Desired Level in Designated
Time
Quantitative Measure: A key measure of institutional resilience effectiveness [MoE] is the restoration of key system functions within a specified time limit. This means that the system (private industry or government organization) recovers its essential function to a predetermined level of performance within a predetermined time window. For example, a local food service business, such as a delicatessen, is forced by a severe storm to shut down operations. The deli's business plan indicates that operations must resume to at least 50 percent of sales capacity within 24 hours.
Inhibit Basic State Change (with other options)
N/A

Risk and Resilience: Exploring the Relationship
B‐11
Goal Communities Domain
Maintain Continuity of Function
Quantitative Measure: Availability is a measure of resilience, which is a system's readiness for usage. The unit of system output by which a threshold for failure is defined and the unit of time of interest depends on the system being measured and the research or management objective involved. For example, a community must have a birthrate of at least 5,000 live births per year to maintain its population at equilibrium. Dropping below this number produces negative population growth.
Quantitative Measure:Reliability is a measure of resilience. This is the conditional probability a system remains operable, given the arrival rate of a specific threat or hazard, for a period of time. The likelihood of system failure and the unit of time of interest depend on the system being measured, the level of harm that a threat or hazard can impose, and the research or management objective involved. For example, given an arrival rate for earthquakes that are 8 or higher on the Richter Scale of two per year, the probability that a community that is located in an earthquake prone location will continue to engage in normal living activities over the course of that year is .8
Qualitative Measure:Resilience is measured as “capacity of a system to experience disturbance and still maintain functions.” Implied associated metric is a heuristic scale of capacity to absorb disturbance, e.g. HighMedium-Low or five point Likert Scale. Judgments would need to be rendered by subject matter experts with significant domain knowledge of the system of interest. For example, a certain middle class family needs to have a minimum yearly combined income of $80,000 in order to maintain its standard of living. If the same family, when experiencing the effects of an economic recession, seesits income decline from $125,000/year to $90,000 per year, its economic resilience by this measure could (illustratively) be characterized as "Strong" on a five point Likert scale (e.g. 1. Very Strong, 2. Strong, 3. Moderate, 4. Weak, 5. Very Weak)
Graceful Degradation Quantitative Measure: Resilience is measured as expected loss of quality -- conditional probability of failure of any of the three qualities - (1) Robustness, (2) Resourcefulness, and (3) Redundancy. Use of following equation suggested:
. For example, given an arrival rate of 10 terrorist attacks over a year in their community, the probability of a family's resourcefulness capacity failing over the course of that year is 20%.
Recovery of Function to Desired Level in Designated
Time
Quantitative Measure: A key measure of community resilience effectiveness [MoE] is the restoration of key activities/functions within a specified time limit. This means that the community (individuals, families, neighborhoods, cities) recovers its essential function to a predetermined level of performance within a predetermined time window. For example, a local volunteer service organization that provides low-cost meals to the homeless has a strategic objective of providing between 500 and 200 meals a day. Mortality in the local homeless population will begin to spike if the organization's delivery of meals falls below 200 for more than 7 days. Consequently, the organization is resilience if it allows no more than five days of meal service disruption, even in the event of a major disaster.
Inhibit Basic State Change (with other options)
Quantitative Measure: Resilience can be measured as the magnitude of disturbance that can be absorbed before a system changes its structure. Evaluation of this ability is accomplished through creation of a multi-dimensional model of a specific system that includes variables describing its fundamental characteristics, the key influencing factors in its environment, and the characteristics of a specific threat or hazard that can cause a disturbance and a specific time scale for interaction between the system and the threat or hazard. A specific threat scenario is applied to the model to assess its resilience according to the measure described above. As an example, the ability of a community to resist changing its structure in the face of an outbreak of pandemic influenza can be evaluated by examining the behavior of a multi-dimensional model of the community within a pandemic scenario (includes variables such as age demographics, per capita income, access to healthcare providers, availability of antiviral drugs, virulence and transmissibility of the type of influenza involved.)

Risk and Resilience: Exploring the Relationship
B‐12
Goal Ecosystems Domain
Maintain Continuity of Function
Qualitative Measure: Resilience is measured as “capacity of a system to experience disturbance and still maintain functions.” Implied associated metric is a heuristic scale of capacity to absorb disturbance, e.g. High-Medium-Low or five point Likert Scale. Judgments would need to be rendered by subject matter experts with significant domain knowledge of the system of interest. For example, a certain area of wetlands needs to have a minimum average level of health among the species existing at the base of its food chain. If the same wetland area, when experiencing the effects of an toxic waste spill is observed to have dramatically reduced levels of health in samples of animals from the bottom layer of the food chain, then the wetland's resilience by this measure could (illustratively) be characterized as "weak" on a five point Likert scale (e.g. 1. Very Strong, 2. Strong, 3. Moderate, 4. Weak, 5. Very Weak)
Graceful Degradation N/A
Recovery of Function to Desired Level in Designated
Time
Quantitative Measure: Resilience of an eco-system can be measured by the time it takes for a particular to return to a self-sustaining state after experiencing a specific disturbance. Evaluation of this ability is accomplished through creation of a multi-dimensional model of a specific eco-system that includes variables describing its fundamental characteristics, the key influencing factors in its environment, and the characteristics of a specific threat or hazard that can cause a disturbance and a specific time scale for interaction between the system and the threat or hazard. A specific threat or hazard scenario is applied to the model to assess its resilience according to the measure described above. As an example, the ability of a grasslands area that is regularly subjected to burn-over by wildfires, initiated by natural and man-made actions, to return to a condition of ecological equilibrium can be evaluated by examining the behavior of a multi-dimensional model of the grassland system within a wildfire scenario. Model would include variables such as type and number of plant and animal species, local climactic conditions and seasonal weather dynamics, abundance and quality of local fire ignition sources, arrival rate of arson events, arrival rate of lightning strike fire ignition events, availability of wildfire fighting resources, characteristics and dynamics of wildfire events.
Inhibit Basic State Change (with other options)
Quantitative Measure: Resilience can be measured as the magnitude of disturbance that can be absorbed before a system changes its structure. Evaluation of this ability is accomplished through creation of a multi-dimensional model of a specific system that includes variables describing its fundamental characteristics, the key influencing factors in its environment, and the characteristics of a specific threat or hazard that can cause a disturbance and a specific time scale for interaction between the system and the threat or hazard. A specific threat scenario is applied to the model to assess its resilience according to the measure described above. As an example, the ability of an area of coral reef to resist changing its structure in the face of a toxic waste spill can be evaluated by examining the behavior of a multi-dimensional model of the reef within a hazardous materials release scenario. Model would include variables such as type and number of plant and animal species, local air and water temperature conditions, local current and tide dynamics, availability of hazardous materials clean up resources, characteristics of the type of toxic chemicals involved.

Risk and Resilience: Exploring the Relationship
B‐13
Annex 2 to Appendix B Alignment of Resilience Measures to Consolidated Definitions For each of the four domains, the results of pairing consolidated resilience definitions and synthesized resilience measures are presented below as a function of goal options – with examples of applications that include suggested metrics.
Domain
Consolidated Definition
(“Snake” Color and Text)
Measurable Element of Resilience Definition
(Goal)
Corresponding Synthesized Measure
Infrastructure BROWN Resilience is the ability of a system to attain the objectives of resisting, absorbing, and recovering from the impact of an adverse event, before, during, and after its occurrence. It is also a dynamic process that seeks to learn from incidents to strengthen capabilities of the system in meeting future challenges. The goals are to maintain continuity of function, degrading gracefully, and recover system functionality to a pre-designated level, as rapidly as desired and feasible.
Goal Option: Continuity of Function
Availability is a measure of resilience that indicates a system's readiness for use. How long the system must perform and at what level depends on the type of system and its objectives. Example, a desalination plant must be capable of supplying fresh water for 20 out every 24 hour cycle.
Reliability is a measure of resilience. This is the conditional probability a system remains operable, given the arrival rate of a specific threat or hazard, for a period of time. The likelihood of system failure and the unit of time of interest depend on the system being measured, the level of harm that a threat or hazard can impose, and the research or management objective involved. Example, given an arrival rate for class 4 hurricanes of two per year, the probability that an oil refinery will remain operable over the course of that year is .8
Goal Option: Graceful Degradation
Resilience is measured as expected loss of quality. The conditional probability of failure of any of the three qualities - (1) Robustness, (2) Resourcefulness, and (3) Redundancy. Use of the following equation is suggested. Example: given an arrival rate of 10 severe thunderstorms over a year, the probability of adam's robustness features failing over the course of that year is 1%.
The resilience of infrastructure can be measured as the ability of a system to degradegracefully. Key inputs to this measure include (a) confidence level that a system will not degrade to the point of failure given a particular disturbance and (b) an understanding of the variance of the parameters of the system. Example: A skyscraperexperiences a large fire in one of its upper stories. Based on the design specifications of the structural steel used in the building, firefighters have an 89 percent confidence level (sum total of uncertainty regarding the characteristics of the building’s steel skeleton system) that the steel will continue to support the weight of the building, in spite of the heaof the fire. The design specifications of the building indicate that the variance or uncertainty connected with the strength of the steel is plus or minus 3 percent.
Mean Time To Failure (MTTF). The unit of system output by which a failure threshold is defined and the unit of time of interest depends on the system being measured, and the research or management objective involved. Example, for large office building an air conditioning unit must be capable of operating for 2,000 logged hours before failure of its compressor requires repair.
Goal Option: Recovery to Designated Level…
Resilience can be measured according to a system's mean Time To Repair (MTTR). Standard of repair is pre-established and represents normal level of function. This is essentially a binary measure. The system is either functioning at its standard level or it is non-functioning. Example: A land line telephone service provider provides communications services to a large community. Provider is contractually obligated to remedy all service disruptions within 6 hours The mean time required to repair the provider's telephone switching station, given a breakdown, cannot exceed 6 hours.
Resilience is measured according to the time required for a system to return to a pre-disturbance level of operation. Example: a computer network supporting a financial institution must process at least 20 million transactions per day to avoid disruption. Any event that disrupts the system‘s operations must be resolved within six hours. In a particular case, the system is capable of functioning at a level where it processes a number of transactions below 20 million, but this does not satisfy contractual and technical requirements.

Risk and Resilience: Exploring the Relationship
B‐14
Domain
Consolidated Definition
(“Snake” Color and Text)
Measurable Element of Resilience Definition
(Goal)
Corresponding Synthesized Measure
Infrastructure BLUE Resilience is the ability of a system to attain the objectives of absorbing and recovering from the impact of an adverse event, during and after its occurrence. The goals are to maintain continuity of function, degrading gracefully, and recover system functionality to a pre-designated level, as rapidly as desired and feasible.
Goal Option: Continuity of Function
Availability is a measure of resilience that indicates a system's readiness for use. How long the system must perform and at what level depends on the type of system and its objectives. Example, a desalination plant must be capable of supplying fresh water for 20 out every 24 hour cycle.
Reliability is a measure of resilience. This is the conditional probability a system remains operable, given the arrival rate of a specific threat or hazard, for a period of time. The likelihood of system failure and the unit of time of interest depend on the system being measured, the level of harm that a threat or hazard can impose, and the research or management objective involved. Example, given an arrival rate for class 4 hurricanes of two per year, the probability that an oil refinery will remain operable over the course of that year is .8
Goal Option: Graceful Degradation
Resilience is measured as expected loss of quality. The conditional probability of failure of any of the three qualities - (1) Robustness, (2) Resourcefulness, and (3) Redundancy. Use of the following equation is suggested.
Example: given an arrival rate of 10 severe thunderstorms over a year, the probability ofa dam's robustness features failing over the course of that year is 1%.
The resilience of infrastructure can be measured as the ability of a system to degrade gracefully. Key inputs to this measure include (a) confidence level that a system will not degrade to the point of failure given a particular disturbance and (b) an understanding of the variance of the parameters of the system. Example: A skyscraper experiences a large fire in one of its upper stories. Based on the design specifications of the structural steel used in the building, firefighters have an 89 percent confidence level (sum total of uncertainty regarding the characteristics of the building’s steel skeleton system) that the steel will continue to support the weight of the building, in spite of the heat of the fire. The design specifications of the building indicate that the variance or uncertainty connected with the strength of the steel is plus or minus 3 percent.
Mean Time To Failure (MTTF). The unit of system output by which a failure threshold is defined and the unit of time of interest depends on the system being measured, and the research or management objective involved. Example, for large office building an air conditioning unit must be capable of operating for 2,000 logged hours before failure of its compressor requires repair.
Goal Option: Recovery to Designated Level…
Resilience can be measured according to a system's mean Time To Repair (MTTR). Standard of repair is pre-established and represents normal level of function. This is essentially a binary measure. The system is either functioning at its standard level or it is non-functioning. Example: A land line telephone service provider provides communications services to a large community. Provider is contractually obligated to remedy all service disruptions within 6 hours The mean time required to repair the provider's telephone switching station, given a breakdown, cannot exceed 6 hours.
Resilience is measured according to the time required for a system to return to a pre-disturbance level of operation. Example: a computer network supporting a financial institution must process at least 20 million transactions per day to avoid disruption. Any event that disrupts the system‘s operations must be resolved within six hours. In a particular case, the system is capable of functioning at a level where it processes a number of transactions below 20 million, but this does not satisfy contractual and technical requirements.

Risk and Resilience: Exploring the Relationship
B‐15
Domain
Consolidated Definition
(“Snake” Color and Text)
Measurable Element of Resilience Definition
(Goal)
Corresponding Synthesized Measure
Infrastructure LIGHT ORANGE Resilience is the ability of a system to attain the objective of absorbing the impact of an adverse event during its occurrence. The goals are to maintain continuity of function, degrading gracefully, at a pre-designated, minimally acceptable level.
Goal Option: Continuity of Function
Availability is a measure of resilience that indicates a system's readiness for use. How long the system must perform and at what level depends on the type of system and its objectives. Example, a desalination plant must be capable of supplying fresh water for 20 out every 24 hour cycle.
Reliability is a measure of resilience. This is the conditional probability a system remains operable, given the arrival rate of a specific threat or hazard, for a period of time. The likelihood of system failure and the unit of time of interest depend on the system being measured, the level of harm that a threat or hazard can impose, and the research or management objective involved. Example, given an arrival rate for class 4 hurricanes of two per year, the probability that an oil refinery will remain operable over the course of that year is .8
Goal Option: Graceful Degradation
Resilience is measured as expected loss of quality. The conditional probability of failure of any of the three qualities - (1) Robustness, (2) Resourcefulness, and (3) Redundancy. Use of the following equation is suggested. Example: given an arrival rate of 10 severe thunderstorms over a year, the probability of a dam's robustness features failing over the course of that year is 1%.
The resilience of infrastructure can be measured as the ability of a system to degrade gracefully. Key inputs to this measure include (a) confidence level that a system will not degrade to the point of failure given a particular disturbance and (b) an understanding of the variance of the parameters of the system. Example: A skyscraper experiences a large fire in one of its upper stories. Based on the design specifications of thestructural steel used in the building, firefighters have an 89 percent confidence level (sum total of uncertainty regarding the characteristics of the building’s steel skeleton system) thathe steel will continue to support the weight of the building, in spite of the heat of the fire. The design specifications of the building indicate that the variance or uncertainty connectedwith the strength of the steel is plus or minus 3 percent.
Mean Time To Failure (MTTF). The unit of system output by which a failure threshold is defined and the unit of time of interest depends on the system being measured, and the research or management objective involved. Example, for large office building an air conditioning unit must be capable of operating for 2,000 logged hours before failure of its compressor requires repair.
Goal Option: Recovery to Designated Level…
Resilience can be measured according to a system's mean Time To Repair (MTTR). Standard of repair is pre-established and represents normal level of function. This is essentially a binary measure. The system is either functioning at its standard level or it is non-functioning. Example: A land line telephone service provider provides communications services to a large community. Provider is contractually obligated to remedy all service disruptions within 6 hours The mean time required to repair the provider's telephone switching station, given a breakdown, cannot exceed 6 hours.
Resilience is measured according to the time required for a system to return to a pre-disturbance level of operation. Example: a computer network supporting a financial institution must process at least 20 million transactions per day to avoid disruption. Any event that disrupts the system‘s operations must be resolved within six hours. In a particular case, the system is capable of functioning at a level where it processes a number of transactions below 20 million, but this does not satisfy contractual and technical requirements.

Risk and Resilience: Exploring the Relationship
B‐16
Domain
Consolidated Definition
(“Snake” Color and Text)
Measurable Element of Resilience Definition
(Goal)
Corresponding Synthesized Measure
Infrastructure RED Resilience is the ability of a system to attain the objective of recovering from the impact of an adverse event, after its occurrence. The goal is to recover degraded system functionality to a pre-designated level, as rapidly as desired and feasible.
Goal Option: Recovery to Designated Level…
Resilience can be measured according to a system's mean Time To Repair (MTTR). Standard of repair is pre-established and represents normal level of function. This is essentially a binary measure. The system is either functioning at its standard level or it is non-functioning. Example: A land line telephone service provider provides communications services to a large community. Provider is contractually obligated to remedy all service disruptions within 6 hours The mean time required to repair the provider's telephone switching station, given a breakdown, cannot exceed 6 hours.
Resilience is measured according to the time required for a system to return to a pre-disturbance level of operation. Example: a computer network supporting a financial institution must process at least 20 million transactions per day to avoid disruption. Any event that disrupts the system‘s operations must be resolved within six hours. In a particular case, the system is capable of functioning at a level where it processes a number of transactions below 20 million, but this does not satisfy contractual and technical requirements.

Risk and Resilience: Exploring the Relationship
B‐17
Domain
Consolidated Definition
(“Snake” Color and Text)
Measurable Element of Resilience Definition
(Goal)
Corresponding Synthesized Measure
Organizations BROWN Resilience is the ability of a system to attain the objectives of resisting, absorbing, and recovering from the impact of an adverse event, before, during, and after its occurrence. It is also a dynamic process that seeks to learn from incidents to strengthen capabilities of the system in meeting future challenges. The goals are to maintain continuity of function, degrading gracefully, and recover system functionality to a pre-designated level, as rapidly as desired and feasible.
Goal Option: Continuity of Function
A key measure of institutional resilience effectiveness [MoE] is the survival of the system. Survival means that the system (private industry or government organization) continues to function at some level regardless of the stressors encountered and does not go out of existence. This measure can be addressed as a binary judgment (yes or no, the institution continues to exist or it does not) Measure can also be addressed with heuristic metrics that seek to gauge how well a system has survived, e.g. High-Medium-Low or five point Likert Scale. Judgments would need to be rendered by subject matter experts with significant domain knowledge of the system of interest. Example: The government of a state has experienced a large natural disaster and has lost a number of its social services functions but continues to exercise governance because its senior leadership and law enforcement and emergency services functions remain intact.
A key measure of institutional resilience is the ability of systems to maintain productive functions in the face of large disruptions. Two metrics can be applied to address this measure. The first is the number of and availability of substitute resources that the system can apply to supporting its productivity goals after accounting for losses caused by damage or stress from man-made or natural disruption. The second is amount of energy surge capacity (e.g. work or effort) that the system can bring to bear to apply to mitigating the effects of a disruption. Example: A machine tool manufacturing company requires 100 tons of sheet steel and 500 tons of mild steel bars per day in order to meet its productivity targets. The company's business plan cannot tolerate a break in production for longer than 14 days. An earthquake that disrupts the company's production operations for ten days and the operations of its normal sheet steel and mild steel bar suppliers for four weeks. Having established contingency contracts with three alternative sheet steel suppliers and two other mild steel bar suppliers, the machine tool company chooses to buy the steel it needs from the supplier best able to meet its demand in the shortest amount of time. To make up production shortfalls resulting from the earthquake disruption, the company draws on its cash reserves to pay its labor force the overtime needed to complete the required number of machine tool units.
Goal Option: Graceful Degradation
Resilience of an institution can be measured according to how effective it is in containing degradation after encountering a disruption. Quantitative units for such a measure include time and level of institutional activities/functions in terms of inputs, throughputs, or outputs per unit of time. Example: A municipal emergency medical response team's capability standard for responding to calls for service is 8 calls within a 24 hour period. Response to a call must be made within 4 minutes of receipt. Even in a severe city-wide emergency, such as blizzard conditions, the EMR Team's capacity will not reduce by more than 2 calls per 24 hour period and call response time will not grow by more than three minutes per call per 24 hour period.
Goal Option: Recovery to Designated Level…
A key measure of institutional resilience effectiveness [MoE] is the restoration of key system functions within a specified time limit. This means that the system (private industry or government organization) recovers its essential function to a predetermined level of performance within a predetermined time window. Example: A local food service business, such as a delicatessen, is forced by a severe storm to shut down operations. The deli's business plan indicates that operations must resume to at least 50 percent of sales capacity within 24 hours.
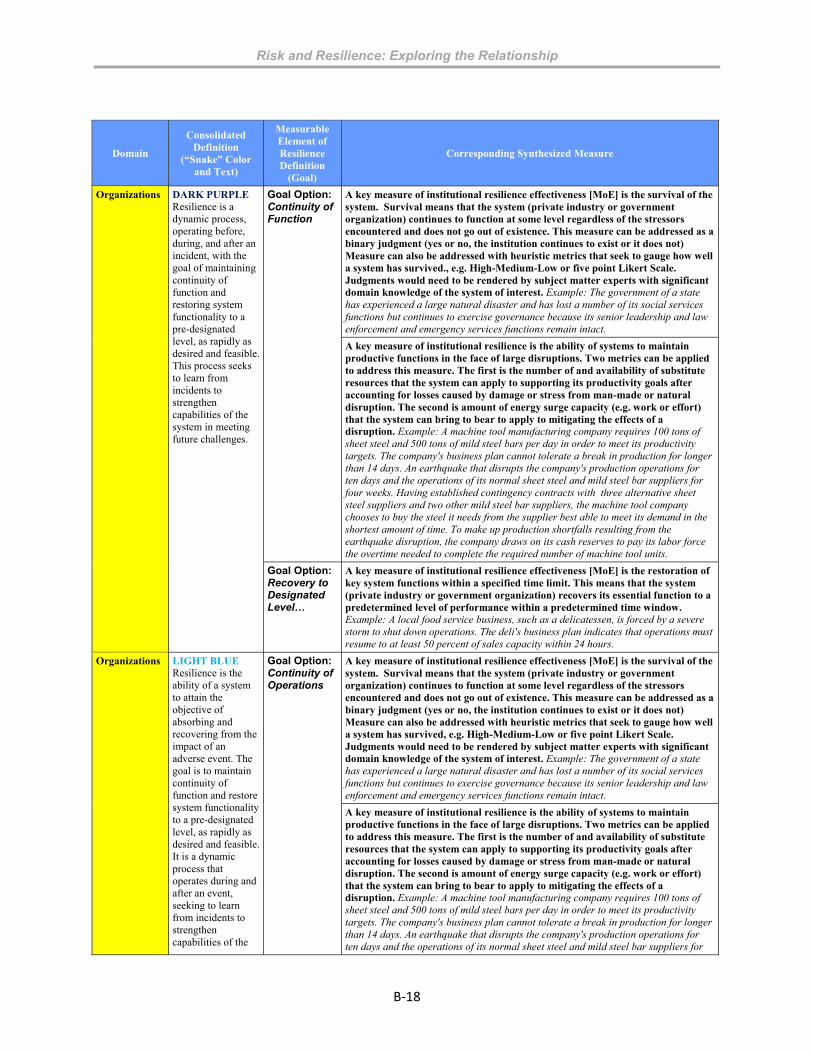
Risk and Resilience: Exploring the Relationship
B‐18
Domain
Consolidated Definition
(“Snake” Color and Text)
Measurable Element of Resilience Definition
(Goal)
Corresponding Synthesized Measure
Organizations DARK PURPLE Resilience is a dynamic process, operating before, during, and after an incident, with the goal of maintaining continuity of function and restoring system functionality to a pre-designated level, as rapidly as desired and feasible. This process seeks to learn from incidents to strengthen capabilities of the system in meeting future challenges.
Goal Option: Continuity of Function
A key measure of institutional resilience effectiveness [MoE] is the survival of the system. Survival means that the system (private industry or government organization) continues to function at some level regardless of the stressors encountered and does not go out of existence. This measure can be addressed as a binary judgment (yes or no, the institution continues to exist or it does not) Measure can also be addressed with heuristic metrics that seek to gauge how well a system has survived., e.g. High-Medium-Low or five point Likert Scale. Judgments would need to be rendered by subject matter experts with significant domain knowledge of the system of interest. Example: The government of a state has experienced a large natural disaster and has lost a number of its social services functions but continues to exercise governance because its senior leadership and law enforcement and emergency services functions remain intact.
A key measure of institutional resilience is the ability of systems to maintain productive functions in the face of large disruptions. Two metrics can be applied to address this measure. The first is the number of and availability of substitute resources that the system can apply to supporting its productivity goals after accounting for losses caused by damage or stress from man-made or natural disruption. The second is amount of energy surge capacity (e.g. work or effort) that the system can bring to bear to apply to mitigating the effects of a disruption. Example: A machine tool manufacturing company requires 100 tons of sheet steel and 500 tons of mild steel bars per day in order to meet its productivity targets. The company's business plan cannot tolerate a break in production for longer than 14 days. An earthquake that disrupts the company's production operations for ten days and the operations of its normal sheet steel and mild steel bar suppliers for four weeks. Having established contingency contracts with three alternative sheet steel suppliers and two other mild steel bar suppliers, the machine tool company chooses to buy the steel it needs from the supplier best able to meet its demand in the shortest amount of time. To make up production shortfalls resulting from the earthquake disruption, the company draws on its cash reserves to pay its labor force the overtime needed to complete the required number of machine tool units.
Goal Option: Recovery to Designated Level…
A key measure of institutional resilience effectiveness [MoE] is the restoration of key system functions within a specified time limit. This means that the system (private industry or government organization) recovers its essential function to a predetermined level of performance within a predetermined time window. Example: A local food service business, such as a delicatessen, is forced by a severe storm to shut down operations. The deli's business plan indicates that operations must resume to at least 50 percent of sales capacity within 24 hours.
Organizations LIGHT BLUE Resilience is the ability of a system to attain the objective of absorbing and recovering from the impact of an adverse event. The goal is to maintain continuity of function and restore system functionality to a pre-designated level, as rapidly as desired and feasible. It is a dynamic process that operates during and after an event, seeking to learn from incidents to strengthen capabilities of the
Goal Option: Continuity of Operations
A key measure of institutional resilience effectiveness [MoE] is the survival of the system. Survival means that the system (private industry or government organization) continues to function at some level regardless of the stressors encountered and does not go out of existence. This measure can be addressed as a binary judgment (yes or no, the institution continues to exist or it does not) Measure can also be addressed with heuristic metrics that seek to gauge how well a system has survived, e.g. High-Medium-Low or five point Likert Scale. Judgments would need to be rendered by subject matter experts with significant domain knowledge of the system of interest. Example: The government of a state has experienced a large natural disaster and has lost a number of its social services functions but continues to exercise governance because its senior leadership and law enforcement and emergency services functions remain intact.
A key measure of institutional resilience is the ability of systems to maintain productive functions in the face of large disruptions. Two metrics can be applied to address this measure. The first is the number of and availability of substitute resources that the system can apply to supporting its productivity goals after accounting for losses caused by damage or stress from man-made or natural disruption. The second is amount of energy surge capacity (e.g. work or effort) that the system can bring to bear to apply to mitigating the effects of a disruption. Example: A machine tool manufacturing company requires 100 tons of sheet steel and 500 tons of mild steel bars per day in order to meet its productivity targets. The company's business plan cannot tolerate a break in production for longer than 14 days. An earthquake that disrupts the company's production operations for ten days and the operations of its normal sheet steel and mild steel bar suppliers for

Risk and Resilience: Exploring the Relationship
B‐19
Domain
Consolidated Definition
(“Snake” Color and Text)
Measurable Element of Resilience Definition
(Goal)
Corresponding Synthesized Measure
system in meeting future challenges.
four weeks. Having established contingency contracts with three alternative sheet steel suppliers and two other mild steel bar suppliers, the machine tool company chooses to buy the steel it needs from the supplier best able to meet its demand in the shortest amount of time. To make up production shortfalls resulting from the earthquake disruption, the company draws on its cash reserves to pay its labor force the overtime needed to complete the required number of machine tool units.
Goal Option: Recovery to Designated Level…
A key measure of institutional resilience effectiveness [MoE] is the restoration of key system functions within a specified time limit. This means that the system (private industry or government organization) recovers its essential function to a predetermined level of performance within a predetermined time window. Example: A local food service business, such as a delicatessen, is forced by a severe storm to shut down operations. The deli's business plan indicates that operations must resume to at least 50 percent of sales capacity within 24 hours.
Organizations GREEN Resilience is the ability of a system to attain the objective of absorbing the impact of an adverse event during its occurrence. The goal is to maintain continuity of function at a pre-designated, minimally acceptable level.
Goal Option: Continuity of Function
A key measure of institutional resilience effectiveness [MoE] is the survival of the system. Survival means that the system (private industry or government organization) continues to function at some level regardless of the stressors encountered and does not go out of existence. This measure can be addressed as a binary judgment (yes or no, the institution continues to exist or it does not) Measure can also be addressed with heuristic metrics that seek to gauge how well a system has survived, e.g. High-Medium-Low or five point Likert Scale. Judgments would need to be rendered by subject matter experts with significant domain knowledge of the system of interest. Example: The government of a state has experienced a large natural disaster and has lost a number of its social services functions but continues to exercise governance because its senior leadership and law enforcement and emergency services functions remain intact.
A key measure of institutional resilience is the ability of systems to maintain productive functions in the face of large disruptions. Two metrics can be applied to address this measure. The first is the number of and availability of substitute resources that the system can apply to supporting its productivity goals after accounting for losses caused by damage or stress from man-made or natural disruption. The second is amount of energy surge capacity (e.g. work or effort) that the system can bring to bear to apply to mitigating the effects of a disruption. Example: A machine tool manufacturing company requires 100 tons of sheet steel and 500 tons of mild steel bars per day in order to meet its productivity targets. The company's business plan cannot tolerate a break in production for longer than 14 days. An earthquake that disrupts the company's production operations for ten days and the operations of its normal sheet steel and mild steel bar suppliers for four weeks. Having established contingency contracts with three alternative sheet steel suppliers and two other mild steel bar suppliers, the machine tool company chooses to buy the steel it needs from the supplier best able to meet its demand in the shortest amount of time. To make up production shortfalls resulting from the earthquake disruption, the company draws on its cash reserves to pay its labor force the overtime needed to complete the required number of machine tool units.
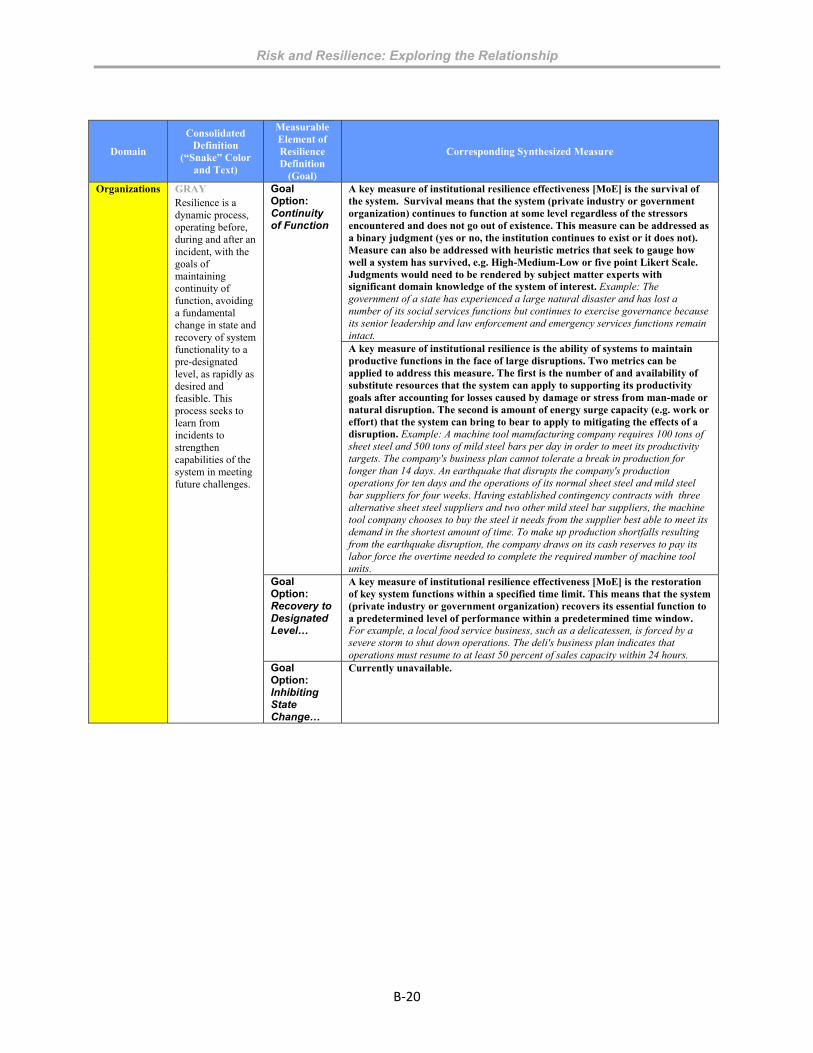
Risk and Resilience: Exploring the Relationship
B‐20
Domain
Consolidated Definition
(“Snake” Color and Text)
Measurable Element of Resilience Definition
(Goal)
Corresponding Synthesized Measure
Organizations GRAY Resilience is a dynamic process, operating before, during and after an incident, with the goals of maintaining continuity of function, avoiding a fundamental change in state and recovery of system functionality to a pre-designated level, as rapidly as desired and feasible. This process seeks to learn from incidents to strengthen capabilities of the system in meeting future challenges.
Goal Option: Continuity of Function
A key measure of institutional resilience effectiveness [MoE] is the survival of the system. Survival means that the system (private industry or government organization) continues to function at some level regardless of the stressors encountered and does not go out of existence. This measure can be addressed as a binary judgment (yes or no, the institution continues to exist or it does not). Measure can also be addressed with heuristic metrics that seek to gauge how well a system has survived, e.g. High-Medium-Low or five point Likert Scale. Judgments would need to be rendered by subject matter experts with significant domain knowledge of the system of interest. Example: The government of a state has experienced a large natural disaster and has lost a number of its social services functions but continues to exercise governance because its senior leadership and law enforcement and emergency services functions remain intact. A key measure of institutional resilience is the ability of systems to maintain productive functions in the face of large disruptions. Two metrics can be applied to address this measure. The first is the number of and availability of substitute resources that the system can apply to supporting its productivity goals after accounting for losses caused by damage or stress from man-made or natural disruption. The second is amount of energy surge capacity (e.g. work or effort) that the system can bring to bear to apply to mitigating the effects of a disruption. Example: A machine tool manufacturing company requires 100 tons of sheet steel and 500 tons of mild steel bars per day in order to meet its productivity targets. The company's business plan cannot tolerate a break in production for longer than 14 days. An earthquake that disrupts the company's production operations for ten days and the operations of its normal sheet steel and mild steel bar suppliers for four weeks. Having established contingency contracts with three alternative sheet steel suppliers and two other mild steel bar suppliers, the machine tool company chooses to buy the steel it needs from the supplier best able to meet its demand in the shortest amount of time. To make up production shortfalls resulting from the earthquake disruption, the company draws on its cash reserves to pay its labor force the overtime needed to complete the required number of machine tool units.
Goal Option: Recovery to Designated Level…
A key measure of institutional resilience effectiveness [MoE] is the restoration of key system functions within a specified time limit. This means that the system (private industry or government organization) recovers its essential function to a predetermined level of performance within a predetermined time window. For example, a local food service business, such as a delicatessen, is forced by a severe storm to shut down operations. The deli's business plan indicates that operations must resume to at least 50 percent of sales capacity within 24 hours.
Goal Option: Inhibiting State Change…
Currently unavailable.
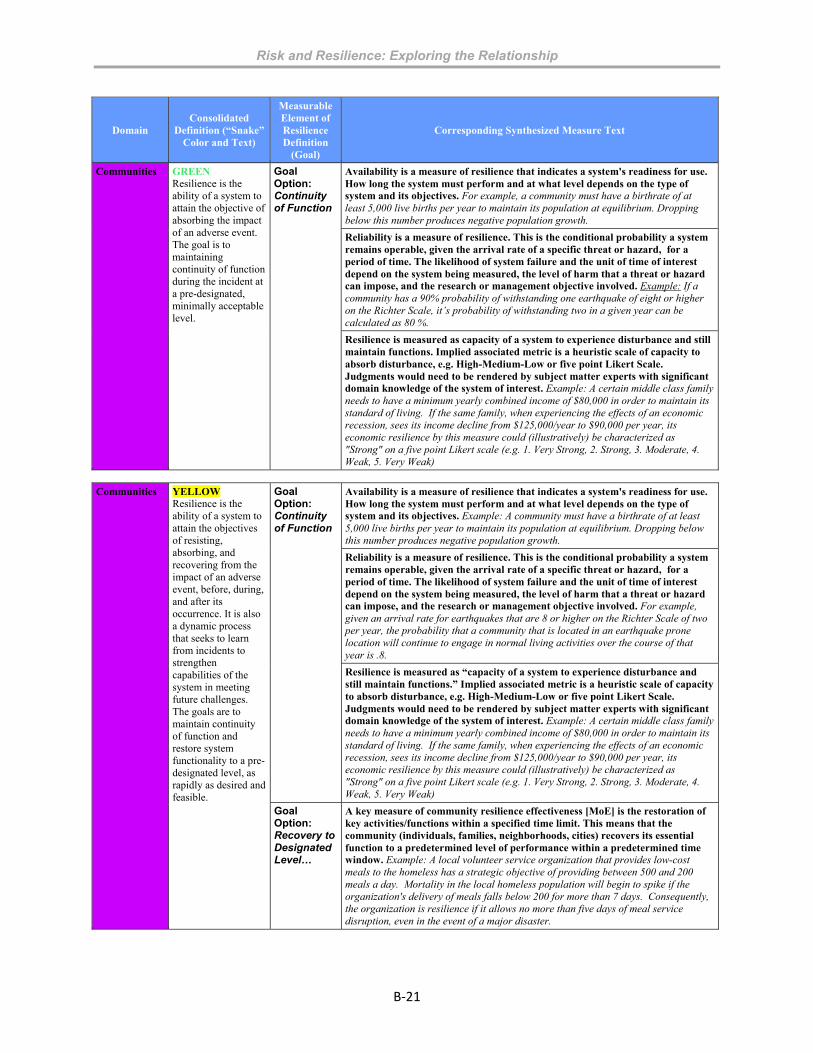
Risk and Resilience: Exploring the Relationship
B‐21
Communities YELLOW Resilience is the ability of a system to attain the objectives of resisting, absorbing, and recovering from the impact of an adverse event, before, during, and after its occurrence. It is also a dynamic process that seeks to learn from incidents to strengthen capabilities of the system in meeting future challenges. The goals are to maintain continuity of function and restore system functionality to a pre-designated level, as rapidly as desired and feasible.
Goal Option: Continuity of Function
Availability is a measure of resilience that indicates a system's readiness for use. How long the system must perform and at what level depends on the type of system and its objectives. Example: A community must have a birthrate of at least 5,000 live births per year to maintain its population at equilibrium. Dropping below this number produces negative population growth.
Reliability is a measure of resilience. This is the conditional probability a system remains operable, given the arrival rate of a specific threat or hazard, for a period of time. The likelihood of system failure and the unit of time of interest depend on the system being measured, the level of harm that a threat or hazard can impose, and the research or management objective involved. For example, given an arrival rate for earthquakes that are 8 or higher on the Richter Scale of two per year, the probability that a community that is located in an earthquake prone location will continue to engage in normal living activities over the course of that year is .8.
Resilience is measured as “capacity of a system to experience disturbance and still maintain functions.” Implied associated metric is a heuristic scale of capacity to absorb disturbance, e.g. High-Medium-Low or five point Likert Scale. Judgments would need to be rendered by subject matter experts with significant domain knowledge of the system of interest. Example: A certain middle class family needs to have a minimum yearly combined income of $80,000 in order to maintain its standard of living. If the same family, when experiencing the effects of an economic recession, sees its income decline from $125,000/year to $90,000 per year, its economic resilience by this measure could (illustratively) be characterized as "Strong" on a five point Likert scale (e.g. 1. Very Strong, 2. Strong, 3. Moderate, 4. Weak, 5. Very Weak)
Goal Option: Recovery to Designated Level…
A key measure of community resilience effectiveness [MoE] is the restoration of key activities/functions within a specified time limit. This means that the community (individuals, families, neighborhoods, cities) recovers its essential function to a predetermined level of performance within a predetermined time window. Example: A local volunteer service organization that provides low-cost meals to the homeless has a strategic objective of providing between 500 and 200 meals a day. Mortality in the local homeless population will begin to spike if the organization's delivery of meals falls below 200 for more than 7 days. Consequently, the organization is resilience if it allows no more than five days of meal service disruption, even in the event of a major disaster.
Domain Consolidated
Definition (“Snake” Color and Text)
Measurable Element of Resilience Definition
(Goal)
Corresponding Synthesized Measure Text
Communities GREEN Resilience is the ability of a system to attain the objective of absorbing the impact of an adverse event. The goal is to maintaining continuity of function during the incident at a pre-designated, minimally acceptable level.
Goal Option: Continuity of Function
Availability is a measure of resilience that indicates a system's readiness for use. How long the system must perform and at what level depends on the type of system and its objectives. For example, a community must have a birthrate of at least 5,000 live births per year to maintain its population at equilibrium. Dropping below this number produces negative population growth.
Reliability is a measure of resilience. This is the conditional probability a system remains operable, given the arrival rate of a specific threat or hazard, for a period of time. The likelihood of system failure and the unit of time of interest depend on the system being measured, the level of harm that a threat or hazard can impose, and the research or management objective involved. Example: If a community has a 90% probability of withstanding one earthquake of eight or higher on the Richter Scale, it’s probability of withstanding two in a given year can be calculated as 80 %.
Resilience is measured as capacity of a system to experience disturbance and still maintain functions. Implied associated metric is a heuristic scale of capacity to absorb disturbance, e.g. High-Medium-Low or five point Likert Scale. Judgments would need to be rendered by subject matter experts with significant domain knowledge of the system of interest. Example: A certain middle class family needs to have a minimum yearly combined income of $80,000 in order to maintain its standard of living. If the same family, when experiencing the effects of an economic recession, sees its income decline from $125,000/year to $90,000 per year, its economic resilience by this measure could (illustratively) be characterized as "Strong" on a five point Likert scale (e.g. 1. Very Strong, 2. Strong, 3. Moderate, 4. Weak, 5. Very Weak)

Risk and Resilience: Exploring the Relationship
B‐22
Domain Consolidated
Definition (“Snake” Color and Text)
Measurable Element of Resilience Definition
(Goal)
Corresponding Synthesized Measure
Communities BROWN Resilience is the ability of a system to attain the objectives of resisting, absorbing, and recovering from the impact of an adverse event, before, during, and after its occurrence. It is also a dynamic process that seeks to learn from incidents to strengthen capabilities of the system in meeting future challenges. The goals are to maintain continuity of function, degrading gracefully, and recover system functionality to a pre-designated level, as rapidly as desired and feasible.
Goal Option: Continuity of Function
Availability is a measure of resilience that indicates a system's readiness for use. How long the system must perform and at what level depends on the type of system and its objectives. Example: A community must have a birthrate of at least 5,000 live births per year to maintain its population at equilibrium. Dropping below this number produces negative population growth.
Reliability is a measure of resilience. This is the conditional probability a system remains operable, given the arrival rate of a specific threat or hazard, for a period of time. The likelihood of system failure and the unit of time of interest depend on the system being measured, the level of harm that a threat or hazard can impose, and the research or management objective involved. Example: A given an arrival rate for earthquakes that are 8 or higher on the Richter Scale of two per year, the probability that a community that is located in an earthquake prone location will continue to engage in normal living activities over the course of that year is .8.
Resilience is measured as “capacity of a system to experience disturbance and still maintain functions.” Implied associated metric is a heuristic scale of capacity to absorb disturbance, e.g. High-Medium-Low or five point Likert Scale. Judgments would need to be rendered by subject matter experts with significant domain knowledge of the system of interest. Example: A certain middle class family needs to have a minimum yearly combined income of $80,000 in order to maintain its standard of living. If the same family, when experiencing the effects of an economic recession, sees its income decline from $125,000/year to $90,000 per year, its economic resilience by this measure could (illustratively) be characterized as "Strong" on a five point Likert scale (e.g. 1. Very Strong, 2. Strong, 3. Moderate, 4. Weak, 5. Very Weak)
Goal Option: Graceful Degradation
Resilience is measured as expected loss of quality. The conditional probability of failure of any of the three qualities - (1) Robustness, (2) Resourcefulness, and (3) Redundancy. Use of the following equation is suggested. Example: Given an arrival rate of 10 terrorist attacks over a year in their community, the probability of a family's resourcefulness capacity failing over the course of that year is 20%.
Goal Option: Recovery to Designated Level…
A key measure of community resilience effectiveness [MoE] is the restoration of key activities/functions within a specified time limit. This means that the community (individuals, families, neighborhoods, cities) recovers its essential function to a predetermined level of performance within a predetermined time window. Example: A local volunteer service organization that provides low-cost meals to the homeless has a strategic objective of providing between 500 and 200 meals a day. Mortality in the local homeless population will begin to spike if the organization's delivery of meals falls below 200 for more than 7 days. Consequently, the organization is resilience if it allows no more than five days of meal service disruption, even in the event of a major disaster.

Risk and Resilience: Exploring the Relationship
B‐23
Domain Consolidated
Definition (“Snake” Color and Text)
Measurable Element of Resilience Definition
(Goal)
Corresponding Synthesized Measure
Communities LIGHT BLUE Resilience is the ability of a system to attain the objectives of absorbing and recovering from the impact of an adverse event, during and after its occurrence. It is also a dynamic process that seeks to learn from incidents to strengthen capabilities of the system in meeting future challenges. The goals are to maintain continuity of function and restore system functionality to a pre-designated level, as rapidly as desired and feasible.
Goal Option: Continuity of Function
Availability is a measure of resilience that indicates a system's readiness for use. How long the system must perform and at what level depends on the type of system and its objectives. Example: a community must have a birthrate of at least 5,000 live births per year to maintain its population at equilibrium. Dropping below this number produces negative population growth. A
Reliability is a measure of resilience. This is the conditional probability a system remains operable, given the arrival rate of a specific threat or hazard, for a period of time. The likelihood of system failure and the unit of time of interest depend on the system being measured, the level of harm that a threat or hazard can impose, and the research or management objective involved. For example, given an arrival rate for earthquakes that are 8 or higher on the Richter Scale of two per year, the probability that a community that is located in an earthquake prone location will continue to engage in normal living activities over the course of that year is .8.
Resilience is measured as “capacity of a system to experience disturbance and still maintain functions.” Implied associated metric is a heuristic scale of capacity to absorb disturbance, e.g. High-Medium-Low or five point Likert Scale. Judgments would need to be rendered by subject matter experts with significant domain knowledge of the system of interest. Example: A certain middle class family needs to have a minimum yearly combined income of $80,000 in order to maintain its standard of living. If the same family, when experiencing the effects of an economic recession, sees its income decline from $125,000/year to $90,000 per year, its economic resilience by this measure could (illustratively) be characterized as "Strong" on a five point Likert scale (e.g. 1. Very Strong, 2. Strong, 3. Moderate, 4. Weak, 5. Very Weak)
Goal Option: Recovery to Designated Level…
A key measure of community resilience effectiveness [MoE] is the restoration of key activities/functions within a specified time limit. This means that the community (individuals, families, neighborhoods, cities) recovers its essential function to a predetermined level of performance within a predetermined time window. Example: A local volunteer service organization that provides low-cost meals to the homeless has a strategic objective of providing between 500 and 200 meals a day. Mortality in the local homeless population will begin to spike if the organization's delivery of meals falls below 200 for more than 7 days. Consequently, the organization is resilience if it allows no more than five days of meal service disruption, even in the event of a major disaster.
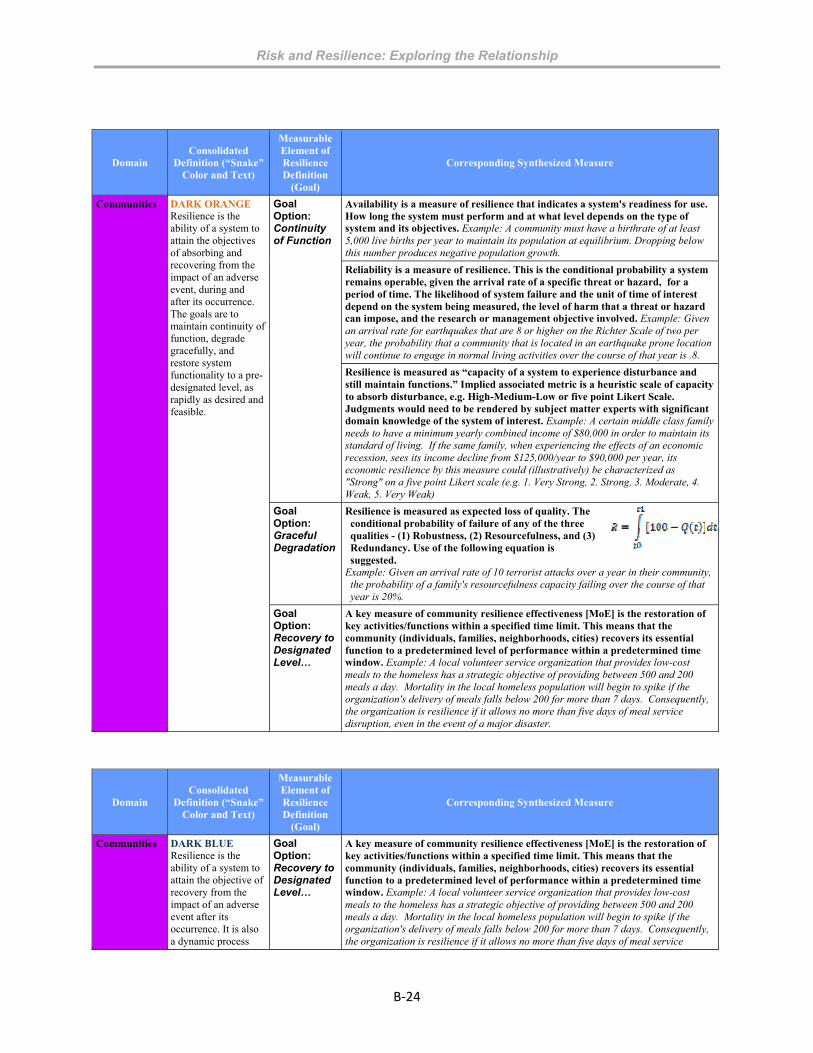
Risk and Resilience: Exploring the Relationship
B‐24
Domain Consolidated
Definition (“Snake” Color and Text)
Measurable Element of Resilience Definition
(Goal)
Corresponding Synthesized Measure
Communities DARK ORANGE Resilience is the ability of a system to attain the objectives of absorbing and recovering from the impact of an adverse event, during and after its occurrence. The goals are to maintain continuity of function, degrade gracefully, and restore system functionality to a pre-designated level, as rapidly as desired and feasible.
Goal Option: Continuity of Function
Availability is a measure of resilience that indicates a system's readiness for use. How long the system must perform and at what level depends on the type of system and its objectives. Example: A community must have a birthrate of at least 5,000 live births per year to maintain its population at equilibrium. Dropping below this number produces negative population growth.
Reliability is a measure of resilience. This is the conditional probability a system remains operable, given the arrival rate of a specific threat or hazard, for a period of time. The likelihood of system failure and the unit of time of interest depend on the system being measured, the level of harm that a threat or hazard can impose, and the research or management objective involved. Example: Given an arrival rate for earthquakes that are 8 or higher on the Richter Scale of two per year, the probability that a community that is located in an earthquake prone location will continue to engage in normal living activities over the course of that year is .8.
Resilience is measured as “capacity of a system to experience disturbance and still maintain functions.” Implied associated metric is a heuristic scale of capacity to absorb disturbance, e.g. High-Medium-Low or five point Likert Scale. Judgments would need to be rendered by subject matter experts with significant domain knowledge of the system of interest. Example: A certain middle class family needs to have a minimum yearly combined income of $80,000 in order to maintain its standard of living. If the same family, when experiencing the effects of an economic recession, sees its income decline from $125,000/year to $90,000 per year, its economic resilience by this measure could (illustratively) be characterized as "Strong" on a five point Likert scale (e.g. 1. Very Strong, 2. Strong, 3. Moderate, 4. Weak, 5. Very Weak)
Goal Option: Graceful Degradation
Resilience is measured as expected loss of quality. The conditional probability of failure of any of the three qualities - (1) Robustness, (2) Resourcefulness, and (3) Redundancy. Use of the following equation is suggested.
Example: Given an arrival rate of 10 terrorist attacks over a year in their community, the probability of a family's resourcefulness capacity failing over the course of that year is 20%.
Goal Option: Recovery to Designated Level…
A key measure of community resilience effectiveness [MoE] is the restoration of key activities/functions within a specified time limit. This means that the community (individuals, families, neighborhoods, cities) recovers its essential function to a predetermined level of performance within a predetermined time window. Example: A local volunteer service organization that provides low-cost meals to the homeless has a strategic objective of providing between 500 and 200 meals a day. Mortality in the local homeless population will begin to spike if the organization's delivery of meals falls below 200 for more than 7 days. Consequently, the organization is resilience if it allows no more than five days of meal service disruption, even in the event of a major disaster.
Domain Consolidated
Definition (“Snake” Color and Text)
Measurable Element of Resilience Definition
(Goal)
Corresponding Synthesized Measure
Communities DARK BLUE Resilience is the ability of a system to attain the objective of recovery from the impact of an adverse event after its occurrence. It is also a dynamic process
Goal Option: Recovery to Designated Level…
A key measure of community resilience effectiveness [MoE] is the restoration of key activities/functions within a specified time limit. This means that the community (individuals, families, neighborhoods, cities) recovers its essential function to a predetermined level of performance within a predetermined time window. Example: A local volunteer service organization that provides low-cost meals to the homeless has a strategic objective of providing between 500 and 200 meals a day. Mortality in the local homeless population will begin to spike if the organization's delivery of meals falls below 200 for more than 7 days. Consequently, the organization is resilience if it allows no more than five days of meal service
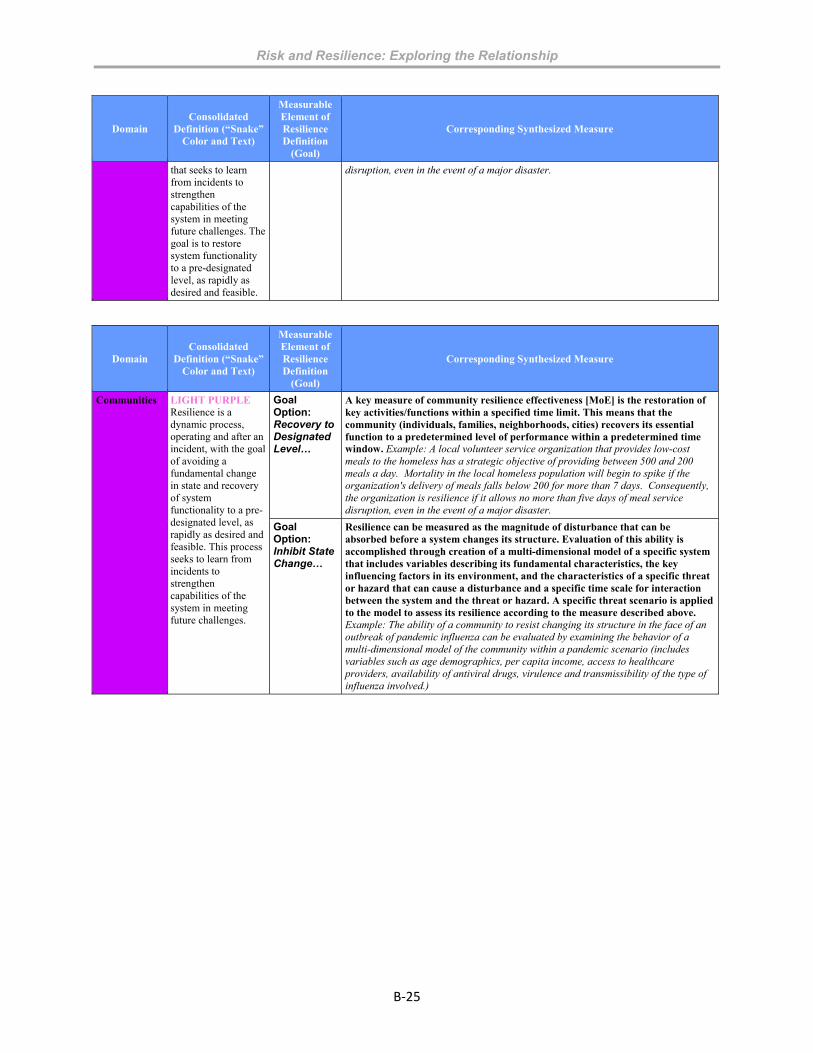
Risk and Resilience: Exploring the Relationship
B‐25
Domain Consolidated
Definition (“Snake” Color and Text)
Measurable Element of Resilience Definition
(Goal)
Corresponding Synthesized Measure
that seeks to learn from incidents to strengthen capabilities of the system in meeting future challenges. The goal is to restore system functionality to a pre-designated level, as rapidly as desired and feasible.
disruption, even in the event of a major disaster.
Domain Consolidated
Definition (“Snake” Color and Text)
Measurable Element of Resilience Definition
(Goal)
Corresponding Synthesized Measure
Communities LIGHT PURPLE Resilience is a dynamic process, operating and after an incident, with the goal of avoiding a fundamental change in state and recovery of system functionality to a pre-designated level, as rapidly as desired and feasible. This process seeks to learn from incidents to strengthen capabilities of the system in meeting future challenges.
Goal Option: Recovery to Designated Level…
A key measure of community resilience effectiveness [MoE] is the restoration of key activities/functions within a specified time limit. This means that the community (individuals, families, neighborhoods, cities) recovers its essential function to a predetermined level of performance within a predetermined time window. Example: A local volunteer service organization that provides low-cost meals to the homeless has a strategic objective of providing between 500 and 200 meals a day. Mortality in the local homeless population will begin to spike if the organization's delivery of meals falls below 200 for more than 7 days. Consequently, the organization is resilience if it allows no more than five days of meal service disruption, even in the event of a major disaster.
Goal Option: Inhibit State Change…
Resilience can be measured as the magnitude of disturbance that can be absorbed before a system changes its structure. Evaluation of this ability is accomplished through creation of a multi-dimensional model of a specific system that includes variables describing its fundamental characteristics, the key influencing factors in its environment, and the characteristics of a specific threat or hazard that can cause a disturbance and a specific time scale for interaction between the system and the threat or hazard. A specific threat scenario is applied to the model to assess its resilience according to the measure described above. Example: The ability of a community to resist changing its structure in the face of an outbreak of pandemic influenza can be evaluated by examining the behavior of a multi-dimensional model of the community within a pandemic scenario (includes variables such as age demographics, per capita income, access to healthcare providers, availability of antiviral drugs, virulence and transmissibility of the type of influenza involved.)
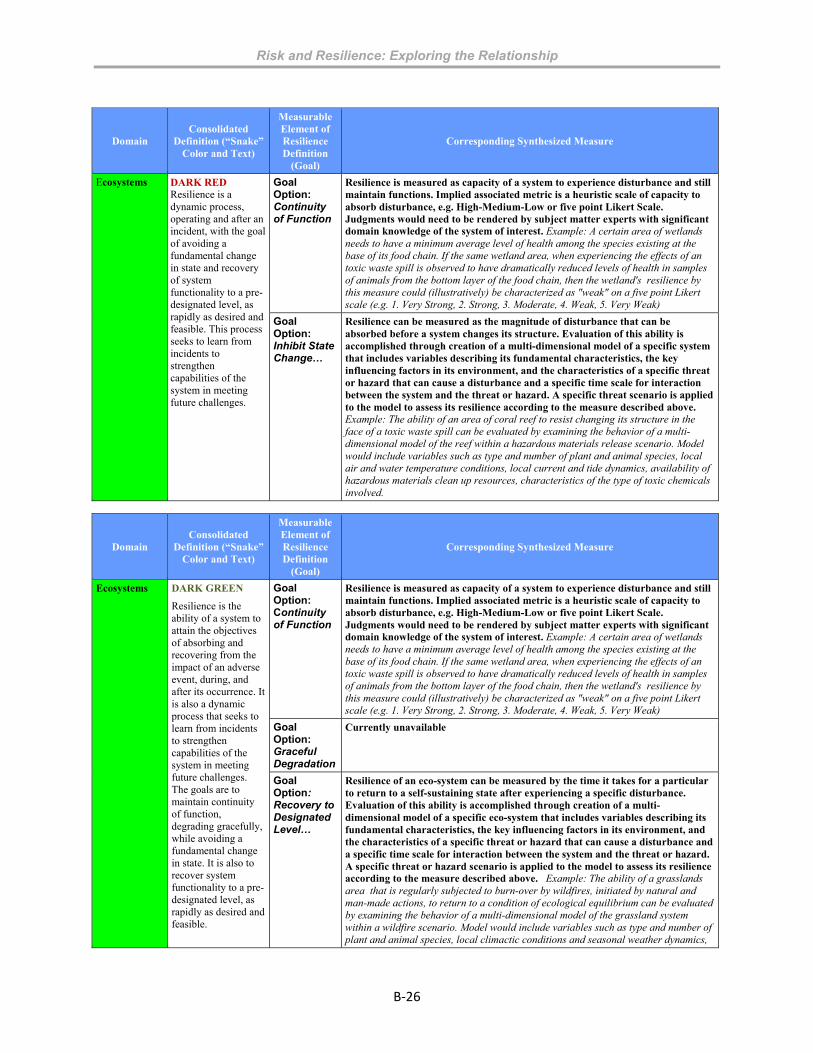
Risk and Resilience: Exploring the Relationship
B‐26
Domain Consolidated
Definition (“Snake” Color and Text)
Measurable Element of Resilience Definition
(Goal)
Corresponding Synthesized Measure
Ecosystems DARK RED Resilience is a dynamic process, operating and after an incident, with the goal of avoiding a fundamental change in state and recovery of system functionality to a pre-designated level, as rapidly as desired and feasible. This process seeks to learn from incidents to strengthen capabilities of the system in meeting future challenges.
Goal Option: Continuity of Function
Resilience is measured as capacity of a system to experience disturbance and still maintain functions. Implied associated metric is a heuristic scale of capacity to absorb disturbance, e.g. High-Medium-Low or five point Likert Scale. Judgments would need to be rendered by subject matter experts with significant domain knowledge of the system of interest. Example: A certain area of wetlands needs to have a minimum average level of health among the species existing at the base of its food chain. If the same wetland area, when experiencing the effects of an toxic waste spill is observed to have dramatically reduced levels of health in samples of animals from the bottom layer of the food chain, then the wetland's resilience by this measure could (illustratively) be characterized as "weak" on a five point Likert scale (e.g. 1. Very Strong, 2. Strong, 3. Moderate, 4. Weak, 5. Very Weak)
Goal Option: Inhibit State Change…
Resilience can be measured as the magnitude of disturbance that can be absorbed before a system changes its structure. Evaluation of this ability is accomplished through creation of a multi-dimensional model of a specific system that includes variables describing its fundamental characteristics, the key influencing factors in its environment, and the characteristics of a specific threat or hazard that can cause a disturbance and a specific time scale for interaction between the system and the threat or hazard. A specific threat scenario is applied to the model to assess its resilience according to the measure described above. Example: The ability of an area of coral reef to resist changing its structure in the face of a toxic waste spill can be evaluated by examining the behavior of a multi-dimensional model of the reef within a hazardous materials release scenario. Model would include variables such as type and number of plant and animal species, local air and water temperature conditions, local current and tide dynamics, availability of hazardous materials clean up resources, characteristics of the type of toxic chemicals involved.
Domain Consolidated
Definition (“Snake” Color and Text)
Measurable Element of Resilience Definition
(Goal)
Corresponding Synthesized Measure
Ecosystems DARK GREEN
Resilience is the ability of a system to attain the objectives of absorbing and recovering from the impact of an adverse event, during, and after its occurrence. It is also a dynamic process that seeks to learn from incidents to strengthen capabilities of the system in meeting future challenges. The goals are to maintain continuity of function, degrading gracefully, while avoiding a fundamental change in state. It is also to recover system functionality to a pre-designated level, as rapidly as desired and feasible.
Goal Option: Continuity of Function
Resilience is measured as capacity of a system to experience disturbance and still maintain functions. Implied associated metric is a heuristic scale of capacity to absorb disturbance, e.g. High-Medium-Low or five point Likert Scale. Judgments would need to be rendered by subject matter experts with significant domain knowledge of the system of interest. Example: A certain area of wetlands needs to have a minimum average level of health among the species existing at the base of its food chain. If the same wetland area, when experiencing the effects of an toxic waste spill is observed to have dramatically reduced levels of health in samples of animals from the bottom layer of the food chain, then the wetland's resilience by this measure could (illustratively) be characterized as "weak" on a five point Likert scale (e.g. 1. Very Strong, 2. Strong, 3. Moderate, 4. Weak, 5. Very Weak)
Goal Option: Graceful Degradation
Currently unavailable
Goal Option: Recovery to Designated Level…
Resilience of an eco-system can be measured by the time it takes for a particular to return to a self-sustaining state after experiencing a specific disturbance. Evaluation of this ability is accomplished through creation of a multi-dimensional model of a specific eco-system that includes variables describing its fundamental characteristics, the key influencing factors in its environment, and the characteristics of a specific threat or hazard that can cause a disturbance and a specific time scale for interaction between the system and the threat or hazard. A specific threat or hazard scenario is applied to the model to assess its resilience according to the measure described above. Example: The ability of a grasslands area that is regularly subjected to burn-over by wildfires, initiated by natural and man-made actions, to return to a condition of ecological equilibrium can be evaluated by examining the behavior of a multi-dimensional model of the grassland system within a wildfire scenario. Model would include variables such as type and number of plant and animal species, local climactic conditions and seasonal weather dynamics,

Risk and Resilience: Exploring the Relationship
B‐27
Domain Consolidated
Definition (“Snake” Color and Text)
Measurable Element of Resilience Definition
(Goal)
Corresponding Synthesized Measure
abundance and quality of local fire ignition sources, arrival rate of arson events, arrival rate of lightning strike fire ignition events, availability of wildfire fighting resources, characteristics and dynamics of wildfire events.
Goal Option: Inhibit State Change…
Resilience can be measured as the magnitude of disturbance that can be absorbed before a system changes its structure. Evaluation of this ability is accomplished through creation of a multi-dimensional model of a specific system that includes variables describing its fundamental characteristics, the key influencing factors in its environment, and the characteristics of a specific threat or hazard that can cause a disturbance and a specific time scale for interaction between the system and the threat or hazard. A specific threat scenario is applied to the model to assess its resilience according to the measure described above. Example: The ability of an area of coral reef to resist changing its structure in the face of a toxic waste spill can be evaluated by examining the behavior of a multi-dimensional model of the reef within a hazardous materials release scenario. Model would include variables such as type and number of plant and animal species, local air and water temperature conditions, local current and tide dynamics, availability of hazardous materials clean up resources, characteristics of the type of toxic chemicals involved.
Domain Consolidated
Definition (“Snake” Color and Text)
Measurable Element of Resilience Definition
(Goal)
Corresponding Synthesized Measure
Ecosystems BLACK Resilience is a dynamic process, operating during and after an incident, with the goals of maintaining continuity of function, avoiding a fundamental change in state and recovery of system functionality to a pre-designated level, as rapidly as desired and feasible. This process seeks to learn from incidents to strengthen capabilities of the system in meeting future challenges.
Goal Option: Continuity of Function
Resilience is measured as capacity of a system to experience disturbance and still maintain functions. Implied associated metric is a heuristic scale of capacity to absorb disturbance, e.g. High-Medium-Low or five point Likert Scale. Judgments would need to be rendered by subject matter experts with significant domain knowledge of the system of interest. Example: A certain area of wetlands needs to have a minimum average level of health among the species existing at the base of its food chain. If the same wetland area, when experiencing the effects of an toxic waste spill is observed to have dramatically reduced levels of health in samples of animals from the bottom layer of the food chain, then the wetland's resilience by this measure could (illustratively) be characterized as "weak" on a five point Likert scale (e.g. 1. Very Strong, 2. Strong, 3. Moderate, 4. Weak, 5. Very Weak)
Goal Option: Recovery to Designated Level…
Resilience of an eco-system can be measured by the time it takes for a particular to return to a self-sustaining state after experiencing a specific disturbance. Evaluation of this ability is accomplished through creation of a multi-dimensional model of a specific eco-system that includes variables describing its fundamental characteristics, the key influencing factors in its environment, and the characteristics of a specific threat or hazard that can cause a disturbance and a specific time scale for interaction between the system and the threat or hazard. A specific threat or hazard scenario is applied to the model to assess its resilience according to the measure described above. Example: the ability of a grasslands area that is regularly subjected to burn-over by wildfires, initiated by natural and man-made actions, to return to a condition of ecological equilibrium can be evaluated by examining the behavior of a multi-dimensional model of the grassland system within a wildfire scenario. Model would include variables such as type and number of plant and animal species, local climactic conditions and seasonal weather dynamics, abundance and quality of local fire ignition sources, arrival rate of arson events, arrival rate of lightning strike fire ignition events, availability of wildfire fighting resources, characteristics and dynamics of wildfire events.
Goal Option: Inhibit State Change…
Resilience can be measured as the magnitude of disturbance that can be absorbed before a system changes its structure. Evaluation of this ability is accomplished through creation of a multi-dimensional model of a specific system that includes variables describing its fundamental characteristics, the key influencing factors in its environment, and the characteristics of a specific threat or hazard that can cause a disturbance and a specific time scale for interaction between the system and the threat or hazard. A specific threat scenario is applied to the model to assess its resilience according to the measure described above. Example: The ability of an area of coral reef to resist changing its structure in the face of a toxic waste spill can be evaluated by examining the behavior of a multi-

Risk and Resilience: Exploring the Relationship
B‐28
Domain Consolidated
Definition (“Snake” Color and Text)
Measurable Element of Resilience Definition
(Goal)
Corresponding Synthesized Measure
dimensional model of the reef within a hazardous materials release scenario. Model would include variables such as type and number of plant and animal species, local air and water temperature conditions, local current and tide dynamics, availability of hazardous materials clean up resources, characteristics of the type of toxic chemicals involved.
Ecosystems PINK Resilience is the ability of a system to attain the objectives of resisting, absorbing and recovering from the impact of an adverse event, before, during, and after its occurrence. It is also a dynamic process that seeks to learn from incidents to strengthen capabilities of the system in meeting future challenges. The goals are to maintain continuity of function, degrading gracefully, while avoiding a fundamental change in state. It is also to recover system functionality to a pre-designated level, as rapidly as desired and feasible.
Goal Option: Continuity of Function
Resilience is measured as capacity of a system to experience disturbance and still maintain functions. Implied associated metric is a heuristic scale of capacity to absorb disturbance, e.g. High-Medium-Low or five point Likert Scale. Judgments would need to be rendered by subject matter experts with significant domain knowledge of the system of interest. Example: A certain area of wetlands needs to have a minimum average level of health among the species existing at the base of its food chain. If the same wetland area, when experiencing the effects of an toxic waste spill is observed to have dramatically reduced levels of health in samples of animals from the bottom layer of the food chain, then the wetland's resilience by this measure could (illustratively) be characterized as "weak" on a five point Likert scale (e.g. 1. Very Strong, 2. Strong, 3. Moderate, 4. Weak, 5. Very Weak)
Goal Option: Graceful Degradation
Currently unavailable
Goal Option: Recovery to Designated Level…
Resilience of an eco-system can be measured by the time it takes for a particular to return to a self-sustaining state after experiencing a specific disturbance. Evaluation of this ability is accomplished through creation of a multi-dimensional model of a specific eco-system that includes variables describing its fundamental characteristics, the key influencing factors in its environment, and the characteristics of a specific threat or hazard that can cause a disturbance and a specific time scale for interaction between the system and the threat or hazard. A specific threat or hazard scenario is applied to the model to assess its resilience according to the measure described above. Example: The ability of a grasslands area that is regularly subjected to burn-over by wildfires, initiated by natural and man-made actions, to return to a condition of ecological equilibrium can be evaluated by examining the behavior of a multi-dimensional model of the grassland system within a wildfire scenario. Model would include variables such as type and number of plant and animal species, local climactic conditions and seasonal weather dynamics, abundance and quality of local fire ignition sources, arrival rate of arson events, arrival rate of lightning strike fire ignition events, availability of wildfire fighting resources, characteristics and dynamics of wildfire events.
Goal Option: Inhibit State Change…
Resilience can be measured as the magnitude of disturbance that can be absorbed before a system changes its structure. Evaluation of this ability is accomplished through creation of a multi-dimensional model of a specific system that includes variables describing its fundamental characteristics, the key influencing factors in its environment, and the characteristics of a specific threat or hazard that can cause a disturbance and a specific time scale for interaction between the system and the threat or hazard. A specific threat scenario is applied to the model to assess its resilience according to the measure described above. Example: The ability of an area of coral reef to resist changing its structure in the face of a toxic waste spill can be evaluated by examining the behavior of a multi-dimensional model of the reef within a hazardous materials release scenario. Model would include variables such as type and number of plant and animal species, local air and water temperature conditions, local current and tide dynamics, availability of hazardous materials clean up resources, characteristics of the type of toxic chemicals involved.

Risk and Resilience: Exploring the Relationship
C‐1
Appendix C Qualitative Risk-Resilience Relationships
Given that our understanding of risk in homeland security is relatively mature, resilience can only be linked to risk once we know what it is and how it can be measured – the purposes of Appendices A and B respectively. This appendix starts this investigation by analyzing the qualitative relationship between risk and resilience.
The Risk-Resilience Matrix To investigate the relationship between risk and resilience, the team constructed a Risk-Resilience Matrix, with three risk variables comprising the vertical axis, and eleven resilience features comprising the horizontal axis. As illustrated in figure C-1, the cells at the intersection of each variable and feature are populated with estimates of how risk variables and resilience features interact from two perspectives; risk perspective (i.e., effect of resilience features on risk variables), and resilience perspective (i.e., effect of changing risk variables on resilience features).
Resilience Features
RiskVariables
Threat
Vulnerability
Consequences
Vu
lne
rab
ilit
y Robustness
Resilience Perspective: • “Reduced vulnerability, less
robustness needed…”
Risk Perspective • “As robustness increases,
vulnerability decreases…”.
Figure C-1: Risk-Resilience Matrix
The risk variables and resilient features that comprise this matrix are discussed below. The complete Risk-Resilience Matrix can be found at annex 1 to this appendix.
Risk Variables
Risk analysis is only one of a number of inputs to decision making or what is referred to as risk management, which involves decision makers deciding what steps to take and investments to make in order to lower risks for a given situation or set of circumstances. Such analyses can be

Risk and Resilience: Exploring the Relationship
C‐2
used to inform a range of decisions spanning a variety of issues – policy development; operational priorities; resource allocations; and program assessments – in either current or projected time-frames and from highly detailed to broad strategic-level analyses.
As noted earlier, we consider risk as the product of threat, vulnerability, and consequences. We will use this formulation as we move ahead to investigate the relationship between risk and resilience. Before doing so, however, we need to further expand upon the definitions of these three variables that comprise risk.
Threat: This can be described as the estimated likelihood (i.e. probability) that a terrorist attack – or attack by any intelligent adversary –will be attempted by applying a given hazard/damage mechanism against a given target, or otherwise causing a serious disruption in the functioning of this target.90 To the extent possible, such estimates seeks to account for how the attacker’s objectives might influence target selection and number of attempts, including judgments as to whether such an adversary might be influenced by understandings of intrinsic protective capabilities of the target and additional countermeasures taken to make the potential target less attractive. For natural disasters, threat is taken to mean the likelihood (i.e. probability) that such an event will occur, with potential to cause harm against, or disrupt the functioning, of against a specific target (not considering countermeasures, as these have no bearing on occurrence of a naturally-caused event).
Vulnerability: This can be defined as the probability that, given an attempt, an attack by an intelligence adversary (e.g., terrorist) against a target will succeed in causing harm, again considering intrinsic system capabilities as well as countermeasures and/or barriers that would need to be overcome. For natural disasters, vulnerability is taken to mean that the hazard, if experienced, would result in damage to a target, again taking account of intrinsic protective characteristics as well as the existence of additional countermeasures.
Consequences: This can be considered to entail estimates of the damage or negative impacts resulting from a successful terrorist attack on a target or the occurrence of a natural disaster. These estimates would take into account the intrinsic capabilities of a target to withstand attacks as well as external measures taken before, during, and after an incident to mitigate consequences. These measures can include immediate response capabilities that might mitigate short term damage, and also recovery programs that might alleviate longer term consequences. There are many ways to express consequences, including psychological and societal implications, injuries sustained, and loss of confidence in government. However, lives lost and economic impact are the most quantifiable measures and tend to be used when rigor is needed.
90 Likelihood can be expressed as either the probability of a single event being attempted or occurring (expressed as a number between 0 and 1) or as the frequency of attempts or occurrences of the same type of incident over a given unit of time (expressed as a number greater than one). For our purposes, we consider the probability of a single threat attempt or occurrence. In this connection, we recognize that threats, hazards, or other disruptions can also take the form of a series of sustained events, where overall risk cumulates over time. This construct can be addressed in risk assessments, with frequency used instead of probability.

Risk and Resilience: Exploring the Relationship
C‐3
Resilience Features
The analytic team reviewed each of 119 relevant source entries for specific features believed to integral to resilient systems. These were then grouped into 11 basic resilience features, as summarized below.
Pre-event Activity: The capacity of individuals, organizations, communities, and certain systems to act prior to adverse events. This includes the capacity to anticipate challenges, and to plan and prepare to effectively cope with the threats or hazards that may arise. Examples include exercises conducted under the Urban Areas Security Initiative program and those supported by DHS's National Exercise Program.
Situational Awareness: The capability of people, organizations, and technology involved in an emergency situation to maintain communications and to develop a common operating picture. That common picture should provide leaders at all levels with the knowledge and understanding of the operating environment required to make timely and effective decisions in support of common priorities and objectives. Examples include the functions of state-level emergency operations centers and the watch centers operated by several FEMA regions.
Resistance: The ability to actively redirect, thwart, or attenuate a threat, hazard, or other disruption before or at time of arrival. This may consist of inherent design or retrofitting s as well as active and/or passive countermeasures. An example is the use of a firebreak to direct wild fires away from homes and businesses.
Cushionability: A system’s ability to absorb a blow and degrade slowly in response to such an event (i.e., "bend not break"). Degradation would be halted (i.e., performance "bottoms-out") at the highest feasible and warranted level. Examples include the strict fault tolerance in computer systems or low damage tolerance in structural systems.
Robustness: The inherent strength or capability of a system withstand internal or external stress and maintain critical functions. The system copes effectively with deviance in system inputs, tolerating function degradation above some specified threshold and seeking to avoid failure. An example includes a “smart” grid that keeps power flowing to all consumers through real time redistributions and re-routings in the event of a disruption.
Redundancy: The absence of complete dependence on any one subsystem critical to system performance. Redundancy focuses on alternate options and substitutions, and includes purposeful diversification and/or decentralization of critical assets or resources. An example is supply chain diversification, where multiple vendors are available to provide raw materials or resources.
Resourcefulness: The capability of individuals and groups to improvise and innovate during and after adverse event. It includes flexibility and adaptability. An example is discovering that an impacted facility can function using different fuels or power sources, enabling it to function during recovery and increasing energy sourcing options in preparation for a future disaster where traditional energy sources may not be available.
Restoration: The capability of a system to reinitiate operations after experiencing an event, at a level of performance at, below, or possibly above pre-event level. How well a system restores its functioning depends on its needs, practical constraints, and the ability
Risk and Resilience: Exploring the Relationship
C‐4
of to learn while dealing with impact. An example is refitting and retooling a manufacturing facility to increase production in the wake of a natural disaster such as an earthquake.
Rapidity: The length of time required for a system to recover to certain levels of performance after experiencing an adverse event. An example is the speed with which certain finance sector business were able to re-establish limited and then full operations after suffering enormous damage during the 9-11 attacks.
Learning Capacity: The capability of systems, organizations, organizations, and communities to routinely apply lessons learned from previous events in order to improve future performance under adverse conditions. An example is the Gulf Coast petrochemical industry’s adoption of standard operating procedures for preparing land-based refinery facilities to withstand tropical storms and hurricanes.
Affordability: The fiscal feasibility and practicality of capabilities designed into systems that enable them to cope with adversity. Optimally, this reflects a judgment regarding the threshold level of cost, investment, or resource burden at which the effort to maintain a system’s functional continuity is no longer tenable. At this threshold, the system is either allowed to fail or be subject to a change of state. An example is the investment- banking businesses that were allowed to fail or directed to reorganize in the wake of the financial crisis of 2008-2009.
Not all resilience features are relevant to addressing all resilience needs of given system. Different resilience features, singly or in combination, can support different goals and for specified stages of the event cycle to meet fixed objectives and/or underpin a continuing process. A system owner, user, or designer has a choice of options in defining what kind of resilience a given system requires. This, in turn, leads to the selection of which features need to be built into a system, either during system development or after the fact, to provide the desired level of resilience, accounting for practical issues such as resource constraints.
To show the role that features can play is setting requirements, consider the example of a designer who needs a system’s resilience to focus on the goal of graceful degradation during the event and follow an outcome based approach.91 By their very nature, this case would seem to favor embodying features of robustness and cushionability over other features such as restoration and rapidity. If, on the other hand, a system designer has a requirement to enhance a system’s resilience to satisfy every goal across all stages of the event life cycle, following both approaches, then all resilience features might be relevant to that problem.
In real applications, certain features would typically be given more weight than others in improving overall system resilience, but in our simple examples we assumed that all features are equally important. Moreover, when actually making decisions on how to enhance resilience, potential payoffs in resilience improvements from incorporating a given feature or group of features needs to be assessed in connection with specific systems, domains, and anticipated threats, hazards, or disruptions. Such assessments would also take into account the fact that some features can support multiple combinations of requirement options selected by a system designer.
91 See appendix A for key discriminators and options as elements in resilience definitions.

Risk and Resilience: Exploring the Relationship
C‐5
Ways and Means for Resilience Features Resilience features are characteristics that need to be operationally embodied into systems by use of “ways and means.” There are two broad types of ways and means, often working in concert.
“Soft” (e.g. policies, standards, and processes that increase a system’s resilience)
“Hard” (e.g. physical equipment and mechanisms to increase a system’s resilience)
Features set resilience requirements, but ways and means translate these requirements into real policies and programs. Resilience features and their associated ways and means act as a bridge between the intention of the owner, user, or designer to make a system resilient, and the embodiment of resilience improvements into the system.92 Figure C-2 depicts this construct.
What to do?
Ways andMeans
Insert ResilienceResilience Realized in the System
ResilienceFeatures
How to do it?
Figure C-2: Features versus Ways and Means
From further review of relevant source entries, the team distilled examples of hundreds of both hard and soft ways and means to insert resilience into a system. We selected a subset, both hard and soft, and organized into a table that associates them with the specific resilience features they tend to promote. This is not an exhaustive list, but it illustrates how each of the eleven resilience features might be embodied into an appropriate system for a given situation, with appropriate scaling and tailoring.
Annex 2 to this appendix captures the list of ways and means we developed for each of the eleven resilience features. Table C-1 below provides samples from this table for two features, redundancy and situational awareness.
92 Resilience ways and means are addressed in Kahan et al, "An Operational Framework for Resilience,”24-26.

Risk and Resilience: Exploring the Relationship
C‐6
Redundancy Situational Awareness
“Soft” Ways and Means
Have alternate supply chains and multiple suppliers for the same parts
Standardize communication channels to enable cooperative communication that maximizes the common operating picture for emergency personnel.
Create standards for parts and products to allow for interchangeability.
Develop protocols for reporting incident information to employees in case of disruptive event.
“Hard” Ways and Means
Decentralize major physical assets either within a single facility or across multiple facilities to make difficult the complete destruction of the assets in question.
Use system monitoring tools and computer-based early-warning systems
Carry extra inventory and safe stocks of part and finished goods on site.
Employ enabling technologies such as sensors to detect damage, material characterizations, etc around the time of the event.
Table C-1. Ways and Means for Sample Features
Certain ways and means promote specific resilience features. If a system in a specified domain is to be made more resilient in the face of anticipated disruptions, ways and means that specifically promote this feature in this set of circumstances need to be identified. Here is where attention is given to such practical issues as cost-effectiveness and trade-offs to assess the incremental payoff in enhanced system resilience for extra resources expended on additional or improved ways and means. Planners and policy makers have recognized that it is significantly easier and more cost effective to build resilience features into a system during the initial system design and creation, rather than to insert features into an operational system.
All ways and means decisions need to account for resource constraints and chose solutions offering best impact for the resources available. Under certain conditions, a saturation effect of diminishing returns could be reached in terms of how much a specific feature can, at the margin, contribute to improving the resilience of a system. In such cases, adding more ways and means for these features will expend resources and not yield significantly higher system resilience or perhaps no measurable improvements at all. Emphasis would then need to be placed on different ways and means that strengthen the system’s weaker resilience features, as long as these actions would be judged to make significant and cost-effective contributions.
One issue to be considered in connection with implementing resilience is whether resilience is necessary or appropriate for all systems in all situations. For example, it can be argued that:
Not all systems are designed to be resilient, given their purpose and threat environment, nor should they be; 93
Excessive resilience can compete with efficiency, effectiveness, competitiveness, and profitability; 94 and
93 David Arsenault and Arun Sood, “Measuring Resilience in Network-Based Infrastructures”, 87-95. For example, if a circuit breaker is too resilient to a large power surge, it may resist shutting down power with major consequences to the system. 94 Brian Walker and David Salt, Resilience Thinking 7-9; and Timothy Pettit et al., 6-8.
Risk and Resilience: Exploring the Relationship
C‐7
Too much resilience might not be warranted if it makes it difficult to transform a system that cannot continue to retain its basic state, no matter how adaptable, into an entirely new type of system that might be more beneficial from an economic or societal perspective.95
Analytic Approach to Risk-Resilience Relationships The risk-resilience matrix in annex 1 provides the foundation for three levels of qualitative analysis conducted by the team to illuminate how risk and resilience are related. The first two levels – cell level and aggregated level – are discussed in some detail below. The third level, relating risk and resilience holistically at the highest level of policy and planning, which we will not discuss here, were integrated into the broad set of qualitative relationship propositions presented in the overview section of this report.
Cell-Level Matrix Analysis
At each intersection on the risk-resilience matrix between a particular risk variable and a specific resilience feature we estimated how the fluctuation of one affects the other. Such qualitative estimates account for how the feature’s essential characteristics interact with the essential nature of the risk variable to affect the resilience of a system and risk it faces.
Each intersection between a particular risk variable and a specific resilience feature is divided into two cells representing the different but complementary perspectives:
Risk Perspective asks the question: How does each of the individual resilience features impact the behavior of each element of the risk equation?
Resilience Perspective asks the question: How does each of the risk variables impact the behavior of each resilience feature? 96
Figure C-3 depicts three examples of cell-level intersections between risk variables and resilience features applying both perspectives, based on qualitative judgments made by team members.97 Each intersection is divided into two cells – risk perspective (“blue”) and resilience perspective (“pink”).98
95 For example, if an industrial city no longer has manufacturing plants to provide work, it might be better off not attempting to be excessively resilient to change, if this blocks the path to becoming a different type of city, which can survive and thrive, where recreational and service are emphasized. 96 For the aggregated resilience perspective, we assume that, if one risk variable goes up or down, the two others remain the same, and if two both go up or both go down, the third variable remains the same. This avoids complexities and uncertainties that can arise if the risk effect of one variable moving is offset by opposite movement of a different variable. For example, although an increase in vulnerability may initially require increased robustness to prevent risk from becoming greater, the threat may simultaneously decrease, thus reducing risk and making increased robustness unnecessary. 97 Time and resources did not permit formal heuristic techniques such as Expert Elicitation to be applied, which would need to be done to validate or alter our less formally produced judgments. 98 The completer matrix at annex 1 to this appendix shows that 31 of the 33 total cells are populated with such estimates. Two cells are “not applicable,” since features of restoration and rapidity have no effect on Vulnerability due to their post-event focus.

Risk and Resilience: Exploring the Relationship
C‐8
Risk Perspective (blue cell)
“For threats and hazards that have known and well understood characteristics, vulnerability tends to decrease as robustness increases. Increased robustness will tend to decrease the degree to which an adverse event negatively affects system performance of its critical functions.”
Resilience Perspective (pink cell)
“If a system is made less vulnerable, there is less need for robustness in order to maintain the same level of resilience; or if the same level of robustness is maintained, resilience will increase. Alternatively, if a system is made more vulnerable, greater robustness is needed to maintain the same level of resilience, but if the same level of robustness is maintained, resilience will decrease. “
Risk Perspective (blue cell)
“Resistance reduces threat by reducing the capacity of human threats or natural hazards to do harm to a given asset or entity of interest. In the case of human threats, it lowers the probability of an event by making the target less attractive, if seen by intelligent adversaries. It does not affect the probability of natural hazard events from occurring. Inversely, reducing resistance may increase threat in the case of man-made threats if seen and exploited by intelligent adversaries.
Resilience Perspective (pink cell)
“If the threat decreases, less resistance is needed to maintain the same level of resilience; or if the same level of resistance is maintained, resilience will increase. Alternatively, if threat increases, more resistance is needed to maintain the same level of resilience, butif the same level o resistance is maintained, resilience decreases.
Risk Perspective (blue cell)
“Increased rapidity decreases the long-term consequences of an event. On the other hand, recuing rapidity may increase consequence.”
Resilience Perspective (pink cell)
“If circumstances change to decrease consequence (city population decreases), less rapidity is needed to maintain the same level of resilience; or if the same level of rapidity is maintained, resilience will increase. Alternatively, if circumstances change to increase consequence, more rapidity is required to maintain the same level of resilience; or if the same level of rapidity is maintained, resilience will decrease.”
Vulnerability Consequence
Robustness Rapidity
Threat
Resistance
RiskPerspective
ResiliencePerspective
RiskPerspective
ResiliencePerspective
RiskPerspective
ResiliencePerspective
Figure C-3. Examples of Risk Variables and Resilience Feature Intersections
Aggregated Level Matrix Analysis
After populating each cell in the matrix with estimates, the analytic team aggregated the results from both risk and resilience perspectives, as portrayed in figure C-4. 99
99 For the aggregated resilience perspective, we assume, as in the cell-level, that if one risk variable goes up or down, the other two remain the same, and if two variables go up or down together, the third risk variable remains the same. These trends assume that no other resilience features are adjusted to compensate for the change in risk, except the feature in question. Theoretically, strategic changes in other resilience features may offset the need for the one in question. (e.g., while an increase in vulnerability may logically require increased redundancy, if another feature is increased drastically, there may be no need for increased redundancy to maintain the same resilience, and it may even be permissible for redundancy to decrease without reducing resilience). As discussed earlier, when we say that a resilience feature must increase or decrease, we mean that ways and means must be implemented that increase specific resilience features. .
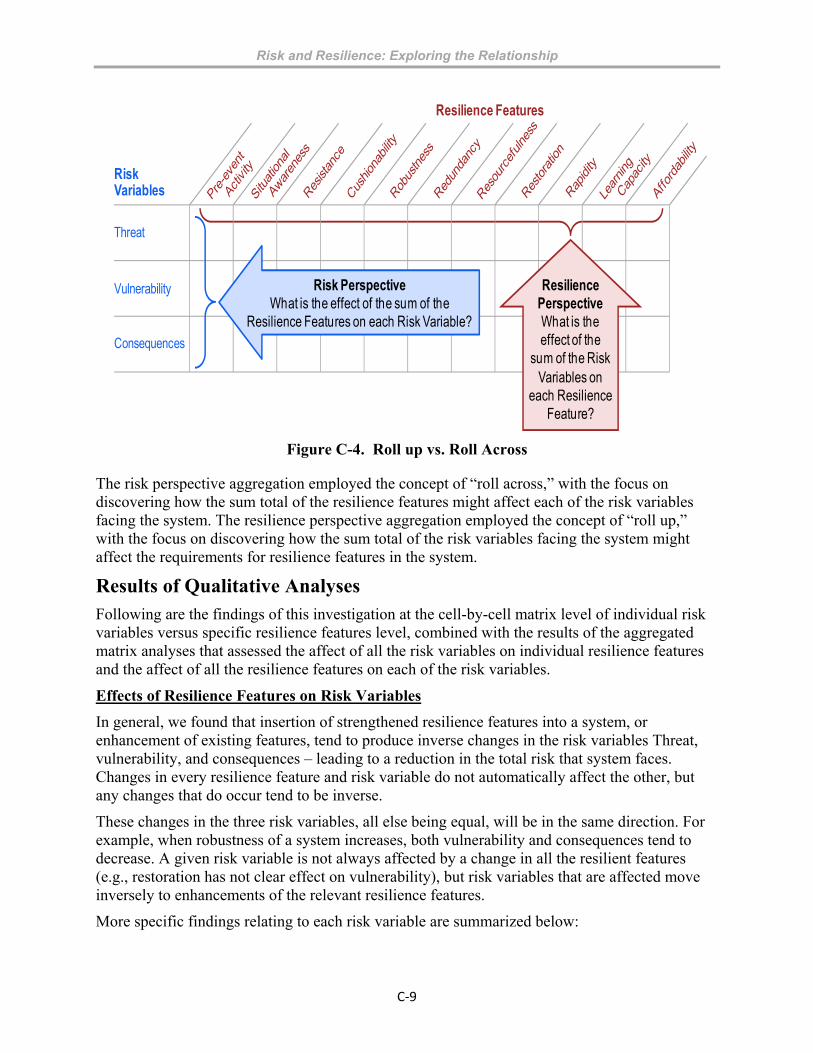
Risk and Resilience: Exploring the Relationship
C‐9
Resilience Features
RiskVariables
Threat
Vulnerability
Consequences
Risk PerspectiveWhat is the effect of the sum of the
Resilience Features on each Risk Variable?
Resilience PerspectiveWhat is the effect of the
sum of the Risk Variables on
each Resilience Feature?
Figure C-4. Roll up vs. Roll Across
The risk perspective aggregation employed the concept of “roll across,” with the focus on discovering how the sum total of the resilience features might affect each of the risk variables facing the system. The resilience perspective aggregation employed the concept of “roll up,” with the focus on discovering how the sum total of the risk variables facing the system might affect the requirements for resilience features in the system.
Results of Qualitative Analyses Following are the findings of this investigation at the cell-by-cell matrix level of individual risk variables versus specific resilience features level, combined with the results of the aggregated matrix analyses that assessed the affect of all the risk variables on individual resilience features and the affect of all the resilience features on each of the risk variables.
Effects of Resilience Features on Risk Variables
In general, we found that insertion of strengthened resilience features into a system, or enhancement of existing features, tend to produce inverse changes in the risk variables Threat, vulnerability, and consequences – leading to a reduction in the total risk that system faces. Changes in every resilience feature and risk variable do not automatically affect the other, but any changes that do occur tend to be inverse.
These changes in the three risk variables, all else being equal, will be in the same direction. For example, when robustness of a system increases, both vulnerability and consequences tend to decrease. A given risk variable is not always affected by a change in all the resilient features (e.g., restoration has not clear effect on vulnerability), but risk variables that are affected move inversely to enhancements of the relevant resilience features.
More specific findings relating to each risk variable are summarized below:

Risk and Resilience: Exploring the Relationship
C‐10
Effect on Threat. Resistance is the only resilience feature that might alter the power of a threat by actively seeking to reduce the capacity of a threat to inflict harm. All other features might have an effect on the likelihood of a threat occurring by diverting the intelligent adversary due to making the system a less attractive target.
The chances of an attempt by an intelligence adversary to harm a system can be affected by the total array of resilience features of that system. For instance, if the resilience of a system is increased by enhancing appropriate features – assuming this is accurately seen and rationally understood by a potential attacker – this might reduce or possibly negate the likelihood of an attack attempt by making the target system less attractive to adversaries.100 Adversaries may consider shifting to a different target with higher potential payoff or a greater probability of success. Conversely, the absence of resilience features that make a system less resilient may increase the threat/probability of attack if seen and exploited by intelligent adversaries.101
Different resilience features can act upon threats in different ways, for example:
The resilience feature of rapidity, or being able to quickly reinstate system functionality after experiencing an event, can increases the cost-benefit ratio for an intelligent adversary.
The resilience feature of resistance can reduce threat by actively redirecting, thwarting, and attenuating the capacity of human threats or natural hazards to cause harm.
By contrast, natural hazards, such as hurricanes and wild fires, have no consciousness and do not make decisions, but unfold according to the dynamics of the natural forces that create them and their own inherent mechanics. As a result, no resilience features are likely to be effective in influencing the probability of a natural hazard occurring.
Effect on Vulnerability. All other relevant factors remaining constant, vulnerability and resilience are inversely related: when system vulnerability is reduced, resilience is increased and when vulnerability becomes greater, system resilience drops. However, the converse is not always true: all resilience improvements are not guaranteed to affect vulnerability.102
Increases in certain resilience features, such as restoration and rapidity, reduce risk by affecting risk variables besides vulnerability. For example, a system may be vulnerable to flooding, but have the resilience to recover and restore system functionality if it occurs.103 In this case, resilience has no effect on vulnerability, yet this restoration capability makes the system more resilient and reduces the risk facing it. In other words, if vulnerability is reduced, a system becomes more resilient, but changes in resilience do not always affect vulnerability.
100 This can be viewed as having the potential effect of deterring or dissuading intelligent adversaries from attacking a target, due to an increased expectation on their behalf of the difficulty and or cost of carrying out the attack, a decreased expectation of lasting consequences following attack, and/or a decreased probability of success in carrying out an attack. 101 No addition of resilience features to a system can reduce the likelihood of the threat of natural hazards, as natural hazards do not have consciousness and do not select targets based on set of goals or objectives 102 For instance, improvements in restoration never affect vulnerability, although they could possibly affect overall risk once saturation in restoration subsides. 103 Philip Buckle et. al., “Assessing Resilience & Vulnerability: Principles, Strategies and Actions.”

Risk and Resilience: Exploring the Relationship
C‐11
All features can influence vulnerability, except restoration and rapidity, as these features are only relevant to the post-impact stage of an event. Systems that integrate the broad range of the nine relevant resilience features should tend to produce the following outcomes in relation to vulnerability.
Directly reduce the capability of a threat to inflict harm, the degree to which a threat causes damage, and the probability that a hazard succeeds inflicts its maximum force –notably, situational awareness, resistance, cushionability, and adaptive learning.104
Rather than actively decreasing the threats’ force, some features, if implemented, would provide the system with capabilities that limit the impact felt by the system, notably robustness, redundancy, and resourcefulness.
Efforts to decrease vulnerability may depend on the degree to which the characteristics of the threat or hazard are understood. Such knowledge is required to ensure that the ways and means for implementing the appropriate features – notably pre-event activity, robustness, and redundancy – are applied in effective and strategic ways.
Effect on Consequences. All eleven resilience features affect consequences, some more than others. The overarching impact on consequences is that, all other things being equal, enhancing resilience features will tend to reduce consequences, while diminishing the strength of these features will tend to increase consequences.
The relationship between resilience and consequences is the closest between resilience and any risk variable. If resilience effects risk, which is not always the case, then increases in resilience might reduce threat and vulnerability, but will always reduce consequences.
Effects of Risk Variables on Resilience Features
We found that, if all three risk variables move in the direction of increasing the overall risk to a system, this tends to result in a decrease in the operational level of the resilience of that system when faced with the same threat, hazard, or other disruption – unless appropriate features are upgraded as a means of compensation. If overall risk decreases due to changes in the risk variables, then the operational level of resilience of a system against the same adverse event will be increased.
To be more specific, 8 of the 11 resilience features have exactly the same relationship in response to overall increases in the risk to a system: resistance, cushionability, resourcefulness, robustness, pre-event activity, situational awareness, affordability, and learning capacity. This relationship can be summarized as follows, with any of the seven other relevant features substituted for cushionability:
If circumstances change to increase the sum total of the threat, vulnerability, and consequence facing the system, more cushionability is required to maintain the same level of resilience, but if the same level is maintained, resilience will decrease.
If circumstances change to decrease the sum total threat, vulnerability, consequence facing the system, less cushionability is required to maintain the same level of resilience, but if the same level of cushionability is maintained, resilience will increase.
104 Adaptive learning and situational awareness decreases probability of a successful attack, especially when instituted prior to attack, due to increase opportunities for interdiction.
Risk and Resilience: Exploring the Relationship
C‐12
The other three features have special issues regarding their relationship to specific risk variables:
Redundancy can lower system vulnerability if this feature is strengthened, but a point of diminishing returns may be reached on how much risk can be lowered.
Restoration of system performance has no direct on the vulnerability of that system, but enhancements of this feature can lower risk by reducing threat or consequences.
Rapidity also has no effect on vulnerability, but improvements in this feature can lower system risk by reducing threat or consequences, as in the case of restoration.
Finally, there are important insights about the way in which changes in threat and vulnerability variables interact with resilience, as these are the two risk variables are the drivers for a risk assessment against a given target, whose characteristics after being exposed to a hazard or damage mechanism results in consequences.
If the threat level is lowered, there is less need enhance appropriate resilience features designed to resist, absorb, or recover from that threat. Some resilience features are particularly sensitive to the degree to which the threat to the system is identified, namely robustness, redundancy, and pre-event activity.
If the risk to a system is raised due to increases in its vulnerability, that system will become less resilient, unless its features are enhanced to compensate to compensate for the increase in risk. Enhancing resilience can reduce the vulnerability of a system by reducing the capability of the threat/hazard to do harm or by equipping the system with capabilities to contain, cushion, or limit the impact felt by the system.

Risk and Resilience: Exploring the Relationship
C-13
Annex 1 to Appendix C RiskResilience Matrix
Risk Variable: Threat
Features of Resilience
Pre-event Activity Situational Awareness
Resistance Cushionability Robustness Redundancy Resourcefulness Restoration Rapidity Learning Capacity Affordability
Risk Perspective
Reduces threat. Increases relative cost to human threat trying to achieve their objective level of harm or damage to system by increasing effectiveness of countervailing mitigation and protection measures. Might reduce probability of event by making target system less attractive to intelligent adversary. Does not affect probability of natural hazard events from occurring. Inversely, reducing pre-event activity may increase threat in the case of man-made threats if seen and exploited by intelligent adversaries.
Can decrease potential for human or natural hazard to negatively affect system by enabling early strategic and tactical warning, allowing more time for preparatory and countervailing or avoidance activities. Might reduce probability of event by making target system less attractive to intelligent adversary. Does not affect probability of natural hazard events from occurring. Inversely, reducing situational awareness may increase threat in the case of man-made threats if seen and exploited by intelligent adversaries.
Reduces threat by reducing capacity of human threats or natural hazards to do harm to given asset or entity of interest. In the case of human threats, lowers the probability of event by making target system less attractive. Does not affect probability of natural hazard events from occurring. Inversely, reducing resistance may increase threat in the case of man-made threats if seen and exploited by intelligent adversaries.
Increases relative cost to human threat trying to achieve objective of inflicting desired level of harm or damage to system, and therefore, might reduce probability of event by making target system less attractive to intelligent adversary. Does not affect probability of natural hazard events from occurring. Inversely, reducing cushionability may increase threat in the case of man-made threats if seen and exploited by intelligent adversaries.
Reduces threat, Increases relative cost to human threat in trying to achieve desired level of harm or damage to system. Might reduce probability of event by making target system less attractive to intelligent adversary. Does not affect probability of natural hazard events from occurring. Inversely, reducing robustness may increase threat in the case of man-made threats if seen and exploited by intelligent adversaries.
Reduces threat. Limits severity of functional degradation experienced by system functioning due to event. Increases relative cost to human threat in trying to achieve desired level of harm or damage to system. Might reduce probability of event by making target system less attractive to intelligent adversary. Does not affect probability of natural hazard events from occurring. Inversely, reducing redundancy may increase threat in the case of man-made threats if seen and exploited by intelligent adversaries.
Reduces threat by enabling system to adapt to changes in human or natural threats' behavior. Regarding human threats, this capability accounts for intelligent nature of adversary, who can understand and seek to overcome countermeasures. Inversely, reducing resourcefulness may increase threat in the case of man-made threats if seen and exploited by intelligent adversaries.
Increases cost to human threats trying to achieve desired final result or outcome (e.g. system destruction, impairment of function). Might reduce probability of event by making target less attractive to intelligent adversary. Does not affect probability of natural hazard events from occurring. Inversely, reducing restoration capabilities may increase threat in the case of man-made threats if seen and exploited by intelligent adversaries.
Reduces threat. Limits extent to which system operations remain at impaired level of performance before return to pre-event or other levels of functioning. Greater rapidity increases relative cost to human threat trying to achieve desired outcome (e.g. system destruction, impairment of function). Might reduce probability of event by making target system less attractive to intelligent adversary. Does not affect probability of natural hazard events from occurring. Inversely, reducing rapidity may increase threat in the case of man-made threats if seen and exploited by intelligent adversaries.
Decreases degrading effects that human threat or natural hazard can have on system performance by increasing effectiveness of personnel in mitigation, protection, response, or recovery activities. Increases relative cost to a human threat in trying to achieve their desired level of system harm or damage. Might reduce probability of event by making target system less attractive to intelligent adversary. Does not affect probability of natural hazard events from occurring. Inversely, reducing adaptive learning may increase threat in the case of man-made threats if seen and exploited by intelligent adversaries.
Makes planning of attacks more reliable for intelligent adversaries if they can gain understanding of these factors. To the extent they cannot, adversaries will have to plan with uncertainty regarding level of resources those responsible for system are willing to commit to ensuring its survival and continued performance. Might reduce probability of event by making target system less attractive to intelligent adversary. Does not affect probability of natural hazard events from occurring. Inversely, reducing affordability may increase threat in the case of man-made threats if seen and exploited by intelligent adversaries.
Resilience Perspective (Cells assume no other Resilience Features are adjusted except the one in question)
If the threat decreases, less pre-event activity is needed to maintain the same level of resilience; or if the same level of pre-event activity is maintained, resilience will increase. Alternatively, if threat increases, more pre-event activity is needed to maintain the same level of resilience, but if the same level of pre-event activity is maintained, resilience decreases.
If the threat decreases, less situational awareness is needed to maintain the same level of resilience; or if the same level of situational awareness is maintained, resilience will increase. Alternatively, if threat increases, more situational awareness is needed to maintain the same level of resilience, but if the same level of situational awareness is maintained, resilience decreases.
If the threat decreases, less resistance is needed to maintain the same level of resilience; or if the same level of resistance is maintained, resilience will increase. Alternatively, if threat increases, more resistance is needed to maintain the same level of resilience, but if the same level of resistance is maintained, resilience decreases.
If the threat decreases, less cushionability is needed to maintain the same level of resilience; or if the same level of cushionability is maintained, resilience will increase. Alternatively, if threat increases, more graceful degradation capabilities are needed to maintain the same level of resilience, but if the same level of cushionability is maintained, resilience decreases.
If the threat decreases, less robustness is needed to maintain the same level of resilience; or if the same level of robustness is maintained, resilience will increase. Alternatively, if threat increases, more robustness is needed to maintain the same level of resilience, but if the same level of robustness is maintained, resilience decreases.
If the threat decreases, less redundancy is needed to maintain the same level of resilience; or if the same level of redundancy is maintained, resilience will increase. Alternatively, if threat increases, more redundancy is needed to maintain the same level of resilience, but if the same level of redundancy is maintained, resilience decreases.
If the threat decreases, less resourcefulness is needed to maintain the same level of resilience; or if the same level of resourcefulness is maintained, resilience will increase. Alternatively, if threat increases, more resourcefulness is needed to maintain the same level of resilience, but if the same level of resourcefulness is maintained, resilience decreases.
If the threat decreases, less restoration capabilities are needed to maintain the same level of resilience; or if the same level of restoration capabilities is maintained, resilience will increase. Alternatively, if threat increases, more restoration capabilities are needed to maintain the same level of resilience, but if the same level of restoration capabilities is maintained, resilience decreases.
If the threat decreases, less rapidity is needed to maintain the same level of resilience; or if the same level of rapidity is maintained, resilience will increase. Alternatively, if threat increases, more rapidity is needed to maintain the same level of resilience, but if the same level of rapidity is maintained, resilience decreases.
If the threat decreases, less adaptive learning is needed to maintain the same level of resilience; or if the same level of adaptive learning is maintained, resilience will increase. Alternatively, if threat increases, more adaptive learning is needed to maintain the same level of resilience, but if the same level of adaptive learning is maintained, resilience decreases.
If the threat decreases, less affordability is needed to maintain the same level of resilience; or if the same level of affordability is maintained, resilience will increase. Alternatively, if threat increases, more affordability is needed to maintain the same level of resilience, but if the same level of affordability is maintained, resilience decreases.

Risk and Resilience: Exploring the Relationship
C-14
Risk Variable: Vulnerability
Features of Resilience
Pre-event Activity Situational Awareness
Resistance Cushionability Robustness Redundancy Resourcefulness Restoration Rapidity Learning Capacity Affordability
Risk Perspective
For threats and hazards that have known and well understood characteristics, vulnerability tends to decrease as planning and preparedness for addressing those threats through mitigation, protection and protection activities increases. On the other hand, reducing pre-event activity may increase vulnerability.
Increased situational awareness decreases probability of success of an event due to increased opportunities of interdiction. Early strategic and tactical warning of impending natural disasters or human attacks allows more time for vulnerability reduction or management activities with regard to an asset or entity of interest. On the other hand, reducing situational awareness may increase vulnerability.
Can reduce vulnerability by reducing the probability of success/probability that natural hazard exerts maximum force, if severity of threat or hazard is mitigated significantly. On the other hand, reducing resistance may increase vulnerability.
Limits speed and severity of functional degradation experienced by system functioning due to event. May affect probability of success of human attack/probability that natural hazard exerts maximum force; e.g. additional set of levees may either a) mitigate total flood damages (impacting consequence) or b) prevent waters reaching a city (impacting both vulnerability and consequences). On the other hand, reducing cushionability may increase vulnerability.
For threats and hazards that have known and well understood characteristics, vulnerability tends to decrease as robustness increases. Increased robustness will tend to decrease the degree to which an adverse event negatively affects a system performance of its critical functions. On the other hand, reducing robustness may increase vulnerability.
For threats and hazards that have known and well understood characteristics, vulnerability tends to decrease as redundancy increases. However, with redundancy there is a point of diminishing returns where adding more back-up systems (or system elements) does not further reduce vulnerability. On the other hand, reducing redundancy may increase vulnerability.
May decrease vulnerability if capacity is exercised prior to system directly encountering a threat or hazard and suffering harm. On the other hand, reducing resourcefulness may increase vulnerability.
n/a - Restoration refers to post-boom events; vulnerability (and risk) considers estimates pre-boom.
n/a - Rapidity, as defined above does not directly affect vulnerability because it comes into play only after a hazard or threat has caused damage.
Decreases vulnerability of systems against classes of threats or hazards over time. On the other hand, reducing adaptive learning may increase vulnerability.
Application of rational judgment to allocation of resources for capabilities to cope with given threat or hazard helps ensure system is no more vulnerable to the characteristics of that threat or hazard than needed to maintain functions at established or acceptable standard. On the other hand, reducing affordability may increase vulnerability.
Resilience Perspective (Cells assume no other Resilience Features are adjusted except the one in question)
If a system is made less vulnerable, there is less need for pre-event activity in order to maintain the same level of resilience; or if same level of pre-event activity is maintained, resilience will increase. Alternatively, if a system is made more vulnerable, greater pre-event activity is needed to maintain the same level of resilience, but if the same level of pre-event activity is maintained, resilience will decrease.
If a system is made less vulnerable, there is less situational awareness is needed in order to maintain the same level of resilience; or if same level of situational awareness is maintained, resilience will increase. Alternatively, if a system is made more vulnerable, greater situational awareness is needed to maintain the same level of resilience, but if the same level of situational awareness is maintained, resilience will decrease.
If a system is made less vulnerable, less resistance is needed to maintain the same level of resilience; or if same level of resistance is maintained, resilience will increase. Alternatively, if a system is made more vulnerable, greater resistance is needed to maintain the same level of resilience, but if the same level of resistance is maintained, resilience will decrease.
If a system is made less vulnerable, there is less need for graceful degradation capabilities in order to maintain the same level of resilience; or if the same level of cushionability is maintained, resilience will increase. Alternatively, if a system is made more vulnerable, greater cushionability is needed to maintain the same level of resilience, but if the same level of cushionability is maintained, resilience will decrease.
If a system is made less vulnerable, there is less need for robustness in order to maintain the same level of resilience; or if same level of robustness is maintained, resilience will increase. Alternatively, if a system is made more vulnerable, greater robustness is needed to maintain the same level of resilience, but if the same level of robustness is maintained, resilience will decrease.
If a system is made less vulnerable, there is less need for redundancy in order to maintain the same level of resilience; or if same level of redundancy is maintained, resilience will increase. Alternatively, if a system is made more vulnerable, greater redundancy is needed to maintain the same level of resilience, but if the same level of redundancy is maintained, resilience will decrease.
If a system is made less vulnerable, there is less need to be resourceful to maintain the same level of resilience; or if same level of resourcefulness is maintained, resilience will increase. Alternatively, if a system is made more vulnerable, greater resourcefulness is needed to maintain the same level of resilience, but if the same level of resourcefulness is maintained, resilience will decrease.
Vulnerability has no effect on Restoration
Vulnerability does not affect rapidity.
If a system is made less vulnerable, there is less need to apply adaptive learning in order to maintain the same level of resilience; or if same level of adaptive learning is applied, resilience will increase. Alternatively, if a system is made more vulnerable, greater application of adaptive learning is needed to maintain the same level of resilience, but if the same level of adaptive learning is applied, resilience will decrease.
If a system is made less vulnerable, there is less affordability is needed in order to maintain the same level of resilience; or if same level of affordability is maintained, resilience will increase. Alternatively, if a system is made more vulnerable, greater affordability is needed to maintain the same level of resilience, but if the same level of affordability is maintained, resilience will decrease.
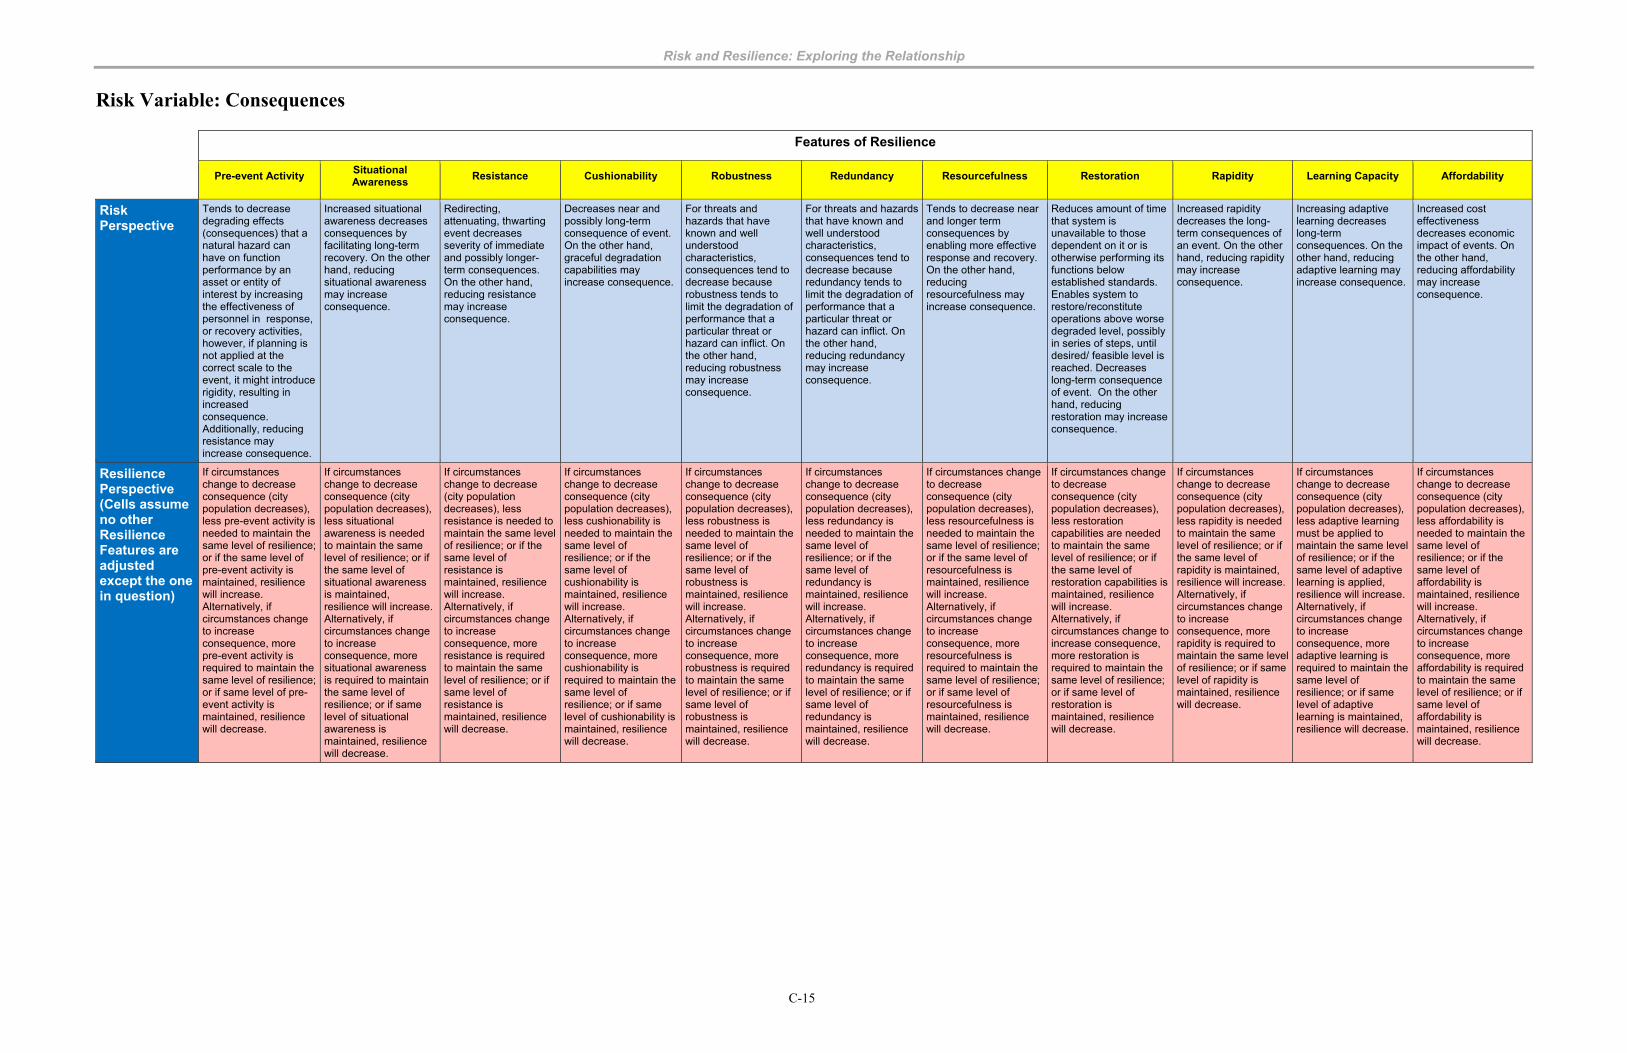
Risk and Resilience: Exploring the Relationship
C-15
Risk Variable: Consequences
Features of Resilience
Pre-event Activity Situational Awareness
Resistance Cushionability Robustness Redundancy Resourcefulness Restoration Rapidity Learning Capacity Affordability
Risk Perspective
Tends to decrease degrading effects (consequences) that a natural hazard can have on function performance by an asset or entity of interest by increasing the effectiveness of personnel in response, or recovery activities, however, if planning is not applied at the correct scale to the event, it might introduce rigidity, resulting in increased consequence. Additionally, reducing resistance may increase consequence.
Increased situational awareness decreases consequences by facilitating long-term recovery. On the other hand, reducing situational awareness may increase consequence.
Redirecting, attenuating, thwarting event decreases severity of immediate and possibly longer-term consequences. On the other hand, reducing resistance may increase consequence.
Decreases near and possibly long-term consequence of event. On the other hand, graceful degradation capabilities may increase consequence.
For threats and hazards that have known and well understood characteristics, consequences tend to decrease because robustness tends to limit the degradation of performance that a particular threat or hazard can inflict. On the other hand, reducing robustness may increase consequence.
For threats and hazards that have known and well understood characteristics, consequences tend to decrease because redundancy tends to limit the degradation of performance that a particular threat or hazard can inflict. On the other hand, reducing redundancy may increase consequence.
Tends to decrease near and longer term consequences by enabling more effective response and recovery. On the other hand, reducing resourcefulness may increase consequence.
Reduces amount of time that system is unavailable to those dependent on it or is otherwise performing its functions below established standards. Enables system to restore/reconstitute operations above worse degraded level, possibly in series of steps, until desired/ feasible level is reached. Decreases long-term consequence of event. On the other hand, reducing restoration may increase consequence.
Increased rapidity decreases the long-term consequences of an event. On the other hand, reducing rapidity may increase consequence.
Increasing adaptive learning decreases long-term consequences. On the other hand, reducing adaptive learning may increase consequence.
Increased cost effectiveness decreases economic impact of events. On the other hand, reducing affordability may increase consequence.
Resilience Perspective (Cells assume no other Resilience Features are adjusted except the one in question)
If circumstances change to decrease consequence (city population decreases), less pre-event activity is needed to maintain the same level of resilience; or if the same level of pre-event activity is maintained, resilience will increase. Alternatively, if circumstances change to increase consequence, more pre-event activity is required to maintain the same level of resilience; or if same level of pre-event activity is maintained, resilience will decrease.
If circumstances change to decrease consequence (city population decreases), less situational awareness is needed to maintain the same level of resilience; or if the same level of situational awareness is maintained, resilience will increase. Alternatively, if circumstances change to increase consequence, more situational awareness is required to maintain the same level of resilience; or if same level of situational awareness is maintained, resilience will decrease.
If circumstances change to decrease (city population decreases), less resistance is needed to maintain the same level of resilience; or if the same level of resistance is maintained, resilience will increase. Alternatively, if circumstances change to increase consequence, more resistance is required to maintain the same level of resilience; or if same level of resistance is maintained, resilience will decrease.
If circumstances change to decrease consequence (city population decreases), less cushionability is needed to maintain the same level of resilience; or if the same level of cushionability is maintained, resilience will increase. Alternatively, if circumstances change to increase consequence, more cushionability is required to maintain the same level of resilience; or if same level of cushionability is maintained, resilience will decrease.
If circumstances change to decrease consequence (city population decreases), less robustness is needed to maintain the same level of resilience; or if the same level of robustness is maintained, resilience will increase. Alternatively, if circumstances change to increase consequence, more robustness is required to maintain the same level of resilience; or if same level of robustness is maintained, resilience will decrease.
If circumstances change to decrease consequence (city population decreases), less redundancy is needed to maintain the same level of resilience; or if the same level of redundancy is maintained, resilience will increase. Alternatively, if circumstances change to increase consequence, more redundancy is required to maintain the same level of resilience; or if same level of redundancy is maintained, resilience will decrease.
If circumstances change to decrease consequence (city population decreases), less resourcefulness is needed to maintain the same level of resilience; or if the same level of resourcefulness is maintained, resilience will increase. Alternatively, if circumstances change to increase consequence, more resourcefulness is required to maintain the same level of resilience; or if same level of resourcefulness is maintained, resilience will decrease.
If circumstances change to decrease consequence (city population decreases), less restoration capabilities are needed to maintain the same level of resilience; or if the same level of restoration capabilities is maintained, resilience will increase. Alternatively, if circumstances change to increase consequence, more restoration is required to maintain the same level of resilience; or if same level of restoration is maintained, resilience will decrease.
If circumstances change to decrease consequence (city population decreases), less rapidity is needed to maintain the same level of resilience; or if the same level of rapidity is maintained, resilience will increase. Alternatively, if circumstances change to increase consequence, more rapidity is required to maintain the same level of resilience; or if same level of rapidity is maintained, resilience will decrease.
If circumstances change to decrease consequence (city population decreases), less adaptive learning must be applied to maintain the same level of resilience; or if the same level of adaptive learning is applied, resilience will increase. Alternatively, if circumstances change to increase consequence, more adaptive learning is required to maintain the same level of resilience; or if same level of adaptive learning is maintained, resilience will decrease.
If circumstances change to decrease consequence (city population decreases), less affordability is needed to maintain the same level of resilience; or if the same level of affordability is maintained, resilience will increase. Alternatively, if circumstances change to increase consequence, more affordability is required to maintain the same level of resilience; or if same level of affordability is maintained, resilience will decrease.

Risk and Resilience: Exploring the Relationship
C-16

Risk and Resilience: Exploring the Relationship
C-17
Annex 2 to Appendix C Ways and Means for Resilience Features Resistance Cushionability Restoration Resourcefulness Redundancy Robustness
Soft Ways & Means Conduct risk assessments at both the component and network levels to identify the hazards the system is likely to face, and its vulnerabilities
Private companies offering operational capabilities to help communities rebound from disasters.
Test and exercise scenarios that challenge employees to respond to unexpected and stressful circumstances that require adjustments to established plans and procedures
Have alternate supply chains and multiple suppliers for the same parts
Industry needs to take a proactive role in developing, deploying, and exercising plans that will ensure that a disruption in the supply-chain will not result in a crippling blow to business
Restrict access to key sites or facilities to unauthorized personnel.
Promote wide public participation in disaster management and recovery
Foster a “culture of resilience” in the office that encourages flexibility and adaptability in business operations, in case of a disruptive event.
Create standards for parts and products to allow for interchangeability.
Develop and exercise business continuity plans
Hard Ways & Means
Create barriers to confine/restrict portions of a facility with the potential for harm
Design and develop self-diagnosing and self-healing cyber systems
Flexible manufacturing facilities that produce standardized, multi-use, and customizable products to ease tailoring for meeting unexpected needs during disruptions.
Decentralize major physical assets either within a single facility or across multiple facilities to make difficult the complete destruction of the assets in question.
Develop website that can continue to receive orders despite having a loss of power in the main facility that may prevent the company from immediately processing orders.
Create new technological aids for border screening
Have an accessible reserve of personnel, material, and financial resources
Carry extra inventory and safe stocks of part and finished goods on site.
Build hazard resistance into initial facility design and strengthen/reinforce it as it ages (protective walls, etc.)
Rapidity Pre‐event Activity Situational Awareness Affordability Learning CapacitySoft Ways & Means
Develop and exercise time-sensitive disaster recovery plans for a local business
Develop deliberate programs to improve the resilience level of a community and its members by improving their response skills, strategies, and ways to cope with crises.
Standardize communication channels to enable cooperative communication that maximizes the common operating picture for emergency personnel.
Develop resource allocation plans and strategies for disruptive events
Incorporate lessons learned from tests, exercises, and past disruptions into current emergency plans
Exercise response plans that focus on quick and effective action
Public education to enhance individual knowledge, responsibility and preparedness.
Embed enterprise-wide early warning capability into day-to-day business operations and culture
Introduce quality control and procedure reviews for business continuity practices
Develop protocols for reporting incident information to employees in case of disruptive event.
Establishing regular forums to promote the resiliency concept, and share best practices.
Hard Ways & Means
Preparing equipment and system beforehand for restoration to service, and rebuilding
Use system monitoring tools and computer-based early-warning systems
Develop software that allocates funds and resources for emergency management resources in a way that maximizes cost efficiency.
Employ enabling technologies such as sensors to detect damage, material characterizations, etc around the time of the event.

Risk and Resilience: Exploring the Relationship
C-18

Risk and Resilience: Exploring the Relationship
D-1
Appendix D Quantitative Risk-Resilience Relationships
This appendix first describes the parameters that define our resilience model, with proposed measures and metrics to assess and compare the resilience of different systems in different situations. The discussion then focuses on developing a quantitative relationship between risk and resilience.
Model for a Resilience Profile Resilience Model and Parameters
Figure D-1 portrays our model, which we call a resilience profile. The model uses straight lines as a first-order approximation to the bathtub shape that describes a system’s overall behavior after being impacted.105 This approach helps demonstrates conceptual points and simplifies the calculations, allowing for rapid analysis of many variations. Developing a more accurate model is considerably more complex and less user-friendly.
Performance(Percent)
100
80
60
40
20
0
D R
B
A
Bt
C
Time
Resilience ParametersD = Disruption to System
R = Capability to attenuate or mitigate effect prior to the event
A = Capability to absorb and degrade
B = Bottom out; Threshold Level
Bt = Length of time at bottom
C = Capability to reconstitute back to initial level
t1 t2 t3
Figure D-1: Resilience Profile
In our model, the profile of a system’s resilience – whether actual or desired – is established by the parameters D, R, A, B, Bt, and C, as highlighted in the above figure. Note that parameters R, A, B, Bt, and C, are internal system characteristics, which a system user can affect, while D is an external parameter, which cannot be affected by the user.
105 The literature offers many quantitative approaches to charactering and measuring resilience, but these approaches are limited, not easily generalized or widely accepted, and not fully compatible with our analytic needs. “Bathtub” curves to depict a system’s performance appear in many sources. Kahan et al, “An Operational Framework for Resilience,” depicts a series of “bathtubs’ and offers the construct of a “resilience profile, 24.

Risk and Resilience: Exploring the Relationship
D-2
A more detailed discussing of these parameters follows:
Disruption to System (D). The external disruption to the system that either impacts the system directly or interacts with the resistance of the system prior to impact.106 The parameter of resistance is addressed immediately below.
Resist/Attenuate/Mitigate (R). The capability of the system to attenuate, mitigate, thwart, or redirect the severity of an event prior to system impact. This capability interacts with the disruption such that the system only experiences the attenuated or mitigated severity of an adverse event. If this capability leads to full blockage or redirection, then the system does not experience any impact from the disruption. Not all systems have this active resistance capability. In such cases, the full force of the disruption impacts the system.
Absorb (A). The capability of the system to absorb primary and secondary effects of an event, resulting in some degree of degradation in system performance will degrade. This is measured as a negative slope, i.e. the rate of degradation. A highly resilient system tends to have a shallow, negative slope, indicating minimal degradation in performance.
Bottom out (B). The minimal level of performance, or threshold level, that the system reaches after the event. This is measured as percent of performance. Very resilient systems tend to have high threshold levels, indicating only limited performance degradation.
Length of time at bottom (Bt).The amount of time the system spends at the minimal level of performance before reconstituting itself. This is measured in units of time. The longer this time period, the less a system can be characterized as resilient in terms of this factor.
Reconstitute (C). The capability to reconstitute back to the initial level of performance.107 Measured as a positive slope, i.e. the rate at which the system reconstitutes. A highly resilient system would tend to recover quickly, following a steep, positive slope.
The equations that form the model over time are piecewise functions, which are defined by the three critical time intervals in the event cycle of a given disruption: t1, when performance degradation stops and levels out; t2, when the system begins its reconstitution; and t3, when the system again reaches full performance. See annex 1 to this appendix for these equations.
The model we developed is taken to be normative and representative. As in the case of our consolidated resilience definitions and synthesized resilience measures, however, it can be scaled, scoped, and tailored to meet the needs and responsibilities of various stakeholders and their particular circumstances. These can include different kinds and levels of systems, the domain(s) in which these systems operate, the hazards or threats faced by these systems, and the capabilities and resources available.
A key issue is how the values of the various system performance parameters are established. The external parameter D can be estimated by assuming a given disruption that might endanger the system and the net force that impacts the system after taking account of its active resistance
106 We use “disruption” to denote the full spectrum of threats, hazards, and other challenges that can impact a system and adversely affect its performance. This can be a one-time event, but can also reflect cumulative effects on a system that has been affected by a series of disruptions. 107 For purposes of this analysis, we assume that the system returns to its pre-event level of functioning. In many cases, however, a system might return to a lesser or a higher level. We can build these options into the model.

Risk and Resilience: Exploring the Relationship
D-3
(R).108 The five internal parameters need to be estimated by assessing the current or desired resilience capabilities of relevant system features and associated ways and means as these influence each of the straight lines that define a system profile in our model. How each of the 11 resilience features we developed in appendix C correlates with the five internal resilience parameters is shown in the parameters-features matrix at annex 2 to this appendix.
Measures and Metrics The team to developed two measures with associated metrics tailored to the needs of our resilience model: area and shape.109 We only consider internal system parameters when applying metrics to comparing resilience profiles, as the external force is not a comparative factor and can be ignored or assumed to be constant for all profiles.
Area of Resilience Profile
The total area within the resilience profile measures the amount of disruption to the system using metrics of performance-time units, consistent with the vertical and horizontal axes shown in the normative profile depicted in figure D-1 above. Area can then be used as a metric to measure the relative “goodness” of different profiles, as shown in figure D-2.
Figure D-2. Different Resilience Profiles
For example, the profile on the extreme right of figure D-2, with the largest area, reflects relatively low system resilience. The profile on the extreme left, with the smallest area, reflects relatively high system resilience. The two middle profiles have the same area and reflect relatively average system resilience.
In choosing between the equal area profiles, a user can apply other factors selecting a solution. For example, these profiles have very different shapes. This suggests that the area of a profile serves as a necessary, but not always a sufficient, indicator of preferred system resilience.
Shape of Resilience Profile
In our taxonomy, resilience profiles are classified into a particular type by considering the combination of two key profile characteristics: threshold level (i.e., lowest level of performance to which the system falls as a percent of 100% full performance); and degradation time (i.e. how long for the system to reach its lowest level of performance as percent of total event time).
108 See later section on how to measure a disruption, its net force on the system, and its affect on system resilience. 109 Other metrics were considered, but these were judged to be the most useful, especially as they subsume other factors. For example, time spent at the bottom and rate of recovery is addressed by the way we define and calculate degradation time, as discussed below.
High Resilience Average Resilience Low Resilience

Risk and Resilience: Exploring the Relationship
D-4
Threshold Level. In our resilience profile model, the parameter B represents the lowest level of performance degradation to which a system falls as a result of experiencing a disruption or its threshold level. This metric is expressed as a percent of the pre-event level, with the latter normalized at 100 % performance. In figure D-1 above, for example, the threshold level is 60%. All other factors equal, a higher threshold level of, say, 80% would tend to be characterized as representing better system resilience in this respect than a profile with a lower threshold level of, say, 40%.
Degradation Time. This metric is the time a system takes over its entire event cycle to fall to the threshold level as a percent of its overall event cycle time. In figure D-1, assume that time for the system to bottom out, T1, is reached after three days, and the total time from impact to full recovery, T3, is 10 days. In this case, degradation time would be 3/10 or 30%. All other factors equal, a longer degradation time of, say, 50 %, would be “better,” and a shorter time, say 15%, would be “worse” in terms of system resilience.
We developed four basic profile type classifications considering combinations of these metrics:
Type 1: High threshold, long degradation time. The system experiences very little degradation and takes a long time to reach the threshold.
Type 2: High threshold, short degradation time. The system experiences very little degradation and takes a short time to reach the threshold.
Type 3: Low threshold, long degradation time. The system experiences considerable degradation and takes a long time to reach the threshold.
Type 4: Low threshold, short degradation time. The system experiences considerable degradation and takes a short time to reach the threshold.
These profile types are represented in the quad chart in figure D-3. 110
High Threshold
LongDegradation
Time
Type 1
Low Threshold
ShortDegradation
Time
Type 2
Type 4Type 3
Figure D-3. Resilience Shape Types
110 Concepts of “short” and “long” degradation, as well as “high” and “low” threshold levels, are meant as comparative measures: a “high threshold” for one system might be considered “low” in another context.

Risk and Resilience: Exploring the Relationship
D-5
In reviewing the quad chart, we observe that:
A relatively high resilient system in the face of a disruption falls slightly in performance and degrades slowly to this level. This shape is positioned as Type 1 in the upper left hand corner of the chart.
A relatively low resilience system drops significantly in performance and degrades rapidly to this level. This shape is positioned as Type 4 in the lower right of the chart.
To underscore the utility of the shape measure, consider the representative profiles for Types 2 and 3 in figure D-3 above, both of which happen to have the same area.111 While satisfied with the area of either profile, users with different needs, threats, and contexts may not find both shapes equally acceptable. For instance, if it is critically important to a user that the performance level does not drop below a certain threshold level, even if it remains at this level for an extended period and does not recover rapidly, then the Type 2 profile would be selected over Type 3.
Two examples can be used to illustrate how resilience profile needs can differ:
If the system is a Command Center, it cannot allow its functionality to fall below a very small degradation in performance without compromising critical national security issues, although it can take additional time to recover to full performance – favoring profile Types 1 and 2.
On the other hand, if the system is a supermarket checkout operation, it can rapidly lose and rehire cashiers, with a major gap in performance as a new shift settles in – favoring a profile similar to Types 3 and 4.
The second quad chart in figure D-4 below, is similar to the chart in figure D-3, but displays units of metric values for threshold level and degradation time to provide a quantitative basis for classifying profile shapes. It also populates the chart with eight different illustrative profiles.
Degradation Time (Percent)
Type 1
ThresholdLevel
(Percent)
Type 2
Type 4Type 3
01000
100
Figure D-4. Classifying Profile Shape
111 The Type 2 profile has been scaled down to fit on diagram.

Risk and Resilience: Exploring the Relationship
D-6
The ways in which profiles are positioned in the foregoing quad chart are guided by these rules:
The threshold metric range of between zero and 100% degradation of initial performance is shown on the vertical axis. The threshold cutoff level between the top and bottom quads is 50% of full performance.
The percent time at a degraded level from zero to 100% is shown on the horizontal axis. The cutoff value between the left and right quads is 50 % of total event cycle time to reach the fully degraded level.
The value of each of these individual metrics for a given profile, taken in combination, thus determines how to assign that profile to one of the four quadrants, establishing its basic Type. For simplification purposes, only four distinct types were developed for use in our analysis. However, a user requiring greater granularity in the types being presented may choose to either alter the classification by changing the cut-off metrics for each measure, or introduce additional cut-off points within these metrics to increase the number of different types being considered. One potential alternative classification is depicted below in figure D-5.
In this alternative classification, threshold levels are still classified into two groups: above and below 50%. However, degradation time is now classified by thirds: above 66.7%, between 33.3% and 66.7%, and below 33%. This additional level of specificity may help planners discern between different resilience solutions for a given system and set of circumstances.
Degradation Time (Percent)
Type 1
ThresholdLevel B
(Percent)
Type 2
Type 4
Type 3
01000
100
66.7 33.3
Type 5 Type 6
Figure D-5. Potential Alternative Profile Classification

Risk and Resilience: Exploring the Relationship
D-7
Applying the Model and Measures
With resilience modeled and measures and metrics developed, this section addresses how these quantitative tools can be applied to system comparisons, design, planning, and resource allocation. As suggested, a user may be strict on one aspect of the curve, such as the time at bottom, but be more lenient on the other aspects. Using their preferences and priorities, a user can choose certain profiles over others by inspecting the specific variables that form the curve.
Comparing Extreme Resilience Profiles
Planners can use shape metrics to compare and contrast different ways that a system might be made resilient in a systematic and quantitative manner. Here we compare two extreme resilience profiles by applying the metrics discussed above, with the results shown in figure D-6. Profile A, classified as a Type 4 shape (i.e., system with relatively low resilience), has an area over five times the size of Profile B, classified as a Type 1 shape (i.e., system with relatively high resilience). This comparison looks about right from diagrams, but is quantitatively supported by calculating the area values in performance-time units, shown in the boxes under the profiles.
Resilience Profile A(Shape Type 4)
Resilience Profile B(Shape Type 1)
Time Time0 100 0 100
Performance
0
100
Performance
0
100
Area (performance-time units): 4257Threshold B: 35%Degradation Time: 10%
Area (performance-time units): 800Threshold B: 75%Degradation Time: 85%
Figure D-6. Comparing Extreme Resilience Profiles
Two examples illustrate the utility of this construct:
If there is interest in seeking to maintain a system’s continuity of operations with a high threshold level (i.e., relatively small degradation in performance during and immediately after an event), metrics analysis shows more precisely than can be judged by viewing the diagrams alone that the threshold for Profile A is 35% of full performance, while the threshold for Profile B is at 75% of full performance. From this perspective, Profile A is over twice as “good” as Profile B and would be the preferred choice.
If there is an interest in a system with low degradation time (i.e., time spent in reaching the bottom level of performance), metrics analysis shows more precisely than through visualization alone that Profile B spends 85% of the total event time reaching its threshold, while Profile A falls to this level in only 10% of the total time. From this perspective, Profile A is over eight times “better” than Profile B and again would be preferable.

Risk and Resilience: Exploring the Relationship
D-8
Other factors such as the cost of incorporating resilience would have to be considered in making a final decision, but, with all these factors equal, Profile A wins the competition – if priority is placed on high threshold and low degradation time.
Selection of Resilience Profiles for Planning
The purpose of formulating resilience measures is to help a user or designer decide on where their resources should be allocated to best suit a specific system’s needs and priorities. A process for addressing this problem was developed, which entails screening a series of resilience profiles first though an “area metric filter” and then through a “shape metric filter.” The final “filter” involves a cost-effective assessment of the profile that to determine whether the solution is feasible, and, if not, to revisit and adjust area and shape preferences.
By putting the possible profiles through these filters, the result is a resilience profile that suits the user’s needs. If the resource requirements for this solution exceed what is available, the process can be repeated with altered filters in an attempt to find a solution that may not be optimal, but sufficient and with an acceptable resource level.112 Figure D-7 portrays how the filtering process can be applied to produce the single best resilience profile, given user priorities.
Time
0 10050
Performance(Percent)
0
100
Time
0 10050
Performance(Percent)
0
100
Time
0 10050
Performance(Percent)
0
100
Time
0 10050
Performance(Percent)
0
100
Area Filter
Shape Filter
Cost-Benefit Analysis
Time
0 10050
Performance(Percent)
0
100
Time
0 10050
Performance(Percent)
0
100
Time
0 10050
Performance(Percent)
0
100
Time
0 10050
Performance(Percent)
0
100
Time
0 10050
Performance(Percent)
0
100
Time
0 10050
Performance(Percent)
0
100
(Filters through all areas thatare ≤ 2,000 resilience units)
(Type preferences in descendingorder: 1, 3, 2, 4 …)
(What profile is cheapest tomaintain? Is this feasible?)
Figure D-7. Filtering Profiles for Best Solution
112 See Kahan, et al., “An Operational Framework for Resilience,” for a planning construct that illustrates ways of trading allocation of fixed resources as a function of different desired profile shapes.

Risk and Resilience: Exploring the Relationship
D-9
The filtering process depicted above can be explained as follows:
Area filter: the first resilience profile presented has an unacceptable level of resilience, and is excluded from consideration
Shape filter: all of these profiles are of Type 2. All have threshold levels above 50%, and all spend a minority of the time degrading. However, the profile on the right is the one closest to being a Type 4: its threshold level is 60%, and it has a degradation time of 10%. Therefore, we exclude that profile from consideration.
Cost-benefit analysis: Choosing between Type 4 and Type 2, it might be the case that the high threshold level reflected in Type 2 is too expensive to maintain, despite the fact that it has a preferred resilience profile shape type. Therefore, the decision might be to select the Type 4 as the planning scenario resilience profile.
Effect of Disruptions on the Resilience Profile The discussion of how to model and select a preferred resilience profile assumes that the Resistance (R) of the system and the external Disruption (D) to the system remain constant. From the perspectives of planners, designers, and users, however, these two parameters are fundamentally different: R can be controlled as part of the system’s features and implementing ways and means, while the types and sizes of D can only be anticipated, based on past experience.
Analytically speaking, D is defined as the hazard, blow, or challenge to the system by an external force, whether a natural phenomenon, such as a hurricane, or a terrorist attack, employing an IED or chem.-bio weapon. The varieties of different scenarios, adversaries, systems, and other variables inherent to any given attack, require the measurement of D to be specific to its domain, context, location, and hazard or threat.
If there can be an understanding of the impact of a range of disruptions on the resilience profile of a system, planners and designers can consider how best to incorporate “hedges” into a system. These would take the form of planning and preparedness steps aimed at ensuring sufficient resilience against a future spectrum of possible disruptions.
With this purpose in mind, we now examine the relationship between differing levels of disruption and their subsequent affect on the parameters of our resilience.
Measuring Disruptions
D is measured with respect to the worst-case expected consequences is the loss of a system due to a disruption, given only its inherent capabilities, and no additional preventative measures, protection against, response to, and recovery from the event are taken. The units of measurement are dollar loss calculated as the sum of the economic loss in dollars due to the event and lives lost translated into dollars.113
In our exploration of the relationship of a disruptive event to system resilience, we posit that the system only responds to the Severity of an event (S), measured as the difference between the Disruption and the system’s inherent capability to Resist (i.e., S=D-R). Resistance is expressed as an absolute value, with same units as disruption. Resistance subtracts from the initial level of Disruption to yield the Severity of the force actually impacting the system, which is also measured in the same units as disruption. 113 This measure is also used in many risk calculations, as will be discussed below.

Risk and Resilience: Exploring the Relationship
D-10
Changes in Severity are driven only by changes in Disruption, since Resistance is an inherent system feature. Such changes are assumed to affect each system parameter independently, such that a decrease in severity leads to a proportional decrease in: absorption rate (A) and time at threshold (Bt), but an increase in: threshold level (B) and reconstitution rate (C). 114
Effects on System Performance
Given the above propositions and assumptions, figure D-8 below illustrates how a typical system might respond to various levels of disruption, each of which results in various levels of severity, after the fixed level of resistance is considered.
Three levels of external disruptions are illustrated in figure D-8: a baseline force of 150 units; a second force of 120 units; and a third force of 100 units. In all cases, Resistance is held constant at 50 units. The Severity of the impact actually experienced by the system – external force minus 50 units of Resistance – is 100 units for the original case (Force 1), 70% of the original in the second case (Force 2), and 50 % of the original in the third case (Force 3).
The graphs in this figure illustrate the corresponding changes in the resilience profiles, given proportional changes in the severity of the disruption. It can be seen that a system’s profile changes non-linearly, when a disruption changes linearly – i.e., shapes associated with the second and third cases are not proportionally smaller versions of the profile for the original case.
Time0 4020
Performance(Percent)
0
100
60
20
40
60
80
Force 1
Force 2 (70% of Force 1)
Force 3 (50% of Force 1)
Figure D-8. Three Comparative Resilience Profiles
The rates of change or slopes of the lines composing each of the three profiles in the above figure are amplified by the graphs in figure D-9 following. These highlight the positive, negative, or neutral changes in performance for each profile, as a function of the major time intervals when that system experiences differing levels of disruptions.
114 See profile parameters defined above.
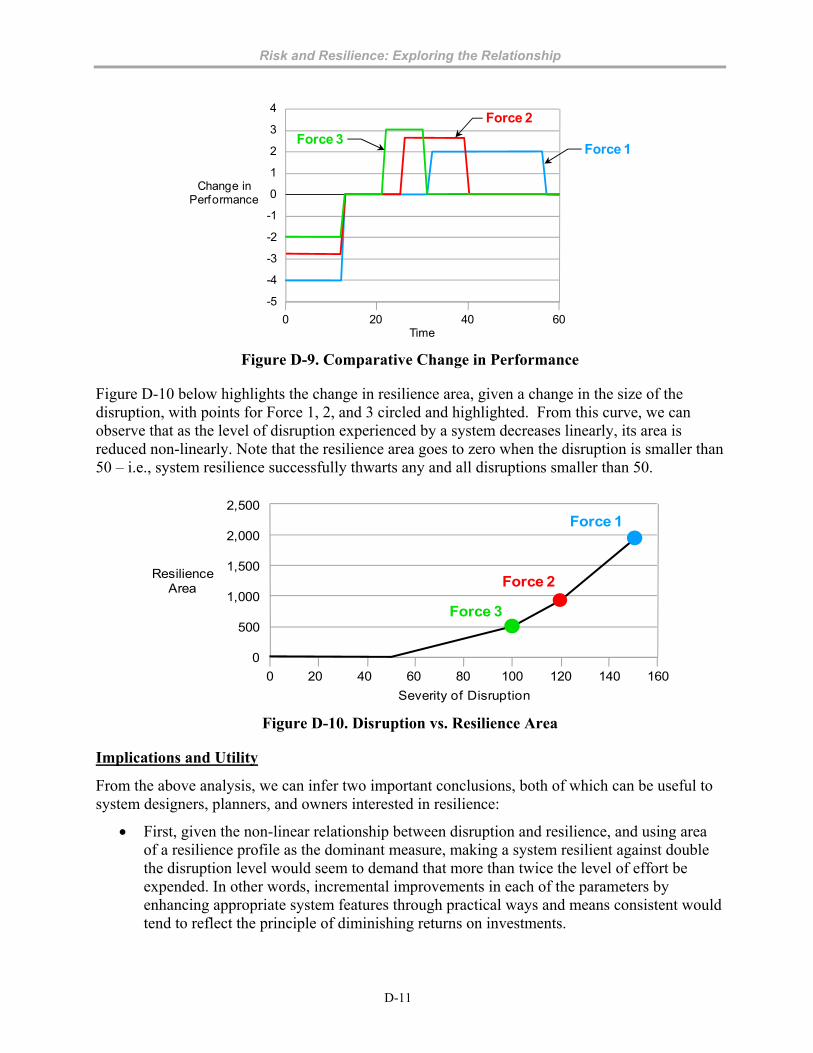
Risk and Resilience: Exploring the Relationship
D-11
Time0 4020
Change inPerformance
-1
4
60
0
1
2
3
-2
-3
-4
-5
Force 1
Force 2
Force 3
Figure D-9. Comparative Change in Performance
Figure D-10 below highlights the change in resilience area, given a change in the size of the disruption, with points for Force 1, 2, and 3 circled and highlighted. From this curve, we can observe that as the level of disruption experienced by a system decreases linearly, its area is reduced non-linearly. Note that the resilience area goes to zero when the disruption is smaller than 50 – i.e., system resilience successfully thwarts any and all disruptions smaller than 50.
Severity of Disruption
0 4020
ResilienceArea
2,000
60
0
500
1,000
1,500
Force 1
Force 2
Force 3
80 100 120 140 160
2,500
Figure D-10. Disruption vs. Resilience Area
Implications and Utility
From the above analysis, we can infer two important conclusions, both of which can be useful to system designers, planners, and owners interested in resilience:
First, given the non-linear relationship between disruption and resilience, and using area of a resilience profile as the dominant measure, making a system resilient against double the disruption level would seem to demand that more than twice the level of effort be expended. In other words, incremental improvements in each of the parameters by enhancing appropriate system features through practical ways and means consistent would tend to reflect the principle of diminishing returns on investments.

Risk and Resilience: Exploring the Relationship
D-12
Second, given the resilience parameters of a system, it is possible to “work backwards” in determining the disruption that would cause that specific shape. For instance, consider a baseline posited “worst-case” disruption of D = 100 encountering a system having R = 20 with its resilience parameters set at A = -3.0, B = 55, Bt = 20, and C = 4.0. If we are now given slightly different system parameters of R = 20, A = -1.5, B = 55, Bt = 10, and C = 2.0, we can calculate the value of D that produces these parameters as D = 60.
Vulnerability as a Key Link between Risk and Resilience To formulate a quantitative relationship between risk and resilience, vulnerability plays a central role in our method. It is not only a key risk variable, but widely discussed in the literature as directly affecting the resilience of a system.
In our approach, we investigate how changes in Vulnerability affect each of the system resilience parameters, and thereby the system’s overall resilience profile and area measure. We also see how risk values change by varying vulnerability (V), holding constant the two other risk variables, threat (T) and consequences (C).115
A conceptual diagram showing the potential relationships between V and the five system resilience parameters is shown in figure D-11. Notice that V is not linked to disruption (D), as this parameter is exogenous to the system. Rather, V is related to resistance (R), an internal system parameter that operates on D, resulting in the net force that actually impacts the system, as discussed above.
T
Resilience = f(R, A, B, Bt, C, D)Risk = T V C
D
V
C
R
A
B
Bt
C
Figure D-11. Illustrative Links Between Vulnerability and Resilience Parameters
We can now turn to relating risk and resilience quantitatively by analyzing the affect of changing vulnerability on both risk and resilience values.
115 Threat and Consequences can affect the resilience parameters and the overall resilience of a system, but because they are held at a constant value, they have no relative impact on changes in resilience as vulnerability changes.
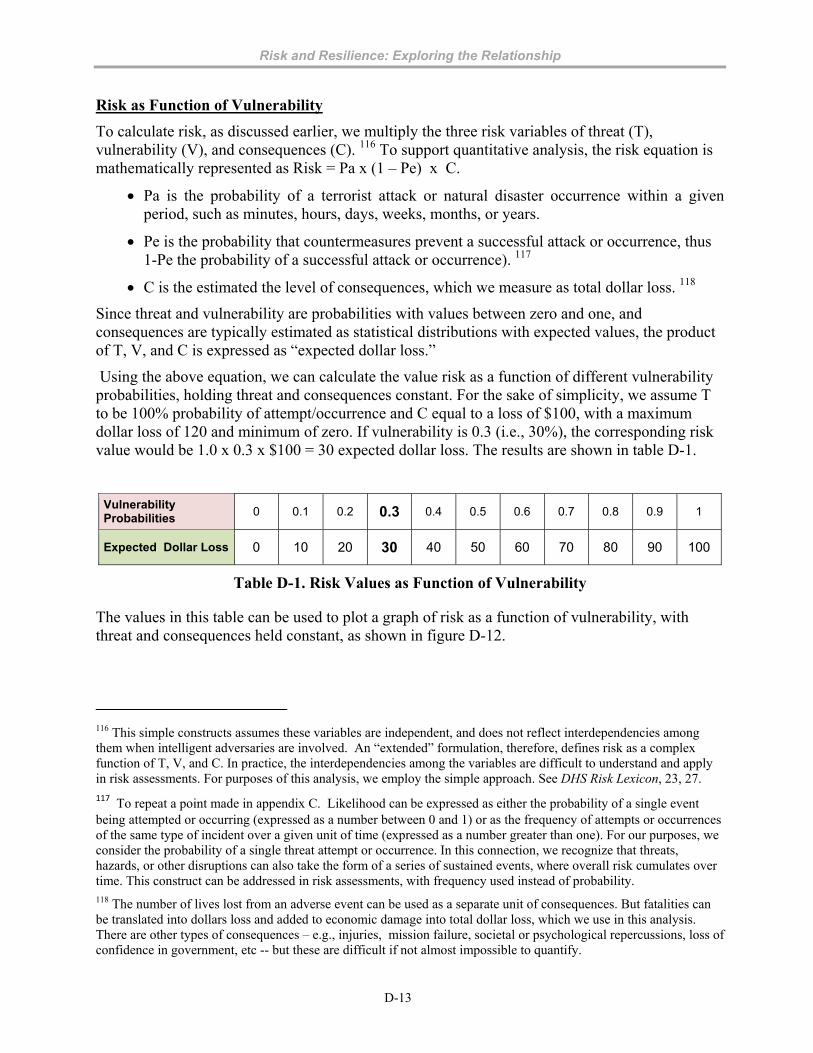
Risk and Resilience: Exploring the Relationship
D-13
Risk as Function of Vulnerability
To calculate risk, as discussed earlier, we multiply the three risk variables of threat (T), vulnerability (V), and consequences (C). 116 To support quantitative analysis, the risk equation is mathematically represented as Risk = Pa x (1 – Pe) x C.
Pa is the probability of a terrorist attack or natural disaster occurrence within a given period, such as minutes, hours, days, weeks, months, or years.
Pe is the probability that countermeasures prevent a successful attack or occurrence, thus 1-Pe the probability of a successful attack or occurrence). 117
C is the estimated the level of consequences, which we measure as total dollar loss. 118
Since threat and vulnerability are probabilities with values between zero and one, and consequences are typically estimated as statistical distributions with expected values, the product of T, V, and C is expressed as “expected dollar loss.”
Using the above equation, we can calculate the value risk as a function of different vulnerability probabilities, holding threat and consequences constant. For the sake of simplicity, we assume T to be 100% probability of attempt/occurrence and C equal to a loss of $100, with a maximum dollar loss of 120 and minimum of zero. If vulnerability is 0.3 (i.e., 30%), the corresponding risk value would be 1.0 x 0.3 x $100 = 30 expected dollar loss. The results are shown in table D-1.
Vulnerability Probabilities
0 0.1 0.2 0.3 0.4 0.5 0.6 0.7 0.8 0.9 1
Expected Dollar Loss 0 10 20 30 40 50 60 70 80 90 100
Table D-1. Risk Values as Function of Vulnerability
The values in this table can be used to plot a graph of risk as a function of vulnerability, with threat and consequences held constant, as shown in figure D-12.
116 This simple constructs assumes these variables are independent, and does not reflect interdependencies among them when intelligent adversaries are involved. An “extended” formulation, therefore, defines risk as a complex function of T, V, and C. In practice, the interdependencies among the variables are difficult to understand and apply in risk assessments. For purposes of this analysis, we employ the simple approach. See DHS Risk Lexicon, 23, 27. 117 To repeat a point made in appendix C. Likelihood can be expressed as either the probability of a single event being attempted or occurring (expressed as a number between 0 and 1) or as the frequency of attempts or occurrences of the same type of incident over a given unit of time (expressed as a number greater than one). For our purposes, we consider the probability of a single threat attempt or occurrence. In this connection, we recognize that threats, hazards, or other disruptions can also take the form of a series of sustained events, where overall risk cumulates over time. This construct can be addressed in risk assessments, with frequency used instead of probability. 118 The number of lives lost from an adverse event can be used as a separate unit of consequences. But fatalities can be translated into dollars loss and added to economic damage into total dollar loss, which we use in this analysis. There are other types of consequences – e.g., injuries, mission failure, societal or psychological repercussions, loss of confidence in government, etc -- but these are difficult if not almost impossible to quantify.
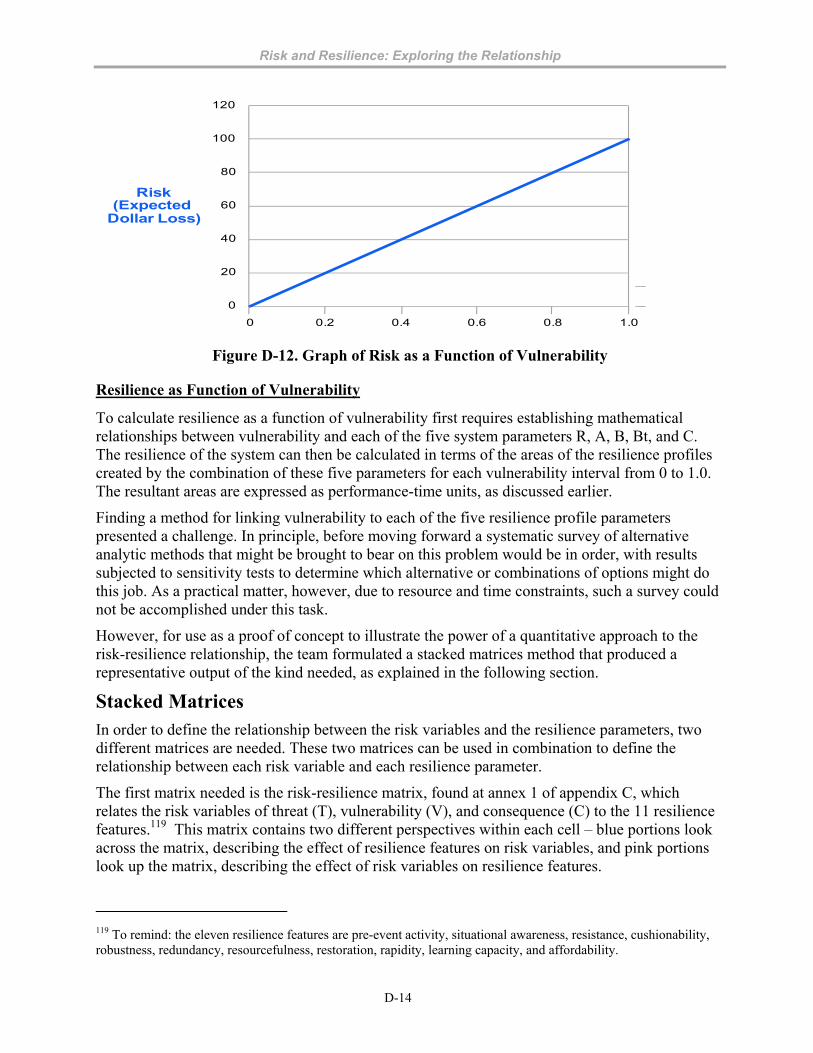
Risk and Resilience: Exploring the Relationship
D-14
0 1.00.2
Risk(Expected
Dollar Loss)
0
100
80
60
40
20
0.4 0.6 0.8
120
Figure D-12. Graph of Risk as a Function of Vulnerability
Resilience as Function of Vulnerability
To calculate resilience as a function of vulnerability first requires establishing mathematical relationships between vulnerability and each of the five system parameters R, A, B, Bt, and C. The resilience of the system can then be calculated in terms of the areas of the resilience profiles created by the combination of these five parameters for each vulnerability interval from 0 to 1.0. The resultant areas are expressed as performance-time units, as discussed earlier.
Finding a method for linking vulnerability to each of the five resilience profile parameters presented a challenge. In principle, before moving forward a systematic survey of alternative analytic methods that might be brought to bear on this problem would be in order, with results subjected to sensitivity tests to determine which alternative or combinations of options might do this job. As a practical matter, however, due to resource and time constraints, such a survey could not be accomplished under this task.
However, for use as a proof of concept to illustrate the power of a quantitative approach to the risk-resilience relationship, the team formulated a stacked matrices method that produced a representative output of the kind needed, as explained in the following section.
Stacked Matrices In order to define the relationship between the risk variables and the resilience parameters, two different matrices are needed. These two matrices can be used in combination to define the relationship between each risk variable and each resilience parameter.
The first matrix needed is the risk-resilience matrix, found at annex 1 of appendix C, which relates the risk variables of threat (T), vulnerability (V), and consequence (C) to the 11 resilience features.119 This matrix contains two different perspectives within each cell – blue portions look across the matrix, describing the effect of resilience features on risk variables, and pink portions look up the matrix, describing the effect of risk variables on resilience features.
119 To remind: the eleven resilience features are pre-event activity, situational awareness, resistance, cushionability, robustness, redundancy, resourcefulness, restoration, rapidity, learning capacity, and affordability.
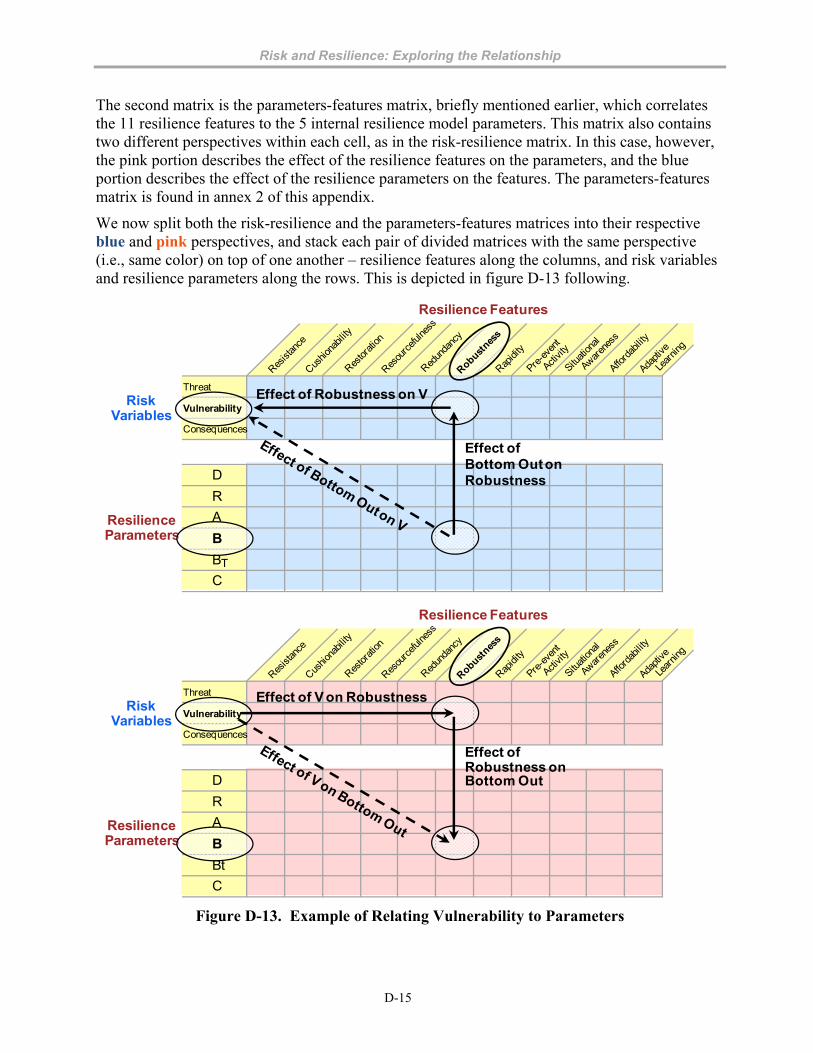
Risk and Resilience: Exploring the Relationship
D-15
The second matrix is the parameters-features matrix, briefly mentioned earlier, which correlates the 11 resilience features to the 5 internal resilience model parameters. This matrix also contains two different perspectives within each cell, as in the risk-resilience matrix. In this case, however, the pink portion describes the effect of the resilience features on the parameters, and the blue portion describes the effect of the resilience parameters on the features. The parameters-features matrix is found in annex 2 of this appendix.
We now split both the risk-resilience and the parameters-features matrices into their respective blue and pink perspectives, and stack each pair of divided matrices with the same perspective (i.e., same color) on top of one another – resilience features along the columns, and risk variables and resilience parameters along the rows. This is depicted in figure D-13 following.
RiskVariables
Threat
Consequences
Resilience Features
ResilienceParameters
D
R
A
Bt
C
Effect of V on Robustness
Effect ofRobustness onBottom Out
Vulnerability
B
RiskVariables
Threat
Consequences
Resilience Features
ResilienceParameters
D
R
A
BT
C
Effect of Robustness on V
Effect ofBottom Out onRobustness
Vulnerability
B
Figure D-13. Example of Relating Vulnerability to Parameters
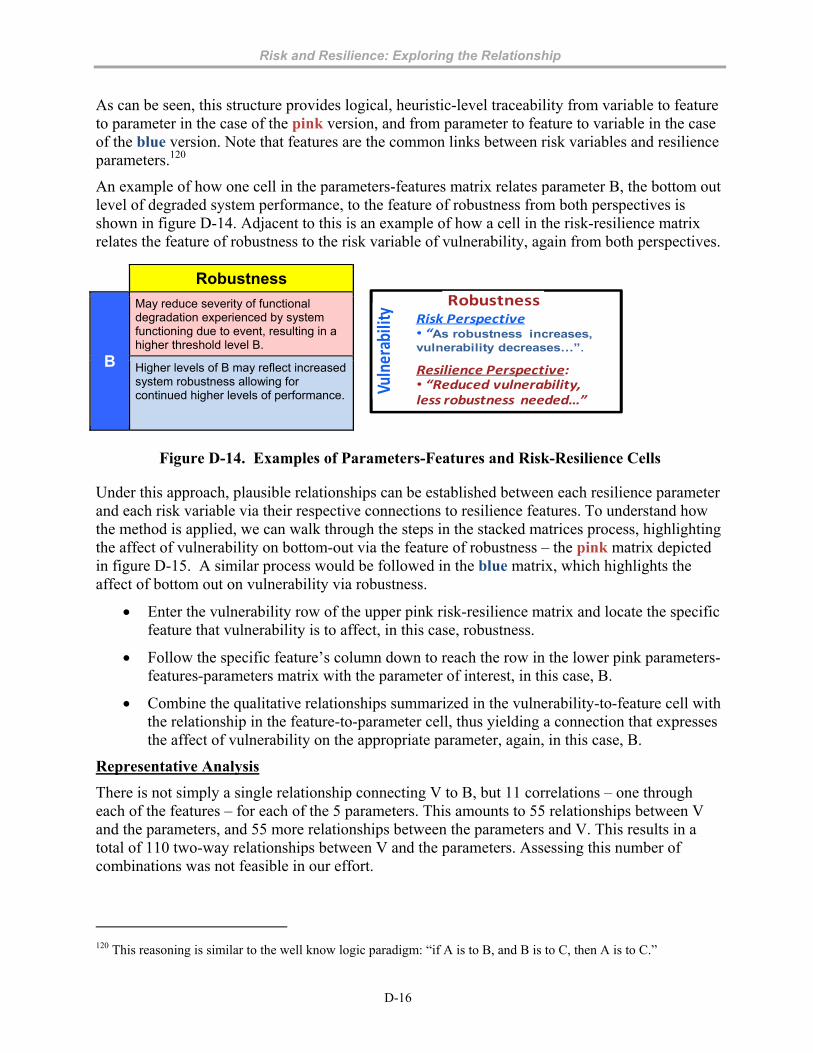
Risk and Resilience: Exploring the Relationship
D-16
As can be seen, this structure provides logical, heuristic-level traceability from variable to feature to parameter in the case of the pink version, and from parameter to feature to variable in the case of the blue version. Note that features are the common links between risk variables and resilience parameters.120
An example of how one cell in the parameters-features matrix relates parameter B, the bottom out level of degraded system performance, to the feature of robustness from both perspectives is shown in figure D-14. Adjacent to this is an example of how a cell in the risk-resilience matrix relates the feature of robustness to the risk variable of vulnerability, again from both perspectives.
Vulnerability
Robustness
Resilience Perspective: • “Reduced vulnerability, less robustness needed…”
Risk Perspective • “As robustness increases, vulnerability decreases…”.
Figure D-14. Examples of Parameters-Features and Risk-Resilience Cells
Under this approach, plausible relationships can be established between each resilience parameter and each risk variable via their respective connections to resilience features. To understand how the method is applied, we can walk through the steps in the stacked matrices process, highlighting the affect of vulnerability on bottom-out via the feature of robustness – the pink matrix depicted in figure D-15. A similar process would be followed in the blue matrix, which highlights the affect of bottom out on vulnerability via robustness.
Enter the vulnerability row of the upper pink risk-resilience matrix and locate the specific feature that vulnerability is to affect, in this case, robustness.
Follow the specific feature’s column down to reach the row in the lower pink parameters- features-parameters matrix with the parameter of interest, in this case, B.
Combine the qualitative relationships summarized in the vulnerability-to-feature cell with the relationship in the feature-to-parameter cell, thus yielding a connection that expresses the affect of vulnerability on the appropriate parameter, again, in this case, B.
Representative Analysis
There is not simply a single relationship connecting V to B, but 11 correlations – one through each of the features – for each of the 5 parameters. This amounts to 55 relationships between V and the parameters, and 55 more relationships between the parameters and V. This results in a total of 110 two-way relationships between V and the parameters. Assessing this number of combinations was not feasible in our effort.
120 This reasoning is similar to the well know logic paradigm: “if A is to B, and B is to C, then A is to C.”
Robustness
B
May reduce severity of functional degradation experienced by system functioning due to event, resulting in a higher threshold level B.
Higher levels of B may reflect increased system robustness allowing for continued higher levels of performance.

Risk and Resilience: Exploring the Relationship
D-17
As it turned out, we were able to limit our analysis to consideration of two features: cushionability and robustness. This is due to the fact that not all features are relevant to making a system resilient, but only those features needed to support the resilience goal for the system – determined by the user and designer, given the nature of the system, the disruptions anticipated, and its domain of operation.
For our representative case, we assumed graceful degradation as the priority resilience design goal, with the aim of enabling the system’s performance to degrade slowly over time in response to a threat, hazard, or other disruption during and in the immediate aftermath of the event.121 We judged that the features of cushionability and robustness are most relevant to attaining this goal and carried these into our stacked matrices analysis.122
As an initial step, the team used the blue and pink stacked matrices to produce a series of heuristically-established relationships, from both perspectives, between vulnerability and each of the five internal resilience parameters.
The team then derived a series of simple mathematical graphs that captured the essence of these relationships, based on the following assumptions:
When vulnerability and resilience parameter are non-continuous, we assume the graphs have two parts, “low” vulnerability (0 < V < 0.5) and “high” vulnerability (0.5 < V < 1).123
Cushionability does not relate to resilience profile parameters Bt, C, or R.
Resilience features are assumed to be independent of each other.124
Figure D-15 below depicts the series of graphs generated by the approach discussed above.
Cushionability Robustness
A
121 See appendix A for key discriminators with options described that include Graceful Degradation. See appendix C for summaries of each of these and other features.
122 Details of the estimates and calculations used in this representative application of the Stacked Matrices method are available on request. 123 Vulnerability should be considered in the context of the resilience feature being studied. A cushioned and robust system has low probabilities of failure, and, therefore, can be considered as having “low” vulnerability. 124 This is not necessarily the case, even though features are relatively distinctive and distinguishable, as there can be areas of overlap between certain aspects of certain features.
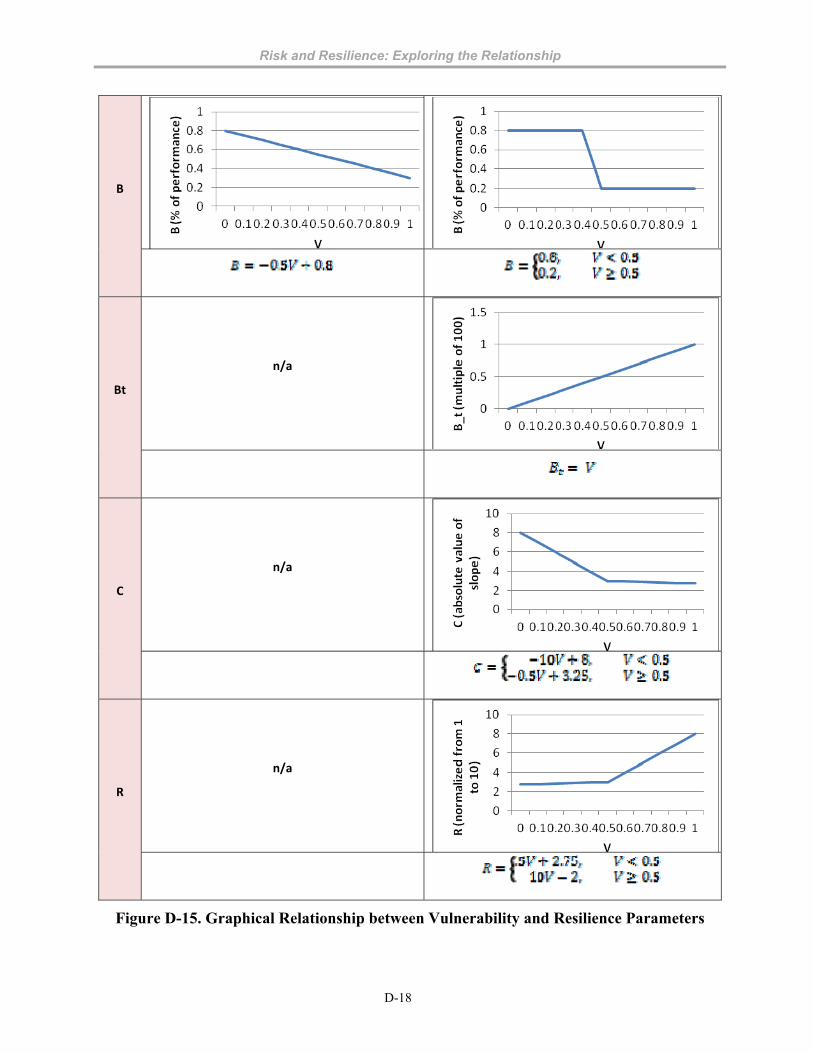
Risk and Resilience: Exploring the Relationship
D-18
B
Bt
n/a
C
n/a
R
n/a
Figure D-15. Graphical Relationship between Vulnerability and Resilience Parameters
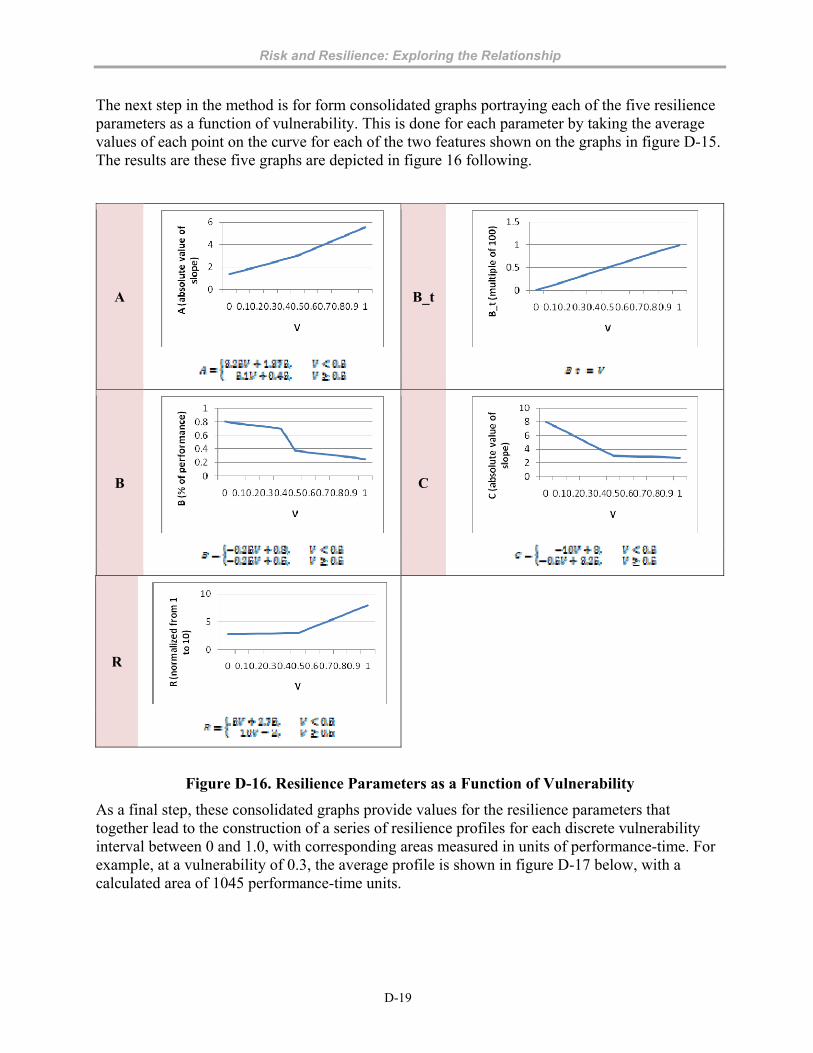
Risk and Resilience: Exploring the Relationship
D-19
The next step in the method is for form consolidated graphs portraying each of the five resilience parameters as a function of vulnerability. This is done for each parameter by taking the average values of each point on the curve for each of the two features shown on the graphs in figure D-15. The results are these five graphs are depicted in figure 16 following.
A B_t
B C
R
Figure D-16. Resilience Parameters as a Function of Vulnerability
As a final step, these consolidated graphs provide values for the resilience parameters that together lead to the construction of a series of resilience profiles for each discrete vulnerability interval between 0 and 1.0, with corresponding areas measured in units of performance-time. For example, at a vulnerability of 0.3, the average profile is shown in figure D-17 below, with a calculated area of 1045 performance-time units.
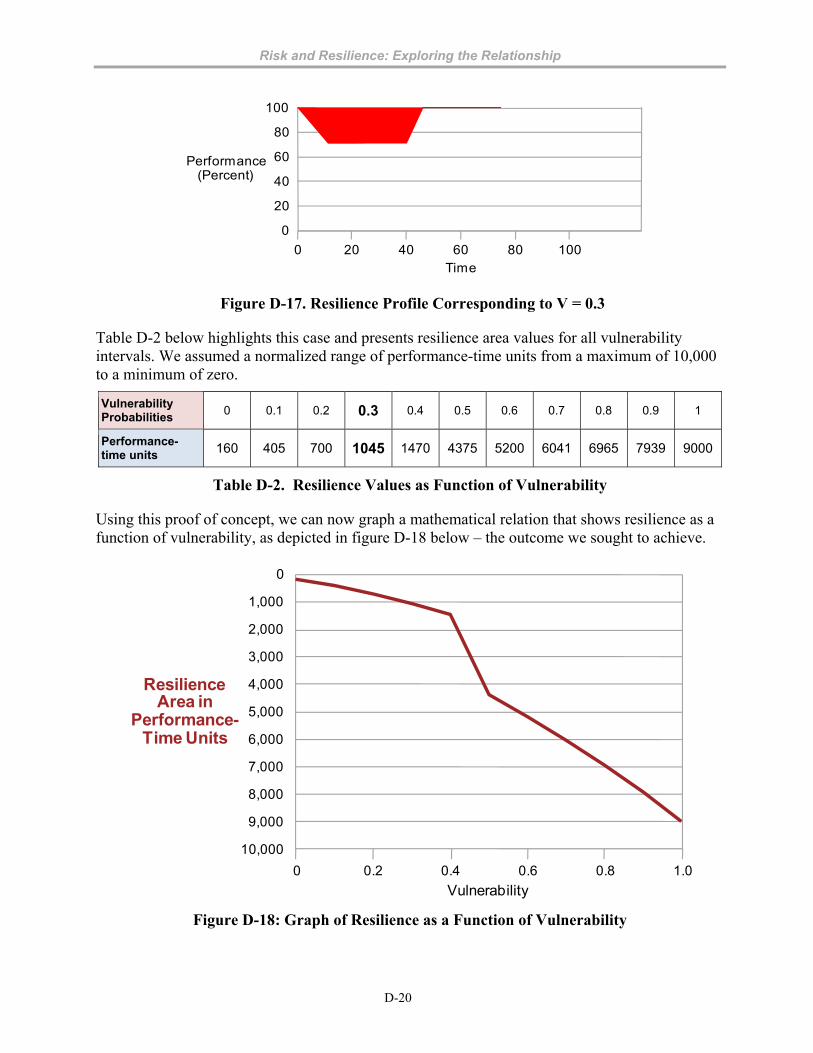
Risk and Resilience: Exploring the Relationship
D-20
Time0 10020
Performance(Percent)
0
100
80
60
40
20
40 60 80
Figure D-17. Resilience Profile Corresponding to V = 0.3
Table D-2 below highlights this case and presents resilience area values for all vulnerability intervals. We assumed a normalized range of performance-time units from a maximum of 10,000 to a minimum of zero.
Vulnerability Probabilities
0 0.1 0.2 0.3 0.4 0.5 0.6 0.7 0.8 0.9 1
Performance-time units 160 405 700 1045 1470 4375 5200 6041 6965 7939 9000
Table D-2. Resilience Values as Function of Vulnerability
Using this proof of concept, we can now graph a mathematical relation that shows resilience as a function of vulnerability, as depicted in figure D-18 below – the outcome we sought to achieve.
Vulnerability0 1.00.2 0.4 0.6 0.8
ResilienceArea in
Performance-Time Units
0
1,000
2,000
3,000
4,000
5,000
6,000
7,000
8,000
9,000
10,000
Figure D-18: Graph of Resilience as a Function of Vulnerability

Risk and Resilience: Exploring the Relationship
D-21
While these proof of concept results for resilience as a function of vulnerability should not be taken to represent validated outcomes, we believe the overall trends developed are roughly representative of what would be derived from applying a more comprehensive and validated method. For this reason, we carry these results forward in our analysis to illustrate the potential utility of a quantitative approach to the risk-resilience relationship.
Risk and Resilience Quantitatively Related
We can now graphically depict and compare both risk and resilience as a function of vulnerability by plotting the risk graph in figure D-12 and the resilience graph in figure D-18 as on the same set of axes, as shown in figure D-19 following.
.
Vulnerability0 1.00.2
Risk(Expected
Dollar Loss)
0
100
80
60
40
20
0.4 0.6 0.8
120
ResilienceArea
(Performance-Time)
0
1,000
2,000
3,000
4,000
5,000
6,000
7,000
8,000
9,000
10,000
Figure D-19. Risk Value versus Resilience Area as Function of Vulnerability
Note that the left axis on the graph displays the full range of risk values from the maximum of 120 lives lost to the minimum of zero lives lost. The right axis displays the full range of resilience areas, from the assumed maximum of 10,000 normalized resilience units to the minimum of zero. The blue graph shows risk values and the red graph shows resilience values in their respective units of measure.125 The numbers of these axes are reversed, with the zero risk value and maximum area values at the – i.e., low risk values in expected dollars loss means low risk, but high resilience values in performance-time units (i.e., large area), means low resilience.
125 Because we used discrete values of V, graphs are composed of straight-line approximations of a smooth relationship. This approximation is consistent with our use of straight lines in drawing the resilience profile.

Risk and Resilience: Exploring the Relationship
D-22
The blue graph above shows a linear relationship between risk and vulnerability. Because we use the product T x V x C with T and C constant, this produces a function of the general form, y= mx, where y is the risk value, and x is the vulnerability. Therefore, the slope is determined by m = T x C = 1.0 * 100 = 100. This explains why this graph as a straight line with a slope of 100.
The red graph, however, reflect regions of non-linear behavior in the relationship between resilience and vulnerability. Recall that vulnerability affects each resilience parameter individually and that the combination of the parameters then affects the shape of the profile. Furthermore, as pointed out earlier, while the shape and parameters of the resilience profile change linearly, the area does not. It is of little surprise, therefore, that the resilience graph, while representing an overall downward trend as vulnerability increases, contains non-linearities.
While figure D-19 shows risk and resilience varying independently as a function of vulnerability, figure D-20 shows the direct relationship between risk and resilience by plotting their trends as one graph for different values of V. This unified risk-resilience graph displays non-linear behavior, due to the dynamics of the resilience model.
Resilience Area in Performance-Time Units
9,000 4,0008,000
Risk(Expected
Dollar Loss)
0
100
80
60
40
20
7,000 6,000 5,000
120
3,000 2,000 1,000 0
LowResilience
HighResilience
High
Low
Vulnerability = 1
V = 0.8
V = 0.6
V = 0.5
V = 0.4
V = 0.3
V = 0.2
V = 0.1
Figure D-20: Risk and Resilience Relationship as Function of Vulnerability
While not “smooth” with a constant downward slope, the graph shows an overall inverse relationship between risk and resilience. In a limited way without validation, this proof of concept result can be said to quantitatively endorse our qualitative finding to this effect, as discussed in appendix C.
It can be presumed that the general shape and overall trend of the risk-resilience curve will probably be the same in for any system across the four domains facing broad categories of

Risk and Resilience: Exploring the Relationship
D-23
disruptions. But it will also likely be the case that particular characteristics of this curve will vary for specific systems and situations.
A validated graph along the lines illustrated in figure D-20 can be potentially useful to a variety of system users, designers, and other stakeholders. It can offer a useful visual vehicle for informing decisions on resource allocations, supporting tradeoff analyses, and enabling risk and resilience outcomes to be compared and contrasted across a wide range of situations.
More Complex Risk-Resilience Relationships Although useful insights were generated by our proof or concept approach to demonstrate quantitative risk-resilience relationships, we were forced by time and resource constraints to limit the application of this method by only using vulnerability as a linkage factor and considering only two of the eleven resilience features in developing a mathematical relationship between this variable and the resilience profile parameters. More complete and complex analyses are needed to develop a more credible and accurate set of risk-resilience relationships.
Accordingly, an extension of our method would seek to generate mathematical relations between the five resilience profile parameters and each of the three of the risk variables – threat (T) and consequences (C) as well as vulnerability (V) – assuming the two others remained constant. This would be done using the entire set of eleven resilience features.
If such an extension were done, this might be expected to produce three pairs of risk-resilience graphs for each of the T, V, C risk variables, along the lines of what we developed for the case of two features and vulnerability. These sets of extended outputs are illustrated in figure D-21. Results of this kind can be useful to different stakeholders in different situation. For example, first responders may be most interested in exploring the effects of reduced consequence on their system’s overall resilience, instead of focusing on the effects of reduced vulnerability.

Risk and Resilience: Exploring the Relationship
D-24
Threat
Vulnerability
Consequences
Vulnerability0 1.00.2
0
100
50
0.4 0.6 0.8
150 0
2,000
4,000
6,000
8,000
10,000
Threat0 0.2
Risk(Expected
Dollar Loss)
0
40
20
0.4 0.6
60
Resilience Areain Performance-
Time Units
0
500
1,000
1,500
2,000
Consequence0 50
0
40
20
100 150
60 0
500
1,000
1,500
2,000
2,500
3,000
Resilience Area in Performance-Time Units
1,500 1,000
Risk(Expected
Dollar Loss)
0
40
20
500 0
60
2,0002,500
Resilience Area in Performance-Time Units
6,000 4,0000
100
50
2,000 0
150
8,00010,000
Resilience Area in Performance-Time Units
1,500 1,0000
40
20
500 0
60
2,000
Risk(Expected
Dollar Loss)
Resilience Areain Performance-
Time Units
Risk(Expected
Dollar Loss)
Risk(Expected
Dollar Loss)
Resilience Areain Performance-
Time Units
Risk(Expected
Dollar Loss)
Figure D-21. Risk versus Resilience Graphs for all Risk Variables
A further refinement of the proof of concept would be to move beyond considering each risk variable independently and consider combinations of T, V, and C as they uniformly increase or decrease, analyzing their impact on each of the resilience parameters. While complex, this approach seems doable and might lead to valuable additional insights. Even more complex, with questionable feasibility and uncertain payoffs, would be to analyze random combinations of risk variables moving independently in different way, seeking to determine the overall impact on resilience parameters, which would be taken as interrelated and no longer independent.
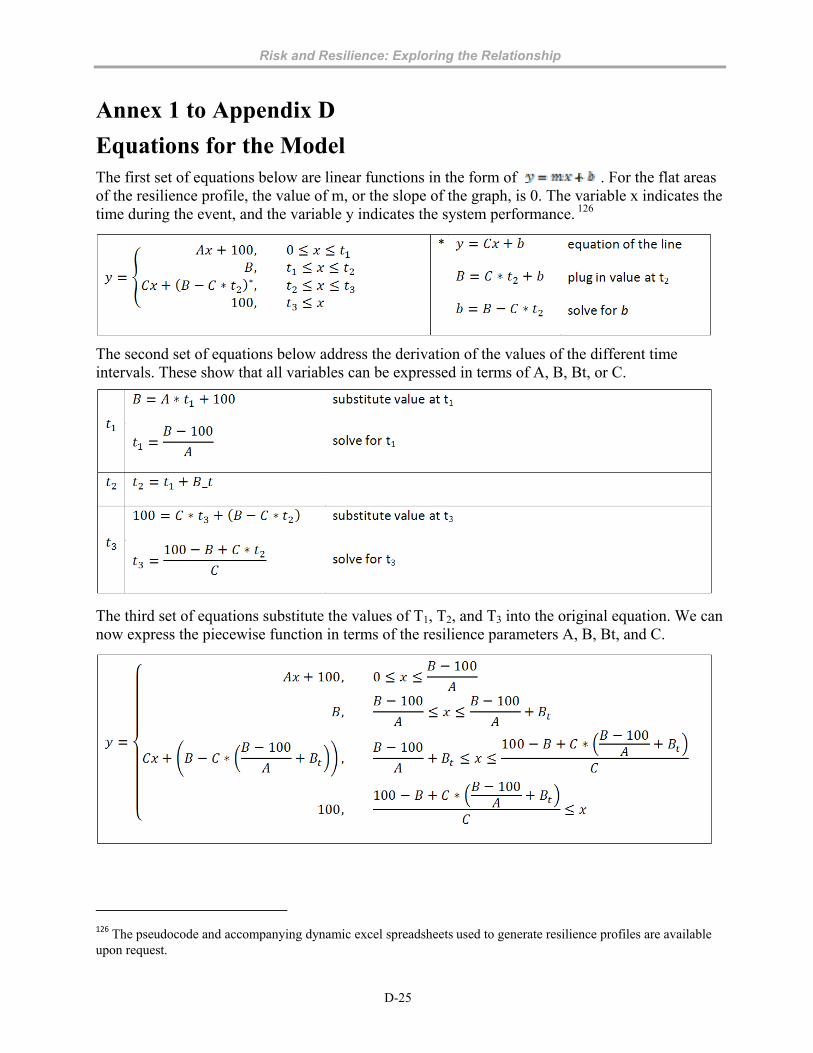
Risk and Resilience: Exploring the Relationship
D-25
Annex 1 to Appendix D
Equations for the Model The first set of equations below are linear functions in the form of . For the flat areas of the resilience profile, the value of m, or the slope of the graph, is 0. The variable x indicates the time during the event, and the variable y indicates the system performance. 126
The second set of equations below address the derivation of the values of the different time intervals. These show that all variables can be expressed in terms of A, B, Bt, or C.
The third set of equations substitute the values of T1, T2, and T3 into the original equation. We can now express the piecewise function in terms of the resilience parameters A, B, Bt, and C.
126 The pseudocode and accompanying dynamic excel spreadsheets used to generate resilience profiles are available upon request.

Risk and Resilience: Exploring the Relationship
D-26

Risk and Resilience: Exploring the Relationship
D-27
Annex 2 to Appendix D Parameters Features Matrix
Resilience Parameter: A (Capability to absorb and degrade)
. Resilience Feature
Pre-event Activity Situational Awareness
Resistance Cushionability Robustness Redundancy Resourcefulness Restoration Rapidity Learning Capacity Affordability
Parameter Perspective
Anticipation of an event can either improve A or have little to no effect, depending on the activity.
Can reduce secondary effects of an event and potentially improve the value of A.
n/a - Increasing resistance has no effect on any parameter except R.
Improving the cushionability of the system results in a value of A closer to zero.
Improving robustness can result in a value of A closer to zero, as it contributes to a more graceful degradation.
Improving redundancy can result in a value of A closer to zero, as it contributes to a more graceful degradation.
Improving resourcefulness can result in a value of A closer to zero, as it contributes to a more graceful degradation.
n/a - Improving restoration has no effect on A.
Improved rapidity can either increase or decrease the value of A depending on resources available. If available resources have greater impact on restoring the system, then the system in question may have a worse value of A while improving rapidity.
Adaptive learning may lead to a more graceful degradation by making the slope of A less steep.
Depending on resources available to respond to the event, affordability may have an effect on improving A.
Resilience Perspective (Cells assume no other Resilience Features are adjusted except the one in question)
Improving A potentially highlights better pre-event activity
Improving A potentially highlights improved situational awareness due to reduced secondary effects
n/a Improving A directly contributes to improving the cushionability capability of the system.
Improving A potentially highlights a system's improved robustness
Improving A potentially highlights a system's improved redundancy
Improving A potentially highlights a system's increased resourcefulness
n/a Holding other resilience features (including the threshold level B) constant, improved A will decrease rapidity
Improving A potentially highlights a system's improved adaptive learning capability
Improved A may be a result of increased affordability of countermeasures and other resilience investments

Risk and Resilience: Exploring the Relationship
D-28
Resilience Parameter: B (Bottom out or threshold level)
. Resilience Features
Pre-event Activity Situational Awareness
Resistance Cushionability Robustness Redundancy Resourcefulness Restoration Rapidity Learning Capacity Affordability
Parameter Perspective
May reduce severity of functional degradation, resulting in higher threshold level B.
May reduce severity of functional degradation as well as mitigate secondary effects, resulting in a higher threshold level B.
n/a - Increasing resistance has no effect on any parameter except R.
Limits speed and severity of functional degradation experienced by system functioning due to event, resulting in a higher threshold level B.
May reduce severity of functional degradation experienced by system functioning due to event, resulting in a higher threshold level B.
May reduce severity of functional degradation experienced by system functioning due to event, resulting in a higher threshold level B.
May decrease the severity of functional degradation experienced by system functioning due to event, resulting in a higher threshold level B.
n/a - Restoration refers to resilience dynamics once the system begins improving.
n/a - Increased rapidity does not directly influence the threshold level B.
May reduce severity of functional degradation, resulting in a higher threshold level B.
Depending on the relative costs of resilience investment, may increase or decrease threshold level B.
Resilience Perspective (Cells assume no other Resilience Features are adjusted except the one in question)
Higher levels of B may reflect improved pre-event planning, allowing for continued higher levels of performance.
Higher levels of B may reflect increased system situational awareness, allowing for continued higher levels of performance.
n/a Higher levels of B will decrease overall system degradation, which results in more cushionability.
Higher levels of B may reflect increased system robustness allowing for continued higher levels of performance.
Higher levels of B may reflect increased system redundancy, allowing for continued higher levels of performance.
Higher levels of B may reflect increased system resourcefulness, allowing for continued higher levels of performance.
n/a Higher levels of B allow for more rapid system recovery, increasing system rapidity
Higher levels of B may reflect increased system adaptive learning, allowing for continued higher levels of performance.
Higher levels of B may reflect increased affordability of resilience investments.
Resilience Parameter: Bt (Length of time at bottom)
. Resilience Features
Pre-event Activity Situational Awareness
Resistance Cushionability Robustness Redundancy Resourcefulness Restoration Rapidity Learning Capacity Affordability
Parameter Perspective
Improved pre-event activity may result in a reduced period of time at the threshold level Bt.
Improved situational awareness may result in improved awareness of potential alternatives to recover system capability, resulting in reduced time at the threshold level Bt.
n/a - Increasing resistance has no effect on any parameter except R.
n/a - Cushionability does not affect length of time spent at the threshold level.
Improved system robustness may result in reduced period of time at the threshold level Bt.
Improved system redundancy may result in reduced period of time at threshold level Bt.
Improved system resourcefulness may result in reduced period of time at the threshold level Bt.
Improved system restoration capabilities may result in reduced period of time at the threshold level Bt.
Improved system rapidity may result in a reduced period of time at the threshold level Bt.
Improved adaptive learning may result in reduced period of time at the threshold level Bt.
The cost of resilience investments may result in increased or decreased periods of time at the threshold level Bt.
Resilience Perspective (Cells assume no other Resilience Features are adjusted except the one in question)
Reduced Bt may be the result of improved pre-event planning and activity.
Reduced Bt may be the result of improved situational awareness.
n/a n/a - Reducing Bt does not affect system’s cushionability.
Reduced Bt may reflect improved system robustness.
Reduced Bt may reflect increased levels of system redundancy.
Reduced Bt may reflect improved system resourcefulness.
Reduced Bt may reflect improved system restoration capabilities.
Reduced Bt will result in a faster return to full functionality.
Reduced Bt may be the result of improved adaptive learning capability.
Reduced Bt may be the result of a change in the cost of resilience investments.
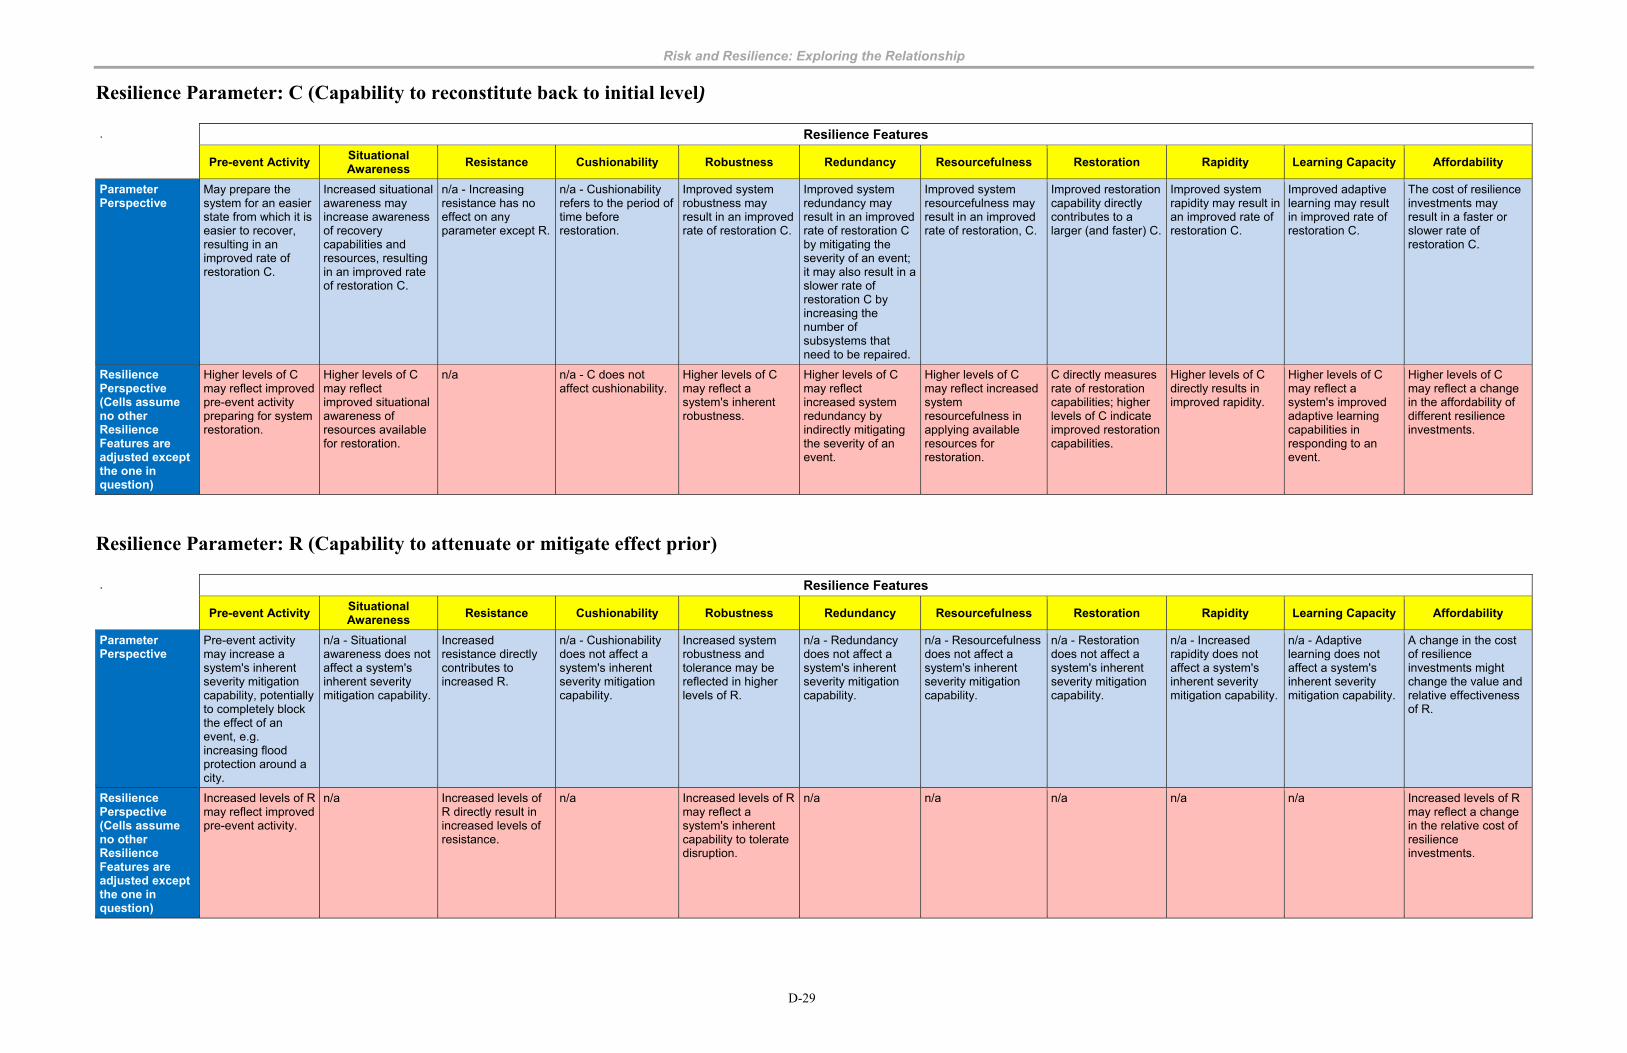
Risk and Resilience: Exploring the Relationship
D-29
Resilience Parameter: C (Capability to reconstitute back to initial level)
. Resilience Features
Pre-event Activity Situational Awareness
Resistance Cushionability Robustness Redundancy Resourcefulness Restoration Rapidity Learning Capacity Affordability
Parameter Perspective
May prepare the system for an easier state from which it is easier to recover, resulting in an improved rate of restoration C.
Increased situational awareness may increase awareness of recovery capabilities and resources, resulting in an improved rate of restoration C.
n/a - Increasing resistance has no effect on any parameter except R.
n/a - Cushionability refers to the period of time before restoration.
Improved system robustness may result in an improved rate of restoration C.
Improved system redundancy may result in an improved rate of restoration C by mitigating the severity of an event; it may also result in a slower rate of restoration C by increasing the number of subsystems that need to be repaired.
Improved system resourcefulness may result in an improved rate of restoration, C.
Improved restoration capability directly contributes to a larger (and faster) C.
Improved system rapidity may result in an improved rate of restoration C.
Improved adaptive learning may result in improved rate of restoration C.
The cost of resilience investments may result in a faster or slower rate of restoration C.
Resilience Perspective (Cells assume no other Resilience Features are adjusted except the one in question)
Higher levels of C may reflect improved pre-event activity preparing for system restoration.
Higher levels of C may reflect improved situational awareness of resources available for restoration.
n/a n/a - C does not affect cushionability.
Higher levels of C may reflect a system's inherent robustness.
Higher levels of C may reflect increased system redundancy by indirectly mitigating the severity of an event.
Higher levels of C may reflect increased system resourcefulness in applying available resources for restoration.
C directly measures rate of restoration capabilities; higher levels of C indicate improved restoration capabilities.
Higher levels of C directly results in improved rapidity.
Higher levels of C may reflect a system's improved adaptive learning capabilities in responding to an event.
Higher levels of C may reflect a change in the affordability of different resilience investments.
Resilience Parameter: R (Capability to attenuate or mitigate effect prior)
. Resilience Features
Pre-event Activity Situational Awareness
Resistance Cushionability Robustness Redundancy Resourcefulness Restoration Rapidity Learning Capacity Affordability
Parameter Perspective
Pre-event activity may increase a system's inherent severity mitigation capability, potentially to completely block the effect of an event, e.g. increasing flood protection around a city.
n/a - Situational awareness does not affect a system's inherent severity mitigation capability.
Increased resistance directly contributes to increased R.
n/a - Cushionability does not affect a system's inherent severity mitigation capability.
Increased system robustness and tolerance may be reflected in higher levels of R.
n/a - Redundancy does not affect a system's inherent severity mitigation capability.
n/a - Resourcefulness does not affect a system's inherent severity mitigation capability.
n/a - Restoration does not affect a system's inherent severity mitigation capability.
n/a - Increased rapidity does not affect a system's inherent severity mitigation capability.
n/a - Adaptive learning does not affect a system's inherent severity mitigation capability.
A change in the cost of resilience investments might change the value and relative effectiveness of R.
Resilience Perspective (Cells assume no other Resilience Features are adjusted except the one in question)
Increased levels of R may reflect improved pre-event activity.
n/a Increased levels of R directly result in increased levels of resistance.
n/a Increased levels of R may reflect a system's inherent capability to tolerate disruption.
n/a n/a n/a n/a n/a Increased levels of R may reflect a change in the relative cost of resilience investments.

Risk and Resilience: Exploring the Relationship
D-30

Risk and Resilience: Exploring the Relationship
1
Bibliography Accorsi, Michael. “Enabling Technologies for Resilient Transportation Infrastructure” presented at Department of Homeland Security University Network Summit March 12, 2010. Aguire, B. E. “On the Concept of Resilience” Preliminary Paper #356. University of Delaware Disaster Research Center, 2006. Allenby, Brad and Jonathan Fink. “Toward Inherently Secure and Resilient Societies.” Science, volume 309, number. 5737 (August 12, 2005). pp. 1034-1036. Arnold, Mary. The Resilient Homeland: Broadening the Homeland Security Strategy (testimony before the House Committee on Homeland Security). May 6, 2008. Arsenault, David and Arun Sood. “Resilience: A Systems Design Perspective” in George Mason University School of Law. “Critical thinking: Moving from Infrastructure Protection to Infrastructure Resilience.” CIP Program Discussion Paper Series, February 2007. pp. 87- 96. ASIS International. “Organizational Resilience: Security, Preparedness, and Continuity Management Systems–Requirements with Guidance for Use.” March 12, 2009. Bailey, Susan. The Resilient Homeland: Broadening the Homeland Security Strategy (testimony before the House Committee on Homeland Security). May 6, 2008. Baker, Stewart. The Resilient Homeland: Broadening the Homeland Security Strategy (testimony before the House Committee on Homeland Security). May 6, 2008. Barabasi, Albert-Laszlo and Bonabeau, Eric. “Scale-Free Networks.” Scientific American, Volume. 288, Number 5 (May 2003): p. 60. Bier, Vicki. “Game-Theoretic and Reliability Methods in Counterterrorism and Security.” Modern Statistical and Mathematical Methods in Reliability. pp. 17-28.
Birkland, Thomas A. “Disasters, Catastrophes, and Policy Failure in the Homeland Security Era.” Review of Policy Research, vol. 26, no. 4 (2009): pp. 226-227. British Standards Institute. “BS 5497, Part 1-Precision of test methods” (London: BSI, 1979). Buckle, Philip, Graham Mars, and Syd Smale. “New Approaches to Assessing Vulnerability and Resilience.” Australian Journal of Emergency Management. (2000) pp 8-14. ———. “Assessing Resilience & Vulnerability: Principles, Strategies & Actions (Guidelines)”. May 2001.

Risk and Resilience: Exploring the Relationship
2
Carafano, James Jay. Backgrounder: Resiliency and Public-Private Partnerships to Enhance Homeland Security. The Heritage Foundation, Washington, DC, number 2150, June 24, 2008. ———. “Risk and Resiliency: Developing the Right Homeland Security Public Policies for the Post-Bush Era,” testimony before the Sub-Committee on Transportation Security and Infrastructure Protection, Committee on Homeland Security, United States House of Representatives, June 24, 2008. Carpenter, Steve, Brian Walker, J. Marty Anderies, and Nick Abel. “From Metaphor to Measurement: Resilience of What to What?” Ecosystems. (2001), pp. 765-781. Cascio, Jamais. “The Next Big Thing: Resilience.” Foreign Policy, vol. 88, no. 3 (May/June 2009).
Chiaradonna, Silvano, Felicita Giandomenicio, and Paolo Lollini. “Evaluation of Critical Infrastructures: Challenges and Viable Approaches.” in Architecting Dependable Systems, eds. R. de Lemos et al. (Springer-Verlag Berlin Heidelberg, 2008). Childs, Iraphne. “Emergence of New Volunteerism: Increasing in Community Resilience to Natural Disasters in Japan in Gow, Kathryn and Douglas Paton eds. The Phoenix of Natural Disasters Community Resilience. (New York: Nova Science Publishers, 2008). pp. 171-180. Cimellaro, G.P., A.M. Reinhorn’ and M. Bruneau. “Quantification of Seismic Resilience” Paper Number 1094, presented at the 8th U.S. National Conference on Earthquake Engineering, April 18-22, 2006, San Francisco, California. Coaffee, Jon. “Risk, resilience, and environmentally sustainable cities.” Energy Policy (2008). pp. 4633-4638. Community and Regional Resilience Institute. “Community Resilience Roundtable Meeting Summary”. December 1, 2009. Collicutt, John. “Community resilience: The future of business continuity” Journal of Business Continuity & Emergency Planning Volume 3 Number 2. pp. 145-152. Colten, Craig E., Robert W. Kates, and Shirley B. Laska. “Three Years After Katrina: Lessons for Community Resilience” Environment, vol. 50, no. 5 (September 2008): pp. 36-47. Coullahan, Robert and C. David Shepherd. “Enhancing enterprise resilience in the commercial facilities sector.” Journal of Business Continuity & Emergency Planning. Volume 3 Number 1. pp. 5-18. Council on Competitiveness. “Prepare: Workshop on Risk Intelligence and Resilience.” (2008).

Risk and Resilience: Exploring the Relationship
3
Cross, Candi. “Stocking up for Disaster” Industrial Engineer. Volume 41, Number 9 (2009). pp. 36. Crowther, Kenneth. “Decentralized risk management for strategic preparedness of critical infrastructure through decomposition of the inoperability input–output model” International Journal of Critical Infrastructure Protection. (2008), pp. 53-67. Cuklc, Bojan. “Systems Resilience: Implications to Border Management” presented at Department of Homeland Security University Network Summit March 11, 2010. Cutter, Susan, Christopher Burton, and Christopher Emrich. “Disaster Resilience Indicators for Benchmarking Baseline Conditions.” Journal of Homeland Security and Emergency Management. Volume 7, Issue 1, Article 51 (2010). pp. 1-22. Dye, Karen and Margarett Langstett. “A roadmap to measure and achieve operational resiliency” Journal of Business Continuity and Emergency Planning. Volume 3 Number 1. pp. 38-45. Dynes, Scott. “Emergent Risk in Critical Infrastructures” in Critical Infrastructure Protection II (Chapter 1) , eds. Papa, Mauricio and Sujeet Shenoi (Springer, 2009), pp. 3-16. Eisner, Richard K. “Planning for Tsunami: Reducing Future Losses Through Mitigation” Natural Hazards (2005). pp. 155-162. Elran, Meir. “Disaster Management Strategy: A Comparative Study The Israeli Case” (Working Paper). ———.“Israel’s Homeland Security Concept: From Civil Defense to National Resilience.” Briefing presented to HSsaI, August 4, 2009. Fetzer' Institute. “Community Resilience: A Cross Cultural Study: Revitalizing Community Within and Across Borders”. Washington, DC: Woodrow Wilson International Center for Scholars, 2009. Fiering, Myron. “A Screening Model to Quantify Resilience” Water Resources Research. Volume 18, Number 1 (February, 1982). pp. 27-32. Flynn, Stephen E. “America the Resilient.” Foreign Affairs, vol. 87, no. 2 (March/April 2008): pp. 2-8. ———. “America the Vulnerable.” Foreign Affairs, vol. 81, no. 1 (January/February 2002): pp. 60-74. ———. America the Vulnerable: How the Government is Failing to Protect us from Terrorism. New York: HarperCollins, 2004.

Risk and Resilience: Exploring the Relationship
4
———. “Resilience.” Briefing presented to HSsaI, April 26, 2010. ———. The Edge of Disaster: Building a Resilient Nation. New York: Random House, 2007. Folke, Carl, Steve Carpenter, Brian Walker, Martin Scheffer, Thomas Elmqvist, Lance Gunderson, and C.S. Holling. “Article 4- Regime Shifts, Resilience, and Biodiversity in Ecosystem Management” in Foundations of Ecological Resilience, eds. Lance Gunderson, Craig Allen, and C.S. Holling (Island Press: Washington) 2010. pp. 119- 150. Franchina, Luisa, Marco Carbonelli, Laura Gratta, Claudio Petricca, and Danielle Peruchinni. “An Effective Approach for Cascading Effects Prevision in Critical Infrastructures” in R. Setola and S. Geretshuber (Eds.): Critis 2008, Lncs 5508, (Springer-Verlag Berlin Heidelberg 2009) pp. 386-393. Fraser, Evan, Warren Mabee, and Frank Figgee. “A framework for assessing the vulnerability of food systems to future shocks.” Futures (2005). pp. 465-479. Furedi, Frank. “Fear and Security: A Vulnerability Led Policy Response” Social Policy and Administration. Volume 42, Number 6. December 2008. pp. 645-661. Garbin, David A and John F. Shortle. “Measuring Resilience in Network Based Infrastructures.” in George Mason University School of Law. “Critical thinking: Moving from Infrastructure Protection to Infrastructure Resilience.” CIP Program Discussion Paper Series, February 2007. pp. 73-86. Gaynor, Jeff. “Critical Infrastructure from a Private Viewpoint.” Defense Management Journal, no. 36, (2007). http://www.defencemanagement.com/article.asp?id=249&content_name= Homeland%20Security&article=7463. George Mason University School of Law. “Critical thinking: Moving from Infrastructure Protection to Infrastructure Resilience.” CIP Program Discussion Paper Series, February 2007. Goldman, Lynn. “Resilience in the Face of Pandemics” presented at Department of Homeland Security University Network Summit March 12, 2010. Goldstein, Bruce Evan. “Skunkworks in the Embers of the Cedar Fire: Enhancing Resilience in the Aftermath of Disaster.” Human Ecology (2008) Number 36. pp. 15-28. Gow, Kathryn and Douglas Paton eds. The Phoenix of Natural Disasters Community Resilience. New York: Nova Science Publishers, 2008. ———, Felicity Shipley and Francine Pritchard. “Never Underestimate SES Workers: Volunteers a Case in Point” in Gow, Kathryn and Douglas Paton eds. The Phoenix of

Risk and Resilience: Exploring the Relationship
5
Natural Disasters Community Resilience. (New York: Nova Science Publishers, 2008). pp. 123-146. Gunderson, L.H., C.S. Holling, and G.D. Peterson. “Resilience in Ecological Systems” in Handbook of Ecosystem Theories and Management, ed. Felix Muller. (CRC Press, 2000). pp. 385-394. Haimes, Yacov. “On the Complex Definition of Risk: A Systems- Based Approach” Risk Analysis. Volume 29, Number 12, 2009. pp. 1647-1654. ———. “On the Definition of Resilience in Systems” Risk Analysis. Volume 29, Number 4, 2009. pp. 498-501. ———. On the Definition of Vulnerabilities in Measuring Risks to Infrastructures (Third Edition). Wiley, 2009. Hardenbrook, Brandon. “Developing Disaster Resilient Regions” Journal of Homeland Security and Emergency Management. Volume 2, Issue 3, Article 2. (2005). Harvard Business School. “Leadership on 9/11: Morgan Stanley’s Challenge.” December 17, 2001. http://hbswk.hbs.edu/archive/2690.html. Hellstrom, Tomas. “Critical infrastructure and systemic vulnerability: Towards a planning framework.” Safety Science. (2007) pp. 415-430. Helmick, Jon S. “Port and maritime security: A research perspective” Journal of Transportation Security. (2008). pp. 15-28. Heyman, David and James Carafano. “Homeland Security 3.0: Building a National Enterprise to Keep America Safe, Free, and Prosperous”. The Heritage Foundation and Center for Strategic and International Studies. September 18, 2008. Hipel, Keith W, Liping Fang, and Michelle Heng. “System of Systems Approach to Policy Development for Global Food Security” Journal of Systems Science and Systems Engineering. (2010). Hodges, Alan. “Emergency Risk Management” Risk Management. Volume 2, Number 4 (2000). pp. 7-18. Holling, C.S. “Article 1- Resilience and Stability of Ecological Systems” in Foundations of Ecological Resilience, eds. Lance Gunderson, Craig Allen, and C.S. Holling (Island Press: Washington) 2010. pp. 19-50. Holling, C.S. “Article 2- Engineering Resilience versus Ecological Resilience” in Foundations of Ecological Resilience, eds. Lance Gunderson, Craig Allen, and C.S. Holling (Island Press: Washington) 2010. pp. 51-66.

Risk and Resilience: Exploring the Relationship
6
Holling, C.S. “Article 3- The Resilience of Terrestial Ecosystems” in Foundations of Ecological Resilience, eds. Lance Gunderson, Craig Allen, and C.S. Holling (Island Press: Washington) 2010. pp. 67-118. Holmgren, Ake. “A Framework for Vulnerability Assessment of Electric Power Systems” in Murray, A.T. and T.H. Grubesic (eds.) Critical Infrastructure: Reliability and Vulnerability (New York: Springer, 2007), pp. 31-55. Homeland Security Institute. Public Role and Engagement in Counterterrorism Efforts: Implications of Israeli Practices for the U.S., April 2, 2009. Prepared for the Department of Homeland Security, Office of Science and Technology. ———. Risk Analysis and Intelligence Communities Collaborative Framework, Final Report, April 23, 2009. Prepared for the Department of Homeland Security, Office of Science and Technology. Horwitz, Steven. “Hurricane Recovery Comes Out of a Box.” Local Knowledge, no. 1 (Summer 2008): pp. 48-55. Hsu, Spencer S. “Obama Integrates Security Councils, Adds New Offices: Computers and Pandemic Threats Addressed.” Washington Post, May 26, 2009, p. 4. http://www.washingtonpost.com/wpdyn/ content/article/2009/05/26/AR2009052603148.html. Hultman, Nathan and Alexander Bozmoski. “The Changing Face of Normal Disaster: Risk, Resilience, and National Security in a Changing Climate” Journal of International Affairs. Spring/Summer 2006, Volume 59, Number 2. pp. 25-41. Hynes, Mary Ellen. “Extreme Loading of Physical Infrastructure: Integrated Design for Intelligent Resilience” presented at Department of Homeland Security University Network Summit March 11, 2010. IBM. “Comprehensive, best-practices approach to business resilience and risk mitigation” IBM white paper. September 2007. Ignazio, James P. Introduction to Expert Systems: The Development and Implementation of Rule- Based Expert Systems, (McGraw-Hill, Inc.: New York, New York, 1991). Jackson, Brian A. “Marrying Prevention and Resiliency.” RAND Corporation Occasional Paper, 2008. Jenkins, Brian Michael. “Surface Transportation: Inherently Resilient and Essential to Resiliency” presented at Department of Homeland Security University Network Summit March 11, 2010.
Risk and Resilience: Exploring the Relationship
7
Kahan, Jerome H., Andrew C. Allen and Justin K. George. “An Operational Framework for Resilience” Journal of Homeland Security and Emergency Management. Volume 6, Issue 1, Article 83. (2009). Kahn, Laura and Jeremiah Barondess. “Preparing for Disaster: Response Matrices in the USA and UK” Journal of Urban Health: Bulletin of the New York Academy of Medicine, Volume 85, Number 6. (2008). pp. 910-923. Kaye, David.”Managing Risk and Resilience in the Supply Chain”. (British Standards Institute, 2008). Kelly, Robert W. “‘Resilience’ Blooming Into Its Own.” Homeland Security Watch. May 1, 2008. Kennedy, Shaun. “What Makes an Infrastructure Resilient -The Food System” presented at Department of Homeland Security University Network Summit March 10, 2010. King, Michael and Christopher Zobel. “Applying the R4 Framework of Resilience: Information Technology Disaster Risk Management at Northrop Grumman” presented at the Annual Meeting of Southeast Decision Sciences Institute, 2008. Kolasky, Bob. “A Report on Integrated Risk Management From DHS’s Office of Risk Management and Analysis.” The Risk Communicator (The Monthly Newsletter of the Security Analysis and Risk Management Association). September, 2010. ———. Implementing Integrated Risk Management at the Department of Homeland Security,” briefing presented at SARMA Annual Conference, October 6, 2010. Kozub, Christopher. “Real World Resiliency” presented at Department of Homeland Security University Network Summit March 12, 2010. Krauthammer, Teodor and Joseph Tedesco. “A Multi-hazard Approach to Insure Resilient Urban Structures.” in Resilience of Cities to Terrorist and Other Threats, H.J. Pasman and I.A. Kirillov (eds.) pp. 259-272. Kroger, Wolfgang. “Critical infrastructures at risk: A need for a new conceptual approach and extended analytical tools” Reliability Engineering and System Safety. (2008). pp. 1781- 1787. Lahad, Mooli. “Post-Traumatic Responses in Disasters: A Community Perspective” in Gow, Kathryn and Douglas Paton eds. The Phoenix of Natural Disasters Community Resilience. (New York: Nova Science Publishers, 2008). pp. 33-46. Landau, Judith. “Enhancing Resilience: Families and Communities as Agents for Change” Family Process. Volume 46, Number 3, 2007. pp. 351-365.

Risk and Resilience: Exploring the Relationship
8
Levy, Jason. “A Case for Sustainable Security Systems Engineering: Integrating National, Human, Energy and Environmental Security.” Journal of Systems Science and Systems Engineering. (2009). pp. 385-402. Longstaff, Patricia, Nicholas J. Armstrong, Keli Perrin, Whitney May Parker, and Matthew A. Hidek. “Building Resilient Communities: A Preliminary Framework for Assessment.” Homeland Security Affairs, Volume 1, Number 3 (September, 2010). Louisiana Governor’s Office of Homeland Security and Emergency Preparedness (GOHSEP). “GOHSEP State and Community Resilience Guidance.” April 2010. Maler, Karl-Goran. “Sustainable Development and Resilience in Ecosystems” Environmental and Resource Economics. (2008). pp. 17-24. McAraw, Sean and Ron Fisher. “Introduction to Resilience: Resilience Index” briefing presented at 78th MORS Symposium. “Leveraging OR for Global Security Operations" June 23, 2010, US Marine Corps Combat Development Command, Quantico.VA. McCarthy, John. “Introduction: From Protection to Resilience: Injecting ‘Moxie’ into the Infrastructure Security Continuum” in George Mason University School of Law. “Critical thinking: Moving from Infrastructure Protection to Infrastructure Resilience.” CIP Program Discussion Paper Series, February 2007. McConnell, Allan and Drennan, Lynn. “Mission Impossible? Planning and Preparing for Crisis.” Journal of Contingencies and Crisis Management, vol. 14, no. 2 (June 2006). McCreight, Robert. “Resilience as a Goal in Crisis and Emergency Management.” The Risk Communicator, (March, 2010). MCEER, University of Buffalo. “MCEER’s Resilience Framework.” October, 2006. McNeil, Jenna Baker. Backgrounder: Building Infrastructure Resiliency: Private Sector Investment in Homeland Security. The Heritage Foundation, Washington, DC, number 2184, September 23, 2008. Mental Health Foundation of Australia. “The Resiliency Model”. Last Modified February 15, 2007. Available at: http://www.embracethefuture.org.au/resiliency/index.htm. Mileti, D. Disasters by Design: A Reassessment of Natural Hazards in the United States. Washington, DC: Joseph Henry Press, 1999. Millazzo, Maria, Giuseppa Ancione, Roberto Lisi, Chiara Vianello, and Giuseppe Maschio. “Risk management of terrorist attacks in the transport of hazardous materials using dynamic geoevents.” Journal of Loss Prevention in the Process Industries. (2009). pp. 625-633.

Risk and Resilience: Exploring the Relationship
9
Moench, M. and The Risk to Resilience Study Team. “Understanding the Costs and Benefits of Disaster Risk Reduction under Changing Climatic Conditions, From Risk to Resilience Working Paper No. 9”, eds. Moench, M., Caspari, E. & A. Pokhrel, ISET, ISET-Nepal and ProVention, Kathmandu, Nepal. (2008). Moody, Darryl B. “The Need for Resiliency at the Corporate Level” in George Mason University School of Law. “Critical thinking: Moving from Infrastructure Protection to Infrastructure Resilience.” CIP Program Discussion Paper Series, February 2007. pp. 97- 109. Montenegro, Maywa and Terry Glavin. “Scientists Offer New Insight Into What to Protect of the World’s Rapidly Vanishing Languages Cultures and Species.” Seed Magazine, July 9, 2010. Morley, Kevin M and Jerry P. Brashear. “Protecting the Water Supply” Mechanical Engineering. January 2010. pp 34-36. Moynihan, Donald P. “Learning under Uncertainty: Networks in Crisis Management” Public Administration Review. March/April 2008. pp. 1-17. National Academy of Sciences. “Private-Public Sector Collaboration to Enhance Community Disaster Resilience: A Workshop Report.” (2010). ———. (Sammantha Magsino Rapporteur). “Applications of Social Network Analysis for Building Community Disaster Resilience: Workshop Summary.” (2009). National Infrastructure Advisory Council. Critical Infrastructure Resilience Final Report and Recommendations. September 2009. Norris, Fran. “Capacities that Promote Resilience” presented at Department of Homeland Security University Network Summit March 11, 2010. ———. and Betty Pfefferbaum. “START Community Resilience” presented at START research symposium, June 2006. ———, Susan P. Stevens, Betty Pfefferbaum, Karen F. Wyche, and Rose L. Pfefferbaum. “Community Resilience as a Metaphor, Theory, Set of Capacities, and Strategy for Disaster Readiness.” American Journal of Community Psychology (2008): pp. 127-150. Nunamaker, Jay F. “A Resilient Border Security System.” presented at Department of Homeland Security University Network Summit March 11, 2010. Obama, Barak. A Proclamation: National Preparedness Month, 2009. Office of the Press Secretary. September 4, 2009.

Risk and Resilience: Exploring the Relationship
10
Ohio State University, Center for Resilience. “What is Resilience,” http://www.resilience.osu.edu/CFR-site/concepts.htm. Olshansky, Robert, and Laurie Johnson. “Improving Post-Disaster Recovery: Initial Thoughts for a New Administration,” University of Illinois at Urbana-Champaign and Laurie Johnson Consulting. San Francisco, California, November 17, 2008. O’Rourke, T. D. “Critical Infrastructure, Interdependencies, and Resilience.” The Bridge (Spring 2007): pp. 27-29. Palin, Philip J. “Resilience: The Grand Strategy” Journal of Homeland Security Affairs. Volume VI, Number 1. (January 2010). pp. 1-20. Parker, Rita. “Anticipate and Adapt - A New Paradigm for Organizational Resilience” White paper. Parrish, Bradley. “Designing the Sustainable Enterprise” Futures. (2007). pp. 846-880. Paton, Douglas. “Chapter 2- Community Resilience: Integrating Individual Community and Societal Perspectives” in Gow, Kathryn and Douglas Paton eds. The Phoenix of Natural Disasters Community Resilience. (New York: Nova Science Publishers, 2008). pp. 13-32. ———, and Kathryn Gow. “Chapter 1- Rising from the Ashes: Empowering the Phoenix” in Gow, Kathryn and Douglas Paton eds. The Phoenix of Natural Disasters Community Resilience. (New York: Nova Science Publishers, 2008). pp. 1-9. Pelling, Mark and Juha Uitto. “Small island developing states: natural disaster vulnerability and global change” Environmental Hazards.(2009). pp. 49-62. Perelman, Lewis J. “Shifting Security Paradigms: Toward Resilience” in George Mason University School of Law. “Critical thinking: Moving from Infrastructure Protection to Infrastructure Resilience.” CIP Program Discussion Paper Series, February 2007. pp. 23-48. Peterson, Garry, Craig Allen, and C.S. Holling. “Article 6- Ecological Resilience, Biodiversity and Scale” in Foundations of Ecological Resilience, eds. Lance Gunderson, Craig Allen, and C.S. Holling (Island Press: Washington) 2010. pp. 167-194. Pettit, Timothy, Joseph Fiksel, and Keely Croxton. “Ensuring Supply Chain Resilience: Development of a Conceptual Framework.” Journal of Business Logistics, Volume 31, Number 1, 2010. pp. 1-21. Pommerening, Christine. “Resilience in Organizations and Systems: Background and Trajectories of an Emerging Paradigm” in George Mason University School of Law.
Risk and Resilience: Exploring the Relationship
11
“Critical thinking: Moving from Infrastructure Protection to Infrastructure Resilience.” CIP Program Discussion Paper Series, February 2007. pp. 9-22. The Reform Institute. “Building a Resilient Nation: Enhancing Security, Ensuring a Strong Economy,” 2008. Reser, Joseph P. and Shirley Morrissey. “Situating and Framing Individual and Community Experience and Response to Hazards.” in Gow, Kathryn and Douglas Paton eds. The Phoenix of Natural Disasters Community Resilience. (New York: Nova Science Publishers, 2008). pp. 47-72. The Resilience Alliance. Assessing and managing resilience in social-ecological systems: A practitioners workbook. (2007). Rigazio, Richard.“Resilience and Mission/Operation Planning- A Framework to Evaluate Provider Resilience and Develop Better Plans,” p. 3, presentation given at Military Operations Research Society. November 9, 2009. Rizzuto, Tracey. “Disaster Recovery in Workplace Organizations” in Cherry, K.E. Lifespan Perspectives on Natural Disasters. (2009). pp. 261-280. Rosa, Eugene. “The Sky is Falling: The Sky is Falling...It Really is Falling.” Contemporary Sociology. Volume 35, Number 3 (May, 2006). pp. 212-217. Rose, Adam. “Economic Resilience to Natural and Man-made Disasters: Multidisciplinary Origins and Contextual Dimensions.” Environmental Hazards: Human and Policy Dimensions (2007): pp. 1-16. ———. Shu-Yi Liao. “Modeling Regional Economic Resilience to Disasters: A Computational Generalized Equilibrium Analysis of Water Service Disruptions.” Journal of Regional Science, Volume 45, Number 1 (2005). pp. 75-112. ———. “Defining and measuring economic resilience to disasters” Disaster Prevention and Management. (2004). pp. 307-314. ———. Ghabedo Oladosu and Shu-Yi Liao. “Business Interruption Impacts of a Terrorist Attack on the Water System of Los Angeles: Customer Resilience to a Total Blackout,” Risk Analysis, vol. 27, no. 3 (2007): pp. 513-531. Scalingi, Paula. Moving Beyond Critical Infrastructure Protection to Disaster Resilience in George Mason University School of Law. “Critical thinking: Moving from Infrastructure Protection to Infrastructure Resilience.” CIP Program Discussion Paper Series, February 2007. pp. 49-72. Schoch-Spana, Monica. “Resilient American Communities: Progress in Practice and Policy” Conference brief. December 10, 2009.

Risk and Resilience: Exploring the Relationship
12
Schroeder, Heike and Dayna Yocum. “Vulnerability, Resilience, and Adaptation: Response Mechanisms in an Environmental Emergency – The Asian Tsunami in Thailand and Hurricane Katrina in the United States” in Chemicals as Intentional and Accidental Global Environmental Threats, Simeonov, L. and E. Chirilia (eds.). (Springer, 2006). pp. 105-126. 78th MORS Symposium. “Leveraging OR for Global Security Operations" June 21-24, 2010, US Marine Corps Combat Development Command, Quantico.VA. Security Analysis and Risk Management Association. “4th Annual Conference: The Road to Resilience: A Risk-Based Approach.” October 5-7, 2010. Setola, Roberto, Stefano De Porcellinisa, and Marino Sforna. “Critical infrastructure dependency assessment using the input–output inoperability model” International Journal of Critical Infrastructure Protection. (2009). pp. 170-178. Sheffi, Yossi. Resilience: What is it and how to achieve it (testimony before the House Committee on Homeland Security). May 6, 2008. ———. The Resilient Enterprise: Overcoming Vulnerability for Competitive Advantage. Cambridge, MA: MIT Press, 2005. Sherrieb, Kathleen, Fran Norris, and Sandro Galea. “Determining the Public Health Consequences of Terrorism on Maternal-Child Health” presented at Department of Homeland Security University Network Summit March 12, 2010. ———. “Measuring Capacities for Community Resilience” Social Indices Research (Springer, 2010). Sjoberg, Lennart. “The Perceived Risk of Terrorism” Risk Management. Volume 7, Number 1 (2005). pp. 43-61. Somers, Scott. “Measuring Resilience Potential: An Adaptive Strategy for Organizational Crisis Planning” Journal of Contingencies and Crisis Management. Volume 17 Number 1 (March, 2009). pp. 12-23. Southers, Erroll. The Resilient Homeland: Broadening the Homeland Security Strategy (testimony before the House Committee on Homeland Security). May 6, 2008. Springer, Christine. “Post-Secondary Homeland Security Curriculum Development for Economic, Community, and Individual Resilience” presented at Department of Homeland Security University Network Summit March 10, 2010. Stanton, Ray and Bill Rann. “Managing risk exposure” Computer Fraud and Security. (July, 2006). pp. 17-20.
Risk and Resilience: Exploring the Relationship
13
Sterbenz, James P.G., David Hutchison, Egemen K. Çetinkaya, Abdul Jabbar, Justin P. Rohrer, Marcus Schöller, and Paul Smith. “Resilience and survivability in communication networks: Strategies, principles, and survey of disciplines” Computer Networks. (2010). Straw, Joseph. “Israel’s Lessons in Public Resilience.” Security Management. (March, 2010). Swanstrom, Todd. “Regional Resilience: A Critical Examination of the Ecological Framework” working paper presented to the Urban Affairs Association, Annual Meeting, April 25, 2008. Thomas, Wendy. “Community Resilience- Exploring the Conceptual Framework” BAMS (American Meteorological Association). pp. 406-407. Tidball, Keith G. and Marianne E. Krasny. “From risk to resilience: what role for community greening and civic ecology in cities” in Social Learning: Toward a Sustainable World Wals, Arjen ed. (Wageningen Academic Publishers, 2007) pp. 149-164. Tierney, Kathleen and Michel Bruneau. “Conceptualizing and Measuring Resilience: A Key to Disaster Loss Reduction” TR News 250. (May-June, 2007). pp. 14-17. Uggla, Ylva. “Risk and safety analysis in long-term perspective” Futures. (2004). pp. 549-564. Ulanowicz, Robert, Sally J. Goerner, Bernard Lietaer, and Rocio Gomez. “Quantifying sustainability: Resilience, efficiency and the return of information theory” Ecological Complexity. (2009). pp. 27-36. United Nations. Towards National Resilience. (Geneva: United Nations Secretariat of the International Strategy for Disaster Reduction, 2008). U.S. Department of Homeland Security. Recommended VV&A guide (website) http://vva.msco.mil/Special_Topics/measures/default.htm. Accessed October 19, 2010. U.S. Department of Homeland Security. One Mission, Securing Our Homeland; U.S. Department of Homeland Security Strategic Plan 2008-2013. Washington, DC, September 2008. http://www.dhs.gov/xabout/strategicplan/. ———. Bottom-Up Review Report. Washington, DC, July 2010. ———. National Infrastructure Protection Plan. Washington, DC, 2009. http://www.dhs.gov/files/programs/editorial_0827.shtm. ———. Quadrennial Homeland Security Review. Washington, DC, February 2010. http://www.dhs.gov/xlibrary/assets/qhsr_report.pdf.

Risk and Resilience: Exploring the Relationship
14
———. “Rebuilding the Foundation for Americas Home Security.” Remarks prepared by Secretary Napolitano, New York City Emergency Operations Center, released September 10, 2010. ———. “Remarks by Secretary Napolitano at the Council on Foreign Relations,” released July 29, 2009. U.S. Department of Homeland Security, Federal Emergency Management Agency. National Incident Management System. Washington, DC, December 2008. http://www.fema.gov/pdf/emergency/nims/NIMS_core.pdf. ———. National Response Framework. Washington, DC, January 2008. http://www.fema.gov/pdf/emergency/nrf/nrf-core.pdf. U.S. Department of Homeland Security, Homeland Security Advisory Council. Report of the Critical Infrastructure Task Force. Washington, DC, January 2006. www.dhs.gov/xlibrary/assets/HSAC_CITF_Report_v2.pdf ———. Top Ten Challenges Facing the Next Secretary of Homeland Security. Washington, DC, September 11, 2008. www.dhs.gov/xlibrary/assets/hsac_dhs_top_10_challenges_report.pdf.
U.S. Department of Homeland Security, Risk Steering Committee. DHS Risk Lexicon 2010 edition. Washington, DC, September 2010. U.S. Department of Homeland Security University Network Summit “Science and Technology for Intelligent Resilience” March 10-12, 2010. U.S. Government Accountability Office. Critical Infrastructure Protection: Update to National Infrastructure Protection Plan Includes Increased Emphasis on Risk Management and Resilience. Washington, DC, March 2010. ———.Critical Infrastructure Protection: DHS Efforts to Assess and Promote Resiliency are Evolving but Program Management Could be Strengthened. Washington, DC, September 2010.
———. IRS Management: IRS Practices Contribute to Its Resilience, but It Would Benefit from Additional Emergency Planning Efforts. Washington, DC, April 2009.
Valverde, L. and S. Farrow. “Federal Decision Making for Homeland Security” in Real-Time and Deliberative Decision Making, eds. I. Linkov et. al. (Springer Science and Business Media, 2008). pp. 31-53. ———. and Igor Linkov. “Systemic Vulnerability Analysis in the Service of Resilience” briefing presented at 78th MORS Symposium. “Leveraging OR for Global Security

Risk and Resilience: Exploring the Relationship
15
Operations" 21-24 June 2010, US Marine Corps Combat Development Command, Quantico.VA. Voss, Douglas and Judith Whipple. “Food Supply Chain Security: Issues and Implications” in Supply Chain Risk: A Handbook of Assessment, Management, and Performance, eds. Zsidisin, George and Bob Ritchie (eds.) (Springer, 2009). pp. 293- 305. Wachtendorf, Tricia. “What Is Community Disaster Resilience? Presentation at Building Community Resilience and a Culture of Preparedness.” NORAD and USNORTHCOM Surgeon’s Conference, March 10-12, 2009. Wagner, Stephan and Christoph Bode. “An empirical investigation into supply chain vulnerability” Journal of Purchasing & Supply Management. (2006). pp. 301-312. Walker, Brian and David Salt. Resilience Thinking: Sustaining Ecosystems and People in a Changing World. Washington, DC: Island Press: 2006. Walker, Clive and James Broderick. The Civil Contingencies Act 2004: Risk, Resilience and the Law in the United Kingdom. Oxford University Press: 2006. Wang, Fan Xiao and Guanrong Chen. “Complex Networks: Small-World, Scale- Free and Beyond,” IEEE Circuits and Systems Magazine (Spring, 2003): pp. 15-16. Westman, Walter. “Measuring the Inertia and Resilience of Ecosystems.” Bioscience. Volume 28, Number 11. (November, 1978). pp. 705-710. The White House. Homeland Security and Counterterrorism. http://www.whitehouse.gov/issues/homeland_security/. ———. The National Security Strategy of the United States of America. Washington, DC, March 2006. http://georgewbushwhitehouse.archives.gov/nsc/nss/2006/. ———. The National Security Strategy of the United States of America. Washington, DC, May 2010. http://www.whitehouse.gov/sites/default/files/rss_viewer/national_security_strategy.pdf. ———. National Strategy for Combating Terrorism. Washington, DC, September 2006. http://georgewbush-whitehouse.archives.gov/nsc/nsct/2006/. The White House, Homeland Security Council. National Strategy for Homeland Security. Washington, DC, October 2007. http://www.dhs.gov/xabout/history/gc_1193938363680.shtm.


