23
Risk and time horizon Jonathan Reiss 21 Feb. 2007 Analytical Synthesis Fostering useful financial innovations www.AnalyticalSynthesis.com 212-452-2590
| Date post: | 19-Dec-2015 |
| Category: |
Documents |
| View: | 215 times |
| Download: | 0 times |

Risk and time horizon
Jonathan Reiss
21 Feb. 2007
Analytical SynthesisFostering useful financial innovations
www.AnalyticalSynthesis.com212-452-2590

_________________________________________________________________________________ Analytical Synthesis ___ © 2007_
2
Efficient FrontierEfficient Frontier with/without Housing
3.00%
4.00%
5.00%
6.00%
7.00%
8.00%
9.00%
0.00% 1.00% 2.00% 3.00% 4.00% 5.00% 6.00%
Risk
Exp
ecte
d R
etur
n
With housing
Without housing
This might be used by the CIO of the Penn Endowment to decide whether a new asset class is worth adding. But something is missing.

_________________________________________________________________________________ Analytical Synthesis ___ © 2007_
3
Efficient Frontier
• What is missing from this?time horizonReal or nominal risk?
Efficient Frontier with/without Housing
3.00%
4.00%
5.00%
6.00%
7.00%
8.00%
9.00%
0.00% 1.00% 2.00% 3.00% 4.00% 5.00% 6.00%
Risk
Exp
ecte
d R
etur
n
With housing
Without housing
This might be used by the CIO of the Penn Endowment to decide whether a new asset class is worth adding. But something is missing.

_________________________________________________________________________________ Analytical Synthesis ___ © 2007_
4
Efficient Frontier
• What is missing from this?– time horizon– real or nominal risk?
Efficient Frontier with/without Housing
3.00%
4.00%
5.00%
6.00%
7.00%
8.00%
9.00%
0.00% 1.00% 2.00% 3.00% 4.00% 5.00% 6.00%
Risk
Exp
ecte
d R
etur
n
With housing
Without housing
This might be used by the CIO of the Penn Endowment to decide whether a new asset class is worth adding. But something is missing.

_________________________________________________________________________________ Analytical Synthesis ___ © 2007_
5
Plan• Introduction
– Efficient frontiers: what is wrong with this picture– Risk, past and future– Non-ergodic processes
• Short-term rates and Inflation– Varying expected returns– Momentum
• Housing Futures– Introduction to market– Simple risk metrics for various horizons
• Ambiguity (Uncertainty)– Is Ellsberg’s Paradox really paradoxical?– Is there ambiguity in the “real world”?
• Summary and Open Questions
• History of financial innovation (as observed on eBay)

_________________________________________________________________________________ Analytical Synthesis ___ © 2007_
6
Risk: Forward-Looking View0
0.5
11
.52
2.5
3
1/1/2007 1/1/2012 1/1/2017

_________________________________________________________________________________ Analytical Synthesis ___ © 2007_
7
Forward-looking risk
• How will my portfolio allocation affect my wealth in 10 years?• Will I have enough to retire?• What are the odds I will run out of money if I follow this strategy?• Should I use a collar to hedge my concentrated low-basis stock
position?• What endowment payout is sustainable?

_________________________________________________________________________________ Analytical Synthesis ___ © 2007_
8
Risk: Forward and Back View0
0.5
11.5
22.5
3
1/1/1997 1/1/2002 1/1/2007 1/1/2012 1/1/2017

_________________________________________________________________________________ Analytical Synthesis ___ © 2007_
9
Wiggles and Cross-sectional risk
• Sometimes, the variability of the path tells you everything you need to know.– Independent and identically distributed– Other ‘ergodic’ processes
• For others, it doesn’t– A lot of focus on lack of identical distribution (e.g. GARCH)– For this purpose, lack of independence is much more important
This talk is about why/when the implicit assumptions may not work.

_________________________________________________________________________________ Analytical Synthesis ___ © 2007_
10
Predictable returns?
• Lack of predictability is a tenet of efficient markets (even moderately efficient ones)
• How can returns not be independent:– Time-varying expected returns
• This doesn’t contradict efficiency– Momentum and mean-reversion
• Fairly modest effects can matter– Uncertain expected returns
• Errors in forecast are not independent

_________________________________________________________________________________ Analytical Synthesis ___ © 2007_
11
Autocorrelation and Cross-Sectional Risk
• If the expected return varies over time, then the unconditional returns will be autocorrelated.
• Variance will grow more than linearly with time
• Note: in some circumstances, this greater dispersion will not be priced into options because the instantaneous volatility is not affected.
Dispersion over time, with and without autocorrelation
4.4
4.5
4.6
4.7
4.8
4.9
5
5.1
5.2
1 2 3
Time Period
Log
of A
sset
Val
ues

_________________________________________________________________________________ Analytical Synthesis ___ © 2007_
12
Autocorrelation and Cross-Sectional Risk
• For 3-month Treasury-bills, essentially all of the variability is variation in the expected return.
• Inflation is similar
Standard Deviation of log returns, annualizedPeriodicity Inflation T-bills Real T-bills3 months 1.7% 1.4% 1.5%1 year 2.8 2.7 2.42 years 3.8 3.7 3.23 years 4.5 4.3 3.85 years 5.3 4.9 4.3
Autocorrelation (1 period) 3 months 0.60 0.93 0.52 1 year 0.76 0.82 0.75
Data for 1970-2006.

_________________________________________________________________________________ Analytical Synthesis ___ © 2007_
13
Urns and Uncertainty• Consider two urns:
– Urn 1 contains 20 red balls and 20 blue balls
– Urn 2 contains X red and (40 – x) blue balls,
X was randomly selected from the integers 0 – 40 (inclusive)
• You can pick a color to bet on
• The payoffs are: + $70 if we draw a ball of your color
– $30 if we draw the other color
See: Chipman (1961), Ellsberg (1961), Knight (1921)
Which urn would you rather draw from?

_________________________________________________________________________________ Analytical Synthesis ___ © 2007_
14
Dispersion of Outcomes: Urn1 versus Urn 2
(400)
(200)
0
200
400
600
800
1,000
1,200
0 4 8 12 16 20Draws
Urn1: 1 s.d. Range
Expected Win
Win
_________________________________________________________________________________ Analytical Synthesis ___ © 2007_
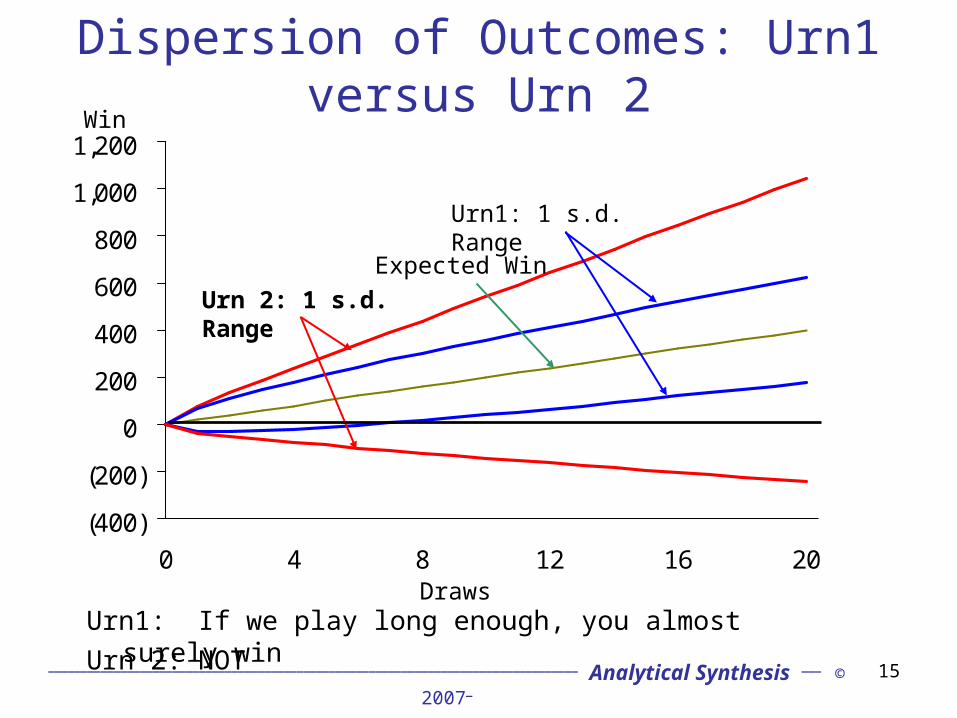
15
Dispersion of Outcomes: Urn1 versus Urn 2
(400)
(200)
0
200
400
600
800
1,000
1,200
0 4 8 12 16 20Draws
Urn1: If we play long enough, you almost surely win
Urn1: 1 s.d. Range
Urn 2: 1 s.d. Range
Urn 2: NOT
Expected Win
Win
_________________________________________________________________________________ Analytical Synthesis ___ © 2007_
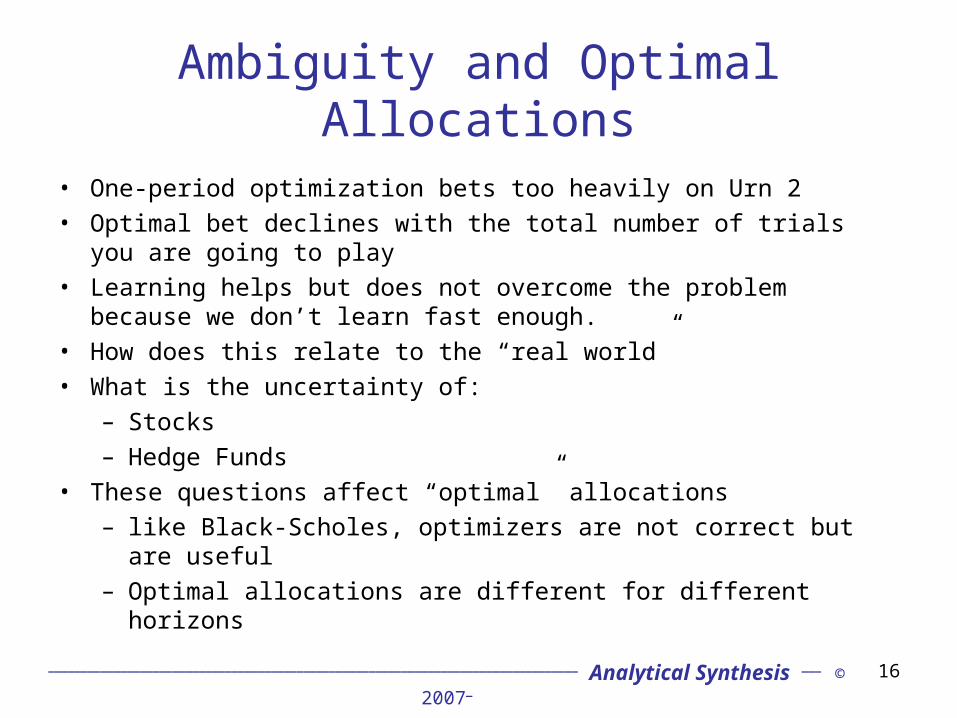
16
Ambiguity and Optimal Allocations
• One-period optimization bets too heavily on Urn 2• Optimal bet declines with the total number of trials you are going to
play • Learning helps but does not overcome the problem because we
don’t learn fast enough.• How does this relate to the “real world”• What is the uncertainty of:
– Stocks– Hedge Funds
• These questions affect “optimal” allocations – like Black-Scholes, optimizers are not correct but are useful– Optimal allocations are different for different horizons

_________________________________________________________________________________ Analytical Synthesis ___ © 2007_
17
Housing Futures and Options
• Futures and options trade on house price indices for:
Boston, Chicago, Denver, Las Vegas, Los Angeles, Miami, New York, San Diego, San Francisco, Washington, DC.
• Four quarterly contracts trade (efforts are being made to extend further)
• Open interest in futures is about $100 million and options are about twice that.

_________________________________________________________________________________ Analytical Synthesis ___ © 2007_
18
Housing price indices: time-series behavior
• Autocorrelation of quarterly returns:Lag 1 0.70
2 0.423 0.56
4 0.72
• Risk for different horizons:Periodicity Unconditional Conditional3 months 3.8% 1.9%1 year 6.4 4.22 years 8.6 6.93 years 10.0 9.2
Data for 10-city composite, 1987-2006.

_________________________________________________________________________________ Analytical Synthesis ___ © 2007_
19
Risk varies by horizonAnnualized Volatility by Horizon
0.00%
2.00%
4.00%
6.00%
8.00%
10.00%
12.00%
14.00%
16.00%
18.00%
0.083333333 0.25 1 2 3 5
Years
S.D
.
Stocks
Long Bonds
Housing
Inflation
T-bills
_________________________________________________________________________________ Analytical Synthesis ___ © 2007_
20
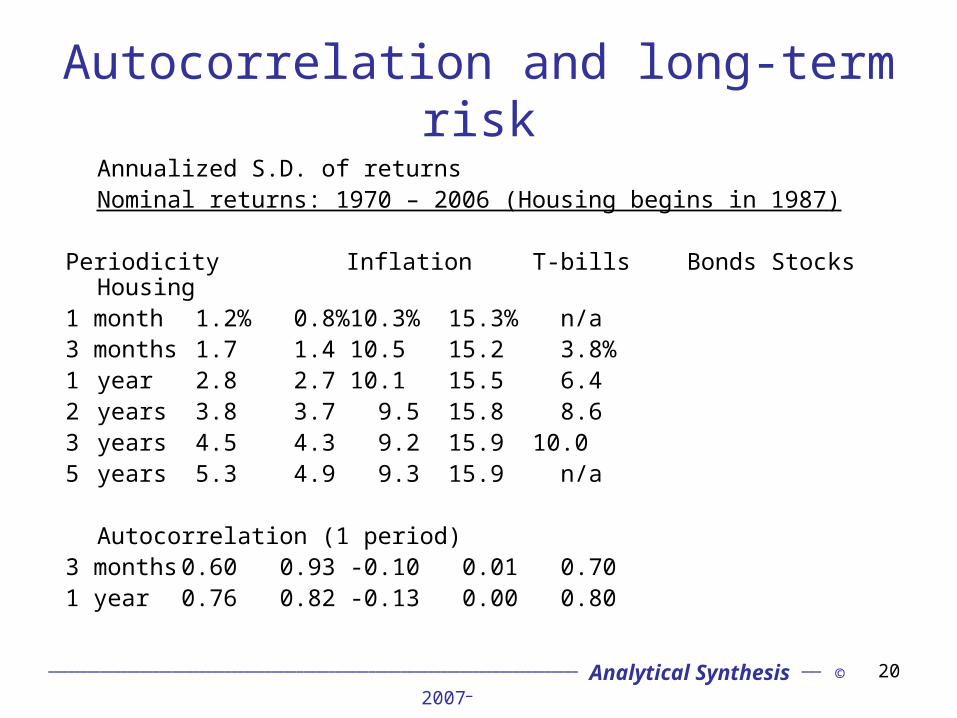
Autocorrelation and long-term risk
Annualized S.D. of returnsNominal returns: 1970 – 2006 (Housing begins in 1987)
Periodicity Inflation T-bills Bonds Stocks Housing1 month 1.2% 0.8% 10.3% 15.3% n/a3 months 1.7 1.4 10.5 15.2 3.8%1 year 2.8 2.7 10.1 15.5 6.42 years 3.8 3.7 9.5 15.8 8.63 years 4.5 4.3 9.2 15.9 10.05 years 5.3 4.9 9.3 15.9 n/a
Autocorrelation (1 period)3 months 0.60 0.93 -0.10 0.01 0.701 year 0.76 0.82 -0.13 0.00 0.80

_________________________________________________________________________________ Analytical Synthesis ___ © 2007_
21
Autocorrelation and long-term risk
Annualized S.D. of returns Real returns: 1970 – 2006 (Housing begins in 1987)
Periodicity T-bills Bonds Stocks Housing1 month 1.1% 10.6% 15.5% n/a3 months 1.5 11.0 15.6 3. 9%1 year 2.4 11.5 16.2 6.72 years 3.2 12.0 16.7 9.13 years 3.8 12.4 17.1 10.75 years 4.3% 13.2 17.5 n/a
Autocorrelation (1-period)3 months 0.52 -0.03 0.03 0.711 year 0.75 0.06 0.03 0.80

_________________________________________________________________________________ Analytical Synthesis ___ © 2007_
22
Selected ReferencesBarberis, Nicholas. 2000. “Investing for the Long Run When Returns are
Predictable.” Journal of Finance, vol. 55, no. 1 (Feb.): 225-264.
Campbell, John Y. and Luis M. Viceira. Strategic Asset Allocation: Portfolio Choice for Long-Term Investors. New York: Oxford University Press, 2002
Campbell, John Y. and Luis M. Viceira. (2005) The Term Structure of the Risk–Return Trade-Off Financial Analysts Journal (Jan) Vol. 61, No. 1: 34-44..
J.S.Chipman. “Stochastic Choice and Subjective Probability” in Decisions, Values and Groups, ed. D. Willner. New York: Pergamon Press, 1960.
Ellsberg, Daniel. 1961. “Risk, Ambiguity and the Savage Axioms.” Quarterly Journal of Economics, vol. 75, no 4: 643-669.
Knight, Frank, 1921, Risk, Uncertainty and Profit (reprinted by New York: Augustus M. Kelly, 1964).
Reiss, Jonathan A., 2006 "The Impact of Expected Return Uncertainty on Long Horizon Risk and Allocation Decisions" //ssrn.com/abstract=761104
_________________________________________________________________________________ Analytical Synthesis ___ © 2007_
23
Summary and Puzzles• We should understand how risk varies with time better.• Topics for further investigation:
– Far-sighted portfolio construction• What does our understanding of the time-series dynamics of
asset prices tell us about optimal long-term portfolios• How can we improve our understanding of the time-series
dynamics of asset prices • Can ambiguity help construct better portfolios?• How should allocations vary depending on time horizon?
– Housing market improvements• Why is it so inefficient and what can be done?• Why is fundamental innovation so difficult?
• Comments, questions, collaboration are very welcome
Jonathan Reiss, [email protected]

![[Katharina Reiss] Translation Criticism- Potential(BookZZ.org)](https://static.documents.pub/doc/80x56/55cf8f33550346703b99eef7/katharina-reiss-translation-criticism-potentialbookzzorg.jpg)


