Page 1
SIXTH FRAMEWORK PROGRAMME
SCIENTIFIC SUPPORT TO POLICIES
Risk Assessment Methodologies for Soil ThreatsRisk Assessment Methodologies for Soil ThreatsRisk Assessment Methodologies for Soil Threats
SPECIFIC SUPPORT ACTION SSPE0-CT-2006-044240
PR1.2
Questionnaires
Date of preparation: May 2007
Author(s): Hanneke Heesmans
Leading participant Alterra
Status: Project Report
Page 2
CONTENTS
Objectives ............................................................................................ 3
Introduction .......................................................................................4
General: How to get a high response from your questionnaire ...........................4
Pilot study.......................................................................................5
General: How to analyze questionnaires .....................................................6
Data cleaning ...................................................................................6
The RAMSOIL Questionnaires....................................................................8
Options for a RAMSOIL questionnaire analyze system ......................................8
Coding system ..................................................................................8
Categories questions ........................................................................9
Database ...................................................................................... 10
What to think about when you have the answers in a database ..................... 10
Annex ............................................................................................. 11
Coding system ................................................................................ 11
References....................................................................................... 21
Page 3
OBJECTIVES
For the RAMSOIL project, a work plan had to be developed to create and distribute
questionnaires to all member states of the European Union. This work plan had to
make sure the questionnaires were made easy to understand, and that the right
questions were given to the persons responsible for policy or scientific knowledge
regarding the 5 soil threats. Furthermore, it has to give a first idea on how to analyze
the questionnaires for a database set up.
Page 4
Introduction
The RAMSOIL (Risk Assessment Methodologies for SOIL threats) project started in February
2007. The objective of the RAMSOIL project is to provide an inventory of the different risk
assessments methodologies for soil threats regarding agricultural soils that are currently used in
the European Union. In order to make this inventory of the Risk Assessment Methodologies
(RAMs) currently used, questionnaires were developed to invite both policy makers and scientists
involved in the process of determining RAMs used for the 27 EU countries.
The RAMSOIL questionnaires were sent to all 27 member states of the European Union.
According to the EU Thematic Strategy on Soils, these member states need to develop a risk
assessment methodology for the soil threats in their countries, and with the questionnaire,
RAMSOIL is examining these current RAMs used.
General: How to get a high response from your questionnaire
Several rules can be applied for making a questionnaire with a high response number. Previous
studies suggest that achieving a good response rate is a particular problem for postal
questionnaire surveys. Previous studies suggest that the response rate may be reduced by up to
20% compared to an interviewer- based survey. A response rate of 75% for a postal
questionnaire survey is considered to be extremely good [Williams, 2003].
Some of the tips given in [Williams, 2003]:
• Questions should be short (less than 20 words is recommended).
• Avoid making assumptions in your questions.
For example, ‘How often do you visit the dentist?’ assumes that the respondent attends
the dentist regularly. You should break this question down into two parts, i.e. ‘Do you
visit the dentist for checkups?’ and ‘If yes, how often do you go for a check-up?’
• Prevent time-memory bias . It is unwise to ask about things that have happened more
than 6 months in the past; People find it particularly difficult to recall events that have
happened some time ago. If this is unavoidable then you should either use wide time
scales, for example 6–12 months, or put the event in question into some sort of context.
• Order of your questions . Studies have shown that a better response rate is achieved if
general questions precede specific questions.
• Open versus closed . Although closed questions tend to yield better response rates,
there is a risk that some subjects will be led to give a response that they may not
otherwise have given simply because it is on the list. You will need to spend some time
piloting your questionnaire to ensure that the whole range of responses is included for
each question. It is also a good idea to include an ‘other’ tick box, to cover all
eventualities, in answers to questions where there is a list of possible responses.
Page 5
• Comments : with closed questions, include an opportunity at the end of each section for
respondents to give their comments and the possibility to add any further explanation
about their responses. You can then either code these comments and include them in the
analysis or quote them verbatim in your study report.
• Use at least a size 14 font size for the questions to avoid cramming too many questions
onto a page in an effort to save paper!
• Make a unique ID label so reminders can be sent.
• Make sure the information is confidential and that the respondents know this.
• Print the questionnaire on good quality paper (at least 100 g).
• Use brightly coloured paper for the front and back covers to grab the respondent’s
attention.
• The questions itself however should be written on white paper, because this is less tiring
on the eye’s.
• Send subjects information, asking them to indicate whether they wish to take part in a
survey, rather than simply sending them a questionnaire through the post, with a letter
cover asking them to complete it.
• Use white stamped envelopes, which look more personal.
• Send postal questionnaires with a pre-paid envelope for their return.
• Questions can be divided into those directly related to the research question: filter
questions (explore the characteristics of the different study groups) and ‘filler’ questions
(although not part of the research question, aid the flow of the questionnaire) [Williams,
2003].
Pilot study
Testing reliability
Reliability is defined as an assessment of the reproducibility and consistency of an instrument.
For self complete questionnaires, two aspects of reliability should be examined. You can assess
test–retest reliability by asking people to complete the questionnaire on two separate occasions
approximately 2 to 3 weeks apart, assuming that their circumstances will not have changed in the
interim. The two sets of responses can then be compared statistically using weighted Kappa12
for categorical data and Spearman’s Rank Correlation Coefficient (or its non-parametric
equivalent, the Wilcoxon Rank Sum test) for continuous data. You can determine the internal
consistency of your questionnaire by asking a question or questions in more than one way during
the questionnaire. The responses given can then be compared as before [Williams, 2003].
Lay-out
Page 6
Page 6 of 21
Testing acceptance
Qualitative methods can be used to assess the acceptability of a questionnaire. You can either
ask the subjects included in your pilot study to write their comments about the questionnaire on a
separate sheet or you can ask them over the telephone how they found answering the
questionnaire during the validity testing. It’s also a good idea to ask people in the pilot study how
long it took them to complete the questionnaire. You can then include this information in the cover
letter that you use to accompany the questionnaire in your main survey [Williams, 2003].
Design your coding team
Coding is the process of converting questionnaire data into meaningful categories to
facilitate analysis . You need to think about your coding scheme at the beginning of your study
and, wherever possible, build it into your questionnaire, for example by numbering the response
tick boxes for each question. This will allow you to enter data directly from the questionnaire into
your database for analysis. The numbers within the boxes should correspond to the variables in
the database where the responses will be stored. The alternative is to code the questionnaire
responses onto a separate coding sheet and then to enter the data from the coding sheet into the
database. This process is not only laborious, but also doubles the margin for error and observer
bias. It’s a good idea to test your coding scheme and data entry process during the pilot study, so
that problems can be rectified before the main study starts. It’s also prudent to discuss the coding
scheme for your questionnaire with a statistician at this stage so that any mistakes can be
rectified before you go to the printers [Williams, 2003].
General: How to analyze questionnaires
Novice researchers often assume that once they have selected, designed, and distributed their
questionnaire, their work is largely complete. In reality, entering, checking, and cleaning the data
account for much of the workload [Boynton, 2007] :You should not under-estimate the amount of
work and time involved in collecting and analyzing qualitative data [Williams, 2003]. Some options
for analyzing the questionnaire are:
Data cleaning
It is good practice to check through each completed questionnaire when you receive it to check
for missing data. If there are any factual gaps in people’s responses, for example, the number of
visits, then it may then be possible to enter these data from other sources. Subjects who have
failed to follow the filters and answered every single question can also be identified at this stage,
and if necessary, contacted to verify information.
Page 7
Page 7 of 21
Once you’ve entered your entire questionnaire responses into the database it is necessary to
spend some time cleaning the data to identify inconsistencies and outliers. This is a laborious
process and there is a strong temptation to leave this stage out, particularly if there is a scientific
conference looming at which you’ve promised to present the results of your study! This is a false
economy, however, since you may then have the embarrassment of having to amend your
abstract or even withdraw your paper when you discover that your ‘exciting’ finding is merely the
result of a data entry error! The quickest way to clean your data is to produce frequency figures
for each question and examine the outliers. Simple cross-tabulations can then be used to identify
nonsensical responses. Two approaches can be used when analyzing the responses to open-
ended questions [Williams, 2003]:
1. You may choose to examine all the responses to a question, devise categories for the
answers and then code the data in the same way as a closed response question.
2. Alternatively, interesting responses can be quoted verbatim in the final report. The choice
depends on the nature of the question and the range of answers given. Once you have coded
as many of the open-ended questions as possible you can enter your data directly from the
completed questionnaires into a computer program for analysis. The Statistical Package for
Social Sciences (SPSS) is a useful software package for questionnaire surveys because it is
flexible and easy to use.
Page 8
Page 8 of 21
The RAMSOIL Questionnaires
Two different questionnaires were developed. This division was a policy questionnaire and 5
more scientific questionnaires related to the 5 agricultural soil threats. The policy questionnaire
was developed for the most influential politicians on soil threat policy in a specific country. The
scientific questionnaires were developed for scientists, who are involved in the development of a
RAM for a specifics soil threat. The 27 member states of the European Union were divided
between the participants in the RAMSOIL project.
The politicians were located through research (telephone calls to governmental departments,
response from governmental contacts and web search) and were asked to fill in names for the
scientific back up of their RAM used. The names of these scientists were used, along with names,
found through literature research, the internet, and through inquiries at conferences, meetings
and workshops, to establish a network of scientist for the scientific questionnaire.
Both questionnaires included open and closed questions, but primarily questions with check
boxes as an answer were used. The reason for choosing different lay outs for the questions was
that a balance had to be found between getting easily filled in answers (one question with multiple
answers limited by predefined check boxes), and the maximum response of information from the
different countries to our questions (open questions). Respondents had to fill in their personal
information (name, address, email address and country) so they could be contacted if any
questions were still unanswered. The policy questionnaire was more descriptive in the
methodology for the RAM used; what indicators, what thresholds, and what motivation were used
in relation to a certain RAM.
The scientific questionnaires were a more detailed version of the policy questionnaire where a
more in-depth indicator field was established necessary for the identification of the RAMs on a
scientific level.
Options for a RAMSOIL questionnaire analyze system
The questions used in the questionnaire were diverse and had several consequences for the
analysis: especially for the way the input into the database should be given.
Coding system
In order to make sure all answers are filled into the database, and can be retrieved easily, a
coding system is necessary to store all possible answers. In the annex an example is given for a
coding system for the policy questionnaire used. The coding system makes sure all answers are
related to a field in a database. It is useful to make a coding system for all questionnaires so it
can be used as a back up and guiding system when filling in the questionnaires into the
database.
Page 9
Page 9 of 21
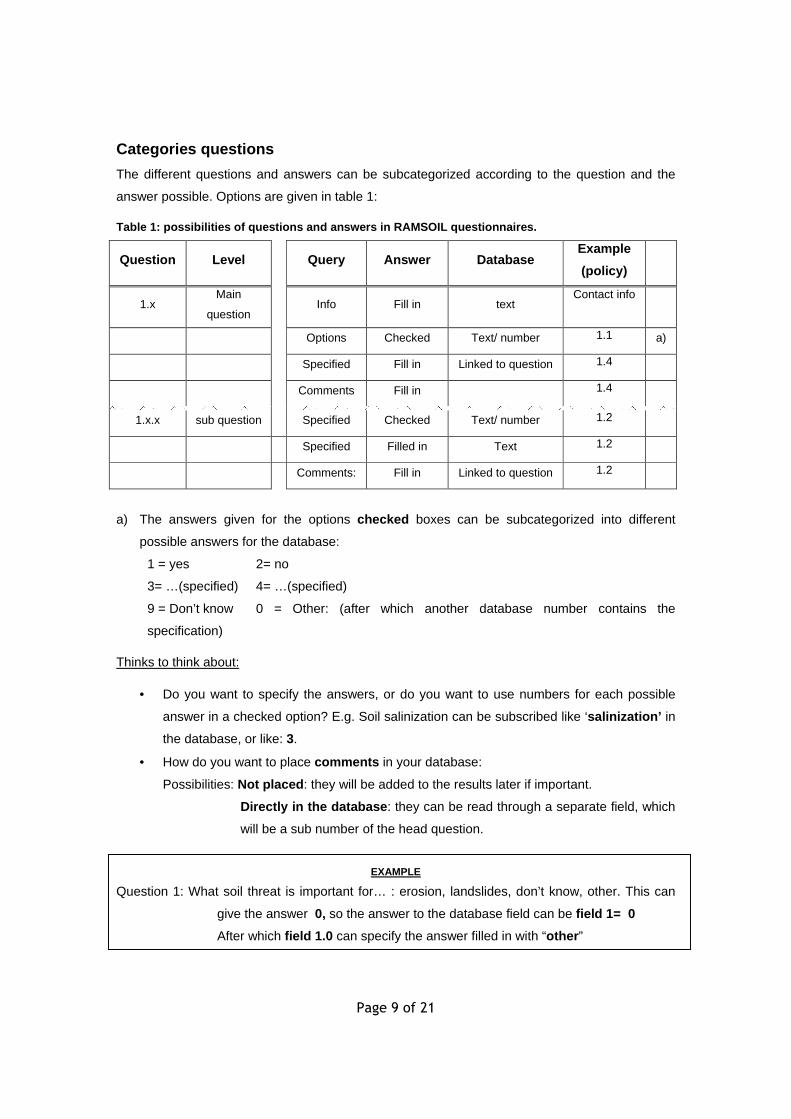
Categories questions
The different questions and answers can be subcategorized according to the question and the
answer possible. Options are given in table 1:
Table 1: possibilities of questions and answers in RAMSOIL questionnaires.
Question Level Query Answer Database Example
(policy)
1.x Main
question Info Fill in text
Contact info
Options Checked Text/ number 1.1 a)
Specified Fill in Linked to question 1.4
Comments Fill in 1.4
1.x.x sub question Specified Checked Text/ number 1.2
Specified Filled in Text 1.2
Comments: Fill in Linked to question 1.2
a) The answers given for the options checked boxes can be subcategorized into different
possible answers for the database:
1 = yes 2= no
3= …(specified) 4= …(specified)
9 = Don’t know 0 = Other: (after which another database number contains the
specification)
Thinks to think about:
• Do you want to specify the answers, or do you want to use numbers for each possible
answer in a checked option? E.g. Soil salinization can be subscribed like ‘salinization’ in
the database, or like: 3.
• How do you want to place comments in your database:
Possibilities: Not placed : they will be added to the results later if important.
Directly in the database : they can be read through a separate field, which
will be a sub number of the head question.
EXAMPLE
Question 1: What soil threat is important for… : erosion, landslides, don’t know, other. This can
give the answer 0, so the answer to the database field can be field 1= 0
After which field 1.0 can specify the answer filled in with “other ”
Page 10
Page 10 of 21
Database
One of the most important analytic tools for these questionnaires is the database. Microsoft
Access is probably the best programme to use for such elaborate questionnaires as the ones
asked in the RAMSOIL questionnaires. The structure of this database is going to be set up within
the next weeks.
What to think about when you have the answers in a database
The database is filled in and the answers from the questionnaires can be retrieved easily. Now
the answers can be valued and analyzed according to the information found in the
questionnaires. Several things have to be considered.
• The answers can be viewed from a perspective of location (e.g. southern EU countries),
specific RAMs (e.g. only erosion) or by background (policy maker or scientist). Which of
these point of views give the best results when analyzing the questionnaires.
• The most important answers can be taken out of the database and numbered according
to interest or importance. One of the possibilities is to weigh each answer. An example of
weighing is that the 5 most important answers or reasons given for a question can be
given a weighing number from 1 till 5. 1 being the most highly valued answer, and 5 the
least valued answer. This weighing can focus on important differences within the different
questionnaires and can be important when (the size of) the questionnaire is limiting the
logic to see ‘through’ the questionnaire and find corresponding answers or relations
within the questionnaires.
• How is weighing going to be implemented within the database? It is possible this should
be considered beforehand and given in the coding of the questionnaire. Maybe it is also
possible to implement the weighing in the database.
• Weighing can be visualized by putting the answers in a graph (spider or radar graph)
according to the weighing number. Several basic graphs can be given and the number of
questionnaires which resemble these basic graphs can be ordered according to their
resemblance. This can show results in a more clustered way easily.
• The answers given in the different questionnaires can be related to each other. This
means that several questions can be found in both questionnaires, and it can be
interesting when several people in one country give different answers to specified RAMs.
It is important to know the harmonized questions beforehand.
• Another possibility to analyze the questionnaires is by selecting the extremes. The first
discrimination division can be made in whether a country already has RAMs for all soil
threats or is not active in any RAM in any soil threat. Everything else is in between these
two possibilities. This could give a broad overview of the possibilities within Europe.
Page 11
Page 11 of 21
Annex
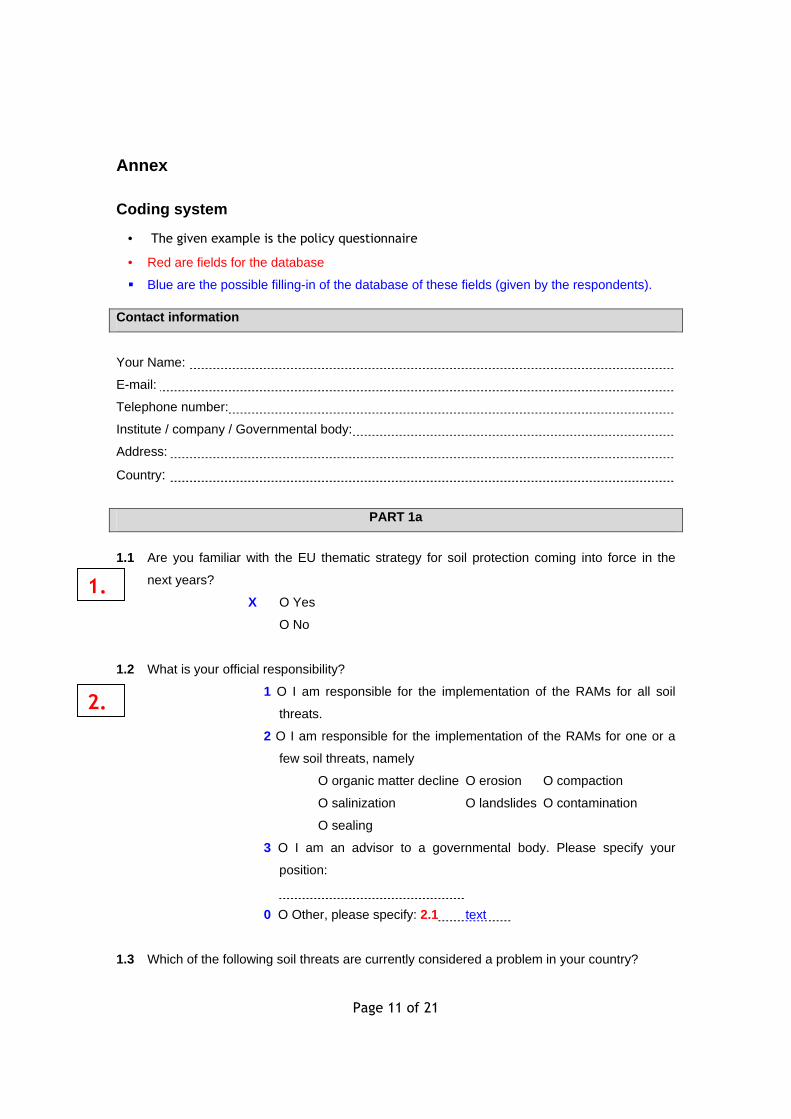
Coding system
• The given example is the policy questionnaire
• Red are fields for the database
� Blue are the possible filling-in of the database of these fields (given by the respondents).
Your Name:
E-mail:
Telephone number:
Institute / company / Governmental body:
Address:
Country:
PART 1a
1.1 Are you familiar with the EU thematic strategy for soil protection coming into force in the
next years?
X O Yes
O No
1.2 What is your official responsibility?
1 O I am responsible for the implementation of the RAMs for all soil
threats.
2 O I am responsible for the implementation of the RAMs for one or a
few soil threats, namely
O organic matter decline O erosion O compaction
O salinization O landslides O contamination
O sealing
3 O I am an advisor to a governmental body. Please specify your
position:
0 O Other, please specify: 2.1 text
1.3 Which of the following soil threats are currently considered a problem in your country?
Contact information
1.
2.
Page 12
Page 12 of 21
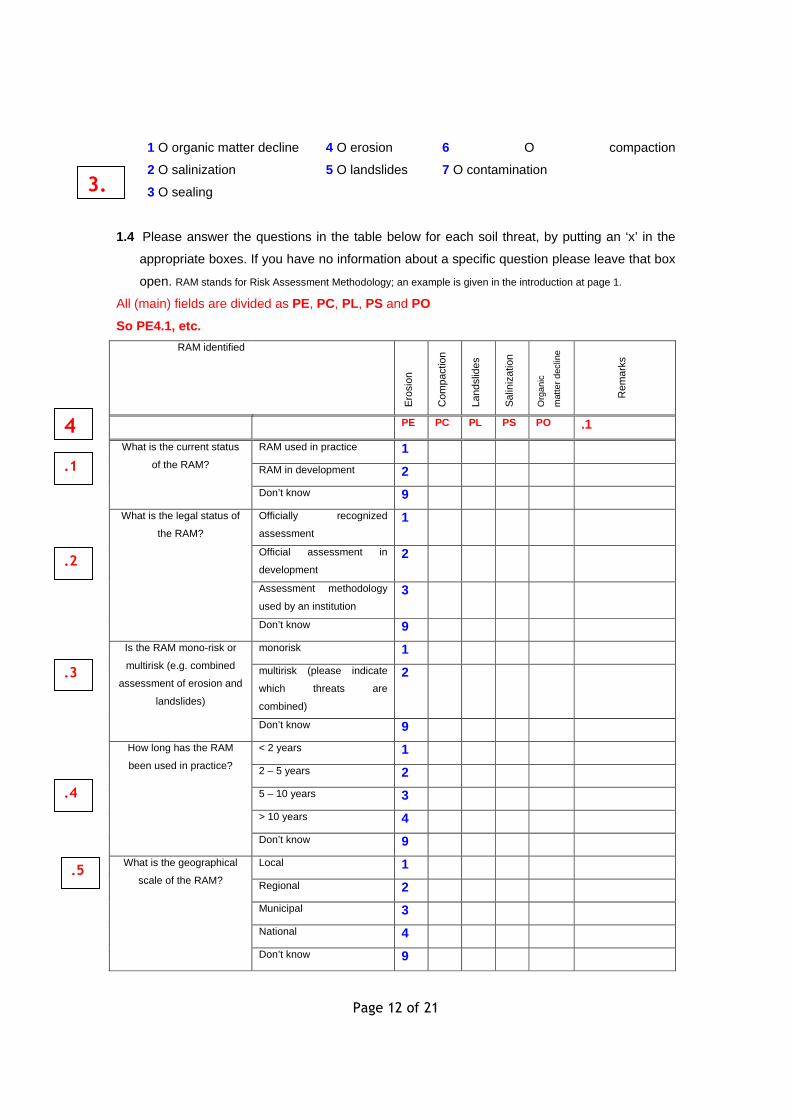
1 O organic matter decline 4 O erosion 6 O compaction
2 O salinization 5 O landslides 7 O contamination
3 O sealing
1.4 Please answer the questions in the table below for each soil threat, by putting an ‘x’ in the
appropriate boxes. If you have no information about a specific question please leave that box
open. RAM stands for Risk Assessment Methodology; an example is given in the introduction at page 1.
All (main) fields are divided as PE, PC, PL, PS and PO
So PE4.1, etc.
RAM identified
Ero
sion
Com
pact
ion
Land
slid
es
Sal
iniz
atio
n
Org
anic
mat
ter
decl
ine
Rem
arks
PE PC PL PS PO .1
RAM used in practice 1
RAM in development 2
What is the current status
of the RAM?
Don’t know 9
Officially recognized
assessment
1
Official assessment in
development
2
Assessment methodology
used by an institution
3
What is the legal status of
the RAM?
Don’t know 9
monorisk 1
multirisk (please indicate
which threats are
combined)
2
Is the RAM mono-risk or
multirisk (e.g. combined
assessment of erosion and
landslides)
Don’t know 9
< 2 years 1
2 – 5 years 2
5 – 10 years 3
> 10 years 4
How long has the RAM
been used in practice?
Don’t know 9
Local 1
Regional 2
Municipal 3
National 4
What is the geographical
scale of the RAM?
Don’t know 9
3.
4
.1
.2
.3
.4
.5
Page 13
Page 13 of 21
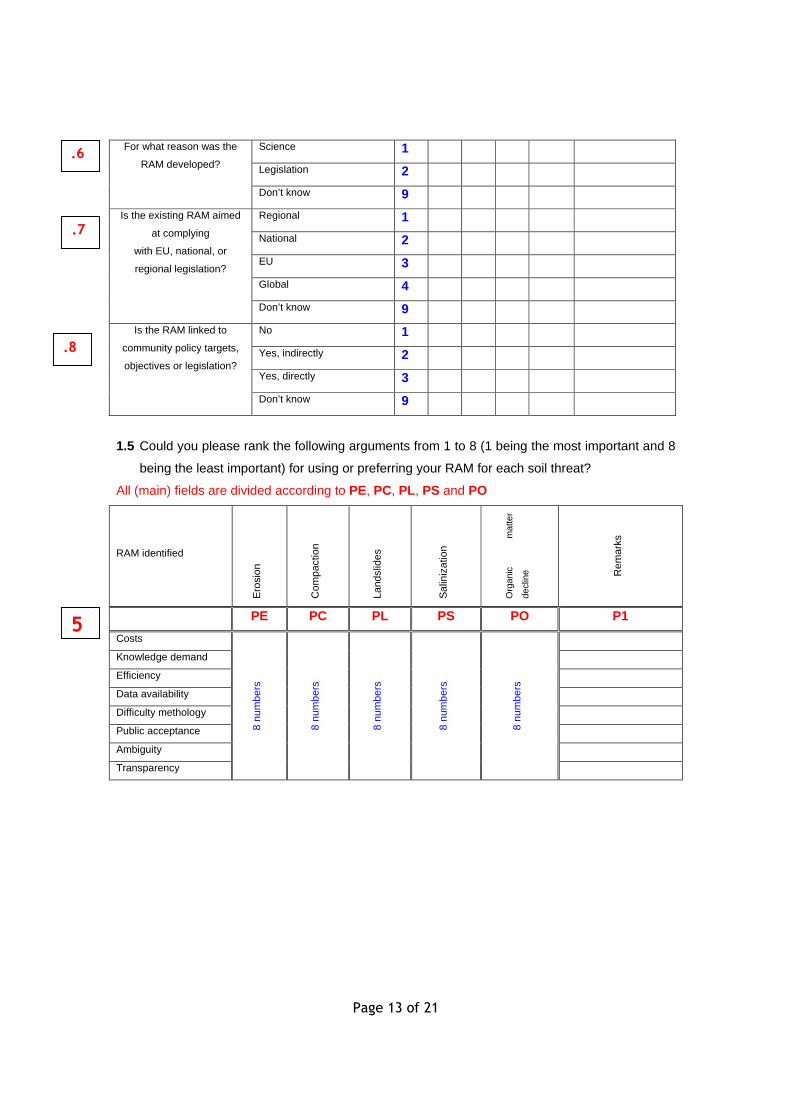
Science 1
Legislation 2
For what reason was the
RAM developed?
Don’t know 9
Regional 1
National 2
EU 3
Global 4
Is the existing RAM aimed
at complying
with EU, national, or
regional legislation?
Don’t know 9
No 1
Yes, indirectly 2
Yes, directly 3
Is the RAM linked to
community policy targets,
objectives or legislation?
Don’t know 9
1.5 Could you please rank the following arguments from 1 to 8 (1 being the most important and 8
being the least important) for using or preferring your RAM for each soil threat?
All (main) fields are divided according to PE, PC, PL, PS and PO
RAM identified
Ero
sion
Com
pact
ion
Land
slid
es
Sal
iniz
atio
n
Org
anic
m
atte
r
decl
ine R
emar
ks
PE PC PL PS PO P1
Costs
Knowledge demand
Efficiency
Data availability
Difficulty methology
Public acceptance
Ambiguity
Transparency
8 nu
mbe
rs
8 nu
mbe
rs
8 nu
mbe
rs
8 nu
mbe
rs
8 nu
mbe
rs
.6
.7
.8
5
Page 14
Page 14 of 21
PART 1b
Several specific questions per soil threat are listed in the following section. This selection has
been divided into the 5 separate soil threats. Please fill in the questions concerning the soil
threats in your country. If you have no information you can leave the questions unanswered, but
please make sure to check all pages.
Erosion
1.6 Please provide the person and/or organisation for obtaining detailed information on the RAM
for erosion:
1. Name organization/ institute: text
2. Name: text
3. Email address contact person: text
1.7 Please list (and if possible, attach) the most important references (preferably digital and in
preferably English) on the RAM for erosion.
X=text or attach
1.8 Please list the most important weblink related to the RAM for erosion.
X=text or attach
1.9 Which process is characterised by the methodology?
1 O Water erosion
2 O Wind erosion
3 O Both
1.10 What type of data are currently being collected specifically for soil erosion, in addition to the
ones listed in 1.4?
1 O Climate 4 O Soil 6 O Topography
2 O Lithology 5 O Land cover 7 O Management practices
3 O Soil erosion rate
PE1
PE2
PE3
PE4
PE5
Page 15
Page 15 of 21
Compaction
1.11 Please provide the person and/or organisation for obtaining detailed information on the risk
assessment methodology for compaction:
1. Name organization/ institute: text
2. Name: text
3. Email address contact person: text
1.12 Please list (and if possible, attach) the most important references (preferably digital and in
English or other international languages) on the RAM for compaction.
X=text or attach
1.13 Please list the most important weblink related to the RAM for compaction.
X=text or attach
Landslides
1.14 Please provide the person/organisation for obtaining detailed information on the risk
assessment methodology for landslides:
1. Name organization/ institute: text
2. Name: text
3. Email address contact person: text
1.15 Please list (and if possible, attach) the most important references (preferably digital and in
English or other international languages) on the RAM for landslides.
X=text or attach
1.16 Please list the most important weblink related to the RAM
X=text or attach
1.17 Please indicate what type of information is available for landslides.
PC1
PC2
PC3
PL1
PL2
PL3
PL4
Page 16
Page 16 of 21
Information Yes No Remarks
1. Date of events 1 2 3
2. Location and map of the processes:
3. Information on the triggering event
4. Estimation of the damages (if any):
5. Photographs of the event
6. Documentation
Salinization
1.18 Please provide the person/organisation for obtaining detailed information on the risk
assessment methodology for salinization:
1. Name organization/ institute: text
2. Name: text
3. Email address contact person: text
1.19 Is the RAM aimed at:
1. Ο only salinity
2. Ο only sodicity
3. Ο salinity and sodicity
1.20 Please list (and if possible, attach) the most important references (preferably digital and in
English or other international languages) on the RAM for salinization.
X=text or attach
1.21 Please list the most important weblink related to the RAM for salinization.
X=text or attach
Organic matter decline
1.22 Please provide the person/organisation for obtaining detailed information on the risk
assessment methodology for organic matter decline:
1. Name organization/ institute: text
2. Name: text
3. Email address contact person: text
1.23 Please list (and if possible, attach) the most important references (preferably digital and in
English or other international languages) on the RAM for soil organic matter decline.
X=text or attach
1.24 Please list the most important weblink related to the RAM for soil organic matter decline.
X=text or attach
PS1
PS2
PS4
PS3
PO1
PO2
PO3
Page 17
Page 17 of 21
PART 2
This is a more detailed part with 2 questions about the 5 soil threats.
2.1 Please answer the questions in the table below for each soil threat, by putting an ‘x’ in the
appropriate boxes. If you have no information about a specific question please leave that box
unanswered. RAM stands for Risk Assessment Methodology; an example is given in the introduction at page 1.
RAM identified
Ero
sion
Com
pact
ion
Land
slid
es
Sal
iniz
atio
n
Org
anic
mat
ter
decl
ine
Rem
arks
PE PC PL PS PO
Yes
No
Is the RAM used for
monitoring purposes?
Don’t know
Not sensitive: delayed
response
Intermediate response
Fast, immediate response
How would you describe
the sensitivity of the RAM?
Don’t know
Qualitative, expert based
Qualitative, weighted-rating
Qualitative, other
Quantitative, monitoring
network
Quantitative other
Modelled, empirical
Modelled, process-based
Combination (please
indicate)
Is the RAM based on
qualitative (e.g.
questionnaires to farmers),
quantitative (e.g. monitoring
network) and/or calculated
states/trends?
Don’t know
Field observations
Remote sensing
GIS
Laboratory analysis
Other
What type of information is
used? (multiple answers
possible)
Don’t know
No
Yes, occasional data
source
Yes, regular data source
Are time series available for
implementing the RAM?
Don’t know
6
Page 18
Page 18 of 21
RAM identified
Ero
sion
Com
pact
ion
Land
slid
es
Sal
iniz
atio
n
Org
anic
m
atte
r
decl
ine
Rem
arks
Annually
Once every 1- 5 years
Once every 5-10 years
Other (please specify)
At what time interval are
data collected?
Don’t know
Not at all
Fairly clear
Very clear
Are outputs of the RAM
clear and easy to
understand? Don’t know
No
Yes, but requires lengthy
processing
Yes
Are the statistics or data
needed for compilation
easily accessible?
Don’t know
No
Yes, but as additional
measurements to an
existing monitoring network
Yes
Is the setup of a (new)
monitoring network required
to implement the RAM?
Don’t know
General public
Administration officers
Scientists
Others (please specify)
In case of an existing
database, to whom is it
accessible?
Don’t know
Page 19
Page 19 of 21
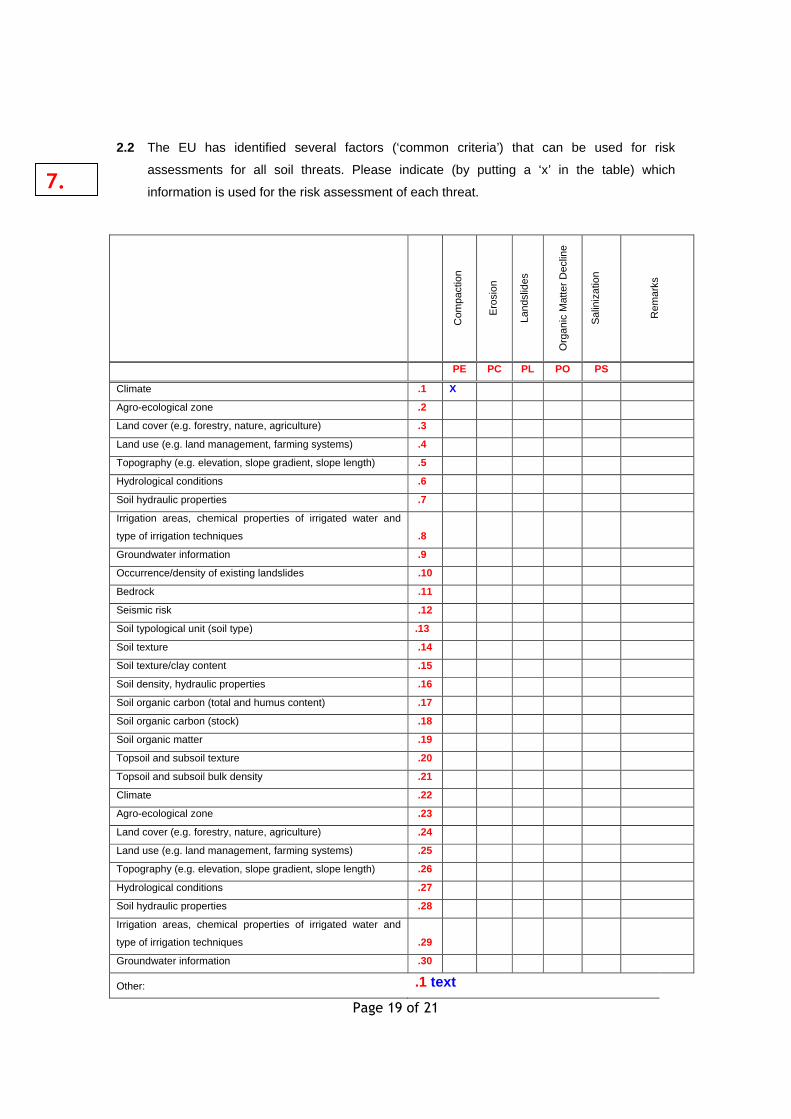
2.2 The EU has identified several factors (‘common criteria’) that can be used for risk
assessments for all soil threats. Please indicate (by putting a ‘x’ in the table) which
information is used for the risk assessment of each threat.
Com
pact
ion
Ero
sion
Land
slid
es
Org
anic
Mat
ter
Dec
line
Sal
iniz
atio
n
Rem
arks
PE PC PL PO PS
Climate .1 X
Agro-ecological zone .2
Land cover (e.g. forestry, nature, agriculture) .3
Land use (e.g. land management, farming systems) .4
Topography (e.g. elevation, slope gradient, slope length) .5
Hydrological conditions .6
Soil hydraulic properties .7
Irrigation areas, chemical properties of irrigated water and
type of irrigation techniques .8
Groundwater information .9
Occurrence/density of existing landslides .10
Bedrock .11
Seismic risk .12
Soil typological unit (soil type) .13
Soil texture .14
Soil texture/clay content .15
Soil density, hydraulic properties .16
Soil organic carbon (total and humus content) .17
Soil organic carbon (stock) .18
Soil organic matter .19
Topsoil and subsoil texture .20
Topsoil and subsoil bulk density .21
Climate .22
Agro-ecological zone .23
Land cover (e.g. forestry, nature, agriculture) .24
Land use (e.g. land management, farming systems) .25
Topography (e.g. elevation, slope gradient, slope length) .26
Hydrological conditions .27
Soil hydraulic properties .28
Irrigation areas, chemical properties of irrigated water and
type of irrigation techniques .29
Groundwater information .30
Other: .1 text
7.
Page 20
Page 20 of 21
Text box for comments
text
8
Page 21
Page 21 of 21
References
Williams, A., 2003, How to...Write and analyse a questionnaire, University of Bristol
Dental School, Bristol, UK, Journal of Orthodontics, Vol. 30, 2003, 245–252.
Boynton, P.M., Administrating, analysing, and reporting your questionnaire, 18 april
2007, Downloaded from http://www.bmj.com.