Date post: | 30-Mar-2018 |
Category: |
Documents |
Upload: | truongtruc |
View: | 217 times |
Download: | 2 times |
1
Risk Based Pricing in the Credit Card Industry:
Evidence from US Survey Data
José Liñares-Zegarra a
John O. S. Wilson b+
Abstract
This paper explores the risk-based pricing strategies of banks issuing credit cards
in the United States. We employ a unique database which combines both the risk of
cardholders (demand side) and terms and conditions of card cards (supply side) offered
in the US. Our results suggest that the annual percentage rates paid per unit of risk
decrease, implying that high-risk cardholders pay lower interest rates than their low-risk
counterparts. This effect is pronounced for sub-prime cardholders. These findings
suggest that the risk-based pricing strategies employed by banks are ineffective in
distinguishing between high- and low-risk consumers. The non-price characteristics of
credit cards (such as network affiliation, issuer brand and reward program) play an
important role in complementing the risk-based strategies.
Keywords: Risk-based pricing, credit card plans, demand, supply.
JEL Codes: D21, L8
a School of Management, University of St Andrews, The Gateway, North Haugh, St Andrews, Fife,
KY16 9AJ, UK. Tel: +44 1334 462800. Email: [email protected]
b School of Management, University of St Andrews, The Gateway, North Haugh, St Andrews, Fife,
KY16 9AJ, UK. Tel: +44 1334 462803. Email: [email protected]
+ Address for correspondence: José Liñares-Zegarra, School of Management, University of St Andrews,
The Gateway, North Haugh, St Andrews, Fife KY16 9SS, UK. Tel: +44 1334 462800. Fax: +44 1334
462812. E-mail: [email protected].
2
1. Introduction
Credit cards are an integral part of the financial and payment systems of modern
societies being used as a convenient payment medium (in place of traditional paper-
based instruments such as cash and checks) and a method for obtaining short-term
revolving credit to make purchases.1 Evidence suggests that reliance on credit cards has
led to an increase in consumer indebtedness and a rise in personal bankruptcy (Mann,
2007; Zywicki, 2005).
In recent years, banks and other financial institutions offering credit cards have
implemented risk-based pricing strategies, where high-risk cardholders are granted
credit cards at higher Annual Percentage Rates of interest (APRs) relative to their low-
risk counterparts. In a world of full information and rational decision makers, pricing
differences should only be related to differences in credit risk (Getter, 2006). Despite
the obvious importance for banks issuing credit cards, and government agencies tasked
with supervising and monitoring developments in the credit card industry, there has
been very little empirical research to assess whether in fact these strategies are effective
in measuring risk. This in part is due to a lack of publicly available data.
Against this background, this paper investigates risk-based pricing in the US
credit card market. We use survey data on both supply (terms and conditions of credit
card plans from a representative sample of issuer banks) and demand (risk
characteristics of cardholders located where banks market their card plans) sides of the
credit card market in the US. We use an innovative matching procedure to study how
1 Revolving consumer debt in the US (comprising almost entirely of credit card debt) stands at $950
billion, and approximately 13.9 per cent of consumer disposable income is used to service this debt (Joint
Economic Committee, 2009). Over 6,000 US depository institutions issue credit cards, and independently
set the terms and conditions. In addition, approximately 10,000 other institutions act as agents for card-
issuing institutions (Federal Reserve Board, 2011; GAO 2011). Recent data suggests that 176.8 million
US consumers hold 609.8 million credit cards, which represents an average of 3.5 cards per cardholder
(Foster et al., 2010, 2011). Gerdes (2008) and Prager et al. (2009) provide detailed overviews of the
functioning and regulation of the US credit card market.
3
card attributes and the level of risk of cardholders affect APRs charged by issuer banks.
Cardholder risk measures comprise: FICO credit score; presence of unpaid credit card
debt in the previous twelve months; and outstanding credit card debt.2 This
classification represents an improvement to previous empirical studies which only
differentiate between high- and low-risk cardholders in terms of outstanding card debt.
To test the effect of card issuer characteristics (supply of credit card plans) and the risk
of cardholders (demand side) on credit card interest rates, we utilize a two-stage least
squares approach to control for potential endogeneity biases in the empirical
specification.3
The results show a negative and statistically significant relationship between
different measures of cardholder risk and APRs. Specifically, we find a negative
relationship between being a sub-prime consumer (measured as a combination of lower
levels of FICO credit scores and higher levels of outstanding credit card debt) and the
APR charged on credit cards. This result has two important implications for industry,
regulatory and consumer stakeholders. First, it provides empirical support to theories
based on search behaviour by risky consumers in the US credit card market. Second it
suggests that issuer banks do not sort consumers in terms of risk. In other words, it
would be expected that low-risk consumers, on average, pay more APRs than high-risk
consumers.4 Low APRs charged to high-risk cardholders could lead to an unexpected
increase in their credit card debt and a worsening of their financial situation. However,
these findings could be also consistent with the observation that banks target high-risk
cardholders in order to increase long-term revenue and that prime consumers are cross-
2 The Fair Issac Corporation (FICO) credit score provides a snapshot of credit risk, and is computed using
information from an individual consumer‟s previous credit and payment history, and provides a summary
measure of the risk of default. As such, the FICO score. Consumers with high (low) FICO scores have a
lower (higher) risk of default. 3 Endogeneity can arise when causality is reversed, i.e., when some fees and penalties (over the limit fees
and minimum finance charges, in our particular case) depend on the prices (annual percentage rates)
charged to consumers. 4 Frank (2009) find many banks issuing credit cards do not appear to pursue risk-based pricing.
4
subsidizing sub-prime consumers. In fact, it seems that the credit card industry has
relied on riskier borrowers as a prime source of revenue (Martin, 2009). This is also
consistent with the idea that issuers want consumers to fail to pay their bills to a certain
extent so banks can charge them higher rates and more fees than they could charge
consumers who pay off their bill each month and are never late (Frank, 2012; Mann,
2007).
Our results suggest that non-price characteristics play a complementary role to
risk based pricing strategies. We find that the APRs charged on national credit cards are
lower compared to their local counterparts. This is perhaps due to advantages in
screening and monitoring cardholder risk. We also find evidence that banks offering
cards with reward programs charge lower APRs compared to cards with no reward
programs.
Cardholders pay high APRs for credit cards that include minimum finance
charges. Furthermore, some cardholders are willing to pay a premium for access to a
large card network. For example, in the case of the Discover card (a major network in
the US), cardholders are willing to pay higher interest rates compared to counterparts
holding cards affiliated to smaller networks such as American Express or Diners Club.
We also observe that prime cardholders of premium and gold cards pay lower APRs
than their sub-prime counterparts. Finally, our results suggest that APRs adjust to
changes in the market interest rates (1 year CD rate that represents a cost of funding to
the card providers) even after controlling for non-price characteristics of credit cards.
These results are robust to different econometric specifications.
Overall, the results of this study shed light on the effectiveness of risk-based
pricing strategies used in the US credit card industry. The rest of this paper is structured
as follows. Section 2 reviews relevant literature. Section 3 describes the data set. The
5
methods utilized to test the hypotheses are discussed in Section 4, while the empirical
findings are presented in Section 5. Section 6 provides final remarks.
2. Literature
Risk-based pricing (RBP hereafter) refers to the practice of setting price or other
credit terms based on the risk of nonpayment. In order to compensate for the higher risk
of default, banks offer consumers with poor credit histories less favorable credit terms
than their counterparts with strong credit histories. This practice has been used for many
years by lenders in mortgage loan markets, and more recently in credit card industry. In
recent years, there has been considerable interest in how RBP has been used for
extending credit to high-risk consumers. In the case of credit cards, several laws and
amendments have been passed to ensure consumers are informed of the terms and
conditions of their credit cards and are protected from unfair business practices.5 The
extent to which RBP in the credit card industry is an effective tool in distinguishing
between high- and low-risk consumers remains uncertain.
A small body of research evidence has explored the relationship between
consumer risk and the price charged by credit card providers. Here we can distinguish
between two strands of research. The first (which has been the most common in the
literature) explores the effects of price changes on cardholder default. The second
examines the determinants of observed credit card prices (Annual Percentage Rates of
Interest or APRs). The market power of incumbent card providers, credit card
characteristics and the credit risk of consumers are commonly cited factors in
determining prices. The remainder of this section provides a brief review of this
literature.
5The Credit Card Accountability, Responsibility and Disclosure (CARD) Act of 2009 served to give
cardholders many guarantees with respect to the terms and conditions associated with their credit cards
(Bar-Gill and Bubb, 2012).
6
The effect of price changes on cardholder default
In a seminal contribution, Ausubel (1991) uses US bank-level survey data to find
that three-quarters of cardholders pay finance charges on their outstanding credit card
balance. This implies that there are a high proportion of high-risk cardholders in the
market. Given these results, he contends that credit card providers would be discouraged
from competing on price, given that a price cut would disproportionately attract
cardholders who intend to borrow, and hold an outstanding balance on their respective
cards. This group represents, in fact, those high-risk cardholders who are most likely to
default. As a consequence, high and sticky prices (APRs) prevail despite the large
numbers of competing card providers.
Drawing on Ausubel‟s insights, Stavins (1996) finds that if an average US issuer
bank raised its APR by a percentage point, average delinquent credit card loans (at least
30 days overdue) would decrease by $2.7 million, during the period 1990 to 1995. In
contrast, Park (1997) finds that delinquency rates are positively related to changes in
APRs for a sample of major credit card providers in US between 1991 and 1994. The
positive relationship suggests that credit card providers offering lower rates control
default risk more effectively. Stavins (2000) appears to support this conclusion using
US bank-level data for the period 1990 to 1999. She finds that banks that charged
higher APRs had higher delinquency rates. Calem and Mester (1995) use data from the
1989 Survey of Consumer Finances (SCF hereafter) to find that households with large
outstanding credit card balances (as an indicator of risk) are more likely to be denied or
be granted a lower-than-desired credit limit when applying for new cards with rival
providers. These households are likely to face higher switching costs, and consequently
search less intensely for new deals than counterparts with low levels of credit card
7
outstanding debt.6 Therefore, if a bank unilaterally lowers APR, it will attract
consumers that have low card balances and search most intensively. However, Agarwal
et al. (2010) find that consumers who responded to inferior solicitations (e.g., higher
APR offer) exhibit poorer credit quality characteristics and are significantly more likely
to default ex post than those responding to superior offer types. However, the authors
argue that these results are based on a sample of low-risk „prime‟ borrowers and then
the results can be considered as a minimal test of the importance of adverse selection in
the credit card market.
Gross and Souleles (2002) use account level data from a sample of credit card
providers in the US for 1995 to find that for every percentage point increase in APR,
outstanding credit card debt declines by an average of $110 per card. The authors
contend that since cardholders are in fact sensitive to prices, a higher APR leads to less
borrowing.
Determinants of Credit Card Prices
Outstanding credit card debt, consumer credit ratings, market power of
incumbents, and the non-price characteristics of credit cards have shown to be important
determinants of prices in the credit card literature (Scholnick et al. 2008).7 Calem et al.
(2006) use data from the 1998 and 2001 SCF to examine the extent to which APRs are
affected by cardholder credit risk (proxied by outstanding credit card debt along with a
pseudo FICO score computed for each respondent to the Survey).8 They find that a large
credit card balance along with a low credit score represents an impediment to
6 Switching costs result in cardholders becoming locked into a particular bank (Stango, 2000).
7 While much of the focus on the credit card pricing has been on the determinants of APRs, other work
analyses the determinants of credit card penalty fees such as late fees and over limit fees (Massoud et al.,
2011). The authors argue that banks that face greater default risks from borrowers (bank level risk of
credit card default as measured by the charge off ratio from each bank‟s balance sheet) will charge higher
penalty fees to compensate for this risk. 8 Agarwal et al. (2003) shows that consumer credit scores are highly predictive in determining credit card
default rates.
8
consumers successfully obtaining a low interest rate through search. Related research
uses accounting data from representative samples of US banks. Stango (2002) maintains
that credit card prices are positively related to the aggregate outstanding balances for the
issuer banks and its competitors, annual fees and market share of providers.9 Recent
evidence reveals that market power has a positive and statistically significant effect on
APRs in the Turkish credit card market (Akin et al., 2011). However, this finding does
not appear to hold for the US credit card market where the effect is positive but not
statistically significant (Massoud et al., 2011).
A small number studies consider simultaneously the extent to which cardholder
risk and credit card attributes determine APRs. Based on a US household telephone
survey during the period 1998 to 1999, Kim et al. (2005) investigate the extent to which
the risk of cardholders is reflected in credit card prices. The results suggest that
consumers with higher credit card balances are charged lower prices. This is attributed
to these consumers engaging in more intensive search for lower priced offerings. Amess
et al. (2010) explore the relationship between credit card APRs and differentiation
characteristics for a sample of UK credit card providers. The authors assume that credit
card providers use reward programs, card and network brands to cater for varied
customer preferences, and distinguish between consumers with differential default risk.
Low-risk consumers holding platinum cards pay lower rates than high-risk counterparts
issued with starter cards. Unfortunately, the authors are unable to capture the risk
characteristics of potential consumers (demand-side factors), and consequently can only
show that the issuer banks, and their respective card characteristics (supply side factors)
determine prices.
9 Outstanding balances for issuer banks and their competitors represent a measure of the issuer's own
customers' captivity, and the captivity of its competitors' customers, respectively.
9
The remainder of this paper builds on these aforementioned studies in three
respects. First, we employ IV estimation techniques (two-stage least squares) to deal
with potential bias due to reverse causality (endogeneity) between prices and their
determinants. Second, we include a more comprehensive range of cardholder risk
measures than used in previous studies. Since previous research has tended to focus on a
single measure of risk (i.e. outstanding credit card debt), our approach provides a unique
opportunity to assess the effects of different types of risk on prices in the credit card
industry. Third, we include both the supply and demand sides of the credit card market
in order to analyse the pricing decisions of issuer banks.
3. Data
We match data from two national representative surveys where the
characteristics of credit cards and the risk of potential cardholders are both close to the
US national averages. The Terms of Credit Card Plans (TCCP) Survey provides
comprehensive information on the characteristics of credit cards offered in the US states
where each bank operates.10
Banks offer credit cards at national (entire country),
regional (several states) or local level (a single state). Information on product attributes
allows us to classify cards into four categories, comprising credit cards: with reward
programs offered by a commercial bank; without reward programs offered by a
commercial bank; with reward programs offered by a non-commercial bank; and
without reward programs offered by a non-commercial bank.11
10
Appendix A provides a full list of banks included in our sample, while Appendix B explains the TCCP
Survey. 11
We follow the FDIC Bank classification in order to classify issuers as commercial and non-commercial
banks. Appendix A provides further detail. Reward programs typically offer rebates on purchases,
extension of manufactures warranty, discounts on the purchases of goods or services, purchase
protection/security plan, travel accident insurance, automobile rental insurance, credit card registration
services, and reduced introductory interest rates.
10
The 2008 and 2009 Federal Reserve Survey of Consumer Payment Choice
(SCPC) provides information regarding the risk of cardholders. The information
provided comprises: credit card outstanding debt, FICO score, and unpaid debt during
the previous 12 months.12
This survey also provides additional information that allows
us to classify cardholders into four categories (in a similar way to the previous
classification for credit card plans included in the TCCP Survey), comprising credit
cardholders who: are commercial bank clients with a reward card; are commercial bank
clients without a reward card; are non-commercial bank clients with a reward card; and
are non-commercial bank clients without a reward card. Following the 2008 and 2009
SCPC (questions PA006/PA007), we assume that a cardholder is a client of a
commercial bank if her primary checking account/saving account is at (i) large national
or international commercial bank or (ii) small local or regional commercial bank. If the
account is kept at a credit union, savings bank, internet bank or other financial
institution, we assume that the cardholder is a client of a non-commercial bank.
Appendix C presents national representative averages of the level of risk of cardholders
at US state-level for each of the four groups.13
This allows us to identify three additional
types of cardholders in terms of risk (using indicator variables) for each of the four
categories at state-level. Type I (sub-prime cardholders), which have a high outstanding
credit card debt (card debt is higher than 50th percentile of the sample distribution of
the outstanding credit card debt in each year) and a low FICO credit score (FICO score
is lower than the 50th percentile of the sample distribution of the FICO score in each
year). Type II cardholders have a high outstanding credit card debt (as defined
12
Further details related to the 2008/2009 SCPC are provided in Appendix B. 13
Tables C1 – C3 show sample corrected weighted average values (2008-2009) of different levels of risk
considered in our study. Missing values are reported when data is missing in the 2008 and 2009 SCPC.
All data was weighted to match national population estimates from the Current Population Survey (CPS),
sponsored jointly by the U.S. Census Bureau and the U.S. Bureau of Labor Statistics (BLS),
11
previously), while Type III cardholder have a low FICO credit score (as defined
previously).
The classification of cardholders into four groups (as defined above) allows us to
match the average risk of cardholders living in a particular US state to the terms and
conditions of the credit card offered by a given bank in the same state. In other words,
national credit cards are matched with national representative average values of
cardholder risk. Regional credit cards are matched with weighted average values of
cardholder risk in the states where the bank offers its credit card.14
State specific credit
cards are matched with representative average values of cardholder risk in the state the
card is offered.15
Our final data set contains price and non-price information on bank-
level credit card plans along with a set of indicators that capture quantitatively the risk
of the potential cardholders.
To control for local market power, we use issuer bank deposit market share
collected at the branch-level.16
In order to do so, we employ the FDIC Summary of
Deposits (SOD) which contains deposit data for branches and offices of all FDIC-
insured institutions. Each bank in the SOD is matched with the TCCP data by using a
bank unique identifier (RSSD ID) assigned by the Federal Deposit Insurance
Corporation (FDIC) which is made available in both data sources. We apply two
filtering rules to eliminate non-representative data. First, we exclude banks that have
missing values in any of our covariates in a given year. Second, the weighted average of
the outstanding credit debt has been winsorized at the top and bottom one per cent of
the distribution in order to avoid potential outliers. The final dataset comprises 575
14
Our weighted factor is the population of the states where each credit card is offered. 15
Matching at state-level is possible since the characteristics of both samples are very close, and the
surveys are nationally representative. Appendix B provides details of these surveys and the matching
procedure. 16
Unfortunately, the TCCP does not offer information about the total number of credit cards issued by a
specific bank.
12
observations and 182 credit card plans associated to a unique issuer bank. Tables 1 and
2 provide definitions and descriptive statistics of the main variables.
Panel A presents descriptive statistics for the supply side variables. The average
APR is 12.53 per cent (ranging from 4.25 per cent to 24.7 per cent). National and
regional credit cards account for approximately 43 per cent and 30 per cent of the
sample. The average grace period is approximately 24 days. Around 65 per cent of
credit card plans include a reward program. Approximately half of the credit card plans
include minimum finance charges while each card plan includes, on average, 2.4
additional credit card fees.17
Visa and MasterCard represent 70 per cent and 19 per cent
of the card plans in our sample, respectively. Gold and platinum cards represent 8 per
cent and 18 per cent of the sample, respectively. Average market share is close to one
per cent ranging from zero per cent to 15.51 per cent of the market. As a benchmark of
the market‟s interest rates, we include the average interest rates of CDs which are on
average 2.33 per cent, in our sample.18
Panel B presents the demand side variables related to the level of risk of
cardholders. The average outstanding credit card debt is $3380 dollars, and the average
FICO score is 4.04 points.19
We observe that 59 per cent of the cardholders included in
our sample have an episode of unpaid credit card debt during the past 12 months. In
terms of cardholder type, 18 per cent of our sample is characterized as Type I (low
FICO credit score and high outstanding debt), 41 per cent are Type II (high outstanding
card debt), and 47 per cent are Type III (low FICO credit score).20
17
These additional charges can include: annual fees, transaction fees for purchases, transaction fees for
cash advances, late payment fees. 18
This variable captures the effects of underlying macroeconomic conditions and how rapidly changes in
the market‟s interest rates pass-through into the APRs (Calem and Mester, 1995). 19
The FICO score is computed on a scale of 1 to 6. Details are provided in Appendix C, Table 2C. 20
Since each group could overlap with another group (they are not mutually exclusive), the aggregate
proportion of cardholders Type I, II and III is not necessarily 100 per cent.
13
Descriptive statistics presented in Table 3 show that APRs vary widely by credit
card type and by respective attributes of cards. Non-banks offering credit cards with
reward programs charge an average APR of 9.89 per cent, while credit cards tied to
Visa and MasterCard networks charge an average of 15.61 per cent. The grace period
(days) and fees linked to a specific plan are also related to the type of credit card. Fees
are particularly relevant since high risk consumers are likely to be attracted to lower
over the credit limit fees and minimum finance charges. A priori we would expect a
positive and statistically significant effect between fees and APRs, since a high risk
premium should be associated with high risk cardholders. Over the credit limit fees
range from $24.99 (cards offered by banks without reward programs) to $31.63 (offered
by other networks such as American Express or Diners Club). Minimum finance
charges and the number of other fees charged by providers also vary substantially across
credit card types.
The final column of Table 3 provides the percentage of credit cards which
include reward programs. Rewards programs can be used to create consumer lock-in
(Klemperer, 1995), differentiate products and restrict price competition. We observe
that reward programs are used extensively by banks. In particular, approximately 50 per
cent of credit card plans offered under the Visa and MasterCard brands include reward
programs, while 80 per cent of platinum cards include such enhancements.
4. Methods
We adopt a hedonic regression approach to capture the importance of card-
specific characteristics in determining the price of a specific credit card. The
specification of the empirical model is as follows:
14
demand attributes marketAPR x x x f Tit it it it i t it
(Equation 1)
APR is a vector of the most common interest rate charged by a specific credit
card i in year t.demanditx is a vector of covariates that control for cardholder risk
(comprising FICO score, card debt, episodes of unpaid debt in the previous year and a
combination of these indicators) living in the regions where the credit card i is offered.
attributesitx is a vector of card characteristics (such as regional coverage, type of credit
card provider, grace period, reward programs, fees, network brand, platinum, gold,
student, classic card., etc.). marketitx includes two control variables, comprising the one
year CD interest rate and the deposit market share of the bank offering credit card i. The
model also includes issuer fixed effects ( if ) to capture unobserved issuer
characteristics that are constant over time, a time dummy for technological change ( tT ),
and a constant term (which captures an interest rate mark-up). it is a stochastic error
term.
Equation 1 is estimated using two-stage least squares (2SLS). The choice of this
instrumental variable (IV) approach relies on the assumption that both over the credit
limit fees and minimum finances charges could be potentially endogenous due to
simultaneity bias.21
To test this hypothesis, we run the Durbin-Wu-Hausman (DWH)
test for each of our models under the null hypothesis that these variables are exogenous
(Davidson and MacKinnon, 1993). The derived test statistic rejects the null hypothesis
of exogeneity in all of the specifications, providing support for our IV approach. The
instrument set contains excluded instruments at bank level as follows: percentage of
21
Endogeneity bias due to reverse causality is unlikely to be an issue given that a change in the APRs are
unlikely to modify substantially the attributes of the credit card plans, the deposit market share of the
banks and the level of risk of their potential cardholders.
15
bank branches, average wages per employee, advertising expenditures and the amount
of gross charge-offs on loans and leases.22
For each of these instruments to be valid,
they must be: correlated with the endogenous variable; and uncorrelated with the error
terms (in this case, the unobserved differences in the most common APRs charged by a
particular bank). A Hansen/Sargan test of instrument validity is conducted, and the
rejection of the null hypothesis indicates the validity of the instrument set employed
(Cameron and Trivedi, 2005).
5. Results
We test for the importance of card characteristics and the level of risk of
potential cardholders where banks offer their respective cards in determining APRs.
Table 4 reports the regression results for Equation 1. Columns (1)–(6) present the
results from estimating six different models that utilise a different combinations of
covariates related to the risk of potential cardholders.23
The results presented in Models
(1), (2), and (3) include measures of risk (FICO score, unpaid credit card debt in the
previous 12 months and outstanding credit card debt), while the results for Models (4),
(5), and (6) employ three different indicator variables as an alternative way to capture
cardholder risk. Specifically Model (4) includes an indicator variable where cardholders
have a low FICO score and a high outstanding card debt (Type I); a separate indicator
variable is included in Model (5) where cardholders have a high outstanding card debt
(Type II). Model (6) includes an indicator variable for cardholders with a low FICO
score (Type III). We include both bank and year fixed effects in all models to control
22
These instruments are collected from Call Reports available at: https://cdr.ffiec.gov/public/. Each bank
is matched using a unique bank identifier (RSSD ID) assigned by the FDIC which is used as a bank
identifier in both data sources. The codes of the instruments are as follows: average wages per employee
(RIAD4135/RIAD4150), expenditures in advertisement (RIAD0497) and the amount of gross charge-offs
on loans and leases (RIAD4635). 23
This solves an important limitation of previous literature (for example, Amess et al. 2010).
16
for time-invariant factors specific to a bank as well as global shocks that influence all
banks in a similar fashion (unobserved heterogeneity).
Our results suggest that cardholders with a high FICO score pay a typical APR
that is 0.39 per cent (39 basis points) higher than cardholders with an average FICO
score (Model 1). This could be also explained by the fact that high-risk consumers
search more intensively for the best interest rates (shopping around) available in the
market. We also consider a second type of cardholders that have declared to have an
unpaid credit card debt during the past 12 months (Model 2). Our results show that this
group pays an average APR that is 1.91 per cent (191 basis points) higher than those
cardholders without any unpaid balance in previous 12 months. In this particular case, a
risk premium seems to be adequately attached to cardholder risk. Previous unpaid card
debt could also generate substantial switching costs to cardholders allowing banks to
use the whole payment history of cardholders as an effective tool to adjust prices to the
level of risk.
Outstanding credit card debt (which is often considered an accurate indicator of
cardholder risk) has no significant effect on APRs (Model 3).24
This suggests that this
measure of risk fails to capture the full extent of cardholder risk. Rather a measure
which considers simultaneously both outstanding credit card debt and other risk
indicators (such as credit score) should be taken into account when measuring
cardholder risk.
We proceed by considering three different types of cardholders (introduced in
Section 3). APRs charged to Type I cardholders (sub-prime) are 0.82 per cent (82 basis
points) lower than those charged to prime counterparts (Model 4). This result is
consistent with the idea that risky consumers shop around in order to find better credit
24
This finding contrast with the Calem and Mester (1995) result, which relies on SCF data to show that
cardholders with larger outstanding balances are more likely to shop around for better prices.
17
cards terms and, consequently, banks fail to achieve the benefits of a RBP strategy.25
Similar to previous results presented for Model 3, we do not find any statistically
significant effect for Type II cardholders (Model 5). However, we find that Type III
cardholders (with a FICO score lower that the median value) pay a typical APR that is
0.66 per cent (66 basis points) lower than cardholders with a FICO score that is higher
than the median value.
Of the other covariates, national credit cards have a rate that is between seven
and eight per cent (700 – 800 basis points) lower than their local counterparts. Banks
which offer credit cards nationally are likely to benefit from scale economies in
payment production which enables them to offer better rates to consumers. The higher
prices charged by banks offering credit cards locally could reflect localised market
power advantages, which enable these providers to charge consumers higher prices.
Credit cards that include reward programs charge a rate that is between 0.60 per
cent and 0.91 per cent lower than counterparts without reward programs.26
Our results
appear to conform to recent developments in the US card industry, where the intense
competition for clients has led banks to offer credit cards with low APRs and reward
programs, simultaneously. Minimum finance charges are passed on as higher APRs
charged to cardholders. This positive relationship suggests that bank providers employ
minimum finance charges as a tool to induce consumers to switch bank and then to
exploit them with high APRs.27
Cardholders are willing to pay a premium for being members of large established
network such as MasterCard/Visa and Discover compared to smaller networks such as
25
This result contrasts with previous research which fails to find evidence supporting the search cost
hypothesis (Berlin and Mester, 2004). 26
This contrasts with Amess et al. (2010) who find that reward programs are associated with higher APRs
in UK. 27
Minimum finance charges are mainly targeted at high-risk cardholders (Amess et al., 2010).
18
American Express and Diners Club.28
This is consistent with the idea that smaller
networks charge lower interest rates to compensate cardholders for the fact that fewer
merchants accept these cards.
Premium and gold cards charge APRs that are 3.83 per cent and 3.96 per cent
lower than classic credit card plans. This implies that a risk premium is attached to
classic cards, which are more likely to be used by higher risk consumers. Market share
is marginally significant in Model 1 showing a positive effect on the prices charged to
cardholders. This implies that an increase in the market share of banks is passed on to
cardholders as higher credit card rates. Finally, as would be expected, changes in market
interest rates (one year CD interest rates) pass-through to APRs charged to cardholders.
6. Final Remarks
Previous literature on credit card pricing has not explored how both demand and
supply sides of the payment card market explain risk-based pricing strategies. In this
paper, we devised a methodology that considers both sides of the industry
simultaneously in order to explore whether US banks offering credit cards have
implemented successful risk-based pricing strategies. We use survey data made recently
available, and an innovative matching procedure to study how card attributes and the
level of risk of cardholders affect APRs charged by issuer banks. The results of our
econometric analysis suggest that contrary to theoretical predictions, higher risk
consumers are charged lower rates on their credit cards. This suggests that either high
risk consumers search more intensively in order to access good deals, or that issuer
banks do not sort cardholders in terms of risk, or indeed both. A variety of non-price
characteristics are also important in determining prices charged to consumers.
28
Our results are similar to those reported by Amess et al. (2010). However, these must be interpreted
with caution since the coefficients for the Discover card were marginally statistically significant the 10
per cent level.
19
In the light of these findings, we believe that the results of our analysis suggest that
more effective risk-based pricing strategies are likely to reduce the misallocation of
resources in the credit card industry. As such the results of our analysis are of interest to
government agencies focused on consumer protection in the credit card industry. All in
all, the results point out the relevance of more in-depth research in this area, and the
need for high quality data sets on both the demand- and supply side of the industry.
20
References
Agarwal, S., Chomsisengphet, S., and Liu, C. (2010). The Importance of Adverse
Selection in the Credit Card Market: Evidence from Randomized Trials of
Credit Card Solicitations. Journal of Money, Credit and Banking, 42(4), 743-
754.
Agarwal, S., Liu, C., and Mielnicki, L. (2003). Exemption laws and consumer
delinquency and bankruptcy behavior: an empirical analysis of credit card data.
The Quarterly Review of Economics and Finance, 43(2), 273-289.
Akin, G. G., Aysan, A. F., Kara, G. I., and Yildiran, L. (2011). Nonprice competition in
the Turkish credit card market. Contemporary Economic Policy, 29(4), 593-604.
Amess, K., Drake, L., and Knight, H. (2010). An Empirical Analysis of UK Credit Card
Pricing. Review of Industrial Organization, 37(2), 101-117.
Ausubel, L. M. (1991). The failure of competition in the credit card market. American
Economic Review, 81(1), 50-81.
Bar-Gill, O. and Bubb, R., (2012). Credit Card Pricing: The CARD Act and Beyond.
NYU Law and Economics Research Paper No. 11-40.
Berlin, M., and Mester, L. J. (2004). Credit card rates and consumer search. Review of
Financial Economics, 13(1-2), 179-198.
Calem, P. S., Gordy, M. B., and Mester, L. J. (2006). Switching costs and adverse
selection in the market for credit cards: New evidence. Journal of Banking &
Finance, 30(6), 1653-1685.
Calem, P. S., and Mester, L. J. (1995). Consumer Behavior and the Stickiness of Credit-
Card Interest Rates. American Economic Review, 85(5), 1327-1336.
Cameron, A. C., and Trivedi, P. (2005). Microeconometrics: methods and applications:
Cambridge University Press.
21
Davidson, R. and MacKinnon, J. G. (1993). Estimation and Inference in Econometrics.
New York: Oxford University Press.
Federal Reserve Board (2011). Report to the Congress on the Profitability of Credit
Card Operations of Depository Institutions. Submitted to the Congress pursuant
to section 8 of the Fair Credit and Charge Card Disclosure Act of 1988.
Washington: Board of Governors of the Federal Reserve System.
Foster, K., Meijer, E., Schuh, S., and Zabek, M. A. (2010). The 2008 Survey of
Consumer Payment Choice. Boston Federal Reserve Public Policy Discussion
Paper Number 09-10.
Foster, K., Meijer, E., Schuh, S., and Zabek, M. A. (2011). The 2009 Survey of
Consumer Payment Choice. Boston Federal Reserve Public Policy Discussion
Paper Number 11-1.
Frank, J. (2009). Dodging Reform: As Some Credit Card Abuses Are Outlawed, New
Ones Proliferate. Durham, N.C: Center for Responsible Lending.
Frank, J. (2012). Predatory Credit Card Lending: Unsafe, Unsound for Consumers and
Companies. Durham, N.C: Center for Responsible Lending
GAO (2011). Credit cards: Consumer Costs for Debt Protection Products Can Be
Substantial Relative to Benefits but Are Not a Focus of Regulatory Oversight.
Washington: United States Government Accountability Office.
Getter, D. E. (2006). Consumer Credit Risk and Pricing. Journal of Consumer Affairs,
40 (1), 41-63.
Gerdes, G. R. (2008). Recent Payment Trends in the United States, Federal Reserve
Bulletin, 94, 75-106.
22
Gross, D. B., and Souleles, N. S. (2002). Do liquidity constraints and interest rates
matter for consumer behavior? Evidence from credit card data. Quarterly
Journal of Economics, 117(1), 149-185.
Joint Economic Committee (2009). Vicious Cycle: How unfair credit card practices are
squeezing consumers and undermining the recovery. Washington, D.C.: United
States Congress.
Kim, T., Dunn, L., and Mumy, G.E. (2005). Bank competition and consumer search
over credit card interest rates. Economic Enquiry, 43(2), 344-353.
Klemperer, P. (1995). Competition when Consumers have Switching Costs: An
Overview with Applications to Industrial Organization, Macroeconomics, and
International Trade. Review of Economic Studies, 62(4), 515-539.
Mann, R. (2007). Bankruptcy Reform and the ‘Sweat Box’ of Credit Card Debt. Illinois
Law Review. 375, 392-97.
Martin, A. (2009, May 19). Credit Card Industry Aims to Profit from Sterling Payers.
New York Times, p. A1
Massoud, N., Saunders, A., and Scholnick, B. (2011). The cost of being late? The case
of credit card penalty fees. Journal of Financial Stability, 7(2), 49-59.
Park, S. (1997). Effects of price competition in the credit card industry. Economics
Letters, 57(1), 79-85.
Prager, R., Manuszak, M., Kiser, E., and Borzekowski, R. (2009). Interchange Fees and
Payment Card Networks: Economics, Industry Developments, and Policy Issues.
Federal Reserve Finance and Economics Discussion Paper Series Number
2009–23.
Scholnick, B., Massoud, N., Saunders, A., Carbo-Valverde, S., and Rodríguez-
Fernández, F. (2008). The economics of credit cards, debit cards and ATMs: A
23
survey and some new evidence. Journal of Banking and Finance, 32(8), 1468-
1483.
Stango, V. (2000). Competition and Pricing in the Credit Card Market. The Review of
Economics and Statistics, 82(3), 499-508.
Stango, V. (2002). Pricing with Consumer Switching Costs: Evidence from the Credit
Card Market. Journal of Industrial Economics, 50(4), 475-92.
Stavins, J. (1996). Can demand elasticities explain sticky credit card rates? New
England Economic Review, 43-54.
Stavins, J. (2000). Credit card borrowing, delinquency, and personal bankruptcy. New
England Economic Review, 15-30.
Zywicki, T. J. (2005). An economic analysis of the consumer bankruptcy crisis.
Northwestern University Law Review, 99 (4), 1463-1541.
24
Table 1. Variable definitions
Variable Data Source Definition
Credit Card debt ($) Own
elaboration
based on the
2008 & 2009
Survey of
Consumer
Payment
Choice (SCPC)
Q. Last month, about how much was the unpaid balance on all your credit cards that
you carried over from the previous month? (thousands)
FICO Score Q. Please estimate your most recent credit rating, as measured by a FICO score: 1 (<
600), 2 (600-649), 3 (650-699), 4 (700-749), 5 (750-800) and 6 (> 800)
Unpaid credit card debt
Q. During the past 12 months, did you carry an unpaid balance on any credit card from
one month to the next (that is, you did not pay the balance in full at the end of the
month)? (1=yes and 0=no)
Cardholder Type I Own
elaboration
based on the
2008 & 2009
Survey of
Consumer
Payment
Choice (SCPC)
1 if consumer have both a credit card debt higher than the median value of the credit
card debt distribution AND a FICO score lower than the median value of the FICO
score distribution, and 0 otherwise. This variable varies per year.
Cardholder Type II 1 if consumer has a credit card debt higher than the median value of the credit card
debt distribution and 0 otherwise. This variable varies per year.
Cardholder Type III 1 if consumer has a FICO score lower than the median value of the FICO score
distribution, and 0 otherwise. This variable varies per year
APR
Terms of
Credit Card
Plans (TCCP)
Annual interest rate in credit card loans (percent)
National/Regional/local 1 if the credit card plan is marketed in all states/ some states / single state
Commercial bank 1 if the issuer bank is listed as a commercial bank by FDIC and 0 otherwise.
Grace period Grace period of credit card loans (days)
Reward programs
1 if the indicate credit card plan includes “free of charge” any of the following reward
programs: rebates on purchases, extension of manufacturer‟s warranty, purchase
protection/security plan, travel accident insurance, travel discounts, automobile rental
insurance, non-travel discounts,, credit card registration services, reduced introductory
interest rate available and other plan enhancements and 0 otherwise
Over the limit fee Over the credit limit fees charges (the fee imposed for exceeding a credit limit)
Minimum Finance
Charge
Minimum finance charge (the minimum or fixed finance charge that could be imposed
during a billing cycle).
Other fees Number of fees included in the credit card plan (Annual fees, transaction fees for
purchases, transaction fees for cash advances, late payment fees)
Visa®/
MasterCard®/Discover
®
Visa®/MasterCard
®/Discover
® credit card plan dummy variable
Platinum/Premium-Gold
card Platinum/ Premium-Gold credit card plan dummy variable
Certified of deposit 1 year Federal
Reserve 1 year CD interest rate (%)
Deposit Market share
(market share)
Summary of
Deposits
(SOD)
collected by
the FDIC
Average market share in terms of deposits per branch adjusted to consider the states
where bank offer their credit card plans (%).
25
Table 2. Summary of variables
Variables Mean Std. Dev. Min Max Observations
Panel A: supply side variables
(bank’s terms of credit card plans)
APR 12.53 3.60 4.25 24.7 575
National dummy 0.43 0.50 0 1 575
Regional dummy 0.30 0.46 0 1 575
Commercial bank 0.86 0.35 0 1 575
Grace period (days) 24.07 4.19 0 30 575
Reward program 0.65 0.48 0 1 575
Over the credit limit fee ($) 26.33 10.39 0 39 525
Minimum Finance charges 0.51 0.50 0 1 575
Other fees 2.46 0.93 0 4 575
Visa® 0.70 0.46 0 1 574
MasterCard® 0.19 0.40 0 1 574
Visa®/MasterCard® 0.05 0.22 0 1 574
Discover® 0.01 0.12 0 1 574
Platinum card 0.18 0.38 0 1 574
Premium/Gold 0.08 0.27 0 1 574
Market share of the issuer bank (%) 0.73 1.57 0 15.51 575
Average Certificate of Deposits 2.33 1.53 0.44 4.61 575
Panel B: demand side variables
(consumer’s financial profiles)
Credit Card debt (in thousands of dollars) 3.38 1.37 0.53 9.87 575
FICO Score 4.04 0.70 1 5.69 573
Unpaid credit card debt 0.59 0.16 0 1 575
Type I 0.18 0.39 0 1 575
Type II 0.41 0.49 0 1 575
Type III 0.47 0.50 0 1 575
26
Table 3. Typical terms and conditions of different credit card plans
(Mean values and standard deviation in parenthesis)
Credit card type APR (%) Grace Period
(days)
Fees
Reward programs
(YES=1/NO=0) Over the limit fee
($)
Minimum Finance
charges
(YES=1/NO=0)
Number of
other fees
Banks offering credit cards with rewards 12.36 (3.17) 24.07 (3.57) 26.94 (9.69) 0.55 (0.50) 2.54 (0.93)
Banks offering credit cards w/o rewards 13.83 (4.05) 24.24 (4.38) 24.99 (11.64) 0.40 (0.49) 2.46 (0.90)
Non-banks offering credit cards with
rewards 9.89 (2.65) 25.08 (1.84) 27.51 (9.44) 0.55 (0.50) 2.19 (0.94)
Non-banks offering credit cards w/o
rewards 11.60 (3.58) 21.33 (8.80) 25.19 (11.56) 0.57 (0.50) 2.13 (0.97)
Visa® 12.35 (3.59) 24.30 (3.49) 25.92 (10.20) 0.50 (0.50) 2.40 (0.91) 0.70 (0.46)
MasterCard® 12.41 (3.41) 23.93 (4.93) 26.87 (12.70) 0.55 (0.50) 2.42 (0.94) 0.50 (0.50)
Visa®/MasterCard
® 15.61 (3.14) 25.00 (0.00) 24.62 (5.60) 0.17 (0.38) 3.17 (0.85) 0.59 (0.50)
Discover® 14.81 (1.14) 12.50 (13.36) 25.00 (10.69) 1.00 (0.00) 2.25 (0.71) 0.50 (0.53)
Others (i.e. Amex or Diners Club) 11.82 (3.85) 23.63 (2.47) 31.63 (4.27) 0.56 (0.51) 2.70 (0.99) 0.63 (0.49)
Platinum cards 10.52 (2.72) 23.89 (2.53) 28.26 (10.17) 0.64 (0.48) 2.31 (0.97) 0.80 (0.40)
Premium/Gold cards 11.20 (3.82) 24.77 (2.33) 25.51 (11.44) 0.32 (0.47) 2.43 (0.93) 0.57 (0.50)
Classic cards 13.16 (3.56) 24.04 (4.63) 25.95 (10.32) 0.49 (0.50) 2.50 (0.92) 0.62 (0.49)
27
Table 4. Determinants of credit card prices (APR) 2007-2008
Instrumental variables (2SLS) regression
Model 1 Model 2 Model 3 Model 4 Model 5 Model 6
FICO Score 0.390** (0.157)
Unpaid credit card debt 1.907*** (0.482)
Credit Card debt ($) 0.010 (0.062)
Type I (Low FICO score & High card debt) -0.819*** (0.287)
Type II (High card debt) -0.109 (0.195)
Type III (Low FICO score) -0.659** (0.283)
National dummy(a) -7.745*** (0.675) -7.217*** (0.660) -7.934*** (0.713) -8.675*** (0.754) -7.847*** (0.737) -8.592*** (0.763)
Regional dummy(a) -0.561 (0.567) -0.004 (0.581) -0.904* (0.531) -0.805 (0.533) -0.803 (0.519) -0.899* (0.532)
Commercial bank 1.268 (1.631) 1.083 (1.630) 1.517 (1.548) 1.427 (1.579) 1.977 (1.454) 1.393 (1.608)
Grace period (days) 0.169 (0.116) 0.171 (0.117) 0.166 (0.116) 0.159 (0.117) 0.170 (0.119) 0.153 (0.118)
Reward program -0.815** (0.345) -0.420 (0.343) -0.602* (0.340) -0.394 (0.336) -0.598* (0.324) -0.912*** (0.343)
Over the credit limit fee 0.181 (0.256) 0.183 (0.252) 0.146 (0.243) 0.158 (0.247) 0.067 (0.223) 0.164 (0.252)
Minimum Finance charges 2.615*** (0.647) 2.299*** (0.639) 2.572*** (0.612) 2.529*** (0.573) 2.889*** (0.741) 2.598*** (0.619)
Other fees 0.117 (0.118) 0.145 (0.120) 0.113 (0.122) 0.094 (0.118) 0.127 (0.120) 0.103 (0.119)
Visa®(b) -0.925 (1.574) -0.867 (1.570) -1.197 (1.477) -1.506 (1.487) -1.696 (1.361) -1.445 (1.505)
MasterCard®(b) 0.057 (1.778) 0.025 (1.777) 0.152 (1.675) -0.258 (1.720) 0.615 (1.519) -0.300 (1.775)
Visa®/MasterCard®(b) 6.553** (3.182) 7.003** (3.188) 6.341** (3.062) 5.184* (3.083) 5.493* (2.863) 5.594* (3.099)
Discover®(b) 12.072* (6.856) 12.413* (6.784) 10.915* (6.501) 10.874* (6.608) 8.797 (6.018) 10.988 (6.710)
Platinum card(c) -1.817 (1.197) -1.847 (1.207) -1.835 (1.222) -1.770 (1.224) -1.786 (1.225) -1.697 (1.223)
Premium/Gold(c) -3.919*** (1.502) -3.832** (1.493) -3.889** (1.558) -3.867** (1.565) -3.960** (1.589) -3.858** (1.565)
Market share of the issuer bank (%) 0.701* (0.392) 0.149 (0.368) 0.428 (0.346) 0.580 (0.361) 0.588 (0.360) 0.428 (0.356)
1 year CD interest rate 0.247*** (0.067) 0.270*** (0.068) 0.219*** (0.067) 0.218*** (0.064) 0.207*** (0.059) 0.217*** (0.064)
Constant -1.683 (8.929) -2.052 (8.660) 1.558 (8.151) 2.328 (8.248) 3.973 (7.480) 2.615 (8.342)
Observations 466 466 466 466 466 466
Year and firm dummies YES YES YES YES YES YES
Robust score test.
Ho: variables are exogenous
8.60572
(p = 0.0135)
7.179
(p = 0.0276)
7.71933
(p = 0.0211)
7.03722
(p = 0.0296)
8.42571
(p = 0.0148)
7.61418
(p = 0.0222)
Test of over identifying restrictions.
Score chi2(2)
3.83505
(p = 0.1470)
4.70978
(p = 0.0949)
4.33757
(p = 0.1143)
4.31492
(p = 0.1156)
4.28907
(p = 0.1171)
4.19714
(p = 0.1226)
R-squared 0.901 0.904 0.903 0.904 0.902 0.903
Notes:
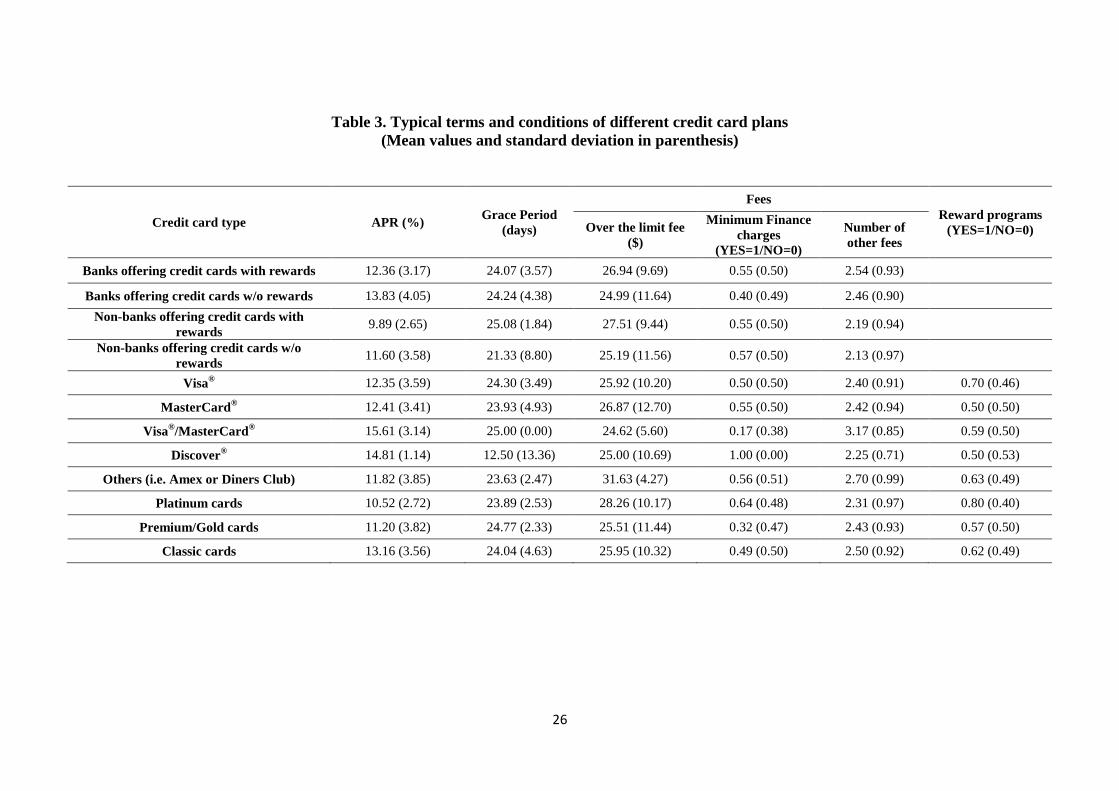
(1) *, **, *** indicate estimates statistically different from zero at the 0.10, 0.05, and 0.01 probability levels. (2) Empty cells occur when a particular variable is not included in a regression. (3)
Standard errors reported in parenthesis, they are robust to general forms of heteroscedasticity. (4) Type I comprises cardholders with both a high outstanding balance and a low FICO Score, Type
II comprises cardholders with a high outstanding balance and Type III comprises cardholders with a low FICO Score. (5) The omitted categories include (a) local banks, (b) other credit card
networks (American Express or Diners Club) and (c) Classic cards.
28
Appendix A. Sample of banks
Type of credit
card plan
Bank Class
(FDIC) Name of the bank
Headquarters’
area
NATIONAL NM 1st Summit Bank Pennsylvania
NATIONAL NM 5Star Bank Colorado
NATIONAL NM Amalgamated Bank of Chicago Illinois
LOCAL N Amegy Bank National Association Texas
NATIONAL SA American Express Bank, FSB. Utah
NATIONAL NM American Express Centurion Bank Utah
LOCAL NM American State Bank Texas
NATIONAL SA Ameriprise Bank, FSB Minnesota
NATIONAL N ANB Financial National Association Arkansas
NATIONAL NM Appalachian Community Bank Georgia
REGIONAL SM Arvest Bank Arkansas
NATIONAL NM Banamex USA California
REGIONAL NM Banamex USA California
REGIONAL SM Banco Popular North America New York
REGIONAL NM BancorpSouth Bank Mississippi
REGIONAL N Bank Midwest, National Association Missouri
NATIONAL NM Bank of Louisiana Louisiana
LOCAL N Banker's Bank of Kansas, National Association Kansas
REGIONAL N Banker's Bank of Kansas, National Association Kansas
REGIONAL NM Banner Bank Washington
LOCAL NM Bar Harbor Bank & Trust Maine
NATIONAL NM Barclays Bank Delaware Delaware
REGIONAL SA BB&T Financial, FSB Georgia
NATIONAL NM BMW Bank of North America Utah
REGIONAL NM Branch Banking and Trust Company North Carolina
NATIONAL N Capital One Bank (USA), National Association Virginia
LOCAL NM Central Bank & Trust Co. Kentucky
REGIONAL SM Centura Card Bank Georgia
NATIONAL N Citibank (South Dakota), N.A. South Dakota
LOCAL NM Citizens First Bank Florida
REGIONAL N City National Bank California
NATIONAL NM CNB Bank Pennsylvania
REGIONAL NM Columbia River Bank Oregon
REGIONAL N Commerce Bank, National Association Pennsylvania
REGIONAL N Commerce Bank, National Association Nebraska
LOCAL SM Community Bank & Trust Company Pennsylvania
LOCAL NM Community First Bank Arkansas
REGIONAL SM Compass Bank Alabama
REGIONAL NM Coppermark Bank Oklahoma
LOCAL NM CoreFirst Bank & Trust Kansas
REGIONAL NM CoreFirst Bank & Trust Kansas
NATIONAL N Credit One Bank, National Association Nevada
NATIONAL N Chase Bank USA, National Association Delaware
LOCAL SM Chemung Canal Trust Company New York
29
NATIONAL NM D. L. Evans Bank Idaho
REGIONAL N Delaware National Bank Delaware
NATIONAL NM Discover Bank Delaware
REGIONAL SA Dollar Bank, Federal Savings Bank Pennsylvania
LOCAL SA Fairfield Federal Savings and Loan Association of
Lancaster Ohio
LOCAL NM Farmers State Bank Iowa
NATIONAL N FIA Card Services, National Association Delaware
REGIONAL SM Fifth Third Bank Ohio
LOCAL NM First Bank & Trust East Texas Texas
REGIONAL NM First Citizens Bank and Trust Company, Inc. South Carolina
NATIONAL SA First Command Bank Texas
LOCAL NM First Commercial Bank Alabama
NATIONAL SM First Community Bank New Mexico
LOCAL SB First County Bank Connecticut
NATIONAL SA First Federal Savings and Loan Association of
Charleston South Carolina
REGIONAL N First Financial Bank, National Association Ohio
REGIONAL N First Financial Bank, National Association Indiana
REGIONAL SM First Interstate Bank Montana
NATIONAL N First National Bank South Dakota
LOCAL N First National Bank Texas
LOCAL N First National Bank Alaska Alaska
NATIONAL N First National Bank of Omaha Nebraska
REGIONAL N First National Bank of St. Louis Missouri
NATIONAL N First National Bank of the Mid-Cities Texas
LOCAL NM First Security Bank Arkansas
LOCAL NM First State Bank New Mexico
REGIONAL N First Tennessee Bank, National Association Tennessee
REGIONAL SM FirstBank Colorado
REGIONAL NM First-Citizens Bank & Trust Company North Carolina
LOCAL N First-Knox National Bank Ohio
REGIONAL N Firstmerit Bank, National Association Ohio
LOCAL N FNB Bank, National Association Pennsylvania
LOCAL NM FNBT.COM BANK Florida
NATIONAL SA Franklin Templeton Bank and Trust, F.S.B. Utah
NATIONAL SA GE Money Bank Utah
LOCAL N Greenville National Bank Ohio
LOCAL NM Hawthorn Bank Missouri
LOCAL SM Heartland Bank Ohio
LOCAL NM Hills Bank and Trust Company Iowa
LOCAL SA Home Federal Bank of Tennessee Tennessee
NATIONAL SM HSBC Bank USA New York
LOCAL NM Huntington State Bank Texas
NATIONAL NM Idaho Independent Bank Idaho
NATIONAL N InfiBank, National Association Nebraska
NATIONAL N Intrust Bank, National Association Kansas
REGIONAL SA IronStone Bank Florida
NATIONAL SM Johnson Bank Wisconsin
LOCAL NM Kentucky Bank Kentucky
30
LOCAL SM Lafayette Ambassador Bank Pennsylvania
NATIONAL NM Liberty Bank and Trust Company Louisiana
NATIONAL N Los Alamos National Bank New Mexico
REGIONAL SA M & I Bank FSB Nevada
LOCAL N MERCANTIL COMMERCEBANK, NATIONAL
ASSOCIATION Florida
LOCAL SA Mercer Savings Bank Ohio
NATIONAL NM Merrick Bank Utah
REGIONAL SA MFB Financial (The "Savings Bank") Indiana
NATIONAL SM Morton Community Bank Illinois
REGIONAL N National City Bank Ohio
NATIONAL SA Nationwide Bank Ohio
NATIONAL NM New Millennium Bank New Jersey
LOCAL NM NewBridge Bank North Carolina
LOCAL N Newfield National Bank New Jersey
NATIONAL SA Nordstrom fsb Arizona
REGIONAL SB Northwest Savings Bank Pennsylvania
NATIONAL NM Oak Hill Banks Ohio
LOCAL NM Palos Bank and Trust Company Illinois
NATIONAL NM Penn Security Bank and Trust Company Pennsylvania
LOCAL SA Peoples First Community Bank Florida
REGIONAL NM Pinnacle Bank Nebraska
REGIONAL NM Plains Commerce Bank South Dakota
NATIONAL SA Pocahontas Federal Savings and Loan Association Arkansas
REGIONAL SM Quad City Bank and Trust Company Illinois
NATIONAL SB Rainier Pacific Bank Washington
REGIONAL SM RBC Bank (USA) North Carolina
NATIONAL N RBS Citizens, National Association Rhode Island
LOCAL NM Republic Bank & Trust Company Kentucky
LOCAL NM S&T Bank Pennsylvania
NATIONAL N Silverton Bank, National Association Georgia
NATIONAL N Simmons First National Bank Arkansas
LOCAL SM Solvay Bank New York
LOCAL NM State Bank of Cross Plains Wisconsin
NATIONAL SA State Farm Bank, F.S.B. Illinois
NATIONAL N Sunflower Bank, National Association Kansas
REGIONAL SM SunTrust Bank Georgia
NATIONAL NM Synovus Bank Georgia
NATIONAL N TCM Bank, National Association Florida
NATIONAL N TD Bank, National Association Delaware
LOCAL NM Texas Bank and Trust Company Texas
LOCAL SM The Adirondack Trust Company New York
LOCAL NM The Bank New Jersey
LOCAL SB The Bank of Canton Massachusetts
REGIONAL NM The Bank of Kentucky, Inc. Kentucky
LOCAL SA The Bank of Maine Maine
REGIONAL N The Boone County National Bank of Columbia Missouri
REGIONAL NM The Central Trust Bank Missouri
LOCAL N The City National Bank of Taylor Texas
31
LOCAL NM The Delaware County Bank and Trust Company Ohio
NATIONAL NM The Farmers & Merchants State Bank Ohio
REGIONAL NM The Fidelity Bank North Carolina
LOCAL N The First National Bank of Fairfield Montana
NATIONAL N The First National Bank of Ipswich Massachusetts
LOCAL N The First National Bank of Litchfield Connecticut
NATIONAL N The National Bank of Blacksburg Virginia
LOCAL N The National Grand Bank of Marblehead Massachusetts
REGIONAL SM The North Side Bank and Trust Company Ohio
REGIONAL NM The Ohio Valley Bank Company Ohio
LOCAL NM The Park Bank Wisconsin
LOCAL N The Park National Bank Ohio
NATIONAL N The Randolph National Bank Vermont
LOCAL NM The Richland Trust Company Ohio
REGIONAL N The Rockport National Bank Massachusetts
LOCAL N The Security National Bank and Trust Co. Ohio
LOCAL N The Vinton County National Bank of McArthur Ohio
NATIONAL SM TIB The Independent Bankersbank Texas
NATIONAL N Town North Bank Nevada, National Association Nevada
NATIONAL NM Toyota Financial Savings Bank Nevada
REGIONAL N Trustmark National Bank Mississippi
REGIONAL N U.S. Bank National Association ND North Dakota
NATIONAL N UMB Bank, National Association Missouri
REGIONAL NM Union Bank and Trust Company Nebraska
REGIONAL SM United Bank West Virginia
LOCAL N Univest National Bank and Trust Co. Pennsylvania
NATIONAL NM USAA Savings Bank Nevada
NATIONAL N Wachovia Bank, National Association North Carolina
LOCAL NM Wallis State Bank Texas
NATIONAL SA Washington Mutual Bank California
NATIONAL SM Wayne Bank and Trust Co. Indiana
NATIONAL N Wells Fargo Bank, National Association South Dakota
REGIONAL NM Wells Fargo Financial Bank South Dakota
NATIONAL N Wells Fargo Financial National Bank Nevada
LOCAL NM West Suburban Bank Illinois
REGIONAL N Whitney National Bank Louisiana
NATIONAL SM Wilmington Trust Company Delaware
NATIONAL N World Financial Network National Bank Delaware
NATIONAL NM World's Foremost Bank Nebraska
NATIONAL NM York State Bank Nebraska
REGIONAL N Zions First National Bank Utah
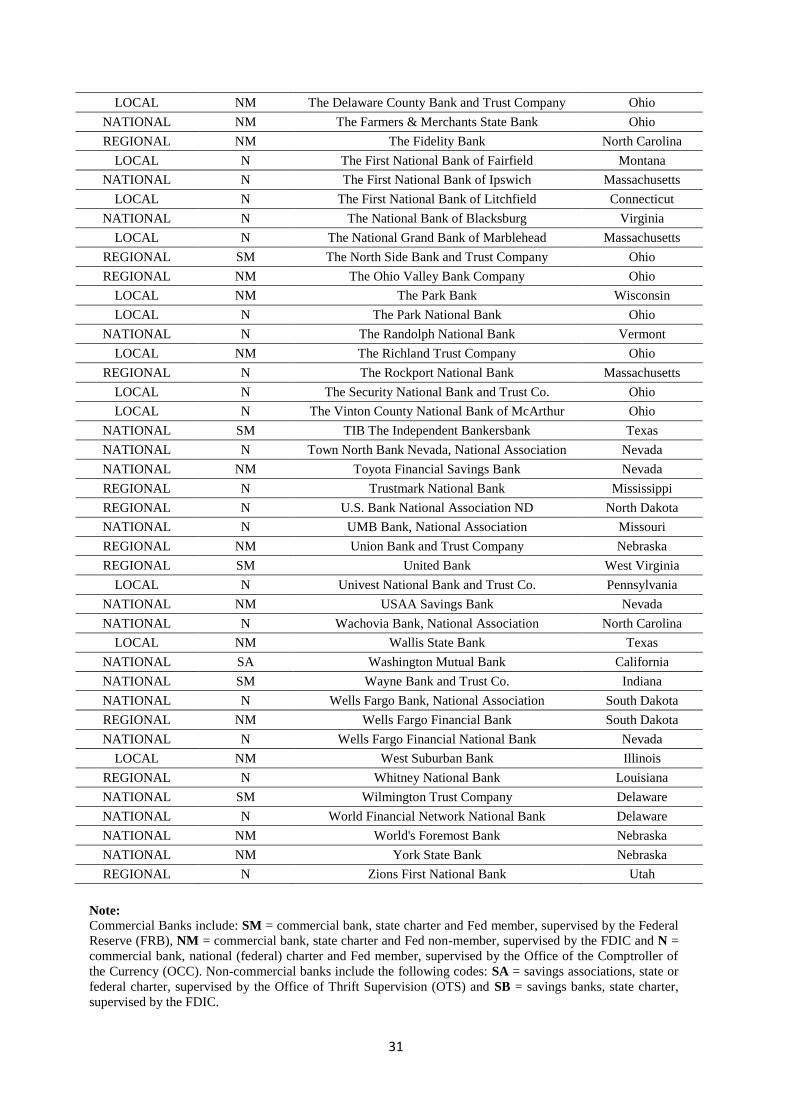
Note:
Commercial Banks include: SM = commercial bank, state charter and Fed member, supervised by the Federal
Reserve (FRB), NM = commercial bank, state charter and Fed non-member, supervised by the FDIC and N =
commercial bank, national (federal) charter and Fed member, supervised by the Office of the Comptroller of
the Currency (OCC). Non-commercial banks include the following codes: SA = savings associations, state or
federal charter, supervised by the Office of Thrift Supervision (OTS) and SB = savings banks, state charter,
supervised by the FDIC.
32
Appendix B: Methodology used to build the demand and supply variables
In this Appendix, we discuss the various data sources used to build both demand
(cardholder‟s sources of risk) and supply (credit card terms and conditions) variables
needed to carry out our empirical estimations. We also explain the methodology used to
match each bank‟s credit card plan (supply side) with the risk profile of the cardholders
located in the markets where the credit cards are offered (demand side).
Supply side variables
For data related to supply of credit cards, we use the twice yearly Terms of
Credit Card Plans (TCCP) Survey undertaken by the U.S. Federal Reserve Bank. Since
demand data is only available for 2008 and 2009, we limit our sample to these years.
Each bank surveyed reports specific details of its most popular credit card plans.29
Appendix A provides a list of the banks surveyed. Credit cards vary across providers
(banks and non-banks), reward enhancements (reward and non-reward cards) and
location (US States). For each bank in the TCCP, we know specifically which of the
various U.S. states where the credit card plan is advertised and issued for each bank.
Credit card plans in our database can be issued on a nationwide (all 50 states and the
District of Columbia), regional (more than one state), or state-specific basis. Each
category is mutually exclusive; so each bank matches with only one category. In order
to guarantee that each bank is associated with a unique card plan, we follow the next
criteria: if the card plan is offered nationally, but with different terms in a few states, we
only consider the „most common terms‟ reported by the bank; if identical terms are
offered regionally, we take average values across all states in which the plan is
29
This refers to the plans that have the largest number of cards outstanding and that was available to new
cardholders as of the report date.
33
marketed while if the card is regional but with different terms in a few states, we
consider the „most common terms‟ reported by the bank. Finally, if the plan is offered
only in one state, we consider the terms applied by the bank in the specific state.30
Demand side variables
We use both the 2008 and 2009 Survey of Consumer Payment Choice (SCPC) as
a primary data source of our demand side variables. The SCPC is a nationally
representative survey data on consumer payment choices in the U.S. (Foster et al.,
2011). It is conducted online to a random sample of more than 2.000 consumers by the
RAND Corporation as a module of the American Life Panel (ALP). The survey
contains detailed information about the state of residence of credit cardholders and risk
measures such as outstanding card debt, unpaid debt information, FICO score along
with the primary financial institution of the cardholders (bank or non-bank institutions)
and information on reward programs linked to the cardholder‟s credit card. We employ
this data to compute state-level average level of risk of credit cardholders according to
the next criteria: if a cardholder has or does not have a reward programs associated to
their credit cards along with if the cardholder has or does not have a commercial bank as
her primary financial institution. 31
Tables C1 to C3 show the average values (2008-2009) across U.S. states of the
main financial characteristics considered in our study.32
All data are weighted to match
national population estimates from the Census Bureau‟s Current Population Survey.
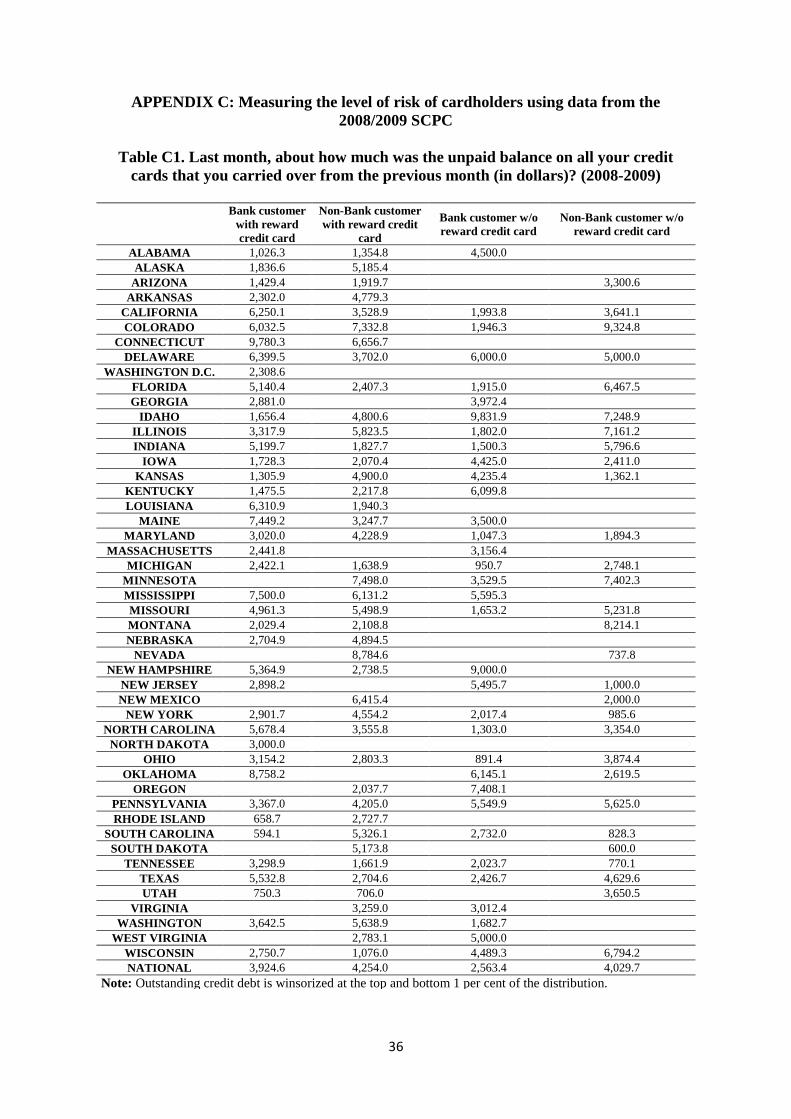
Table C1 shows a considerable state-level variation in the unpaid debt of credit
30
We weight continuous variables by the branches of the bank in these states. 31
It should be noted that we restrict our analysis to consumers whom have adopted a credit card(s) and
have a positive outstanding balance in their card (revolving cardholders) since it is expected that they are
more responsive to changes in credit card plans. Because the interest rate is only relevant to those who
borrow on their credit card, respondents were filtered to include only credit card users who carry a
balance. 32
Missing values in Tables 1 to 4 are due to there is no state-level available data for cardholders who
meet these criteria in both the 2008 and 2009 SCPC.
34
cardholders. The credit card debt of bank cardholders is much lower than non-bank
cardholders. Unpaid debt is higher for reward receivers than non-reward receivers.
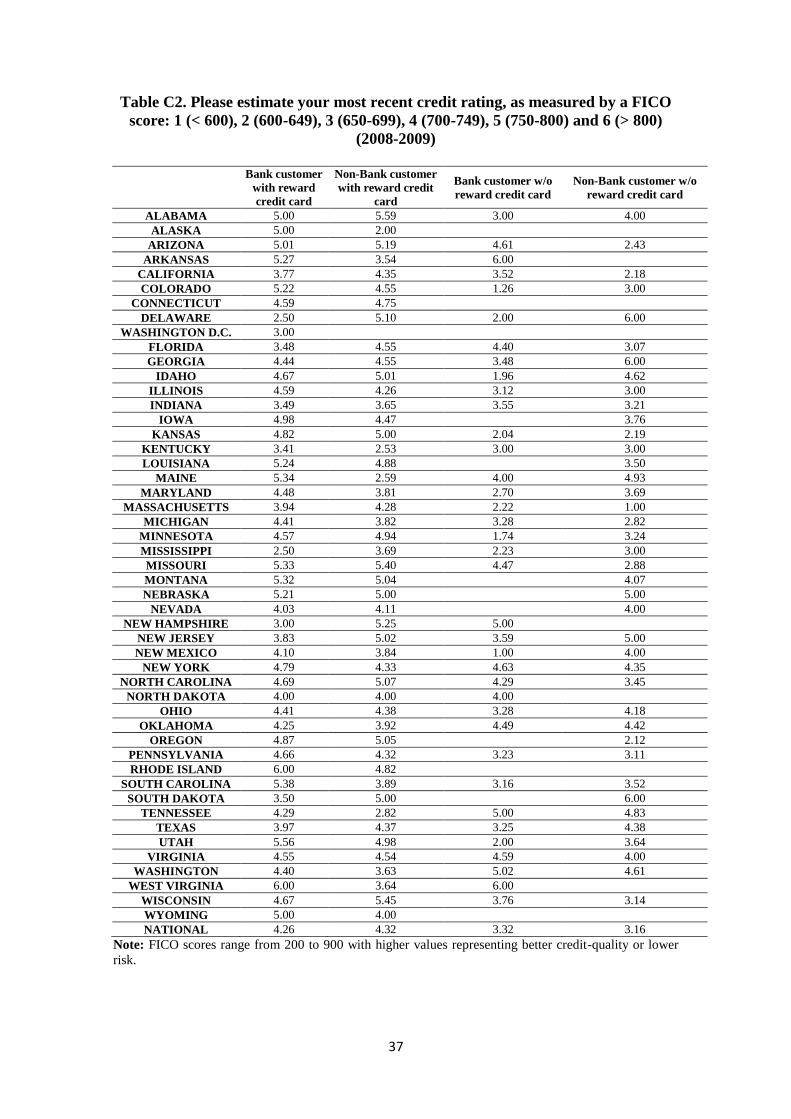
Table C2 completes this picture and provides self-reported FICO scores, ranging from 1
(<600 points) to 5 (>800 points), of the cardholders surveyed. There is substantial
variation in FICO scores across states and between consumers holding cards with
associated reward programs. Table C3 shows that, on average, the U.S. cardholders
have carried an unpaid balance on any credit card from one month to the next during the
previous 12 months. More precisely, the last row of Table C3 (national weighted
average) shows that more than 50 per cent of the cardholders in our sample have carried
an unpaid balance on any credit card from one month to the next during the previous 12
months.
Matching demand, supply and market variables
As shown in Section 3, our database contains both demand and supply side
information for the period 2008 to 2009. From the demand side, we can observe if the
cardholder is or is not a client of a commercial bank and has or does not have reward
programs associated with their credit cards. From the supply side, we can observe
whether each credit card plan is or is not marketed by a commercial bank, and if the
plan offers or does not offer reward programs. By using this information, we are able to
match each bank‟s credit card plan with the level of risk of their most likely credit
cardholder living in the regions where each bank offers its card plans. Nationally
marketed credit cards plans have been matched with national average values of the
cardholder‟s level of risk extracted from the 2008/2009 SCPC (see Tables C1-C3).
Regional card plans are matched with the weighted average value of the cardholder‟s
level of risk in the regions where the bank operates while if the card plan is offered in
35
only a single US state, we impute the cardholder‟s level of risk in this particular US
state to the card plan marketed in the same US state. 33
33
Our weighted factor is the population of the states where each credit card is offered.
36
APPENDIX C: Measuring the level of risk of cardholders using data from the
2008/2009 SCPC
Table C1. Last month, about how much was the unpaid balance on all your credit
cards that you carried over from the previous month (in dollars)? (2008-2009)
Bank customer
with reward
credit card
Non-Bank customer
with reward credit
card
Bank customer w/o
reward credit card
Non-Bank customer w/o
reward credit card
ALABAMA 1,026.3 1,354.8 4,500.0
ALASKA 1,836.6 5,185.4
ARIZONA 1,429.4 1,919.7 3,300.6
ARKANSAS 2,302.0 4,779.3
CALIFORNIA 6,250.1 3,528.9 1,993.8 3,641.1
COLORADO 6,032.5 7,332.8 1,946.3 9,324.8
CONNECTICUT 9,780.3 6,656.7
DELAWARE 6,399.5 3,702.0 6,000.0 5,000.0
WASHINGTON D.C. 2,308.6
FLORIDA 5,140.4 2,407.3 1,915.0 6,467.5
GEORGIA 2,881.0 3,972.4
IDAHO 1,656.4 4,800.6 9,831.9 7,248.9
ILLINOIS 3,317.9 5,823.5 1,802.0 7,161.2
INDIANA 5,199.7 1,827.7 1,500.3 5,796.6
IOWA 1,728.3 2,070.4 4,425.0 2,411.0
KANSAS 1,305.9 4,900.0 4,235.4 1,362.1
KENTUCKY 1,475.5 2,217.8 6,099.8
LOUISIANA 6,310.9 1,940.3
MAINE 7,449.2 3,247.7 3,500.0
MARYLAND 3,020.0 4,228.9 1,047.3 1,894.3
MASSACHUSETTS 2,441.8 3,156.4
MICHIGAN 2,422.1 1,638.9 950.7 2,748.1
MINNESOTA 7,498.0 3,529.5 7,402.3
MISSISSIPPI 7,500.0 6,131.2 5,595.3
MISSOURI 4,961.3 5,498.9 1,653.2 5,231.8
MONTANA 2,029.4 2,108.8 8,214.1
NEBRASKA 2,704.9 4,894.5
NEVADA 8,784.6 737.8
NEW HAMPSHIRE 5,364.9 2,738.5 9,000.0
NEW JERSEY 2,898.2 5,495.7 1,000.0
NEW MEXICO 6,415.4 2,000.0
NEW YORK 2,901.7 4,554.2 2,017.4 985.6
NORTH CAROLINA 5,678.4 3,555.8 1,303.0 3,354.0
NORTH DAKOTA 3,000.0
OHIO 3,154.2 2,803.3 891.4 3,874.4
OKLAHOMA 8,758.2 6,145.1 2,619.5
OREGON 2,037.7 7,408.1
PENNSYLVANIA 3,367.0 4,205.0 5,549.9 5,625.0
RHODE ISLAND 658.7 2,727.7
SOUTH CAROLINA 594.1 5,326.1 2,732.0 828.3
SOUTH DAKOTA 5,173.8 600.0
TENNESSEE 3,298.9 1,661.9 2,023.7 770.1
TEXAS 5,532.8 2,704.6 2,426.7 4,629.6
UTAH 750.3 706.0 3,650.5
VIRGINIA 3,259.0 3,012.4
WASHINGTON 3,642.5 5,638.9 1,682.7
WEST VIRGINIA 2,783.1 5,000.0
WISCONSIN 2,750.7 1,076.0 4,489.3 6,794.2
NATIONAL 3,924.6 4,254.0 2,563.4 4,029.7
Note: Outstanding credit debt is winsorized at the top and bottom 1 per cent of the distribution.
37
Table C2. Please estimate your most recent credit rating, as measured by a FICO
score: 1 (< 600), 2 (600-649), 3 (650-699), 4 (700-749), 5 (750-800) and 6 (> 800)
(2008-2009)
Bank customer
with reward
credit card
Non-Bank customer
with reward credit
card
Bank customer w/o
reward credit card
Non-Bank customer w/o
reward credit card
ALABAMA 5.00 5.59 3.00 4.00
ALASKA 5.00 2.00
ARIZONA 5.01 5.19 4.61 2.43
ARKANSAS 5.27 3.54 6.00
CALIFORNIA 3.77 4.35 3.52 2.18
COLORADO 5.22 4.55 1.26 3.00
CONNECTICUT 4.59 4.75
DELAWARE 2.50 5.10 2.00 6.00
WASHINGTON D.C. 3.00
FLORIDA 3.48 4.55 4.40 3.07
GEORGIA 4.44 4.55 3.48 6.00
IDAHO 4.67 5.01 1.96 4.62
ILLINOIS 4.59 4.26 3.12 3.00
INDIANA 3.49 3.65 3.55 3.21
IOWA 4.98 4.47 3.76
KANSAS 4.82 5.00 2.04 2.19
KENTUCKY 3.41 2.53 3.00 3.00
LOUISIANA 5.24 4.88 3.50
MAINE 5.34 2.59 4.00 4.93
MARYLAND 4.48 3.81 2.70 3.69
MASSACHUSETTS 3.94 4.28 2.22 1.00
MICHIGAN 4.41 3.82 3.28 2.82
MINNESOTA 4.57 4.94 1.74 3.24
MISSISSIPPI 2.50 3.69 2.23 3.00
MISSOURI 5.33 5.40 4.47 2.88
MONTANA 5.32 5.04 4.07
NEBRASKA 5.21 5.00 5.00
NEVADA 4.03 4.11 4.00
NEW HAMPSHIRE 3.00 5.25 5.00
NEW JERSEY 3.83 5.02 3.59 5.00
NEW MEXICO 4.10 3.84 1.00 4.00
NEW YORK 4.79 4.33 4.63 4.35
NORTH CAROLINA 4.69 5.07 4.29 3.45
NORTH DAKOTA 4.00 4.00 4.00
OHIO 4.41 4.38 3.28 4.18
OKLAHOMA 4.25 3.92 4.49 4.42
OREGON 4.87 5.05 2.12
PENNSYLVANIA 4.66 4.32 3.23 3.11
RHODE ISLAND 6.00 4.82
SOUTH CAROLINA 5.38 3.89 3.16 3.52
SOUTH DAKOTA 3.50 5.00 6.00
TENNESSEE 4.29 2.82 5.00 4.83
TEXAS 3.97 4.37 3.25 4.38
UTAH 5.56 4.98 2.00 3.64
VIRGINIA 4.55 4.54 4.59 4.00
WASHINGTON 4.40 3.63 5.02 4.61
WEST VIRGINIA 6.00 3.64 6.00
WISCONSIN 4.67 5.45 3.76 3.14
WYOMING 5.00 4.00
NATIONAL 4.26 4.32 3.32 3.16
Note: FICO scores range from 200 to 900 with higher values representing better credit-quality or lower
risk.
38
Table C3. During the past 12 months, did you carry an unpaid balance on any
credit card from one month to the next (that is, you did not pay the balance in full
at the end of the month)? (1=YES & 0=NO) (2008-2009)
Bank customer
with reward
credit card
Non-Bank customer
with reward credit
card
Bank customer
w/o reward credit
card
Non-Bank customer
w/o reward credit
card
ALABAMA 0.48 0.23 1.00 1.00
ALASKA 0.52 1.00
ARIZONA 0.43 0.62 0.36 0.83
ARKANSAS 0.46 0.81
CALIFORNIA 0.62 0.56 0.65 0.36
COLORADO 0.15 0.55 1.00 1.00
CONNECTICUT 0.54 0.27
DELAWARE 0.45 0.45 1.00 1.00
WASHINGTON D.C. 0.16
FLORIDA 0.72 0.66 0.87 0.90
GEORGIA 0.54 0.65 0.73
IDAHO 0.88 0.42 0.32 0.64
ILLINOIS 0.43 0.75 0.90 0.92
INDIANA 0.67 0.59 1.00 0.86
IOWA 0.35 0.26 1.00 0.72
KANSAS 0.87 0.50 0.53 1.00
KENTUCKY 0.59 0.73 0.64 1.00
LOUISIANA 0.69 0.71 1.00
MAINE 1.00 0.93 1.00 0.84
MARYLAND 0.66 0.48 0.92 0.60
MASSACHUSETTS 0.26 0.46 0.43 1.00
MICHIGAN 0.41 0.30 0.13 0.68
MINNESOTA 0.76 0.42 0.46 0.72
MISSISSIPPI 1.00 0.81 1.00 1.00
MISSOURI 0.57 0.40 1.00 1.00
MONTANA 0.34 0.50 0.78
NEBRASKA 0.59 0.33 1.00
NEVADA 1.00 0.69 0.11
NEW HAMPSHIRE 0.34 0.17 1.00 0.41
NEW JERSEY 0.49 0.57 0.92 0.50
NEW MEXICO 0.40 0.74 1.00
NEW YORK 0.49 0.50 0.68 0.59
NORTH CAROLINA 0.73 0.45 0.51 0.97
NORTH DAKOTA 1.00
OHIO 0.57 0.45 0.30 0.91
OKLAHOMA 0.94 0.43 0.50 0.83
OREGON 0.14 0.17 1.00 0.25
PENNSYLVANIA 0.60 0.55 0.83 0.87
RHODE ISLAND 0.46 1.00
SOUTH CAROLINA 0.63 0.90 1.00 0.62
SOUTH DAKOTA 1.00 0.92 1.00
TENNESSEE 0.38 0.49 0.87 0.72
TEXAS 0.67 0.39 0.54 0.43
UTAH 0.12 0.15 0.00 0.86
VIRGINIA 0.62 0.42 1.00 0.50
WASHINGTON 0.50 0.51 0.90 0.56
WEST VIRGINIA 0.62 0.36 0.50 1.00
WISCONSIN 0.55 0.30 0.97 1.00
NATIONAL 0.57 0.51 0.59 0.73