Page 1
i
Risk-based shutdown
inspection and maintenance
for a processing facility
By
Abdul Hameed
A thesis submitted to the School of Graduate Studies
in partial fulfillment of the requirements for the degree of
Doctor of Philosophy
Faculty of Engineering and Applied Science
Memorial University of Newfoundland
October - 2016
St. John’s, Newfoundland
Page 2
ii
Abstract
In this research, a risk-based shutdown inspection and maintenance interval
optimization for a processing facility is proposed. Often inspection and maintenance
activities can’t be performed until the processing unit or plant is taken into a non-operational
state, generally known as “shutdown”. Extensive work on inspection and maintenance
interval estimation modeling is available in the concerned literature however, no to very
limited application on shutdown inspection and maintenance modeling is observed for a
continuous operating facility. Majority of the published literature deals to optimize individual
equipment inspection and maintenance interval without considering the overall impact of
plant unavailability due to shutdown. They all deal to optimize individual equipment
inspection and maintenance interval considering cost, risk, availability and reliability. The
efforts towards finding an optimal inspection and maintenance interval is not considered in
these studies especially when it requires unit or plant to be in shutdown state from an
operational state for performing inspection and maintenance. This topic is selected to bridge
the existing gap in the available literature and to provide a means to develop a methodology
to estimate the shutdown inspection and maintenance interval for a continuous processing
unit or plant, rather an inspection and maintenance interval for each piece of equipment
considering the overall asset availability, reliability and risk.
A component failure due to wear or degradation is a major threat to asset failure in a
processing facility. A carefully planned inspection and maintenance strategy not only
mitigate the effects of age-based degradation and reduce the threat of failure but also
minimize the risk exposure. Generally failure caused by wear or degradation is modeled as a
Page 3
iii
stochastic process. For an effective inspection and maintenance strategy, the stochastic nature
of failure has to be taken into consideration. The proposed methodology aims to minimize
the risk of exposure considering effect of failure on human life, financial investment and
environment by optimizing the interval of process unit shutdown. Risk-based shutdown
inspection and maintenance optimization quantifies the risk to which individual equipment
are subjected and uses this as a basis for the optimization of a shutdown inspection and
maintenance strategy.
Keywords: Risk-based, Availability, Reliability, Safety, Failure consequences, Shutdown,
Maintenance Scheduling Optimization, Genetic Algorithms
Page 4
iv
This dissertation is dedicated to my parents
Muhammad Alamgeer and Salma Khatoon
My wife
Shaista Hameed
&
My kids
Nabiha Hameed, Rayyan Hameed and Fayzan Hameed
for their endless love and support …
Page 5
v
Acknowledgments
First and foremost, all praises to Allah, the most Gracious and Most Merciful, for
giving me the opportunity and strength to complete this work. I am pleased to acknowledge
several individuals for their guidance, contribution and support throughout my Ph.D.
program.
I would like to thank my academic advisor, Dr. Faisal Khan for giving me the
opportunity to work with him on this research. Without his guidance, support and
encouragement throughout this program, this dissertation would have been impossible. Dr.
Khan has been supportive in all circumstances whether academically, professionally and
personally.
I would also like to thank my supervisory team members, Dr. Salim Ahmed for
providing valuable guidance and help throughout the study and Dr. Syed Imtiaz for his
guidance and support in completing this dissertation.
I would like to offer thanks to my friends, Dr. Syed Asif Raza and Dr. Qadeer
Ahmed, for their support and guidance to address industry problems.
I am indebted to the graduate studies department of Memorial University for
providing me with such a great opportunity. I am sincerely thankful to all who helped me,
including the administrative, technical and academic staff at Memorial University.
Most especially, I would like to thank my parents, brothers and sisters for providing
me support and encouragement in growing and securing an outstanding education. I could
not have completed this without their love, support and generosity.
Page 6
vi
Last but not least, I would like to take this opportunity to thank my wife and beloved
kids for their unselfish support for their understanding, patience and sacrifices during my
study.
Page 7
vii
Co-Authorship Statement
I, Abdul Hameed, hold a primary author status for all the chapters in this dissertation.
However, each manuscript is co-authored by my supervisor and co-researchers. Supports
from my friends and colleagues were also obtained in facilitating the development of this
work as described below.
Hameed A., & Khan, F. (2014). A framework to estimate the risk-based
shutdown interval for a processing plant. Journal of Loss Prevention in the
Process Industries, 32, 18–29.
Statement: I am the primary author and carried out numerical modeling and analysis.
I have drafted the manuscript and included all the comments after review from co-
author in the final manuscript. As co-author, Faisal I. Khan helped in developing the
idea, reviewed, corrected the model and results. He also contributed in reviewing and
revising the manuscript.
Hameed, A., Khan, F., & Ahmed, S. (2015). A risk-based methodology to
estimate shutdown interval considering system availability. Process Safety
Progress, 34 (3), 267-279.
Statement: In primary author capacity, I developed the framework and implemented
analyzed and compiled the results. I have drafted the initial manuscript which was
reviewed and commented by co-authors. Their suggestions were later incorporated in
the final manuscript. As co-author, Faisal I. Khan guided for the improvements of
overall framework and supported in finalizing the methodology to implement the
Page 8
viii
framework. He also contributed in reviewing and revising the manuscript. As co-
author, Salim Ahmed contributed in reviewing and revising the manuscript.
Hameed, A., Khan, F., & Ahmed, S. (2016). A Risk-based Shutdown Inspection
and Maintenance Interval considering human error for a processing facility.
Process Safety and Environmental Protection, 100, 9-21.
Statement: In primary author capacity, I developed the framework and
implemented analyzed and compiled the results. I have drafted the initial manuscript
which was reviewed and commented by co-authors. Their suggestions were later
incorporated in the final manuscript. As co-author, Faisal I. Khan guided for the
improvements of overall framework and supported in finalizing the methodology to
implement the framework. He also contributed in reviewing and revising the
manuscript. As co-author, Salim Ahmed contributed in reviewing and revising the
manuscript.
Hameed, A., Raza, S.A., Ahmed, Q., Khan, F.I., & Ahmed, S. (2016). Risk-based
maintenance scheduling for a LNG gas sweetening unit. Submitted in Journal of
Loss Prevention in the Process Industries.
Statement: As a primary author, I developed and integrated the concept of
maintenance scheduling considering shutdown application. I have drafted the
manuscript for review and comments, later, included all the comments from co-
authors in the final manuscript. As a co-author, Syed A. Raza participated in the
development of the Genetic Algorithm code in MATLAB. He also contributed in
reviewing and revising the manuscript. As co-author, Qadeer Ahmed contributed in
Page 9
ix
developing and refining the idea and providing data support, reviewed, and feedback
on the model and results. He also contributed in reviewing and suggesting areas to
improve the manuscript. As co-author, Faisal I. Khan guided for the improvements of
overall framework and supported in finalizing the methodology to implement the
framework. He also contributed in reviewing and revising the manuscript. As co-
author, Salim Ahmed contributed in reviewing and revising the manuscript.
Abdul Hameed
Page 10
x
Table of Contents
Abstract ................................................................................................................................ ii
Acknowledgments .................................................................................................................v
Co-Authorship Statement ................................................................................................... vii
Table of Contents ..................................................................................................................x
Table of Figures ................................................................................................................ xiii
List of Tables .....................................................................................................................xvi
List of Symbols & Abbreviations ..................................................................................... xvii
1 CHAPTER 1 – Introduction and Overview ......................................................................1
1.1 Introduction ............................................................................................................... 1
1.2 Research Objective and Scope ................................................................................... 2
1.3 General Terminology and Definitions ........................................................................ 5
1.4 Constraints and Limitations ..................................................................................... 15
1.5 Thesis Structure ....................................................................................................... 16
2 CHAPTER 2 – A framework to estimate the risk-based shutdown interval for a
processing plant ................................................................................................................... 19
2.1 Introduction ............................................................................................................. 20
2.2 State-of-the-art on shutdown inspection and maintenance: ....................................... 22
2.3 Risk-based shutdown inspection and maintenance interval (RBSIM) methodology .. 27
2.4 The application of RBSIM to an onshore processing facility unit ............................. 41
2.5 Results & discussions .............................................................................................. 42
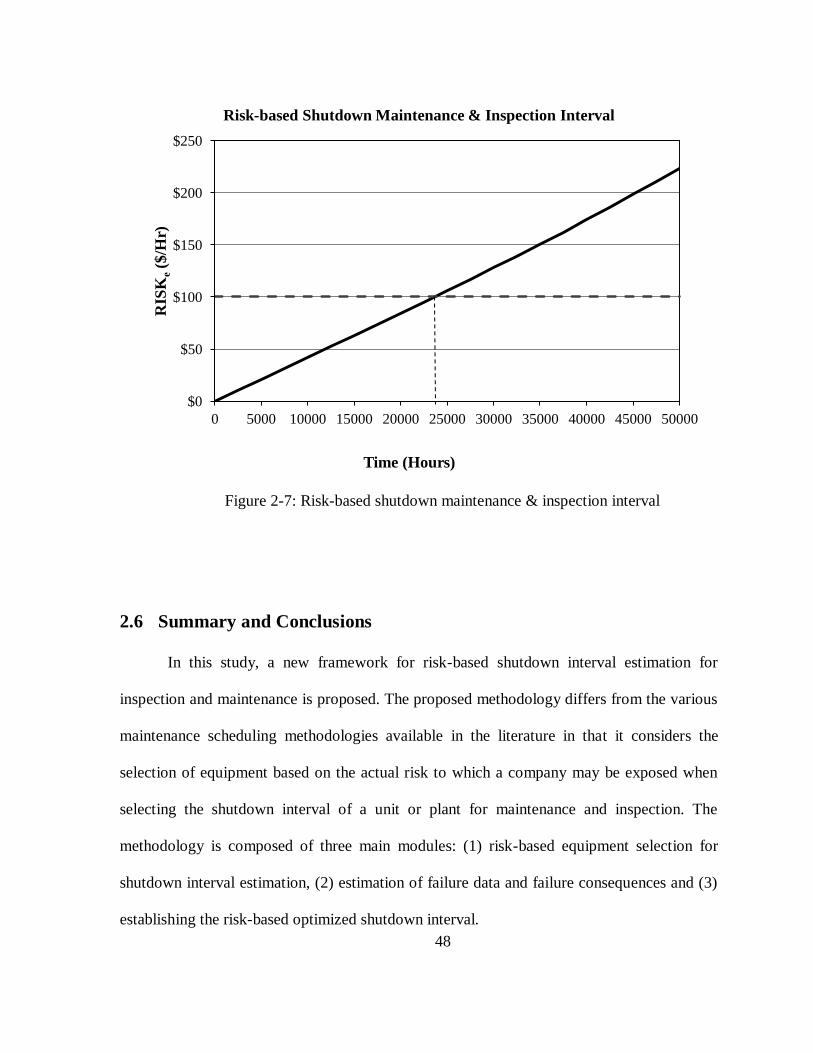
2.6 Summary and Conclusions ....................................................................................... 48
Page 11
xi
3 CHAPTER 3 – A risk-based methodology to estimate shutdown interval considering
system availability ............................................................................................................... 51
3.1 Introduction ............................................................................................................. 52
3.2 A risk-based Shutdown Interval Methodology (RBSIM) .......................................... 57
3.3 The Application of RBSIM to a LNG Processing Facility ........................................ 77
3.4 Discussion and Conclusions ..................................................................................... 88
4 Chapter 4 – A risk-based shutdown inspection and maintenance interval considering
human error for a processing facility ................................................................................... 91
4.1 Introduction ............................................................................................................. 92
4.2 Past Studies ............................................................................................................. 94
4.3 A risk-based inspection and maintenance modeling considering human error ........... 99
4.4 The application of RBSIM to a LNG processing facility ........................................ 116
4.5 Conclusion ............................................................................................................. 127
5 Chapter 5 – Risk-based maintenance scheduling for a LNG gas sweetening unit .......... 129
5.1 Introduction ........................................................................................................... 130
5.2 Literature Research ................................................................................................ 132
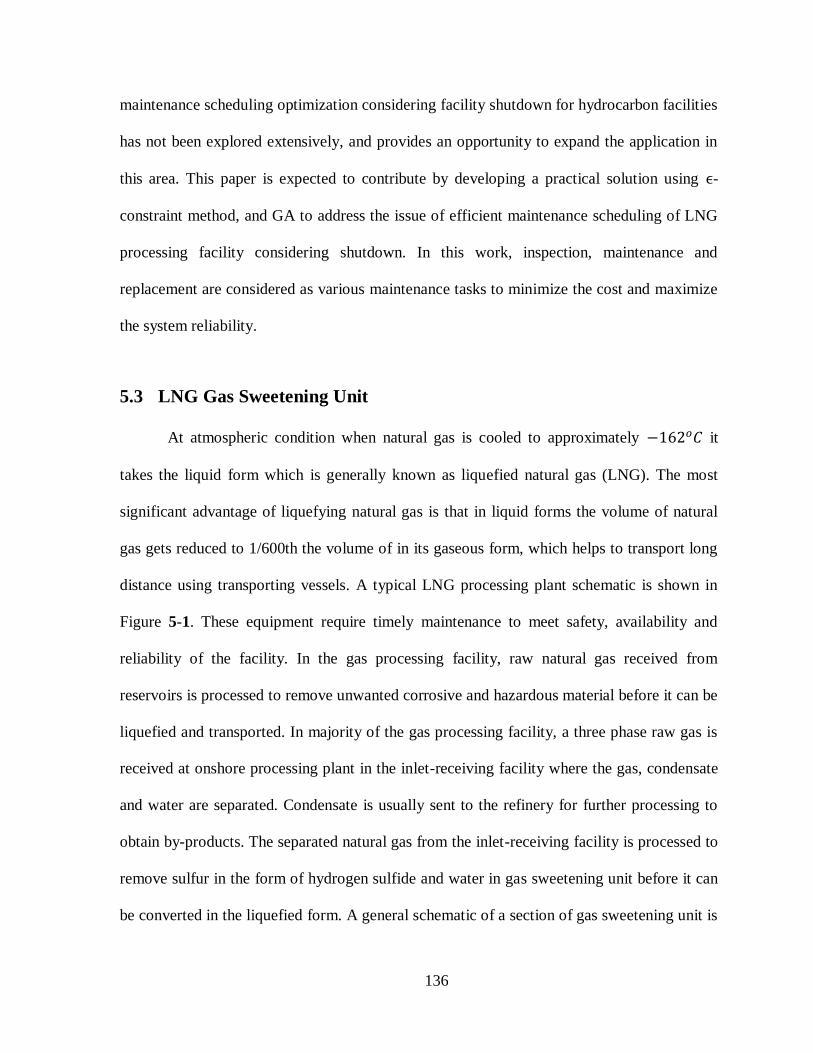
5.3 LNG Gas Sweetening Unit ..................................................................................... 136
5.4 Risk-based Bi-Objective Maintenance Scheduling Model ...................................... 140
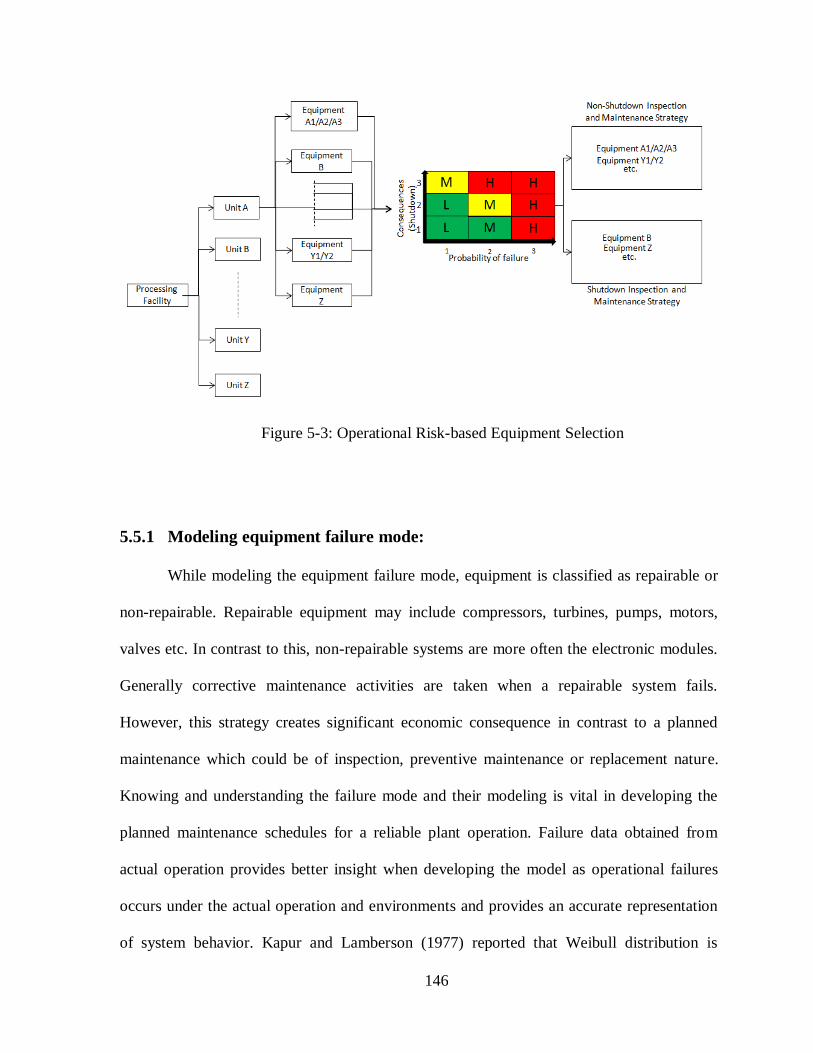
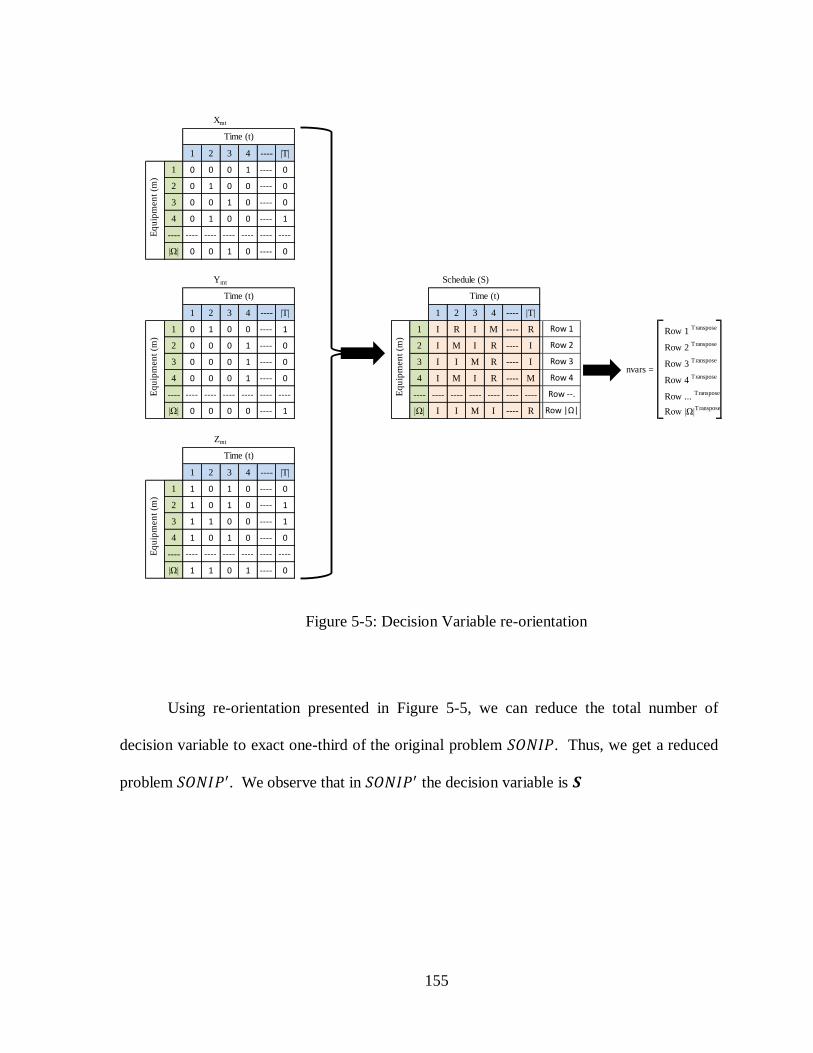
5.5 Operational Risk-based Equipment Selection: ........................................................ 144
5.6 Bi-objective model formulation ............................................................................. 150
5.7 Simulation Study ................................................................................................... 162
5.8 Conclusions ........................................................................................................... 169
6 Chapter6 – Conclusion, Contribution and Future work ................................................ 171
Page 12
xii
6.1 Introduction ........................................................................................................... 171
6.2 Research Contributions .......................................................................................... 172
6.3 Conclusion ............................................................................................................. 176
6.4 Recommendations for Future Research Work ........................................................ 177
7 REFERENCES ............................................................................................................ 180
7.1 References - Chapter 1 ........................................................................................... 180
7.2 References - Chapter 2 ........................................................................................... 181
7.3 References - Chapter 3 ........................................................................................... 185
7.4 References - Chapter 4 ........................................................................................... 190
7.5 References - Chapter 5 ........................................................................................... 197
7.6 References - Chapter 6 ........................................................................................... 203
Page 13
xiii
Table of Figures
Figure 1-1: Overall research strategy .....................................................................................5
Figure 1-2: Types of maintenance ..........................................................................................8
Figure 1-3: Failure consequence modeling........................................................................... 13
Figure 1-4: Asset Failure Scenarios and Hazards ................................................................. 14
Figure 2-1: Frame work to estimate risk-based shutdown interval ........................................ 29
Figure 2-2: Qualitative Criticality risk ranking matrix ......................................................... 30
Figure 2-3: Block diagram showing equipment acting in series............................................ 31
Figure 2-4: Block diagram showing equipment acting in series/parallel configuration ......... 31
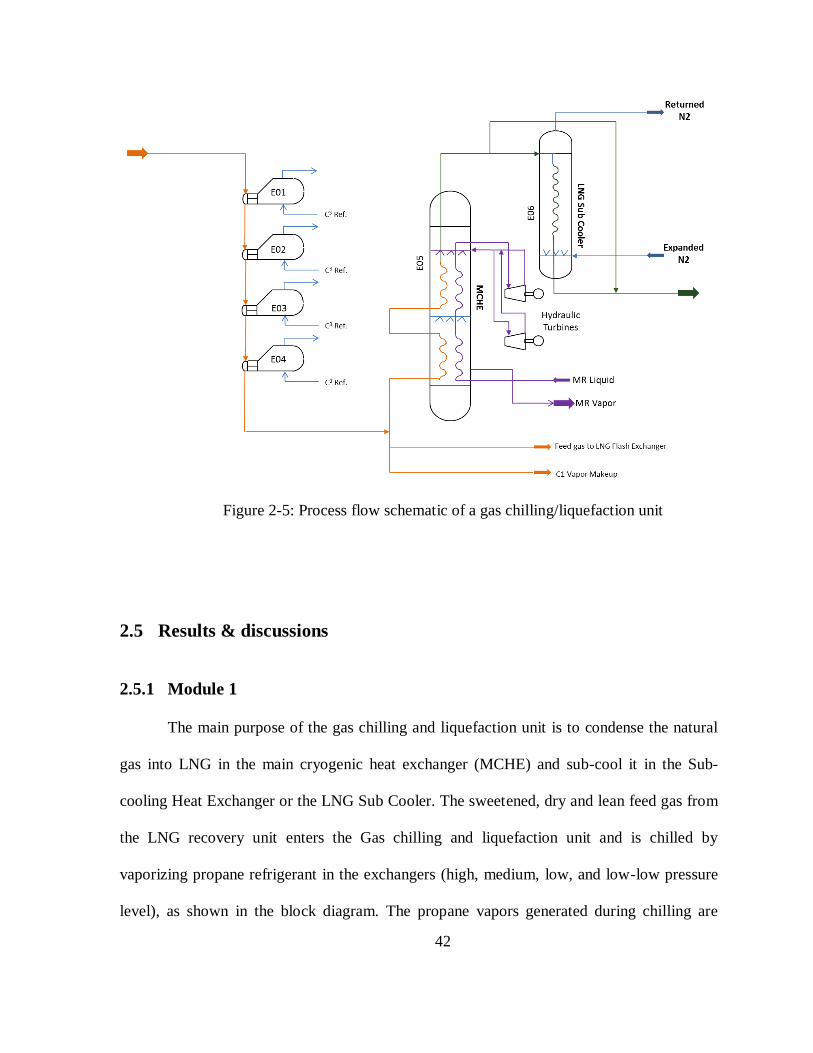
Figure 2-5: Process flow schematic of a gas chilling/liquefaction unit ................................. 42
Figure 2-6: Block diagram of the critical equipment selected for a gas chilling/liquefaction
unit ...................................................................................................................................... 43
Figure 2-7: Risk-based shutdown maintenance & inspection interval ................................... 48
Figure 3-1: Shutdown Classification .................................................................................... 54
Figure 3-2: Risk-based shutdown interval methodology....................................................... 59
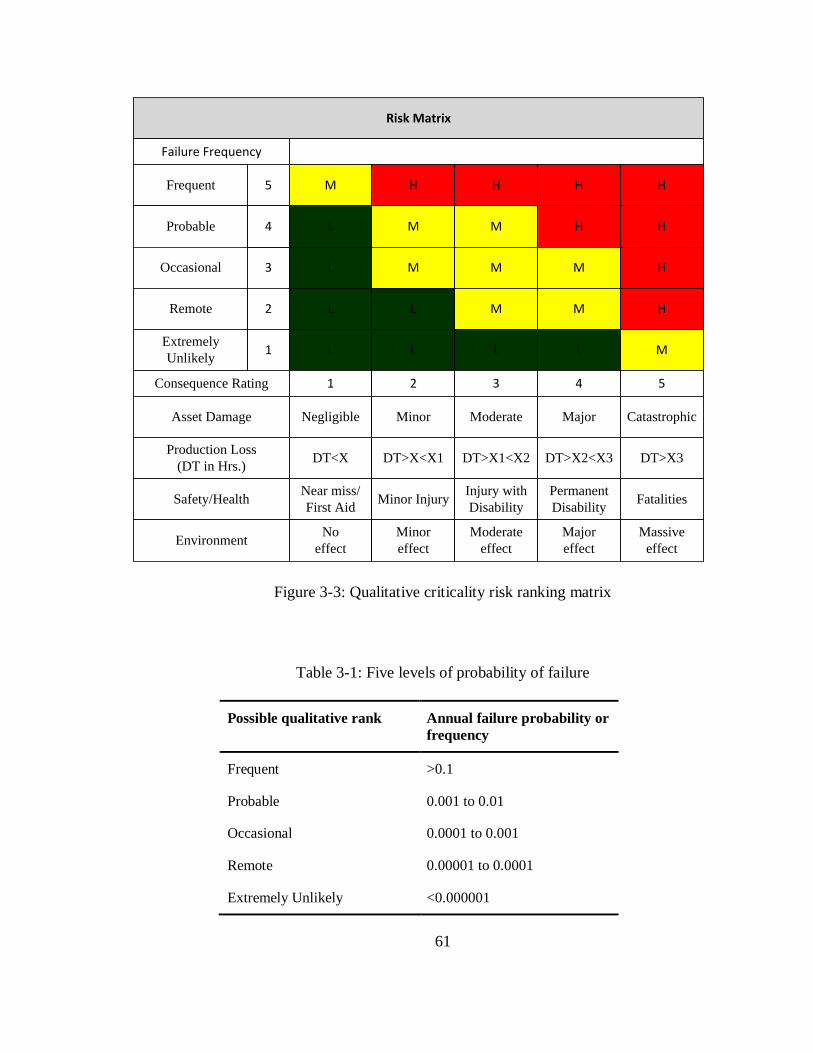
Figure 3-3: Qualitative criticality risk ranking matrix .......................................................... 61
Figure 3-4: Operational and shutdown state of a repairable system ...................................... 63
Figure 3-5: Markov state space diagram of a single component repairable system ............... 63
Figure 3-6: Illustration of failure patterns (redrawn after Nowlan and Heap, 1978) .............. 64
Figure 3-7: State space diagram of an unplanned and planned shutdown for system with
redundancy .......................................................................................................................... 67
Figure 3-8: State space diagram of an unplanned and planned shutdown for system with no
redundancy .......................................................................................................................... 68
Page 14
xiv
Figure 3-9: Air Products AP-X™ process (redrawn after Roberts et al. 2002) ...................... 79
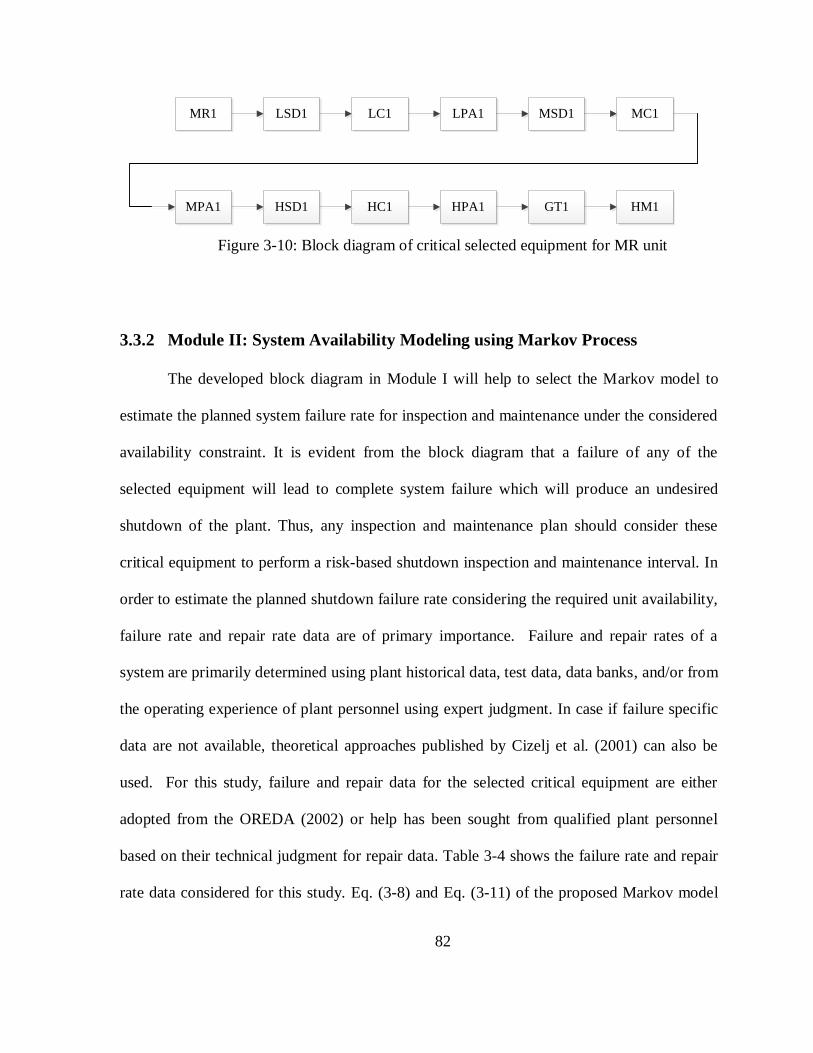
Figure 3-10: Block diagram of critical selected equipment for MR unit ............................... 82
Figure 3-11: Risk-based shutdown inspection and maintenance interval modeling ............... 86
Figure 3-12: Risk-based shutdown inspection and maintenance interval - Sensitivity analysis
for availability ..................................................................................................................... 87
Figure 3-13: Risk-based shutdown inspection and maintenance interval - Sensitivity analysis
for MSDT............................................................................................................................ 88
Figure 4-1: A Risk based inspection and maintenance interval optimization model
considering human error .................................................................................................... 101
Figure 4-2: Qualitative Criticality risk ranking matrix ....................................................... 104
Figure 4-3: System Operational Availability ...................................................................... 107
Figure 4-4: SLIM methodology to calculate HEP .............................................................. 109
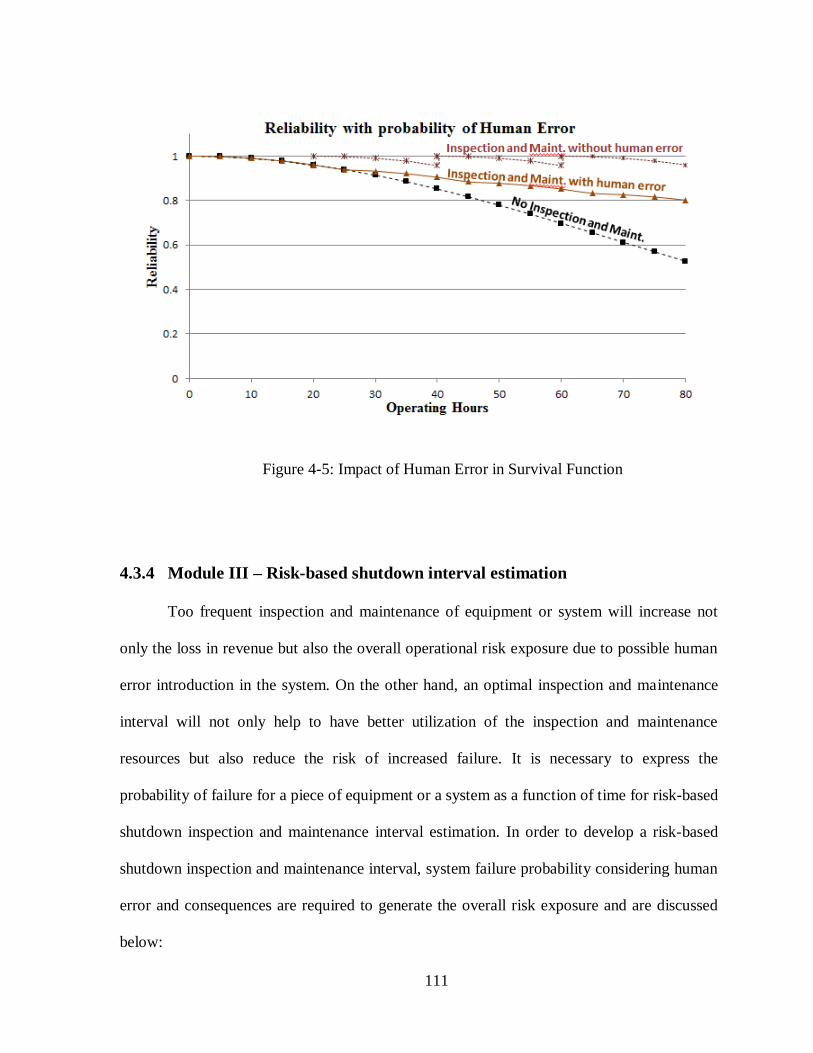
Figure 4-5: Impact of Human Error in Survival Function ................................................... 111
Figure 4-6: A typical LNG processing plant process flow .................................................. 117
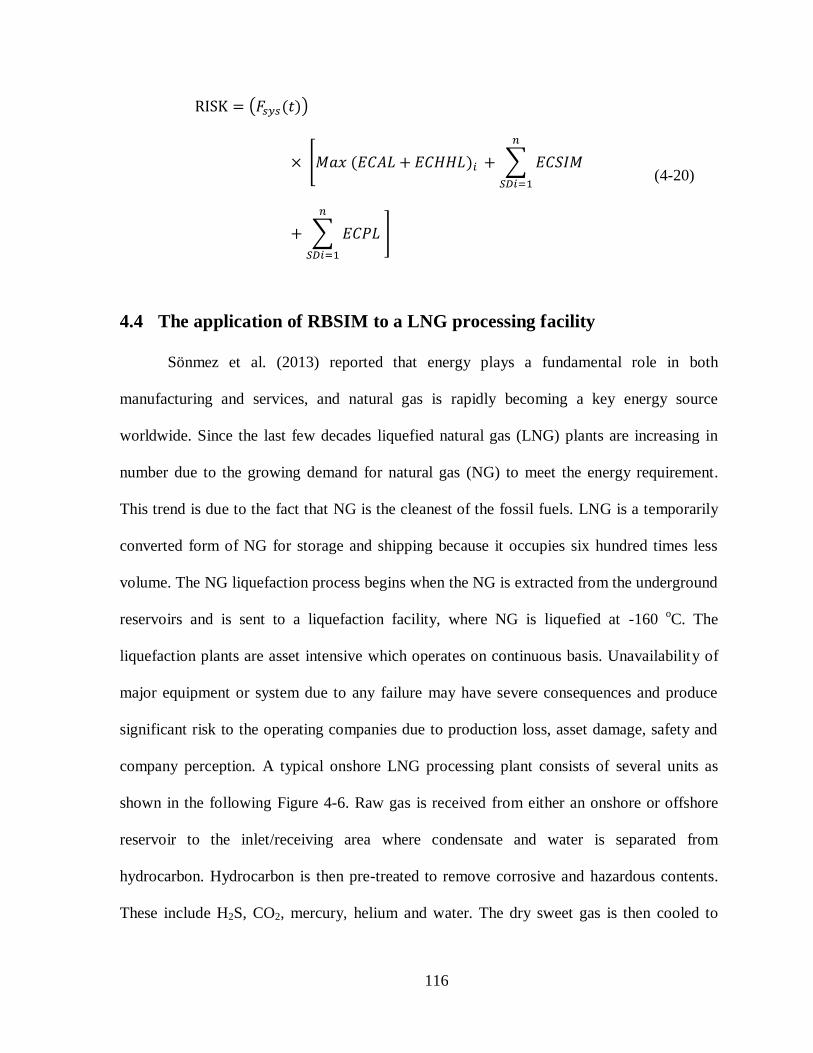
Figure 4-7: Gas Chilling and Liquefaction Unit ................................................................. 119
Figure 4-8 Functional block diagram of selected equipment .............................................. 120
Figure 4-9: Risk-based shutdown inspection and maintenance ........................................... 126
Figure 4-10: Risk-based shutdown inspection and maintenance ......................................... 127
Figure 5-1: A typical LNG Process Plant (Mokhatab, Mark, Valappil, & Wood, 2014) ..... 137
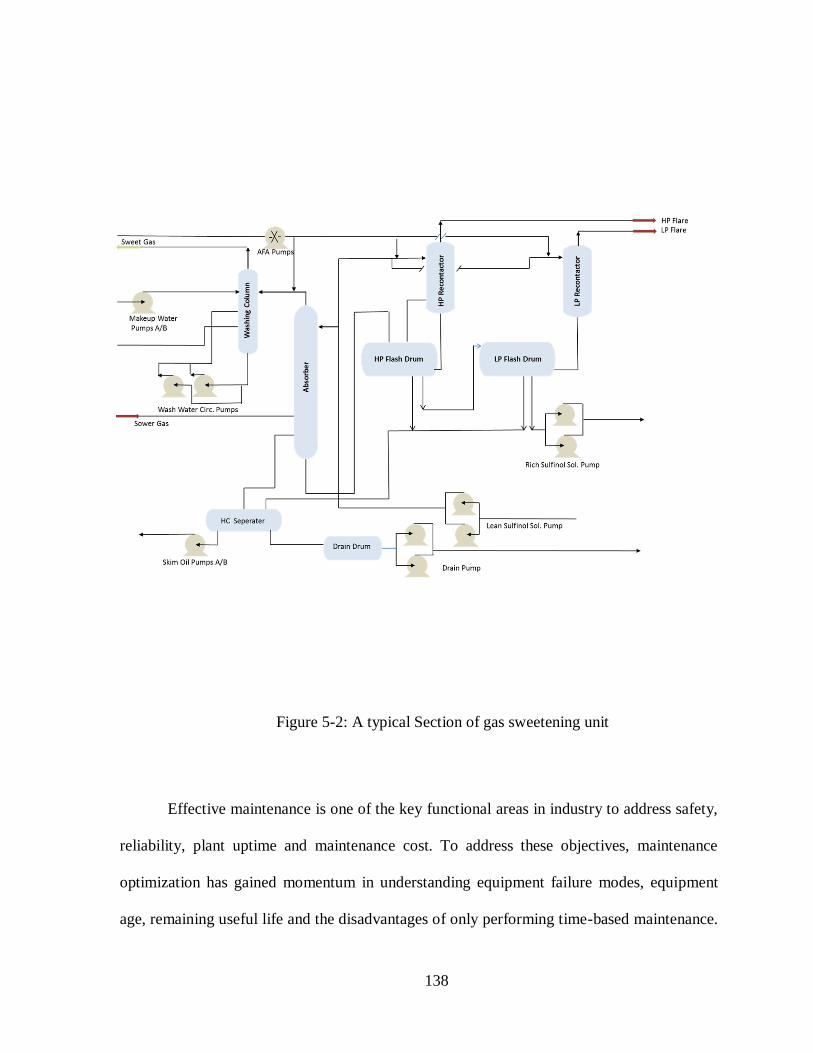
Figure 5-2: A typical Section of gas sweetening unit ......................................................... 138
Figure 5-3: Operational Risk-based Equipment Selection .................................................. 146
Figure 5-4: Proposed solution framework .......................................................................... 154
Figure 5-5: Decision Variable re-orientation ...................................................................... 155
Page 15
xv
Figure 5-6: Population representation in a typical generation ............................................. 161
Figure 5-7: Pareto Front - Total Maintenance Cost Subject to Reliability Constraints ........ 167
Page 16
xvi
List of Tables
Table 2.5-1: Critical equipment selected from gas chilling and liquefaction unit .............................. 43
Table 2.5-2: The failure rate data for the equipment considered in this case study ............................ 44
Table 2.5-3: Failure scenarios and their estimated consequences ...................................................... 46
Table 3-1: Five levels of probability of failure ................................................................................. 61
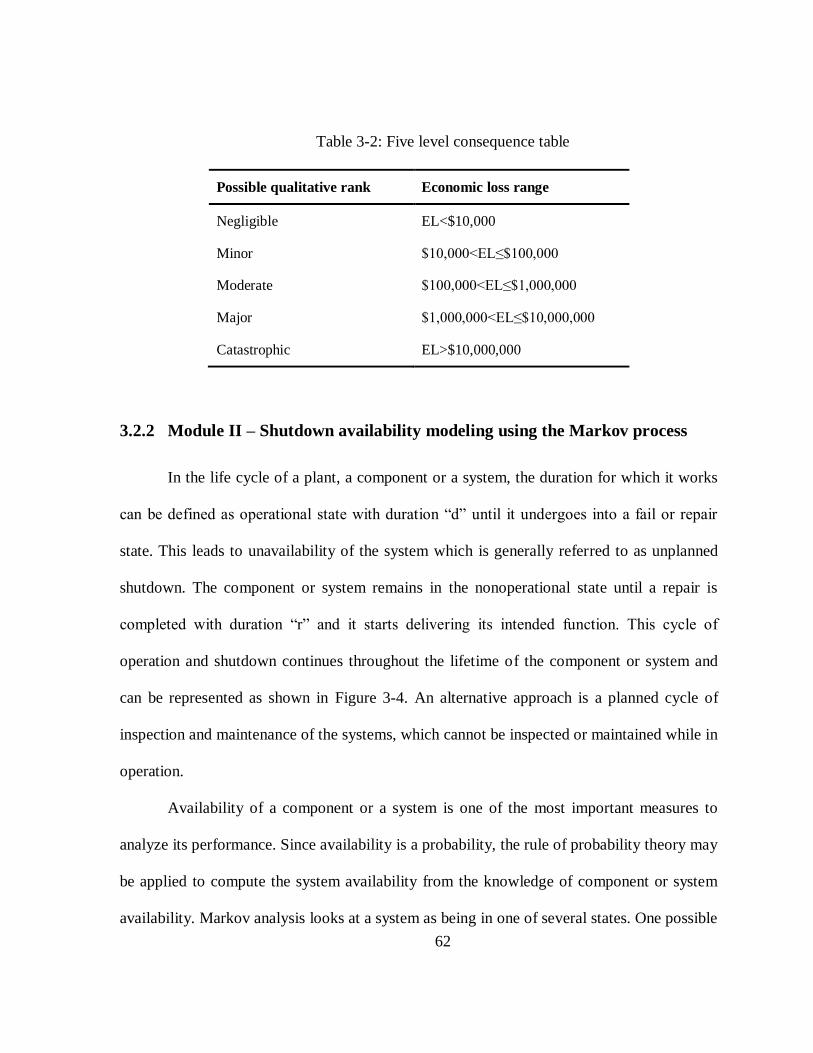
Table 3-2: Five level consequence table........................................................................................... 62
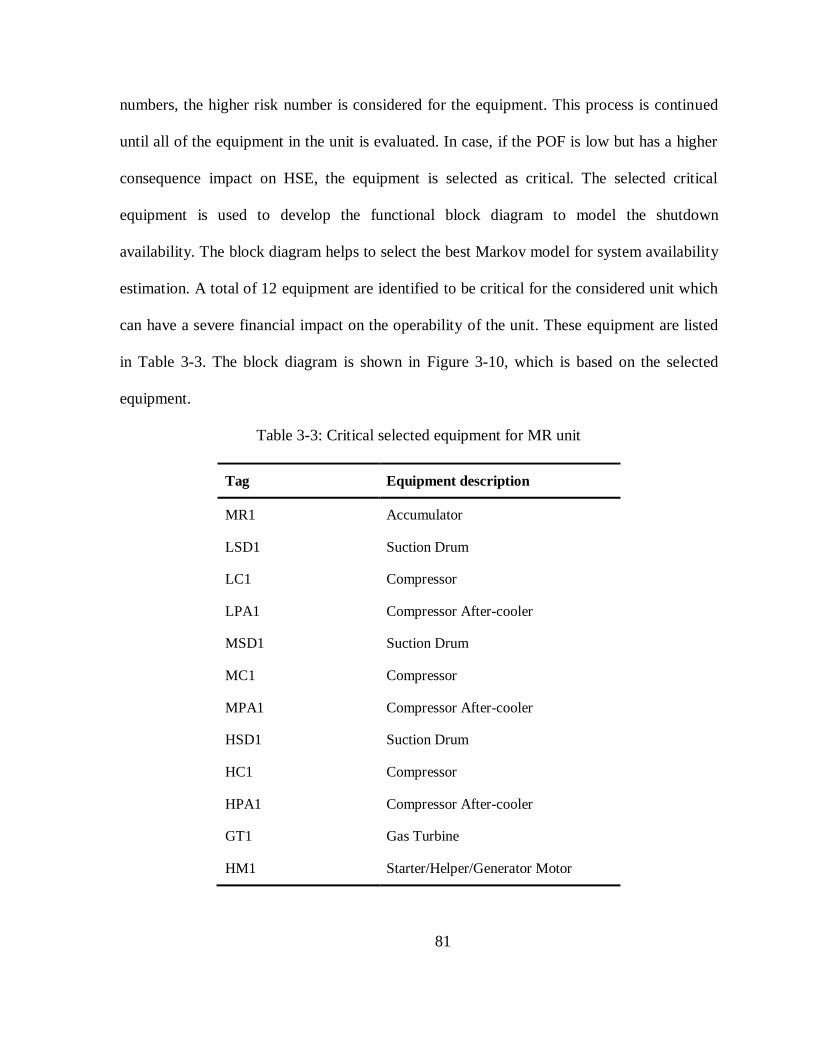
Table 3-3: Critical selected equipment for MR unit.......................................................................... 81
Table 3-4: Critical selected equipment failure and repair data .......................................................... 83
Table 3-5: Estimated system failure and repair rates ........................................................................ 83
Table 4-1: Five Level of Probability of failure (Khan et al. (2014)) ................................................ 104
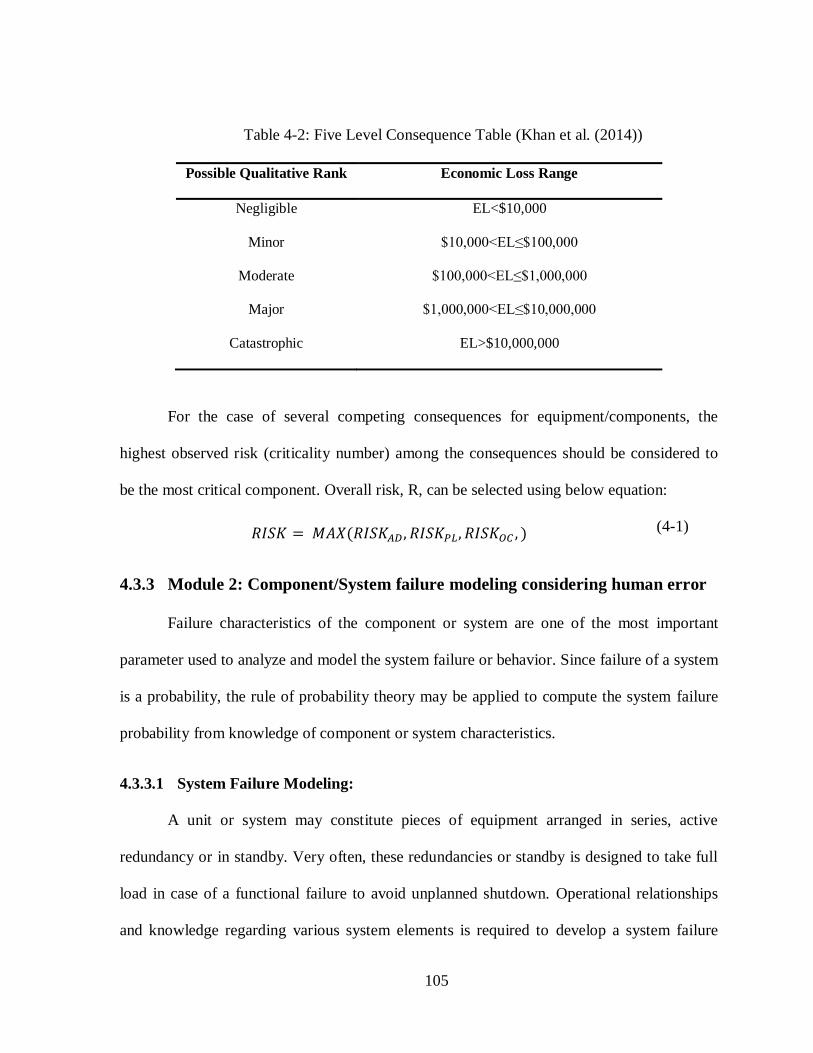
Table 4-2: Five Level Consequence Table (Khan et al. (2014)) ...................................................... 105
Table 4-3: Consequence Estimation (Khan et al. (2014)) ............................................................... 114
Table 4-4: The failure Characteristics of considered equipment. .................................................... 120
Table 4-5: List of considered PSF .................................................................................................. 121
Table 4-6 : Performance Shaping Factor, Rank and Weight ........................................................... 122
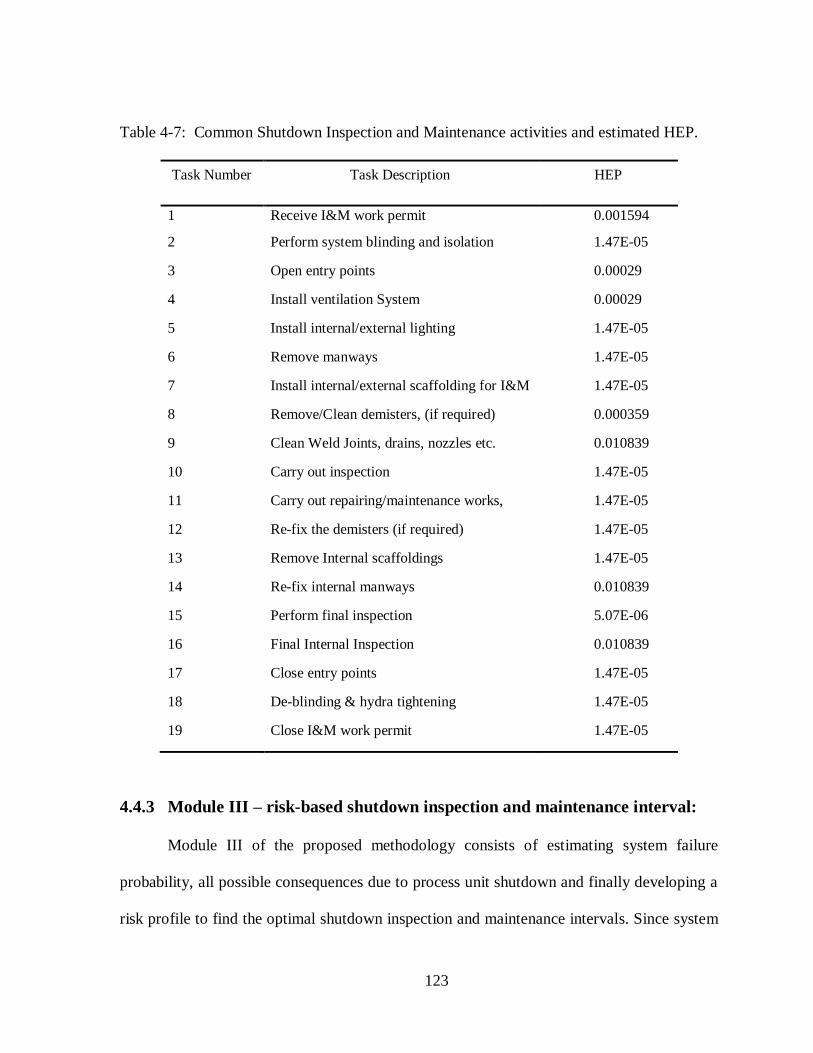
Table 4-7: Common Shutdown Inspection and Maintenance activities and estimated HEP. ........... 123
Table 4-8: Estimated failure consequences .................................................................................... 125
Table 4-9: Estimated Shutdown Cumulative time .......................................................................... 126
Table 5-1: MATLAB (2015b) built-in procedure ‘ga’ related selected parameters in ‘gaoptimset’ . 159
Table 5-2: MATLAB (2015b) built-in procedure ‘ga’ user-defined functions and parameters ........ 160
Table 5-3: Operational Riskbased Equipment Selection ................................................................. 163
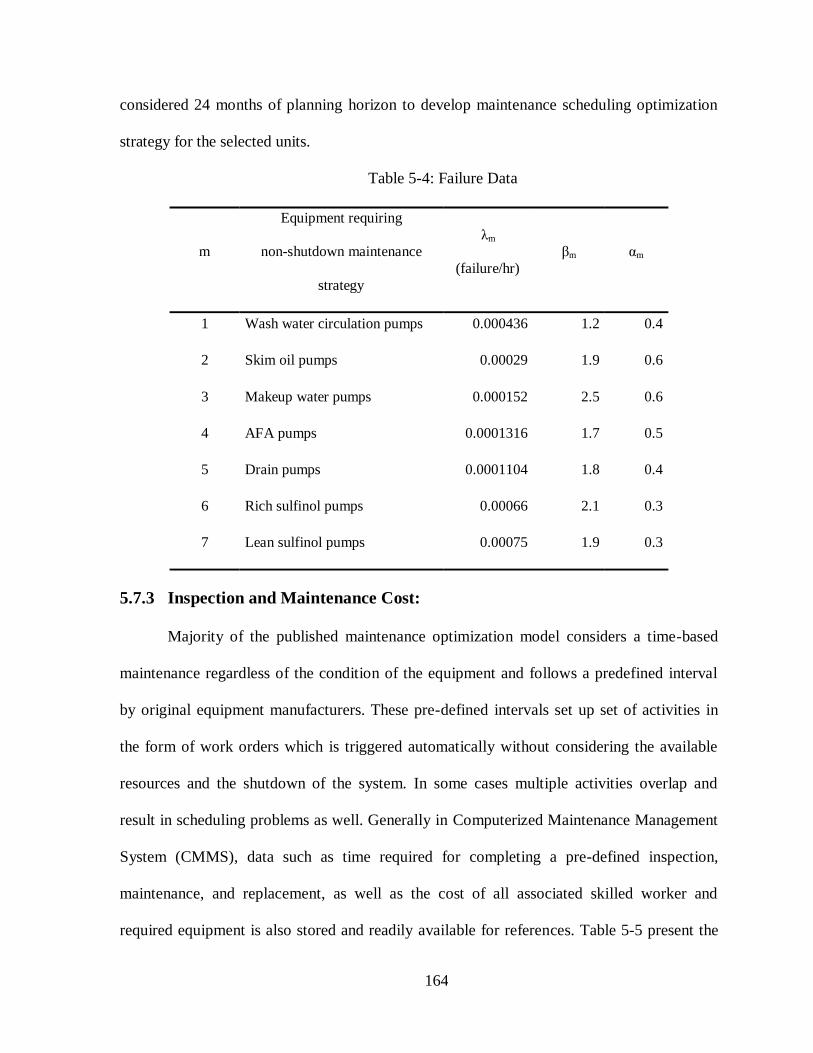
Table 5-4: Failure Data.................................................................................................................. 164
Table 5-5: Inspection and Maintenance Cost Data ......................................................................... 165
Table 5-6: Inspection and Maintenance Schedule for Target Reliability of 90% ............................. 168
Table 5-7: Inspection and Maintenance Schedule for Target Reliability of 95% ............................. 168
Page 17
xvii
List of Symbols & Abbreviations
Symbol/
Abbreviation
Description
As bad as old
Asset density
As good as new
As low as reasonably practicable
Air Products and chemicals inc.
American petroleum institute
Boiling liquid expanding vapor explosion
Condition based maintenance
Cost of injury and fatality
Corrective maintenance
Department of defense, USA
Federal aviation authority
Economic consequence of asset loss
Economic consequence of failure
Economic consequence of human health loss
Economic consequence of production loss cost
Economic consequence of shutdown inspection and maintenance
Total economic consequence
Effected zone due to overpressure
Page 18
xviii
Human error assessment and reduction technique
Human error probability of task k
High Pressure
Health, safety and environment
International atomic energy agency
Justified human error data information
Low low pressure
Liquefied natural gas
Low pressure
Main cryogenic heat exchanger
Mixed refrigerant
Mean shutdown time
Mean time to repair
Medium pressure
Natural gas
Original equipment manufacturer
Offshore and onshore reliability data
Population density
Probability of damage due to heat flux
Probability of damage due to overpressure
Process equipment reliability database
Probability of injury or death due to heat flux
Page 19
xix
Production loss volume per day
Preventive maintenance
Probability of failure
Performance shaping factor
Reliability block diagram
Risk-based maintenance
Risk-based inspection and maintenance
Risk-based shutdown inspection and maintenance
Shutdown time in days
Success likelihood indexing method
Selling price of product per unit volume ($/Unit)
Technique for human error rate production
Vapor cloud explosion
System availability
Inspection Cost ($)
Cost of inspection equipment ($/Hr.)
Cost of inspection labor ($/Hr.)
Cost of skilled maintenance labor ($/Hr.)
Cost of preparatory maintenance labor ($/Hr.)
Cost of technical labor ($/Hr.)
Maintenance cost ($)
Preparatory cost ($)
Page 20
xx
Cost of spare parts ($)
Technical support cost
Operational state with duration
Total economic consequence
Expected number of failures of the ith unique subsystem over the
system design life
System failure probability at time t
Mean time to repair the ith unique subsystem
System mean time to repair
Probability of being in state i
Probability of being in state j
Probability of a complete repair
Production loss volume per day
Cost of production loss
System unavailability
Number of identical subsystem of type i
Probability of minimal repair
System reliability at time t
Estimated risk ($)
Selling price of product volume per day
Operating time (h)
Design life of the plant or unit
Page 21
xxi
Duration of inspection work
Duration of maintenance work
Duration of preparatory work
Duration of technical support work
Shutdown interval
Weibull Shape Parameter
Weibull Characteristic life
Weibull Hazard rate
Failure rate for parallel configuration
Failure rate for series configuration
System failure rate
Exponential failure rate
Exponential repair rate
Page 22
1
1 CHAPTER 1
Introduction and Overview
1.1 Introduction
Processing industries such as oil and gas and petrochemicals are considered to be
complex industries due to their size and production volumes. A process plant consists of
equipment, machineries, systems or their integral parts or components (hard resources; such
as pipes, heat exchangers, electric motors, pumps, turbine, vessel, columns, flow and control
valves etc. etc.), controlling and monitoring software (soft resources) which provide a
specific function or services. These hard and soft resources are generally called physical
assets. These physical assets are a combination of many permanent or temporary components
which are configured within the hierarchy of an asset. Performance of these assets depends
on their reliability, operation and maintainability. Very often these components need to be
removed, repaired, overhauled or replaced in order for the asset to keep functioning or
deliver the output it is designed for. When an asset fail (partial or total) to perform its
intended function, it may result in loss of production, poor quality products, financial losses
and in some case, serious hazardous and environmental issues. These failures or breakdowns
could be due to cracks, leakages, corrosion, erosion, heating, vibration and wear (age
related). Failure to detect these symptoms and not inspecting or reacting to remove these
Page 23
2
degraded mode or functionality may result in major asset breakdowns or serious catastrophic
failures.
A set of activities or actions which ensures that the asset is available to perform its
intended function, in a cost effective manner is generally called maintenance. Proper and
effective inspection and maintenance of the asset not only helps to sustain the reliability of its
functioning but also to improve its availability and performance as required. Best inspection
and maintenance strategy helps to detect the potential failure before it produce undesired
event or down time e.g. emergency shutdown for corrective action. Gulati and Smith (2009)
reported that maintenance is an act of maintaining, or the work of keeping an asset in proper
operating condition. It may consist of performing maintenance inspection and repair to keep
assets operating in a safe manner to produce or provide designed capabilities. These actions
can be Preventive Maintenance (PM) and Corrective Maintenance (CM) actions. So,
maintenance keeps assets in an acceptable working condition, prevents them from failing,
and, if they fail, brings them back to their operational level effectively and as quickly as
possible.
1.2 Research Objective and Scope
Inspection and maintenance activities are carried out aiming to improve the reliability
and availability of the system. Nowadays, complexity and advancement in systems and
equipment has increased significantly in Oil & Gas, Refineries and Petrochemical facilities.
Due to this reason, inspection and maintenance activities are moving from the reactive and
expensive mode (e.g., breakdown maintenance, failure-finding maintenance and corrective
maintenance) to proactive based, cost effective and high service maintenance techniques and
Page 24
3
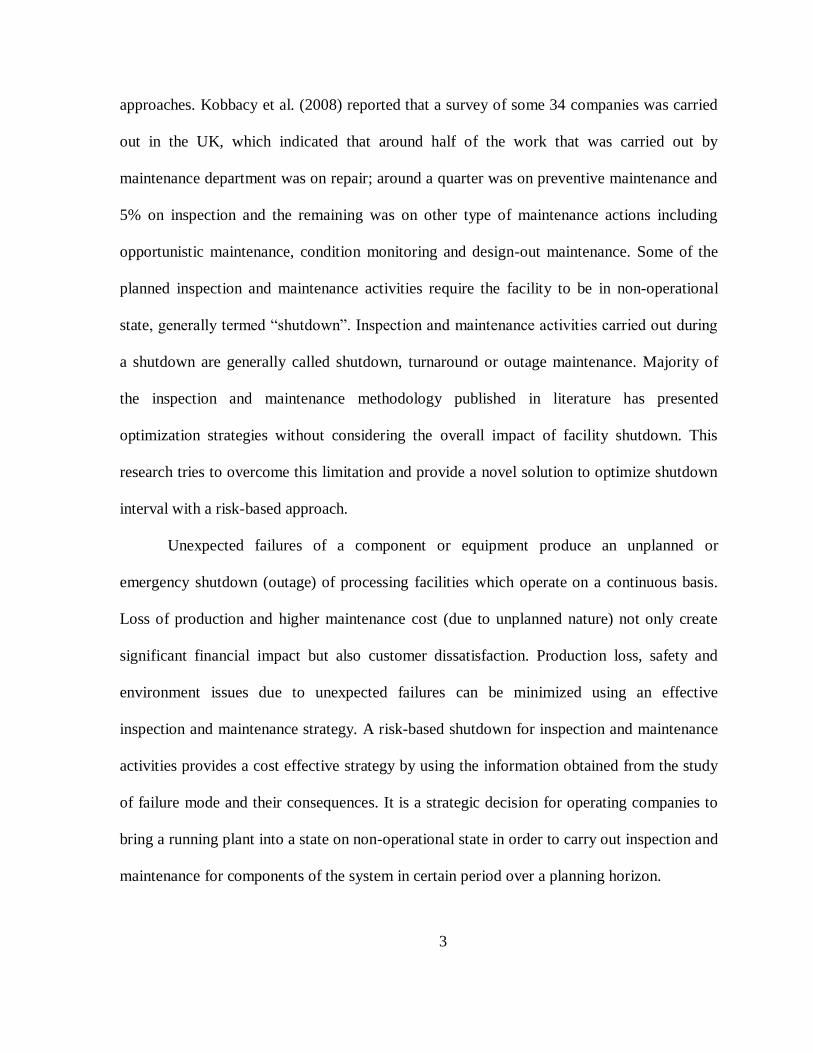
approaches. Kobbacy et al. (2008) reported that a survey of some 34 companies was carried
out in the UK, which indicated that around half of the work that was carried out by
maintenance department was on repair; around a quarter was on preventive maintenance and
5% on inspection and the remaining was on other type of maintenance actions including
opportunistic maintenance, condition monitoring and design-out maintenance. Some of the
planned inspection and maintenance activities require the facility to be in non-operational
state, generally termed “shutdown”. Inspection and maintenance activities carried out during
a shutdown are generally called shutdown, turnaround or outage maintenance. Majority of
the inspection and maintenance methodology published in literature has presented
optimization strategies without considering the overall impact of facility shutdown. This
research tries to overcome this limitation and provide a novel solution to optimize shutdown
interval with a risk-based approach.
Unexpected failures of a component or equipment produce an unplanned or
emergency shutdown (outage) of processing facilities which operate on a continuous basis.
Loss of production and higher maintenance cost (due to unplanned nature) not only create
significant financial impact but also customer dissatisfaction. Production loss, safety and
environment issues due to unexpected failures can be minimized using an effective
inspection and maintenance strategy. A risk-based shutdown for inspection and maintenance
activities provides a cost effective strategy by using the information obtained from the study
of failure mode and their consequences. It is a strategic decision for operating companies to
bring a running plant into a state on non-operational state in order to carry out inspection and
maintenance for components of the system in certain period over a planning horizon.
Page 25
4
This research focuses on developing a risk-based shutdown inspection and
maintenance interval optimization methodology for a processing facility. This methodology
will help to identify a proper inspection and maintenance interval in view of the overall risk
exposure (financial impact), and lead to avoid unwanted breakdowns in the facility.
The specific research objectives of this work are:
(1) To develop a framework to estimate risk-based shutdown inspection and
maintenance interval
(2) To develop a risk-based methodology to estimate shutdown interval
considering system availability.
(3) To develop a risk-based shutdown inspection and maintenance interval
considering human error for a processing facility.
(4) To develop a multi-constrained, bi-objective risk-based maintenance
scheduling for a LNG gas sweetening unit.
The endeavor of this research is to find the optimum shutdown interval to perform
inspection and maintenance of a system such that the overall risk is minimized subject to a
constraint on reliability and availability. The proposed methodology will provide a means to
achieve the desired reliability and availability of the processing unit or facility under
considered circumstances as illustrated in Figure 1-1: Overall research strategy.
Page 26
5
Figure 1-1: Overall research strategy
1.3 General Terminology and Definitions
To better understand the concepts in this dissertation, basic definitions and
terminology are discussed in the following sub-sections.
1.3.1 Shutdown
A duration in which a process facility is out of service and does not produce the
desired outcome is termed as shutdown.
Risk-based shutdown interval
Framework to estimate risk-
based shutdown
interval
Risk-based shutdown
interval considering
human error
Multi-constraint, bi-
objective maintenance optimization using Genetic
Algorithm
Risk-based shutdown
interval considering
system availability
Page 27
6
1.3.1.1 Planned/Scheduled Shutdown:
Duffuaa and Daya (2004) and Lawrence (2012) have defined that a planned periodic
shutdown (total or partial) of a processing unit or facility is the time taken to perform
maintenance, overhaul and repair operations and to inspect, test and replace process materials
and equipment. Planned/Scheduled shutdown can be classified as total and partial shutdown.
1.3.1.2 Total Shutdown:
In a total planned shutdown, the entire process facility is taken out of service. This
type of shutdown causes serious negative financial impact on business operations due to
production loss and shutdown maintenance cost (labor and spare parts). Generally, planning
for total shutdown begins well in advance and includes stakeholders such as procurement,
engineering, maintenance, operations, quality assurance, Health, Safety, and Environment
(HSE), security and administration.
1.3.1.3 Partial Shutdown:
A partial shutdown is a scheduled short term shutdown. This type of shutdown is the
result of critical equipment or process system deterioration for which the unit of the process
facility has to be taken out for service. Generally, the duration of partial shutdown is short in
nature. This type of shutdown may have some impact on the production rate, depending on
the configuration of the plant.
1.3.1.4 Extended Shutdown:
According to the International Atomic Energy Agency (IAEA) publication (2004),
mothballing or extended shutdown is to place the facility in a condition of preservation in
order to prevent degradation and to maintain the facility or part of the facility for future
Page 28
7
usage. Mothballing is characterized by the treatment afforded to major components.
Components and systems to be preserved may be physically removed from the environment
in which they have been operating to a new environment where they are protected from
degradation.
1.3.1.5 Emergency Shutdown:
The emergency shutdown is an unscheduled event which is initiated in the event of
safety and/or environmental related issues such as fire, spill, etc., or due to a sudden failure
of certain component or equipment which may produce or result in the loss of production.
Emergency shutdown is triggered either by the operators or the safety interlock systems
installed, to avoid failure of sophisticated and complex equipment such as compressors,
pumps, turbines, boilers, furnaces, vessels etc.
1.3.2 Maintenance and Inspections:
Maintenance and inspections are activities carried out with the aim to improve the
reliability and availability of the equipment or system. Some of these activities are
inspection, cleaning, lubricating, adjustment, alignment and/or the replacement of
components carried out in order to reduce the risk of failure. Some of the most important
maintenance approaches are reviewed briefly here. Figure 1-2 shows a broad classification of
maintenance activities.
Page 29
8
Proactive
Maintenance
Operator based
Reactive
Preventive
Predictive
Risk-based
Figure 1-2: Types of maintenance
1.3.2.1 Reactive Maintenance:
Maintenance activities which are not planned and performed when an internal
(inherent) or an external (operator-induced) failure is observed are called reactive
maintenance. Run to failure, breakdown, corrective and emergency maintenance are reactive
maintenance labeled as “unplanned”, having common characteristics with the objective to
restore the equipment to a state in which it can perform its full intended function.
1.3.2.2 Proactive Maintenance:
Maintenance activities which are planned well in advance, to avoid any potential
failure, whether internal (inherent) or external (operator-induced), are called proactive
maintenance. Proactive maintenance is contrary to reactive maintenance. Preventive
maintenance and predictive maintenance are proactive maintenance.
Page 30
9
1.3.2.3 Preventive Maintenance:
Duffua et al. (1999) and Dhillon (2002) reported that preventive maintenance can be
defined as a series of planned tasks performed to counteract the known causes of potential
failures of the intended function of an asset. Preventive maintenance can be planned based on
time or usage. If the actual failure mechanism of an asset is known, certain maintenance
action can be carried out and planned in advance to avoid failure. For example, if the failure
mode is due to wear or usage and increases over a period of time, then the preventive
maintenance will be time-based. The downside of preventive maintenance is that it increases
system downtime as well as increases the possibility of induced failures which may
negatively impact system availability and reliability.
1.3.2.4 Predictive Maintenance:
Duffua et al. (1999) reported that predictive maintenance can be defined as a series of
planned tasks performed to counteract the unknown causes of potential failures of the
intended function of an asset by monitoring or inspecting the health of the asset. This type of
maintenance strategy is also referred to as condition-based or diagnostic based maintenance.
This strategy is very useful when the probability of failure is constant regardless of time, age,
or usage, and there is a gradual degradation from the onset of failure. Gulati (2009) reported
that the "predictive" component stems from the goal of predicting the future trend of the
asset's condition. This approach uses the principles of statistical process control and trend
analysis to determine at what point in the future, maintenance activities will be appropriate
and cost effective.
Page 31
10
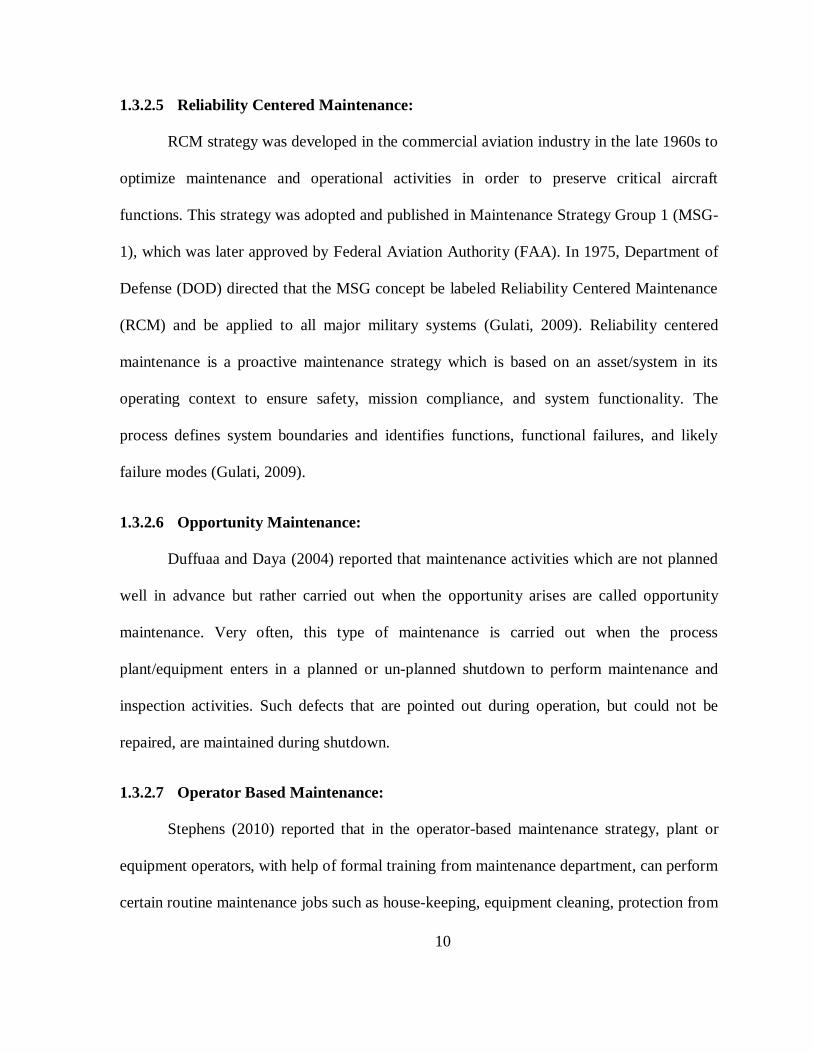
1.3.2.5 Reliability Centered Maintenance:
RCM strategy was developed in the commercial aviation industry in the late 1960s to
optimize maintenance and operational activities in order to preserve critical aircraft
functions. This strategy was adopted and published in Maintenance Strategy Group 1 (MSG-
1), which was later approved by Federal Aviation Authority (FAA). In 1975, Department of
Defense (DOD) directed that the MSG concept be labeled Reliability Centered Maintenance
(RCM) and be applied to all major military systems (Gulati, 2009). Reliability centered
maintenance is a proactive maintenance strategy which is based on an asset/system in its
operating context to ensure safety, mission compliance, and system functionality. The
process defines system boundaries and identifies functions, functional failures, and likely
failure modes (Gulati, 2009).
1.3.2.6 Opportunity Maintenance:
Duffuaa and Daya (2004) reported that maintenance activities which are not planned
well in advance but rather carried out when the opportunity arises are called opportunity
maintenance. Very often, this type of maintenance is carried out when the process
plant/equipment enters in a planned or un-planned shutdown to perform maintenance and
inspection activities. Such defects that are pointed out during operation, but could not be
repaired, are maintained during shutdown.
1.3.2.7 Operator Based Maintenance:
Stephens (2010) reported that in the operator-based maintenance strategy, plant or
equipment operators, with help of formal training from maintenance department, can perform
certain routine maintenance jobs such as house-keeping, equipment cleaning, protection from
Page 32
11
dust, lubrication, routine inspection and routine adjustment as well as simple faults that can
be easily taken care of by the production or operational staff. Telang et al. (2010) reported
that operator driven maintenance strategy closes the gap between operation/production and
maintenance and may help to achieve significant improvement in overall plant and
equipment availability.
1.3.3 Risk
The word “risk” is widely used in the industries. This word is used to represent
various conditions which are considered to be having a negative impact on the operating
companies, such as business risk, economic risk, safety and environmental risk and injury or
fatality risk. Risk is generally analyzed qualitatively or quantitatively. Kaplan and Garrick
(1981) suggested that a qualitative risk analysis tries to answer three fundamental questions
or the “set of triplets idea”:
(1) What can go wrong?
(2) How likely is it to happen?
(3) What will be the consequences if it happens?
Once all the scenarios are covered, these sets of scenarios can be represented as a set
of triplets as shown in the following equation:
(1-1)
Further a quantitative risk is generally defined as the possibility of loss and injury and the
degree of probability of such a loss. In this context, risk can be defined as:
(1-2)
Page 33
12
The result of a quantitative risk analysis produces a number in $ values/unit of time. This
number is used by operating companies to decide their tolerance or acceptance criteria to
meet their target or goal.
1.3.3.1 Failure and reliability function
All equipment, either static or rotating degrades as the time passes or ages in
operation. This degradation may result in a failure of the equipment or system. Generally,
reliability of an equipment or system is defined as the probability that it will perform its
intended function under a specified condition for the specified period of time without failure.
In contrast, the probability that the equipment is in a failed state and unable to perform its
required function is a complement to reliability. Mathematically, this is represented as:
For a given value of t,
(1-3)
where, R(t) is referred to as reliability function, and F(t) is the probability that failure occurs
before time t.
(1-4)
1.3.3.2 Consequence of failure
A failure or breach of containment can lead to various scenarios or hazards which
may produces unwanted outcomes. Typically, in oil and gas or petrochemical industries, fire
(Flash fire, Jet fire, Pool fire, and Fireball), and explosions (Boiling Liquid Expanding Vapor
Explosion (BLEVE), Vapor Cloud Explosion (VCE), and Confined Vapor Cloud Explosion
Page 34
13
(CVCE)), are considered to be major hazards events which may lead to devastated outcomes
for the operating companies. Figure 1-3 briefly represents possible scenarios.
Figure 1-3: Failure consequence modeling
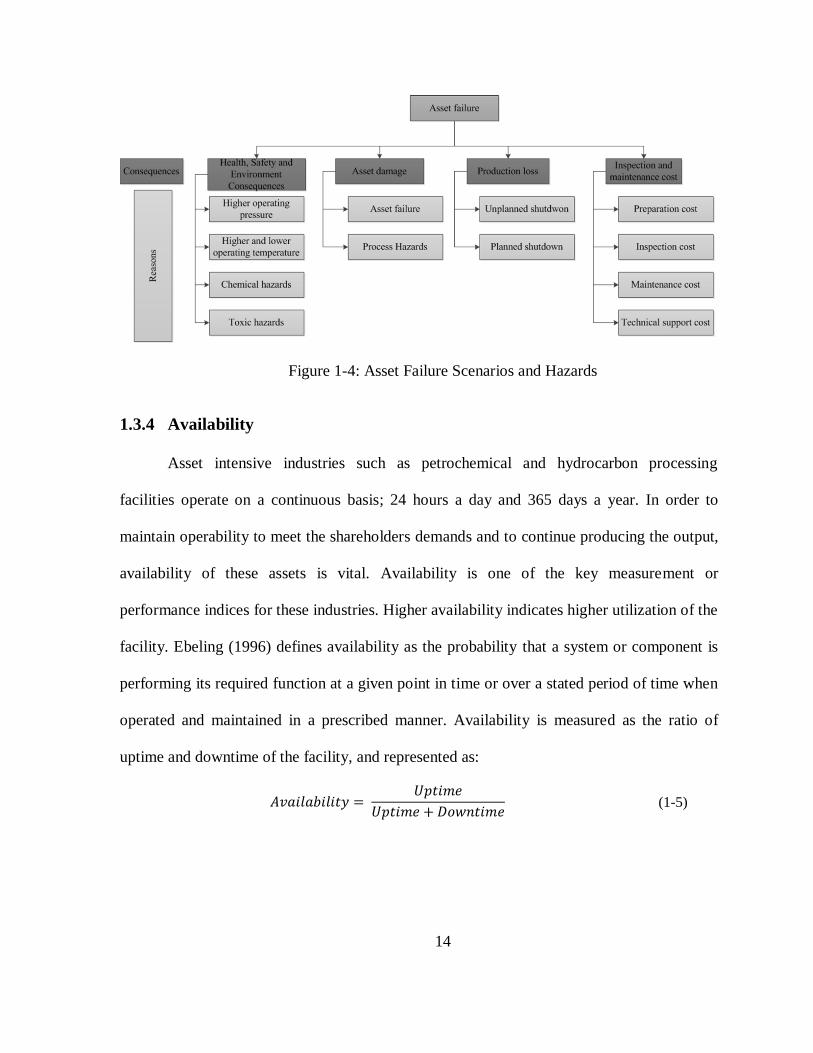
These consequences are estimated in terms of asset damage, production loss, health
safety and environment and various inspection and maintenance costs and measured in $
values as shown in Figure 1-4.
Page 35
14
Figure 1-4: Asset Failure Scenarios and Hazards
1.3.4 Availability
Asset intensive industries such as petrochemical and hydrocarbon processing
facilities operate on a continuous basis; 24 hours a day and 365 days a year. In order to
maintain operability to meet the shareholders demands and to continue producing the output,
availability of these assets is vital. Availability is one of the key measurement or
performance indices for these industries. Higher availability indicates higher utilization of the
facility. Ebeling (1996) defines availability as the probability that a system or component is
performing its required function at a given point in time or over a stated period of time when
operated and maintained in a prescribed manner. Availability is measured as the ratio of
uptime and downtime of the facility, and represented as:
(1-5)
Page 36
15
where, uptime and downtime are generally represented in terms of mean time between failure
(MTBF) and mean time to repair (MTTR). Using MTBF and MTTR, the availability
equation can be represented as:
(1-6)
1.3.5 Risk based Inspection and Maintenance (RBI&M):
Maintenance strategies such as breakdown maintenance, preventive maintenance,
condition monitoring and reliability centered maintenance were the main focus for reducing
maintenance cost and improving plant operational reliability and availability. However, over
the last two decades, a paradigm shift has been observed in which maintenance strategies are
now coupled with the risk associated with the operating plants. A risk-based approach,
compared to a fixed interval (conventional) approach, assesses the failure by considering not
only the likelihood but also the consequences of total shutdown and failure.
1.4 Constraints and Limitations
The proposal is based on a risk-based analysis. Quantification of risk requires having
thorough understanding of equipment or system failure mechanism and failure probability.
To calculate the failure probability of a component, equipment or system, failure data are
required. Failure probabilities are primarily determined using physical plant data, test data,
data banks and from the operating experience of plant personnel. Analyzing data without
knowing the failure mechanism can lead to incorrect results. Depending on the availability of
plant specific numerical data, failure rates can be estimated using the maximum likelihood
Page 37
16
method, Bayesian reliability estimation or from a generic data base, if no raw data are
available for a component. Some available industry databases e.g., Offshore and Onshore
Reliability Data (OREDA) and Process Equipment Reliability Database (PERD), have
documented failure and repair rates for different failure modes. In general, careful
consideration is required in using this data since many of the failure modes are not applicable
to all the processes. In this proposal, failure data for the selected critical equipment will be
adopted from the available data banks, plant specific data as well as expert judgments.
1.5 Thesis Structure
This thesis follows the sequence of objectives as discussed earlier. The Chapter
structure is discussed as follows:
Chapter 1 provides a brief introduction of the relevant terminologies discussed, such
as shutdown and its types, inspection and maintenance and their types, operation
performance measurements such as reliability, availability, and risk. Further,
assumptions, limitations, research objectives are also mentioned.
Chapter 2 discusses a novel framework to estimate risk-based shutdown interval for a
processing facility. This chapter includes a discussion on the introduction of a risk-
matrix for critical equipment selection to develop shutdown interval. Further, failure
and consequence modeling for various failure scenarios is discussed and presented.
Finally an operational risk profile is generated which is used considering the As Low
As Reasonably Practical (ALARP) criteria to establish the shutdown interval. The
proposed framework is applied and discussed to develop shutdown maintenance and
inspection intervals for a gas chilling/liquefaction unit in a LNG processing plant.
Page 38
17
Chapter 3 describes the risk-based methodology to estimate shutdown interval
considering system availability. Shutdown interval using plant availability as a
constraint is discussed using Markov process. Availability of the system is estimated
considering two different system configurations. Probabilities of failure and their
consequences are presented. A novel concept of Mean Shutdown Time (MSDT) is
proposed over the design life of the system, considering that the shutdown is a
planned event in advance to obtain risk-based shutdown interval.
Chapter 4 presents a novel risk-based methodology to estimate shutdown inspection
and maintenance interval by integrating human errors. Probability of human error is
introduced while modeling the system failure. Success Likelihood Methodology
(SLIM) is used to estimate the human error probability (HEP). The proposed
methodology is the extension of the previously published work by the authors to
determine the shutdown interval, considering the system desired availability. The
methodology is used to ensure the practicality of the proposed formulation to the real
industry.
Chapter 5 presents a multi-constrained, bi-objective non-linear maintenance
scheduling optimization using Genetic Algorithm (GA). Further, in this chapter, the
facility is split in to two main categories of equipment which help to develop a well-
planned maintenance, considering planned shutdown and its financial impact. The
benefits of maintenance can only be gained when a reliable performance with high
availability and productivity is sustained without having frequent facility shutdowns.
The two conflicting objectives are: i) the minimization of total expenditures incurred
on maintenance related activities and ii) improving the total reliability of gas
Page 39
18
sweetening unit. Finally a true Pareto-front using plant specific data and employing
Genetic Algorithm Toolbox in MATLAB (Version 2015b) is presented. The
developed approach is applied to construct the maintenance schedule for a processing
facility unit.
Finally, Chapter 6 presents the research conclusions with the key findings, presented
novelties and contributions for the operating facility shutdown management. Further,
possible opportunities to improve the shutdown modeling are also suggested to take
this subject to the next higher level.
Page 40
19
2 CHAPTER 2
A framework to estimate the risk-based shutdown interval
for a processing plant1
Abstract
The proposed framework is a cost effective way to minimize the overall financial risk
for asset inspection and maintenance, while fulfilling safety and availability requirements.
Petrochemical plants and refineries consist of hundreds of pieces of complex equipment and
machinery that run under rigorous operating conditions and are subjected to deterioration,
over a time due to aging, wear, corrosion, erosion, fatigue and other reasons. These devices
operate under extreme operating pressures and temperatures, and any failure may result in
huge financial consequences for the operating company. To minimize the risk and to
maintain operational reliability and availability, companies adopt various maintenance
strategies. Shutdown or turnaround maintenance is one such strategy. In general, shutdown
1 This Chapter is based on the published work in a peer-reviewed journal. Hameed A., &
Khan, F. (2014). “A framework to estimate the risk-based shutdown interval for a processing plant”.
Journal of Loss Prevention in the Process Industries, 32, 18–29. To minimize the duplication, all the
references are listed in the reference list. The contribution of the authors is presented in Section
titled, “Co-authorship Statement”.
Page 41
20
for inspection and maintenance is based on the original equipment manufacturer’s (OEM)
suggested and recommended certain periods. However, this may not be the most optimum
strategy given in which operating conditions may vary significantly from company to
company.
The framework proposed in this work estimates the risk-based shutdown interval for
inspection and maintenance. It provides a tool for maintenance planning and decision making
by considering the probability of the equipment or the system for failure and the likely
consequences that may follow. The novel risk-based approach is compared with the
conventional fixed interval approach. This former approach, characterized as it is by
optimized inspection, maintenance and risk management, leads to extended intervals between
shutdowns. The result is the increase in production and the consequent income of millions of
dollars.
2.1 Introduction
Petrochemical plants and refineries consist of several pieces of equipment and
machinery that are complex and run under rigorous operating conditions. They tend to
deteriorate over time, due to aging, wear, corrosion, erosion, fatigue and other reasons. If the
consequences of a failure are very low, the minimum amount of maintenance activity can be
performed at the time of a failure. However, if the consequences of a failure are very high
and are not addressed in a timely manner, the deterioration of equipment and system may
result in unplanned shutdowns, production losses, higher production costs and in certain
cases serious accidents and environmental issues.
Page 42
21
To keep these losses low by minimizing the deterioration rate associated with time
and operation, companies adopt different maintenance strategies by which to maintain the
safety, reliability and availability of the systems, so that they may continue to operate
smoothly. Shutdown maintenance is one of the maintenance management strategies used in
process plants to improve the plant reliability, availability and integrity. Reliability is very
important for any processing plant given that any equipment failure may result in safety
consequences (e.g., injuries or loss of life and the company’s reputation), financial damages
(e.g., production losses and damages to assets) and environmental consequences. Some of the
planned inspection and maintenance activities cannot be performed if the plant is operational
and require the unit or plant to be in a non-operational state. This category of maintenance is
referred to as shutdown, turnaround or outage maintenance. Lawrence (2012) reported that
refineries and other petrochemical facilities that run continuously must shut down operations
every few years to provide access to production units so that essential maintenance,
modification and inspection work can be carried out. To achieve a predefined operational
reliability goal, companies adopt preventive maintenance strategies based on the original
equipment manufacturer’s suggested fixed intervals of maintenance. However, these
suggested intervals may not be the most optimum maintenance strategy, given that the
operating conditions may vary significantly from company to company. Based on case
studies performed for six major process plants in the United Kingdom, Obiajunwa (2012)
reported that typically power plant shutdown (turnaround) maintenance is planned for every
four years, oil refinery and petrochemical plant shutdown maintenance is planned for every
two years, and chemical, steel, glass and food and beverage plant shutdown maintenance is
planned for every year. Tan and Kramer (1997) reported that a typical refinery experiences
Page 43
22
approximately 10 days of downtime per year due to equipment failures, with an estimated
economic loss of $20,000-$30,000, per hour. Shutdown maintenance is critical to oil and gas
companies as the availability of operating facilities has a major impact on the company’s
profitability through the cost of the event and the revenue loss due to the plant being offline.
The average production losses due to planned shutdowns based on a fixed interval strategy
have a significant financial impact amounting to millions of dollars, which can be minimized
by adopting a risk-based shutdown interval strategy.
If the system deterioration can be modeled, it is possible to predict the time for
failure, and maintenance action can be planned on the basis of the service age and the
anticipated failure time. A risk-based shutdown maintenance interval methodology not only
extends the interval between shutdowns but also produces millions of dollars in savings.
2.2 State-of-the-art on shutdown inspection and maintenance:
In recent years, shutdown maintenance strategies have emerged as a critical
management decision to achieve optimal output for a unit or a plant, while keeping the
overall costs low and maintaining safety and regulatory requirements. In the last two
decades, a paradigm shift (risk-based maintenance strategies) has been observed, in which
maintenance strategies are now coupled with the specific risk associated with the operating
plant. It is likely that this reason that has influenced researchers to focus more on risk-based
maintenance management approaches. Different risk-based maintenance and inspection
approaches are reported in the literature, ranging from the qualitatively ones to the
quantitative ones. Duffua and Daya (2004) reported that shutdown maintenance (also termed
as turnaround maintenance) is a periodic maintenance where plants are shutdown to allow
Page 44
23
time for inspections, repairs, replacements and overhauls, that can be carried out only when
the assets (plant facilities) are taken out of service. During this period, three types of work
are carried out: (1) work on equipment that cannot be performed unless the whole plant is
shutdown, (2) work that requires a lengthy maintenance and a large number of maintenance
personnel and (3) maintenance on defects that are discovered during normal operations but
cannot be repaired. Duffua, Raouf, and Cambell (1999), and Lenahan (1999) both
extensively discussed detailed requirements for shutdown (turnaround) maintenance.
Pokharel and Jiao (2008) reported that if project management practices and the involvement
of external experts and parties are allowed during maintenance projects, then issues in
maintenance projects can be more clearly addressed and the cost and schedule for such a
project can be minimized. Levitt (2004) discussed five phases of shutdown: planning,
initiating, executing, completion and closeout. Duffua et al. (1999), Duffua and Daya (2004),
Lenahan (1999) and Levitt (2004) covered only the management and execution portions of
shutdown and have not addressed the important question regarding shutdown intervals to
improve plant reliability and availability. Zulkipli et al. (2009) reported that the studies
regarding turnaround (shutdown) maintenance are descriptive and highly narrative in nature.
The shutdown (turnaround) event is considered duration-driven, and the frequency is largely
determined by variables such as plant technology, the required level of plant reliability, and
the legal requirements associated with the operation. Ghosh and Roy (2009) proposed
optimizing the maintenance intervals by maximizing the reliability based cost/benefit ratio.
Rusin and Wojaczeck (2012) presented optimization of power machine maintenance intervals
by taking the risk into consideration. Vaurio (1995) presented a procedure for optimizing test
and maintenance intervals for safety related systems and components. This procedure was
Page 45
24
based on minimizing the total plant-level cost and setting an upper bound, on the total
accident frequency (risk). Khan and Haddara (2003) developed a risk-based maintenance
(RBM) strategy interval for periodic preventive maintenance (PM) on key equipment. Khan
and Haddara (2004a, 2004b) applied the risk-based maintenance (RBM) strategies to
offshore oil and gas processing facilities to develop a maintenance plan and extended similar
strategies to an ethylene oxide production plant. Krishnasamy, Khan and Haddara (2005)
proposed a risk based maintenance strategy for a power plant. The strategies listed by Khan
and co-authors are intended to develop an optimized inspection and maintenance program
based on integrating a reliability approach and a risk assessment strategy. The desired end
product is an optimum maintenance schedule that reduces the overall risk for the plants based
on the individual equipment in the plant. However, these methods are deficient in
considering the overall financial impact of plant shutdown on the facility and the frequency
of the maintenance shutdown interval. Tan and Kramer (1997) proposed a general framework
for preventive maintenance optimization that combines Monte Carlo simulations with a
genetic algorithm. When applied to opportunistic maintenance problems, the method
overcomes the demonstrated shortcomings using analytic or Markov techniques in terms of
solution accuracy, versatility and tractability. Duarte, Craveiro, and Trigo (2006) proposed
optimizing the preventive maintenance plans of a series of components to ensure availability
under the assumption that all of the components in the system exhibit a linearly increasing
hazard rate, a constant repair rate and that preventive maintenance returns the system to ‘as
good as new’ condition. Vatn, Hokstand, and Bodsberg (1996) presented an overall model
for maintenance optimization for the components of a production system considering safety,
health, maintenance costs, environment objectives and the cost of lost production. Keshavarz,
Page 46
25
Thodi, and Khan (2011) proposed a risk-based shutdown management strategy for LNG
units. A combination of preventive maintenance, active redundancy and standby redundancy
was considered to achieve an optimized shutdown maintenance strategy. This work failed to
address the equipment selection criteria for the shutdown interval characterization of the
plant, which is a key issue as far as optimizing the shutdown maintenance interval is
concerned. Hadavi (2009) proposed a heuristic single function model incorporating cost, risk
and loss for outage maintenance scheduling optimization. Fujiyama et al. (2004) developed a
risk based maintenance system for steam turbine plants coupled with a quick inspection
system. The objective was to provide a rational basis for life cycle maintenance planning.
Tam, Chan, and Price (2006) reported that in the manufacturing industry, PM is carried out to
minimize the probability of unexpected plant breakdown. Suggested PM intervals are
normally determined by the OEMs. However, they observed that due to the multi-faceted
relationship between the operating context and the production requirements for different
plants, it is unlikely that these OEM suggested intervals are optimized for plant specific
conditions. Additionally, these authors proposed three models to calculate the optimal
maintenance intervals for a multi-component system in a factory with a minimum required
reliability, maximum allowable budget and minimum total cost.
API Recommended Practice 580 (2009) provides guidance to owners, operators, and
designers of pressure-containing equipment, including pressure vessels, process piping,
storage tanks, rotating equipment (with pressure containing components), boilers and heaters,
heat exchangers and pressure-relief devices. API Recommended Practice 581 (2008)
provides quantitative procedures to establish an inspection program using risk-based methods
for pressurized fixed equipment, including pressure vessels, piping, tankage, pressure relief
Page 47
26
devices, heat exchangers, pumps and compressors. In literature, extensive work on inspection
and maintenance modeling is available, however, very limited application is observed related
to the modeling of shutdown for a processing unit or plant. Some of these methods have been
discussed in details in literature to estimate optimal maintenance and inspection interval
considering cost, risk, availability and reliability. However, they all tend to optimize
individual equipment inspection and maintenance cycle. The efforts towards finding an
optimal inspection and maintenance interval is not considered in these studies especially
when it requires the unit or plant to be in non-operational (shutdown) state, from an
operational state for performing inspection and maintenance on the equipment. If an
inspection and maintenance strategy is developed only by giving consideration to individual
equipment reliability and availability point of view, it will have a major impact on the return
on investment for shareholders, lead to higher operating expenses and in some cases result in
loss of market share. The Risk-based Shutdown Inspection and Maintenance Methodology
(RBSIM) proposed in the present work, is a unique quantitative approach which enables us to
find a unit or plant shutdown interval which will provide an optimal inspection and
maintenance interval considering the overall system availability, reliability and risk. The
proposed RBSIM is designed to optimize the plant shutdown interval and maintain a high
level of equipment availability considering the critical equipment from the risk perspective,
while ensuring that the overall financial impact is kept to a minimum, considering the critical
equipment from risk perspective. RBSIM provides an efficient way to select the equipment
based on the risk and direct impact on plant operability to manage assets in comparison to the
individual equipment strategy by efficiently utilizing inspection and maintenance resources
and thus achieve better results with less operating expenses.
Page 48
27
2.3 Risk-based shutdown inspection and maintenance interval (RBSIM)
methodology
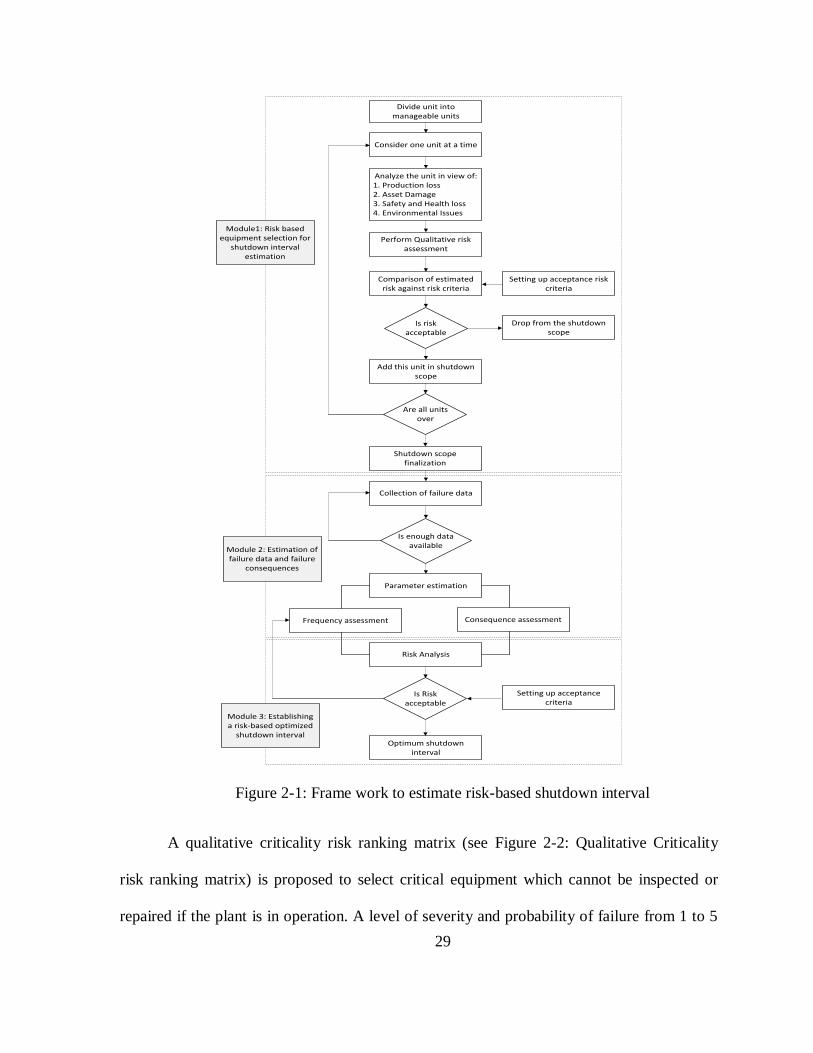
In this study, a framework to establish risk-based shutdown intervals is presented.
This framework is broken down into three main modules, as shown in Figure 2-1:
1. Risk-based equipment selection for shutdown interval estimation
2. Estimation of failure data and failure consequences
3. Establishing a risk-based optimized shutdown interval
2.3.1 Module 1: Risk-based equipment selection for shutdown interval
estimation.
According to Zulkipli et al. (2009) tasks carried out during shutdown maintenance
include overhauls, maintenance, replacement, inspection, tie-ins for plant expansions and
modifications and upgrades. Duffua and Daya (2004) reported that during shutdown
(turnaround), maintenance is performed on that equipment, which necessarily requires that
the whole plant is shutdown and on defects that are discovered during operation that cannot
be repaired or which require a lengthy repair period and a large number of maintenance
personnel.
To estimate the shutdown interval or provide enhancement, the focus must be placed
on equipment failure probabilities that have the most significant impact on system failure. In
a typical operating plant, thousands of pieces of equipment and components are operating. It
is very unlikely that a shutdown interval can be based on all of the equipment. The overall
financial impact of the shutdown for inspection and maintenance activities can be offset by
Page 49
28
reducing excessive equipment selection by removing those pieces that exhibit a lower risk to
reliability, availability and safety.
Process industries such as oil, gas or petrochemical industries are exposed to risk
which relates to financial losses due to losses in production and to operating risks associated
with higher operating pressures, lower temperatures (cryogenic), as well as toxic and
chemical hazards. To avoid or minimize these risks, risk-based equipment selection is
proposed to help estimate the best risk-based shutdown intervals.
This process begins with a qualitative risk-based study for equipment selection in
reference to the imposed risk on the facility and the performance of the equipment. This
module proposes a unique risk assessment strategy to select the critical equipment that
affects the functionality of the system. To achieve this, operating plants need to be divided
into manageable units/systems to identify pertinent equipment or components. To minimize,
the exposed risk to the company, each unit needs to be analyzed, to identify the equipment
with the largest impact on the plant operability, reliability, availability, financial impact (e.g.,
production loss, asset damage due to failure and revenue loss due to shutdown), as well as the
possible impact on safety and the environment. This cycle continues until the whole unit or
plant is analyzed. The output from this qualitative risk assessment is a categorization of the
equipment that exhibits a significant impact on the operability of the unit or plant.
Page 50
29
Divide unit into manageable units
Consider one unit at a time
Analyze the unit in view of:1. Production loss2. Asset Damage3. Safety and Health loss4. Environmental Issues
Perform Qualitative risk assessment
Comparison of estimated risk against risk criteria
Is risk acceptable
Add this unit in shutdown scope
Are all units over
Shutdown scope finalization
Collection of failure data
Is enough data available
Parameter estimation
Frequency assessment Consequence assessment
Risk Analysis
Is Risk acceptable
Setting up acceptance criteria
Optimum shutdown interval
Drop from the shutdown scope
Setting up acceptance risk criteria
Module1: Risk based equipment selection for
shutdown interval estimation
Module 2: Estimation of failure data and failure
consequences
Module 3: Establishing a risk-based optimized
shutdown interval
Figure 2-1: Frame work to estimate risk-based shutdown interval
A qualitative criticality risk ranking matrix (see Figure 2-2: Qualitative Criticality
risk ranking matrix) is proposed to select critical equipment which cannot be inspected or
repaired if the plant is in operation. A level of severity and probability of failure from 1 to 5
Page 51
30
is assigned to each category. For the case of several competing consequences for
equipment/components, the highest observed risk among the consequences should be
considered to be the most critical component.
5
3
Risk Matrix
Failure Frequency
Frequent
Probable
Occasional
Remote
Extremely
Unlikely
M H H H H
L M M H H
L M M M H
L L M M H
L L L L M
Consequence Rating
Asset Damage
Production Loss
Safety/Health
Environment
1 2 3 4 5
Negligible Minor Moderate Major Catastrophic
<5% 5- 10% 10-30% 30-60% >60%
Near miss/
First AidMinor Injury
Injury with
Disability
Permanent
DisabilityFatalities
No
effect
Minor
effect
Moderate
effect
Major
effect
Massive
effect
4
2
1
Figure 2-2: Qualitative Criticality risk ranking matrix
Operational relationships and knowledge regarding various system elements is
required to perform shutdown interval estimation. System failures cannot be evaluated and
improved until it is known that how these various elements affect system operation. A true
representation of these relationships is required for prediction and assessment based on either
cost or risk. Reliability block diagrams are usually used to represent these relationships. For a
system comprising various elements (equipment), reliability diagrams are a good means of
Page 52
31
showing the functional relationship between the elements and providing an indication of the
elements which must operate successfully for the system to accomplish its intended function.
An operating plant may constitute pieces of equipment arranged in series, active redundancy
or standby redundancy. Typical reliability block diagrams are shown below (Figure 2-3 &
Figure 2-4).
Equipment 1 Equipment 2 Equipment 3 Equipment n
Figure 2-3: Block diagram showing equipment acting in series
Equipment 1 Equipment 2 Equipment 2Equipment n
Equipment 1
Equipment m
Figure 2-4: Block diagram showing equipment acting in series/parallel configuration
Furthermore, this study assumes that a piece of equipment/component in standby
arrangement or active redundancy has the full capacity to undergo inspection and
maintenance without requiring, that the operating plant be placed into a non-operational state.
2.3.2 Module 2: Estimation of system failure probability and failure
consequences
A failure of a piece of equipment or a system is defined as its inability to perform its
intended function as per stated procedure in a defined environment. A partial failure may
Page 53
32
result in a reduction of process throughput, whereas a complete failure will stop the entire
process operation. Failures are generally modeled as a stochastic process. A stochastic
process can be defined using a probabilistic method. Ebeling (1997) reported that the
reliability of a piece of equipment or a system is defined as the probability that it will
perform its intended function without failure for a given period of time. The failure of a piece
of equipment or a system is complementary to the reliability and is written mathematically
as:
(2-1)
(2-2)
2.3.2.1 System Failure Probability:
A failure can be modeled using exponential, Weibull, normal or lognormal
probability distributions. However, Weibull distributions provide a more generalized failure
model and often are used in reliability analyses due to this model’s inherent flexibility.
Additionally, Weibull distributions can mimic the behavior of other statistical distributions,
such as normal (for β =3.4) and exponential (for β =1) distributions. A decreasing failure rate
(β<1) corresponds to an early life failure or infant mortality. A constant failure rate (β =1)
suggests that items are failing from random events. An increasing failure rate (β>1) suggests
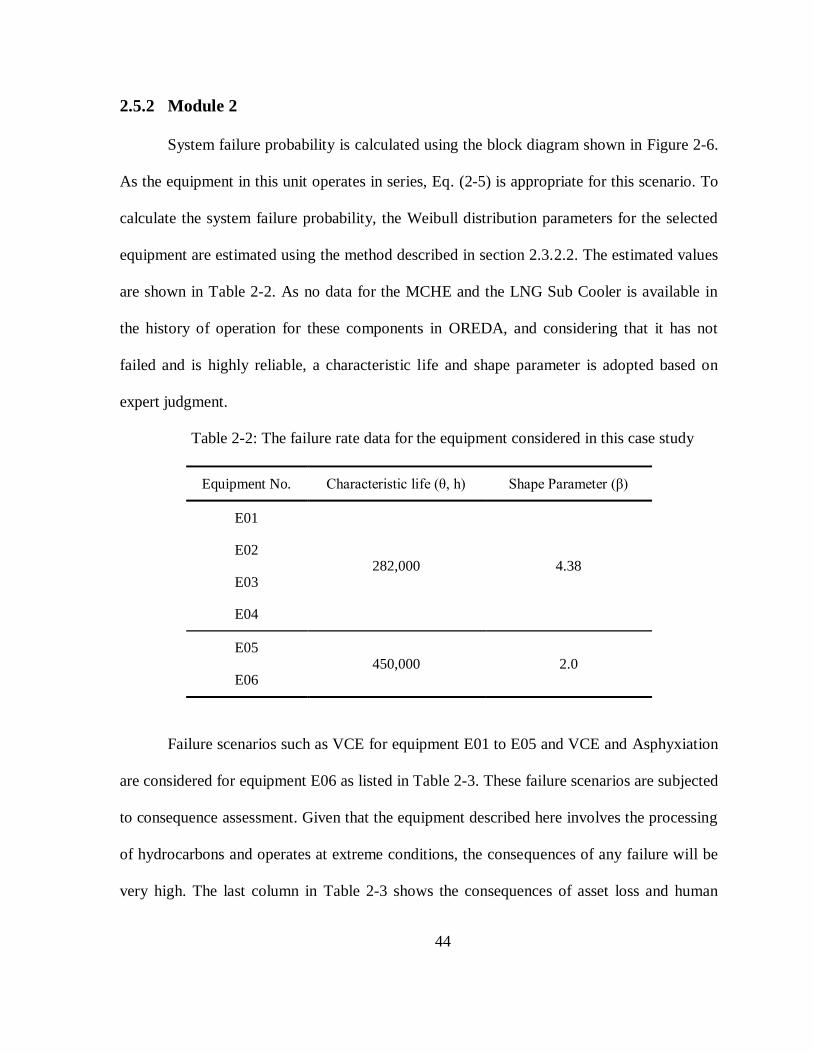
that wear out is occurring and that parts are more likely to fail over time (Ghosh & Roy,
2009). The value of the shape parameter (β) estimated from the failure data provides an
insight into the failure processes of the equipment. This includes reliable operation for certain
durations and when the device enters into the wear out zone. All maintenance activities are
based on this assumption so that action can be taken before any failures occur. It is necessary
Page 54
33
to express the probability of failure for a piece of equipment or a system as a function of time
for risk-based shutdown maintenance and inspection interval estimation. In this study, the
Weibull model with the parameters β and characteristic life (θ) is used to model the time
dependent reliability of the equipment involved in the system. Ebeling (1997) reported that
the reliability of equipment following the Weibull distribution is defined as:
(2-3)
(2-4)
The variable is defined as the reliability of the equipment in a system that has
not had any maintenance or inspection during a time t but is scheduled to undergo inspection
and maintenance during a shutdown. Ebeling (1997) reported that the system failure
probability prior to the shutdown maintenance and inspection is given as:
For a System in a Series Configuration (Figure 2-3):
(2-5)
(2-6)
where i = 1, 2,….., n pieces of equipment acting in series, as shown in Figure 2-3,
and:
For System in Series/Parallel Configuration (Figure 2-4):
Page 55
34
(2-7)
where i = 1, 2…n pieces of equipment acting in series and j=1, 2…m pieces of equipment
acting in parallel, as shown in Figure 2-4.
2.3.2.2 Estimation of failure probability parameters
To calculate the failure probability of a component, equipment or a system, failure
data are required. Noortwijk, Dekker, Cooke, and Mazzuchi (1992) proposed a
comprehensive method to use expert opinion for obtaining the lifetime distributions required
for maintenance optimization. Failure probabilities are primarily determined using physical
plant data, test data, data banks and from the operating experience of plant personnel.
Analyzing data without knowing the failure mechanism can lead to incorrect results. Cizelj,
Mavko, and Kljenak (2001) reported that estimation of a component failure rate depends on
the availability of plant specific numerical data and proposed a new method that explicitly
adds numerical and linguistic information into the assessment of a specific failure rate using
a Bayesian updating approach. Depending on the availability of plant specific numerical data,
failure rates can be estimated using the maximum likelihood method, Bayesian reliability
estimation or from a generic data base if no raw data are available for a component. For this
study, failure data for the selected critical equipment are adopted from the OREDA (2002).
Keshavarz et al. (2011) reported that by using different causes of failure, number of failures,
and demand for equipment reported in OREDA, the reliability of any component may be
calculated in the following way:
(2-8)
Page 56
35
where n is the number of critical failures and N is the demand.
As no information is listed in OREDA on the time of individual failures, it is fair to
assume a constant mean time between failures for any specific cause. A simultaneous
solution of Eq. (2-3) and Eq. (2-4) is used to obtain the distribution parameters β and θ for
any piece of equipment.
2.3.2.3 Economic failure consequences:
Failure modes for process equipment (static or rotating) need to be assessed to
perform inspection and maintenance activities. Maintenance activities can be as simple as
lube oil analysis, lube oil replacement or a complete replacement of a degraded component.
For example, a catastrophic failure of a pump bearing may result in damage to the casing,
ring, impeller, and mechanical seal. A failure of a threaded drain connection due to corrosion
in a process vessel may result in the release of a large amount of hydrocarbons. If a pump
operating in a gas processing plant under extreme pressure or temperature fails
catastrophically and releases hydrocarbons, it may form a vapor cloud and result in an
explosion in the presence of an ignition source. The consequences of these failures are not
only limited to mechanical damage of the equipment but may also cause significant damage
to nearby assets, production loss, serious health and safety issues and environment impacts.
These consequences can be calculated based on the effects of thermal radiation and
overpressure on surrounding equipment and personnel and subsequently converted in the
monetary ($) terms that are assumed to be invariant with time. Improper inspection or
maintenance of processing units may result in severe failure consequences. The purpose of
Page 57
36
risk-based shutdown maintenance and inspection interval modeling is to minimize the
consequences of these failures by reducing the risk associated with deterioration or aging
effects. The total economic consequences of these failures include asset losses, human health
losses, production losses and the cost of maintenance and inspections. Each of these
economic consequences is discussed briefly in the following section.
2.3.2.4 Economic Consequences of Asset Loss (ECAL):
To determine any damage to surrounding assets due to various hazards resulting from
a hydrocarbon release, such as flash fires, jet fires, pool fires, fire balls, VCE, CVCE,
BLEVE, or toxic dispersion in a processing plant, consequence effect zones (m2) in terms of
overpressure level are calculated to establish asset losses. The assessment of consequence
effect zones and their impact involves many models, such as source modeling, dispersion
modeling, fire and explosion models. A large number of computer software packages are
available to perform these types of analyses. However, in this study, an analytical model is
used to calculate overpressure in the effected zones due to an explosion (Crowl & Louvar,
2002) and converted into probability of damage due to overpressure using probit analysis
(Assael & Kakosimos, 2010). The main parameters required to perform these calculations are
operating pressure, temperature, physical and chemical properties, and atmospheric
conditions. Asset loss is estimated for each accident scenario using the following equation:
(2-9)
where PDOP is the probability of damage due to overpressure, EZ is the effected
zone due to overpressure and AD is asset density.
Page 58
37
2.3.2.5 Economic Consequences of Human Health Loss (ECHHL)
The loss of life or pain suffered due to equipment failure or degradation has a severe
impact on the operation of the facility and the operating company’s perception in the eyes of
the public. Although it is difficult to calculate the impact of the loss of life or pain suffered to
one’s family, the cost due to compensation and corporate liability needs be taken into
account in terms of economic consequences, which vary from company to company. Judycki
(1994) of the US Department of Transportation and the Federal Highway Administration
published a technical note relating the injury scale (in terms of severity) to the
comprehensive costs in police-reported crashes. The figures of this previous study are used
hereinto calculate the financial impact on companies for human fatalities or injuries.
Similar to the calculation of asset loss, human health loss is calculated in terms of
dollars for each scenario using the following equation:
(2-10)
where PDOP is the probability of damage due to overpressure, EZ is the effected
zone due to overpressure, PD is population density and CF is cost of injury or fatality.
2.3.2.6 Economic Consequences of Production Loss (ECPL):
The consequences of production loss are the product of downtime and the production
loss volume:
(2-11)
where SDT denotes the shutdown time in days, PL is production loss volume per day
and SP is the selling price of the product per unit volume.
The shutdown time includes the total amount of time, the plant would be out of operation
(from the moment it is stopped to the moment it is again fully operational).
Page 59
38
2.3.2.7 Economic Consequences of Shutdown Inspection and Maintenance Costs
(ECSIM):
Shutdown inspection and maintenance costs include scheduled inspection and
maintenance costs for a group of equipment or components. These costs include the cost of
preparation (scaffolding, insulation removal, blinding, purging, etc.), the cost of inspection
(visual inspection, hydro jetting, eddy current testing, etc.), the cost of maintenance activities
and materials (spare parts, maintenance materials, tools and vehicles associated with
maintenance or inspection jobs), and the cost of technical support.
2.3.2.7.1 Preparation cost:
The preparatory cost can be estimated in the following manner:
(2-12)
where Cp is the preparatory cost ($), Clp is the cost of preparatory maintenance labor
per hour ($/h) and t1 is the duration of the work.
2.3.2.7.2 Inspection cost:
The inspection cost can be estimated with the following equation:
(2-13)
where Ci is the inspection cost ($), Cli is the cost of skilled inspection labor per hour
($/h), Cie is the cost of inspection equipment per hour ($/h), t2 is the duration of the work and
t3 is the duration of the required equipment.
2.3.2.7.3 Maintenance cost:
The maintenance cost can be estimated in the following manner:
Page 60
39
(2-14)
where Cm is the maintenance cost ($), Clm is the cost of skilled maintenance labor per
hour ($/h), Csp is the cost of spare parts consumed and t4 is the duration of the work. The cost
of spare parts includes replacement parts, consumables, internally manufactured parts, parts
sent out for repairs at vendor’s facilities, special equipment and treatments. Spare part cost
can be drawn from the plant warehouse book.
2.3.2.7.4 Technical support cost:
The technical support cost can be estimated with the following equation:
(2-15)
where Cts is the technical support cost ($), Clts is the cost of a technical support
specialist per hour ($/h) and t5 is the duration of the work in hours.
The economic consequences of shutdown inspection and maintenance are the
following:
(2-16)
The total economic consequences of failure are the following:
(2-17)
where i =1, 2, 3………, n is the equipment identified from the criticality matrix and
considered for shutdown interval estimation.
Page 61
40
2.3.3 Module 3: establishing risk-based optimized shutdown inspection and
maintenance interval
The risk-based plant shutdown inspection and maintenance interval optimization
model is a mathematical model in which both the risks and the benefits of maintenance are
quantified in terms of failure probability.
Schon (1980) defined risk as a statement concerning the damage probability
depending on both the frequency of occurrence and the extent of possible expected (either
direct or indirect) damage to all kinds to life and health. The risk may be described by a
suitable combination ( ) of the frequency of occurrence of an undesirable event with the
probable extent of the damage expected upon occurrence. Muhlbauer (2004) wrote that the
most commonly accepted definition of risk is often expressed as the following mathematical
relationship:
(2-18)
(2-19)
(2-20)
Where RISKe is the estimated operational risk, which varies with time because the
probability of failure is a function of time. The objective of this study is to obtain a risk-
based plant shutdown inspection and maintenance interval with an acceptable risk and to
Page 62
41
determine the time at which the estimated risk is equal to the acceptable risk. Thus, Eq.
(2-19) is subject to the following condition:
(2-21)
Acceptable risk is defined as the level of acceptance for shutdown inspection and
maintenance planning purposes. For economic based consequence analysis, the acceptable
risk is defined in terms of the financial limits. Each operating company defines its own
tolerable risk criteria. This risk criterion should be used when making an estimation of risk-
based shutdown interval.
2.4 The application of RBSIM to an onshore processing facility unit
The above-proposed methodology has been used to develop shutdown maintenance
and inspection intervals for a gas chilling/liquefaction unit in a LNG processing plant. The
plant considered in this study employs the AP-XTM
Hybrid liquefaction process, licensed by
Air Products and Chemicals Inc. (APCI). The AP-XTM
process cycle is an improvement on
the C3MR process in that the LNG is sub-cooled using a simple, efficient nitrogen expander
loop rather than a mixed refrigerant. A schematic process flow of this unit is shown in Figure
2-5.
Page 63
42
Figure 2-5: Process flow schematic of a gas chilling/liquefaction unit
2.5 Results & discussions
2.5.1 Module 1
The main purpose of the gas chilling and liquefaction unit is to condense the natural
gas into LNG in the main cryogenic heat exchanger (MCHE) and sub-cool it in the Sub-
cooling Heat Exchanger or the LNG Sub Cooler. The sweetened, dry and lean feed gas from
the LNG recovery unit enters the Gas chilling and liquefaction unit and is chilled by
vaporizing propane refrigerant in the exchangers (high, medium, low, and low-low pressure
level), as shown in the block diagram. The propane vapors generated during chilling are
Page 64
43
returned to the propane compressor via suction drums. After pre-cooling with propane
refrigerant, the feed gas is liquefied in the MCHE, which uses a mixed refrigerant. It is then
sub-cooled in the LNG Sub Cooler, which uses nitrogen as the refrigerant. The proposed risk
matrix is applied to select the critical equipment from gas chilling and liquefaction unit
(Table 2-1). A block diagram of the critical equipment selected for this unit is shown in
Figure 2-6. It is evident that to perform any maintenance and inspections on any of these
equipment, the unit (plant) must be placed in the shutdown mode.
E01 E02 E03 E04 E05 E06
Figure 2-6: Block diagram of the critical equipment selected for a gas chilling/liquefaction
unit
Table 2-1: Critical equipment selected from gas chilling and liquefaction unit
Chilling and Liquefaction Unit:
Equipment No. Description
E01 Feed Gas/HP C3 Exchanger
E02 Feed Gas/MP C3 Exchanger
E03 Feed Gas/LP C3 Exchanger
E04 Feed Gas/LLP C3 Exchanger
E05 Main Cryogenic Heat Exchanger
E06 Sub Cooling Heat Exchanger/ LNG Sub Cooler
Page 65
44
2.5.2 Module 2
System failure probability is calculated using the block diagram shown in Figure 2-6.
As the equipment in this unit operates in series, Eq. (2-5) is appropriate for this scenario. To
calculate the system failure probability, the Weibull distribution parameters for the selected
equipment are estimated using the method described in section 2.3.2.2. The estimated values
are shown in Table 2-2. As no data for the MCHE and the LNG Sub Cooler is available in
the history of operation for these components in OREDA, and considering that it has not
failed and is highly reliable, a characteristic life and shape parameter is adopted based on
expert judgment.
Table 2-2: The failure rate data for the equipment considered in this case study
Equipment No. Characteristic life (θ, h) Shape Parameter (β)
E01
282,000 4.38 E02
E03
E04
E05 450,000 2.0
E06
Failure scenarios such as VCE for equipment E01 to E05 and VCE and Asphyxiation
are considered for equipment E06 as listed in Table 2-3. These failure scenarios are subjected
to consequence assessment. Given that the equipment described here involves the processing
of hydrocarbons and operates at extreme conditions, the consequences of any failure will be
very high. The last column in Table 2-3 shows the consequences of asset loss and human
Page 66
45
health loss at the study point. This clearly shows that these consequences will have a major
financial impact due to asset damages and human injuries or fatalities. Judycki (1994) of the
US Department of Transportation and the Federal Highway Administration published a
technical note relating the injury scale (in terms of severity) to the comprehensive costs in
police-reported crashes. This note is used to calculate the financial impact on companies for
human fatality or injuries.
Page 67
46
Table 2-3: Failure scenarios and their estimated consequences
Equipment
No.
Accident Scenario Accident Scenario Description Consequences of Asset
Loss and Human
Health Loss at study point (all values in
million dollars)
E01
VCE (Vapor Cloud
Explosion)
Release of hydrocarbons from
any of the equipment, which upon finding an ignition source
may result in vapor cloud
explosion, causing shock wave damaging assets and humans.
344.98
E02 307.29
E03 256.40
E04 88.34
E05 284.18
E06 VCE (Vapor Cloud
Explosion) and Asphyxiation
a) Release of hydrocarbons
from the equipment, which upon finding an ignition
source may result in vapor
cloud explosion, causing shock waves damaging assets and
humans.
b) Release of N2 vapors, which
upon physical contact may produce asphyxiation,
resulting in human injuries or
fatalities.
377.76
U.S. Energy Information Administration (2012) has published the LNG price in
$/thousand cubic feet. The same is used in this study to calculate the economic consequences
of production loss.
Page 68
47
2.5.3 Module 3
The estimated results of the consequences and failure probability of a unit are
combined to quantify the operational risk. In general, the acceptable risk will be different
from one company to another. An ALARP for this particular study is assumed to be $100/h.
or lower. Any value higher than this is not acceptable. Given that the considered failure rate
of the selected equipment is time dependent, the operational risk changes over the time
period that the unit is in operation. A comparison of the estimated operational risk with the
acceptable risk helps to determine the optimal shutdown inspection and maintenance
intervals under the considered risk criteria. The optimized risk-based shutdown inspection
and maintenance interval is found to be 23,663 h as shown in Figure 2-7. Estimated
shutdown interval is considered to be an optimal solution under the assumed risk
acceptability criteria. A conventional approach for inspection and maintenance interval based
on the individual equipment does not consider the system unavailability resulting facility
shutdown. Further, the consequences would be much higher with a conventional approach
(based on individual equipment) as it does not consider, the overall facility shutdown,
specifically production loss, leading to a higher risk.
Page 69
48
Figure 2-7: Risk-based shutdown maintenance & inspection interval
2.6 Summary and Conclusions
In this study, a new framework for risk-based shutdown interval estimation for
inspection and maintenance is proposed. The proposed methodology differs from the various
maintenance scheduling methodologies available in the literature in that it considers the
selection of equipment based on the actual risk to which a company may be exposed when
selecting the shutdown interval of a unit or plant for maintenance and inspection. The
methodology is composed of three main modules: (1) risk-based equipment selection for
shutdown interval estimation, (2) estimation of failure data and failure consequences and (3)
establishing the risk-based optimized shutdown interval.
$0
$50
$100
$150
$200
$250
0 5000 10000 15000 20000 25000 30000 35000 40000 45000 50000
RIS
Ke (
$/H
r)
Time (Hours)
Risk-based Shutdown Maintenance & Inspection Interval
Page 70
49
This methodology helps to optimize shutdown intervals for the inspection and
maintenance of a processing unit or plant while considering the exposed risk related to
production, safety and environment. It minimizes the financial consequences for an operating
company due to production loss, loss of assets, safety (e.g., injury or loss of life) and
environmental consequences.
The proposed methodology has been applied to obtain an optimum shutdown interval
for a liquefied natural gas chilling and liquefaction unit, ensuring that the high level of risk is
contained at an acceptable level. Such a shutdown interval optimization approach is expected
to provide a cost-effective maintenance and inspection program and provide better asset and
capital utilization. Estimated shutdown interval for maintenance and inspection are based on
assumed ALARP criteria. As these criteria vary for different operating companies, the
shutdown interval can be increased or decreased accordingly. The proposed RBSIM
methodology can be easily applied to any processing facility, however, proper attention must
be given to identify the most critical equipment which can be inspected or maintained only
when the plant is in the non-operational (shutdown) state. A process plant consists of a large
number of equipment and components which interact together under severe operating
conditions such as high pressure, high and low temperatures and flow, thereby making the
estimation of consequences an uphill task. A risk matrix must reflect a company's risk criteria
as it will differ significantly from those of the other companies. It should ensure that
appropriately experienced personnel from engineering, operations, SHE and the maintenance
team ( with a good understanding of the system, failures, hazards, impact on operations and
the consequences if the inspection and maintenance is delayed beyond a certain period) are
Page 71
50
involved in performing risk assessment. Effective tools and methods should be utilized for
the same. Other essential elements that govern the success of the methodology are:
(1) An appropriate risk matrix that reflects organizational commitment,
(2) Credible risk acceptance criteria developed considering the long term perspectives
such as process safety and business interruption,
(3) An effective data collection protocol to support risk assessment and evaluation of
management strategies, and
(4) Most importantly, safety culture. These non-technical elements require the
unwavering commitment of the senior management.
Page 72
51
3 CHAPTER 3
A risk-based methodology to estimate shutdown interval
considering system availability2
Abstract
This paper presents a risk-based methodology to estimate shutdown inspection and
maintenance interval considering system availability. Most inspection and maintenance
activities are performed when the plant/unit is in the operational state. However, some
inspection and maintenance activities require the plant to be in a non-operational or
shutdown state. In most cases, operating companies adopt a shutdown schedule based on the
original equipment manufacturer’s (OEM) suggested recommended periods. However, this
may not be the best strategy as OEM recommended duration is general and may not reflect
the current state of operation. The proposed methodology is unique in the sense that it
identifies a shutdown interval by identifying the critical equipment in terms of risk
2 This Chapter is based on the published work in a peer-reviewed journal. Abdul Hameed,
Faisal Khan, Salim Ahmed (2015), “A risk-based methodology to estimate shutdown interval
considering system availability,” Process Safety Progress, Volume 34 (3), pages 267-279. To
minimize the duplication, all the references are listed in the reference list. The contribution of the
authors is presented in Section titled, “Co-authorship Statement”.
Page 73
52
considering availability and safety of the operating unit. It optimizes process plant shutdown
interval to minimize the risk (in dollar terms). The Markov process is used to establish the
state diagram to calculate system availability. The proposed methodology is comprised of
three steps namely, risk based equipment selection, shutdown availability modeling of a
complex system using the Markov process and risk-based shutdown inspection and
maintenance interval modeling. It can be applied to process plants such as those for LNG
processing, petrochemicals and refineries. The key elements for the success of the proposed
methodology are the plant specific data and identification of critical equipment.
3.1 Introduction
Inspection and maintenance have evolved from a nonissue into a strategic concern in
a short span of time. Mourbray (1997) reported that over the last few decades, maintenance
has changed more than any other management discipline. The changes are due to a huge
increase in the number and the variety of physical assets (plant, equipment and buildings),
more complex design, new maintenance techniques and changing views on maintenance
organization and responsibilities.
In general, a complex system consists of a large number of interacting components or
equipment that performs the system’s required functions. The system is subject to
periodically or non-periodically planned inspection and maintenance during its life cycle.
The inspection and maintenance actions are generally taken to fix a piece of equipment if it is
found defective and having the potential to fail or to perform preventive maintenance to
avoid any possible failure. In certain cases, these equipment or system cannot be isolated to
perform inspection and maintenance, and this requires the plant to be taken out of service,
Page 74
53
which is known as shutdown or turnaround. Shutdowns are generally classified as sudden or
emergency and non-emergency shutdowns as shown in Figure 3-1. The sudden or emergency
shutdown is an unscheduled event which is initiated in the event of a failure or breach of
containment (such as fire, major spill, instrument failure, power failure, or total loss of
control of chemical or physical processes). Non-emergency shutdowns can be further
classified as planned or unplanned shutdowns. According to Duffuaa & Daya (2004) and
Lawrence (2012), a planned, periodic shut down (total or partial) of a processing unit or
facility is carried out to perform maintenance, overhaul and repair operations and to inspect,
test and replace process materials and equipment. Generally, planning for total shutdown
begins well in advance and involves the departments of procurement, engineering,
maintenance, operations, quality assurance, HSE, security, and administration. An unplanned
shutdown is initiated when a possible failure scenario seems to exist but does not require
immediate stoppage of the operation, and can be delayed for a few weeks. Both planned and
unplanned shutdowns can be total or partial in nature. In extended shutdown a facility is put
in a condition of preservation to prevent degradation over time for future usage. The focus of
this article is on planned shutdown, both total and partial.
Shutdown inspection and maintenance management is one of the maintenance
management strategies used in continuously operating plants to improve plant reliability,
availability and integrity.
Page 75
54
Shtudown
Emergency
Non Emergency
Unplanned
Planned
Partial
Total
Partial
Total
Mothball/Extended
Figure 3-1: Shutdown Classification
Extensive literature is available on inspection and maintenance interval modeling
considering cost, reliability, availability and risk. Inspection and maintenance intervals can
be estimated on equipment by equipment basis. However, in a process plant, a unit or system
consists of hundreds of pieces of equipment that run in continuous mode. Developing an
inspection and maintenance strategy without considering the impact of these inspection and
maintenance cycles over the operability of the plant will not produce an optimum interval.
This problem could be solved by considering a risk-based critical component selection and
by developing an optimized shutdown inspection and maintenance interval for the system.
Risk, reliability and availability are interminably interlinked. Higher risk means lower
reliability and availability, while higher availability means higher reliability and lower risk.
In order to quantify the associated risk to the operating plant due to equipment or component
failures, estimation of consequences is essential. Failure of a complex system results in not
Page 76
55
only the loss of revenue due to production loss but also asset damages, safety and health
issues and inspection and maintenance costs.
Khan et al. (2008) have presented a risk-based methodology to estimate the optimal
inspection and maintenance intervals which maximize a system’s availability by considering
risk-based inspection and maintenance program to reduce the risk of failure and enhance the
overall availability of the system. Sarkar and Behra (2012), Bertolini et al. (2009), Kumar
and Chaturvedi (2008), Zhaoyang et al. (2011) and Wang et al. (2012) proposed that the risk-
based maintenance approach provided a mean to reduce the overall risk when selecting a
maintenance strategy. Neil and Marquez (2012) considered a hybrid Bayesian network
(HBN) framework to model the availability of renewable systems. In this approach, HBNs
were used to model distributions for corrective repair time, logistics delay time and
scheduled maintenance and combine these with time- to-failure distributions to derive system
availability. Jacob and Amari (2005) explored the difficulties in determining reliability and
availability for repairable and non-repairable systems. The analysis is difficult when the
failure distribution is not exponential and becomes even more difficult when the systems are
hybrid and complex rather than only series, parallel or a combination of the two. A binary
decision diagram to calculate a system’s reliability and availability is presented (Jacob &
Amari, 2005). Pil et al. (2008) proposed a concept of reliability assessment of re-liquefaction
systems with focus on redundancy optimization and maintenance strategies based on a time
dependent Markov approach. Penrose (2009) presented a tool for time to failure estimation
for risk-based reporting of condition based maintenance tests and inspections to improve the
effectiveness of the maintenance program by prioritizing corrective action. Khan and
Haddara (2003) proposed a comprehensive and quantitative methodology for risk-based
Page 77
56
maintenance. This methodology comprises of risk estimation module, risk evaluation
module, and maintenance planning module by integrating reliability with safety and
environmental issues and used as a decision tool for preventive maintenance planning. Risk-
based approach has been applied successfully to the maintenance of oil pipelines (Dey et al.,
1998), and Dey (2001). Krishnasamy et al., (2005) applied a risk-based maintenance strategy
in developing cost-effective maintenance policies for critical equipment of a power-
generating plant by reducing the overall risk of the plant. Krishnasamy et al., (2005) reported
that the profitability is closely related to the availability and reliability of the equipment.
Alsyouf (2007) presented a model which enables the decision-makers to trace how an
effective maintenance policy could influence the productivity and profitability through its
direct impact on quality, efficiency and effectiveness of operation. Backlund and Hanu
(2002) reported that risk analysis depends on various factors and therefore the focus must be
put on the function required of the subsystem and equipment. Fujiyama et al. (2004)
developed a risk-based maintenance system for steam turbine plants coupled with a quick
inspection system. The objective was to provide a rational basis for life cycle maintenance
planning. Duffua et al. (1999), Duffua and Daya (2004), Lenahan (1999) and Levitt (2004)
covered only the management and execution portions of shutdown and have not addressed
the important question regarding shutdown intervals to improve plant reliability and
availability. Keshavarz et al. (2011) proposed a risk-based shutdown management strategy
for liquefied natural gas (LNG) units. However, it did not address the equipment selection
criteria for the shutdown interval.
Thus, keeping in view the existing work, the objective of this article is to develop a
risk-based methodology for a continuous processing facility to estimate shutdown interval for
Page 78
57
optimal inspection and maintenance, considering complex system unavailability using the
Markov model. This proposed methodology will provide a rational basis to make a shutdown
interval inspection and maintenance decision considering the availability of the unit or plant
and overall risk exposure.
3.2 A risk-based Shutdown Interval Methodology (RBSIM)
Although extensive work on inspection and maintenance interval estimation modeling
is available in the literature, a very limited number of studies are there on shutdown
inspection and maintenance modeling for a continuous operating facility. Authors such as
Ghosh and Roy (2009), Rusin and Wojaczeck (2012), Vaurio (1995), Khan and Haddara
(2003, 2004a, & 2004b), Krishnasamy et al. (2005), Tan and Kramer (1997), Duarte et al.
(2006) and Vatn et al. (1996) have discussed methods to estimate the optimal maintenance
and inspection interval considering cost, risk, availability and reliability. However, most of
these studies are concerned with optimizing individual equipment inspection and
maintenance cycles. The efforts towards finding an optimal inspection and maintenance
interval is not considered in these studies, especially when it requires a unit or plant to be in
nonoperational (shutdown) state from an operational state. This work has been carried out to
bridge the existing gap in the literature and to provide a means to develop a methodology to
estimate the shutdown inspection and maintenance interval for a continuous processing unit
or plant rather than an inspection and maintenance interval for each piece of equipment. The
proposed methodology to determine risk-based shutdown inspection and maintenance
intervals is presented in the following sections. This framework is broken down into three
main modules as shown in Figure 3-2:
Page 79
58
(a) Module 1: Risk-based selection of critical equipment
(b) Module II: Shutdown availability modeling using the Markov model
(c) Module III: Risk-based shutdown interval estimation
3.2.1 Module 1: Risk-based selection of critical equipment
Duffua and Daya (2004) reported that during shutdown (turnaround), maintenance is
performed on the equipment that cannot be performed unless the whole plant is taken out of
service. In a typical operating plant where thousands of equipment and components are
operating, it is very unlikely that a plant as a whole can be taken offline to perform inspection
and maintenance based on individual equipment. It will have severe financial consequences
due to loss of production. A better approach will be to focus on the selection of equipment
which cannot be inspected or repaired during the plant operation. This will help to reduce the
frequent production losses due to shutdowns of the facility for each individual equipment
inspection and maintenance.
This module proposes a qualitative risk-based study for equipment selection with
reference to the imposed risk on the facility and the performance of the equipment for taking
the plant into shutdown mode. To achieve this, operating units or plants need to be divided
into manageable systems to identify pertinent equipment or components. To minimize the
exposed risk to the company, each unit needs to be analyzed to identify the equipment with
the largest impact on the plant operability, reliability, availability, financial impact (e.g.,
revenue loss due to shutdown, asset damage due to failure, etc.), as well as the possible
impact on safety and the environment. This cycle continues until the whole unit or plant is
analyzed. The output from this qualitative risk assessment is a categorization of the equipm-
Page 80
59
Divide plant/unit into manageable units
Consider one unit/system at a time
Perform risk assessment to select critical equipment
Develop functional block diagram
Setting up acceptance risk criteria
Module1: Risk based selection of critical
equipment
Module 2: Shutdown availability modelling using Markov process
Module 3: Riskbased shutdown interval
Collect failure and repair data
Estimate component failure rate
Estimate component repair rate
Select applicable Markov model (Case I/ Case II)
Estimate system planned failure rate
Select required plant/unit availability constraint
Estimate system failure probability
Estimate system failure consequence
Estimate risk profile
Shutdown interval maintenance planning
Figure 3-2: Risk-based shutdown interval methodology
Page 81
60
-ment that exhibit a significant impact on the operability of unit or plant. API recommended
practice API-580 (2009) provides the basic guidelines to develop a risk matrix. These
guidelines have been used to establish the proposed risk-matrix as shown in Figure 3-3.
According to API-580, (2009) for a qualitative risk analysis, the probability of failure (POF)
may be categorized from one through five. However, it is appropriate to associate an event
frequency with each probability category to provide guidance to determine the probability of
failure as shown in Table 3-1. POF can be assessed separately for each unit, system,
equipment grouping or individual equipment item. Similarly, consequences are represented
in monetary terms ($) as shown in Table 3-2.
Schon (1980) defined risk as a statement concerning the damage probability
depending on both the frequency of occurrence and the extent of possible expected (either
direct or indirect) damage to all kinds. The risk R, may be described by a suitable
combination (×) of the frequency of occurrence of an undesirable event with the probable
extent of the damage expected upon occurrence. Using the above definition, the risks
associated with safety and health ( , production loss asset loss (
and environment can be calculated. For the case of several competing consequences
for equipment/components, the highest observed risk among the consequences should be
considered. The outcome of this risk assessment will enable the selection of the most critical
set of equipment that may result in functional failure of a unit or a system and will require to
go for shutdown inspection and maintenance. Overall risk can be selected using Eq. (3-1):
(3-1)
Page 82
61
5
3
Risk Matrix
Failure Frequency
Frequent
Probable
Occasional
Remote
Extremely
Unlikely
M H H H H
L M M H H
L M M M H
L L M M H
L L L L M
Consequence Rating
Asset Damage
Production Loss
(DT in Hrs.)
Safety/Health
Environment
1 2 3 4 5
Negligible Minor Moderate Major Catastrophic
DT<X DT>X<X1 DT>X1<X2 DT>X2<X3 DT>X3
Near miss/
First AidMinor Injury
Injury with
Disability
Permanent
DisabilityFatalities
No
effect
Minor
effect
Moderate
effect
Major
effect
Massive
effect
4
2
1
Figure 3-3: Qualitative criticality risk ranking matrix
Table 3-1: Five levels of probability of failure
Possible qualitative rank Annual failure probability or
frequency
Frequent >0.1
Probable 0.001 to 0.01
Occasional 0.0001 to 0.001
Remote 0.00001 to 0.0001
Extremely Unlikely <0.000001
Page 83
62
Table 3-2: Five level consequence table
Possible qualitative rank Economic loss range
Negligible EL<$10,000
Minor $10,000<EL≤$100,000
Moderate $100,000<EL≤$1,000,000
Major $1,000,000<EL≤$10,000,000
Catastrophic EL>$10,000,000
3.2.2 Module II – Shutdown availability modeling using the Markov process
In the life cycle of a plant, a component or a system, the duration for which it works
can be defined as operational state with duration “d” until it undergoes into a fail or repair
state. This leads to unavailability of the system which is generally referred to as unplanned
shutdown. The component or system remains in the nonoperational state until a repair is
completed with duration “r” and it starts delivering its intended function. This cycle of
operation and shutdown continues throughout the lifetime of the component or system and
can be represented as shown in Figure 3-4. An alternative approach is a planned cycle of
inspection and maintenance of the systems, which cannot be inspected or maintained while in
operation.
Availability of a component or a system is one of the most important measures to
analyze its performance. Since availability is a probability, the rule of probability theory may
be applied to compute the system availability from the knowledge of component or system
availability. Markov analysis looks at a system as being in one of several states. One possible
Page 84
63
state, for example, is that in which all the components comprising the system are in
operation. Another possible state is that in which one component has failed but the other
components continue to work. A third possible scenario is that a component failure leads to
system failure. Markov model can be extended to the repairable component or system
assuming that both the failure rate and repair rate are constant (exponential distribution). A
majority of the components or systems in a process facility can often be modeled using a two
state Markov process. For example, the simplest case for determining the steady state
availability is a single component system that has a failure rate (λ) and a repair rate (μ).
Assume that the system will be in either one of the two possible states, Operational state (1)
or Shutdown state (2) under repair or failed condition. This can be represented using a
transition rate diagram as shown in Figure 3-5:
Figure 3-4: Operational and shutdown state of a repairable system
Operational State
(1)
Shutdown State
(2)
λ
μ
Figure 3-5: Markov state space diagram of a single component repairable system
Page 85
64
Simple equipment is designed to perform few basic functions and is typically exposed
to only one possible failure mode. However, a complex system performs multiple functions
and consists of a number of items that can fail. Nowlan and Heap (1978) have reported that
six different failure patterns exist as shown in Figure 3-6. NASA (2000) reported that random
failures accounted for 77-92% of the total failures and age related failure characteristics
accounted for the remaining 8-23% failures. Since 77-92% of the failures seem to follow
constant failure rate, it is fair to assume the exponential distribution while modeling the
availability of complex systems.
Figure 3-6: Illustration of failure patterns (redrawn after Nowlan and Heap, 1978)
Considering that 77-92% of the failures are random in nature (exponential
distribution), Markov process can be extended to the complex system. Steady-state
availability can be calculated using the Markov rate diagram. Steady state equations may be
written for each state i on the basis of a general relationship as given in Eq. (3-2).
Type E = 4%
Type A = 2% Type F = 5%
Type C = 7%
Type D = 14%
Time
Type B = 68%
Fai
lure
rat
e
rat
e
Page 86
65
(3-2)
Letting Pi be the probability of being in state i and Pj in state j, the steady state
equation can be written to calculate the availability or unavailability of the system. In
general, the summation of all state probabilities remains equal to 1 as shown in Eq. (3-3).
(3-3)
In the life cycle of a process plant, a system can be in the state of unplanned
shutdown for repair due to the failure which has already happened or in a planned shutdown
to perform the inspection and maintenance activities to improve the availability and
reliability. The parameters of the distributions for unplanned shutdown can be estimated from
failure data over the life cycle of the plant. If a planned shutdown is treated as a random
event then the state space diagram for an unplanned shutdown and a planned shutdown can
be modeled under two scenarios namely Case I and Case II.
3.2.2.1 Case I
Complex industries consist of multiple equipment configurations. These arrangements can be
either full standby or active redundant. Full stand by and active redundant configurations
provide contingency to the operation of the facility in case of any unforeseen failure and help
to avoid the unplanned shutdown. In a standby system, the primary unit is in operation while
the other units are in standby. If repair of the primary unit is feasible when it is in failed state,
the system will continue to operate as long as the backup unit has not failed. If the primary
unit is restored before the back-up unit fails, then from the operational perspective no
Page 87
66
unplanned shutdown situation arises. Standby systems are generally much more reliable than
the active redundant systems. In the case of a parallel or redundant system, system failure
will only happen when all of the redundant systems have failed. If one or more of the units
are operational, the system continues to operate. Generally, in a complex system, standby or
redundancy features are designed to take 100% load of the production. If in both of these
configurations, the primary failed equipment is not restored before the operating equipment
fails, then the system will enter into an unplanned shutdown state. This situation is modeled
as Case I and the corresponding state space diagram is shown in Figure 3-7. In Figure 3-7, λ
and μ represents the transition rate for different system states.
Applying the Markov method to the state space diagram, system availability can be
calculated as follows:
(3-4)
where
(3-5)
where, and represents system in unplanned shutdown mode and in planned
shutdown mode.
For simplicity, it is assumed that µ1 = µ2 = µ3 = R, then the system availability (A) and
unavailability (Q) can be defined as:
(3-6)
Assuming that in an ideal case, failure rate is higher in the degraded as compared to
the normal operation, Eq. (3-7) can be simplified as,
(3-7)
Page 88
67
1
24
3
μ3
μ2
μ1
λ1
λ2
λ3
Figure 3-7: State space diagram of an unplanned and planned shutdown for system
with redundancy
State System condition
1 System in operation mode
2 System in operation mode with back-up unit
3 System in unplanned shutdown mode
4 System in planned shutdown mode
and thus, the expression for Q gets modified as:
(3-8)
Page 89
68
3.2.2.2 Case II
Another possible scenario is that the systems are designed with no redundancy or
standby. In this situation a failure of any equipment or component will lead to unplanned
shutdown. Figure 3-8 shows the state space diagram for this type of a system configuration.
1
23
μ2
μ1
λ1
λ2
Figure 3-8: State space diagram of an unplanned and planned shutdown for system
with no redundancy
State System condition
1 System in operation mode
2 System in unplanned shutdown mode
3 System in planned shutdown mode
Applying the Markov method to the state space diagram, system unavailability can be
calculated as:
(3-9)
(3-10)
Page 90
69
(3-11)
where Q is the system unavailability. The availability of the system can be calculated
using Eq. (3-4).
3.2.2.3 System Failure Rate
A complex system may fail through various means resulting from different physical
phenomena or different failure characteristics of individual components which may lead to an
unplanned shutdown. A useful analysis approach in reliability engineering is to separate
these failures according to the mechanism or components causing the failure. These
categories of failures are then referred to as failure modes. Ebeling (1997) has defined that if
λi (t) be the failure rate function for the ith failure mode then, assuming independence among
the failure modes, the system failure rate is obtained as:
(3-12)
In case of a series-parallel combined system, the system failure rate can be calculated
by breaking the network into series and parallel configurations. Mannan (2005) reported that
if the failure rate of a component is constant, λ, then in the parallel configuration, the failure
rate can be estimated using Eq. (3-13):
(3-13)
Overall system failure rate for series-parallel configuration may be obtained by Eq. (3-14):
Page 91
70
(3-14)
where, the term represents the failure rate of the components acting in series
and represents the failure rate of the parallel configuration..
3.2.2.4 System Repair Rate
System repair time is generally represented as the function of the repair times of the
components. An average (mean) system repair time can be calculated by using the
knowledge of the mean subsystem or component repair time. For a complex system
comprising many subsystems or components, the mean time to repair depends on the repair
time distribution of each of the subsystems or components such as electrical, hydraulic,
mechanical and so on. Ebeling (1997) defined that the system mean time to repair (MTTR)
may be computed as a weighted average of the subsystem MTTRs in which the weights are
based on the relative number of failures and can be represented as:
(3-15)
where MTTRi is the mean time to repair the ith unique subsystem, fi is the expected
number of failures of the ith unique subsystem over the system design life, and qi is the
number of identical subsystems of type i.
3.2.3 Module III – Risk-Based Shutdown Interval Estimation
Muhlbauer (2004) presented the most commonly accepted definition of risk, often
expressed mathematically as:
Page 92
71
, (3-16)
However, in this paper, risk is defined as the POF of a system or component to
deliver its intended function in a given time-frame under a given operating context and the
overall consequences in monetary ($) values. The two components of the risk can be
quantitatively expressed as:
,
(3-17)
Since the risk is a combination of probability and the consequence, one needs to
consider all possible consequences, including safety and health, operational and non-
operational consequences. Estimation of failure probability and the consequences are
discussed below.
3.2.3.1 Estimation of System Failure Probability
In general, operating companies keenly focus on targeting to maintain the desired
availability to achieve their operational goal. Considering the process plant targeted
availability, and using this as a constraint in the Markov model (as discussed in Case I and
II), system failure rate can be estimated. This planned failure rate will help to achieve the
required availability of the unit or plant and minimize the overall exposure of the risk to
operating companies. Since the system failure probability is a function of failure rate and is
complementary to the reliability of the system, mathematically it can be written as:
(3-18)
where t is the failure time of the system on or before a time
Page 93
72
3.2.3.2 Estimation of the Economic Consequences of Shutdown
Generally, process plants run under extreme operating conditions such as high
pressures and temperatures. Improper inspection and maintenance of processing equipment
may result in damage to the casing, ring, impeller, and mechanical seal of rotating
equipment. These in turn can lead to failure modes which can have a severe impact on the
safety and health of the people. For example, a catastrophic failure of a pump bearing
operating in a gas processing plant or refinery may release hydrocarbons, which may form a
vapor cloud and result in an explosion in the presence of an ignition source. The
consequences of a failure are not only localized to mechanical damage of the equipment
itself; it can cause significant damages to nearby assets, as well as result in operational loss,
serious safety and health issues, adverse environmental impact and inspection and
maintenance cost. These consequences can be calculated based on the effects of thermal
radiation and overpressure on surrounding equipment and personnel and subsequently
converted in monetary ($) terms. Each of these economic consequences is discussed briefly
in the following section.
3.2.3.2.1 Economic Consequence of Asset Loss (ECAL)
A failure of processing equipment may lead to various hazards resulting from the
release of materials and energy. For example, a hydrocarbon release may result in flash fires,
jet fires, pool fires, BLEVE, fire balls, VCE or toxic dispersion in a process plant.
Consequence effect zones (m2) for such hazards can be calculated in terms of overpressure to
establish asset losses. The assessment of the consequence effect zones and their impact
involves many models. These include source models, dispersion models, fire models and
Page 94
73
explosion models. A large number of computer software packages are available to perform
these types of analyses. The main parameters required to perform these calculations are
operating pressure, temperature, physical and chemical properties, and atmospheric
conditions. In cases of flash fire, jet fire, pool fire and BLEVE, asset damage due to heat flux
can be calculated and converted into POF of various damage effects using the probit analysis
((Assael & Kakosimos, 2010), & (Crowl & Louvar, 2002)). Asset damage can be estimated
for each accident scenario using the following equation:
(3-19)
where, i represents the various possible scenarios, is the probability of damage
due to heatflux in the effected zones and is the asset density.
In the case of explosion, asset damage due to overpressure can be calculated and
converted into POF due to overpressure using the probit analysis ((Assael & Kakosimos,
2010), & (Crowl & Louvar, 2002)). Asset damage can be estimated for this scenario using
the following equation:
(3-20)
where is the probability of damage due to overpressure, is the effected zone
due to overpressure and is asset density.
3.2.3.2.2 Economic Consequence of Human Health Loss (ECHHL)
In cases of flash fire, jet fire, pool fire and BLEVE, probability of injury or death due
to fire effects can be calculated for a given heat flux at a specified effected zone and which
can be converted into probability of injury or death using the probit analysis ((Assael &
Page 95
74
Kakosimos, 2010), & (Crowl & Louvar, 2002)). ECHHL can be estimated for each accident
scenario using the following equation:
(3-21)
where, i represents the various possible scenarios, is the probability of injury or
death due to heatflux in the effected zones , is the population density and is the cost of
injury or fatality.
In the case of explosion, human health losses such as injuries and fatalities due to
overpressure can be calculated and converted into probability of damage due to overpressure
using the probit analysis ((Assael & Kakosimos, 2010), & (Crowl & Louvar, 2002)).
Economic consequence of human health loss can be estimated for each accident scenario
using the following equation:
(3-22)
where, is the probability of damage due to overpressure, is the effected
zone due to overpressure, is population density and is cost of injury or fatality.
The loss of life or pain suffered due to equipment failure is difficult to calculate in
monetary value. However, the cost due to compensation and corporate liability needs be
taken into account in terms of economic consequences, which vary for operating companies.
Judycki (1994) of the US Department of Transportation and the Federal Highway
Administration published a technical note relating the injury scale (in terms of severity) to
the comprehensive costs in police-reported crashes. The figures of this study are used herein
to calculate financial impact on companies for human fatality or injuries.
Page 96
75
3.2.3.2.3 Production Loss
One of the most important operational consequences is the production loss due to
unavailability of the asset to perform its function. Production loss due to plant being taken
into a planned shutdown is one of the major negative financial impacts on the operating
companies. The loss due to the non-production of the desired product is directly linked to the
inspection and maintenance duration and frequency over the life of the asset. Production loss
is the function of the number of unit loss, selling price/unit and the amount of duration the
system is out for inspection and service. In general, the reported MTTR does not cover all the
factors which contribute in getting the actual repair duration. To overcome this shortfall and
to have a better estimation of the production loss, in this paper a Mean Shutdown Time
(MSDT) is proposed over the design life of the system or unit considering that the shutdown is
a planned event in advance and the factors related to material supply delay and any
uncertainty in supply are negligible.
It can be defined as:
(3-23)
where,
MTTR is the mean time to repair, td is design life of the plant or unit, TSD is shutdown
interval and MSDT is Shutdown duration considering preparation, inspection and
maintenance actions.
In the case of exponential distribution, m is replaced with λsys.
Hence, the operational consequence due to production loss can be represented
mathematically as:
Page 97
76
EC (3-24)
where, denotes the mean shutdown maintenance time in days, PL is production
loss volume per day and SP is the selling price of the product per unit volume.
3.2.3.2.4 Inspection and Maintenance Cost
Planned inspection and maintenance cost can be classified as a nonoperational
consequence. This cost includes the cost of preparation (scaffolding, insulation removal,
blinding, purging), cost of inspection (visual inspection, hydro jetting, eddy current testing,
etc.,) and the cost of maintenance activities and materials (spare parts, maintenance materials,
tools and vehicles associated with maintenance or inspection jobs), and the cost of technical
support. These costs can be calculated using the following equations:
(3-25)
(3-26)
(3-27)
(3-28)
(3-29)
Where, Cp is the preparatory cost, Clp is the cost of preparatory maintenance labor per
hour ($/Hr.), tp is the duration of the preparatory work, Ci is the inspection cost, Cli is the cost
of skilled inspection labor per hour ($/Hr.), Cie is cost of inspection equipment per hour
($/Hr.), ti is the duration of inspection work, Cm is the maintenance cost, Clm is the cost of
skilled maintenance labor per hour ($/Hr.), Csp is the cost of spare parts consumed, tm is the
Page 98
77
duration of maintenance work, Cts is the technical support cost, Clts is the cost of a technical
support specialist per hour ($/Hr.) and t is the duration of technical support work in hours.
The total economic consequences of shutdown are the following:
,
(3-30)
where, i = 1, 2, 3………n is the equipment identified from the criticality matrix and
considered for shutdown interval estimation.
A risk-based approach not only helps to make an optimized decision to bring a process
plant or unit in a shutdown mode for inspection and maintenance but also assists in
determining an optimized shutdown inspection and maintenance interval. The concept of
risk-based inspection and maintenance optimization is generally accepted and applied in
petrochemical and process industries. However, it has not been used to optimize the
shutdown inspection and maintenance interval.
3.3 The Application of RBSIM to a LNG Processing Facility
Alabdulkarem et al. (2011) have reported that LNG plants are increasing in number
due to the growing demand for natural gas (NG). NG is the cleanest of the fossil fuels. LNG
is produced by the liquefaction of NG from the atmospheric temperature to -160 oC.
Different NG liquefaction cycles exist that use either pure refrigerant in cascade cycles,
multi-pressure cycles, or mixed refrigerant (MR) cycles. Mokhateb and Economides (2006)
reported that the Air Products and Chemicals, Inc. (APCI) licensed Propane Precooled MR
process has dominated the market since 1970 and accounts for a significant proportion of the
world's base load LNG production capacity.
Page 99
78
Alabdulkarem et al. (2011) reported that about 77% of LNG plants are using the
propane pre-cooled MultiComponent Refrigerant cycle licensed by APCI for NG
liquefaction. Roberts et al. (2002) reported that in response to continuing producer demand
for increased LNG train capacity, APCI has developed the AP-XTM
LNG Process. The AP-
XTM
process is a hybrid of a C3-MR cycle for precooling and liquefying LNG and a nitrogen
gas compressor-expander cycle for subcooling LNG. In the AP-X™ process, the warmer
LNG is subcooled to storage temperature by a gaseous nitrogen refrigerant in the same
compression/expansion cycle that has been used for years to liquefy oxygen, nitrogen, and
for peak-shaver NG liquefiers. Similar to the traditional C3MR process, propane is used to
provide cooling to a temperature of approximately -30 °C. The feed is then cooled and
liquefied by MR, exiting the Main Cryogenic Heat Exchanger (MCHE) at a temperature of
approximately -120 °C. Final subcooling of the LNG is performed using cold gaseous
nitrogen from the nitrogen expander. The proposed methodology is applied to a LNG facility.
Figure 3-9 shows a general equipment layout for the liquefaction and subcooling sections of
an AP-X™ LNG train. Coil wound heat exchangers are used to liquefy and subcool the LNG,
while the nitrogen economizer uses brazed aluminum plate fin heat exchangers.
Page 100
79
Figure 3-9: Air Products AP-X™ process (redrawn after Roberts et al. 2002)
The described methodology can be extended to other production processes as well.
However, the risk matrix should be re-evaluated accordingly for equipment selection.
3.3.1 Module I: Risk-based Selection of Critical Equipment
In this application, the methodology discussed earlier is applied to a section of the
refrigeration unit of one of the LNG liquefaction processing plants. The main purpose of the
refrigeration unit in a liquefaction processing plant is to supply various refrigerants to
condense the NG into LNG. As a by-product, the exhaust gas from the gas turbine is routed
through a heat recovery system where high pressure steam is produced. The refrigeration unit
Page 101
80
is composed of three major systems viz., the propane refrigeration system, the MR system
and the nitrogen refrigeration system. The propane system primarily provides chilling for the
feed circuit and the MR system. The MR system provides low temperature refrigeration to
produce LNG in the MCHE. Finally the nitrogen system subcools the LNG in the Sub-
cooling Heat Exchanger. The propane refrigeration system consists of propane compression,
water-cooled condensers and subcoolers. The heart of the system is a gas turbine with a
starter, helper and/or generator which drives the compressors. The MR comprises a mixture
of hydrocarbon (methane, ethane and propane) and nitrogen. The system is composed of a
numbers (varies design-wise) of compressors, turbine, water cooled and propane cooled heat
exchangers, suction drums and separators. The nitrogen refrigeration system consists of
compressor, water-cooled inter-coolers and exchangers. Equipment criticality analysis helps
to evaluate how failures of these equipment impact the performance of assets and is used to
prioritize equipment selection for inspection and maintenance. Module I of the presented
methodology describes the critical equipment selection using the risk matrix. The proposed
risk assessment not only helps to evaluate and select the critical equipment for shutdown
inspection and maintenance availability modeling (by considering its influence on the plant
or unit) but also to determine the risk associated if the inspection and maintenance interval
cycle is delayed beyond the manageable duration. Equipment categorization using this
methodology helps to identify the critical equipment and their interaction for unit or plant
availability. The outcome of this qualitative risk evaluation is the classification of the
equipment with a risk prioritization number. For example, if an equipment is identified
having as high probability (frequent = 5) and higher production loss (extreme= 5), the risk
number is 25. Similarly the other risk factors can be estimated. In the case of multiple risk
Page 102
81
numbers, the higher risk number is considered for the equipment. This process is continued
until all of the equipment in the unit is evaluated. In case, if the POF is low but has a higher
consequence impact on HSE, the equipment is selected as critical. The selected critical
equipment is used to develop the functional block diagram to model the shutdown
availability. The block diagram helps to select the best Markov model for system availability
estimation. A total of 12 equipment are identified to be critical for the considered unit which
can have a severe financial impact on the operability of the unit. These equipment are listed
in Table 3-3. The block diagram is shown in Figure 3-10, which is based on the selected
equipment.
Table 3-3: Critical selected equipment for MR unit
Tag Equipment description
MR1 Accumulator
LSD1 Suction Drum
LC1 Compressor
LPA1 Compressor After-cooler
MSD1 Suction Drum
MC1 Compressor
MPA1 Compressor After-cooler
HSD1 Suction Drum
HC1 Compressor
HPA1 Compressor After-cooler
GT1 Gas Turbine
HM1 Starter/Helper/Generator Motor
Page 103
82
MR1 LSD1 LC1 LPA1 MSD1 MC1
MPA1 HSD1 HC1 HPA1 GT1 HM1
Figure 3-10: Block diagram of critical selected equipment for MR unit
3.3.2 Module II: System Availability Modeling using Markov Process
The developed block diagram in Module I will help to select the Markov model to
estimate the planned system failure rate for inspection and maintenance under the considered
availability constraint. It is evident from the block diagram that a failure of any of the
selected equipment will lead to complete system failure which will produce an undesired
shutdown of the plant. Thus, any inspection and maintenance plan should consider these
critical equipment to perform a risk-based shutdown inspection and maintenance interval. In
order to estimate the planned shutdown failure rate considering the required unit availability,
failure rate and repair rate data are of primary importance. Failure and repair rates of a
system are primarily determined using plant historical data, test data, data banks, and/or from
the operating experience of plant personnel using expert judgment. In case if failure specific
data are not available, theoretical approaches published by Cizelj et al. (2001) can also be
used. For this study, failure and repair data for the selected critical equipment are either
adopted from the OREDA (2002) or help has been sought from qualified plant personnel
based on their technical judgment for repair data. Table 3-4 shows the failure rate and repair
rate data considered for this study. Eq. (3-8) and Eq. (3-11) of the proposed Markov model
Page 104
83
discussed in Module II are used to estimate the system planned shutdown failure rate which
will help to achieve the desired availability target. The estimated value is shown in Table 3-5.
Table 3-4: Critical selected equipment failure and repair data
Equipment description Failure rate (λ) Repair rate (μ)
Accumulator 1.141Х10-6
0.0208
Suction Drum 1.141Х10-6
0.0208
Compressor 2.314Х10-6
0.0027
Compressor After-cooler 1.141Х10-6
0.0208
Gas Turbine 2.283Х10-5
0.0208
Starter/Helper/Generator Motor 3.805Х10-6
0.0138
Table 3-5: Estimated system failure and repair rates
Availability Constraints 0.98
Estimated system failure rate 4.157X10⁻⁵
Using Eq. (3-12)
Estimated system repair rate 0.0097 Using Eq. (3-13)
Estimated planned shutdown failure rate 0.00016 Using Eq. (3-9)
3.3.3 Module III: Risk-Based Shutdown Interval
Module III of the proposed methodology consists of three parts viz. estimating system
failure probability, all possible consequences due to process unit shutdown, and finally
developing a risk profile to find the optimal shutdown inspection and maintenance interval. A
system failure probability is a function of time and failure rate, which can be modeled using
Page 105
84
exponential, Weibull, normal or lognormal distribution. In order to apply Markov availability
model system failure probability is calculated using the exponential distribution as discussed
in Module II. The estimated value of exponential distribution parameter is shown in Table
3-5. Thus, the system failure probability function can be written using Eq. (3-17) as follows:
(3-31)
Given the fact that the equipment described here involves the processing of
hydrocarbons and operates at extreme conditions, the consequences of any failure will be
very high. The failure scenario considered for estimating the asset loss and human health loss
for these equipment is the release of hydrocarbons, which upon finding an ignition source
may result in explosion that could generates shock waves. These shock waves may cause
serious asset damage as well as human injuries or fatality. Calculated shock waves are then
transformed into probability of damage due to shock waves for various effected zones. In this
particular scenario, estimated consequence is based on a radius of 200m. It is important to
note that the loss of life or injury suffered by the people is hard to estimate in monetary
value. However, the cost associated with the compensation and corporate liability needs to be
taken into account in consequence analysis. In this regard, a published note from Judycki
(1994) of the US Department of Transportation and the Federal Highway Administration
relating the injury scale (in terms of severity) to the comprehensive costs in police-reported
crashes is used. Production loss is estimated using Eq. (3-23), and an average of 10 days is
considered for MSDT. The U.S. Energy Information Administration (2012) published the
LNG price in $/thousand cubic feet. The same is used in this study to calculate the economic
consequences of production loss. The total calculated consequence along with Eq. (3-29) is
Page 106
85
used to generate the expected risk profile to determine the optimal inspection and
maintenance intervals. Figure 3-11, shows the obtained risk profile to achieve the optimal
planned shutdown inspection and maintenance interval. This risk profile will enable the
achievement of a desired level of availability (98%) for the system considered while meeting
the risk exposure to the lowest level. The lowest risk point will give an optimum shutdown
interval; in this case it is estimated to be 13000 h. It is evident that by performing a risk-
based planned shutdown inspection and maintenance interval, the risk will be significantly
reduced. As the shutdown interval beyond this period (the time at which the system needs to
be down for inspection and maintenance) increases, the risk starts to increase as shown in
Figure 3-11. Risk profile obtained is a function of system failure, and system configuration
coupled with exposed consequences to the operation due to unavailability of the facility.
Hence, depending upon the company risk tolerance, estimated shutdown interval for the
considered unit can be further increased. A sensitivity analysis is performed to study the
effect of the availability constraint and mean shutdown inspection and maintenance duration
on the shutdown interval model. The results are plotted in Figure 3-12 and Figure 3-13. It is
evident from Figure 3-12 that the estimated shutdown inspection and maintenance interval is
sensitive to the overall system availability considered. For 95% system availability, the
estimated interval is close to 19000 h. for 97% system availability the estimated interval is
close to 16000 h., and for 98% system availability the estimated interval is close to 13000 h.
No significant impact is observed for the mean shutdown time duration over the shutdown
inspection and maintenance interval. Based on risk-based shutdown interval estimation, for
the design life of 25 years, a total of 17 shutdowns are recommended. This is the optimal
number of shutdown over the design life. However, if an inspection and maintenance strategy
Page 107
86
is selected based on individual equipment basis, it will be suboptimal and will have higher
financial risk (as evident in Figure 3-12).
Figure 3-11: Risk-based shutdown inspection and maintenance interval modeling
10.00
12.00
14.00
16.00
18.00
20.00
22.00
0 5000 10000 15000 20000 25000
Ris
k (
$)
/ H
r
Time (Hrs)
Risk-Based shutdown inspection and maintenance interval
Page 108
87
Figure 3-12: Risk-based shutdown inspection and maintenance interval – Sensitivity
analysis for availability
10.00
15.00
20.00
25.00
30.00
35.00
40.00
45.00
50.00
55.00
0 5000 10000 15000 20000 25000
Ris
k ($
) /
Hr
Time (Hrs)
Risk-based shutdown inspection and maintenance interval - Sensitivity analysis for availability
A=98% A=97% A=95%
Page 109
88
Figure 3-13: Risk-based shutdown inspection and maintenance interval - Sensitivity analysis
for MSDT
3.4 Discussion and Conclusions
Over the last few decades risk-based inspection and maintenance optimization has
been accepted and applied in petrochemical and process industries. However, in most cases it
has been applied to optimize the inspection and maintenance interval on equipment basis. In
addition, there is lack of system’s approach to estimating risk-based shutdown inspection and
maintenance interval. In this article a methodology to estimate the shutdown inspection and
maintenance interval considering system availability using Markov process is presented to
13.00
14.00
15.00
16.00
17.00
18.00
19.00
20.00
21.00
22.00
0 5000 10000 15000 20000 25000
Ris
k (
$)
/ H
r
Time (Hrs)
Risk-Based shutdown inspection and maintenance interval - Sensitivity analysis for MSDT
MSDT=10 MSDT=7 MSDT=15
Page 110
89
reduce the exposure of risk to the operating company and shareholders. This methodology
ensures that the unit or plant is not only available for production but also the overall risk
exposure is reduced to an acceptable level. Estimated risk-based shutdown inspection and
maintenance interval will not only enhance the reliability and availability but also the safety
and operation of the facility. The methodology provides a tool to determine shutdown
inspection and maintenance intervals for unit or systems based on the optimization of the
total risk in order to bring the operating plant in a planned shutdown mode. The presented
methodology consists of three main modules: (1) Risk-based critical equipment selection, (2)
Shutdown availability modeling using Markov process, and (3) Risk-based shutdown interval
estimation. The proposed methodology minimizes the financial consequences for an
operating company due to production loss, loss of assets, safety (e.g., injury or loss of life).
In the present study, the proposed methodology is applied to the MR section of a
LNG refrigeration unit, ensuring that the high level of risk is contained at an acceptable level.
The developed risk-matrix is used to select the critical equipment that cannot be inspected or
maintained without the unit or plant being taken into shutdown. Applying the Markov
process, an availability constraint of 98% is used to estimate the planned shutdown rate.
Estimated planned shutdown failure rate along with the consequences of failures are used to
generate the risk profile as shown in Figure 3-11. Risk-based shutdown interval optimization
approach is expected to provide a cost-effective maintenance and inspection program and
provide better asset and capital utilization. All processing plants such as LNG processing
facilities, petrochemicals and refineries, which consist of similar equipment like heat
exchangers, vessels, columns, compressors, pumps, turbines, valves, detectors, transmitters
and others can benefit immensely from this approach. The functionality of these equipment
Page 111
90
remains the same, except that their operating parameters can vary. Moreover, since the
shutdown availability modeling is only dependent upon the failure rate and the repair rate and
other assumptions do not play a significant role, the presented methodology can be extended
to any processing or manufacturing facility. However due care should be exercised when
defining the risk-matrix for selecting critical equipment which requires the unit or plant to be
taken in shutdown in order to perform any inspection and maintenance.
Page 112
91
4 Chapter 4
A risk-based shutdown inspection and maintenance interval
considering human error for a processing facility 3
Abstract
This paper presents a risk-based methodology to estimate shutdown inspection and
maintenance interval by integrating human errors with degradation modeling of a processing
unit. The methodology presented in this paper addresses to identify number of shutdown
intervals required to achieve a target reliability over a goal period. The proposed
methodology is the extension of the previously published work by the authors to determine
the shutdown interval considering the system desired availability. The proposed work is
novel in the sense that a concept of human error during shutdown inspection and
maintenance is introduced while modeling the system failure. Selection of critical equipment
is the most important aspect in obtaining the shutdown interval to minimize overall
operational risk. In order to achieve this; a risk criticality matrix is proposed to select the
3 This Chapter is based on the published work in a peer-reviewed journal. Abdul Hameed,
Faisal Khan, Salim Ahmed (2016), “A Risk-based Shutdown Inspection and Maintenance Interval
considering human error for a processing facility,” Process Safety and Environmental Protection,
Volume 100, pages 9-21. To minimize the duplication, all the references are listed in the reference
list. The contribution of the authors is presented in Section titled, “Co-authorship Statement”.
Page 113
92
critical equipment for shutdown inspection and maintenance. Probability of human error
induced during shutdown inspection and maintenance is estimated using Success Likelihood
methodology (SLIM). The proposed methodology is comprised of three steps namely,
equipment selection considering criticality of operation, system failure modeling considering
human error and finally a risk-based shutdown inspection and maintenance interval
estimation. The proposed methodology is applied to a gas chilling and liquefaction unit of a
hydrocarbon processing facility. The methodology is used to ensure the practicality of the
proposed formulation to the real industry. The proposed methodology can be applied to any
plant (process or non-process) such as those for LNG processing, petrochemicals, refineries
or manufacturing plants. The key elements for the success of the proposed methodology are
the identification and selection of critical equipment, breakdown of activities to estimate
human error probability (HEP) and plant specific data for modeling system failures.
4.1 Introduction
Due to continuous production demands, processing facilities are getting not only bigger
and bigger but also more complex in nature. The increase in complexity and size is inviting
maintenance and reliability engineers to put more emphasis on system inspection and
maintenance optimization to minimize unplanned downtime, overall cost and risk exposure.
Effective inspection and maintenance is one of the critical elements for operating facilities.
The core objective of inspection and maintenance is to make sure that the facilities or
equipment are optimized in a way, which does not only increase the reliability and
availability of the plant but also minimizes the overall operational risk. Inspection and
maintenance on some of the equipment are performed by taking the unit or facility out of the
Page 114
93
service, generally termed as Shutdown. Taking the unit or facility out of the service,
generally termed as shutdown, performs inspection and maintenance on some of the
equipment. Duffua and Daya (2004) and Lawrence (2012) have stated that a planned periodic
shut down is carried out to perform maintenance and to inspect, test and replace process
materials and equipment. Inspection and maintenance strategies of the equipment, which do
not require facility to be taken in shutdown mode, can be developed based on individual
equipment. Shutdown interval is one of the most important factor in determining an effective
inspection and maintenance policy. In case if the shutdown inspection and maintenance
interval is too short, facility shutdown time and production loss along with the inspection and
maintenance cost will be too high, vice versa if the shutdown interval is too long, the
production loss and inspection and maintenance cost will be low but the risk exposure will be
high. This leads to find an optimal solution for shutdown inspection and maintenance
interval. Failure of equipment may lead to significant consequences due to improper
planning. Understanding the facilities system from operation and safety is the most important
faucet when selecting and designing a shutdown inspection and maintenance model. A
typical processing facility consists of hundreds of equipment, which works, in rigorous
environment. One of the key aspects which should be covered and included when modeling
for shutdown inspection and maintenance optimization, is to include human error and its
impact on the equipment or system failure. Integration and design of the systems such as
acting in series, parallel, combination of series-parallel, 50% load capacity or 100% load
capacity dictate the development of shutdown inspection and maintenance strategy for the
processing plant. Inspection and maintenance operation is one of the key links in the process
chain for achieving the required production and management goals. While performing
Page 115
94
inspection and maintenance, a minor failure and omission in following a clear guideline or
process not only minimizes all of the inspection and maintenance benefits but also increases
and changes the failure rate or behavior of the equipment or system due to introduction of
human error. Despite technological advancement in equipment design and consideration
given for maintainability, man-machine interface cannot be eliminated. In general, any
inspection and maintenance process involves disassembly; reassembly and/or replacement of
components. These processes require human interaction, and under various circumstances,
create potential to include human error by installing or replacing a wrong part or assembling
the part in wrong sequence despite all technological enhancement. In this paper, the focus is
on the group of equipment which cannot be inspected or maintained and requires a shutdown
of the facility. Thus, in order to develop an optimal inspection and maintenance strategy,
attention must be paid while selecting these critical equipment.
4.2 Past Studies
Inspection and maintenance optimization has gained huge momentum and dynamic
changes over the last couple of decades due to the realization of potential benefits in plant
availability, reliability, scheduling, cost and risk minimization. Risk, reliability and
availability are the three facet of facility operation and are interminably linked together. A
high risk is generally an indication of facility lower reliability and availability, while higher
availability means higher reliability and lower risk. Operation risk is associated with the
probability of equipment or component failure and the consequences of failure such as loss of
revenue due to production loss, asset damages, safety and health issues and inspection and
maintenance costs. Obiajunwa (2012) reported that typically power plant turnaround
Page 116
95
maintenance is planned for every four years, oil refinery and petrochemical plant shutdown
maintenance is planned for every two years, and chemical, steel, glass and food and beverage
plant shutdown maintenance is planned for every year. Alsyouf (2007) presented a model
enabling the decision-makers to identify how an effective maintenance policy could
influence the productivity and profitability through its direct impact on quality, efficiency
and effectiveness of operation. Backlund and Hanu (2002) reported that while doing the risk
analysis focus must be put on the function required of the subsystem and equipment.
Fujiyama et al. (2004) proposed a risk-based maintenance system for steam turbine plants
which is coupled with an inspection system. Ghosh and Roy (2009), Rusin and Wojaczeck
(2012), Vaurio (1995), Khan and Haddara (2003, 2004a,b), Krishnasamy et al. (2005), Tan
and Kramer (1997), Duarte et al. (2006) and Vatn et al. (1996) have presented methods to
estimate the optimal maintenance and inspection interval considering cost, risk, availability
and reliability for individual equipment and have not considered the impact of facility
shutdown. Neil and Marquez (2012) proposed a hybrid Bayesian network (HBN) framework
to model the availability of renewable systems considering corrective repair time, logistics
delay time and scheduled maintenance. These were combined with time- to-failure
distributions using HBN. Mannan and Yang (2010) proposed a dynamic risk assessment
(DORA) methodology considering various process variables such as level, flow rate,
temperature, pressure and chemical concentration and their impact to guide and improve the
process design and optimize failure probability. However, the proposed methodology is not
considering whether a sequence of component failure will lead to the system failure. The
uniqueness of the presented methodology is that it helps to optimize the shutdown inspection
and maintenance interval to minimize the overall system failure which will lead to reduce the
Page 117
96
un-necessary shutdown. Jacob and Amari (2005) presented a binary decision diagram to
calculate system reliability and availability. Pil et al. (2008) proposed a redundancy
optimization and maintenance strategies based on a time dependent Markov approach. Khan
and Haddara (2003) proposed a comprehensive and quantitative methodology for risk-based
maintenance. Dey et al. (1998) and Dey (2001) have applied risk-based approach to the
maintenance of oil pipelines. Khan et al. (2008) have presented a risk-based methodology to
maximize a system’s availability by considering risk-based inspection and maintenance
program to reduce the risk of failure and enhance the overall availability of the system.
Sarkar and Behra (2012), Bertolini et al. (2009), Kumar and Chaturvedi (2008), Zhaoyang et
al. (2011) and Wang et al. (2012) proposed that selecting a maintenance strategy based on
risk reduces the overall risk. However, most of these studies are concerned with optimizing
equipment inspection and maintenance cycles based on perfect (AGAN) as good as new or
minimal (ABAO) as bad as old repair. AGAN strategy holds the assumption that after the
maintenance intervention, the system starts its life under the same failure rate as if it were
new. On the other hand ABAO holds that the equipment or system is maintained with minor
action, which has not changed the failure rate behavior and after the maintenance activity the
failure rate remains the same as it was before the maintenance. In order to overcoming the
short fall of AGAN or ABAO strategy, researchers have introduced concept of imperfect
maintenance. Nguyen and Murthy (1981) introduced the concept of imperfect maintenance
considering that the failure characteristic of the system is different (worse) from that of
correctively maintained system to minimize the mean cost rate. Block et al. (1985) extended
Brown and Proschan model and proposed an age dependent repairable model considering a
probability of p(t) a complete repair or with probability q(t)=1-p(t) is a minimal repair,
Page 118
97
where, t is the age of the equipment in use at the failure time. Ben-Daya and Alghamdi
(2000) presented two sequential preventive maintenance model considering age reduction
model, an extension of Nakagawa’s model while in the second model PM, intervals are
defined such that the integrated hazard rate over each interval is the same for all intervals.
Levitin and Lisnianski (1999) have used Genetic Algorithm to generalize a preventive
maintenance optimization to multi-state system considering the effective age of equipment.
Nakagawa et al. (2012) considered system damages (damage level k) due to shock (shock
number N) and proposed a preventive model considering imperfect maintenance. Rangan and
Grace (1989) extended Brown and Proschan model to develop a replacement policy for a
deteriorating system with imperfect maintenance. Li and Shaked (2003) extended Brown and
Proschan (1983) imperfect maintenance approach to model preventive maintenance and
obtained stochastic maintenance comparisons for the number of failures under different
policies via a point process approach. Malik (1979) introduces the concept of improvement
factor assuming that maintenance action changes the system time of the failure rate curve and
the failure rate post maintenance lies between as good as new and as bad as old. Brown and
Proschan (1983) reported that some possible causes for imperfect, worse or worst
maintenance due to the maintenance performer, such as repair the wrong part, only partially
repair the faulty part, repair the faulty part but damage the adjacent part are the true
contributor. Nakagawa and Yasui (1987) reported that hidden failures which are not detected
during the maintenance, human errors such as wrong adjustment and further damage done
during maintenance and replacement with faulty parts. Dhillon (1986) reported that
operation, assembly design, inspection, installation and maintenance are all prone to human
errors. These errors are due to poorly written maintenance procedures, complex maintenance
Page 119
98
tasks, harsh environment, fatigue, outdated maintenance manual, inadequate training and
experience. Dhillon and Liu (2006) reported that reasons for the occurrence of human errors
including inadequate lightning in the work area, inadequate training or skills of the
manpower involved, poor equipment design, high noise level, an inadequate work layout,
improper tools and poorly written equipment maintenance and operating procedure. They
further classified that human error in six categories, (1) operating error (2) assembly error (3)
design error (4) inspection error (5) installation error and (6) maintenance error. Dhillon and
Yang (1995) cited that failure of repairable system can occur not only due to hardware failure
but also due to operating human error or maintenance error. Factors such as temperature,
dust, fatigue, incomplete or inappropriate maintenance tools, errors in inventory and personal
problems may be the contributor for these errors. Noroozi et al. (2014, 2013) used Human
Error Assessment and Reduction Technique for evaluating human error risk assessment and
applied to pre- and post-maintenance procedure of a process facility and has also applied
Success Likelihood method (SLIM) to perform human factors analysis in pre- and post-pump
maintenance activities for offshore facility. The above referred literature covers inspection
and maintenance interval modeling considering cost, reliability, availability and risk,
imperfect maintenance and human error. However majority of these have discussed
inspection and maintenance based on equipment by equipment basis. In reality, a process
plant, a unit or system consists of hundreds of pieces of equipment that run in continuous
mode. Further, possible human errors in the inspection and maintenance activities can impact
equipment performance. For example, poor repair can play an instrumental role in increasing
the number of equipment breakdowns or failure pattern which in turns can significantly
increase the risk associated with equipment. Understanding the probability of human error
Page 120
99
while performing inspection and maintenance and including in the modeling will provide a
better sight to reduce the overall risk and increasing reliability, availability and safety.
Developing an inspection and maintenance strategy without considering the impact of these
inspection and maintenance due to the shutdown of the plant and the associated risk due to
human errors will not produce an optimum interval. This problem could be solved by
considering a risk-based critical equipment selection and then by developing an optimized
shutdown inspection and maintenance interval considering the imperfectness due to human
error for the system or unit. The objective of this paper is to develop a risk-based shutdown
inspection and maintenance optimization methodology by integrating HEP in the system
failure model for a continuous processing facility. This proposed methodology will provide a
rational basis to make a shutdown inspection and maintenance decision making considering
human error contribution in inspection and maintenance and the overall risk exposure.
4.3 A risk-based inspection and maintenance modeling considering
human error
Although several research have been published on inspection and maintenance
interval modeling and optimization in the literature as discussed above, majority of these
works deals to address the individual equipment. Consideration of shutdown inspection and
maintenance modeling is found to be limited. Hameed et. al (2014) and Hameed and Khan
(2014) has proposed a risk-based shutdown interval modeling for continuous operating
facilities. These modelings are based on the assumption of the perfect maintenance. In reality
majority of the time inspection and maintenance does not meet the perfect conditions and fall
short. The result of imperfectness is induced due to the contribution of human error. Errors
Page 121
100
induced during inspection and maintenance may be realized immediately and result in the
premature failure of the equipment or system or in some cases may lie dormant with the
equipment or system for some period of time, until a combination of other factor accelerate
the degradation mechanism and lead to a failure. Some-time these have resulted in serious
accidents in process industries. The proposed model is developed considering the human
error which may be induced during the shutdown inspection and maintenance and is the
extension of Hameed et. al (2014) and Hameed and Khan (2014). The objective of this paper
is to integrating human errors in the system failure model and to interlink this with the
operational risk. Higher the probability of failure of inducing the human error in inspection
and maintenance, the degradation or the system failure probability will be more impacted.
The proposed shutdown inspection and maintenance methodology is broken down in three
modules and shown in Figure 4-1. Assumption in developing the model as well as detail of
each module is described below;
4.3.1 Assumptions for Model Development:
o A group of equipment which cannot be inspected or maintained without taking the
plant into non-operational mode (shutdown).
o Failure as time-dependent process.
o Material, labor, specialist, production cost are available.
o The degree of imperfectness is assumed to be a number between 0 and 1 due to
human error while performing inspection and maintenance.
o Sufficient manpower and equipment are available to execute the planned job.
o Inspection and maintenance durations are non-negligible.
Page 122
101
Divide plant/unit into manageable units
Perform critical ranking assessment to select
equipment
Exclude equipment from shutdown modelling
Include equipment in shutdown modelling
Module1: Equipment selection considering
criticality
Collect failure data Collect repair data
Develop functional block diagram
Estimate system failure probability
Estimate system failure consequence
Generate risk profile
Inspection and Maintenance interval
optimization
Is risk
acceptable
Setup a risk acceptance criteria
Develop system failure model
Select Human error probability model
Develop Overall system failure
Module 2: System failure modelling
considering human error
Module 3: Riskbased shutdown inspection
and maintenance interval optimization
Figure 4-1: A Risk based inspection and maintenance interval optimization model
considering human error
Page 123
102
4.3.2 Module 1: Equipment selection considering criticality of Operation:
A processing facility consists of a large number of interacting systems or equipment.
When these system or equipment performs together the facility delivers its intended function.
These systems or equipment are subject to periodically or non-periodically planned
inspection and maintenance during its life cycle. The inspection and maintenance
management is one of the key decisions for continuously operating plants to improve the
plant reliability, availability and integrity. Some of these system or equipment can’t be
isolated to perform inspection and maintenance, and requires the plant to be taken in
shutdown mode. The remaining systems and units do not impact the overall facility
operation and can be taken out for inspection and maintenance without causing facility
operation shutdown. Thus, it is very critical to identify system or equipment for their
inspection and maintenance to minimize the impact due to operation loss and to achieve
required reliability and availability. The success to achieve an optimal inspection and
maintenance plan for the facility depends on identifying and selecting these critical
equipment. In this paper a risk criticality matrix is proposed to select these equipment. The
uniqueness of the proposed matrix is to identify these critical equipment and system which
will not only help to reduce the utilization of inspection and maintenance resources but also
help to increase the reliability and availability of the unit. The process consists of the
following steps;
(1) Developing a boundary diagram by breaking down units or plant into manageable
system.
Page 124
103
(2) Reviewing all equipment in the selected boundary using a risk matrix to establish
the criticality in relation to the operation of facility, production loss and impact on
asset damage. Proposed criticality matrix is shown in Figure 4-2.
(3) Estimating the qualitative risk criticality number and comparing with the
acceptable criteria.
(4) If the risk number does not meet the acceptable criteria, include the equipment in
shutdown inspection and maintenance planning.
(5) Continue the process until the all equipment in the selected boundary has been
analyzed.
The advantage of this qualitative risk assessment helps to categories the equipment
that will require a facility shutdown. For qualitative risk analysis, a criticality risk number
may be developed depending on the company operational considerations. According to API
(2009), risk-based inspection, for a qualitative risk analysis the likelihood of failure may be
categorized from one through five. However, it is appropriate to associate an event frequency
with each likelihood category to provide guidance to determine the probability of failure as
shown in Table 4-1 and consequences are represented in monetary terms ($) as shown in
Table 4-2.
Page 125
104
5
3
Risk Matrix
Failure Frequency
Frequent
Probable
Occasional
Remote
Extremely
Unlikely
M H H H H
L M M H H
L M M M H
L L M M H
L L L L M
Consequence Rating
Asset Damage
Production Loss
(DT in Hrs.)
Safety/Health
Environment
1 2 3 4 5
Negligible Minor Moderate Major Catastrophic
DT<X DT>X<X1 DT>X1<X2 DT>X2<X3 DT>X3
Near miss/
First AidMinor Injury
Injury with
Disability
Permanent
DisabilityFatalities
No
effect
Minor
effect
Moderate
effect
Major
effect
Massive
effect
4
2
1
Figure 4-2: Qualitative Criticality risk ranking matrix
Table 4-1: Five Level of Probability of failure (Khan et al. (2014))
Possible Qualitative Rank Annual likelihood of failure
Frequent >0.1
Probable 0.001 to 0.01
Occasional 0.0001 to 0.001
Remote 0.00001 to 0.0001
Extremely Unlikely <0.000001
Page 126
105
Table 4-2: Five Level Consequence Table (Khan et al. (2014))
Possible Qualitative Rank Economic Loss Range
Negligible EL<$10,000
Minor $10,000<EL≤$100,000
Moderate $100,000<EL≤$1,000,000
Major $1,000,000<EL≤$10,000,000
Catastrophic EL>$10,000,000
For the case of several competing consequences for equipment/components, the
highest observed risk (criticality number) among the consequences should be considered to
be the most critical component. Overall risk, R, can be selected using below equation:
(4-1)
4.3.3 Module 2: Component/System failure modeling considering human error
Failure characteristics of the component or system are one of the most important
parameter used to analyze and model the system failure or behavior. Since failure of a system
is a probability, the rule of probability theory may be applied to compute the system failure
probability from knowledge of component or system characteristics.
4.3.3.1 System Failure Modeling:
A unit or system may constitute pieces of equipment arranged in series, active
redundancy or in standby. Very often, these redundancies or standby is designed to take full
load in case of a functional failure to avoid unplanned shutdown. Operational relationships
and knowledge regarding various system elements is required to develop a system failure
Page 127
106
model. System failures cannot be evaluated and improved until it is known that how these
various elements affect system operation. A true representation of these relationships is
required for prediction and assessment based on either cost or risk. A functional block
diagram is developed once the critical equipment are identified to represent their
relationships and provide an indication of the element which must operate successfully for
the system to accomplish its intended function. Depending on the functional block diagram,
system reliability or failure model equation can be developed using either standard series or
series-parallel equations. Further most often inspection and maintenance modeling is
considered based on a fixed time interval between two consecutive inspection and
maintenance. In this paper, it is assumed that the inspection and maintenance interval will be
dictated by the risk considered and will vary between two consecutive shutdown inspection
and maintenance as shown in Figure 4-3. Considering the variability in shutdown interval,
the reliability of the system over the life cycle can be written as follows:
(4-2)
Where;
(1)
(2) is shutdown inspection and maintenance interval
(3)
(4)
(5) ∆1>∆2>∆3>……>∆n
Page 128
107
Td
TSD1 TSD2 TSD3 TSDn
tup tup tup tuptd td td td
Figure 4-3: System Operational Availability
4.3.3.2 Human error modeling in inspection and maintenance:
Inspection and maintenance activities are critical to improve the reliability and
availability of equipment. These activities are performed not only under immense pressure to
bring the facility up and running in shortest period of time but also under difficult and
hazardous conditions. Even with all kind of technical advancement while designing the
equipment or system, human involvement needs to be considered when performing
inspection and maintenance. Human interactions with machines or systems are prone to
introduce error while performing inspection and maintenance due to various factors. Human
errors during inspection and maintenance activities have already produced disastrous
outcomes (in millions of dollars) such as Flixborough, Three Mile Island, Piper Alpha and
Bhopal accident. Sometime human errors in inspection and maintenance may lie in dormant
mode for a longer period of time before leading the equipment or system to failure. An
example of a loosely secure nut during maintenance may produce vibration and result into a
fatigue crack over period of time. Human errors such as misinterpretation of engineering
drawings and maintenance manuals, inadequate training, poor working environment, time
constraint and working environment as well as processing hazards are some factors which
impact human performance. Swain and Guttmann (1983) have defined these factors as
performance shaping factor (PSF) and listed several PSF which are linked with internal,
Page 129
108
external, or stress related for complex man-machine interface for nuclear power plants.
Wilson and McCutcheon (2003) reported that facility layout, workstation configuration,
controls, hand tools, control systems, noise, vibration, lighting, temperature, force, repetition,
posture, work schedule/workload, behavior based safety, labels/signs, communications,
training, stress/fatigue, motivation, fitness/body size) are the areas where human factor
should be considered. Toriizuka (2001) evaluated the importance of each PSF from the
viewpoint of work efficiency, workload and human reliability. Any inspection and
maintenance activity whether non shutdown or shutdown for a complex system consists of
three major steps namely preparation activities, inspection and maintenance activities and
boxing up/lining up activities before it is taken in operation. The above three steps consist of
several sub-sets of task. Since these actions are performed by humans, there is always a
probability of introducing an error. If the probability of inducing such human error is
analyzed considering various PSF and represented by p, it can be integrated in to the system
failure function of the equipment or system. Various techniques have been presented in
literature to estimate the HEP. Some of the major techniques are Success Likelihood
Indexing Method (SLIM), Technique for Human Error Rate Production (THERP), Justified
Human Error Data Information (JHEDI) and Human Error Assessment and Reduction
Technique (HEART). Kirwan (1996, 1997) and Kirwan et al. (1997) have discussed and
validated these techniques in details. These techniques have been applied in Nuclear, Air and
process industries. In this paper, SLIM technique is utilized to estimate human error
probability and later integrated in the system failure probability. Figure 4-4 represents the
SLIM process. SLIM process is based on developing the Performance Shaping Factors (PSF)
and their impacts on human behavior. Generally an expert judgment is used to quantify PSF
Page 130
109
which is used to derive a Success Likelihood Index (SLI) for each activity. A detailed set of
task needs to be developed. Each task is reviewed in view of the considered PSF. Field and
Technical expert judgments are used to assign a ranking and weighting to each PSF in terms
of the influence on the success of a task. Eq. (4-4) is used to convert estimated SLI to
estimate HEP.
Select set of Performance Shaping Factor
Calculate PSF ranking
Determine PSF Weight
Determine SLI for each task
Predict HEP for each action
Calculate overall HEP
Figure 4-4: SLIM methodology to calculate HEP
(4-3)
Page 131
110
(4-4)
Where, SLIk is the SLI for each activity k, Wj is the importance weight for the jth
PSF, Rjk is the scaled rating of task k on the jth PSF. The overall probability of human error
in inspection and maintenance can be calculated using Eq. (4-5):
(4-5)
Incorporating inspection and maintenance HEP in Eq. (4-6) will result in:
(4-6)
Figure 4-5 represents the impact of human induced error in the survival function of
the system and is compared with no inspection and maintenance.
Page 132
111
Figure 4-5: Impact of Human Error in Survival Function
4.3.4 Module III – Risk-based shutdown interval estimation
Too frequent inspection and maintenance of equipment or system will increase not
only the loss in revenue but also the overall operational risk exposure due to possible human
error introduction in the system. On the other hand, an optimal inspection and maintenance
interval will not only help to have better utilization of the inspection and maintenance
resources but also reduce the risk of increased failure. It is necessary to express the
probability of failure for a piece of equipment or a system as a function of time for risk-based
shutdown inspection and maintenance interval estimation. In order to develop a risk-based
shutdown inspection and maintenance interval, system failure probability considering human
error and consequences are required to generate the overall risk exposure and are discussed
below:
Page 133
112
4.3.4.1 Estimation of system failure probability
In general, operating companies keenly focus on targeting to maintain the desired
reliability to achieve their operational goal. Since the system failure probability is a function
of failure rate and is complementary to the reliability of the system, mathematically it can be
written as:
(4-7)
(4-8)
where t is the failure time of the system on or before a time
A system or equipment failure can be modeled using exponential, Weibull, normal or
lognormal probability distribution. Plant-specific inspection and maintenance data are the
best source to identify the model. However, sometime due to the limited availability of plant-
specific data, test data, data bank or expert judgment is also used. Weibull distributions due
to its inherent flexibility such as normal (for β =3.4) and exponential (for β =1) distributions
is most commonly used to model system failure probability. In this study, the Weibull model
with the parameters β and θ is used to model the time dependent reliability of the equipment
involved in the system. A decreasing failure rate (β<1) corresponds to an early life failure or
infant mortality. A constant failure rate (β =1) suggests that items are failing from random
events. An increasing failure rate (β>1) suggests that wear out is occurring and that parts are
more likely to fail over time (Ghosh & Roy, 2009).
Page 134
113
4.3.4.2 Estimation of the economic consequences:
In general, process plants such as refineries, chemical plants, natural gas processing
facilities equipment operate under extreme conditions (pressure and temperature). It is due to
these extreme operating conditions, failure consequences are not limited to the localized
failure of component or equipment. Further these facilities process hazardous substances
(hydrocarbons), failures due to leak of hydrocarbons may produce sever impact on the nearby
assets, safety and health issues of the people and operational losses in the presence of an
ignition source. For example in a gas processing plant, hydrocarbon release may result in
flash fires, jet fires, pool fires, boiling liquid expanding vapor explosion (BLEVE), fire balls,
vapor cloud explosions or toxic dispersion. In order to estimate the impact in the effected
zones, operating pressure, temperature, physical and chemical properties and atmospheric
conditions are required. Economic consequences due to these may be estimated based on the
effects of thermal radiation and overpressure on surrounding equipment and personnel in
monetary ($) terms for effected zones. Failure to consider these consequences when
developing inspection and maintenance strategies for the facility may increase the
operational risk. Hameed et al. (2014) has described various equations to estimate economic
consequences in monetary ($) terms. Table 4-3 lists the summary of these equations which
has been used here.
Page 135
114
Table 4-3: Consequence Estimation (Khan et al. (2014))
Economic Consequence of Asset Loss
Due to Heat Flux (4-9)
Due to Overpressure (4-10)
Economic Consequence of Human Health Loss (ECHHL)
Due to Heat Flux (4-11)
Due to Overpressure (4-12)
Economic Consequence of Production Loss (ECPL)
(4-13)
Economic Consequence of Inspection and Maintenance (ECSIM)
(4-14)
(4-15)
(4-16)
(4-17)
(4-18)
The total economic consequences of shutdown (
, (4-19)
Page 136
115
where, x represents the various possible scenarios, is the probability of damage
due to heatflux in the effected zones and is the asset density, is the probability of
damage due to overpressure, is the effected zone due to overpressure, is the
probability of injury or death due to heatflux in the effected zones , is the population
density and is the cost of injury or fatality, is the probability of damage due to
overpressure, PL is production loss volume per day and SP is the selling price of the product
per unit volume, SDT is the shutdown duration, Cp is the preparatory cost, Clp is the cost of
preparatory maintenance labor per hour ($/h), tp is the duration of the preparatory work, CI is
the inspection cost, ClI is the cost of skilled inspection labor per hour ($/h), CIe is cost of
inspection equipment per hour ($/h), ti is the duration of inspection work, Cm is the
maintenance cost, Clm is the cost of skilled maintenance labor per hour ($/h), Csp is the cost
of spare parts consumed, tm is the duration of maintenance work, Cts is the technical support
cost, Clts is the cost of a technical support specialist per hour ($/h) and t is the duration of
technical support work in hours.
4.3.4.3 Risk estimation:
Since the risk is a combination of probability and the consequence, one needs to
consider all possible consequences, including safety & health, operational and non-
operational consequences. In this paper, risk is estimated in terms of ($) value due to all
possible combination and can be written as:
Page 137
116
(4-20)
4.4 The application of RBSIM to a LNG processing facility
Sönmez et al. (2013) reported that energy plays a fundamental role in both
manufacturing and services, and natural gas is rapidly becoming a key energy source
worldwide. Since the last few decades liquefied natural gas (LNG) plants are increasing in
number due to the growing demand for natural gas (NG) to meet the energy requirement.
This trend is due to the fact that NG is the cleanest of the fossil fuels. LNG is a temporarily
converted form of NG for storage and shipping because it occupies six hundred times less
volume. The NG liquefaction process begins when the NG is extracted from the underground
reservoirs and is sent to a liquefaction facility, where NG is liquefied at -160 oC. The
liquefaction plants are asset intensive which operates on continuous basis. Unavailability of
major equipment or system due to any failure may have severe consequences and produce
significant risk to the operating companies due to production loss, asset damage, safety and
company perception. A typical onshore LNG processing plant consists of several units as
shown in the following Figure 4-6. Raw gas is received from either an onshore or offshore
reservoir to the inlet/receiving area where condensate and water is separated from
hydrocarbon. Hydrocarbon is then pre-treated to remove corrosive and hazardous contents.
These include H2S, CO2, mercury, helium and water. The dry sweet gas is then cooled to
Page 138
117
separate heavier hydrocarbon such as C3, C4 etc. Finally it is cooled in the cryogenic units to
liquefy natural gas for storage and or shipping. In this paper, a section of gas chilling and
liquefaction unit of a LNG processing facility is selected to develop shutdown inspection and
maintenance interval for a targeted goal time to achieve a desired reliability (0.95). The
general schematic and the block diagram of gas chilling and liquefaction unit section is
shown in Figure 4-7 and is taken from Hameed and Khan (2014) previous work. The main
purpose of the Gas Chilling and Liquefaction Unit is to condense the sweetened, dry, lean
feed gas into LNG in the Main Cryogenic Heat Exchanger, and then sub-cool it in the Sub-
cooling Heat Exchanger.
Offshore well head platform
Inlet facilitiesSeparation of Gas
Acid Gas RemovalDehydration/
Mercury RemovalNGL Recovery
Gas chilling/Liquefaction
Waste Water Treatment
Condensate Treatment (Removal)
Sulfur Recovery (Change H2S to
Liquid)
Liquid Sulfur Tanks
FractionationLPG (C3 & C4)
N2 Rejection (Removal of
Nitrogen)
Refrigeration
LPG Tank
Condensate
Sulfur
loadingLPG
loading LNG
LNG
loading
Figure 4-6: A typical LNG processing plant process flow
Page 139
118
4.4.1 Module 1: equipment selection considering criticality of operation
Equipment criticality analysis helps to evaluate how failure of these equipment
impacts the performance of asset and is use to prioritize equipment selection for inspection
and maintenance. Module I of the presented methodology is applied to select critical
equipment using the risk criticality matrix. The risk criticality matrix helps to estimate the
risk criticality number for all equipment in the unit for all considered consequences. Using
the risk criticality matrix, equipment can have a criticality number ranging from 1 to 25.
Criticality number 1 indicates that the equipment has least impact while a criticality number
25 indicate significant impact on the risk. For example, if an equipment is having high
probability (frequent = 5) of failure and the unavailability of the equipment having moderate
impact on production, 50% loss (moderate = 3), the risk number will be 15, compared to an
equipment which upon failure will result total loss of operation will get a criticality number
of 25. Higher criticality number indicates that the equipment will have higher risk on
operational facilities due to the unavailability, and should be considered for a shutdown
inspection and maintenance. Other risk factors can also be estimated to obtain the criticality
number. In the considered unit, hydraulic turbines are design to take full load capacity, in
case if one unit fails, other unit will take the load, hence it does not get a higher criticality
number and is not considered for shutdown inspection and maintenance interval
optimization. These can be inspected and maintained any time without taking the unit in
shutdown. Equipment E01, E02, E03, E04, E05 and E06 as shown in Figure 4-7 are
estimated to be having higher critical number and are selected for shutdown inspection and
maintenance interval for the studied unit.
Page 140
119
Figure 4-7: Gas Chilling and Liquefaction Unit
4.4.2 Module 2: integrating human error in reliability modeling:
A functional block diagram is developed for the selected critical equipment and is
shown in Figure 4-8. System failure probability is calculated using the block diagram from
the selected critical equipment. Since these equipment (in this unit) operate in series,
reliability equation in series is appropriate for this scenario. In order to estimate the risk-
based inspection and maintenance interval, failure data is a key. For this study, failure and
repair data for the selected equipment are taken from the previously published work by
Hameed and Khan (2014) and is listed in Table 4-4.
Page 141
120
E01 E02 E03 E04 E05 E06
Figure 4-8: Functional block diagram of selected equipment
Table 4-4: The failure Characteristics of considered equipment.
Equipment No.
Characteristic life
(θ, h)
Shape Parameter
(β)
E01
282,000 4.38
E02
E03
E04
E05
450,000 2.0 E06
All inspection and maintenance activities whether it is minor services, such as
tightening the bolt or loose parts, cleaning and removing dust and rust, repairing and/or
replacing degraded components such as bearing and seals, or performing welding to
strengthen the integrity of the equipment requires human interaction. As discussed in Module
II, various factors may introduced human error and result in accelerating the degradation or
failure of the system. Table 4-5 list the considered PSF which may have impacts on the
shutdown inspection and maintenance activities. Expert judgment from the experienced plant
personnel are used to identify the significant Performance Shaping Factors and are listed in
Table 4-5. These PSF are then ranked to select the top five PSF. Selected top five PSF were
then assigned a weightage and is listed in Table 4-6. Table 4-7 list the general and common
shutdown inspection and maintenance activities which were developed using field engineer’s
Page 142
121
experience. This information was used to estimate the HEP for individual activities using Eq.
(4-3) to Eq. (4-5) as discussed in Section 4.3.3.2.
Table 4-5: List of considered PSF
External PSF Internal PSF Stressors
o Environment o Training
o Fatigue, Pain or
discomfort
o Working hours,
work breaks, shift
rotations
o Experience
o Temperature and
Radiations
o Availability and
adequacy of special
equipment, tools
and supplies
o Knowledge of performance
standards
o Oxygen insufficiency
o Method, Policies
and Procedure o Stress (Mentally or bodily) o Vibration
o Criticality and
Complexity of Task o Work Memory o Movement limitation
o Physical Condition o Risk and Threats
Page 143
122
Table 4-6 : Performance Shaping Factor, Rank and Weight
Number Performance Shaping Factor Rank Weight
1 Training 5 0.20
2 Experience 4 0.25
3 Time Pressure 3 0.20
4 Work Memory 2 0.15
5 Work Environment 1 0.20
Page 144
123
Table 4-7: Common Shutdown Inspection and Maintenance activities and estimated HEP.
Task Number Task Description HEP
1 Receive I&M work permit 0.001594
2 Perform system blinding and isolation 1.47E-05
3 Open entry points 0.00029
4 Install ventilation System 0.00029
5 Install internal/external lighting 1.47E-05
6 Remove manways 1.47E-05
7 Install internal/external scaffolding for I&M 1.47E-05
8 Remove/Clean demisters, (if required) 0.000359
9 Clean Weld Joints, drains, nozzles etc. 0.010839
10 Carry out inspection 1.47E-05
11 Carry out repairing/maintenance works, 1.47E-05
12 Re-fix the demisters (if required) 1.47E-05
13 Remove Internal scaffoldings 1.47E-05
14 Re-fix internal manways 0.010839
15 Perform final inspection 5.07E-06
16 Final Internal Inspection 0.010839
17 Close entry points 1.47E-05
18 De-blinding & hydra tightening 1.47E-05
19 Close I&M work permit 1.47E-05
4.4.3 Module III – risk-based shutdown inspection and maintenance interval:
Module III of the proposed methodology consists of estimating system failure
probability, all possible consequences due to process unit shutdown and finally developing a
risk profile to find the optimal shutdown inspection and maintenance intervals. Since system
Page 145
124
failure probability is the function of time, it is modeled here using Weibull distribution. To
calculate the system failure probability, the Weibull distribution parameters of the equipment
are used as discussed in Module II, thus the system failure probability function can be written
using Eq. (4-8). Considered gas chilling and liquefaction unit is used to process hydrocarbons
and operates at higher pressure and cryogenic temperature conditions, the consequences of
failure will be very high. Failure scenario considered to estimates the asset damage and
human health loss for these equipment is release of hydrocarbon which upon finding an
ignition source may result in explosion which could generates shock waves. Calculated shock
waves are then transformed in to probability of damage due to shock wave for various
effected zones. This shock wave may cause serious asset damage as well as human injury or
fatality. In this particular scenario, estimated consequence is based on a radius of 200m and
is listed in Table 4-8. It is important to note that the loss of life or injury suffered to the
people is hard to estimate in dollars value, however the cost associated with the
compensation and corporate liability needs to be taken account in consequence analysis. In
this regard, published note from Judycki (1994) of the US Department of Transportation and
the Federal Highway Administration published relating the injury scale (in terms of severity)
to the comprehensive costs in police-reported crashes is used. In this paper production loss is
estimated using Eq. (4-13) for 10 days of shutdown is considered. Plant-specific data and
field engineer supports to estimate number of manhour, labor and equipment cost is
considered to estimate economic consequence of each shutdown inspection and maintenance
interval.
Page 146
125
Table 4-8: Estimated failure consequences
Equipment No.
Consequences of Asset damage and human health loss in terms of
(Million dollars)
E01 344.98
E02 307.29
E03 256.40
E04 88.34
E05 284.18
E06 377.76
The total calculated consequence along with Eq. (4-20) is used to generate the
expected risk profile to determine the total number of shutdown intervals. Figure 4-9 show
the obtained risk profile to achieve optimal shutdown inspection and maintenance interval,
which would enable a level of 95.0% system reliability for a desired goal time while meeting
the risk exposure to the lowest level. The shutdown inspection and maintenance interval is
obtained from Figure 4-9. A sensitivity analysis is performed to study the effect of the
number of shutdown days on the shutdown interval model. The results are plotted in Figure
4-10. It is evident from Figure 4-10 that operational risk profile is increasing or decreasing
with the increase or decrease of shutdown duration, due to the impact of production losses,
however the number of shutdown required in achieving desired system reliability over the
goal time does not have significant impact. Table 4-9 shows the estimated shutdown
cumulative time. It is evident from Figure 4-9 that the overall operational risk is low when a
total of six shutdowns with unequal intervals are performed under the given conditions to
achieve minimum operational risk ($) per hour. The presented methodology does not only
Page 147
126
provide optimal number of the facility shutdown interval but also suggest when these
shutdowns should be planned to achieve target reliability, availability and to minimize the
overall risk for the considered life of the facility.
Table 4-9: Estimated Shutdown Cumulative time
Shutdown Number Cumulative Time
1 43222 h
2 72014 h
3 96487 h
4 117289 h
5 134971 h
6 150000 h
Figure 4-9: Risk-based shutdown inspection and maintenance
200
225
250
275
300
5 6 7 8 9 10
Ris
k (
$)/
Hr
Number of Shutdowns
Risk based Shutdown Optimization
Page 148
127
Figure 4-10: Risk-based shutdown inspection and maintenance
4.5 Conclusion
Shutdown inspection and maintenance activities are performed to increase the
availability and reliability of facility by selecting the critical equipment to optimize the
overall risk profile. Risk assessment integrates the system failure probability and
consequences. A risk-based shutdown inspection and maintenance helps to select the critical
equipment and systems which can’t be inspected or maintained without taking the plant out
of operation. This paper presents a risk-based shutdown inspection and maintenance intervals
optimization for a processing facility unit considering human error which may be introduced
during these activities. The unit considered in this study is a gas chilling and liquefaction unit
of LNG facility. In this study, SLIs were calculated for each activity and converted into HEP
using SLIM methodology. Estimated HEP is then integrated in the probability of system
failure. Shutdown inspection and maintenance consequences of selected equipment were
Page 149
128
determined and expressed in financial values ($). The cost of inspection and maintenance
were calculated using the plant data and/or using engineer’s experiences. System probability
of failure couples with estimated consequences is used to generate operational risk profile.
By including the HEP in system failure modeling, it is safe to say that shutdown inspection
and maintenance planning will help to obtain a risk profile which will not only allow
achieving an optimal shutdown intervals but also the desired system reliability over the goal
time by minimizing the overall risk. As the system operating life increases, the reliability
decreases, which require shorter duration of inspection and maintenance to avoid excessive
operational consequences. Duration of shutdown and the number of activities depends on the
number of equipment selected which will go for inspection and maintenance and the scope of
shutdown. The proposed methodology is an extension of Hameed and Khan (2014) and
Hameed et al. (2014) to estimate shutdown interval, where in the previous studies, the impact
of human error was not considered. Further these methodologies was considered to find a
risk-based shutdown interval considering the equal interval whereas the proposed
methodology helps to find optimal shutdown inspection and maintenance considering
unequal interval over a goal time to minimize the overall operational risk. Risk-based
shutdown inspection and maintenance interval methodology proposed in this paper can be
applied and used for any processing or manufacturing facility. By using the risk criticality
matrix, it is possible to select the critical equipment which should be considered for
shutdown to optimize the overall risk.
Page 150
129
5 Chapter 5
Risk-based maintenance scheduling for a LNG gas
sweetening unit 4
Abstract
Significant productivity increase has been observed due to advanced automation in
process operations, which has also caused increased complexity in the process. The benefits
from this investment can only be gained when a reliable performance with high availability
and productivity is sustained. In process operations, a reliable performance requires well-
planned maintenance activities. A well-planned maintenance considers planned shutdown
and its financial impacts. Due to increased process complexity, it is cost effective to adopt a
risk-based approach for maintenance planning. In this paper, a risk-based approach for
maintenance planning and scheduling for a gas-sweetening unit in a Liquefied Natural Gas
(LNG) plant is discussed. A bi-objective scheduling optimization model is developed for
maintenance planning. The two conflicting objectives: i) the minimization of total
4 This Chapter is based on the submitted work in a peer-reviewed journal. Abdul Hameed,
Syed A. Raza, Qadeer Ahmed, Faisal I. Khan and Salim Ahmed (2016), “Risk-based maintenance
scheduling for a LNG gas sweetening unit,” Submitted to Journal of Loss Prevention in the Process
Industries. To minimize the duplication, all the references are listed in the reference list. The
contribution of the authors is presented in Section titled, “Co-authorship Statement”.
Page 151
130
expenditures incurred on maintenance related activities and ii) improving the total reliability
of a gas sweetening are considered. The simulation-based optimization framework is
proposed to obtain a true Pareto-front using plant specific data and MATLAB 2015b built-in
Genetic Algorithm procedure. The developed framework provides a rapid decision support
tool for bi-objective problem embedded with the simulation-based optimization framework.
5.1 Introduction
Maintenance management is not only essential to manufacturing facilities but also
highly critical to the asset intensive industries such as petrochemical, refineries and gas
processing plants. These facilities consist of hundreds of equipment, which operate on a
continuous basis. Some of the equipment inspection and maintenance cannot be performed
until the unit or facility is taken into shutdown, which poses a significant impact to the
company revenue. On the other hand, some equipment maintenance can be planned without
triggering the facility shutdown, here we termed it as non-shutdown strategy. Inspection and
maintenance has three critical aspects, which, what, and when? ‘Which’ relates to selecting
the equipment considering the operational risk, ‘What’ relates to define maintenance task or
activity and ‘When’ explains the time these activities should be performed. The right task at
the right time on the right equipment is essential to make sure that facility remains in reliable
operational condition. Developing maintenance management is not only about developing
maintenance strategies on individual equipment basis but also to minimizing the risk to
operability of the facility due to shutdown. It is vital to understand the integration and design
of the systems such as acting in series, parallel, combination of series-parallel, 50% load
capacity or 100% load capacity to design an optimal inspection and maintenance strategy.
Page 152
131
Campbell, Jardine, and McGlynn (2011) reported that typically inspection and maintenance
cost ranges from 28% to 52% of the total operating cost of a plant. The significant cost
associated with inspection and maintenance has encouraged researchers to develop efficient
methods, techniques for inspection and maintenance which have been published over the
years. When developing inspection and maintenance schedule, it is critical to consider which
strategy should be applied to minimize unplanned downtime, overall cost, risk exposure and
to effectively utilize skilled personnel and available spares. The inspection and maintenance
scheduling optimization topic has gained much attention among researchers and industrial
practitioners over the last few decades. However, it is noted that there is an opportunity to
introduce shutdown and non-shutdown inspection and maintenance strategy in the
optimization model to minimize the overall cost and maximize reliability.
In this paper, a bi-objective risk-based maintenance scheduling optimization for a
continuous processing plant considering facility shutdown is suggested. The proposed bi-
objective scheduling optimization is solved using an - constraint method and GA. If the
maintenance schedule is developed without considering the facility shutdown mode, it will
not only result in too frequent intervals, but also have produced huge financial losses such as
production loss and maintenance cost due to higher number of shutdown. The proposed
maintenance optimization methodology considers multiple conflicting objectives; several
constraints with a common goal of achieving lower cost, higher reliability and efficient
maintenance schedule. The prime objective of the proposed maintenance schedule
optimization is to minimize the overall maintenance cost and maximize the reliability of the
physical assets.
Page 153
132
5.2 Literature Research
5.2.1 Maintenance of Natural Gas processing plant:
Liquefied natural gas (LNG) processing plants are not only asset intensive and
complex, but also require a heavy financial investment. A careful maintenance planning for
LNG assets depends on the good understanding of assets configuration and their impacts on
operation. Some equipment deteriorates over time and failure of these key equipment
produces an undesirable event which can lead to the shutdown of the facility. A carefully
designed maintenance planning for these critical equipment may prevent unwanted
breakdown. Gowid, Dixon, and Ghani (2014) developed and proposed a system redundancy
and maintenance interval optimization for a Floating Liquefied Natural Gas (FLNG) export
platforms to reduce the total associated maintenance cost. This was achieved by identifying
the optimum maintenance intervals for the major LNG liquefaction plant components.
Keshavarz, Thodi, and Khan (2011) proposed a risk-based shutdown management strategy
for LNG units. A combination of preventive maintenance, active redundancy and standby
redundancy was considered to achieve an optimized shutdown maintenance strategy. These
proposed optimization studies cannot be applied to the existing plant, as most of the facilities
do not have redundancies for liquefaction units. Nwaoha, Yang, Wang, and Bonsall (2010)
used GA to model risk-based maintenance and repair cost for a liquefied natural gas
containment system and its transfer arm in conjunction with probabilistic risk assessment
technique to improve system safety. When developing shutdown maintenance planning for
LNG or processing facilities, realizing the criticality of the equipment to the operation is very
important. Hameed, Khan, and Ahmed (2014); Hameed, and Khan (2014) have proposed a
risk-based shutdown interval modeling for continuous operating facilities by selecting and
Page 154
133
analyzing the risk of critical equipment to define the facility shutdown interval. In reality, not
all assets in the LNG plant required a facility shutdown to carry out maintenance. Thus, the
key question is to define what would be the maintenance activities for equipment and what
would be the frequency? Frequent maintenance activities on these equipment may introduce
accelerated failure due to human interface and produce severe negative financial impacts due
to frequent shutdown; on the other hand few of the planned maintenance activities will not
help in achieving a reliable operation of the facility either. Thus, a balanced or optimized
maintenance schedule is required to meet the functional requirements considering facility
shutdown.
5.2.2 Risk-based maintenance optimization:
Maintenance optimization is an active research topic. Single objective or multiple
objectives optimization has been addressed under risk, reliability, availability, and cost.
Backlund, and Hanu (2002) reported that while doing the risk analysis focus must be put on
the function required of the subsystem and equipment. Garg, Monica, and Sharma (2013);
Fitouhi, and Nourelfath (2014); Adhikary, Bose, Jana, Bose, D., and Mitra (2015); Salvador,
and Juan-Carlos (2013); Ghosh, and Roy (2009); Rusin, and Wojaczeck (2012); Khan, and
Haddara (2003, 2004a, 2004b) have presented methods to estimate the optimal maintenance
and inspection interval considering cost, risk and availability. Bertolini, Bevilacqua,
Ciarapica, and Giacchetta (2009) proposed a risk based inspection and maintenance strategy
to minimize the overall risk considering time limit, budget and human resources. Zhaoyang,
Jianfeng, Zongzhi, Jianhu, and Weifeng (2011); Wang, Cheng, Hu, and Wu (2012) proposed
a risk rating criteria to select a maintenance strategy which reduces the overall risk. However,
Page 155
134
the real-life optimization problems are quite complex and often intractable to solve using
conventional optimization approaches.
5.2.3 Meta-heuristics approach for maintenance optimization:
There has been significant development in the heuristics-based approaches to solve
large-scale problems. Silver (2004) stated that a metaheuristic is an iterative master process
that guides and modifies the operations of subordinate heuristics to produce efficiently high-
quality solutions and presented an overview of various metaheuristic solution methods.
Statistics presented by Jones, Mirrazavi, and Tamiz (2002) shows that 70% of the
optimization problem used GA as primary meta-heuristic algorithms compared to 24%
Simulated Annealing (SA) and 6% Tabu Search (TS). Dowsland (1996); and Chen, Vempati,
and Aljaber (1995) reported that GA has been successfully applied to wide range of
applications ranging from maintenance optimization to revenue maximization and so on.
Moghaddam and Usher (2011) have explored maintenance scheduling using dynamic
programming and introduction of heuristic algorithms in maintenance optimization with
reliability, availability, and budget criteria. Painton, and Campbell (1995); and Coit and
Smith (1996) have introduced meta-heuristics, for example GA, to effectively handle
optimization problems in maintenance and reliability contexts. Hadi, Ashkan, and Isa (2012)
presented a joint production, and maintenance scheduling model with multiple preventive
maintenance services. A component-based heuristic algorithm was developed to solve the
optimization model for a real field system while maintaining the architecture or components
in a traction catenary system. Xu, Han, Wang, and Sun (2012) proposed a risk-based
optimization model for system maintenance scheduling problem that consists of optimizing
availability and cost of the system by balancing between system maintenance risk and failure
Page 156
135
risk. Fu (2013) presented a selection of multiple maintenance strategy in process equipment.
Three maintenance strategies namely, repair maintenance, preventive maintenance and
preventive replacement on equipment reliability was analyzed. The harmony search
algorithm was designed to solve the model, and the diversity of solutions was ensured by
generating the new solution and the replacement process. Ahmadi, and Newby (2011)
proposed an integrated model for the joint determination of both optimal inspection strategy
and optimal repair policy for a manufacturing system whose resulting output is subject to
system state. In this paper, an intensity control model adapted to partial information provides
an optimal inspection intensity and repair degree of the system as an optimal control process
to yield maximum revenue. Go, Kim, and Lee (2013) studied the problem of determining
operations and maintenance schedules for a container ship equipped with various subsystems
during its sailing according to a pre-determined navigation schedule. A mixed integer
programming model is developed. Then, due to the complexity of the problem, a heuristic
algorithm that minimizes the sum of earliness and tardiness between the due-date and the
actual start time for each maintenance activity is discussed and improvement is reported over
the experience based conventional method. Mirabedini, Mina, and Iranmanesh (2012)
proposed a multi-objective integrated production and maintenance optimization using GA for
multi parallel machines. Kancev, Gjorgiev, and Cepin (2011) proposed surveillance test
interval optimization of standby equipment considering aging parameters uncertainty using
GA. Esmaeili (2012) developed a single machine scheduling problem with maintenance
activities to optimize total cost scheduling problem using GA.
The above literature review clearly indicates that meta-heuristic such as GA has been
successfully applied for maintenance scheduling optimization. However, it is found that
Page 157
136
maintenance scheduling optimization considering facility shutdown for hydrocarbon facilities
has not been explored extensively, and provides an opportunity to expand the application in
this area. This paper is expected to contribute by developing a practical solution using -
constraint method, and GA to address the issue of efficient maintenance scheduling of LNG
processing facility considering shutdown. In this work, inspection, maintenance and
replacement are considered as various maintenance tasks to minimize the cost and maximize
the system reliability.
5.3 LNG Gas Sweetening Unit
At atmospheric condition when natural gas is cooled to approximately it
takes the liquid form which is generally known as liquefied natural gas (LNG). The most
significant advantage of liquefying natural gas is that in liquid forms the volume of natural
gas gets reduced to 1/600th the volume of in its gaseous form, which helps to transport long
distance using transporting vessels. A typical LNG processing plant schematic is shown in
Figure 5-1. These equipment require timely maintenance to meet safety, availability and
reliability of the facility. In the gas processing facility, raw natural gas received from
reservoirs is processed to remove unwanted corrosive and hazardous material before it can be
liquefied and transported. In majority of the gas processing facility, a three phase raw gas is
received at onshore processing plant in the inlet-receiving facility where the gas, condensate
and water are separated. Condensate is usually sent to the refinery for further processing to
obtain by-products. The separated natural gas from the inlet-receiving facility is processed to
remove sulfur in the form of hydrogen sulfide and water in gas sweetening unit before it can
be converted in the liquefied form. A general schematic of a section of gas sweetening unit is
Page 158
137
shown in Figure 5-2 . The main function of this unit is to remove H2S, CO2 and organic
sulfurs from the stream and convert the gas into a sweet gas for further processing. Since this
unit deals with highly corrosive and hazardous materials, equipment inspection and
maintenance must be planned carefully to achieve reliable operation. Considering this, the
proposed methodology has been applied to develop an optimized maintenance schedule
under multiple constraints for a section of gas sweetening unit.
Gas Sweetening Unit
Gas Dehydration/Marcaptans
Removal Unit
Mercury Removal Unit
NGL Recovery Unit
Liquefaction Unit
Sulfur Recovery Unit +
Tail Gas Treating Unit
HP
Se
pe
rato
r
Nitrogen Rejection Unit
Fractionation Unit
Sour Water Stripping Unit
Water Treating Unit
Utilities
C2LPGSulfur LNG Storage Tank
Rich gas to Fuel Gas System
Condensate Stabilization
Unit
Condensate
Off gas
Raw Gas
Slug Catcher
Off-gas to Atmosphere
Figure 5-1: A typical LNG Process Plant (Mokhatab, Mark, Valappil, & Wood, 2014)
Page 159
138
Figure 5-2: A typical Section of gas sweetening unit
Effective maintenance is one of the key functional areas in industry to address safety,
reliability, plant uptime and maintenance cost. To address these objectives, maintenance
optimization has gained momentum in understanding equipment failure modes, equipment
age, remaining useful life and the disadvantages of only performing time-based maintenance.
Page 160
139
Estimation of equipment age is a difficult task which drives the conservative maintenance
schedules. This results in performing maintenance too early when it is not required and
possibly introducing the effect of poor workmanship or human error. On the other hand, if
the interval between successive maintenance is increased equipment may run into the risk of
unscheduled breakdown. This situation results a demanding area of interest for the industry
and researcher. The concept of inspection and maintenance management is not restricted to
only the strategy but also how the strategy is being selected considering system process flow,
equipment design, its maintainability, and so on. A continuous operating facility such as
LNG processing plant operates in rigorous condition, 365 days a year. Developing a
maintenance schedule for these equipment depends on the system configuration. These
systems are designed in various possible configurations such as acting in series, parallel, 50%
load sharing, 100% load sharing; thus results in two major scenarios a shutdown or non-
shutdown maintenance strategy. Majority of the model presented in literature for
maintenance optimization has not been specific to consider facility shutdown scenarios. This
shortcoming provides an opportunity to integrate concept of shutdown in maintenance
strategy to minimize cost and maximize system reliability considering aging of the
equipment and error introduced in the system. Risk is usually based on the consequence and
probability of an equipment breakdown or failure. Risk also relates to the operability, the
operating pressures, temperatures, and age of the facilities. Maintenance planning and
scheduling is important due to its direct impact on the reliability of the facility. The right
maintenance activity at the right time is the goal of any maintenance organization. However,
due to shortage of resources and to meet production demand sometimes a compromise is
made by delaying the schedule task. Current maintenance strategies focus not only on
Page 161
140
keeping the plant in operation but also on efficient utilization of equipment through quality
and service. Processing liquefied natural gas is a hazardous process requiring considerable
safety. It is a cryogenic process where the operating temperature is around -164 °C and any
failure can have catastrophic consequences. Hence, effective and optimized maintenance is a
key to safety, reliability and to minimize overall maintenance cost. Maintenance strategy for
hydrocarbon processing facilities is important not only because of critical application but also
due to the high cost of unplanned or planned shutdowns on revenues due to production loss.
These motivating factors are behind the formulation of a maintenance scheduling
optimization model.
5.4 Risk-based Bi-Objective Maintenance Scheduling Model
In this section, a risk-based bi-objective mathematical model for maintenance
scheduling for the gas sweetening process of a LNG plant is presented.
5.4.1 Assumptions:
Following are the assumptions to ensure the models are representative of real plant
operations. These assumptions are the basis of bi-objective optimization.
o Equipment time to failure follows increasing failure with known or estimated shape
and characteristics life parameter.
o Material, labor, specialist, and production cost are available.
o Labor cost/unit time is independent of equipment.
o Sufficient manpower and equipment are available to execute the job once planned.
o Inspection and maintenance times are non-negligible
Page 162
141
5.4.2 Notations:
The following notations are used.
Sets
Set of Equipment, indexed such that
Set of time period intervals, indexed such that
Decision Variables
Parameters
L Length of the planning horizon
Cost of corrective (failure) task of equipment
labor cost/hour to perform a corrective task of equipment m
Cost of replacement of components in equipment
labor cost/hour to perform a replacement task of equipment m
Cost of maintenance of equipment
labor cost/hour to perform a maintenance task of equipment m
cost of material of an equipment m
Cost of inspection of equipment
Page 163
142
labor cost/hour to perform an inspection task of equipment m
Expected total inspection and maintenance cost
High pressure
Low pressure
Overall system reliability
Corrective repair time at equipment m
time required to perform a maintenance at equipment m
time required to perform a replacement at equipment m
time required to perform an inspection at equipment m
Shape parameter of equipment
Scale parameter of equipment
Improvement factor of equipment
Rate of occurrence of failure (ROCOF)
failure cost factor of equipment m
Expected number of failures of equipment at time t
Reliability of an equipment at time
Age of equipment at start of period
Age of equipment at end of period
5.4.3 Preliminaries:
In a typical LNG production facility, many maintenance actions are taken to ensure
the functionality of each equipment by properly capturing its failure modes and assigning
suitable tasks such as inspection, preventive maintenance or replacement. One of the
objectives of this work is to develop maintenance task such as inspection, preventive
maintenance and repair schedule for each equipment ( ), for a planning horizon ( ). While
Page 164
143
developing this optimized maintenance schedule, the overall planning horizon is broken in
equally spaced period i.e. . At the end of each period, the system is analyzed to select
which maintenance activity should be performed such as inspection (I), preventive
maintenance (M) or replacement (R). Here the inspection task is considered to be an operator
based inspection. These inspections (I) activities are specific to the operators using their
sensory element such as visuals, hear, touch and feel to analyze the equipment behavior and
report to the maintenance team if any un-wanted condition is observed such as noise, leak
etc. etc. Based on the operator based inspection, if required, maintenance team performs the
detail investigation and takes any necessary action. The operator based inspection does not
change the failure rate of the equipment. At the same time, operator based inspection ease the
maintenance resource utilization and helps in reducing the maintenance cost. In contrast, a
predefined planned maintenance such as oil change or grease filling help to improve the
degradation in the equipment failure characteristic. In industry these actions are called as
preventive maintenance or simply maintenance (M). These actions help to improve the
condition of the equipment. However, there is always a chance of introducing human error.
Further, a corrective maintenance action is taken if a sudden failure of a component is
observed while the system is in operational state. Corrective task or replacement task is
synonymously being used in the industry. Corrective task is initiated when a sudden failure
of equipment is observed. On the other hand, a replacement activity (R) may be of a planned
replacement of seal, bearing and other components which may be in the wear-out zone of the
failure characteristic. These actions will improve the equipment condition. Ahmed et al.
(2015) has discussed these activities in greater details.
Page 165
144
Many state-of-the-art computerized maintenance management systems have been
developed to manage, execute, record and track these activities. These systems also help to
obtain real operational failure data to perform equipment and system studies and failure
investigations.
5.5 Operational Risk-based Equipment Selection:
A risk-based approach for equipment selection to a section of gas sweetening unit of a
LNG plant is outlined in this section. As described earlier in Section 5.3 (Figure 5-2) that a
typical gas sweetening unit in an LNG plant consists of a large number of equipment and it
would be very difficult to plan and manage the maintenance activities at once. Indeed, some
equipment are likely to be at more risk of failure such as rotating equipment compared to
stationary equipment. Also in certain cases, a planned maintenance action on some of the
equipment cannot be performed, and requires the unit or plant to be taken out of operation.
This situation is generally known as shutdown. On the other hand, some units or equipment
do not impact the overall facility operation and hence, maintenance activity can be performed
during normal operation. Identifying and integrating such systems and equipment is one of
the most important aspects to achieve a risk-based optimal maintenance schedule without
impacting operability and loss of revenue due to un-necessary shutdowns. A sound approach
will be to plan and schedule maintenance activity considering the operational risk of the
facility.
Generally risk is defined as the resultant of the probability of an undesired event and its
consequences. Assessing and performing a risk assessment require a cross-functional team
with detailed knowledge about the system and function being analyzed. Risk can be
Page 166
145
measured in using the probability of failure and its relation to multi facet consequences such
as operation loss due to facility shutdown, inspection and maintenance cost due to incorrect
planning, environment and safety impacts on the facility and people. API (2009) guideline
suggests that a risk matrix is an effective tool to show the distribution of risk associated with
a plant or a process. The size of a risk matrix may vary, such as 5 5, 4 4 and so on. In this
study, a 3×3 risk assessment matrix is used to segregate and categorize equipment for
inspection and maintenance considering a unit or facility shutdown. A 3×3 risk matrix for
probability of loss of operation and consequence ($) is shown in Figure 5-3. To exemplify, if
the consequence is as high as 3 and the probability of the failure is high as 3, the risk
exposure will be maximum i.e. 9. In order to apply the risk matrix, facility needs to be
broken down into small manageable units. All equipment in the gas sweetening unit of LNG
plant are reviewed using the risk matrix to identify a quantitative measure of risk (also
known as risk index) representing the impact on facility operability. Equipment having
impact on facility operation with a higher risk index should be given higher priority in
planning for shutdown inspection and maintenance strategy while others with a lower risk
may be considered lower in the priority. This assessment process is performed for all
equipment until the complete unit is analyzed as shown in Figure 5-2. One significant
advantage of using the risk segregation would be to allocate and use skilled resources for the
systems which are critical for plant operability and availability. Further, the proposed risk
assessment will help to establish the equipment or system which will require facility
shutdown for inspection and maintenance and help to make better planning. However, it
should be noted that the risk criteria can vary from organization to organization, depending
on their exposure and tolerance to absorb the consequences of the facility shutdown.
Page 167
146
Figure 5-3: Operational Risk-based Equipment Selection
5.5.1 Modeling equipment failure mode:
While modeling the equipment failure mode, equipment is classified as repairable or
non-repairable. Repairable equipment may include compressors, turbines, pumps, motors,
valves etc. In contrast to this, non-repairable systems are more often the electronic modules.
Generally corrective maintenance activities are taken when a repairable system fails.
However, this strategy creates significant economic consequence in contrast to a planned
maintenance which could be of inspection, preventive maintenance or replacement nature.
Knowing and understanding the failure mode and their modeling is vital in developing the
planned maintenance schedules for a reliable plant operation. Failure data obtained from
actual operation provides better insight when developing the model as operational failures
occurs under the actual operation and environments and provides an accurate representation
of system behavior. Kapur and Lamberson (1977) reported that Weibull distribution is
Page 168
147
considered as generalized failure model and is often used in reliability analysis due to its
inherent flexibility to model increasing or decreasing failure rates. In reality equipment
failure pattern does not always tend to be independent of each other; in this case a Non-
Homogeneous Poisson Process (NHPP) can be used to model the time-dependent random
failures. Ahmed, Moghaddam, Raza, and Khan (2015); Moghaddam and Usher (2011) and
many other researchers have used this approach. In this article we assume that the selected
equipment are repairable. It is also assumed that failure, repair, replacement and inspection
task can be scheduled and time to failure follows a NHPP. Each equipment in the system is
assumed to have an increasing failure rate. For non-homogeneous Poisson process, failure
rate is a function of time. As we are considering increasing failure rate, Rate of Occurrence
of Failure (ROCOF), is given by Eq. (1);
(5-1)
In Eq. (5-1) , are scale parameter, shape parameter, and t is the time
interval. Using Eq. (5-1), expected number of failures can be computed as follows:
(5-2)
5.5.2 Equipment age estimation:
Age of an equipment, at a given time, with respect to the different tasks such as
inspection (I), Maintenance (M), and Replacement (R) is estimated by Ahmed et al. (2015)
and is represented in Eq. (5-3) to Eq. (5-7). Further, the maintenance task is considered to be
Page 169
148
imperfect, and therefore after the maintenance task the equipment does not return to as good
as new (AE=0) and its age is reduced by a factor for an equipment, m.
Inspection Task
(5-3)
Maintenance Task:
(5-4)
Replacement Task:
(5-5)
(5-6)
Considering the above maintenance task, if the age of the system at the end of each
period t for equipment m can be obtained from Eq. (7)
(5-7)
5.5.3 Maintenance activities costing:
Performing a maintenance activity such as inspection, corrective or preventive
maintenance and replacement for any equipment requires skilled resources and materials.
Consuming these resources derives various cost activities and is an increasing function
depending upon the nature and number of time action is taken over the life span of the
facility. The economic consequence (cost) of these activities has been discussed in detail by
Ahmed et al. (2015) and is summarized in Eq. (5-8) to Eq. (5-11).
Inspection Task:
Page 170
149
(5-8)
Where in Eq. (8), is the time for inspecting equipment and is the cost of
labor for inspection.
Maintenance Task:
(5-9)
Where in Eq. (9), is the time required to carry out maintenance of equipment and
is the cost of maintenance labor.
Replacement Task:
(5-10)
Where in Eq. (5-10), is the time required to replace an equipment , is
the cost of replacement labor and is the replacement material cost. Due to various
failure natures, the material cost is not considered here.
In the case of a failure, an unplanned replacement is carried out. It is assumed that
this cost of replacement due to failure would be;
(5-11)
Where in Eq. (5-11), is the time required to replace a failed equipment ,
is the cost of labor to replace a failed equipment, is the failure cost factor of equipment
m, and is the replaced material cost.
In addition to the above, one of the major and significant cost contributor is the
production loss due to the facility shutdown. Since, in this proposed methodology, the
maintenance schedule is designed such that there is no impact on operational availability; the
cost of production loss is not considered.
Page 171
150
5.5.4 System reliability estimation:
We assume that the failure rate function of an equipment follows an increasing failure
pattern and the rate of failure of occurrence for repairable system follows a NHPP, the
reliability, of an equipment m for a given period t is computed using Eq. (5-12),
(5-12)
However, when various subsystems are interlinked to each other, the system functionality
depends on the function of each of the subsystem considered. Considering that the failures of
each subsystem are independent, the system reliability is the product of the reliability of each
individual subsystem for a considered interval. Thus for a system acting in series, reliability
equation can be written as,
(5-13)
5.6 Bi-objective model formulation
Damghani, Abtahi, and Tavana (2013) reported that epsilon-constraint method is one
of the methodologies to solve multi-objective optimization. In this method decision makers
select one objective function out of n to be optimized, while the remaining objective
functions are put as a constraints to be less than or equal to given target values. We use an
epsilon-constraint framework, and this has been used in other areas of research as well.
Berube, Gendreau, and Potvin (2009) provided evidences that Pareto set of bi-objective
Page 172
151
problem can be generated more efficiently using the epsilon-constraint method. Laumanns,
Thiele, and Zitzler (2006); Amirian and Sahraeian (2015); and Morabi, Owlia, Bashiri, and
Doroudyan (2015) have used this method for multi-objective decision problem.
In this paper expected total estimated cost ( ) and system reliability ( ) are
considered as the two objectives to optimize and the decision is the complete schedule for
inspection (I), Maintenance (M), and Replacement (R)
(5-14)
(5-15)
5.
6.
(5-16)
(5-17)
(5-18)
(5-19)
(5-20)
(5-21)
Eq. (5-16) to Eq. (5-21) represents various constraints used in designing the model.
Where, Eq. (5-16) sets the initial age to zero for each subsystem at the beginning of the
Page 173
152
planning horizon, Eq. (5-17) and Eq. (5-18) are used to estimate the effective age of the
equipment due to various activities performed over the period, Eq. (5-19) prevents
simultaneous activities scheduling for an equipment, Eq. (5-20) makes sure that in all cases
the equipment age at the beginning or end of the period is always positive and more than zero
and finally Eq. (5-21) defines various maintenance activities as a binary variables and
restricts the values to be positive numbers.
5.6.1 Proposed solution approach
In Figure 5-4, a solution framework is presented. It is mainly a simulation-based
optimization approach. The risk-based equipment selection has been completed in section 5.5
and a bi-objective nonlinear integer program (BONIP) is proposed in section 5.6. Next,
following the solution suggested in Figure 5-4, we developed an -constraint method to
transform BONIP into a single objective function which can be solved more conveniently.
(5-22)
(5-23)
And constraints defined in Eq. (16) to Eq. (21).
.
Page 174
153
In Single Objective Nonlinear Integer Program (SONIP), the reliability objective
is transformed as a constraint.
5.6.2 Decision variables re-orientation:
In Figure 5-5, we have explored the structure of the decision variables (
) and have shown how we can generate a schedule ( ). We can observe here that
using the schedule, , it reduces the decision variables from to considerably
less, variables in the schedule, . Each cell in the Schedule matrix can take either
of three actions: Inspection ( ), Maintenance ( ), or Replacement ( .
Page 175
154
StartInput Data
Bi-objective Nonlinear
Model Developments
Transformation into Single
objective using epsilon
constraint method
Start Simulation
Generate the initial
population
Evaluate the Objective
Function for all individuals in
the population
Generate new population
through selection,
crossover, and mutation
Stopping criteria for GA
met?
Decision variables
reorientation for
schedule
Generate a uniformly
distributed epsilon
GA starts
Stop Simulation?
End
Store the Best (optimal)
Schedule and corresponding
cost and reliability
Determine non-dominated
(pareto-optimal) solutions
GA ends
Yes
Yes
No
No
1
23
GA
Figure 5-4: Proposed solution framework
Page 176
155
Figure 5-5: Decision Variable re-orientation
Using re-orientation presented in Figure 5-5, we can reduce the total number of
decision variable to exact one-third of the original problem . Thus, we get a reduced
problem . We observe that in the decision variable is
1 2 3 4 ---- |T|
1 0 0 0 1 ---- 0
2 0 1 0 0 ---- 0
3 0 0 1 0 ---- 0
4 0 1 0 0 ---- 1
---- ---- ---- ---- ---- ---- ----
|Ω| 0 0 1 0 ---- 0
1 2 3 4 ---- |T| 1 2 3 4 ---- |T|
1 0 1 0 0 ---- 1 1 I R I M ---- R Row 1 Transpose
2 0 0 0 1 ---- 0 2 I M I R ---- I Row 2 Transpose
3 0 0 0 1 ---- 0 3 I I M R ---- I Row 3 Transpose
4 0 0 0 1 ---- 0 4 I M I R ---- M Row 4 Transpose
---- ---- ---- ---- ---- ---- ---- ---- ---- ---- ---- ---- ---- ---- Row ... Transpose
|Ω| 0 0 0 0 ---- 1 |Ω| I I M I ---- R Row |Ω|Transpose
1 2 3 4 ---- |T|
1 1 0 1 0 ---- 0
2 1 0 1 0 ---- 1
3 1 1 0 0 ---- 1
4 1 0 1 0 ---- 0
---- ---- ---- ---- ---- ---- ----
|Ω| 1 1 0 1 ---- 0
Row --.
Row |Ω|
nvars =
Row 1
Row 2
Row 3
Row 4
Time (t)
Eq
uip
men
t (m
)
Xmt
Ymt
Time (t)
Zmt
Time (t)
Eq
uip
men
t (m
)
Schedule (S)
Time (t)
Eq
uip
men
t (m
)
Eq
uip
men
t (m
)
Page 177
156
(5-24)
(5-25)
The matrix contains elements as outlined in Figure 5-5. Using Eq. (24), we can
compute ETC by recoding into , , and . Given , then
, , . Similarly for other values of , the , , and are
easily translated. Notice that constraints in Eq.(16)-(21) are removed as the proposed
solution using schedule, resolves the selection decision among the three operation
, that was earlier addressed using, into , , and . Similarly, for a given
schedule, , the reliability, can be estimated using Eq. (15)
5.6.3 Genetic Algorithm (GA) implementation:
GA is a meta-heuristic, which belongs to the class of evolutionary algorithms (Deb,
2001). It mimics the process of natural evolution like inheritance, mutation, selection, and
crossover in pursuit to find the best solution to an optimization problem (Kaveshgar, Huynh,
& Rahimian, 2012). In the proposed solution framework as shown in Figure 5-4, we have
utilized the GA provided in Global Optimization tool in MATLAB (2015b). The current
version of the toolbox has incorporated increased functionality and enables the built-in GA
Page 178
157
procedure to handle the nonlinear mixed integer optimization problem (NLMIP) such as the
one presented in . In the following we discuss the important features.
The procedure starts with the knowledge of the input data form the LNG plant gas
sweetening process unit. The data includes information regarding equipment failure, and the
estimated cost for each equipment regarding the inspection, preventive maintenance, planned
replacement, and replacement or repair. The planning horizon is also decided at this stage.
There are four main procedures a typical GA implementation performs:
5.6.3.1 Initial population generation:
Typically GA procedure starts with the creation of a randomly generated initial
population. Using the decision variable re-orientation framework presented in Figure 5-6 an
individual solution, ‘schedule’, which is also referred to as chromosome is randomly
generated. The population size valuation could be arbitrarily set in the population generation
option in ‘gaoptimset’ in the MATLAB (2015b) ‘ga’ procedure. In Figure 5-4, the procedure
is represented in Step 1 in the GA related operators which is repeated for each simulation. In
this implementation we have generated initial population using ‘PopulationSize’ parameters
in ‘gaoptimset’.In the following, the main procedure of MATLAB (2015b) ‘ga’ along with
the options used is presented.
‘options =gaoptimset('PopulationSize', 'Generations', 'EliteCount', 'TolFun', 'PlotFcns',
@gaplotbestf)’
The MATLAB 2015b built-in procedure used is:
‘[x,fval,exitflag] = ga(@cost_obj,nvars,[],[],[],[],lb,ub,nonlcon1,IntCon,options),
Table 5-1 and Table 5-2 outline the user-defined and built-in parameters selection. In
addition to the stated parameters in Table 5-1 and Table 5-2, all other parameters in ‘ga’
Page 179
158
procedure are set to their default values. A detailed documentation on how ‘ga’ built-in
procedure works is available at MATLAB (2015b)a Global Optimization Toolbox. However,
the problem that we have addressed here is an integer program which requires several
modifications to basic ‘ga’ procedure. In this implementation for ‘ga’ procedure for our
problem, we have restricted to default settings for crossover, mutation, special creation in
order to keep the decision variables integers. These details on default settings can be found at
MATLAB (2015b)b Global Optimization Toolbox.
Deep et al. (2009) have discussed the use of GA for constrained integer programming
problems. ‘ga’ procedure used penalty functions as suggested in Deep et al. (2009) and Deb
(2000) for handling nonlinear constraint in . The MATLAB (2015b) built-in function
‘ga’ also suits this implementation of the integer variable problems as there are no equality
constraints in . Due to integer variables, no custom creation functions such as
(‘CreationFcn’ option), crossover function (‘CrossoverFcn’ option), mutation function
(‘MutationFcn’ option), or initial scores (‘InitialScores’ option) can be user-supplied in ‘ga’.
These functions are self-selected in MATLAB default setting in ‘ga’ procedure. In the
simulation, to maintain the integer decision variables, ‘ga’ have used special creation.
Crossover, and mutation functions, and their detailed documentation is also available at
MATLAB (2015b)c Global Optimization Toolbox.
Page 180
159
Table 5-1: MATLAB (2015b) built-in procedure ‘ga’ related selected parameters in
‘gaoptimset’
Parameters Remarks Selection value(s)
‘PopulationSize’ The number of individual chromosomes
(solutions) in a generation
150
‘Generations’ Total number of generations explored in
simulation run
500
‘EliteCount’ Number of individual in the current generation
guaranteed to survive for next generation.
10 (MATLAB 2015b,
default)
‘TolFun’ Function tolerance, i.e., the different between the
objective values improved
1e-08
‘PlotFcns’ Optional. It is used to graph the best total expected
cost
Built-in parameters
‘SelectionFcn’
Selection options specify how the genetic
algorithm chooses parents for the next generation.
Binary tournament,
default for integer
problem
Page 181
160
Table 5-2: MATLAB (2015b) built-in procedure ‘ga’ user-defined functions and parameters
Parameters Remarks Selection value(s)
@cost_obj User-defined function to compute the total
expected cost
Not applicable
nvars Total number of decision variables. A column
vector of size 168 containing values, ‘1’, ‘2’, ‘3’
, where
, and ,
Indicators
1= Inspection,
2= Maintenance,
3= Replacement
lb Lower bound column vector of size 168 all
values are ones, i.e., lb=ones(168,1)
1= Inspection
ub Lower bound column vector of size 168 all
values are set at three, i.e., ub=3 * ones(168,1)
3= Replacement
Nonlcon User-defined non-linear constraint for reliability
IntCon The total number of integer values. Set to 168, since
. All variables are
integers.
Page 182
161
Figure 5-6: Population representation in a typical generation
5.6.3.2 Cost and reliability estimation:
For a given schedule, as an individual chromosome in the population the expected
total cost, ( ) is computed using Eq. (14) using the decision variable orientation
1 2 3 4 ---- |T|
1 1 1 1 1 ---- 1
2 1 2 1 1 ---- 2
3 2 1 1 1 ---- 1
4 2 1 2 1 ---- 1
---- ---- ---- ---- ---- ---- ----
|Ω| 1 3 1 2 ---- 1
1 2 3 4 ---- |T|
1 1 1 1 2 ---- 1
2 1 1 2 1 ---- 1
3 1 2 1 2 ---- 2
4 1 2 2 1 ---- 1
---- ---- ---- ---- ---- ---- ----
|Ω| 1 1 3 1 ---- 2
1 2 3 4 ---- |T|
1 2 2 1 1 ---- 1
2 2 1 1 2 ---- 2
3 1 1 1 1 ---- 2
4 1 2 2 2 ---- 2
---- ---- ---- ---- ---- ---- ----
|Ω| 1 1 3 3 ---- 1
Spopoulationsize
Generation
Index Chromosomes
1
n
---- ----
---- ----
Spopulationsize
Time (t)
Eq
uip
men
t (m
)
population size
Sn
Eq
uip
men
t (m
)
S1
S1
Time (t)
Eq
uip
men
t (m
)
Sn
Time (t)
Page 183
162
procedures outlined in Figure 5-4 and Figure 5-5. Similarly, we also estimate reliability for -
constraint method using Eq. (15).
5.6.3.3 Crossover and mutation:
As discussed previously in Section 5.6.3.1, ‘ga’ procedure restricts a customized
selection for crossover and mutation related parameters.
5.6.3.4 Stopping criterion:
There are several stopping criteria that are employed with built-in ‘ga’ function in
MATLAB (2015b). The details on the stopping criterion can be found in MATLAB
(2015b)d Global Optimization Toolbox. We have selected the default stopping criterion, with
the exception to two criteria: ‘Generations’ and ‘TolFun’. The selected values for these
parameters are provided in Table 5-1.
5.7 Simulation Study
5.7.1 Operational Risk-based Equipment Selection:
Operational risk-based equipment selection process as discussed in Section 5.5 is
applied to a section of gas sweetening unit as shown in Figure 5-2. The proposed operational
risk-based equipment selection generated two categories of equipment as listed Table 5-3.
From the operational risk analysis, it is evident that maintenance scheduling of all columns,
drums and recontactor cannot be done unless the unit is planned for a shutdown and requires
a shutdown maintenance strategy to develop the maintenance plan. Shutdown inspection and
maintenance modeling has been presented by Hameed, and Khan (2014) and Hameed et al.
(2014). On the other hand, for the remaining equipment maintenance scheduling can be
Page 184
163
planned and optimized without shutting down the facility. The proposed model is applied to
develop an optimized maintenance schedule for selected equipment considering facility non-
shutdown maintenance strategy.
Table 5-3: Operational Risk-based Equipment Selection
Equipment requiring shutdown
maintenance strategy
Equipment requiring
non-shutdown maintenance strategy
Washing column Wash water circulation pumps
Absorber Skim oil pumps
HP recontactor Makeup water pumps
LP recontactor AFA pumps
HP flash drum Drain pumps
LP flash drum Rich sulfinol pumps
Drain drum Lean sulfinol pumps
5.7.2 Equipment Failure Model:
Equipment failure history and repair data are generally stored in the maintenance
management systems. Data from a LNG plant gas sweetening unit was analyzed and
presented by Ahmed et al. (2015). In this study we use the same information. However, some
of the data has been revised based on the information received from field engineers for some
of the selected equipment. These data are presented in Table 5-4. Further, we have
Page 185
164
considered 24 months of planning horizon to develop maintenance scheduling optimization
strategy for the selected units.
Table 5-4: Failure Data
m
Equipment requiring
non-shutdown maintenance
strategy
λm
(failure/hr)
βm αm
1 Wash water circulation pumps 0.000436 1.2 0.4
2 Skim oil pumps 0.00029 1.9 0.6
3 Makeup water pumps 0.000152 2.5 0.6
4 AFA pumps 0.0001316 1.7 0.5
5 Drain pumps 0.0001104 1.8 0.4
6 Rich sulfinol pumps 0.00066 2.1 0.3
7 Lean sulfinol pumps 0.00075 1.9 0.3
5.7.3 Inspection and Maintenance Cost:
Majority of the published maintenance optimization model considers a time-based
maintenance regardless of the condition of the equipment and follows a predefined interval
by original equipment manufacturers. These pre-defined intervals set up set of activities in
the form of work orders which is triggered automatically without considering the available
resources and the shutdown of the system. In some cases multiple activities overlap and
result in scheduling problems as well. Generally in Computerized Maintenance Management
System (CMMS), data such as time required for completing a pre-defined inspection,
maintenance, and replacement, as well as the cost of all associated skilled worker and
required equipment is also stored and readily available for references. Table 5-5 present the
Page 186
165
estimated cost ($/event) related to failure (CFm), repair (CRm), maintenance (CMm) and
inspection (CIm) for all considered equipment. These values are estimated using Eq. (5-8) to
Eq. (5-11) and plant specific CMMS data and field personnel.
Table 5-5: Inspection and Maintenance Cost Data
M
CFm
($/event)
CRm
($/event)
CMm
($/event)
CIm
($/event)
1 970 480 190 20
2 1900 1080 190 20
3 1850 1050 190 48
4 1050 480 240 36
5 1000 450 240 36
6 800 320 180 45
7 800 320 200 40
5.7.4 Numerical results:
Selected results of the solution run for developed model on the case study is presented
in Table 5-6 and Table 5-7. The optimal maintenance schedule for the set of equipment,
obtained from GA optimization procedure is presented in terms of corresponding Pareto
Front as showed in Figure 5-7 within the objective function space. Pareto Front shown in the
referred figure is comprised of 42 points i.e. a total of 42 possible optimal solutions of the
objective functions. The Pareto front shown in Figure 5-7 is developed based on the 42
optimal solutions corresponding to the range of reliability from 0 to 0.99. The convergence
graph clearly indicates that the cost increase exponentially when the target reliability is set to
be more than 80% and is in line with the practical expectation. Higher cost associated with
Page 187
166
higher level of reliability is due to the cost of frequent replacement; this is also reflected in
the optimal schedule where frequency of replacement increases with increased reliability
target. Appearance of successive replacement also observed in the schedule. It is
understandable that in the extreme scenario of 100% target reliability, replacement (R)
becomes the only option. When a plant can be operated with lower level of reliability, regular
maintenance can be carried out instead of replacement. In the proposed methodology, the
maintenance schedule is developed by minimizing the cost while considering variable target
reliability. The user can then choose from a list of alternative schemes to decide maintenance
schedule over a period of time considering budgetary constraints. Generally gas processing
facility target to achieve and operate with the reliability in the range of 90% to 95%.
Considering this, two maintenance schedule obtained using Pareto-front is presented in Table
5-6 and Table 5-7. The optimum schedule suggested by this integrated approach to achieve
90% system reliability produces a maintenance cost of $34210 and for a 95% reliability
results $42926.75 for two years period. The optimized schedule is an outcome while
maximizing reliability and minimizing cost. The Pareto frontier is representative of this fact.
The failure model is developed using expected number of failures while estimating the
maintenance cost. The outcome of the simulation run confirms that the inspection is not
directly affecting the reliability. Hence, at lower level of reliability we expect more
inspections and lower cost. In other case, maintenance and replacement is dominating, as
they affect the reliability.
One of the outputs of the Pareto Front is that the analyst can select externally the best
maintenance strategies considering various possible restrictions imposed over the solution
simultaneously. Hence the analyst can analyze afterword every solution of each Pareto front
Page 188
167
score based on reliability and cost. Additionally each of the 500 generation calculated in the
front is related to specific schedule, so the decision maker can select a schedule of the Pareto
front according to his or her preference knowing that the elected solution will accomplish all
the imposed constraints. Maintenance and reliability team can effectively utilize the
presented model to design maintenance activities such as inspection, maintenance and
replacement to meet their organizational goals. Further in case of an equipment unexpected
failures, the model need to be updated to develop a revised schedule for the remaining
period.
Figure 5-7: Pareto Front - Total Maintenance Cost Subject to Reliability Constraints
Page 189
168
Table 5-6: Inspection and Maintenance Schedule for Target Reliability of 90%
Total Cost = $ 34210.55 and Reliability = 90.0%
m Planning Horizon (Month)
1 2 3 4 5 6 7 8 9 1 1 1 1 1 1 1 1 1 1 2 2 2 2 2
0 1 2 3 4 5 6 7 8 9 0 1 2 3 4
1 I M M I I R R R M M M M M R M M R M M I M R M M
2 I M M I I M I I I R M M M R M I M M I I M I M I
3 I R I M R M M I I M M R M M I I R M I M M M M M
4 I M M M I M M I I M I R M I I I I I I I M I I I
5 I I R M M I I I M M M M M M M M M I M M M I I M
6 I M M M I R M I R M R M M M M M R M R M M R R M
7 I M R M M M R M R M M I R M M M I M R R M I M M
Table 5-7: Inspection and Maintenance Schedule for Target Reliability of 95%
Total Cost = $ 42926.75 and Reliability = 95.0%
m Planning Horizon (Month)
1 2 3 4 5 6 7 8 9 1 1 1 1 1 1 1 1 1 1 2 2 2 2 2
0 1 2 3 4 5 6 7 8 9 0 1 2 3 4
1 I R M M M M I R M M M R M R I M R I R M M M M M
2 I R M M M M M R M R M I I I R M M R M M M I I M
3 I M M M M M R M M R I M R I R I M R M M R R M M
4 I M R I M I M M I M I M R M M M M I I I I M I I
5 I I R I R M I I M M M M R M M I M M I R M I I I
6 I M M R M M M M R R M M M R R M M R R I R M M M
7 I M R R M R M M R M R R R M M M R M M I R M M M
Page 190
169
5.8 Conclusions
This paper proposes a multi-constrained, bi-objective non-linear optimization models
using GA for maintenance scheduling for a section of a sweetening unit of a hydrocarbon
processing facility. The proposed simulation based approach presented in the study, provides
an optimal schedule for inspection, maintenance and replacement activities to achieve a
reliable performance of the facility considering the facility shutdown. A well planned
maintenance schedule generated from the Pareto-optimal solution, such as presented here
will not only help to reduce the overall maintenance cost, increase the reliability of the
facility but also minimize unnecessary shutdown of the facility. Typically a shutdown of a
LNG producing facility generates a significant financial impact, resulting in millions of
dollars in loss of production. The developed risk-based equipment selection strategy helps to
minimize such event of loss production due triggered from the shutdown for maintenance of
the unit.
The proposed model has been successfully applied to obtain and optimize
maintenance schedule for a gas sweetening unit, without provoking the facility shutdown.
The proposed methodology, when extended to the complete plant will multiply the savings
further, due to reduction in number of planned facility shutdown to maintain the desired
reliability. Overall this methodology helps in developing an effective resource utilization
planning. Pareto-optimal model provides flexibility to engineers and planners to develop
maintenance schedules considering different conflicting objectives.
The overall results derived from the proposed optimization models confirm the
applicability of the approach to real world maintenance scheduling optimization problem and
its application to other asset intensive industries where these actions are important to ensure
Page 191
170
safety, availability and reliability of the facilities. The proposed optimization methodology
can be applied to any facility such as process or non-process.
In the future work, proposed methodology can be extended to solve non-linear
optimization problem for maintenance scheduling with many other meta-heuristics such as
Harmony Search algorithm, Tabu Search, and Simulated Annealing. This can assist in
benchmarking the performance of the proposed GA with the other meta-heuristics. This
problem of scheduling can also be revisited considering inflationary conditions as well. The
current model has risk-neutral analysis to the problem, and interesting future work could be
used to customize the schedule, based on the firm’s risk tolerance attitude.
Page 192
171
6 Chapter6
Conclusion, Contributions and future work
6.1 Introduction
The development of an optimal shutdown interval for inspection and maintenance
considering the uncertainty surrounding the age-based wear-out or degradation of systems or
equipment is vital for the safe operation of a processing plant. A carefully planned inspection
and maintenance strategy not only mitigates the effect of age based degradation but also
reduces the threat of risk exposure. During the operational life of a facility, the only way to
prevent component failure is through optimal maintenance strategy which can facilitate
inspection, repair, overhaul or replacement. Some of the maintenance and inspection
activities can be completed while the processing unit is in operations; however some of the
equipment requires the processing unit to be in a non-operational state, usually called
shutdown. These maintenance and inspection activities involve cost, shutdown, and a
likelihood of having a reduced life due to induced human error. If the interval between
subsequent shutdown, maintenance and inspection tasks is too long, it may result in a number
of premature failures of components, which will result in higher economic consequences. On
the other hand, if the shutdown maintenance and inspection is performed very often, it will
not only increase the overall cost but also the possibility of induced human error. This is why
a careful inspection and maintenance shutdown interval is required. Finding an optimal
Page 193
172
shutdown interval, after taking into consideration the uncertainty, is a challenging task.
Failures due to wear-out, corrosion, erosion etc., can be modeled stochastically. Existing
maintenance strategies e.g., preventive maintenance, and condition based maintenance are
formulated on the probability of component failure only. However, the risk-based
maintenance and inspection strategy is a new paradigm change. A risk-based methodology
not only considers the probability of a failure of the equipment but also the possible
consequences of the failure. The economic consequences of a failure include the cost of
breakdown, production loss due to facility shutdown, consequence of environmental damage,
consequence of asset damage and cost of liability. Inspection and maintenance tasks
inherently have economic consequences such as cost of inspection, cost of repair, cost of
technical support, cost of replacement parts, labor and equipment cost. Keeping in mind the
importance of the probability of failure and its consequences, the risk based inspection and
maintenance strategy proposed in this thesis provides a legitimate choice for the decision
making process regarding the shutdown interval. In this proposed work, the reduction of risk
to a reasonably low and practicable level is considered to ensure that the risk-based shutdown
inspection and maintenance strategy maintains the safety of operations through the optimal
utilization of resources. The proposed optimization methodology is a trade-off between the
cost of failure, shutdown and the benefits of risk reduction, achieved by the optimal
shutdown interval in terms of increased safety, availability and reliability.
6.2 Research Contributions
In this proposed research, a methodology is developed and presented to estimate and
manage the shutdown of complex processing units or facilities which operate on a 24 hours
Page 194
173
and 365 days basis. The decision to shut-down a unit or facility is an important and a key
decision for operating companies as this may produce a severe negative impact on their
financial health. However, the benefits of having a best planned shutdown strategy will not
only help to achieve high availability and reliability, low maintainability, and low overall
cost but importantly will also minimize the operational risk. The availability of very limited
shutdown modeling for inspection and maintenance for processing facilities provides us an
opportunity to work on this topic, and to develop methodologies that can be applied and used
to benefit operating companies in achieving their financial objectives. As discussed earlier,
reliability, availability and cost are the three facet of risk.
The major contributions of this research are summarized as follows:
A framework to estimate the risk-based shutdown interval for a processing plant
Asset intensive industries such as oil and gas and petrochemical plants operate
on a continuous basis. Planning inspection on maintenance on individual equipment
will result in a significant impact on the operability as well as financial losses to the
shareholders. In order to minimize these impacts, a frame work to estimate shutdown
inspection and maintenance interval estimation on risk-based strategy is developed.
This research analyzes the unit or facility by developing a risk-based equipment
selection considering risk. The proposed research outlines the risk by estimating
consequences considering various hazards. The proposed methodology is applied to
develop shutdown interval for a LNG producing unit.
A risk-based methodology to estimate shutdown interval considering system
availability
Page 195
174
A novel risk-based approach to estimate the shutdown inspection and
maintenance interval considering system availability using Markov process is
presented. The proposed methodology reduces the risk of exposure to the operating
company and shareholders for planning facility shutdown by maintaining the desired
availability. This methodology ensures that the unit or plant is not only available for
production but also the overall risk exposure meets the acceptance criteria.
Considering and minimizing risk while planning for shutdown interval not only
enhances the availability but also the safety and operation of the facility. The
proposed methodology minimizes the financial consequences for an operating
company due to production loss, loss of assets, safety (e.g., injury or loss of life) and
environmental consequences.
A risk-based shutdown inspection and maintenance interval considering human
error for a processing facility
Repair is the maintenance action that restores the equipment to its operating
conditions. Some repair actions restore equipment to a new condition while others are
classed as minimal repair, i.e., they restore equipment to the condition prior to its
failure. However, in reality, an equipment is likely to be restored to a condition
between these two states. Occasionally, repairs may introduce faults in the equipment.
A majority of the maintenance models find the optimum maintenance and inspection
interval under the assumption that after maintenance action, the system or equipment
state will be as good as new. Other researchers have studied the impact of imperfect
maintenance while optimizing the maintenance and inspection interval. However, in
both the cases the optimization is performed considering individual equipment and
Page 196
175
the impact of facility shutdown while optimizing the maintenance and inspection
interval is not taken into account. The novel idea presented in this work is to link
various mechanics which can induce human error during inspection and maintenance
activities. SLIM methodology is deployed to estimate HEP for each set of inspection
and maintenance activities. Estimated HEP is then integrated in the probability of
system failure. Shutdown inspection and maintenance consequences of selected
equipment are determined and expressed in financial values ($). Integration of HEP
results in obtaining a better risk profile, which is later used to optimize the shutdown
interval.
Risk-based maintenance scheduling for a LNG gas sweetening unit
The previous three proposed articles help to develop an optimized shut down
inspection and maintenance interval for the operating facility. In this paper, a multi-
constrained, bi-objective maintenance scheduling optimization model is proposed
using genetic algorithms. The genetic algorithm model was developed using
MATLAB (Version 2015b) to solve this non-linear optimization problem. The
proposed simulation based approach presented in the study, provides an optimal
schedule for inspection, maintenance and replacement activities to achieve a reliable
performance of the facility considering, the facility shutdown. Inspection,
maintenance and replacement are considered as the three possible sets of activities to
develop the schedule. Overall, this methodology helps in developing an effective
planning for resource utilization. The developed Pareto-optimal model provides
flexibility to engineers and planners to develop maintenance schedules considering
different conflicting objectives.
Page 197
176
6.3 Conclusions
Inspection and maintenance optimization using mathematical modeling and
simulation of the stochastic process is a growing area of research. A critical review of
literature shows that there is a need for a robust risk-based inspection and maintenance model
considering the process plant shutdown to help make an informed decision. In this
dissertation, new models, approaches and algorithms have been explored to estimate and
manage the shutdown interval for complex hydrocarbon processing units.
The risk of equipment failure and its consequences on availability and reliability are
vital for the hydrocarbon industry. In order to achieve a desired reliability and availability,
these units are mostly taken out of service, i.e., put on “shutdown”. If the shutdown of the
unit or facility is not planned considering the risk, it will produce a severe negative financial
impact on the operating companies and their shareholders. By combining the probability of
failure and the consequences of failure, an optimal strategy is proposed for developing
shutdown interval.
The inspection and maintenance management and optimization is encouraging
operating companies and engineers to invest efforts in this domain to meet the availability
and reliability of the facilities. However, the emphasis is found to be very limited when
planning for shutdown of the facility and is generally based on Original Equipment
Manufacturer (OEM) suggested intervals. The aim of this proposed risk-based shutdown
strategy for a processing facility is to provide an optimal interval. This optimal shutdown
interval will not only improve the reliability and availability of the plant but will also protect
human life, financial investment and the environment.
Page 198
177
The key areas covered in this research include efforts to develop a risk-based frame
work for shutdown interval modeling, risk-based shutdown interval optimization considering
required availability, integrating human errors in shutdown interval optimization model, and
finally developing a risk-based maintenance schedule for the facility, considering shutdown.
In conclusion, the proposed methodologies will contribute to processing plant
industries in providing a methodology for shutdown interval optimization. Most important,
the proposed methodology not only takes account the uncertainty and variability by using
stochastic modeling but also the economic consequence of failure.
In conclusion, it is envisaged that this research will effectively contribute to the field
by providing a wide range of solutions to industry in terms of shutdown interval estimation
and management. This proposal is an attempt to overcome the shortcomings of the existing
methodologies published in the literature, which fail to capture the impact of overall facility
shutdown in long duration operations. In this work an attempt has been made to overcome
the said limitation and provide a novel solution to optimize shutdown interval with a risk-
based approach.
6.4 Recommendations for future research work
Inspection and maintenance optimization is in focus since the last few decades.
However, consideration of shutdown interval for inspection and maintenance is found to be
very limited in literature. In this proposed research, a methodology to develop shutdown
interval for a processing facility is presented considering the risk, availability, reliability,
imperfect maintenance and finally genetic algorithms are applied to develop a maintenance
Page 199
178
schedule. Along with the key development, there is always an option to enhance or extend
the proposed work. Some of the suggestions are discussed in this section.
1. In the presented research, a risk profile is developed considering the
consequences due to safety hazards, production loss and inspection and maintenance costs.
Generally, operating companies operate with the resources which can meet their ongoing
operations, however for shutdown they need to hire additional manpower, tools and purchase
spares. This work can be extended to optimize shutdown interval optimization including
other constraints such as inspection and maintenance manpower, tools and spares availability
and their financial impact on shutdown planning. Consideration of these in generating a risk
profile will provide a better insight into the optimization problem.
2. In the present work a risk-based shutdown interval methodology is explored
considering the availability of the facility. Here, the proposed methodology has considered a
constant failure and repair rate in determining a steady state availability to obtain the risk-
based shutdown interval. This work can be extended to develop state dependent models with
different failure behaviors. The flexibility of state-dependent models will help to develop
various failure modes that will result in obtaining a better representation of the situation.
3. A planned shutdown helps in utilizing the available resources to minimize the
operational risk. For any shutdown planning, multiple tasks can be considered such as no
action can be planned on certain equipment of the facility, and/or the equipment is left to
operate and continues to age with the same failure rate. An inspection, maintenance and
repair action may be scheduled and in some cases a decision may be made to replace the
equipment. These tasks will generate a detailed shutdown schedule for the considered
equipment. Developing a detailed time schedule for a specific shutdown will help taking
Page 200
179
account the uncertainties in completing these tasks and will lead to forecasting the actual
shutdown duration. This in turn will help the operating companies to adjust their risk
tolerance considering the impact of their delivery schedule and commitments.
4. Shutdown interval optimization for inspection and maintenance is considered
to ensure the safety, reliability, and availability of the units and the facility. In this research, a
simulation based Pareto-optimal solutions using genetic algorithms for multi-constrained
maintenance scheduling optimization are discussed for the equipment which can be inspected
and maintained without taking the facility in shutdown. The proposed methodology can be
extended to solve non-linear optimization problems for shutdown maintenance scheduling
with meta-heuristics such as Harmony Search algorithm (Geem, Kim, & Loganathan, 2001),
Tabu Search (Glover, 1998), and Simulated Annealing (Kirkpatrick, 1984), etc.
5. Further, the shutdown interval optimization problem can be coupled with
inflationary conditions to generate a risk profile for shutdown interval planning and decision
making.
Page 201
180
7 REFERENCES
7.1 References - Chapter 1
[1] Dhillon, B.S., (2002). Engineering maintenance, A Modern approach. CRC Press
LLC, 2000 N.W. Corporate Blvd., Boca Raton, Florida 33431.
[2] Duffua, S.O., Raouf, A., & Campbell, J., (1999). Maintenance planning and control,
modeling and analysis. Wiley, New York, N.Y.
[3] Duffua, S.O. & Daya M.A.B., (2004). Turnaround maintenance in petrochemical
industry, practice and suggested improvement. Journal of Quality in Maintenance
Engineering, 10(3), 184-190.
[4] Ebeling, C. E., (1996). An Introduction to Reliability and Maintainability
Engineering. 2nd edition, McGraw-Hill
[5] Lawrence, G., (2012). Cost estimating for turnarounds: Petroleum Technology
quarterly. Q1-2012. www.eqtq.com.
[6] Gulati, R., & Smith, R., (2009). Maintenance and Reliability Best Practices. Industrial
Press, Inc., 989 Avenue of the Americas New York, NY 10018.
[7] International atomic energy association, (2004). IAEA-TECDOC-1387, Safety
considerations for research reactors in extended shutdown, IAEA, VIENNA, Austria
[8] Kaplan, S., & Garrick, B.S., (1981). On the quantitative definition of risk, Risk
Analysis, 1, 11-27.
[9] Kobbacy, K.A.H, & Murthy, D.N.P., (2008). A complex system maintenance
handbook. Springer Series in Reliability Engineering, Springer-Verlang London
Limited.
Page 202
181
[10] Stephens, M.P., (2010). Productivity and Reliability-Based Maintenance
Management, Purdue University Press, USA.
[11] Telang, A.D. & Telang, A., (2010). Comprehensive Maintenance Management,
Policies, Strategies and Option; PHI Learning, ISBN – 978-81-203-3953-8.
7.2 References - Chapter 2
[1] API., (2009). Risk Based Inspection; Recommended Practice 580 (2nd ed.),
Washington, D.C., USA: American Petroleum Institute.
[2] API., (2008). Risk Based Inspection; Recommended Practice 581 (2nd ed.),
Washington, D.C., USA: American Petroleum Institute.
[3] Assael, M. J., & Kakosimos, K. E., (2010). Fires explosions and toxic gas dispersion;
Effects calculation and risk analysis. Broken Sound Parkway NW, Boca Raton, FL,
USA: CRC Press, Taylor & Francis Group.
[4] Cizelj, R. J., Mavko, B., & Kljenak, I., (2001). Component reliability assessment
using quantitative and qualitative data. Reliability Engineering and System Safety,
71, 81-95.
[5] Crowl, D. A., & Louvar, J. F., (2002). Chemical process safety: Fundamentals with
applications. Upper Saddle River, New Jersey, USA: Prentice Hall PTR.
[6] Duarte, J. A. C., Craveiro, J. C. T., & Trigo, T. P., (2006). Optimization of the
preventive maintenance plan of a series components system. International Journal of
Pressure Vessel and Piping, 83, 244-248.
Page 203
182
[7] Duffua, S. O., & Ben-Daya, M. A. B., (2004). Turnaround maintenance in
petrochemical industry; practice and suggested improvement. Journal of Quality in
Maintenance Engineering, 10(3), 184-190.
[8] Duffua, S. O., Raouf, A., & Campbell, J. D., (1999). Planning and control of
maintenance system, modeling and analysis. New York, N.Y., USA: John Wiley &
Sons, Inc.
[9] Ebeling, C. E., (1997). An introduction to reliability and maintainability engineering.
New York, N.Y., USA: McGraw-Hill.
[10] Fujiyama, K., Nagai, S., Akikuni, Y., Fujiwara, T., Furuya, K., & Matsumoto, S.,
(2004). Risk-based inspection and maintenance system for steam turbine.
International Journal of Pressure Vessel and Piping, 81, 825-835.
[11] Ghosh, D., & Roy, S., (2009). Maintenance optimization using probabilistic cost-
benefit analysis. Journal of Loss Prevention in the Process Industry, 22, 403-407.
[12] Hadavi, S. M. H., (2009). A heuristic model for risk and cost impacts of plant outage
maintenance schedule. Annals of Nuclear Energy, 36, 947-987.
[13] Judycki, D. C., (1994). Technical advisory on motor vehicle accident costs. US
Department of Transportation, Federal Highway Administration.
http://safety.fhwa.dot.gov/facts_stats/t75702.cfm Accessed 20.12.12.
[14] Keshavarz, G., Thodi, P., & Khan, F., (2011). Risk based shutdown management of
LNG units. Journal of Loss Prevention in the Process Industries, 25, 159-165.
[15] Khan, F. I., & Haddara, M., (2003). Risk-based maintenance (RBM): a quantitative
approach for maintenance/inspection scheduling and planning. Journal of Loss
Prevention in the Process Industries, 16, 561-573.
Page 204
183
[16] Khan, F. I., & Haddara, M., (2004)a. Risk-Based Maintenance (RBM): a new
approach for process plant inspection and maintenance. Process Safety Progress,
23(4), 252-265.
[17] Khan, F. I., & Haddara, M., (2004)b. Risk-based maintenance of ethylene oxide
production facilities. Journal of Hazardous Materials, 108, 147-159.
[18] Krishnasamy, L., Khan, F., & Haddara, M., (2005). Development of risk-based
maintenance (RBM) strategy for a power generating plant. Journal of Loss Prevention
in the Process Industries, 18, 69-81.
[19] Lawrence, G., (2012). Cost estimating for turnarounds: Petroleum Technology
quarterly. Q1-2012. www.eqtq.com.
[20] Lenahan, T., (1999). Turnaround management. Oxford, MA, UK: Butterworth-
Heinemann.
[21] Levitt, J., (2004). Managing maintenance shutdowns and outages (1st ed.). New
York, N.Y., USA: Industrial Press.
[22] Muhlbauer, W. K., (2004). Pipeline risk management manual, ideas, techniques, and
resources (3rd ed.). Burlington, MA, USA: Gulf Professional Publishing.
[23] Noortwijket, J. M., Dekker, R., Cooke, R. M., & Mazzuchi, T. A., (1992). Expert
judgment in maintenance optimization. IEEE Transactions on Reliability, 41(3), 427-
432.
[24] Obiajunwa, C., (2012). A framework for the evaluation of turnaround maintenance
projects. Journal of Quality in Maintenance Engineering, 18(4), 368-383.
[25] OREDA (2002). Offshore reliability data (4th ed.), Trondheim, NORWAY.
Page 205
184
[26] Pokharel, S., & Jiao, J., (2008). Turnaround maintenance management in a processing
industry, a case study. Journal of Quality in Maintenance Engineering, 14(2), 109-
122.
[27] Rusin, A., & Wojaczek, A., (2012). Optimization of Power Machines maintenance
intervals taking the risk into consideration. Eksploatacja i Niezawodnosce
Maintenance and Reliability, 14(1), 72-76.
[28] Schon, G., (1980). What is meant by risk? Basic technical views for the initiation and
application of safety legislation. Journal of Occupational Accidents, 2, 273-281.
[29] Tam, S. B., Chan, W. M., & Price, J. W. H., (2006). Optimal maintenance intervals
for a multi-component system: production planning & control. The Management of
Operations, 17(8), 769-779.
[30] Tan, J. S., & Kramer, M. A., (1997). A general framework for preventive
maintenance optimization in chemical process operations. Computers and Chemical
Engineering, 21(12), 1451-1469.
[31] U.S. Energy Information Administration, (2012). LNG Price. Retrieved from
http://www.eia.gov/dnav/ng/hist/n9103us3m.htm Accessed 30.09.12.
[32] Vatn, J., Hokstand, P., & Bodsberg, L., (1996). An overall model for maintenance
optimization, Reliability Engineering & System Safety, 51(3), 241–257.
[33] Vaurio, J.K., (1995). Optimization of test and maintenance intervals based on risk and
cost, Reliability Engineering and System Safety, 49(1), 23–36.
[34] Zulkipli, G., Halib, M., Nordin, S. M., & Ghazali, M. C., (2009). Rusty bolts and
broken valves: a study on the plant technology, size, and organizational structure of
Page 206
185
plant turnaround maintenance in Malaysian process-based industries. International
Review of Business Research Papers, 5(5), 239-256.
7.3 References - Chapter 3
[1] Alabdulkarem, A., Mortazavi, A., Hwang, Y., Radermacher, R., & Rogers, P.,
(2011). Optimization of propane pre-cooled mixed refrigerant LNG plant. Applied
Thermal Engineering, 31, 1091–1098.
[2] Alsyouf, I., (2007). The role of maintenance in improving companies, productivity
and profitability. International Journal of Production Economics, 105 (1), 70–78.
[3] API, (2009). Risk Based Inspection: Recommended Practice 580, Second ed.
American Petroleum Institute, Washington, D.C.,USA.
[4] Assael, M. J., & Kakosimos, K. E., (2010). Fires explosions and toxic gas dispersion;
Effects calculation and risk analysis. Broken Sound Parkway NW, Boca Raton,
FL,USA: CRC Press, Taylor & Francis Group.
[5] Backlund, F., & Hanu, J., (2002). Can we make maintenance decision on risk
analysis?. Journal of Quality in Maintenance Engineering, 8 (1), 77-91.
[6] Bertolini, M., Bevilacqua, M., Ciarapica, F.E., & Giacchetta, G., (2009).
Development of Risk-Based Inspection and Maintenance procedures for an oil
refinery. Journal of Loss Prevention in the Process Industries, 22, 244–253.
[7] Cizelj, R. J., Mavko, B., & Kljenak, I., (2001). Component reliability assessment
using quantitative and qualitative data. Reliability Engineering and System Safety,
71, 81-95.
Page 207
186
[8] Crowl, D. A., & Louvar, J. F. (2002). Chemical process safety: Fundamentals with
applications. Upper Saddle River, New Jersey, USA: Prentice Hall PTR.
[9] Dey, K.P., Ogunlana, S.O., Gupta, S.S., & Tabucanon, M.T., (1998). A risk-based
maintenance model for cross-country pipelines. Cost Engineering, 40 (4), 24–31.
[10] Dey, P.M., (2001). A risk-based model for inspection and maintenance of cross-
country petroleum pipeline. Journal of Quality in Maintenance Engineering, 7 (1),
25–41.
[11] Duarte, J.A.C., Craveiro, J.C.T., & Trigo, T.P., (2006). Optimization of the
preventive maintenance plan of a series components system. International Journal of
Pressure Vessels and Piping, 83, 244–248.
[12] Duffua, S. O., & Ben-Daya, M. A. B., (2004). Turnaround maintenance in
petrochemical industry; practice and suggested improvement. Journal of Quality in
Maintenance Engineering, 10(3), 184-190.
[13] Duffua, S. O., Raouf, A., & Campbell, J. D., (1999). Planning and control of
maintenance system, modeling and analysis. New York, N.Y., USA: John Wiley &
Sons, Inc.
[14] Ebeling, C. E. (1997). An introduction to reliability and maintainability engineering.
New York, N.Y., USA: McGraw-Hill.
[15] Fujiyama, K., Nagai, S., Akikuni, Y., Fujiwara, T., Furuya, K., Matsumoto, S.,
Takagi, K., & Kawabata, T., (2004). Risk-based inspection and maintenance system
for steam turbine. International Journal of Pressure Vessels and Piping, 81, 825–835.
[16] Ghosh, D., & Roy, S. (2009). Maintenance optimization using probabilistic cost-
benefit analysis. Journal of Loss Prevention in the Process Industry, 22, 403-407.
Page 208
187
[17] Jacob, D., & Amari, S., (2005). Analysis of complex repairable systems. Institute of
Electrical and Electronics Engineers, 54, 517–529.
[18] Judycki, D.C., (1994). Technical Advisory on Motor Vehicle Accident Costs. US
Department of Transportation, Federal Highway Administration, USA.
http://safety.fhwa.dot.gov/facts stats/t75702, Accessed on December 20, 2012.
[19] Keshavarz, G., Thodi, P., & Khan, F., (2011). Risk based shutdown management of
LNG units. Journal of Loss Prevention in the Process Industries, 25, 159-165.
[20] Khan F. I., & Haddara, M., (2004)a. Risk-Based Maintenance (RBM): A new
approach for process plant inspection and maintenance. American Institute of
Chemical Engineers Process Safety Progress, 23(4), 252-265.
[21] Khan, F. I., & Haddara, M., (2003). Risk-based maintenance (RBM): A quantitative
approach for maintenance/inspection scheduling and planning. Journal of Loss
Prevention in the Process Industries, 16, 561-573.
[22] Khan, F.I., & Haddara, M., (2004)b. Risk-based maintenance of ethylene oxide
production facilities. Journal of Hazardous Materials, 108(3), 147–159.
[23] Khan, F.I., Haddara, M., & Krishnasamy, L., (2008). A new methodology for risk-
based availability analysis. IEEE Transactions on Reliability, 57, 103–112.
[24] Krishnasamy, L., Khan, F.I., & Haddara, M., (2005). Development of risk-based
maintenance (RBM) strategy for a power generating plant. Journal of Loss Prevention
in the Process Industries, 18, 69-81.
[25] Kumar, E.V., & Chaturvedi, S.K., (2008). Prioritization of maintenance tasks on
industrial equipment for reliability. International Journal of Quality & Reliability
Management, 28 (1), 109–126.
Page 209
188
[26] Lawrence, G., (2012). Cost estimating for turnarounds: Petroleum Technology
quarterly. Q1-2012. www.eqtq.com., Last accessed on August 5, 2014.
[27] Lenahan, T., (1999). Turnaround management. Oxford, MA, UK: Butterworth-
Heinemann.
[28] Levitt, J., (2004). Managing maintenance shutdowns and outages (1st ed.). New
York, N.Y., USA: Industrial Press.
[29] Mannan, S., (2005). Lee’s Loss Prevention in the Process Industries: Hazard
Identification. Assessment and Control, Vol. 1, Third Edition, Elsevier
Butterworth_Heinemann, Burlington, MA.
[30] Mokhatab, S., & Economides, M.J., (2006). Onshore LNG production process
selection, SPE Annual Technical Conference and Exhibition, San Antonio, TX,
September 24–27.
[31] Mourbray, J., (1997). An Introduction to Reliability Centered Maintenance,
Butterworth-Heinemann, Oxford.
[32] Muhlbauer, W. K., (2004). Pipeline risk management manual, ideas, techniques, and
resources (3rd ed.). Burlington, MA, USA: Gulf Professional Publishing.
[33] NASA, (2000), The National Aeronautics and Space Administration: Reliability-
Centered Maintenance Guide for Facilities and Collateral Equipment, NASA,
Washington, DC.
[34] Neil, M., & Marquez, D., (2012). Availability modeling of repairable systems using
Bayesian networks, Engineering Applications of Artificial Intelligence, 25(4) ,698-
704.
Page 210
189
[35] Nowlan, F.S., & Heap, W., (1978). Reliability Centered Maintenance, US
Department of Commerce, National Technical Information Services, Springfield, VA.
[36] OREDA, (2002). Offshore reliability data (4th ed.), Trondheim, NORWAY.
[37] Penrose, H.W., (2009). Simple time-to-failure estimation techniques for reliability
and maintenance of equipment, IEEE Electrical Insulation Magazine, 25(4), 14–18.
[38] Pil, C.K., Rausand, M., & Vatn, J., (2008). Reliability assessment of reliquefaction
systems on LNG carriers. Reliability Engineering & System Safety, 93(9), 1345-
1353.
[39] Roberts, M.J., & Agrawal, R., (2001). Hybrid Cycle for the Production of Liquefied
Natural Gas. US Patent 6,308,531.
[40] Rusin, A., & Wojaczek, A., (2012). Optimization of Power Machines maintenance
intervals taking the risk into consideration. Eksploatacja i Niezawodnosce
Maintenance and Reliability, 14(1), 72-76.
[41] Sarkar, A., & Behera, D.K., (2012). Development of risk based maintenance strategy
for gas turbine power system. International Journal of Advanced Research in
Engineering and Applied Science, 1 (2), 20–38.
[42] Schon, G., (1980). What is meant by risk? Basic technical views for the initiation and
application of safety legislation. Journal of Occupational Accidents, 2, 273-281.
[43] Tan, J.S., & Kramer, M.A., (1997). A general framework for preventive maintenance
optimization in chemical process operations. Computers & Chemical Engineering,
21(12), 1451–1469.
[44] U.S. Energy Information Administration, (2012). LNG Price. Retrieved from
http://www.eia.gov/dnav/ng/hist/n9103us3m.htm Accessed 30.09.12.
Page 211
190
[45] Vatn, J., Hokstand, P., & Bodsberg, L., (1996). An overall model for maintenance
optimization. Reliability Engineering & System Safety, 51(3), 241–257.
[46] Vaurio, J.K., (1995). Optimization of test and maintenance intervals based on risk and
cost. Reliability Engineering and System Safety, 49(1), 23–36.
[47] Wang, Y., Cheng, G., Hu, H., & Wu, W., (2012). Development of a risk-based
maintenance strategy using FMEA for a continuous catalytic reforming plant. Journal
of Loss Prevention in the Process Industries, 25(6) ,958–965.
[48] Zhaoyang, T., Jianfeng, L., Zongzhi, W., Jianhu, Z., & Weifeng, H., (2011). An
evaluation of maintenance strategy using risk based inspection. Safety Science, 49(6),
852–860.
7.4 References - Chapter 4
[1] Alsyouf, I., (2007). The role of maintenance in improving companies, productivity
and profitability. International Journal of Production Economics, 105 (1), 70–78.
[2] API, (2009). Risk Based Inspection: Recommended Practice 580. Second ed.
American Petroleum Institute, Washington, D.C.,USA.
[3] Backlund, F., & Hanu, J., (2002). Can we make maintenance decision on risk
analysis?. Journal of Quality in Maintenance Engineering, 8 (1), 77-91.
[4] Ben-Daya, M., & Alghamdi, A.S., (2000). On an imperfect preventive maintenance
model. International Journal of Quality & Reliability Management, 17(06), 661–670.
[5] Bertolini, M., Bevilacqua, M., Ciarapica, F.E., & Giacchetta, G., (2009).
Development of Risk-Based Inspection and Maintenance procedures for an oil
refinery. Journal of Loss Prevention in the Process Industries, 22, 244–253.
Page 212
191
[6] Block, H.W., Borges, W.S., & Savits, T.H., (1985). Age dependent minimal repair.
Journal of Applied Probability, 22 (2), 370–385.
[7] Brown, M., & Proschan, F., (1983). Imperfect repair. Journal of Applied Probability,
20, 851–859.
[8] Dey, K.P., Ogunlana, S.O., Gupta, S.S., & Tabucanon, M.T., (1998). A risk-based
maintenance model for cross-country pipelines. Cost Engineering, 40 (4), 24–31.
[9] Dey, P.M., (2001). A risk-based model for inspection and maintenance of cross-
country petroleum pipeline. Journal of Quality in Maintenance Engineering, 7 (1),
25–41.
[10] Dhillon, B.S., & Liu, Y., (2006). Human error in maintenance: a review. Journal of
Quality in Maintenance Engineering, 12 (1), 21–36.
[11] Dhillon, B.S., & Yang, N., (1995). Probabilistic analysis of a maintainable system
with human error. Journal of Quality in Maintenance Engineering, 1(2), 50–59.
[12] Dhillon, B.S., (1986). Human Reliability with Human Factor. Pergamon Press, New
York, USA.
[13] Duarte, J.A.C., Craveiro, J.C.T., & Trigo, T.P., (2006). Optimization of the
preventive maintenance plan of a series components system. International Journal of
Pressure Vessels and Piping, 83, 244–248.
[14] Duffua, S.O., & Ben-Daya, M.A., (2004). Turnaround maintenance in petrochemical
industry, practice and suggested improvement. Journal of Quality in Maintenance
Engineering, 10 (3), 184–190.
Page 213
192
[15] Fujiyama, K., Nagai, S., Akikuni, Y., Fujiwara, T., Furuya, K., Matsumoto, S.,
Takagi, K., & Kawabata, T., (2004). Risk-based inspection and maintenance system
for steam turbine. International Journal of Pressure Vessels and Piping, 81, 825–835.
[16] Ghosh, D., & Roy, S., (2009). Maintenance optimization using probabilistic cost-
benefit analysis. Journal of Loss Prevention in the Process Industries, 22(4), 403–407.
[17] Hameed, A., Khan, F., & Ahmed, S., (2014). A risk-based methodology to estimate
shutdown interval considering system availability. Process Safety Progress, 34(3),
267-279. http://dx.doi.org/10.1002/prs.11722.
[18] Hameed, A., & Khan, F., (2014). A framework to estimate the risk-based shutdown
interval for a processing plant. Journal of Loss Prevention in the Process Industries,
32, 18–29.
[19] Jacob, D., & Amari, S., (2005). Analysis of complex repairable systems. Institute of
Electrical and Electronics Engineers, 54, 517–529.
[20] Judycki, D.C., (1994). Technical Advisory on Motor Vehicle Accident Costs. US
Department of Transportation, Federal Highway Administration, USA.
http://safety.fhwa.dot.gov/facts stats/t75702.
[21] Khan, F.I., & Haddara, M., (2004)a. Risk-based maintenance (RBM): anew approach
for process plant inspection and maintenance. Process Safety Progress, 23 (4), 252–
265.
[22] Khan, F.I., & Haddara, M., (2004)b. Risk-based maintenance of ethylene oxide
production facilities. Journal of Hazardous Materials, 108(3), 147–159.
Page 214
193
[23] Khan, F.I., & Haddara, M., (2003). Risk-based maintenance (RBM); aquantitative
approach for maintenance/inspection scheduling and planning. Journal of Loss
Prevention in the Process Industries, 16(6), 561–573.
[24] Khan, F.I., Haddara, M., & Krishnasamy, L., (2008). A new methodology for risk-
based availability analysis. IEEE Transactions on Reliability, 57, 103–112.
[25] Kirwan B., (1996). The validation of three Human Reliability Quantification
techniques – THERP, HEART and JHEDI; Part 1 – technique descriptions and
validation issues. Applied Ergonomics, 27(6), 359-373.
[26] Kirwan, B., (1997). The validation of three human reliability quantification
techniques—THERP, HEART and JHEDI; part III—practical aspects of the usage of
the techniques. Applied Ergonomics, 28 (1), 27–39.
[27] Kirwan, B., Kennedy, R., Taylor-Adams, & S., Lambert, B., (1997). The validation of
three human reliability quantification techniques—THERP, HEART and JHEDI: part
II- results of validation exercise. Applied Ergonomics, 28 (1), 17–25.
[28] Krishnasamy, L., Khan, F.I., & Haddara, M., (2005). Development of risk-based
maintenance (RBM) strategy for a power generating plant. Journal of Loss Prevention
in the Process Industries, 18(2), 69-81.
[29] Kumar, E.V., & Chaturvedi, S.K., (2008). Prioritization of maintenance tasks on
industrial equipment for reliability. International Journal of Quality & Reliability
Management, 28 (1), 109–126.
[30] Lawrence, G., (2012). Cost estimating for turnarounds. Petroleum Technology
quarterly. Q1, 37-43, www.eqtq.com.
Page 215
194
[31] Levitin, G., & Lisnianski, A., (2000). Optimization of imperfect preventive
maintenance for multi-state system. Relibility Engineering and System Safety, 67 (2),
193–203.
[32] Li, H., & Shaked, M., (2003). Imperfect repair models with preventive maintenance.
Journal of Applied Probability, 40(4), 1043–1059.
[33] Malik, M.A.K., (1979). Reliable preventive maintenance policy. AIIE
Transactions,11(3), 221–228.
[34] Mannan, M.S., & Yang, X., (2010). The development and application of dynamic
operational risk assessment in oil/gas and chemical process industry. Reliability
Engineering & System Safety, 95 (7), 806–815.
[35] Nakagawa, T., & Yasui, K., (1987). Optimum policies for a system with imperfect
maintenance. IEEE Transactions on Reliability, R-36 (5), 631–633.
[36] Nakagawa, T., Qian, C., & Zhao, X., 2012. Optimal imperfect preventive
maintenance policies for a used system. International Journal of Systems Science,
43(9), 1632–1641.
[37] Neil, M., & Marquez, D., (2012). Availability modeling of repairable systems using
Bayesian networks. Engineering Applications of Artificial Intelligence, 25(4) ,698-
704.
[38] Nguyen, D.G., & Murthy, D.N.P., (1981). Optimal maintenance policy with imperfect
preventive maintenance. IEEE Transactions on Reliability, R-30(5), 496-497.
[39] Noroozi, A., Khakzad, N., Khan, F., MacKinnon, S., & Abbassi, R., (2013). The role
of human error in risk analysis: application to pre and post-maintenance procedures of
process facilities. Reliability Engineering & System Safety, 119, 251–258.
Page 216
195
[40] Noroozi, A., Khan, F., MacKinnon, S., Amyotte, P., & Deacon, T., (2014).
Determination of human error probabilities in maintenance procedures of a pump.
Process Safety and Environmental Protection, 92(2), 131–141.
[41] Obiajunwa, C.C., (2012). A framework for the evaluation of turnaround maintenance
projects. Journal of Quality in Maintenance Engineering, 18 (4), 368–383.
[42] Pil, C.K., Rausand, M., & Vatn, J., (2008). Reliability assessment of reliquefaction
systems on LNG carriers. Reliability Engineering & System Safety, 93(9), 1345-
1353.
[43] Rangan, A., & Grace, R.E., (1989). Optimal replacement policies for a deteriorating
system with imperfect maintenance. Advances in Applied Probability, 21(4), 949–
951.
[44] Rusin, A., & Wojaczek, A., (2012). Optimization of power machines maintenance
intervals taking the risk into consideration. Eksploatacja i Niezawodnosc-
Maintenance and Reliability, 14 (1), 72–76.
[45] Sarkar, A., & Behera, D.K., (2012). Development of risk based maintenance strategy
for gas turbine power system. International Journal of Advanced Research in
Engineering and Applied Science, 1 (2), 20–38.
[46] Sönmez, E., Kekre, S., Scheller-Wolf, A., & Secomandi, N., (2013). Strategic
analysis of technology and capacity investments in the liquefied natural gas industry.
European Journal of Operational Research, 226 (1), 100–114.
[47] Swain A.D., & Guttmann H. E., (1983); Handbook of Human Reliability Analysis
with Emphasis on Nuclear Power Plant Applications: NUREC/CR-1278, U.S.
Page 217
196
Nuclear Regulatory Commission, with Addendum #1 to NUREC/CR-1278, August
1983, September 1, 1985, by A. D. Swain.
[48] Toriizuka, T., (2001). Application of performance shaping factor (PSF) for work
improvement in industrial plant maintenance tasks. International Journal of Industrial
Ergonomics, 28 (3-4), 225–236.
[49] Tan, J.S., & Kramer, M.A., (1997). A general framework for preventive maintenance
optimization in chemical process operations. Computers & Chemical Engineering,
21(12), 1451–1469.
[50] Vatn, J., Hokstand, P., & Bodsberg, L., (1996). An overall model for maintenance
optimization. Reliability Engineering & System Safety, 51(3), 241–257.
[51] Vaurio, J.K., (1995). Optimization of test and maintenance intervals based on risk and
cost. Reliability Engineering and System Safety, 49(1), 23–36.
[52] Wang, Y., Cheng, G., Hu, H., & Wu, W., (2012). Development of a risk-based
maintenance strategy using FMEA for a continuous catalytic reforming plant. Journal
of Loss Prevention in the Process Industries, 25(6) ,958–965.
[53] Wilson, L., & McCutcheon, D., (2003). Industrial Safety and Risk Management. The
University of Alberta Press, Edmonton, Alberta, Canada.
[54] Zhaoyang, T., Jianfeng, L., Zongzhi, W., Jianhu, Z., & Weifeng, H., (2011). An
evaluation of maintenance strategy using risk based inspection. Safety Science, 49(6),
852–860.
Page 218
197
7.5 References - Chapter 5
[1] Adhikary, D.D., Bose, G.K., Jana, D.K., Bose, D., & Mitra, S., (2015). Availability
and cost-centered preventive maintenance scheduling of continuous operating series
systems using multi-objective genetic algorithm: A case study. Quality Engineering,
1-6. doi: 10.1080/08982112.2015.1086001
[2] Ahmadi, R., & Newby, M., (2011). Maintenance scheduling of a manufacturing
system subject to deterioration. Reliability Engineering & System Safety, 96, 1411-
1420.
[3] Ahmed, Q., Moghaddam, K. S., Raza, S. A., & Khan, F.I., (2015). A multi-
constrained maintenance scheduling optimization model for a hydrocarbon processing
facility. Proceedings of the Institution of Mechanical Engineers, Part O: Journal of
Risk and Reliability, 1–18. doi. 10.1177/1748006X15573166
[4] Amirian, H., & Sahraeian, R., (2015). Augmented ε-constraint method in multi-
objective flowshop problem with past sequence set-up times and a modified learning
effect. International Journal of Production Research, 53 (19), 5962-5976.
[5] API, (2009). Risk Based Inspection; Recommended Practice 580; Second edition.
American Petroleum Institute, Washington, D.C., USA.
[6] Backlund, F., & Hanu, J., (2002). Can we make maintenance decision on risk
analysis?. Journal of Quality in Maintenance Engineering, 8 (1), 77-91.
[7] Bertolini, M., Bevilacqua, M., Ciarapica, F.E., & Giacchetta, G., (2009).
Development of Risk-Based Inspection and Maintenance procedures for an oil
refinery. Journal of Loss Prevention in the Process Industries, 22, 244–253.
Page 219
198
[8] Berube, J.F., Gendreau, M., & Potvin, J.Y., (2009). An exact ɛ-constraint method for
bi-objective combinatorial optimization problems: application to the traveling
salesman problem with profits. European Journal of Operational Research, 194, 39–
50.
[9] Campbell, J.D., Jardine, A.K.S., & McGlynn, J., (2011). Asset Management
Excellence; Optimizing Equipment Life-Cycle Decisions; Second edition. CRC Press,
Taylor & Francis Group, Boca Raton, FL, USA.
[10] Chen, C.L., Vempati, V.S., & Aljaber, N., (1995). An application of genetic
algorithms for flowshop problems. European Journal of Operational Research, 80,
389-396.
[11] Coit, D.W., & Smith, A.E., (1996). Reliability optimization of series-parallel systems
using a genetic algorithm. IEEE Transactions, 45, 254-266.
[12] Damghani, K.K., Abtahi, A.R., & Tavana, M., (2013). A new multi-objective particle
swarm optimization method for solving reliability redundancy allocation problems.
Reliability Engineering and System Safety, 111, 58–75.
[13] Deb, K., (2000). An efficient constraint handling method for genetic algorithms.
Computer Methods in Applied Mechanics and Engineering, 186(2), 311-338.
[14] Deb, K., (2001). Multi-objective optimization using evolutionary algorithms. Wiley-
Interscience series in systems and optimization; John Wiley & Sons, Ltd., England.
[15] Deep, K., Singh, K.P., Kansal, M.L., & Mohan, C., (2009). A real coded genetic
algorithm for solving integer and mixed integer optimization problems. Applied
Mathematics and Computation, 212 (2), 505-518.
Page 220
199
[16] Dowsland, K.A., (1996). Genetic algorithms-a tool for OR?. The Journal of the
Operational Research Society, 47, 550-561.
[17] Esmaeili, M., (2012). Optimize costs of the single-machine scheduling problem with
maintenance activities by using genetic algorithm. Management Science Letters, 2,
673-680.
[18] Fitouhi, M.C., & Nourelfath, M., (2014). Integrating noncyclical preventive
maintenance scheduling and production planning for multi-state systems. Reliability
Engineering and System Safety, 121, 175-186.
[19] Fu, F., (2013). Maintenance scheduling optimization for electromechanical equipment
based on reliability. Computer Integrated Manufacturing System,19(12), 2940-2946.
[20] Garg, H., Monica, R., & Sharma, S., (2013). Preventive maintenance scheduling of
the pulping unit in a paper plant. Japan Journal of Industrial and Applied
Mathematics, 30(2), 397-414.
[21] Ghosh, D., & Roy, S., (2009). Maintenance optimization using probabilistic cost-
benefit analysis. Journal of Loss Prevention in the Process Industry, 22, 403-407.
[22] Go, H., Kim, J. S., & Lee, D., (2013). Operation and preventive maintenance
scheduling for containerships: Mathematical model and solution algorithm. European
Journal of Operational Research, 229, 626-636.
[23] Gowid S., Dixon R., & Ghani S., (2014). Optimization of reliability and maintenance
of liquefaction system on FLNG terminals using Markov modeling. International
Journal of Quality & Reliability Management, 31(3), 293 – 310.
Page 221
200
[24] Hadi, M., Ashkan, M., & Isa, N. K. A., (2012). A reliability/availability approach to
joint production and maintenance scheduling with multiple preventive maintenance
services. International Journal of Production Research, 50, 5906-5925.
[25] Hameed A., & Khan, F., (2014). A framework to estimate the risk-based shutdown
interval for a processing plant. Journal of Loss Prevention in the Process Industries,
32, 18–29.
[26] Hameed A., Khan, F. & Ahmed, S., (2014). A risk-based methodology to estimate
shutdown interval considering system availability. Process Safety Progress, 34(3),
267-279.
[27] Jones, D.F., Mirrazavi, S.K., & Tamiz, M., (2002). Multi-objective meta-heuristics:
An overview of the current state-of-the-art. European Journal of Operational
Research, 137 (1), 1-9.
[28] Kancev, D., Gjorgiev, B., & Cepin, M., (2011). Optimization of test interval for
ageing equipment; A multi-objective genetic algorithm approach. Journal of Loss
Prevention in the Process Industries, 24(4), 397-404.
[29] Kapur, K.C., & Lamberson, L.R., (1977). Reliability in engineering design. John
Willey & Sons, Inc., Newyork, USA.
[30] Kaveshgar, N., Huynh, N., & Rahimian, S.K., (2012). An efficient genetic algorithm
for solving the quay crane scheduling problem. Expert Systems with Applications, 39,
13108–13117.
[31] Keshavarz, G., Thodi, P. & Khan, F., (2011). Risk based shutdown management of
LNG units. Journal of Loss Prevention in the Process Industries, 25(1), 159-165.
Page 222
201
[32] Khan F. I., & Haddara, M., (2004)a. Risk-Based Maintenance (RBM): A new
approach for process plant inspection and maintenance. American Institute of
Chemical Engineers Process Safety Progress, 23(4), 252-265.
[33] Khan F. I., & Haddara, M., (2004)b. Risk-based maintenance of ethylene oxide
production facilities. Journal of Hazardous Materials, A108, 147-159.
[34] Khan F.I., & Haddara, M., (2003). Risk-based maintenance (RBM); a quantitative
approach for maintenance/inspection scheduling and planning. Journal of Loss
Prevention in the Process Industries, 16(6), 561-573.
[35] Laumanns, M., Thiele, L., & Zitzler, E., (2006). An efficient, adaptive parameter
variation scheme for metaheuristics based on the epsilon-constraint method. European
Journal of Operational Research, 169, 932–942.
[36] MATLAB, (2015b)a. MATLAB documentation, retrieved
from http://www.mathworks.com/help/gads/how-the-genetic-algorithm-
works.html. on Dec 14, 2015.
[37] MATLAB, (2015b)b. MATLAB documentation, retrieved from
http://www.mathworks.com/help/gads/mixed-integer-optimization.html. on Dec 14,
2015.
[38] MATLAB, (2015b)c. MATLAB documentation, retrieved from
http://www.mathworks.com/help/gads/gaoptimset.html. on Dec 14, 2015.
[39] MATLAB, (2015b)d. MATLAB documentation, retrieved from
http://www.mathworks.com/help/gads/gaoptimset.html. on Feb 14, 2016.
[40] Mirabedini, S., Mina, N. H., & Iranmanesh, S.H., (2012). Multi-objective
optimization research of multi parallel machine with different preventive maintenance
Page 223
202
planning and scheduling with genetic algorithm. International Journal of Academic
Research in Business and Social Sciences, 2(12), 129-139.
[41] Moghaddam, S. K., & Usher, S. J., (2011). Preventive maintenance and replacement
scheduling for repairable and maintainable systems using dynamic programming.
Computers & Industrial Engineering; 60(4), 654-665.
[42] Mokhatab, S., Mak, J.Y., Valappil, J. V., & Wood, D. A., (2014). Handbook of
Liquefied Natural Gas. Kidlington, Oxford, UK.
[43] Morabi, Z.S., Owlia, M.S., Bashiri, M., & Doroudyan, M.H., (2015). Multi-objective
design of control charts with fuzzy process parameters using the hybrid epsilon
constraint. Applied Soft Computing, 30, 390-399.
[44] Nwaoha, T.C., Yang, Z., Wang, J., Bonsall, S., (2010). Application of genetic
algorithm to risk-based maintenance operations of liquefied natural gas carrier
systems. Proceedings of the Institution of Mechanical Engineers, Part E: Journal of
Process Mechanical Engineering, 225(1), 40-52.
[45] Painton, L., & Campbell, J., (1995). Genetic algorithms in optimization of system
reliability. IEEE Transactions on Reliability, 44(2), 172-178.
[46] Rusin, A., & Wojaczek, A., (2012). Optimization of Power Machines maintenance
intervals taking the risk into consideration. Eksploatacja i Niezawodnosc –
Maintenance and Reliability, 14(1), 72-76.
[47] Salvador, P.C., & Juan Carlos, R.R., (2013). A model for the preventive maintenance
scheduling of power plants including wind farms. Reliability Engineering & System
Safety, 119, 67-75.
Page 224
203
[48] Silver. E.A., (2004). An overview of heuristic solution methods. Journal of the
operational research society, 55(9), 936-956.
[49] Wang, Y., Cheng, G., Hu, H., & Wu, W., (2012). Development of a risk-based
maintenance strategy using FMEA for a continuous catalytic reforming plant. Journal
of Loss Prevention in the Process Industries, 25(6), 958-965.
[50] Xu, B., Han X., Wang, Y., & Sun, D., (2012). Risk-based optimization model for
system maintenance scheduling. IEEE International Conference on Power System
Technology (POWERCON), 1-6. doi: 10.1109/PowerCon.2012.6401315
[51] Zhaoyang, T., Jianfeng, L., Zongzhi, W., Jianhu, Z., & Weifeng, H., (2011). An
evaluation of maintenance strategy using risk based inspection. Safety Science, 49(6),
852–860.
7.6 References - Chapter 6
[1] Geem, G.W., Kim, J.H., & Loganathan, G. V., (2001). A New Heuristic Optimization
Algorithm: Harmony Search. Simulation, 76(2), 60-68.
[2] Glover, F., (1998). Tabu search - Wellsprings and challenges. European Journal of
Operational Research, 106(2), 221-225.
[3] Kirkpatrick, S., (1984). Optimization by simulated annealing: Quantitative studies.
Journal of Statistical Physics, 34(5), 975-986.