EIOPA-BoS/18-176 27th April 2018 RISK DASHBOARD April 2018 1 Risks Level Trend 1. Macro risks High 2. Credit risks Medium 3. Market risks Medium 4. Liquidity and funding risks Medium 5. Profitability and solvency Medium 6. Interlinkages and imbalances Medium 7. Insurance (underwriting) risks Medium Market perceptions Level Trend 8. Market perceptions Medium Key observations: - Risk exposures for the insurance sector remained stable in Q4 2017. - Despite positive macroeconomic developments, low interest rates continue to represent a major source of risk for insurers. - Credit risk and market risk are still at a medium level. Spreads further decreased and concerns about potential risk mispricing remained. Volatility of equity prices increased and valuations are now slightly lower. - Median figures for all profitability indicators are broadly at the same level as in Q4 2016. Solvency positions continued to be strong for both groups and solo companies. - The impact of the natural catastrophes observed in Q3 2017 keeps insurance risks at a medium level. - Market perceptions were mixed, with insurers’ stock prices outperforming the market but at the same time a deterioration of the external rating outlook for some insurance groups. 1 Reference date for company data is Q4-2017 for quarterly indicators and 2016 YE for annual indicators. The cut-off date for most indicators based on market data is end-March 2018.
Transcript
EIOPA-BoS/18-176
27th April 2018
RISK DASHBOARD
April 20181
Risks Level Trend
1. Macro risks High
2. Credit risks Medium
3. Market risks Medium
4. Liquidity and funding risks Medium
5. Profitability and solvency Medium
6. Interlinkages and imbalances Medium
7. Insurance (underwriting) risks Medium
Market perceptions Level Trend
8. Market perceptions Medium
Key observations:
- Risk exposures for the insurance sector remained stable in Q4 2017. - Despite positive macroeconomic developments, low interest rates continue to
represent a major source of risk for insurers.
- Credit risk and market risk are still at a medium level. Spreads further decreased and concerns about potential risk mispricing remained. Volatility of equity prices increased and valuations are now slightly lower.
- Median figures for all profitability indicators are broadly at the same level as in Q4 2016. Solvency positions continued to be strong for both groups and solo companies.
- The impact of the natural catastrophes observed in Q3 2017 keeps insurance risks at a medium level.
- Market perceptions were mixed, with insurers’ stock prices outperforming the
market but at the same time a deterioration of the external rating outlook for some insurance groups.
1 Reference date for company data is Q4-2017 for quarterly indicators and 2016 YE for annual indicators. The cut-off date for
most indicators based on market data is end-March 2018.
2
Macro risks
Level: high
Trend: constant
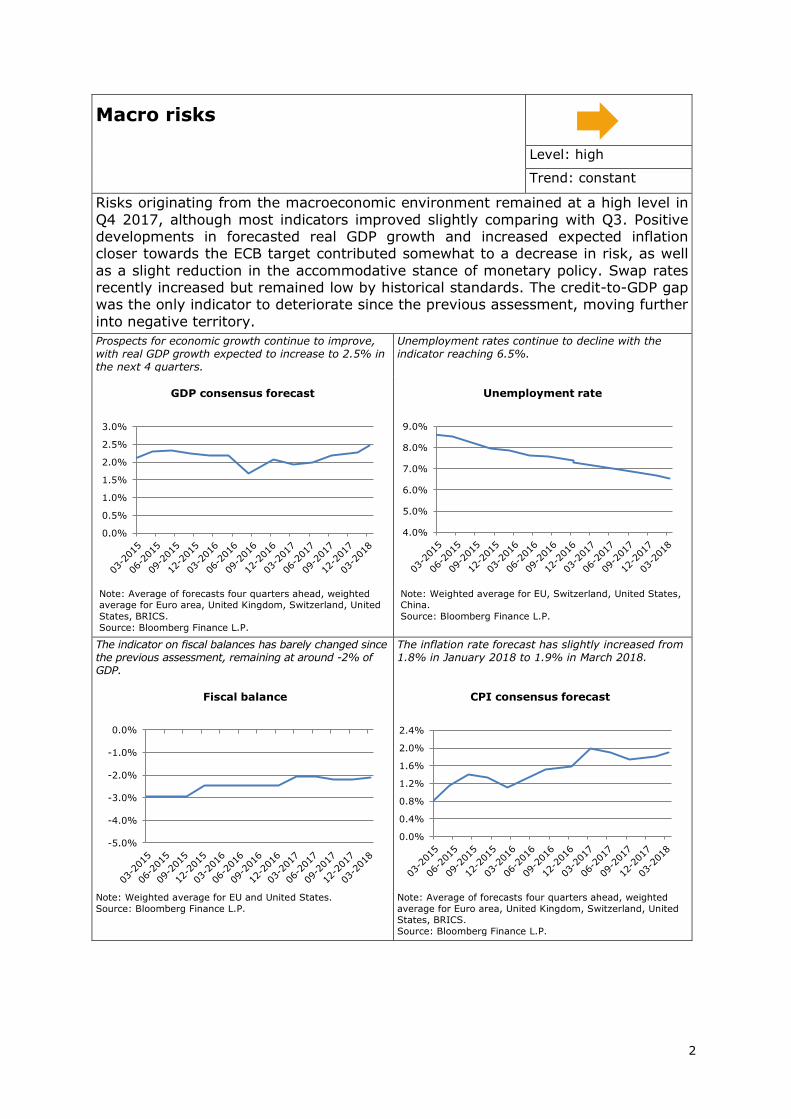
Risks originating from the macroeconomic environment remained at a high level in
Q4 2017, although most indicators improved slightly comparing with Q3. Positive developments in forecasted real GDP growth and increased expected inflation closer towards the ECB target contributed somewhat to a decrease in risk, as well
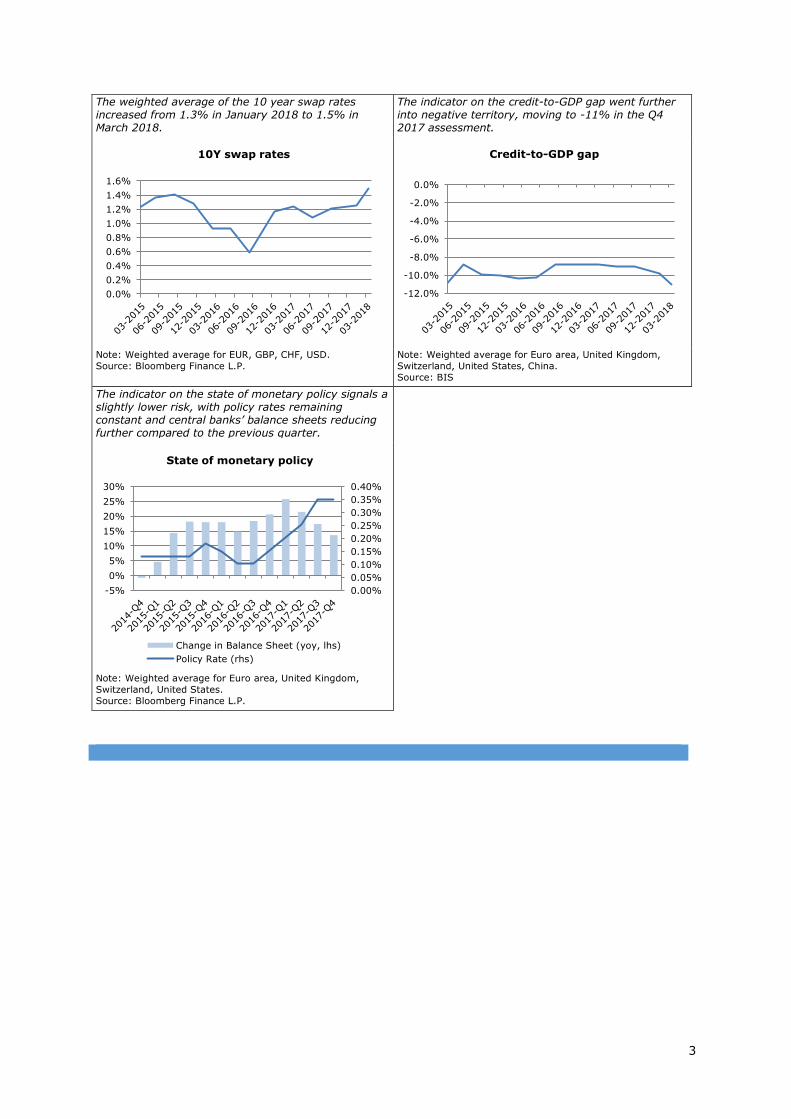
as a slight reduction in the accommodative stance of monetary policy. Swap rates recently increased but remained low by historical standards. The credit-to-GDP gap was the only indicator to deteriorate since the previous assessment, moving further
into negative territory.
Prospects for economic growth continue to improve, with real GDP growth expected to increase to 2.5% in the next 4 quarters.
Unemployment rates continue to decline with the indicator reaching 6.5%.
Note: Average of forecasts four quarters ahead, weighted average for Euro area, United Kingdom, Switzerland, United
States, BRICS.
Source: Bloomberg Finance L.P.
Note: Weighted average for EU, Switzerland, United States, China.
Source: Bloomberg Finance L.P.
The indicator on fiscal balances has barely changed since the previous assessment, remaining at around -2% of GDP.
The inflation rate forecast has slightly increased from 1.8% in January 2018 to 1.9% in March 2018.
Note: Weighted average for EU and United States.
Source: Bloomberg Finance L.P.
Note: Average of forecasts four quarters ahead, weighted
average for Euro area, United Kingdom, Switzerland, United States, BRICS.
Source: Bloomberg Finance L.P.
0.0%
0.5%
1.0%
1.5%
2.0%
2.5%
3.0%
GDP consensus forecast
4.0%
5.0%
6.0%
7.0%
8.0%
9.0%
Unemployment rate
-5.0%
-4.0%
-3.0%
-2.0%
-1.0%
0.0%
Fiscal balance
0.0%
0.4%
0.8%
1.2%
1.6%
2.0%
2.4%
CPI consensus forecast
3
The weighted average of the 10 year swap rates increased from 1.3% in January 2018 to 1.5% in March 2018.
The indicator on the credit-to-GDP gap went further into negative territory, moving to -11% in the Q4 2017 assessment.
Note: Weighted average for EUR, GBP, CHF, USD.
Source: Bloomberg Finance L.P.
Note: Weighted average for Euro area, United Kingdom,
Switzerland, United States, China.
Source: BIS
The indicator on the state of monetary policy signals a slightly lower risk, with policy rates remaining constant and central banks’ balance sheets reducing further compared to the previous quarter.
Note: Weighted average for Euro area, United Kingdom,
Switzerland, United States.
Source: Bloomberg Finance L.P.
0.0%
0.2%
0.4%
0.6%
0.8%
1.0%
1.2%
1.4%
1.6%
10Y swap rates
-12.0%
-10.0%
-8.0%
-6.0%
-4.0%
-2.0%
0.0%
Credit-to-GDP gap
0.00%
0.05%
0.10%
0.15%
0.20%
0.25%
0.30%
0.35%
0.40%
-5%
0%
5%
10%
15%
20%
25%
30%
State of monetary policy
Change in Balance Sheet (yoy, lhs)
Policy Rate (rhs)
4
Credit risks
Level: medium
Trend: constant
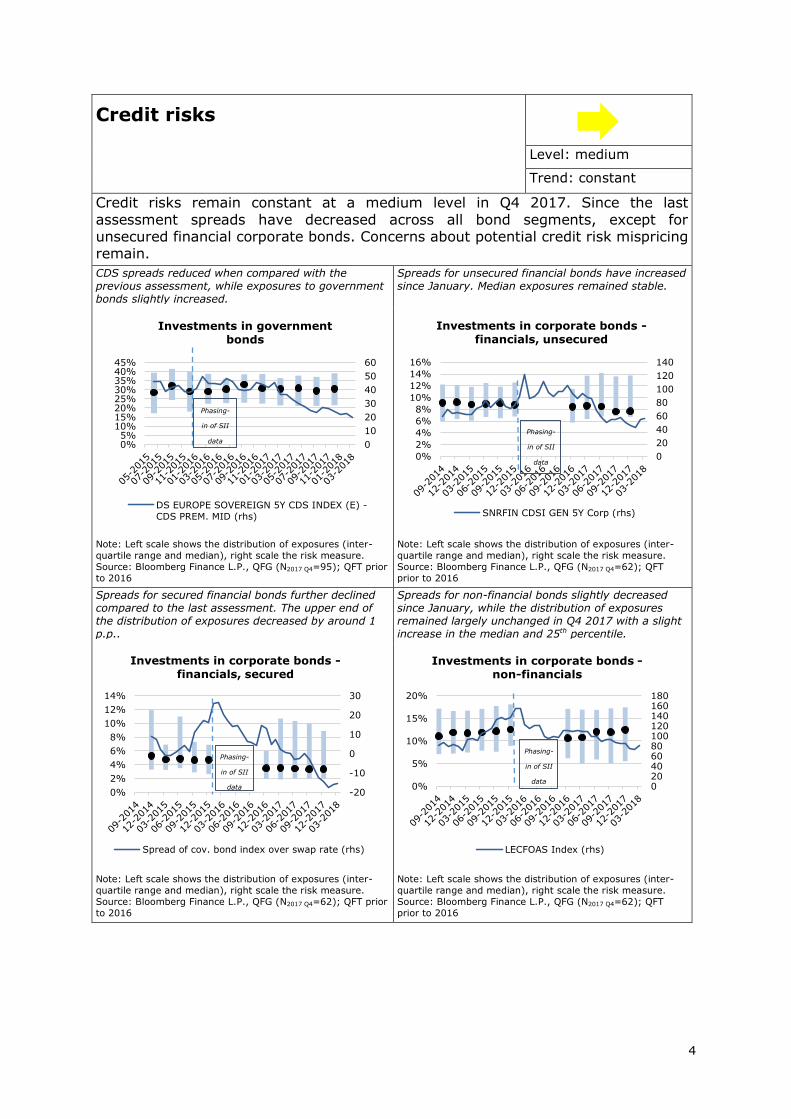
Credit risks remain constant at a medium level in Q4 2017. Since the last
assessment spreads have decreased across all bond segments, except for unsecured financial corporate bonds. Concerns about potential credit risk mispricing remain.
CDS spreads reduced when compared with the previous assessment, while exposures to government bonds slightly increased.
Spreads for unsecured financial bonds have increased since January. Median exposures remained stable.
Note: Left scale shows the distribution of exposures (inter-
quartile range and median), right scale the risk measure.
Spreads for secured financial bonds further declined compared to the last assessment. The upper end of the distribution of exposures decreased by around 1 p.p..
Spreads for non-financial bonds slightly decreased since January, while the distribution of exposures remained largely unchanged in Q4 2017 with a slight increase in the median and 25th percentile.
Note: Left scale shows the distribution of exposures (inter-
quartile range and median), right scale the risk measure.
Investments in corporate bonds -financials, unsecured
SNRFIN CDSI GEN 5Y Corp (rhs)
-20
-10
0
10
20
30
0%
2%
4%
6%
8%
10%
12%
14%
Investments in corporate bonds -financials, secured
Spread of cov. bond index over swap rate (rhs)
020406080100120140160180
0%
5%
10%
15%
20%
Investments in corporate bonds -non-financials
LECFOAS Index (rhs)
Phasing-
in of SII
data
Phasing-
in of SII
data
Phasing-
in of SII
data
Phasing-
in of SII
data
5
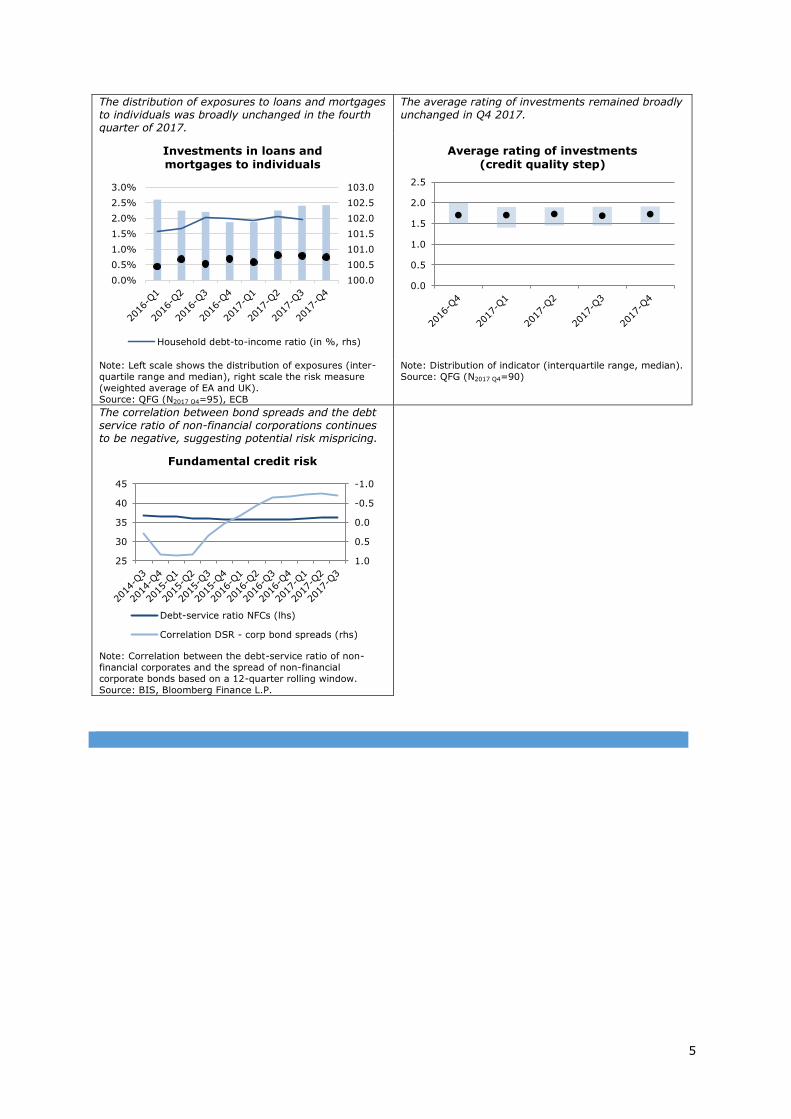
The distribution of exposures to loans and mortgages to individuals was broadly unchanged in the fourth quarter of 2017.
The average rating of investments remained broadly unchanged in Q4 2017.
Note: Left scale shows the distribution of exposures (inter-
quartile range and median), right scale the risk measure
(weighted average of EA and UK).
Source: QFG (N2017 Q4=95), ECB
Note: Distribution of indicator (interquartile range, median).
Source: QFG (N2017 Q4=90)
The correlation between bond spreads and the debt service ratio of non-financial corporations continues to be negative, suggesting potential risk mispricing.
Note: Correlation between the debt-service ratio of non-
financial corporates and the spread of non-financial
corporate bonds based on a 12-quarter rolling window.
Source: BIS, Bloomberg Finance L.P.
100.0
100.5
101.0
101.5
102.0
102.5
103.0
0.0%
0.5%
1.0%
1.5%
2.0%
2.5%
3.0%
Investments in loans and mortgages to individuals
Household debt-to-income ratio (in %, rhs)
0.0
0.5
1.0
1.5
2.0
2.5
Average rating of investments(credit quality step)
-1.0
-0.5
0.0
0.5
1.025
30
35
40
45
Fundamental credit risk
Debt-service ratio NFCs (lhs)
Correlation DSR - corp bond spreads (rhs)
6
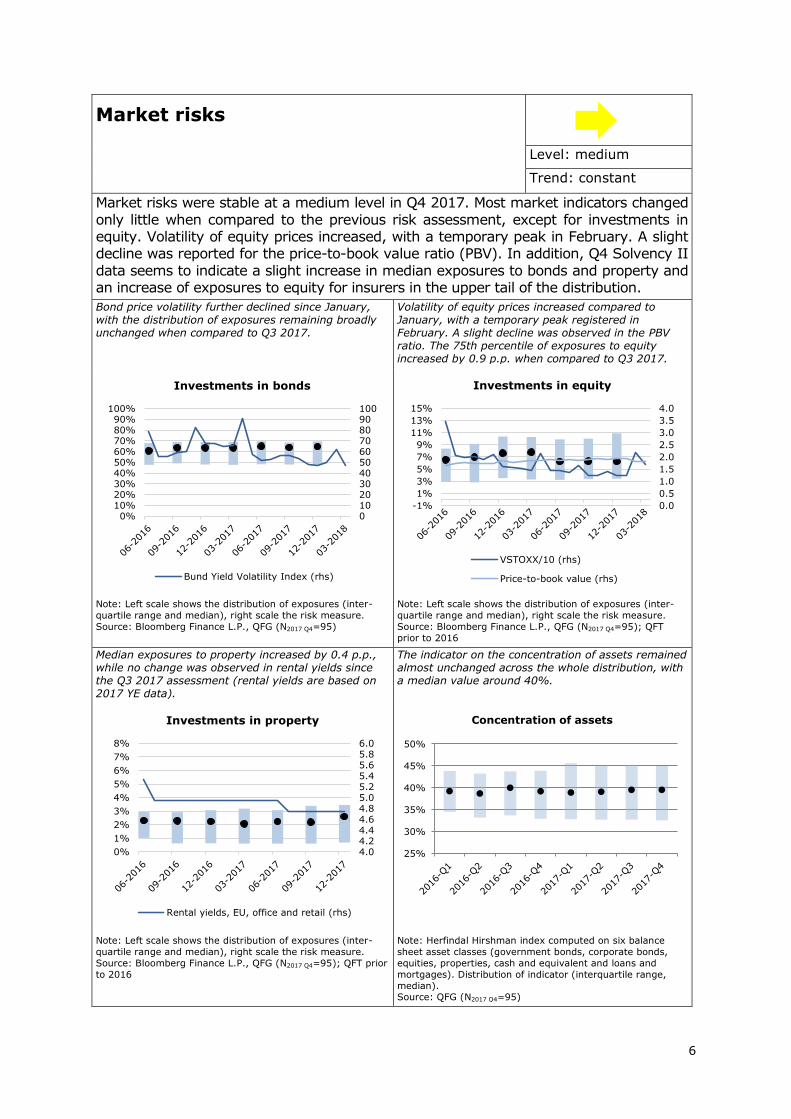
Market risks
Level: medium
Trend: constant
Market risks were stable at a medium level in Q4 2017. Most market indicators changed
only little when compared to the previous risk assessment, except for investments in equity. Volatility of equity prices increased, with a temporary peak in February. A slight decline was reported for the price-to-book value ratio (PBV). In addition, Q4 Solvency II
data seems to indicate a slight increase in median exposures to bonds and property and an increase of exposures to equity for insurers in the upper tail of the distribution.
Bond price volatility further declined since January, with the distribution of exposures remaining broadly unchanged when compared to Q3 2017.
Volatility of equity prices increased compared to January, with a temporary peak registered in February. A slight decline was observed in the PBV ratio. The 75th percentile of exposures to equity increased by 0.9 p.p. when compared to Q3 2017.
Note: Left scale shows the distribution of exposures (inter-
quartile range and median), right scale the risk measure.
Source: Bloomberg Finance L.P., QFG (N2017 Q4=95)
Note: Left scale shows the distribution of exposures (inter-
quartile range and median), right scale the risk measure.
Median exposures to property increased by 0.4 p.p., while no change was observed in rental yields since the Q3 2017 assessment (rental yields are based on 2017 YE data).
The indicator on the concentration of assets remained almost unchanged across the whole distribution, with a median value around 40%.
Note: Left scale shows the distribution of exposures (inter-
quartile range and median), right scale the risk measure.
equities, properties, cash and equivalent and loans and
mortgages). Distribution of indicator (interquartile range,
median). Source: QFG (N2017 Q4=95)
0102030405060708090100
0%10%20%30%40%50%60%70%80%90%
100%
Investments in bonds
Bund Yield Volatility Index (rhs)
0.0
0.5
1.0
1.5
2.0
2.5
3.0
3.5
4.0
-1%
1%
3%
5%
7%
9%
11%
13%
15%
Investments in equity
VSTOXX/10 (rhs)
Price-to-book value (rhs)
4.04.24.44.64.85.05.25.45.65.86.0
0%
1%
2%
3%
4%
5%
6%
7%
8%
Investments in property
Rental yields, EU, office and retail (rhs)
25%
30%
35%
40%
45%
50%
Concentration of assets
7
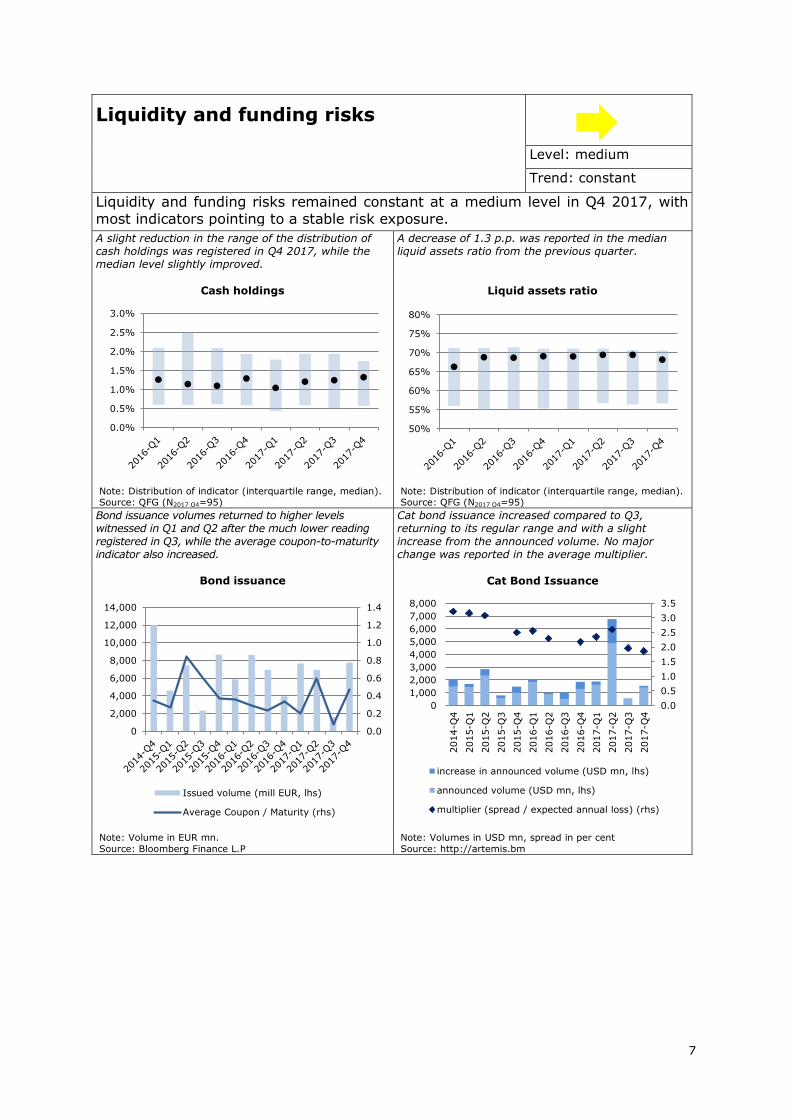
Liquidity and funding risks
Level: medium
Trend: constant
Liquidity and funding risks remained constant at a medium level in Q4 2017, with
most indicators pointing to a stable risk exposure.
A slight reduction in the range of the distribution of cash holdings was registered in Q4 2017, while the median level slightly improved.
A decrease of 1.3 p.p. was reported in the median liquid assets ratio from the previous quarter.
Note: Distribution of indicator (interquartile range, median). Source: QFG (N2017 Q4=95)
Note: Distribution of indicator (interquartile range, median). Source: QFG (N2017 Q4=95)
Bond issuance volumes returned to higher levels witnessed in Q1 and Q2 after the much lower reading
registered in Q3, while the average coupon-to-maturity indicator also increased.
Cat bond issuance increased compared to Q3, returning to its regular range and with a slight
increase from the announced volume. No major change was reported in the average multiplier.
Note: Volume in EUR mn.
Source: Bloomberg Finance L.P
Note: Volumes in USD mn, spread in per cent
Source: http://artemis.bm
0.0%
0.5%
1.0%
1.5%
2.0%
2.5%
3.0%
Cash holdings
50%
55%
60%
65%
70%
75%
80%
Liquid assets ratio
0.0
0.2
0.4
0.6
0.8
1.0
1.2
1.4
0
2,000
4,000
6,000
8,000
10,000
12,000
14,000
Bond issuance
Issued volume (mill EUR, lhs)
Average Coupon / Maturity (rhs)
0.0
0.5
1.0
1.5
2.0
2.5
3.0
3.5
0
1,000
2,000
3,000
4,000
5,000
6,000
7,000
8,000
2014-Q
4
2015-Q
1
2015-Q
2
2015-Q
3
2015-Q
4
2016-Q
1
2016-Q
2
2016-Q
3
2016-Q
4
2017-Q
1
2017-Q
2
2017-Q
3
2017-Q
4
Cat Bond Issuance
increase in announced volume (USD mn, lhs)
announced volume (USD mn, lhs)
multiplier (spread / expected annual loss) (rhs)
8
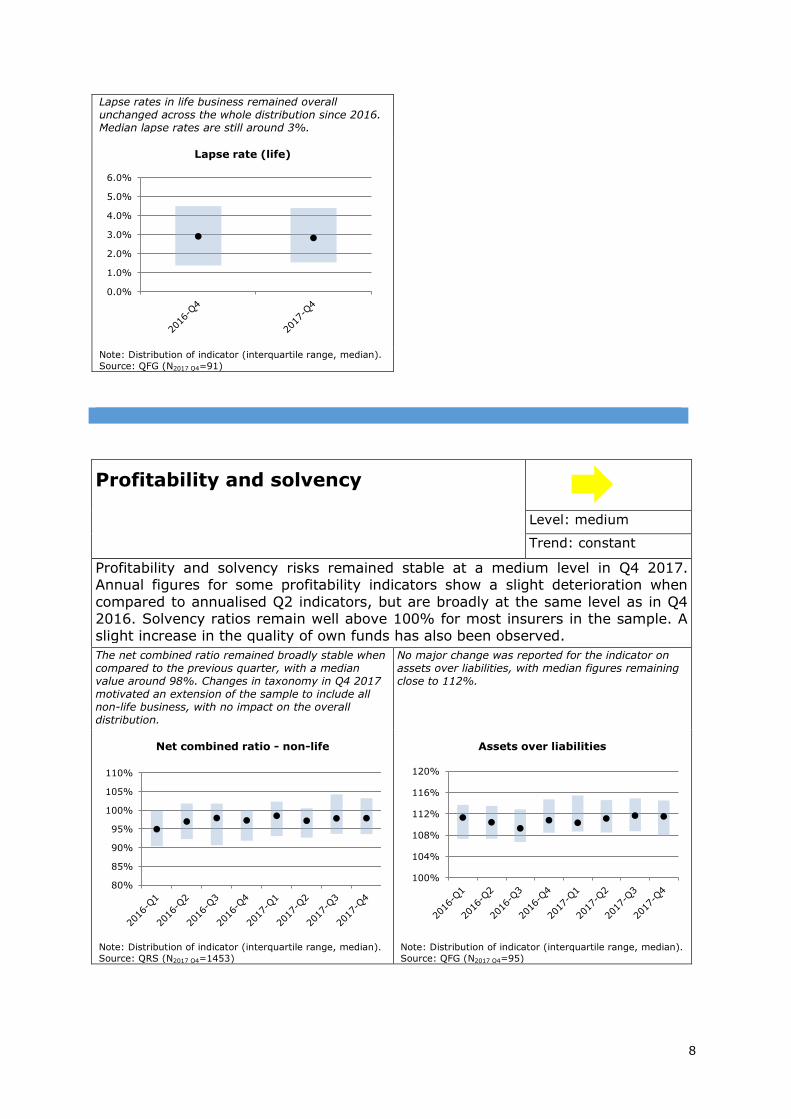
Lapse rates in life business remained overall unchanged across the whole distribution since 2016. Median lapse rates are still around 3%.
Note: Distribution of indicator (interquartile range, median).
Source: QFG (N2017 Q4=91)
Profitability and solvency
Level: medium
Trend: constant
Profitability and solvency risks remained stable at a medium level in Q4 2017. Annual figures for some profitability indicators show a slight deterioration when
compared to annualised Q2 indicators, but are broadly at the same level as in Q4 2016. Solvency ratios remain well above 100% for most insurers in the sample. A slight increase in the quality of own funds has also been observed.
The net combined ratio remained broadly stable when compared to the previous quarter, with a median value around 98%. Changes in taxonomy in Q4 2017 motivated an extension of the sample to include all non-life business, with no impact on the overall distribution.
No major change was reported for the indicator on assets over liabilities, with median figures remaining close to 112%.
Note: Distribution of indicator (interquartile range, median).
Source: QRS (N2017 Q4=1453)
Note: Distribution of indicator (interquartile range, median).
Source: QFG (N2017 Q4=95)
0.0%
1.0%
2.0%
3.0%
4.0%
5.0%
6.0%
Lapse rate (life)
80%
85%
90%
95%
100%
105%
110%
Net combined ratio - non-life
100%
104%
108%
112%
116%
120%
Assets over liabilities
9
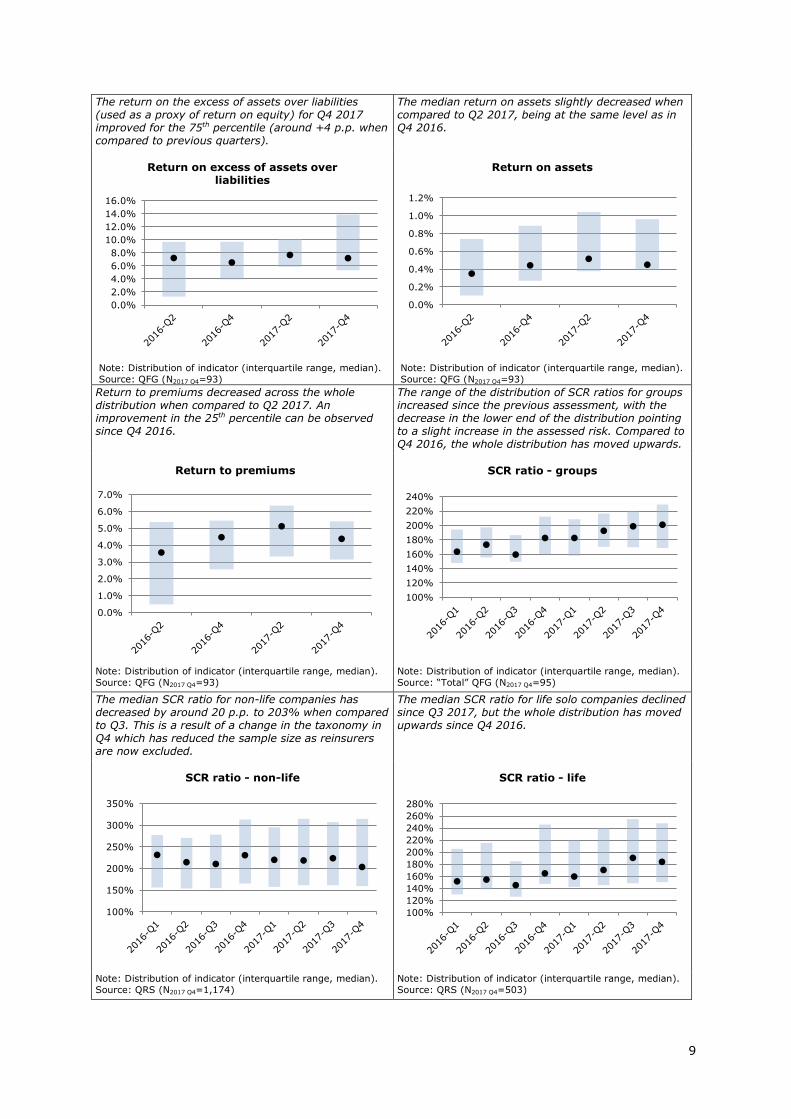
The return on the excess of assets over liabilities (used as a proxy of return on equity) for Q4 2017 improved for the 75th percentile (around +4 p.p. when compared to previous quarters).
The median return on assets slightly decreased when compared to Q2 2017, being at the same level as in Q4 2016.
Note: Distribution of indicator (interquartile range, median).
Source: QFG (N2017 Q4=93)
Note: Distribution of indicator (interquartile range, median).
Source: QFG (N2017 Q4=93)
Return to premiums decreased across the whole distribution when compared to Q2 2017. An improvement in the 25th percentile can be observed since Q4 2016.
The range of the distribution of SCR ratios for groups increased since the previous assessment, with the decrease in the lower end of the distribution pointing to a slight increase in the assessed risk. Compared to Q4 2016, the whole distribution has moved upwards.
Note: Distribution of indicator (interquartile range, median).
Source: QFG (N2017 Q4=93)
Note: Distribution of indicator (interquartile range, median).
Source: “Total” QFG (N2017 Q4=95)
The median SCR ratio for non-life companies has decreased by around 20 p.p. to 203% when compared to Q3. This is a result of a change in the taxonomy in Q4 which has reduced the sample size as reinsurers are now excluded.
The median SCR ratio for life solo companies declined since Q3 2017, but the whole distribution has moved upwards since Q4 2016.
Note: Distribution of indicator (interquartile range, median).
Source: QRS (N2017 Q4=1,174)
Note: Distribution of indicator (interquartile range, median).
Source: QRS (N2017 Q4=503)
0.0%
2.0%
4.0%
6.0%
8.0%
10.0%
12.0%
14.0%
16.0%
Return on excess of assets over liabilities
0.0%
0.2%
0.4%
0.6%
0.8%
1.0%
1.2%
Return on assets
0.0%
1.0%
2.0%
3.0%
4.0%
5.0%
6.0%
7.0%
Return to premiums
100%
120%
140%
160%
180%
200%
220%
240%
SCR ratio - groups
100%
150%
200%
250%
300%
350%
SCR ratio - non-life
100%
120%
140%
160%
180%
200%
220%
240%
260%
280%
SCR ratio - life
10
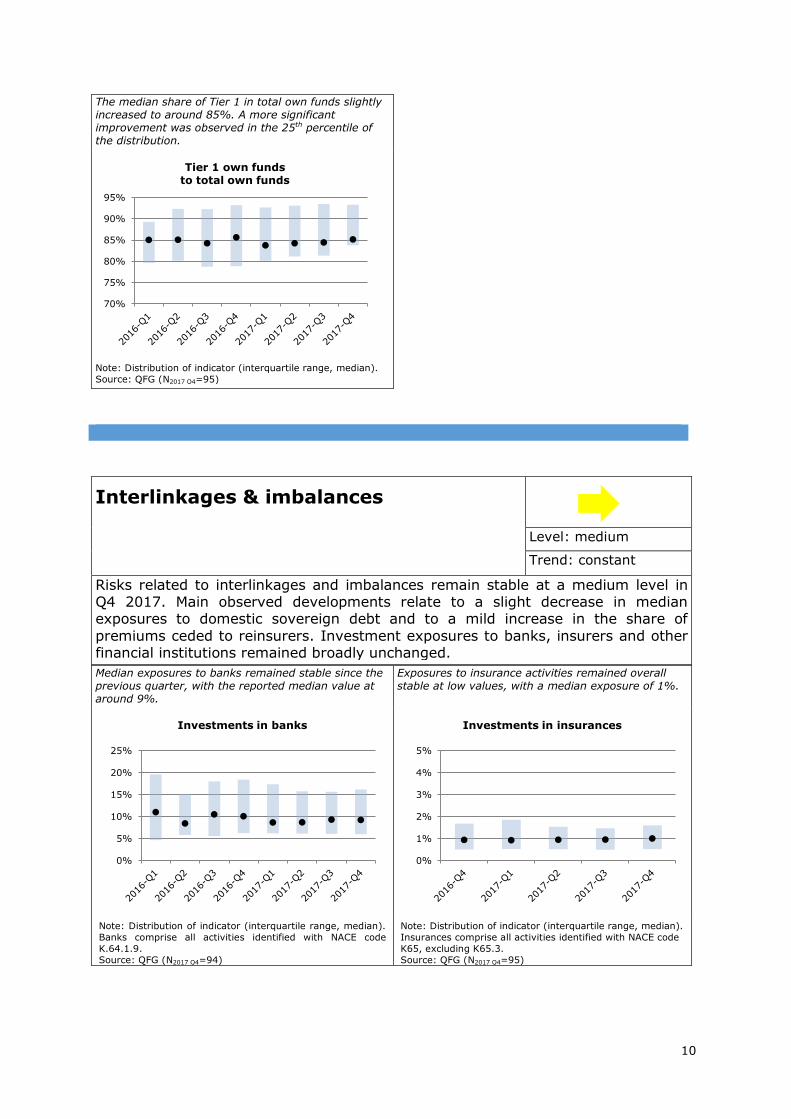
The median share of Tier 1 in total own funds slightly increased to around 85%. A more significant improvement was observed in the 25th percentile of the distribution.
Note: Distribution of indicator (interquartile range, median).
Source: QFG (N2017 Q4=95)
Interlinkages & imbalances
Level: medium
Trend: constant
Risks related to interlinkages and imbalances remain stable at a medium level in Q4 2017. Main observed developments relate to a slight decrease in median exposures to domestic sovereign debt and to a mild increase in the share of
premiums ceded to reinsurers. Investment exposures to banks, insurers and other financial institutions remained broadly unchanged.
Median exposures to banks remained stable since the previous quarter, with the reported median value at around 9%.
Exposures to insurance activities remained overall stable at low values, with a median exposure of 1%.
Note: Distribution of indicator (interquartile range, median).
Banks comprise all activities identified with NACE code
K.64.1.9.
Source: QFG (N2017 Q4=94)
Note: Distribution of indicator (interquartile range, median).
Insurances comprise all activities identified with NACE code
K65, excluding K65.3.
Source: QFG (N2017 Q4=95)
70%
75%
80%
85%
90%
95%
Tier 1 own fundsto total own funds
0%
5%
10%
15%
20%
25%
Investments in banks
0%
1%
2%
3%
4%
5%
Investments in insurances
11
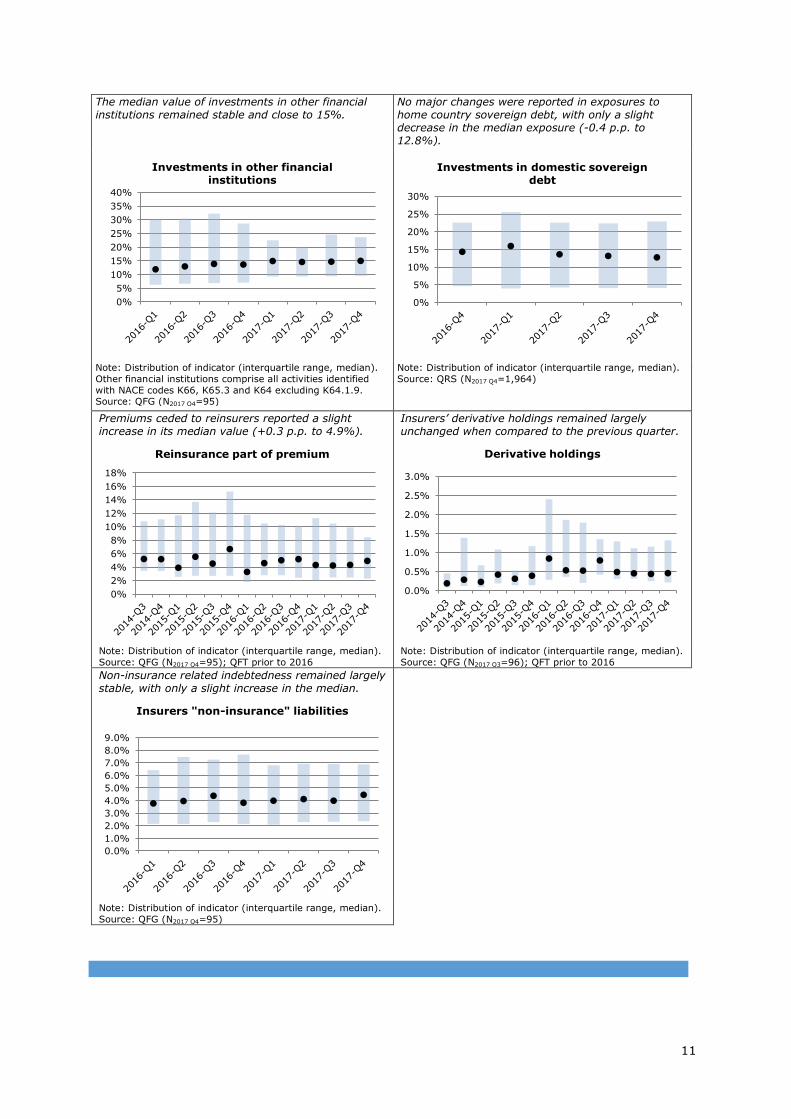
The median value of investments in other financial institutions remained stable and close to 15%.
No major changes were reported in exposures to home country sovereign debt, with only a slight decrease in the median exposure (-0.4 p.p. to 12.8%).
Note: Distribution of indicator (interquartile range, median).
Other financial institutions comprise all activities identified
with NACE codes K66, K65.3 and K64 excluding K64.1.9. Source: QFG (N2017 Q4=95)
Note: Distribution of indicator (interquartile range, median).
Source: QRS (N2017 Q4=1,964)
Premiums ceded to reinsurers reported a slight increase in its median value (+0.3 p.p. to 4.9%).
Insurers’ derivative holdings remained largely unchanged when compared to the previous quarter.
Note: Distribution of indicator (interquartile range, median).
Source: QFG (N2017 Q4=95); QFT prior to 2016
Note: Distribution of indicator (interquartile range, median).
Source: QFG (N2017 Q3=96); QFT prior to 2016
Non-insurance related indebtedness remained largely stable, with only a slight increase in the median.
Note: Distribution of indicator (interquartile range, median).
Source: QFG (N2017 Q4=95)
0%
5%
10%
15%
20%
25%
30%
35%
40%
Investments in other financial institutions
0%
5%
10%
15%
20%
25%
30%
Investments in domestic sovereign debt
0%
2%
4%
6%
8%
10%
12%
14%
16%
18%
Reinsurance part of premium
0.0%
0.5%
1.0%
1.5%
2.0%
2.5%
3.0%
Derivative holdings
0.0%
1.0%
2.0%
3.0%
4.0%
5.0%
6.0%
7.0%
8.0%
9.0%
Insurers "non-insurance" liabilities
12
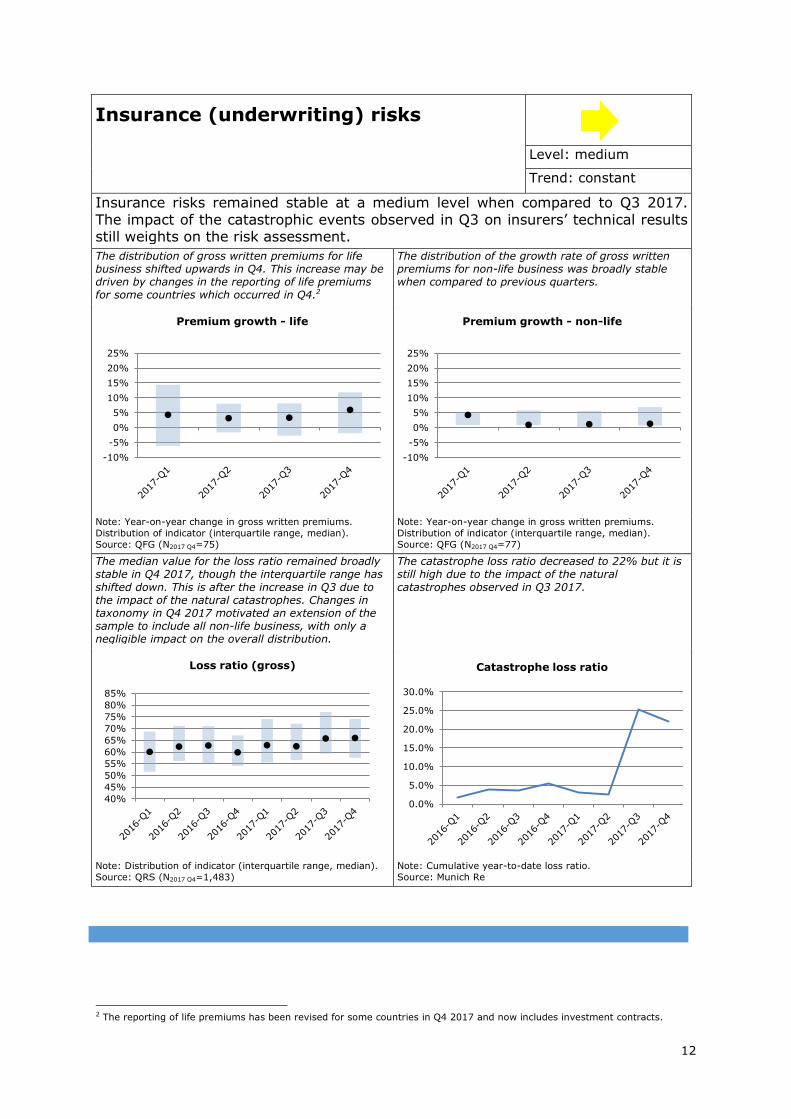
Insurance (underwriting) risks
Level: medium
Trend: constant
Insurance risks remained stable at a medium level when compared to Q3 2017.
The impact of the catastrophic events observed in Q3 on insurers’ technical results still weights on the risk assessment.
The distribution of gross written premiums for life business shifted upwards in Q4. This increase may be driven by changes in the reporting of life premiums for some countries which occurred in Q4.2
The distribution of the growth rate of gross written premiums for non-life business was broadly stable when compared to previous quarters.
Note: Year-on-year change in gross written premiums.
Distribution of indicator (interquartile range, median).
Source: QFG (N2017 Q4=75)
Note: Year-on-year change in gross written premiums.
Distribution of indicator (interquartile range, median).
Source: QFG (N2017 Q4=77)
The median value for the loss ratio remained broadly stable in Q4 2017, though the interquartile range has
shifted down. This is after the increase in Q3 due to the impact of the natural catastrophes. Changes in taxonomy in Q4 2017 motivated an extension of the sample to include all non-life business, with only a negligible impact on the overall distribution.
The catastrophe loss ratio decreased to 22% but it is still high due to the impact of the natural
catastrophes observed in Q3 2017.
Note: Distribution of indicator (interquartile range, median).
Source: QRS (N2017 Q4=1,483)
Note: Cumulative year-to-date loss ratio.
Source: Munich Re
2 The reporting of life premiums has been revised for some countries in Q4 2017 and now includes investment contracts.
-10%
-5%
0%
5%
10%
15%
20%
25%
Premium growth - life
-10%
-5%
0%
5%
10%
15%
20%
25%
Premium growth - non-life
40%
45%
50%
55%
60%
65%
70%
75%
80%
85%
Loss ratio (gross)
0.0%
5.0%
10.0%
15.0%
20.0%
25.0%
30.0%
Catastrophe loss ratio
13
Market perceptions
Level: medium
Trend: constant
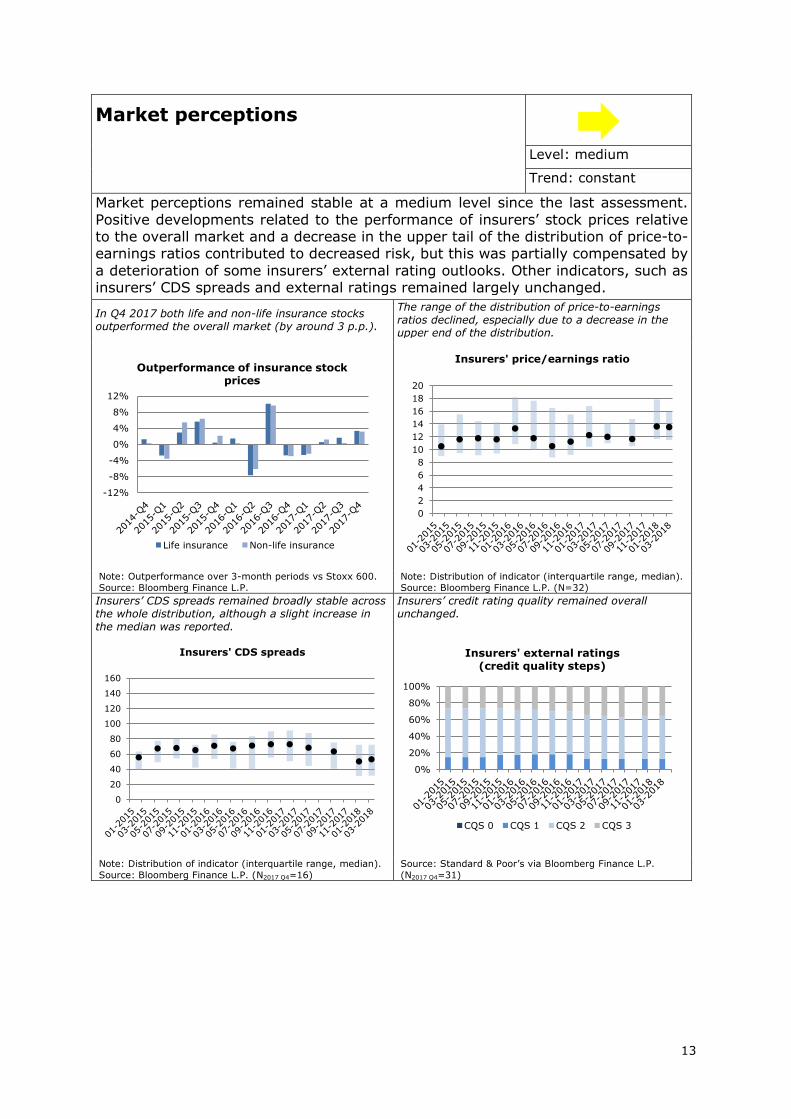
Market perceptions remained stable at a medium level since the last assessment.
Positive developments related to the performance of insurers’ stock prices relative to the overall market and a decrease in the upper tail of the distribution of price-to-earnings ratios contributed to decreased risk, but this was partially compensated by
a deterioration of some insurers’ external rating outlooks. Other indicators, such as insurers’ CDS spreads and external ratings remained largely unchanged.
In Q4 2017 both life and non-life insurance stocks outperformed the overall market (by around 3 p.p.).
The range of the distribution of price-to-earnings ratios declined, especially due to a decrease in the upper end of the distribution.
Note: Outperformance over 3-month periods vs Stoxx 600.
Source: Bloomberg Finance L.P.
Note: Distribution of indicator (interquartile range, median).
Source: Bloomberg Finance L.P. (N=32)
Insurers’ CDS spreads remained broadly stable across the whole distribution, although a slight increase in the median was reported.
Insurers’ credit rating quality remained overall unchanged.
Note: Distribution of indicator (interquartile range, median).
Source: Bloomberg Finance L.P. (N2017 Q4=16)
Source: Standard & Poor’s via Bloomberg Finance L.P.
(N2017 Q4=31)
-12%
-8%
-4%
0%
4%
8%
12%
Outperformance of insurance stock prices
Life insurance Non-life insurance
0
2
4
6
8
10
12
14
16
18
20
Insurers' price/earnings ratio
0
20
40
60
80
100
120
140
160
Insurers' CDS spreads
0%
20%
40%
60%
80%
100%
Insurers' external ratings (credit quality steps)
CQS 0 CQS 1 CQS 2 CQS 3
14
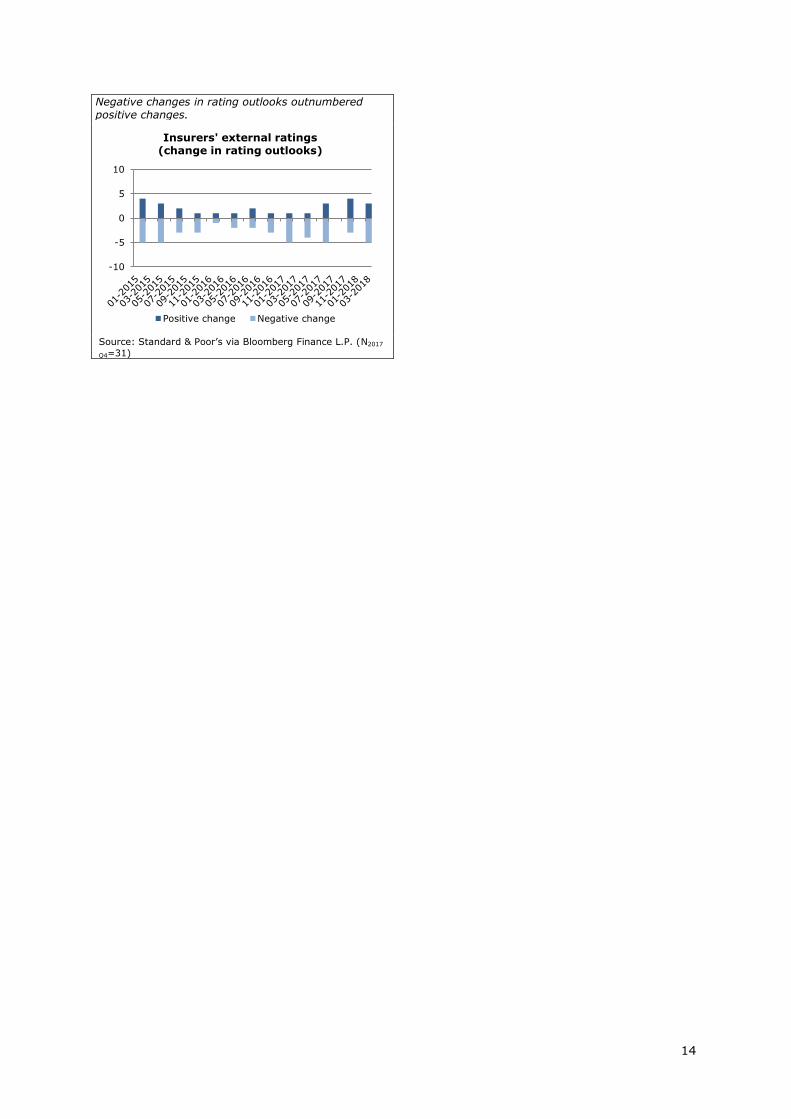
Negative changes in rating outlooks outnumbered positive changes.
Source: Standard & Poor’s via Bloomberg Finance L.P. (N2017
Q4=31)
-10
-5
0
5
10
Insurers' external ratings(change in rating outlooks)
Positive change Negative change
15
APPENDIX
Level of risk Very high
High
Medium
Low
Trend Large increase
Increase
Constant
Decrease
Large decrease
Description of risk categories
Macro risks
Macro risk is an overarching category affecting the whole economy. EIOPA’s
contribution focuses on factors such as economic growth, state of the monetary
policies, consumer price indices and fiscal balances which directly impact the insurance
industry. The indicators are developed encompassing information on the main
jurisdictions where European insurers are exposed to both in terms of investments and
product portfolios.
Credit risks
The category measures the vulnerability of the European insurance industry to credit
risk. To achieve this aim, credit-relevant asset class exposures of the (re)insurers are
combined with the relevant risk metrics applicable to these asset classes. For instance,
the holdings of government securities are combined with the credit spreads on
European sovereigns.
Market risks
Market risk is, for most asset classes, assessed by analysing both the investment
exposure of the insurance sector and an underlying risk metric. The exposures give a
picture of the vulnerability of the sector to adverse developments; the risk metric,
usually the volatility of the yields of the associated indices, gives a picture of the
current level of riskiness. The risk category is complemented by an indicator which
captures the difference between guaranteed interest rates and investment returns.
Liquidity and funding risks
This category aims at assessing the vulnerability of the European insurance industry to
liquidity shocks. The set of indicators encompasses the lapse rate of the life insurance
sector with high lapse rate signalling a potential risk, holdings of cash & cash
equivalents as a measure of the liquidity buffer available, and the issuance of
catastrophe bonds, where a very low volume of issuance and/or high spreads signals a
reduction in demand which could form a risk.
Profitability and solvency
The category scrutinises the level of solvency and profitability of the European
insurance industry. Both dimensions are analysed for the overall industry (using group
data) and include a breakdown for the life and non-life companies (using solo data). In
16
detail, the solvency level is measured via solvency ratios and quality of own funds.
Standard profitability measures for the whole industry are complemented by indicators
such as the combined ratio and the return on investments specifically applied to the
non-life and life industry respectively.
Interlinkages and imbalances
Under this section various kinds of interlinkages are assessed, both within the
insurance sector, namely between primary insurers and reinsurers, between the
insurance sector and the banking sector, as well as interlinkages created via derivative
holdings. Exposure towards domestic sovereign debt is included as well.
Insurance (underwriting) risks
As indicators for insurance risks gross written premiums of both life and non-life
business are an important input. Both significant expansion and contraction are taken
as indicators of risks in the sector; the former due to concerns over sustainability and
the latter as an indicator of widespread contraction of insurance markets. Information
on claims and insurance losses due to natural catastrophes also contribute to this risk
category.
Market perception
This category encompasses the financial markets’ perception of the healthiness and
profitability of the European insurance sector. For this purpose, relative stock market
performances of European insurance indices against the total market are assessed, as
well as fundamental valuations of insurance stocks (price/earnings ratio), CDS spreads
and external ratings/rating outlooks.
Abbreviations
AFG Annual Financial Stability Reporting for Groups
ARS Annual Prudential Reporting for Solo Entities
QFG Quarterly Financial Stability Reporting for Groups
QRS Quarterly Prudential Reporting for Solo Entities
QFT Quarterly Fast Track Reporting (pre-Solvency II, for around 32 large
insurance groups on a best effort basis)
Notes
- Sample size for the different indicators may vary according to availability and
consistency of the reported information.
- Vertical dashed lines where displayed in the graphs signals the structural change in
the series driven by the transition from Solvency I to Solvency II reporting.