SUSTAINABLE PRODUCTION AND CONSUMPTION 1 (2015) 67–86 Contents lists available at ScienceDirect Sustainable Production and Consumption journal homepage: www.elsevier.com/locate/spc Prioritizing the responses to manage risks in green supply chain: An Indian plastic manufacturer perspective Sachin K. Mangla a,∗ , Pradeep Kumar a , Mukesh Kumar Barua b a Department of Mechanical and Industrial Engineering, Indian Institute of Technology, Roorkee, India b Department of Management Studies, Indian Institute of Technology, Roorkee, India ABSTRACT Green Supply Chain Management (GSCM) has become a very useful initiative for industries to improve their environmental capabilities in terms of, reducing resources consumption and ensuring sustainable production in business. However, the effectiveness of Green Supply Chain (GSC) is comparatively low, as there has been a substantial amount of risk involved in managing GSC efficiently. In this contribution, therefore, we aim to identify and prioritize/rank the responses of risks in a GSC context. It would be useful for industries to focus on highly ranked responses and formulate strategies to practice them in accordance with their priority for managing the consequences of risks in GSC. The present research seeks to propose a model by using the fuzzy Analytic Hierarchy Process (AHP) and fuzzy Technique for Order Performance by Similarity to Ideal Solution (TOPSIS) methods to prioritize the responses in GSC to manage its risks under the fuzzy environment. The fuzzy AHP is useful in deciding the importance weights of the related GSC risks. While, by using the fuzzy TOPSIS, the priority/ranking of the responses in a successful accomplishment of green initiatives is determined. To illustrate the effectiveness of the proposed model, the GSCM real-world case of an Indian poly-plastic manufacturing company is presented. The model proposed would offer a scientific analytic means to the managers/business professionals/practitioners for systematic implementation of the responses of risks relevant to adoption and effective implementation of green initiatives in business. A sensitivity analysis test has also been performed that monitors the robustness of the proposed network model. Keywords: Sustainable production; Green supply chain management; Resources consumption; Risk responses; Fuzzy AHP; Fuzzy TOPSIS c ⃝ 2015 The Institution of Chemical Engineers. Published by Elsevier B.V. All rights reserved. 1. Introductory background Supply Chain Management (SCM) has been observed as one of the key success areas to improve the effectiveness of busi- ness. In recent years, a significant need of natural and non- renewable resources has been identified all over the world across industries in their supply chain scenario (Mangla et al., 2012; Muduli et al., 2013). Having said that, it requires more ∗ Corresponding author. Tel.: +91 9416824761. E-mail addresses: [email protected](S.K. Mangla), [email protected](P. Kumar), [email protected](M.K. Barua). Received 19 March 2015; Received in revised form 11 May 2015; Accepted 20 May 2015; Published online 28 May 2015. than eighty tons of natural resources, including minerals per person yearly globally—really a matter of great concern among nations (ICMM report, 2012). In this sense, it has been stated that the adoption and implementation of green in sup- ply chain, i.e., green supply chain (GSC) helps industries to conserve resources, which in turn enhances their ecological and economic performances (EPA, 2000; Srivastava, 2007; Zhu et al., 2008b; Paulraj, 2009; Hu and Hsu, 2010; Sundarakani http://dx.doi.org/10.1016/j.spc.2015.05.002 2352-5509/ c ⃝ 2015 The Institution of Chemical Engineers. Published by Elsevier B.V. All rights reserved.
Transcript
S U S T A I N A B L E P R O D U C T I O N A N D C O N S U M P T I O N 1 ( 2 0 1 5 ) 6 7 – 8 6
Contents lists available at ScienceDirect
Sustainable Production and Consumption
journal homepage: www.elsevier.com/locate/spc
Prioritizing the responses to manage risks in greensupply chain: An Indian plastic manufacturerperspective
Sachin K. Manglaa,∗, Pradeep Kumara, Mukesh Kumar Baruab
aDepartment of Mechanical and Industrial Engineering, Indian Institute of Technology, Roorkee, IndiabDepartment of Management Studies, Indian Institute of Technology, Roorkee, India
A B S T R A C T
Green Supply Chain Management (GSCM) has become a very useful initiative for industries to improve their
environmental capabilities in terms of, reducing resources consumption and ensuring sustainable production
in business. However, the effectiveness of Green Supply Chain (GSC) is comparatively low, as there has been a
substantial amount of risk involved in managing GSC efficiently. In this contribution, therefore, we aim to identify
and prioritize/rank the responses of risks in a GSC context. It would be useful for industries to focus on highly
ranked responses and formulate strategies to practice them in accordance with their priority for managing the
consequences of risks in GSC. The present research seeks to propose a model by using the fuzzy Analytic Hierarchy
Process (AHP) and fuzzy Technique for Order Performance by Similarity to Ideal Solution (TOPSIS) methods to
prioritize the responses in GSC to manage its risks under the fuzzy environment. The fuzzy AHP is useful in
deciding the importance weights of the related GSC risks. While, by using the fuzzy TOPSIS, the priority/ranking
of the responses in a successful accomplishment of green initiatives is determined. To illustrate the effectiveness
of the proposed model, the GSCM real-world case of an Indian poly-plastic manufacturing company is presented.
The model proposed would offer a scientific analytic means to the managers/business professionals/practitioners
for systematic implementation of the responses of risks relevant to adoption and effective implementation of green
initiatives in business. A sensitivity analysis test has also been performed that monitors the robustness of the
c⃝ 2015 The Institution of Chemical Engineers. Published by Elsevier B.V. All rights reserved.
b
1. Introductory background
Supply Chain Management (SCM) has been observed as oneof the key success areas to improve the effectiveness of busi-ness. In recent years, a significant need of natural and non-renewable resources has been identified all over the worldacross industries in their supply chain scenario (Mangla et al.,2012; Muduli et al., 2013). Having said that, it requires more
∗ Corresponding author. Tel.: +91 9416824761.E-mail addresses: [email protected] (S.K. Mangla), kumarReceived 19 March 2015; Received in revised form 11 May 2015; A
http://dx.doi.org/10.1016/j.spc.2015.05.0022352-5509/ c⃝ 2015 The Institution of Chemical Engineers. Published
than eighty tons of natural resources, including mineralsper person yearly globally—really a matter of great concernamong nations (ICMM report, 2012). In this sense, it has beenstated that the adoption and implementation of green in sup-ply chain, i.e., green supply chain (GSC) helps industries toconserve resources, which in turn enhances their ecologicaland economic performances (EPA, 2000; Srivastava, 2007; Zhuet al., 2008b; Paulraj, 2009; Hu and Hsu, 2010; Sundarakani
68 S U S T A I N A B L E P R O D U C T I O N A N D C O N S U M P T I O N 1 ( 2 0 1 5 ) 6 7 – 8 6
et al., 2010; Madaan and Mangla, 2015). GSC not only in-corporates the ecological thinking in the business, but alsoensures the sustainable development of industries (Beamon,1999; Jung, 2011; Muduli and Barve, 2013; Mangla et al., 2014b;Luthra et al., 2014a,b). In this line of getting maximum com-petitive and sustainable advantages, many other industrieshave either initiated or thinking to initiate the green trendin their business activities (Zhang et al., 2009; Mohanty andPrakash, 2013).
However, the successful adoption of the green initia-tives/trends/different GSC business activities (From here on-wards the word initiatives is used throughout the paper.) isnot so easy at industrial perspective (Ma et al., 2012). Differ-ent production and business activities in GSC engages sev-eral different types of risks (Mangla et al., 2014c). These risksand their sources can create problems in smooth functioningof GSC, and reduce the efficiency of a structure GSC (Wanget al., 2012). Therefore, it is important to manage and reducethe convolution of risks in GSC. Hence, to help industries, itis needed to concentrate on devolving some appropriate re-sponses and concrete strategies helpful in effective adoptionand implementation of GSCM.
1.1. Motivation and need for this research
Adding of ‘green’ initiatives in the supply chain includesdealing with interactions between supply chain managementand the environment (Sarkis, 2003). However, still, it is noteasy to the point of view of industries to adopt the greeninitiatives in their supply chain planning (Mathiyazhaganet al., 2013; Govindan et al., 2014a). There is an incompleteunderstanding of what is responsible for green adoption tofail in the supply chain (Mangla et al., 2014c). It is dueto the reason as the initiatives of green at various aspectsof business involve several complexities (Ma et al., 2012).Due to which, there arises different risks and risk factorsin implementing different GSC initiatives in business, whichwould certainly affect the overall performance (Dan-Li et al.,2011; Wang et al., 2012). Therefore, for effectively managingthe different business processes and activities linked to GSC,the risks associated with the green supply chain necessarilyneed to be known, and understood (Ma et al., 2012). The risksin GSC context can be recognized through literature resourceand from the expert’s inputs. Moreover, it should be notedthat different industries may face different GSC risks andproblems for greening their respective supply chain (Manglaet al., 2015). The same risk may not be equally importantto the individual industry with regards to its priorities,capabilities, resource, etc. Considering this, Mangla et al.(2015) analyzed the risks for an effective understanding andsuccessful management of implementation of different GSCinitiatives with the help of a case example of multiple plasticmanufacturing industries in Indian perspective. This studyhas identified and prioritized the common risks, as agreedupon by all the industries, in the implementation aspects ofGSC initiatives using fuzzy AHP technique. Besides, it has alsobeen mentioned in their study that in order to manage andreduce the consequences of the risks in GSC, the appropriateresponse measures need to be proposed in future research byusing technique for order performance by similarity to idealsolution (TOPSIS). Further, literature also reveals that the areaof risk analysis and management in the context of GSC iscomparatively uncharted (Ma et al., 2012; Mangla et al., 2014c,2015). Hence, it is considered as an evident gap of research in
GSC dimension. Thereby, in order to improve the performanceof adoption and implementation of green in the supply chain,a set of reasonable and viable response measures need to beproposed and prioritized or ranked to manage the GSC risksin a systematic way.
1.2. Research objectives
This paper aims in achieving two objectives, mentioned as:(1) to propose and or identify the responses to manage therisks associated with the GSC; (2) to prioritize the responsesto diminish the effect of the risks in managing the GSCefficiently.
In this research, an effort has been made to prioritize theresponses to manage the risks and their implementation inGSC. The prioritization of the responses of the risks in GSCis a multi-criteria decision making (MCDM) problem. How-ever, due to the presence of fuzziness and unclearness in thedata, there exist difficulties in prioritizing the responses ofrisks. To ease the process and for removing the inherent am-biguity, it is proposed to use the theory of fuzzy sets (Zadeh,1965) for the above purpose. The present research proposes toutilize the fuzzy analytic hierarchy process (AHP) and fuzzyTOPSIS methods to prioritize the responses of risks in GSC.The fuzzy AHP method (Saaty, 1980) determines the impor-tance weights of the related GSC risks. While, the fuzzy TOP-SIS method (Hwang and Yoon, 1981) was used to analyzethe identified appropriate responses of the risks to obtaintheir performance rating by using triangular fuzzy number(TFN). To demonstrate the real-life application of the pro-posed model, the GSCM case example of an Indian poly-plasticmanufacturing company is discussed. The chosen caseexample company seeks to know, understand, and prioritizethe responses of the risks in effective GSCM adoption and im-plementation.
The rest of this paper is structured in a manner: Section 2,explores the literature relevant to this study. The details onthe proposed research methods are given (Section 3). Thedescription of the proposed model is illustrated in Section 4.The real-life application of the proposed model is shown inSection 5. The results of the study and sensitivity analysisof the proposed model are discussed in Section 6. Section 7,covers the research conclusions, limitations, and scope fornext work.
2. Literature review
This section presents the literature on the GSC and GSCM,the risks in GSC, and the multi criteria decision analysistechniques used in GSC and GSCM.
2.1. Exploring recent in the context of GSC and GSCM
It has been recognized that literature is growing on the GSCMand Sustainability over the past two decades as mentioned ina study conducted by Fahimnia et al. (0000). This study under-took 884 research articles related to GSCM, published duringa period of 21 years, from 1992 to December 31, 2013. Theirwork presented a progression of the influential GSC and sus-tainability research articles and further aimed to contribute tothe subject via mapping the relationships amongst the higherimpact contributions. In line with this, Min and Kim (2012)presented an extensive review of literature on GSCM and
S U S T A I N A B L E P R O D U C T I O N A N D C O N S U M P T I O N 1 ( 2 0 1 5 ) 6 7 – 8 6 69
illustrated that GSCM cuts across various boundaries, i.e., in-dustrial activities, integrating purchasing, procuring, produc-ing, and delivery processes from a supply chain context.GSCM has been described as an idea to incorporate eco-friendly measures at every definite operation of a supplychain network design, such as, green procurement and pur-chasing of material, greenmanufacturing strategies and tech-niques, distribution networks, green marketing, etc. (Greenet al., 1996, 2000; Hervani et al., 2005; Sarkis, 2006; Vachon,2007; Sarkis et al., 2011; Luthra et al., 2011).
There are various definitions given by different re-searchers, managers and practitioners in their ways, forinstance, Godfrey (1998, p. 244)) mentioned GSCM as the prac-tice of improving environmental performance in the supplychain. Zsidisin and Siferd (2001) described GSCM as the set ofSCM policies held, actions taken and relationships shaped inresponse to issues related to the natural environment with re-gard to the design, acquisition, production, distribution, use,re-use and disposal of the firm’s goods and services. In addi-tion, according to Zhu et al. (2008a), GSCM ranges from greenpurchasing to integrated life-cycle management SC flowingfrom supplier, through to manufacturer, customer, and clos-ing the loop with reverse logistics. Nonetheless, for the pur-pose of this research work, GSCM is defined as incorporatingenvironmental thinking into SCM, including product design,material sourcing and selection, manufacturing practices, de-livery of the final products to consumers, and end-of-lifemanagement of the product after its intended life (Srivas-tava, 2007). Besides, considering the various perspectives ofGSCM, different scholars and professionals in their studieshave addressed and developed various frameworks throughGSCM practices, including developing of sustainable devel-opment framework, ecological efficiency framework, environ-mental performance framework, etc. (Van Hoek and Erasmus,2000; Beamon, 2005; Linton et al., 2007; Zhu et al., 2008a). Theprime subject to discuss in GSCM analysis is the ‘environ-ment’.
Rao and Holt (2005), in their work expressed that GSCM isan important organizational plan, which acts as a significantplayer in encouraging efficiency and synergy between allies.In line with this, GSCM has been expressed as a strategicapproach that seeks to, address environmental measures ofan organizational supply chain (Vachon and Klassen, 2006;Albino et al., 2009; Parmigiani et al., 2011). GSCM has alsobeen linked to human resource management to achieveorganizational sustainability and truly sustainable supplychains (Jabbour and de Sousa Jabbour, 2015).
In one other related study, Mangla et al. (2013) treatedGSC as a concept of handling the issues related to returningand recovering the value of products while closing its loop.It has been stated that GSC is different from traditionalsupply chains in terms of closed loop operation nature(i.e. repair, remanufacturing, recycling, reuse), of ecologicalconcerns on operations, and of ecological–economic benefitsfocus (Porter and van der Linde, 1995; Beamon, 1999; Hervaniet al., 2005; Orsato, 2006; Zhu et al., 2008a,b). Additionally, awide acceptability of GSCM has been recorded in literaturefor improving the ecological–economic performances andbusiness sustainability all across the globe among industries(Kumar et al., 2012; Muduli and Barve, 2013; Mangla et al.,2014a; Govindan et al., 2014b; Luthra et al., 2015b). It givesa logical reason and support behind the need of GSCMimplementation in any business organization (Diabat andGovindan, 2011; Xu et al., 2013; Zhu et al., 2013; Mangla et al.,2014a; Mathiyazhagan et al., 2014; Madaan and Mangla, 2015).
2.2. Exploring the risks for a GSC perspective
From an operational and supply chain perspective, the riskhas been described as variance from expected outcomes andnegative events in disruptions to supply chain (Hora andKlassen, 2013). It can reduce the effectiveness and efficiencyof activities (Gurnani et al., 2012) and processes along a sup-ply chain (Sodhi et al., 2012). And, for the point of view ofbusiness organizations, SCM can be understood as a manage-rial approach that accounts for the movement of materials/resources/goods throughout the product life-cycle (right fromthe supplying of the raw materials to till the product reachesto final customers) (Chopra and Meindl, 2007). In contrast tothis, GSCM has been stated as the inclusion of the environ-mental aspect into conventional SCM (Ahi and Searcy, 2013).
In case of GSC, risk can be understood as an occurrenceof unforeseen events those might affect the green mate-rial movement, and even disrupt the proposed flow of eco-friendly materials and finished green products from theirpoint of origin to the point of consumption (Mangla et al.,2015). A few of them may include supplier failures, raw mate-rial supply disruptions, scarcity of skilled labor, managementpolicy failures, information irregularity, technology risks,market risks, etc. (Ma et al., 2012; Wang et al., 2012; Manglaet al., 2015). The consequences of risks could be delay in deliv-eries, damage of goods, financial problems, business loss, etc.
In order to adopt GSCM practices effectively and efficiently,literature has pointed several risks and risk factors associatedwith the initiation and adoption of different green initiativesin business. Being as a reference to this, Dan-Li et al. (2011)analyzed the influencing risks and risk factors from an orga-nizational GSC perspective. In another study, Hu et al. (2009)offered a quantitative based-approach to analyze the risksconnected to green components in accordance with EuropeanUnion standards for lowering the ecological impacts. Further-more, several risk sources, like, internal or external surround-ings and issues like demand, supply, information technology,process, knowledge flow, social and natural environment,were identified and analyzed to project some measures fortheir management in GSC (Yang and Li, 2010). Qianlei (2012)listed several risks in green products agricultural GSC basedon systematic analysis, and emphasized on the managementof these risks for improving GSC effectiveness. Wang et al.(2012) developed a risk assessment model useful in decisionanalysis of aggregative risk when applying different green ini-tiatives in the case of a fashion industry supply chain. Manglaet al. (2015), analyzed the risks involved in implementing thegreen initiatives from Indian plastic industries viewpoints.In one other relevant study, Mangla et al. (2014c) suggesteda SAP–LAP (Situation Actor Process–Learning Action Perfor-mance) and IRP (Interactive Ranking Process) based modelto propose strategies to mitigate the risks in the contextof GSC.
2.3. Multi criteria decision analysis techniques used inGSC and GSCM
Various researchers have utilized different multi-criteriadecision analysis techniques for analyzing the differentissues in the GSC scenario. A brief review of various multi-criteria decision analysis techniques used in GSC and GSCMis presented in Table 1.
70 S U S T A I N A B L E P R O D U C T I O N A N D C O N S U M P T I O N 1 ( 2 0 1 5 ) 6 7 – 8 6
Table 1 – A review of various multi criteria decision analysis techniques used in GSC and GSCM.
S. N. Researcher (Year) Modeling techniques used Issues addressed Industry covered,Country
1 Tuzkaya et al. (2009) Fuzzy Analytical NetworkProcess (ANP) and Fuzzy
7 Lin (2013) Decision Making Trial andEvaluation Laboratory
(DEMATEL)
Carbon management model ofsupplier selection in GSCM
Electronics case company,Taiwan
8 Luthra et al. (2013) AHP Ranking of strategies toimplement GSCM practices
Manufacturing industry,India
9 Wang and Chan (2013) Fuzzy AHP and Fuzzy TOPSIS Assessing improvement areaswhen implementing GSC
initiatives
Multinational clothingcompany, UK
10 Govindan et al. (2014a) AHP Barrier analysis for GSCM Manufacturing industries,India
11 Govindan et al. (2014b) DEMATEL, ANP andPROMETHEE
Evaluation of greenmanufacturing practices
Rubber manufacturingcompany, India
12 Mirhedayatian et al. (2014) Data Envelopment Analysis(DEA)
Evaluates the GSCM practices Soft drink companies, Iran
13 Rostamzadeh et al. (2015) Fuzzy VIKOR Evaluates the GSCMimplementation practices
Laptop manufacturer casecompany, Malaysia
14 Wu et al. (2015) Fuzzy DEMATEL Explores decisive factors inGSC practices under
uncertainty
Automobile manufacturingindustry, Vietnam
15 Mangla et al. (2015) Fuzzy AHP Analyzes risks in GSCdimension
Plastic manufacturingindustry, India
3. Research methods
This section presents the description of the methods toachieve the objectives of present research. The fuzzy AHPmethod helps in computing the importance weights of therelated GSC risks, and the fuzzy TOPSIS technique is utilizedto analyze appropriate responses of risks and to obtain theirperformance rating. Regarding some other MCDM methodslike ELECTRE (ELimination and Choice Expressing the REal-ity), ANP (Analytical Network Process), and a limited recog-nition for their applicability have been acknowledged by thescientific group of people (Harputlugil et al., 2011). Comparedto ANP, the AHP method is a linear evaluation type and sim-pler method. Furthermore, in case of ANP, it needs to de-velop several pair-wise evaluation matrices, which could be
difficult at the non-expert participant viewpoint (Harputlugilet al., 2011). At the same time, the methodology of AHP en-ables the managers to analyze the complicated system (Saaty,1980). In recent years, rough sets theory has also been appliedsuccessfully in analyzing decision making problems (Bai andSarkis, 2010a, 2011). However, it has few limitations in termsof, a relatively new emerging technique, reaching at a num-ber of rules, which may or may not be significant (Bai andSarkis, 2010a,b). To deal this, the variation of approaches isconstantly growing, and other decision analysis techniquesmay be used for resolving the issue (Bai and Sarkis, 2010a).Due to these merits, the AHP method has been greatly ac-cepted and widely used as a decision-making method foranalyzing different systems, such as, Engineering/Design, Ed-ucation, Supply chain management, etc. (Vaidya and Kumar,
S U S T A I N A B L E P R O D U C T I O N A N D C O N S U M P T I O N 1 ( 2 0 1 5 ) 6 7 – 8 6 71
Fig. 1 – Membership function for the triangular fuzzynumber.Source: modified Zimmerman (1996).
2006; Chang et al., 2007; Zayed et al., 2008; Qureshi et al., 2009;Wadhwa et al., 2009; Govindan et al., 2014b).
The TOPSIS methodology is used because of the reasons(Wang and Chang, 2007) mentioned as: (1) the computationalprocess is simple; (2) it is an easily understandable andrational method; (3) the concept in TOPSIS, enables thedetection of the best alternative for all criteria depicted incomputational procedure; (4) the inclusion of importanceweights into computation practice. In addition, fuzzyTOPSIS has reduced the computational time and eliminatesseveral computational steps to be performed in AHP–fuzzyAHP methodology (Dagdeviren et al., 2009). The completeAHP–fuzzy AHP are logical to apply to the situation wherethere are a less number of criteria and alternatives, availableto a system. Otherwise, the number of pair wise evaluationmatrices will be higher than a reasonably threshold. Forinstance, if there are x criteria for which importance weightshave to be determined and y alternatives, in that case, thereare x × y × (y − 1)/2 pair wise evaluation comparisons needto be formed in accordance with the procedure of completeAHP–fuzzy AHP methodology (Shipley et al., 1991). Thus, toavoid the large number of pair wise evaluation comparisons,the methodology of fuzzy TOPSIS is utilized to prioritize orrank alternatives. Besides, the fuzzy set theory concept helpsin removing the inherent imprecision and ambiguity in theprocess (Zadeh, 1965). However, the details of the researchmethods are given in the subsequent sub-sections.
3.1. Use of fuzzy set theory
In this globalization era, the organizations are facing severalcomplexities in decision-making due to lack of exactness inthe data. Human involvement in evaluating multi-criteria de-cision problems typically includes qualitative judgments. Thehuman judgments are generally expressed in linguistic state-ments instead of crisp value. In this sense, fuzzy method-ology is logically helpful in providing clear information foranalyzing the problem under such unclear surroundings(Zadeh, 1965).
Fuzzy logic helps in capturing the human linguistic judg-ments and provides assistance in converting these linguisticstatements into crisp values using fuzzy numbers (Susilawatiet al., 2015). The current research uses triangular fuzzy num-ber (TFN), and it is mostly preferred for practical applications(Zimmerman, 1996; Chang et al., 2007).
In the theory of fuzzy set, if a group of object is de-scribed by X, and x with values (x1, x2, x3, . . . , xn) representsthe generic element of X, then the fuzzy set for this object setcan be represented as {(x, µA(x))|x ∈ X} (Zimmerman, 1996).
Additionally, µA(x) represents its membership function thatoperates over a scale of real numbers, usually ranged to theinterval [0,1].
For any triangular fuzzy number (a,b, c) its membershipfunction is shown in Fig. 1, and it can be expressed mathe-matically as given in Eq. (1), where a ≤ b ≤ c.
Moreover, (a,b, c) represents the lower, mean and upperboundary of the TFN. If, O1 = (a,b, c) and O2 = (p,q, r), are twotriangular fuzzy numbers. These two TFNs can be equal if andonly if a = p, b = q, c = r. Further, the algebraic operations forthese two TFNs are given as follows:
O1 + O2 =a,b, c
+p,q, r
= (a + p,b + q, c + r)
O1 − O2 = (a,b, c) − (p,q, r) = (a − p,b − q, c − r)
O1 × O2 =a,b, c
× (p,q, r) = (a × p,b × q, c × r)
O1 ÷ O2 = (a,b, c) ÷ (p,q, r) = (a ÷ p,b ÷ q, c ÷ r)
−O1 = −a,b, c
=−c, −b, −a
µA (x) =
0, x ≤ a,
·
x − ab − a
, x ∈ [a,b] ,
x − cb − c
, x ∈ [b, c] ,
0, x > c,
. (1)
Furthermore, the distance between the two TFNs can becalculated as given below:
d(O1 O2) =
13
a − p
2+b − q
2+ (c − r)2
. (2)
3.2. Fuzzy AHP
In 1970s, Thomas L. Saaty has introduced the methodology ofAHP for solving the problems in multi-criteria decision sys-tem. In methodology of AHP, ‘analytic’ implies that a par-ticular problem is initially broken down into its constitutiveelements and ‘hierarchy’ means that a hierarchical structureof the constitutive elements built according to the goal of thestudy (Saaty, 1980; Qureshi et al., 2009). This method is ben-eficial in evaluating the system in finding the priority of con-cern of criteria and sub-criteria associated with that system(Zayed et al., 2008; Sarminento and Thomas, 2010; Govindanet al., 2014a; Al-Hawari et al., 2014; Galvez et al., 2015).
However, human judgment based factors always have un-certainty and ambiguity. In such situation, the methodologyof AHP has limited acceptance (Mangla et al., 2015). To over-come this issue, it is proposed to incorporate the concepts offuzzy set theory with the AHP method (Bhatti et al., 2010).Fuzzy AHP has been recognized as a well-accepted techniqueto adequately handle the inherent uncertainty and humansubjectivity involved in the decision-making practice (Changet al., 2007; Hu et al., 2009; Kaya and Kahraman, 2010; Choud-hary and Shankar, 2012; Büyüközkan and Cifci, 2012a; Wanget al., 2012; Jakhar and Barua, 2013; Luthra et al., 2015b). In thepresent work, it is proposed to utilize the fuzzy AHP method-ology that determines the importance weights of listed risks.The various computational steps involved in employing thefuzzy AHP methodology (Wang et al., 2007; Chang et al., 2007;Mangla et al., 2015) are described as below:
Step 1: Designing the scale of relative importance toconstruct the pair wise comparison/evaluation matrix: TheTFNs, are used to improve the classical nine-point scalingdesign. In order to deal with the vagueness and unclearness
72 S U S T A I N A B L E P R O D U C T I O N A N D C O N S U M P T I O N 1 ( 2 0 1 5 ) 6 7 – 8 6
Table 2 – Fuzzy linguistic scale used for determining thepair wise evaluation matrix.Source: Wang et al. (2007).
Linguistic variables Fuzzy score
Approximately equal 1/2,1,2Approximately x times more important x − 1, x, x + 1Approximately x times less important 1/x + 1, 1/x, 1/x − 1Between y and z times more important y, (y + z)/2, zBetween y and z times less important 1/z, 2/(y + z), 1/y
Note: The value of x ranges from 2,3, . . . ,9, whereas the values of yand z can be 1,2, . . . ,9, and y < z.
involved in human based linguistic assessments, the fivefuzzy score are defined as shown in Table 2.
Step 2: Develop the fuzzy evaluation matrix: The humanjudgment linguistics assessments transformed into a fuzzyevaluation matrix through TFN. A positive fuzzy evaluationmatrix (A) is calculated by taking the average of the pairwise comparisons from decision group, which is illustratedas A =
yijn×m
,
where, yij represents the fuzzy entries in the constructedfuzzy positive matrix, i.e., (aij,bij, cij), and in this relationpositive fuzzy numbers satisfy the following property:
aij =1aji
, bij =1bji
, cij =1cji
, where,
i and j = 1,2, . . . , z, i.e., no. of criteria.
Step 3: Determination of importance weights: it needs toaggregate fuzzy numbers into crisp values. This crisp valueenables the decision makers to find out the weights ofconsidered criteria that help in determining their relativeimportance. In this regard, this study has used Chang’s ExtentAnalysis method. This method has been widely acceptedto calculate fuzzy aggregate importance weights for thefuzzy input pair-wise evaluation matrix (Viswanadham andSamvedi, 2013; Mangla et al., 2015). The details of essentialcalculations of extent analysis method as described by Chang(1992) are given as:
If extent analysis values for the ith object are representedby O1
gi, O2
gi, O3
gi, . . . ,Op
gi, then, their corresponding fuzzy syn-
thetic extent would be represented as below in Eq. (3).
Si =
oj=1
Ojgi
×
ni=1
oj=1
Ojgi
. (3)
In addition, for considering the minimum and maximum val-ues for fuzzy number, the degree of possibility for two fuzzynumbers is represented as below:
V(O1 ≥ O2) = supmin
µo1 (x) , µo2
y
;
x, y ∈ R, and x ≥ y. (4)
Noted that, if, x ≥ y and fo1 (x) = fo2y
= 1, then V(O1 ≥ O2) =
1. Since O1 and O2 are two convex fuzzy numbers, then, itsatisfies the properties mentioned as below:
V(O1 ≥ O2) = 1 if o1 ≥ o2; (5)
V(O1 ≥ O2) = hgtO1 ∩ O2
= fo1 (m) (6)
while, m represents the ordinate of the highest intersectionpoint M between µo1 and µo2 (see Fig. 2), and further, M isgiven as:
V(O1 ≥ O2) = hgtO1 ∩ O2
= (a − r) /
q − r
−b − a
. (7)
Fig. 2 – Representation of intersection between O1 and O2.Source: modified Chan et al. (2008).
Moreover, the degree of possibility for ‘k’ convex fuzzy num-bers Oi
i = 1,2, . . . , k
is calculated as:
VO ≥ O1,O2, . . . ,Ok
= V
O ≥ O1
and
O ≥ O2
and . . .and
O ≥ Ok
= minV
O ≥ Oi
, i = 1,2,3, . . . , k. (8)
Furthermore, by assuming, z′Ci
= minVSi ≥ Sk
, for k =
1,2, . . . , ,n; k = i the weight vector is given as:
W′=z′C1,C2,C3, . . . ,
CiT
;
where Ci(i = 1,2, . . . ,n) are the elements.
After normalizing, the normalized fuzzy weight vectorsfor the system are given as below, While, ‘W’ is a non-fuzzynumber.
W =z′C1,C2,C3, . . . , (Cn)
T. (9)
3.3. Fuzzy TOPSIS
Hwang and Yoon (1981) have initially proposed the method-ology of TOPSIS. According to their study, TOPSIS is amulti-criteria analysis method that enables experts to knowresponses from a set of alternatives. The reason behind this isexplained as that the best alternative would have the farthestdistance from the negative ideal response (NIS) and the small-est from the positive ideal response (PIS) (Kuo et al., 2007; Sun,2010). The negative ideal response is a response that maxi-mizes the cost criteria and minimizes the benefit criteria. Onthe other hand, the positive ideal response is a response thatminimizes the cost criteria and maximizes the benefit crite-ria.
Different researchers have successfully used the TOP-SIS method to analyze different multi criteria problems(Büyüközkan et al., 2008; Dagdeviren et al., 2009; Amiri, 2010;Aydogan, 2012).
Despite of this, the methodology of TOPSIS has beencriticized widely for its inability to deal the subjectivity andvagueness associated with the assessment of human beings(Dagdeviren et al., 2009; Afshar et al., 2011). In real-lifesituations, it is very difficult to measure human judgments incrisp values. In view of this, linguistic values could be betteroption to use. Fuzzy concepts can be helpful to measurelinguistic values. Therefore, fuzzy concepts have beenintegrated into the TOPSIS method (Choudhary and Shankar,2012). The fuzzy TOPSIS technique is an appropriate methodto analyze multi criteria problems under fuzzy surroundings(Dagdeviren et al., 2009; Viswanadham and Samvedi, 2013;Patil and Kant, 2014; Taylan et al., 2014; Prakash and Barua,2015). Various computational steps considered in employingthe fuzzy TOPSIS method can be outlined (Kuo et al., 2007;Büyüközkan et al., 2008; Sun, 2010) as below:
S U S T A I N A B L E P R O D U C T I O N A N D C O N S U M P T I O N 1 ( 2 0 1 5 ) 6 7 – 8 6 73
Table 3 – Linguistic scale used for responses rating.Source: Modified Wang et al. (2007) through expert’sopinion.
Linguistic variables Fuzzy score
Important 1/2,1,2Approximately x times more important x − 1, x, x + 1Approximately x times less important 1/x + 1, 1/x, 1/x − 1Between y and z times more important y, (y + z)/2, zBetween y and z times less important 1/z,2/(y + z),1/y
Note: The value of x ranges from 2,3, . . . ,9, whereas the values of yand z can be 1,2, . . . ,9, and y < z.
Step 1: Determine the importance weights of the evaluationcriteria: themethodology of fuzzy AHP is used in this researchto determine the importance weights of the evaluationcriteria, which are denoted by wj (j = 1,2, . . . ,n).
Step 2: Select the linguistic preferences for the alterna-tive with regards to criteria and derive the fuzzy perfor-mance/decision matrix: The problem can be expressed as:if, m denotes a set of possible alternatives represented A =
(A1,A2, . . . ,Am) and C denotes a set of possible criteria repre-sented C = (C1,C2, . . . ,Cn) for which these alternatives haveto be evaluated. Further, if there are K decision makers, thenthe evaluation rating of each expert Dk (k = 1,2, . . . ,K) foreach alternative Ai (i = 1,2, . . . ,m) with regards to criteriaCj (j = 1,2, . . . ,n) are represented by Rk = xijk (i = 1,2, . . . ,m;j = 1,2, . . . ,n; k = 1,2, . . . ,K) with membership function rep-resented by µRk(x). The scale utilized for rating of responsesis shown in Table 3.
The fuzzy performancematrix for the alternatives (F) to bedeveloped by using Eq. (10), and is represented as follows:
However, the perception toward implementation of responsemeasures of risks in GSC context varies in accordance withthe individual experience, intuition and or knowledge of theexperts. In view of this, this research has used the methodof average value to find the aggregate value of the fuzzyperformance score (i.e., aggregated fuzzy decision matrix) xijfor k experts in concern to the same evaluation criteria, givenas, xkij = 1/k(xkij+ xkij+ xkij+· · · xkij). Where, xkij is the performance
rating of alternative Ai, in reference to criteria Cj performed
by kth decision maker or expert, and xkij = (akij, bkij, c
kij).
Step 3: Derive the normalized fuzzy performance matrix:In order to convert the scale of different criteria into a com-parative and comparable unit of measurements, the raw datashould be normalized. The normalized fuzzy performancematrix R is represented as following:
R =
rijm×n
, where i = 1,2, . . . ,m; j = 1,2, . . . ,n. Further, rijis given by:
rij =
aijc∗j
,bijc∗j
,cijc∗j
and c∗j = max cij
(benefit effective criteria) (11)
rij =
a∗
j
cij,a∗
j
bij,a∗
j
aij
and a∗
j = minaij
(cost effective criteria). (12)
Step 4: Derive the weighted normalized matrix: The weightednormalized matrix v for criteria should be calculated bymultiplying the importance weights (wj) of decision criteriawith the entries of the normalized fuzzy decision matrix rij...
V = [vij]mxn where vij = rij · wj. (13)
Step 5: Compute the fuzzy positive ideal response (FPIS, A∗)and the fuzzy negative ideal response (FNIS, A−) using theexpressions as given below:
A∗= (v∗
1, v∗
2, . . . , v∗n) (14)
A−= (v−
1 , v−
2 , . . . , v−n ) (15)
Where, v∗
j = (0,0,0) and v−
j = (1,1,1); j = 1,2, . . . ,n.
Step 6: Computation of distance of each alternative from FPISand FNIS: The distance (d+
i ,d−
i ) of each weighted alternativefrom the FPIS and FNIS should be calculated using theequations given below:
d+
i =
nj=1
dv(vij, v∗
j ) (16)
d−
i =
nj=1
dv(vij, v−
j ). (17)
Step 7: Determination of closeness coefficient of eachalternative: The value of closeness coefficient denotes thedistance of alternative from the FPIS and the FNIS. Thecloseness coefficient (Di) of each alternative to be computed,as follows:
Di =d−
i(d−
i + d+
i ). (18)
Step 8: Ranking of the alternatives: Using the values ofcloseness coefficient, the different alternatives considered inthe system have been ranked. Highest value is ranked first,and thereafter, it follows a decreasing order.
4. The proposed model
The proposed model for prioritizing the response of risks ineffective adoption and implementation of green initiativesin the supply chain, based on the fuzzy AHP and fuzzyTOPSIS methods, consists of three stages as described in thefollowing sub-sections:
4.1. Stage 1: Identification of the responses to manage therisks for effective implementation of the green initiatives insupply chain
In the first stage, a decision-making team consists of expertshaving expertise in various managerial functions within theindustry, such as purchasing, planning, quality, production,finance, inspection, and environmental management wasformed. The decision making team will be helpful inidentifying and finalizing the responses to manage the risksfor effective implementation of the green initiatives in thesupply chain. Prior to this, the risks associated with the GSCwere needed to be selected. At the same time, the alternatives(responses) of the risks in GSC also need to be finalizedthrough an extensive review of literature and inputs receivedfrom the experts. Next, a decision hierarchy to be constructedthat consists of four levels, given as the goal of research atLevel 1; the main criteria at Level 2; the sub-criteria at Level 3;the alternatives represented at Level 4.
74 S U S T A I N A B L E P R O D U C T I O N A N D C O N S U M P T I O N 1 ( 2 0 1 5 ) 6 7 – 8 6
4.2. Stage 2: Calculate the importance weights of criteriaand sub-criteria
The importance weights of the criteria and sub-criteria ofthe risks in GSC were calculated by using the methodologyof fuzzy AHP. For this, the pair wise evaluation matrix ofexpert’s judgment was constructed. In this regard, a linguisticscale was provided to the experts (see Table 2 mentioned inSection 3.2). Using this scale, the final pair-wise evaluationmatrix has been constructed. Based on this matrix, theweights of the risks were calculated.
4.3. Stage 3: Evaluation of the responses (alternatives) ofrisks in adoption and effective implementation of the greeninitiatives in the supply chain
Priority or ranking of the responses of risks to manage theGSC effectively was determined using fuzzy TOPSIS method.For determining the rating of responses of risks, a linguisticscale was utilized, (for linguistic scale see Table 3 mentionedin Section 3.3). Priority of the response was determined on thebasis of the values of closeness coefficient (Di). The Di valueswere calculated with the help of fuzzy TOPSIS method. Theschematic illustration of the proposed model for prioritizingthe responses of risks in GSC is shown in Fig. 3.
5. An illustrative application example
The proposed network model is applied to a real world prob-lem. Asia has been the world’s largest plastics consumer forseveral years, accounting for almost 30% of global consump-tion (Global Plastics Industry, 2013). Following China, Indiaaccounts second significant fastest growing consumers, andoffers huge opportunities of business by incorporating en-vironmental consideration with recycling and reusing oper-ations. All India Plastics Manufacturers Association (AIPMA)report estimates that Plastics is one of the major contributorsto India’s GDP and the consumption of plastic will increaseto almost 2–3 times a year in 2020 from the existing 8 milliontons a year in India (Plastic News, 2013). Considering the busi-ness opportunities in this sector, a GSCM case example of apoly-plastic manufacturing company located in the northernregion of India has been identified in this research.
The case company was established in year 1967 with avision to emerge a niche power in the plastic manufactur-ing industrial sector. At present, the company has an annualturnover in the range of 50–60 Million (INR). It has a good rep-utation in both the domestic and global market. Currently, thecompany is TS-16949/ an ISO-14001 certified. There are morethan 450 employees in the firm. The company produces awide variety of products including Automotive Plastic moldedcomponents, Wheel Rims & Wheel Covers, Emblems (Elec-troplated, Painted & Hot stamped), Door Handle, DecorativeBody side molding, etc. During the manufacturing of plasticbased automotive products, minerals like carbon and hydro-gen are used as the raw material. The global trend and com-petitions in the plastic sector proposes a great pressure toconsider green influence in the supply chain planning pro-cess. It not only offer enough prospects for sustainable oper-ations, such as reuse and recycling of plastic based products,but also significantly reduces the consumption of resources,energy (Plastic Europe, 2009). Considering this, the companyin question is greatly conscious in improving its ecologicalperformance, and wants to develop a sustainable businessculture. Therefore, company managers are implementinggreen considerations at various stages of business.
However, the company managers were facing several risksand problems in GSCM network design. Thereby, the casecompany has shown desire to list the risks associated withthe implementation of different green initiatives in the sup-ply chain to improve its effectiveness. Besides, the managersof the case company also seek to identify and select appro-priate and viable responses to manage and reduce the con-sequences of the risks in a successful accomplishment ofdifferent business activities in GSC. Under these consider-ations, implementation of appropriate mitigation responsemeasures to deal with GSC risks assumes great importancefor the company in this perspective.
An application of the proposedmodel is described throughthree stages given in the earlier section (Section 4), and withregards to the company in question is illustrated as follows:
5.1. Identification of the responses to manage the risks foreffective adoption and implementation of the green initiativesin supply chain
A decision making team of ten experts is formed which con-sists of five senior managers, two environmental representa-tives and three senior professionals of supply chainmembers.All experts are capable of decision-making and are actively in-volved in supply chain planning and operations managementactivities since last seven years.
Mangla et al. (2015), proposed a risk analysis framework foreffective understanding of implementation of the green ini-tiatives from a supply chain perspective. Based on this study,we selected the six main criteria and twenty-five risks (sub-criteria) associated with the GSC as shown in Appendix A.These risk criteria and sub-criteria have also been validatedfor an agreement through an interactive discussion with theprofessionals of decision-making team.
In order to manage these risks, 17 responses were identi-fied (see Table 4). These responses were selected through liter-ature and inputs received from the professionals of the samedecision-making team.
In that way, twenty-five risks and seventeen responses, tomanage these risks, were decided, and a decision hierarchywas constructed to address the problem as shown in Fig. 4. Itconsists of four levels — Prioritizing responses of the risks ineffective adoption and implementation of green in the supplychain (the goal of research) at Level 1; Risks (the main criteriaused in this research) at Level 2; Risks (sub-criteria used inthis research) at Level 3; Responses (proposed alternatives)represented at Level 4.
After the approval of the constructed decision hierarchy bythe professionals of decision-making team, the importanceweights of the criteria recognized in this study wasdetermined as given in the next section.
5.2. Compute the importance weights of criteria and sub-criteria
Based on the work presented in the study of Mangla et al.(2015), the pair-wise evaluation matrices for the main criteriaand sub-criteria were formed. The TFN based pair-wiseweight evaluation matrix for the main criteria is given inTable 5.
The importance weights for each recognized main criteriaand sub criteria were calculated using expert’s inputs throughChang’s Extent Analysis method. It has been calculated by
S U S T A I N A B L E P R O D U C T I O N A N D C O N S U M P T I O N 1 ( 2 0 1 5 ) 6 7 – 8 6 75
Table 4 – Defining the responses of risks in adoption and effective implementation of the green initiatives in the supplychain.Source: Combined result of the studies of Green et al. (1996, 2000), Roarty (1997), Lippmann (1999), Beamon (1999), Hillary(2000), Hall (2001), Sarkis (2003), Sarkis (2006), Hervani et al. (2005), Zhu et al. (2005, 2008a,b), Adler (2006), Zhu andSarkis (2006), Orsato (2006), Walker et al. (2008), Marsillac (2008), Hsu and Hu (2008), Mudgal et al. (2009), Holt andGhobadian (2009), AlKhidir and Zailani (2009), Hu and Hsu (2010), Yang and Li (2010), Diabat and Govindan (2011), Tokeet al. (2012), Wang et al. (2012), Meacham et al. (2013), Muduli and Barve (2013), Muduli et al. (2013), Mangla et al.(2014a,c, 2015), and inputs of the professionals of the decision-making team.
Responses Description
Establishment of motivational programs forsupplier to built their commitment about green(R1)
The initiation of motivational programs will be quite useful in building the supplier’scommitment in adopting of the green trends in the organizational supply chain
Use of information technology in tracking thereturning of products to foster the productrecovery (R2)
Information system can be effective in tracking the returning of products by use of barcode, EDI, RFID, etc., and thereby GSC product recovery performance will improve
Adoption of product take-back responsibilities(R3)
Product take-back obligations influences the collection procedure and improves theproduct recovery process in GSC
Provision of well-defined and environmentalsupportive governmental policies and directions(R4)
Establishment of well-defined and environmental supportive governmental directionswould be significant for industries. Efficient legislative directions and governmentalpolicies in terms of providing some incentives and subsidies and or exempting the taxon green product may be helpful in solving the various uncertain issues related toadoption of GSC initiatives
Improved forecasting (R5) Accurate forecast through improved forecasting method and techniques are significantto stabilize the demand risk in GSC in business
Multiple supplier policy (R6) Policy of multiple supplier helps in resolving the supplier risks and certainly improvesthe economic–ecological gains in GSC at industrial perspective
Incorporation of environmental practices incompany policies and mission at strategically (R7)
In a strategic view, it is significant to include environmental concepts in companypolicies and mission for achieving better GSC performances from the industrialstandpoint
Establish an efficient information network systemfor effective green information sharing amongpartners and across the hierarchy (R8)
An efficient interactive information network will reduce the risks of informationasymmetry between supply chain partners and members across the hierarchy. It will becrucial in implementing an effective GSCM thought in business
Training and education of employee to increasetheir competency regarding green (R9)
The understanding and knowledge of green operations and method among employeesis important to increase the success rate of GSC
Flexibility in design to process and operationallevel (R10)
The strategy of flexibility in design at process and operational level is significant inmanaging the GSC operations and will be useful in improving the overall performance
Awareness and education of the customers aboutgreen (R11)
Ecological consciousness of consumers is one of the significant factors fororganizations to increase the GSC effectiveness
To develop and upgrade on technology being usedin the specific sectors for implementation of green(R12)
Managers should have sound knowledge and understanding of the applicability of newtechnology in various sectors for effective implementation of green in the supply chain
Establishing a well designed reverse logisticssystem (R13)
Reverse logistics has been recognized as a significant operation in GSC perspective inrecovering the resources via closing the forward supply loop
Conduct seminar and some programs to educatesupply chain partners and members about green(R14)
Conducting seminar and education program can be significant in updating theknowledge of supply chain members and partners, and it would be helpful inenhancing the GSC success rate
Commitment of top management and support oflower and middle level managers (R15)
The commitment of top management and support at managerial level, (i.e. at lower andmiddle level) is important in adopting efficient green trends in the supply chain
Building organizational-supplier environmentalcollaboration and partnerships (R16)
Building of environmental collaboration and partnerships among organization andsupplier is useful in enhancing the ecological performance of suppliers and certainlywould reduce the disruptions at the supplier end in GSC
Establishment of financial resources, capabilitiesand contingency plans (R17)
Establishment of financial resources, capabilities and contingency plans are veryimportant from the industrial point of view in adoption and implementation of efficientGSC initiatives/practices
76 S U S T A I N A B L E P R O D U C T I O N A N D C O N S U M P T I O N 1 ( 2 0 1 5 ) 6 7 – 8 6
Fig. 3 – Schematic illustration of the proposed model for prioritizing the responses of risks in GSC.
using Eqs. (3)–(9) as mentioned in Section 3.2. The associatedSi values can be computed through Eq. (3), as follows:
S1 = (7.3300,10.0000,13.0000)
×
1
68.1400,
151.5200
,1
37.4200
= (0.1076,0.1941,0.3474)
S2 = (5.6600,7.4000,9.5000) ×
1
68.1400,
151.5200
,1
37.4200
= (0.0831,0.1436,0.2539)
S3 = (4.9100,6.1900,7.8300) ×
1
68.1400,
151.5200
,1
37.4200
= (0.0721,0.1201,0.2092)
S4 = (6.2500,8.7900,11.3900) ×
1
68.1400,
151.5200
,1
37.4200
= (0.0917,0.1706,0.3044)
S5 = (3.7000,4.4100,5.3600) ×
1
68.1400,
151.5200
,1
37.4200
= (0.0543,0.0856,0.1432)
S6 = (2.9100,5.2300,8.0600) ×
1
68.1400,
151.5200
,1
37.4200
= (0.0427,0.1015,0.2154).
Using Eqs. (3)–(7), the degree of possibility for two fuzzynumbers is given as,
V(S1 ≥ S2) =(0.0831 − 0.3474)
(0.1941 − 0.3474) − (0.1436 − 0.0831)= 1
V(S1 ≥ S3) = 1
V(S1 ≥ S4) = 1
V(S1 ≥ S5) = 1
V(S1 ≥ S6) = 1
V(S2 ≥ S1) =(0.1076 − 0.2539)
(0.1436 − 0.2539) − (0.1941 − 0.1076)= 0.7434
V(S2 ≥ S3) =(0.0721 − 0.2539)
(0.1436 − 0.2539) − (0.1201 − 0.0721)= 1
V(S2 ≥ S4) =(0.0917 − 0.2539)
(0.1436 − 0.2539) − (0.1706 − 0.0917)= 0.8579
S U S T A I N A B L E P R O D U C T I O N A N D C O N S U M P T I O N 1 ( 2 0 1 5 ) 6 7 – 8 6 77
Fig. 4 – Decision hierarchy for prioritizing the responses of risks in GSC.Source: Literature survey and inputs of the professionals of decision-making team.
Table 5 – Triangular fuzzy number based pair-wise evaluation matrix for GSC risk criteria.Source: Mangla et al. (2015).
These calculated minimum weight vectors were furtheroperated to obtain the normalized value and weight vector byusing Eqs. (9)–(10). As a result, the weight vectors for the mainrisks (i.e., 0.2507, 0.1863, 0.1449, 0.2236, 0.0607 and 0.1338)were established. In the same way, the importance weightsfor sub risks have been computed. The calculated importanceweights of the criteria of risk and sub risks are given inAppendix A. The order of priority of main risks and sub risks,based on their respective global importance weights, has alsobeen determined. The global importance weights for the subrisks were calculated by multiplying their relative importanceweights with importance weights of their respective mainrisks.
After the approval of calculated weights of criteria andsub-criteria by decision-making team, the ranking of theresponses of risks recognized in this study are determined inthe next sub-section.
5.3. Evaluation of the responses of risks in adoption andeffective implementation of the green initiatives in the supplychain
In this stage, the experts in the decision team were askedto make a fuzzy performance matrix based on linguisticvariables illustrated in Table 3 (for Table 3 see Section 3.3).In this fuzzy performance matrix, the identified responseswere compared with regards to each of the identified risk.The linguistic expressions were replaced with TFN and thefuzzy performance matrix was constructed. In this way, thefuzzy performance matrix of each expert was constructed.The fuzzy performance matrix given by Expert 1 is given inTable 6.
Then, by taking an average of the fuzzy evaluationmatrices of the experts, an aggregate fuzzy performancematrix was derived as shown in Table 7.
Next to this, a fuzzy normalized performance matrix wasformed as illustrated in Table 8. As alreadymentioned, severalrisks criterion in GSC has been listed, and it is proposed tomanage or minimize these risks. Therefore, it can be statedthat all the risks are cost effective criteria. Hence, a fuzzynormalized performance matrix was formed using Eq. (12).For instance, the normalized fuzzy performance matrix withregards to response R1 and risk O1 is given as,
rij =
0.332
,0.331.2
,0.330.7
,
= (0.165,0.275,0.471)
(by taking cost effective criteria).
These calculations were repeated for the remaining risks forresponse R1.
Then, a fuzzy weighted performance matrix was con-structed by multiplying the importance weights of criteriacomputed by fuzzy AHP with the elements of the fuzzy nor-malized performance matrix, and is shown in Table 9. For in-stance, the fuzzy weighted performance entry with regards toresponse R1 and risk O1 based on Eq. (13) is given as,
V = 0.0399 × (0.165,0.275,0.471) = (0.006,0.010,0.018).
These calculations were repeated for the remaining risks forresponse R1.
In this research work, all the risks are cost effectivecriteria. Therefore, the fuzzy positive ideal response (FPIS, A∗)and the fuzzy negative ideal response (FNIS, A−) are given asv∗
j = (0,0,0), v−
j = (1,1,1) respectively for each of these risk
criteria. The distance (d+
i ,d−
i ), of each of the alternative werecalculated from these FPIS and FNIS by using Eqs. (16)–(17).As an example, the distances d(A1,A∗) and d(A1,A−) withregards to response R1 and risk O1 from FPIS and FNIS werecalculated, as follows:
d(A1,A∗) =
13
[(0 − 0.006)2 + (0 − 0.010)2 + (0 − 0.018)2]
+ · · · +
13
[(0 − 0.001)2 + (0 − 0.001)2 + (0 − 0.002)2]
= 0.2966 (19)
d(A1,A−) =
13
[(1 − 0.006)2 + (1 − 0.010)2 + (1 − 0.018)2]
+ · · · +
13
[(1 − 0.001)2 + (1 − 0.001)2 + (1 − 0.002)2]
= 24.7299. (20)
These calculations were repeated for the remaining risksfor response R1. Further, based on distances d(A1,A∗) and
S U S T A I N A B L E P R O D U C T I O N A N D C O N S U M P T I O N 1 ( 2 0 1 5 ) 6 7 – 8 6 79
Table 6 – Fuzzy performance matrix for the responses of risks in GSC (given by Expert 1).Source: fuzzy-TOPSIS analysis.
d(A1,A−), the closeness coefficient of R1 was computed usingEq. (18), and is given as:
D1 =24.7299
(0.2966 + 24.7299)= 0.9881.
In the same way, distances d(A1,A∗) and d(A1,A−) were cal-culated for each of the response, and the corresponding close-ness coefficient (Di) was computed. To develop and upgradeon technology being used in the specific sectors for imple-mentation of green (R12) response obtains the highest Divalue of equal to 0.9952. While, Use of information technol-ogy in tracking the returning of products to foster the productrecovery (R2) response obtains the lowest highest Di value ofequal to 0.98607. Finally, using Di values, the ranking for therisk responses or alternatives was made as shown in Table 10.
6. Discussion of the results
It is difficult to declare, which responses are more signifi-cant to manage the risks in adopting effective green initia-tives in the supply chain scenario. However, the prioritizingof these responses by utilizing fuzzy AHP and fuzzy TOPSISmethods could be more effective to the point of view of in-dustries in this situation. In the present work, an integratedfuzzy AHP–TOPSIS approach has been extended to an Indiancase company to improve its effectiveness in adoption andimplementation of the green initiatives in the supply chain.For this, a set of appropriate and feasible responses are pro-posed to the case company to manage and reduce the conse-quences of the risks in GSC.
80 S U S T A I N A B L E P R O D U C T I O N A N D C O N S U M P T I O N 1 ( 2 0 1 5 ) 6 7 – 8 6
Table 10 – Summary of closeness coefficient (Di) andfinal ranking of the responses.Source: fuzzy-TOPSIS analysis.
According to the findings of this research, twenty-fiverisks and seventeen responses were recognized through lit-erature resource and in consultation with experts. The im-portance weights of the risks were identified using the fuzzyAHP method. These weights were used to give priority to re-sponses of the risks in GSC by using the fuzzy TOPSISmethod.
The fuzzy TOPSIS based preference order of responses ofrisk in GSC is illustrated in Table 10. According to the val-ues of Di, the priority of concern of the responses of the risksin GSC are given as, R12-R15-R10-R7-R17-R16-R8-R6-R14-R11-R13-R5-R4-R9-R3-R1-R2. To develop and upgrade on technol-ogy being used in the specific sectors for implementation ofgreen (R12) obtains the highest rank. Thus, managers of theIndian case company should consider this response at prior-ity in effective implementation of GSCM. The commitment oftop management and support of lower and middle level man-agers (R15) comes next to R12 in priority in adopting an effi-cient GSCM thought. Further, Flexibility in design to processand operational level (R10) and Incorporation of environmen-tal practices in company policies and mission at strategically(R7) occupies the third and fourth place of priority, and so onup to Use of information technology in tracking the returningof products to foster the product recovery (R2), which obtainsthe last rank.
Furthermore, to increase the managerial utility of this re-search, the research findings were discussed with the deci-sionmaking teamwith an objective to have further insights toimplement the responses of risks relevant to effective GSCMadoption and implementation, which in turn will improvethe GSC effectiveness. Therefore, case companymanagers aresuggested that they should formulate the proposed responsesin accordance with their priority and implement them in asystematic way as defined through the rank assigned in thisstudy.
6.1. Evaluation of sensitivity analysis results
To check the robustness of the proposedmodel, it is suggestedto conduct the sensitivity analysis test (Patil and Kant,2014). In sensitivity analysis (for this a computer basedprogram is prepared by means of Microsoft Excel), the rankingof the responses of risks were monitored with regards tothe changes in the importance weights of identified risks.
Therefore, in this research, the total twenty-one experimentshave been performed; details are given in Table 11.
In the first 20 experiments, the importance weights of eachrisk was set as a higher one by one, while the weights ofother risks are set to low and assigned at equivalent impor-tance or equal values (for details see Table 11). According tothe findings of sensitivity analysis test, the weight of the riskO1 is taken as 0.6 and the weights of the remaining 24 risks(experiment-1) are given as equal importance, thus assignedequal importance weights for them, i.e. 0.01667. In experi-ment number 21, all the risks are treated as equally impor-tant, and so, they are assigned as equal weights, i.e. 0.04.
The changes in the importance weights of the risk (criteria)may reflect changes in both the closeness coefficient andthe final ranking of the responses of risks in efficient GSCMadoption. In sensitivity analysis, out of 21 experiments,response (R12) has obtained the highest value of closenesscoefficient in 10 experiments (in experiments number 1–3,6, 8, 10–12, 16–17). While, response (R15) has received thehighest score in 7 experiments (i.e. in experiments number5, 7, 9, 13, 19–21). Concerning to the other 4 experiments,response (R10) acquired the highest score and thus obtainedthe first rank among other responses. According to sensitivityanalysis, in the majority of experiments (approximately 50%of times), response (R12) has obtained the highest rankamong all risk responses. Hence, it can be concluded thatthe proposed network model is robust, and the ranking ofthe responses of risks relevant to effective adoption andimplementation of GSCM is relatively stable to the change inthe weights of the risks as shown in Fig. 5.
7. Conclusions, limitations, and future scopeof research
Due to customer pressure, scarcity of natural resources, andgovernmental policies, industries are pushing to adopt greeninitiatives in the supply chain planning process. However, theeffectiveness of GSC is relatively low as different risks andrisk factors are associated with the GSCM adoption. It callsfor the need to manage these risks by providing the necessaryresponse measures. However, in real world situations, it isvery difficult for industries to implement all the responsemeasures simultaneously because of various constraints andcurbs. Hence, prioritizing the responses may prove to bebeneficial to have a systematic implementation of theseresponses in managing the GSC effectively. By implementingappropriate response measures, industries would becomemore capable in managing GSC risk and reducing pessimisticconsequences.
In this research, an effort has been made to suggest astructural model to prioritize responses of the risks in GSCdimension. The proposed approach helps managers in over-coming the problem of human subjectivity and an inher-ent uncertainty in the GSC risk management process. Themethodology of fuzzy AHP is helpful in deciding the impor-tance weights of the related GSC risks, and the fuzzy TOPSIStechnique is utilized to determine the responses’ priority. Theweights obtained from the fuzzy AHP method are used as in-put in the fuzzy TOPSIS technique, and the identified appro-priate responses of risks are ranked to obtain the priorities interms of their implementation.
The real-world applicability of the proposed networkmodel has been illustrated through an Indian poly-plastic
S U S T A I N A B L E P R O D U C T I O N A N D C O N S U M P T I O N 1 ( 2 0 1 5 ) 6 7 – 8 6 81
Tabl
e11
–S
um
mar
yof
resu
lts
ofse
nsi
tivi
tyan
alys
iste
st.
Source:
Sen
siti
vity
anal
ysis
.
Des
cription
ofth
eex
perim
ents
R1
R2
R3
R4
R5
R6
R7
R8
R9
R10
R11
R12
R13
R14
R15
R16
R17
Exp1:
WO1=
0.60
,WO2–
WGO6=
0.01
667
0.97
070.96
510.97
090.96
530.96
660.96
730.96
480.96
600.96
720.96
840.96
520.97
320.96
630.96
790.96
760.97
030.97
19Ex
p2:
WO2=
0.60
,WO1,
WO3–
WGO6=
0.01
667
0.97
170.96
680.97
200.96
810.96
850.96
860.96
730.96
850.97
020.97
120.96
680.97
300.96
810.96
990.96
940.97
040.97
13Ex
p3:
WO3=
0.60
,WO1–
WO2,
WO4–
WGO6=
0.01
667
0.97
220.97
280.97
420.97
240.97
340.97
320.97
320.97
330.97
300.97
250.97
220.97
380.97
360.97
350.97
120.97
370.97
03Ex
p4:
WO4=
0.60
,WO1–
WO3,
WS1
–WGO6=
0.01
667
0.96
990.97
060.96
990.97
120.96
970.96
800.96
850.97
030.96
720.97
340.96
800.96
890.96
960.96
750.96
940.97
040.96
78Ex
p5:
WS1
=0.60
,WO1–
WF3
,WS2
–WGO6=
0.01
667
0.97
210.97
010.97
090.96
830.96
760.96
920.97
070.97
160.97
030.96
810.97
020.96
800.97
000.96
650.97
330.96
890.97
31Ex
p6:
WS2
=0.60
,WO1–
WS1
,WS3
–WGO6=
0.01
667
0.97
200.97
040.96
890.97
180.97
130.96
810.96
780.96
970.97
010.96
930.96
860.97
280.96
830.96
890.96
770.96
750.96
65Ex
p7:
WS3
=0.60
,WO1–
WS2
,WS4
–WGO6=
0.01
667
0.97
180.96
930.96
860.97
060.96
990.97
200.97
190.97
230.97
170.96
730.97
260.96
760.97
250.96
860.97
360.96
920.97
32Ex
p8:
WS4
=0.60
,WO1–
WS3
,WPR
1–W
GO6=
0.01
667
0.96
950.97
270.96
920.96
810.97
240.97
200.97
060.97
100.97
250.96
920.96
810.97
340.96
830.96
710.97
060.96
820.97
27Ex
p9:
WPR
1=0.60
,WO1–
WS4
,WPR
2–W
GO6=
0.01
667
0.96
820.97
220.97
260.96
710.96
690.96
780.96
610.96
870.96
980.97
230.96
920.96
930.96
870.96
830.97
350.97
020.97
20Ex
p10
:WPR
2=0.60
,WO1–
WPR
1,W
PR3–
WGO6=
0.01
667
0.96
870.97
050.97
120.97
130.96
970.97
000.96
850.97
000.97
160.97
070.96
640.97
280.96
660.96
720.96
830.97
010.97
13Ex
p11
:WPR
3=0.60
,WO1–
WPR
2,W
PR4–
WGO6=
0.01
667
0.97
260.96
820.97
260.96
980.96
860.96
790.96
660.96
810.96
930.96
800.96
940.97
320.96
990.96
870.96
780.97
280.97
29Ex
p12
:WPR
4=0.60
,WO1–
WPR
3,W
GO1–
WGO6=
0.01
667
0.96
910.97
040.97
120.96
860.96
960.96
840.96
810.96
840.97
020.96
850.96
790.97
260.96
840.96
770.96
690.97
000.97
13Ex
p13
:WF1
=0.60
,WO1–
WO4,
WF2
–WGO6=
0.01
667
0.97
250.96
880.97
120.96
960.96
780.97
150.97
090.97
090.96
830.96
800.96
890.97
000.97
120.96
800.97
300.97
200.97
23Ex
p14
:WF2
=0.60
,WO1–
WF1
,WF3
–WGO6=
0.01
667
0.97
120.97
300.97
070.96
920.96
650.97
160.96
900.96
780.96
840.97
310.97
100.96
720.97
030.96
830.96
890.97
050.97
27Ex
p15
:WF3
=0.60
,WO1–
WF2
,WS1
–WGO6=
0.01
667
0.97
010.97
260.97
390.97
240.97
260.97
100.96
900.96
850.97
040.97
360.97
170.97
110.97
280.97
160.97
030.97
300.97
28Ex
p16
:WD1=
0.60
,WO1–
PR4,
WD2–
WGO6=
0.01
667
0.96
910.96
970.97
330.96
800.96
800.96
760.96
760.96
920.96
990.97
260.96
860.97
350.96
830.96
870.97
010.96
880.97
33Ex
p17
:WD2=
0.60
,WO1–
D1,
WD3–
WGO6=
0.01
667
0.97
130.97
220.96
920.96
990.96
860.96
740.96
880.96
690.97
230.96
850.96
860.97
300.97
300.96
980.96
990.97
160.97
24Ex
p18
:WD3=
0.60
,WO1–
WD2,
WD4–
WGO6=
0.01
667
0.97
240.97
110.97
060.96
970.97
110.97
100.97
210.97
110.96
980.97
260.97
170.96
700.97
280.96
890.96
700.96
950.97
10Ex
p19
;WD4=
0.60
,WO1–
D3,
WGO1–
WGO6=
0.01
667
0.96
810.97
240.97
100.96
700.96
990.96
910.97
080.97
060.97
050.96
950.97
270.97
010.96
940.96
900.97
360.97
020.96
90Ex
p20
:WGO1=
0.60
,WO1–
D44
,WGO1–
WGO6=
0.01
667
0.96
690.96
820.96
970.97
000.96
680.96
920.96
950.97
010.96
760.97
010.97
150.96
810.96
940.96
860.97
340.97
030.96
91Ex
p21
:WO1–
WGO6=
0.04
0.99
710.99
700.99
710.99
690.99
690.99
700.99
690.99
690.99
700.99
690.99
700.99
690.99
700.99
690.99
720.99
700.99
71
82 S U S T A I N A B L E P R O D U C T I O N A N D C O N S U M P T I O N 1 ( 2 0 1 5 ) 6 7 – 8 6
Tabl
eA
.1–
List
ing
and
fin
alra
nk
ing
ofm
ain
crit
eria
and
sub-
crit
eria
ofri
sks
inG
SC
base
don
Man
gla
etal
.(20
15).
Riskcriteria
Impor
tance
weigh
tsRan
kSu
brisk
sRelative
weigh
tsRelative
rank
Globa
lweigh
tsGloba
lrank
Operational
risk
s(O
)0.25
071
Mac
hine,
equipmen
tor
facility
failure
(O1)
0.15
954
0.03
999
11Des
ignrisk
sO2
0.31
772
0.07
965
3Sc
arcity
ofsk
illedlabo
rO3
0.19
563
0.04
904
8Green
tech
nolog
yleve
lO4
0.32
721
0.08
203
2Su
pply
risk
s(S)
0.18
633
Proc
uremen
tco
stsrisk
sS1
0.19
444
0.03
622
13Key
supplier
failuresS2
0.24
543
0.04
572
10Su
pplier
qualityissu
esS3
0.25
282
0.04
710
9Green
raw-m
aterials
upply
disru
ption
sS4
0.30
541
0.05
690
6Prod
uct
reco
very
risk
s(PR)
0.14
494
Inve
ntory
andca
pac
itydes
ignrisk
sat
repro
cessingce
nters
PR1
0.17
243
0.02
498
17
Gateke
epingdes
ignfailuresPR
20.16
834
0.02
439
18Rev
erse
logisticsdes
ignrisk
sPR
30.23
992
0.03
476
14Ta
ke-bac
kob
liga
tion
srisk
sPR
40.41
841
0.06
063
5Finan
cial
risk
s(F)
0.22
362
Sourcingof
fundsF1
0.33
902
0.07
580
4In
flationan
dcu
rren
cyex
chan
geratesF2
0.24
783
0.05
541
7Finan
cial
restrictionsF3
0.41
221
0.09
217
1Dem
andrisk
s(D
)0.06
076
Bullwhip
effect
risk
sD1
0.25
042
0.01
520
21Marke
tdyn
amicsD2
0.12
064
0.00
732
25Key
custom
erfailuresD3
0.23
853
0.01
448
22Com
petingrisk
sD4
0.39
151
0.02
376
19Gov
ernmen
tala
ndOrgan
izational
relatedrisk
s(G
O)
0.13
385
Man
agem
entpolicyfailuresGO1
0.27
181
0.03
637
12
Gov
ernmen
tpolicyrisk
sGO2
0.20
673
0.02
766
16In
form
ationas
ymmetry
risk
acro
ssGSC
mem
bers
inhierarchy
GO3
0.16
334
0.02
185
20
Lack
inen
terp
rise
strategicgo
alsGO4
0.22
122
0.02
956
15Le
galr
isks
GO5
0.07
985
0.01
067
23Pa
rtnersh
iprisk
sGO6
0.05
726
0.00
765
24
S U S T A I N A B L E P R O D U C T I O N A N D C O N S U M P T I O N 1 ( 2 0 1 5 ) 6 7 – 8 6 83
Fig. 5 – Score of closeness coefficient through sensitivity analysis.Source: Sensitivity analysis.
manufacturing company GSCM case. Based on literature re-source and inputs from the professionals of decision-makingteam, seventeen responses of risks relevant to the implemen-tation of GSC initiatives are finalized. The selected responsesare prioritized based on their respective rank using integratedfuzzy AHP–TOPSIS approach.
The findings of this study illustrate that to develop andupgrade on technology being used in the specific sectorsfor implementation of green, response (R12) obtains thehighest priority. Meaning that, it is the highest rank responseto manage risk and its consequences in effective GSCMadoption and implementation. Thus, managers should focusthis response at priority in managing the risks in GSC.
It is believed that the current work would help the man-agers of the Indian case company inmanaging GSC efficiently.The findings of this research will not only assist the casecompany in managing the risks and risk factors relevant toan effective implementation of GSCM, but also enable in en-hancing the ecological–economic gains. In the end, sensitiv-ity analysis examines the robustness of the proposed networkmodel.
This research has some limitations as well. A fuzzyAHP–TOPSIS integrated decision framework has been de-veloped with twenty-five risks and seventeen responses tomanage the risks in the context of GSC. More responses tomanage these risks have not been recognized. For the per-spective of future analysis, the interdependence and strengthof relationships between or among recognized responses ofthe risks can be explored by using other multi-criteria, anal-ysis methods like Interpretive Structural Modelling (ISM), De-cision Making Trial and Evaluation Laboratory (DEMATEL) etc.Further, the projected fuzzy based AHP—TOPSISmethodologymight be extended to various sectors of industry, for exam-ple, the automobile, power, service, that seeks to determinethe performance ratings of the responses of the risks in im-plementing an effective GSCM concept. However, the expert’sjudgment may vary with industry type and its priorities.
Acknowledgments
We wish to thank Prof. Adisa Azapagic, (Editor-in-chief,Sustainable Production and Consumption) and anonymousreviewers, for your constructive suggestions. We thank youand your reviewers for suggesting us directions for improvingthe paper. We are also thankful to The Ministry of HumanResource Development (MHRD), India for the financial andtechnical support. We also acknowledge the support to theresearch facilities provided by the Department of Mechanicaland Industrial Engineering, in Indian Institute of TechnologyRoorkee, India.
Appendix
Table A.1.
References
Adler J., 2006. Going Green, Newsweek, online atwww.msnbc.msn.com, July 17; pp. 42-52.
Afshar, A., Marino, M.A., Saadatpour, M., Afshar, A., 2011.Fuzzy TOPSIS multicriteria decision analysis applied to karunreservoirs system. Water Resour. Manage. 25 (2), 545–563.
Ahi, P., Searcy, C., 2013. A comparative literature analysisof definitions for green and sustainable supply chainmanagement. J. Cleaner Prod. 52 (1), 329–341.
Albino, V., Balice, A., Dangelico, R.M., 2009. Environmentalstrategies and green product development: An overview onsustainability-driven companies. Bus. Strategy Environ. 18 (2),83–96.
Al-Hawari, T., Mumani, A., Momani, A., 2014. Application of theAnalytic Network Process to facility layout selection. J. Manuf.Syst. 33 (4), 488–497.
AlKhidir, T., Zailani, S., 2009. Going green in supply chain towardsenvironmental sustainability. Global J. Environ. Res. 3 (3),246–251.
Amiri, M.P., 2010. Project selection for oil-fields development byusing the AHP and fuzzy TOPSIS methods. Expert Syst. Appl. 7(9), 6218–6224.
84 S U S T A I N A B L E P R O D U C T I O N A N D C O N S U M P T I O N 1 ( 2 0 1 5 ) 6 7 – 8 6
Aydogan, E., 2012. Performance measurement model for Turkishaviation firms using the rough-AHP and TOPSIS methodsunder fuzzy environment. Expert Systems with Applications38 (4), 3992–3998.
Bai, C., Sarkis, J., 2010a. Green supplier development: analyticalevaluation using rough set theory. J. Cleaner Prod. 18 (12),1200–1210.
Bai, C., Sarkis, J., 2010b. Integrating sustainability into supplierselection with grey system and rough set methodologies. Int.J. Prod. Econ. 124 (1), 252–264.
Bai, C., Sarkis, J., 2011. Evaluating supplier development programswith a grey based rough setmethodology. Expert SystemswithApplications 38 (11), 13505–13517.
Beamon, B.M., 1999. Designing the green supply chain. Logist. Inf.Manage. 12 (4), 332–342.
Bhatti, R.S., Kumar, P., Kumar, D., 2010. A Fuzzy AHP modelfor 3PL Selection in Lead Logistics Provider Scenarios.In: Chapter 18 of Enterprise Information Systems andImplementing IT Infrastructures: Challenges and Issues. IGIGlobal Publications, Hershey, Pennsylvania, USA, (ISBN: 978-1-61520-625-4).
Büyüközkan, G., Cifci, G., 2012a. A combined fuzzy AHP and fuzzyTOPSIS based strategic analysis of electronic service quality inhealthcare industry. Expert Systems with Applications 39 (3),2341–2354.
Büyüközkan, G., Çifçi, G., 2012b. A novel hybrid MCDM approachbased on fuzzy DEMATEL, fuzzy ANP and fuzzy TOPSIS toevaluate green suppliers. Expert Systems with Applications 39(3), 3000–3011.
Büyüközkan, G., Feyzioglu, O., Nebol, E., 2008. Selection of thestrategic alliance partner in logistics value chain. Int. J. Prod.Econ. 113 (1), 148–158.
Chang, Y.H, Chung, H.Y., Wang, S.Y., 2007. A survey andoptimization-based evaluation of development strategies forthe air cargo industry. Int. J. Prod. Econ. 106, 550–562.
Choudhary, D., Shankar, R., 2012. An STEEP-fuzzy AHP-TOPSISframework for evaluation and selection of thermal powerplant location: A case study from India. Energy 42 (1), 510–521.
Dagdeviren, M., Yavuz, S., Kılınç, N., 2009. Weapon selectionusing the AHP and TOPSIS methods under fuzzy environment.Expert Systems with Applications 36 (4), 8143–8151.
Dan-Li D., Ju Q., Hong-Yan Z., Risk assessment study ofmanufacturing green supply chain based on grey theory. In:International Conference on Information Systems for CrisisResponse and Management (ISCRAM), Harbin, Heilongjiang,2011, pp. 234–240, ISBN: 978-1-4577-0369-0.
Diabat, A., Govindan, K., 2011. An analysis of the drivers affectingthe implementation of green supply chain management.Resour. Conserv. Recycling 55, 659–667.
EPA United States Environmental Protection Agency. 2000. TheLean and Green Supply Chain. A practical Guide for MaterialsManagers and Supply Chain Managers to Reduce Costsand Improve Environmental Performance. Washington, DC;pp. 12–13.
Fahimnia B., Sarkis J., Davarzani H., Green supply chainmanagement: A review and bibliometric analysis, Int. J. Prod.Econ., Online at: (http://dx.doi.org/10.1016/j.ijpe.2015.01.003).
Galvez, D., Rakotondranaivo, A., Morel, L., Camargo, M., Fick,M., 2015. Reverse logistics network design for a biogasplant: An approach based on MILP optimization andAnalytical Hierarchical Process (AHP). J. Manuf. Syst. Online at:(http://dx.doi.org/10.1016/j.jmsy.2014.12.005).
Global Plastics Industry. 2013. Published on Business Vibeshttp://www.businessvibes.com.
Godfrey, R., 1998. Ethical purchasing: Developing the supply chainbeyond the environment. In: Russel, T. (Ed.), Greener Pur-chasing: Opportunities and Innovations. Greenleaf Publishing,Sheffield, England, pp. 244–251.
Govindan, K., Mathiyazhagan, K., Kannan, D., Noorulhaq, A.,2014a. Barriers Analysis for Green Supply Chain ManagementImplementation in Indian Industries Using Analytic HierarchyProcess. Int. J. Prod. Econ. 147(B), 555–568.
Govindan, K., Kannan, D., Shankar, M., 2014b. Evaluation ofgreen manufacturing practices using a hybrid MCDM modelcombining DANP with PROMETHEE. Int. J. Prod. Res. ahead-of-print:1-28.
Green, K., Morton, B., New, S., 1996. Purchasing and environ-mental management: interactions, policies and opportunities.Business Strategy and the Environment 5 (3), 188–197.
Gurnani, H., Mehrotra, A., Ray, S., 2012. Supply Chain Disruptions:Theory and Practice of Managing Risk. Springer, LondonDordrecht Heidelberg, New York.
Harputlugil, T., Prins, M., Gultekin, T., Topcu, I., 2011. Concep-tual Framework for Potential Implementations of Multi Cri-teria Decision Making (MCDM) Methods for Design QualityAssessment. In: Management and Innovation for a Sustain-able Built Environment. The Netherlands, Amsterdam, ISBN:9789052693958.
Hervani, A.A., Helms, M.M., Sarkis, J., 2005. Performancemeasure-ment for green supply chain management. Benchmarking 12(4), 330–353.
Hillary, R. (Ed.), 2000. Small and Medium Sized Enterprises andthe Environment, Business Imperatives. Greenleaf Publishing,Sheffield, pp. 11–22.
Holt, D., Ghobadian, A., 2009. An empirical study of green supplychain management practices amongst UK manufacturers.J. Manuf. Technol. Manage. 20 (7), 933–956.
Hora, M., Klassen, R.D., 2013. Learning from others’misfortune:factors influencing knowledge acquisition to reduce opera-tional risk. J. Oper. Manage. 31, 52–61.
Hsu, C.W., Hu, A.H., 2008. Green supply chain management in theelectronic industry. Int. J. Environ. Sci. Technol. 5 (2), 205–216.
Hu, A.H., Hsu, C.W., 2010. Critical factors for implementing greensupply chain management practice: an empirical study ofelectrical and electronics industries in Taiwan. Manage. Res.Rev. 33 (6), 586–608.
Hu, A.H., Hsu, C.W., Kuo, T.C., Wu, W.C., 2009. Risk evaluation ofgreen components to hazardous substance using FMEA andFAHP. Expert Systems with Applications 36 (3), 7142–7147.
Hwang, C.L., Yoon, K., 1981. Multiple Attributes Decision MakingMethods and Applications. Springer, Berlin.
International Council on Mining and Metals (ICMM) report, 2012assessed at http://www.icmm.com/.
Jabbour C.J.C., de Sousa Jabbour A.B.L., 2015. Green humanresource management and green supply chain management:Linking two emerging agendas. J. Clear Prod.; Online at:http://dx.doi.org/10.1016/j.jclepro.2014.09.034.
Jakhar, S.K., Barua, M.K., 2013. An integrated model of supplychain performance evaluation and decision-making usingstructural equation modelling and fuzzy AHP. Prod. Plan.Control 1–20. http://dx.doi.org/10.1080/09537287.2013.782616.
Jung, 2011. A bibliometric analysis on green supply chainmanagement: a pre-liminary result. In: Commerce andEnterprise Computing, IEEE 13th Conference. pp. 418–420.http://dx.doi.org/10.1109/CEC.2011.68.
Kaya, T., Kahraman, C., 2010. Multi criteria renewable energyplanning using an integrated fuzzy VIKOR & AHP methodol-ogy: The case of Istanbul. Energy 35 (6), 2127–2517.
Kumar, S., Teichman, S., Timpernagel, T., 2012. A green supplychain is a requirement for profitability. International Journalof Production Research 50 (5), 1278–1296.
Kuo, M.S., Tzeng, G.H., Huang, W.C., 2007. Group decision makingbased on concepts of ideal and anti-ideal points in fuzzyenvironment. Math. Comput. Model. 45 (3/4), 324–339.
Lin, R.J., 2013. Using fuzzy DEMATEL to evaluate the green supplychain management practices. J. Cleaner Production 40, 32–39.
Linton, J.D., Klassen, R., Jayaraman, V., 2007. Sustainable supplychains: an introduction. J. Oper. Manage. 25 (1), 1075–1082.
Luthra, S., Garg, D., Haleem, A., 2013. Identifying and rankingof strategies to implement green supply chain managementin Indian manufacturing industry using Analytical HierarchyProcess. J. Ind. Eng. Manage. 6 (4), 930–962.
Luthra, S., Garg, D., Haleem, A., 2014. Critical success factors ofgreen supply chain management for achieving sustainabilityin Indian automobile industry. Prod. Plan. Control ahead ofprint: 1–24.
Luthra S., Garg D., Haleem A., 2015a. An analysis of inter-actions among critical success factors to implement greensupply chain management towards sustainability: An Indianperspective. Resour. Policy Online at: http://dx.doi.org/10.1016/j.resourpol.2014.12.006.
Luthra, S., Kumar, V., Kumar, S., Haleem, A., 2011. Barriers toimplement green supply chain management in automobileindustry using interpretive structural modeling technique anIndian perspective. J. Ind. Eng. Manage. 4 (2), 231–257.
Luthra, S., Mangla, S.K., Kharb, R.K., 2015b. Sustainableassessment in energy planning and management in Indianperspective. Renew. Sustain. Energy Rev. 47, 58–73.
Ma, R.M., Yao, L., Huang, R., 2012. The green supply chainmanagement risk analysis. Adv. Mater. Res. 573–574, 734–739.
Madaan, J., Mangla, S., 2015. Decision Modeling Approach for Eco-Driven Flexible Green Supply Chain. In: Systemic Flexibilityand Business Agility. Springer India, pp. 343–364.
Mangla, S., Madaan, J., Chan, F.T.S., 2012. Analysis of performancefocused variables for multi-objective decision modelingapproach of flexible product recovery systems. Global J.Flexible Syst. Manage. 13 (2), 77–86.
Mangla, S., Madaan, J., Sarma, P.R.S., Gupta, M.P., 2014a. Multi-objective decision modelling using interpretive structuralmodelling for green supply chains. Int. J. Logist. Syst. Manage.17 (2), 125–142.
Mangla, S.K., Kumar, P., Barua, M.K., 2014b. Flexible decisionapproach for analysing performance of sustainable supplychains under risks/uncertainty. Global J. Flexible Syst. Manag.15 (2), 113–130.
Mangla, S.K., Kumar, P., Barua, M.K., 2014c. A flexible decisionframework for building risk mitigation strategies in greensupply chain using SAP-LAP and IRP Approaches. Global J.Flexible Syst. Manag. 15 (3), 203–218.
Mangla S.K., Kumar P., Barua M.K., 2015. Risk analysis ingreen supply chain using fuzzy AHP approach: a casestudy. Recycling Resources and Conservation. Online at:(http://dx.doi.org/10.1016/j.resconrec.2015.01.001).
Marsillac, E.L., 2008. Environmental impacts on reverse logisticsand green supply chains: similarities and integration. Int. J.Logist. Syst. Manage. 4 (4), 411–422.
Mathiyazhagan, K., Govindan, K., Noorul Haq, A., Geng, Y., 2013.An ISM approach for the barrier analysis in implementinggreen supply chain management. J. Cleaner Prod. 47, 283–297.
Mathiyazhagan, K., Govindan, K., Noorul Haq, A., Geng, Y.,2014. Pressure analysis for green supply chain managementimplementation in Indian industries using analytic hierarchyprocess. Int. J. prod. Res. 52 (1), 188–202.
Meacham, J., Toms, L., Green Jr., K.W., Bhadauria, V.S., 2013.Impact of information sharing and green informationsystems. Manage. Res. Rev. 36 (5), 478–494.
Min, H., Kim, I., 2012. Green supply chain research: past, present,and future. Logist. Res. 4 (1/2), 39–47.
Mirhedayatian, S.M., Azadi, M., Saen, R.F., 2014. A novel networkdata envelopment analysis model for evaluating green supplychain management. Int. J. Prod. Econ. 147, 544–554.
Mohanty, R.P., Prakash, A., 2013. Green supply chain managementpractices in India: an empirical study. Prod. Plan. Control 1–16.Online at: (http://dx.doi:10.1080/09537287.2013.832822).
Mudgal, R.K., Shankar, R., Talib, P., Raj, T., 2009. Greening thesupply chain practices: an Indian perspective of enablers’relationships. Int. J. Adv. Oper. Manage. 1 (2), 151–176.
Muduli, K., Barve, A., 2013. Sustainable development practices inmining sector: a GSCM approach. Int. J. Environ. Sustain. Dev.12 (2), 222–243.
Muduli, K., Govindan, K., Barve, A., Kannan, D., Geng, Y., 2013.Role of behavioural factors in green supply chainmanagementimplementation in Indian mining industries. Resour. Conserv.Recycling 76, 50–60.
Orsato, R., 2006. Competitive environmental strategies: whendoes it pay to be green?. California Manage. Rev. 48 (2),127–143.
Prakash, C., Barua, M.K., 2015. Integration of AHP-TOPSIS methodfor prioritizing the solutions of reverse logistics adoption toovercome its barriers under fuzzy environment. J. Manuf. Syst.Online at: (http://dx.doi.org/10.1016/j.jmsy.2015.03.001).
Parmigiani, A., Klassen, R.D., Russo, M.V., 2011. Efficiency meetsaccountability: Performance implications of supply chainconfiguration, control, and capabilities. J. Oper. Manage. 29 (3),212–223.
Patil, S.K., Kant, R., 2014. A fuzzy AHP-TOPSIS framework forranking the solutions of Knowledge Management adoption inSupply Chain to overcome its barriers. Expert Syst. Appl. 41 (2),679–693.
Paulraj, A., 2009. Environmental motivations: a classificationscheme and its impact on environmental strategies andpractices. Bus. Strategy Environ. 18 (7), 453–468.
Plastic Europe, 2009. The Compelling facts about plastics 2009,an analysis of European plastics production, demand andrecovery for 2008. Plastic Europe, www.plasticseurope.org.
Plastic News. 2013. SAY YES TO PLASTIC; May issue 66(5), 1–66.
Porter, M.E., van der Linde, C., 1995. Green and competitive:ending the stalemate. Harv. Bus. Rev. 73, 20–34.
Qianlei, L., 2012. The study on the risk management of agri-cultural products green supply chain based on systematicanalysis. In: Business Computing and Global Informatiza-tion (BCGIN), IEEE 2nd International Conference, Shanghai.pp. 250–253, ISBN: 978-1-4673-4469-2.
Qureshi, M.N., Kumar, P., Kumar, D., 2009. Selection of 3PL serviceproviders: a combined approach of AHP and graph theory. Int.J. Serv. Technol. Manage. 12 (1), 35–60.
Rao, P., Holt, D., 2005. Do green supply chains lead tocompetitiveness and economic performance? Int. J. Oper.Prod. Manage. 25 (9), 898–916.
Roarty, M., 1997. Greening business in a market economy. Eur.Bus. Rev. 97 (5), 244–254.
Rostamzadeh, R., Govindan, K., Esmaeili, A., Sabaghi, M., 2015.Application of fuzzy VIKOR for evaluation of green supplychain management practices. Ecol. Indic. 49, 188–203.
Saaty, T.L., 1980. The Analytic Hierarchy Process. McGraw-Hill,New York.
Sarkis, J., Zhu, Q., Lai, K., 2011. An organizational theoretic reviewof green supply chain management literature. Int. J. Prod.Econ. 130 (1), 1–15.
Sarkis, J., 2003. A strategic decision framework for green supplychain management. J. Cleaner Production 11 (4), 397–409.
Sarkis, J., 2006. Greening the Supply Chain. Springer, Berlin.
Sarminento, R., Thomas, A., 2010. Identifying improvement areaswhen implementing green initiatives using a multitier AHPapproach. Benchmarking 17 (3), 452–463.
Sawadogo, M., Anciaux, D., 2011. Intermodal transportationwithin the green supply chain: an approach based on ELECTREmethod. Int. J. Bus. Perform. Supply Chain Model. 3 (1), 43–65.
Shipley, M.F., Korvin, D.K., Obit, R., 1991. A decision makingmodel for multiattribute problems incorporating uncertaintyand bias measures. Comput. Oper. Res. 18, 335–342.
86 S U S T A I N A B L E P R O D U C T I O N A N D C O N S U M P T I O N 1 ( 2 0 1 5 ) 6 7 – 8 6
Srivastava, S.K., 2007. Green supply-chain management: a state-of-the-art literature review. Int. J. Manage. Rev. 9 (1), 53–80.
Sun, C.C., 2010. A performance evaluation model by integratingfuzzy AHP and fuzzy TOPSIS methods. Expert Systems withApplications 37 (12), 7745–7754.
Sundarakani, B., De Souza, R., Goh, M., Wagner, S.M., Manikan-dan, S., 2010. Modelling carbon footprints across the supplychain. Int. J. Prod. Econ. 128 (1), 43–50.
Susilawati, A., Tan, J., Bell, D., Sarwar, M., 2015. Fuzzy logic basedmethod to measure degree of lean activity in manufacturingindustry. J. Manuf. Syst. 34, 1–11.
Taylan, O., Bafail, A.O., Abdulaal, R.M., Kabli, M.R., 2014.Construction projects selection and risk assessment by fuzzyAHP and fuzzy TOPSIS methodologies. Appl. Soft Comput. 17,105–116.
Toke, L.K., Gupta, R.C., Dandekar, M., 2012. An empirical study ofgreen supply chain management in Indian perspective. Int. J.Appl. Sci. Eng. Res. 1 (2), 372–383.
Tuzkaya, G., Ozgen, A., Ozgen, D., Tuzkaya, U.R., 2009. Environ-mental performance evaluation of suppliers: A hybrid fuzzymulti-criteria decision approach. Int. J. Environ. Sci. Technol. 6(3), 477–490.
Vachon, S., Klassen, R.D., 2006. Extending green practices acrossthe supply chain: the impact of upstream and downstreamintegration. Int. J. Oper. Prod. Manage. 26 (5), 795–821.
Vachon, S., 2007. Green supply chain practices and the selectionof environmental technologies. International Journal ofproduction Research 45 (18/19), 4357–4379.
Vaidya, O.S., Kumar, S., 2006. Analytic hierarchy process: anoverview of applications. European J. Oper. Res. 169 (1), 1–29.
Van Hoek,, Erasmus, R.I., 2000. From reversed logistics to greensupply chains. Logist. Solut. 2, 28–33.
Viswanadham, N., Samvedi, A., 2013. Supplier selection based onsupply chain ecosystem, performance and risk criteria. Inter-national Journal of Production Research 51 (21), 6484–6498.
Wadhwa, S., Madaan, J., Chan, F.T.S., 2009. Flexible decisionmodeling of reverse logistics system: A value adding MCDMapproach for alternative selection. Robot. Comput.-Integr.Manuf. 25 (2), 460–469.
Walker, H., Di Sisto, L., McBain, D., 2008. Drivers and barriers toenvironmental supply chain management practices: Lessonsfrom the public and private sectors. J. Purch. Supply Manage.14 (1), 69–85.
Wang, L., Chu, J., Wu, J., 2007. Selection of optimum maintenancestrategies based on a fuzzy analytic hierarchy process. Int. J.Prod. Econ. 107, 151–163.
Wang, T.C., Chang, T.H., 2007. Application of TOPSIS in evaluatinginitial training aircraft under a fuzzy environment. ExpertSystems with Applications 33 (4), 870–880.
Wang, X., Chan, H.K., Yee, R.W.Y., Diaz-Rainey, I., 2012. A two-stage fuzzy-AHP model for risk assessment of implementinggreen initiatives in the fashion supply chain. Int. J. Prod. Econ.135 (2), 595–606.
Wang, X., Chan, H.K., 2013. A hierarchical fuzzy TOPSIS approachto assess improvement areas when implementing greensupply chain initiatives. International Journal of ProductionResearch 51 (10), 3117–3130.
Wu, K.J., Liao, C.J., Tseng, M.L., Chiu, A.S., 2015. Exploring decisivefactors in green supply chain practices under uncertainty. Int.J. Prod. Econ. 159, 147–157.
Xu, L., Mathiyazhagan, K., Govindan, K., Noorul Haq, A., Ra-machandrand, N.V., Ashokkumar, A., 2013. Multiple compar-ative studies of Green Supply Chain Management: Pressuresanalysis. Resour., Conserv. Recycling 78, 26–35.
Yang, Z.K., Li, J., 2010. Assessment of Green Supply Chain RiskBased on Circular Economy. In: Industrial Engineering andEngineering Management (IE&EM), IEEE 17th InternationalConference, Xiamen. pp. 1276–1280. ISBN: 978-1-4244-6483-8.
Zadeh, L.A., 1965. Fuzzy sets. Inf. Control 8, 338–352.Zayed, T., Amer, M., Pan, J., 2008. Assessing risk and uncertainty
inherent in Chinese highway projects using AHP. Int. J. ProjectManage. 26 (4), 408–419.
Zhang, B., Bi, J., Liu, B., 2009. Drivers and barriers to engageenterprises in environmental management initiatives inSuzhou Industrial Park, China. Front. Environ. Sci. Eng. 3 (2),210–220.
Zhu, Q., Sarkis, J., Geng, Y., 2005. Green supply chainmanagementin China: pressures, practices and performance. Int. J. Oper.Prod. Manage. 25 (3), 449–468.
Zhu, Q., Sarkis, J., Lai, K.H., 2008b. Confirmation of ameasurement model for green supply chain manage-ment practices implementation. Int. J. Prod. Econ. 111 (2),261–273.
Zhu, Q., Sarkis, J., Lai, K.H., 2008a. Green supply chainmanagement implications for closing the loop. Transp. Res. E44 (1), 1–18.
Zhu, Q., Sarkis, J., Lai, K.H., 2013. Institutional-based antecedentsand performance outcomes of internal and external greensupply chain management practices. J. Purch. Supply Manage.19 (2), 106–117.
Zhu, Q., Sarkis, J., 2006. An inter-sectoral comparison of greensupply chain management in China: drivers and practices.J. Cleaner Prod. 14 (5), 472–486.
Zimmerman, H.J., 1996. Fuzzy Sets Theory and its Applications.Kluwer Academic Publishers, Boston.
Zsidisin, G.A., Siferd, S.P., 2001. Environmental purchasing: aframework for theory development. Eur. J. Purch. & SupplyingManage. 7, 61–73.
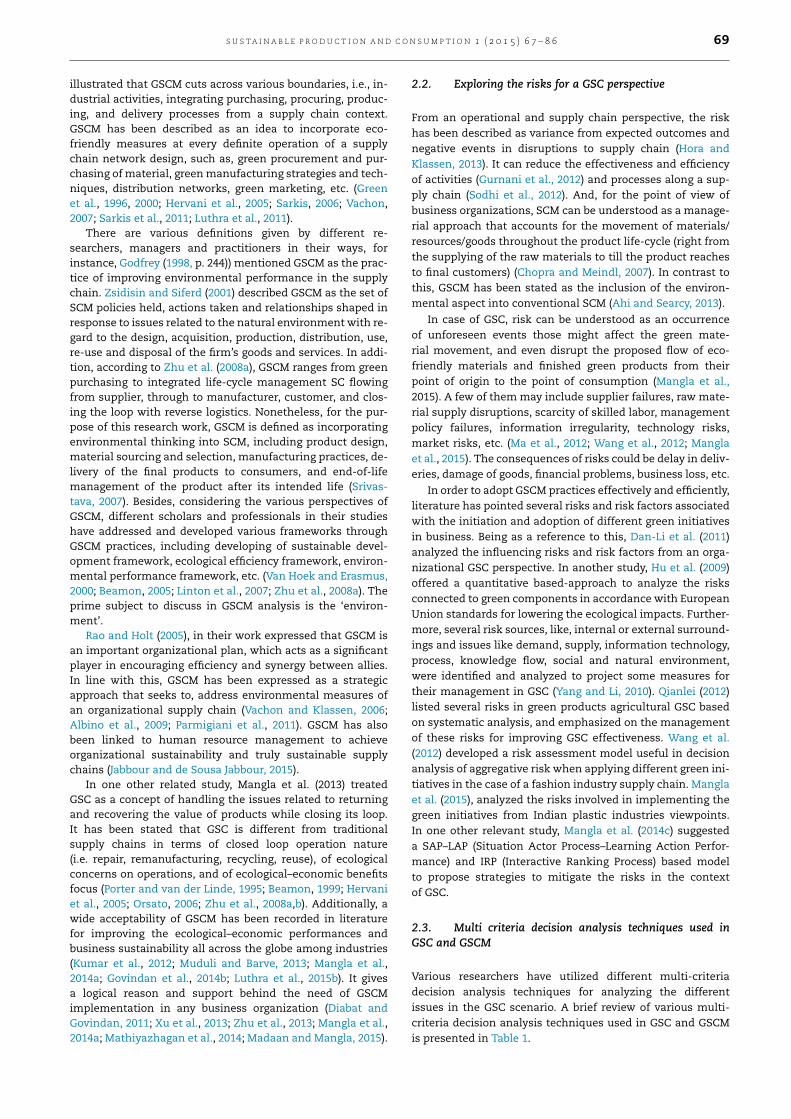


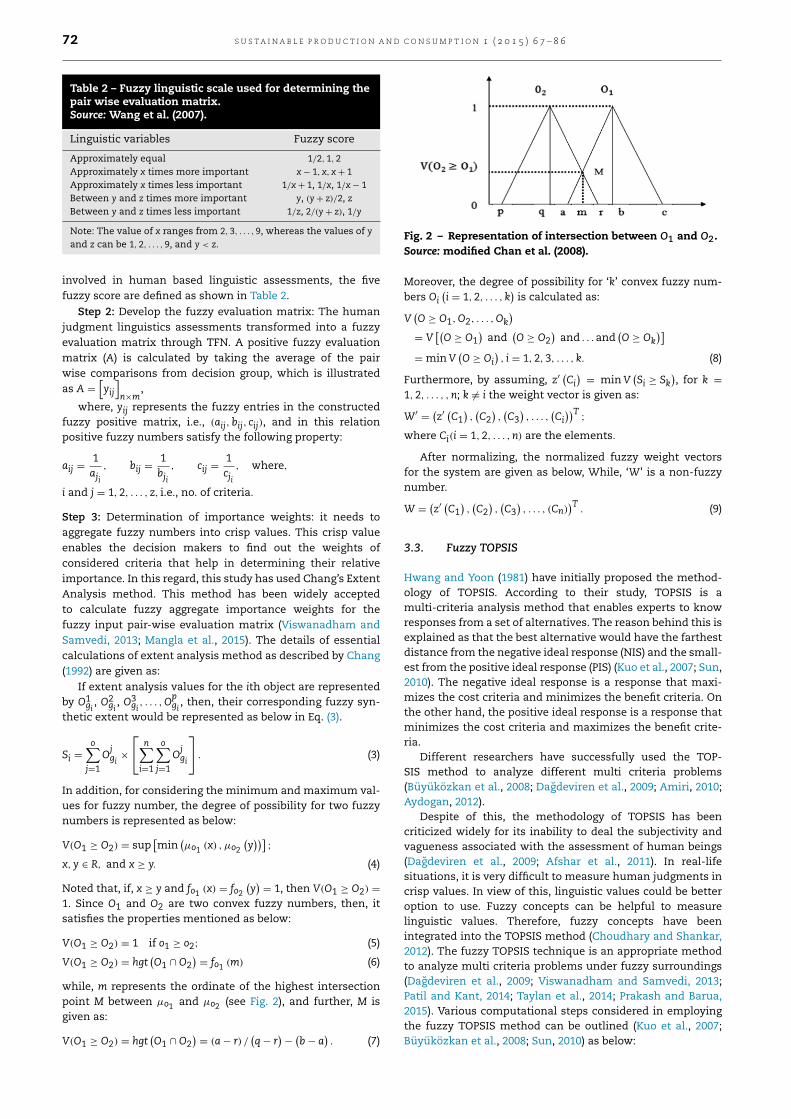
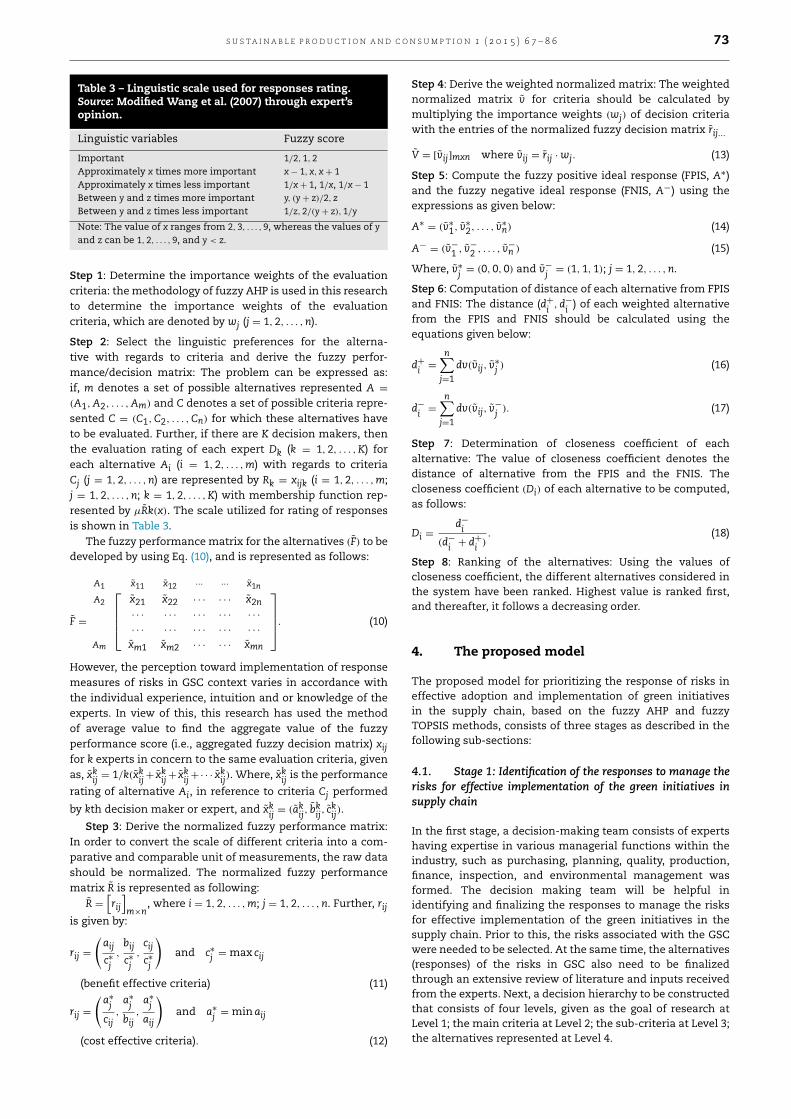
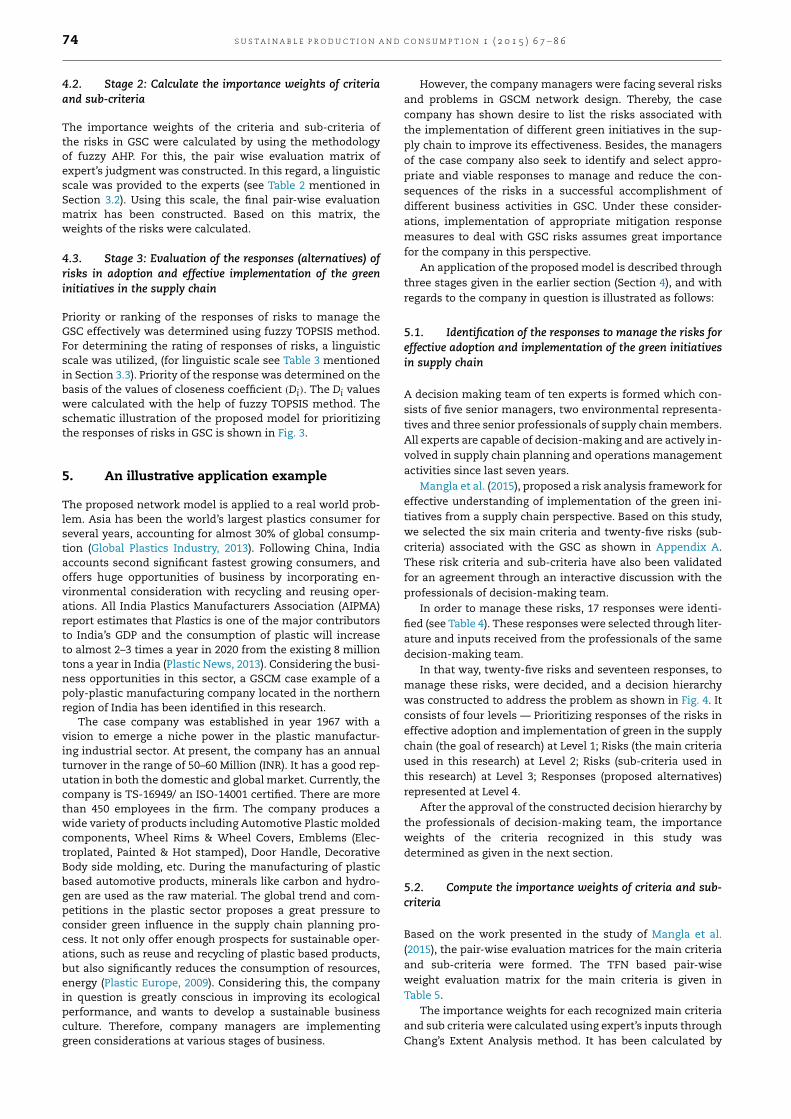
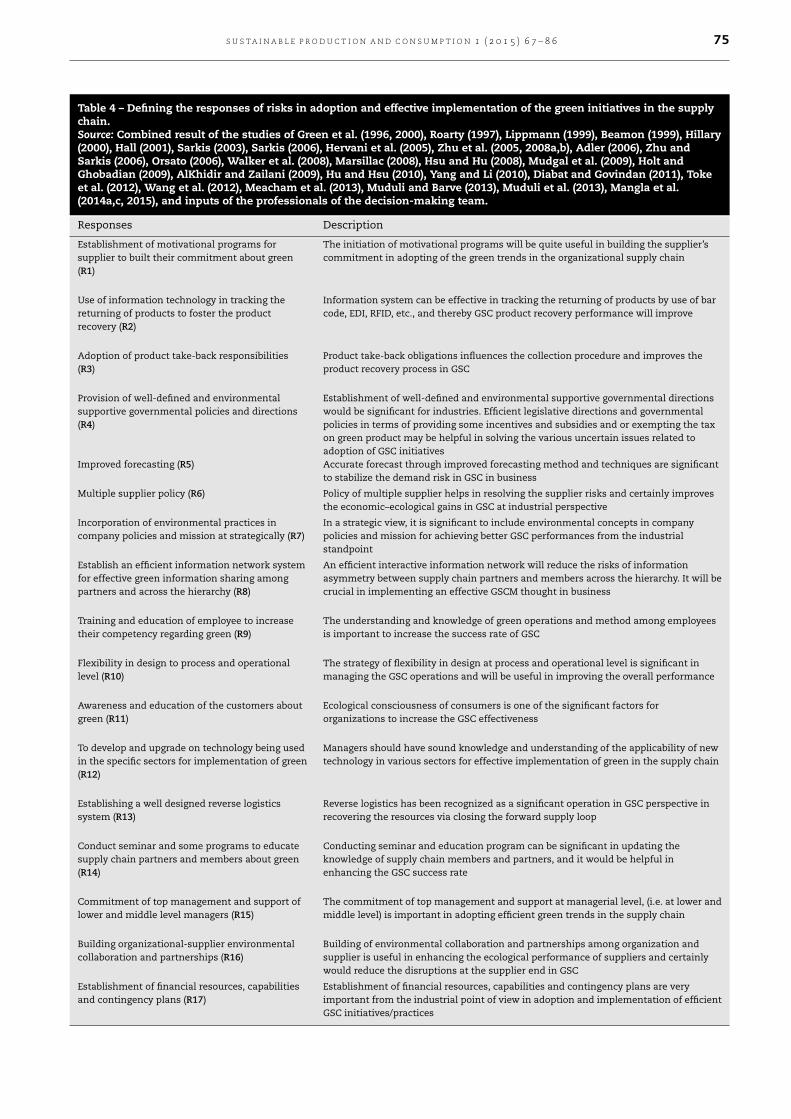

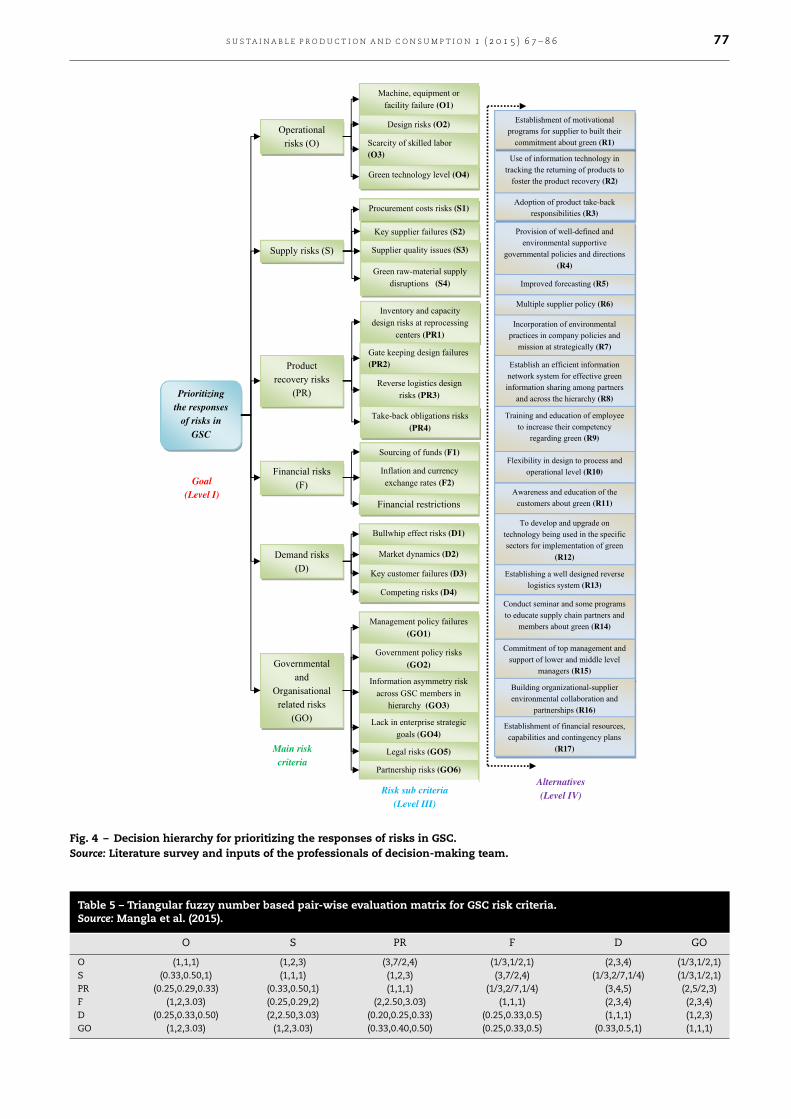

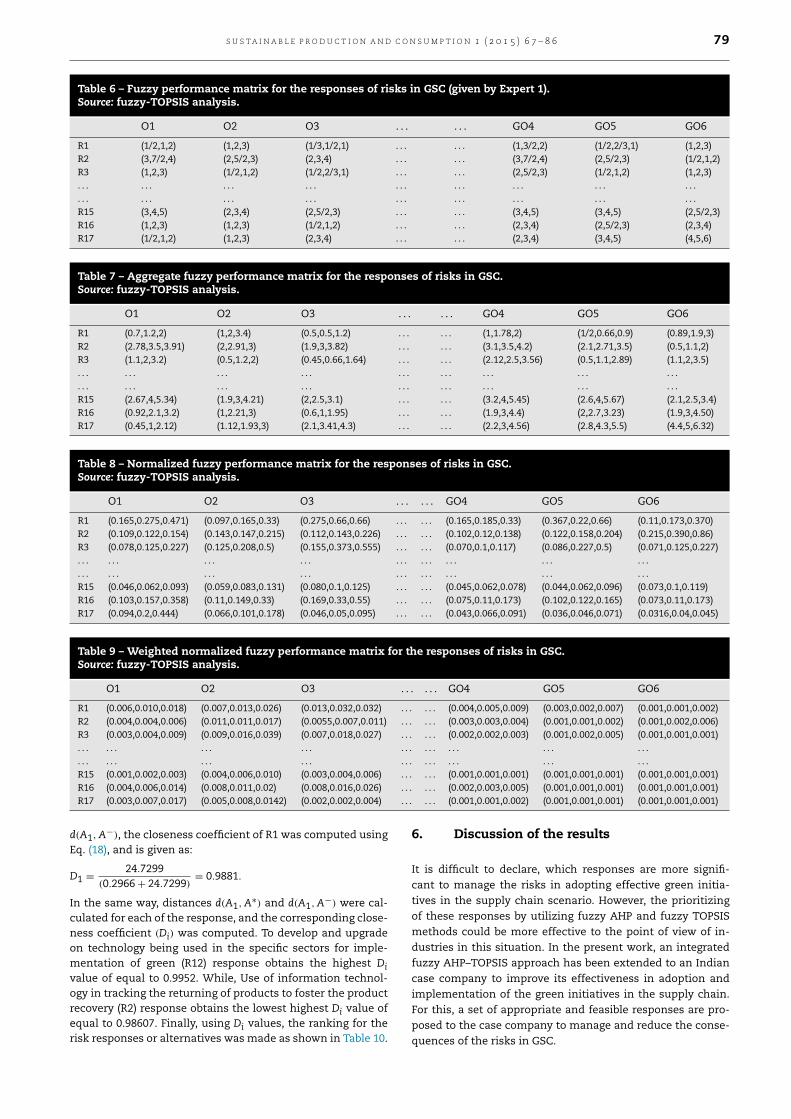

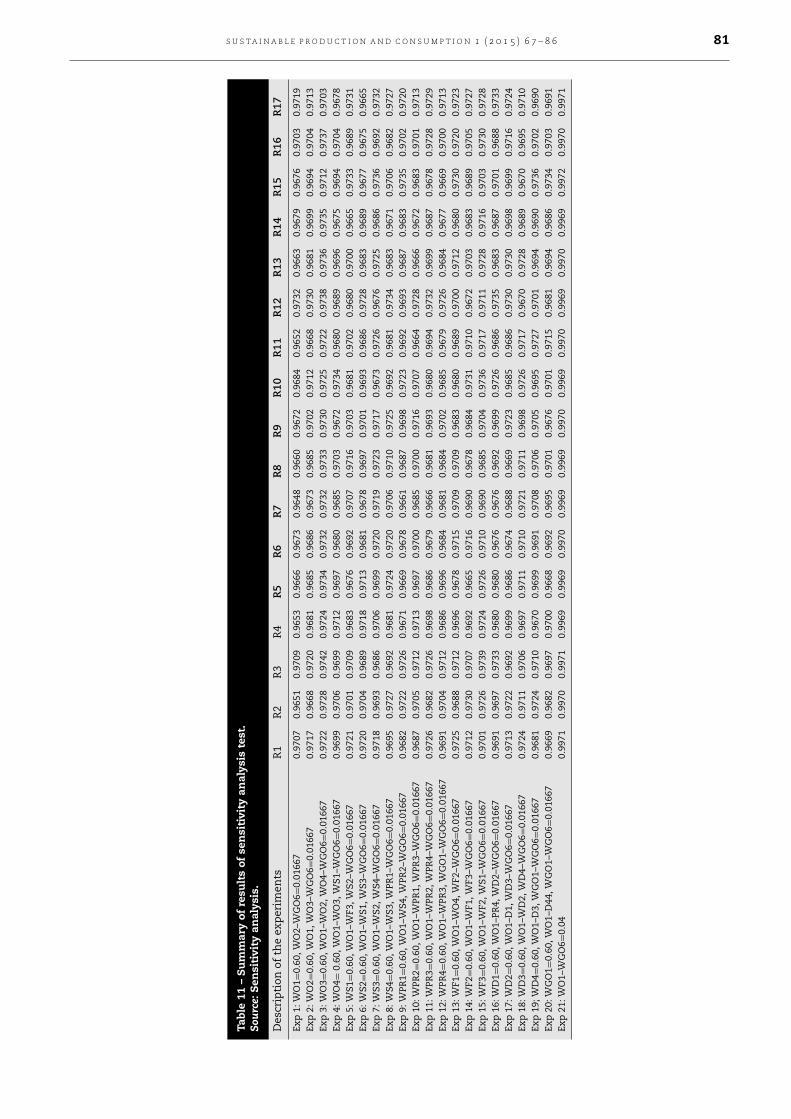

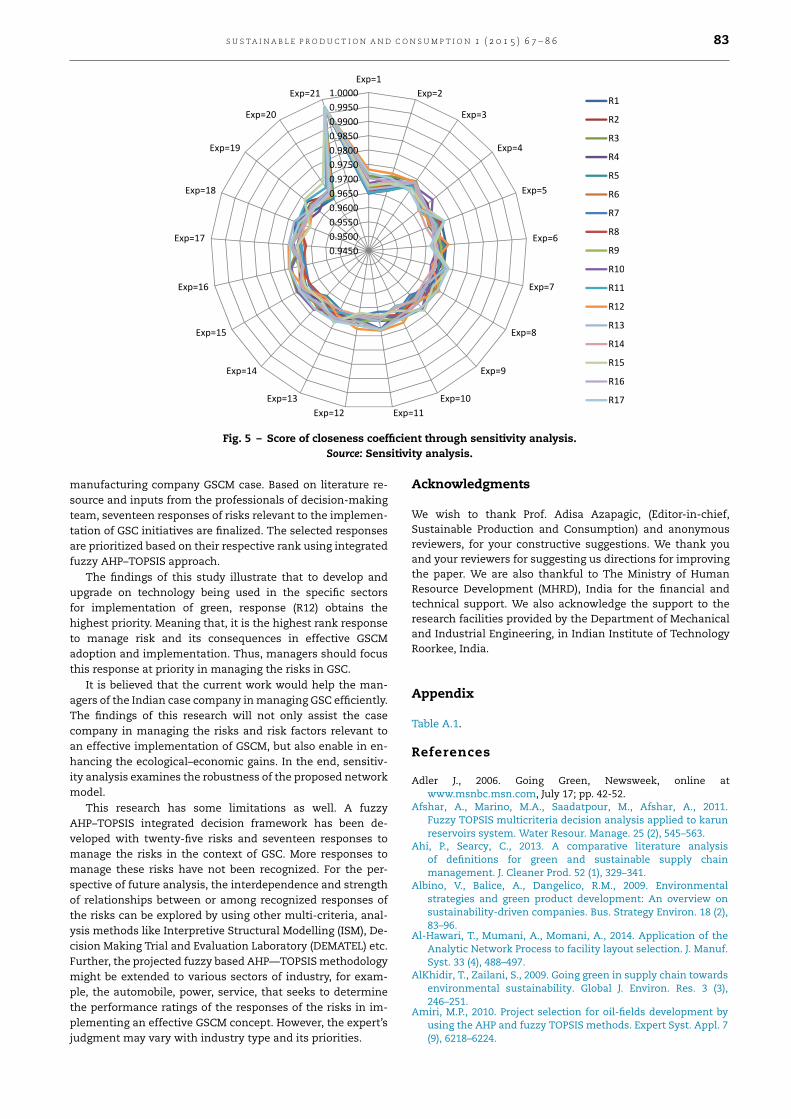


![[Quick Video] Prioritizing Maintenance - Work Order Management](https://static.documents.pub/doc/80x56/588662a81a28ab26598b77fd/quick-video-prioritizing-maintenance-work-order-management.jpg)


