Risk Management Report 2018 Group objecties of Risk Managemnet Report To keep our shareholders and other staeholders informed of the group’s risk and capital management policies, including risk management methodologies and practices, both short and long term P/F skr. nr. 10, Tórshavn Board of Directors and Executive Board
Transcript
Page 1 Risk Management Report 2018
Risk ManagementReport2018
Group objecties of Risk Managemnet Report
To keep our shareholders and other staeholders informed of the group’s risk and capital management policies, including risk management methodologies and practices, both short and long term P/F skr. nr. 10, Tórshavn
Board of Directors and Executive Board
Page 2 Risk Management Report 2018
Contents
1. Introduction 4
2. Organisation 52.1 Introduction 5
2.2 Risk policies and limits 6
2.3 Risk organization 7
2.3.1 Board of Directors 8
2.3.2 Executive Board 8
2.3.3 Risk Committee 9
2.3.4 Credit Committee 9
2.3.5 Staff departments 9
2.3.6 Business units 10
2.4 Reporting 11
3. Capital Management 12
3.1 Framework of the Group’s capital management 12
3.2 Pillar I 12
3.3 Pillar II 12
3.3.1 Solvency requirement 14
3.3.2 The methodology 14
3.3.3 Group solvency requirement 15
4 Credit Risk 16
4.1 Definition 16
4.2 Policy 16
4.3 Credit process 16
4.4 Credit risk classification 17
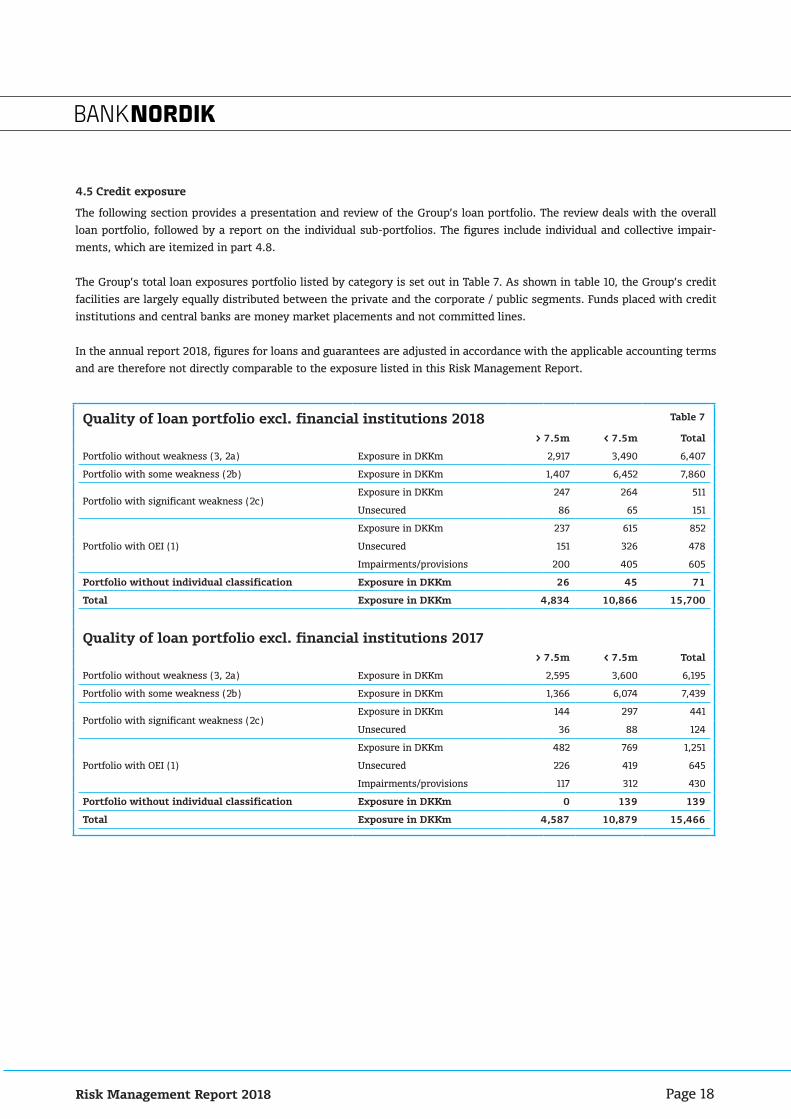
4.5 Credit exposure 18
4.5.1 Credit exposure, quality and concentration 19
4.6 Risk mitigation 21
4.7 Monitoring and portfolio management 22
4.7.1 Credit risk management 23
4.8 Impairment/Losses 23
4.9 The Supervisory Diamond 25
Page 3 Risk Management Report 2018
5. Market Risk 26
5.1 Organisation 26
5.2 Definition 26
5.3 Policy and responsibility 26
5.4 Control and management 27
5.5 Market risk 27
5.6 Interest rate risk 27
5.7 Exchange rate risk 28
5.8 Equity market risk 28
6. Liquidity Risk 29
6.1 Definition 29
6.2 Control and management 29
6.2.1 Operational liquidity risk 29
6.2.2 Liquidity stress testing 29
6.2.3 Twelvemonth liquidity 29
6.2.4 Structural liquidity risk 30
6.2.5 Funding sources 30
6.3 Collateral provided by the Group 30
7. Operational Risk 32
7.1 Definition 32
7.2 Policy 32
7.3 Measurement and control 32
7.4 Long-term goals in operational risk management 33
8. Insurance Risk 34
8.1 Insurance risk 34
8.2 Capital requirements 35
8.3 Trygd non-life insurance 35
8.4 NordikLív — Life insurance 37
Page 4 Risk Management Report 2018
1. Introduction
The purpose of BankNordik’s Risk Management Report is to ensure transparency in the BankNordik Group and to make availa-ble information on how the Group manages the risks it encounters.
BankNordik’s Risk Management Report is published annually on the Group’s website, www.banknordik.com/riskmanagement, simultaneously with the release of the Group’s Annual Report 2018. The Risk Management Report is a separate unaudited docu-ment. There are no audit requirements for the Risk Management Report, but much of the information in the Risk Management
Report will also be provided in the audited Annual Report 2018.
Page 5 Risk Management Report 2018
BankNordik Organisation
Board of Directors
Internal AuditArndis Poulsen
Chief Audit Executive
Products SupportTurið F. Arge, COO
Corporate BankingÁrni Ellefsen, CEO
CEOs OfficeIR, Compliance &Risk Management
Credit Control
Executive BoardÁrni Ellefsen, CEO
StaffRune Nørregaard,
CFO & CCO
Personal BankingPer Sjørup Christiansen, Head of Personal Banking
Skyn P/FPetur M. Niclasen
NordikLívBrian Smedemark
Trygd P/FBrian Smedemark
Subsidiaries
figure 1
The CEO’s Office reports report to Árni Ellefsen, Chief Executive Officer, while the insurance activities (Trygd P/F and
NordikLív P/F) and the Real Estate Company (Skyn P/F) report to Turið F. Arge, Chief Operating Officer.
2. Organisation
Understanding and ensuring transparency in risk taking are key elements of the BankNordik Group’s business strategy. The
Group’s ambition is to set high standards for risk management. Our risk organization supports this ambition, and it has
developed in-depth risk management expertise.
The Board of Directors sets out the overall risk policies for all types of material risk while the Chief Executive Officer (CEO)
is responsible for the day-to-day management of the Group, including implementation of the risk policies and risk manage-
ment.
The Executive Board consists of Group CEO, Árni Ellefsen. At the chief operational level, the Group is divided into three main
business units:
■ Corporate Banking operations in the Faroe Islands
and Greenland, headed by Árni Ellefsen, CEO
■ Personal Banking operations and Private Banking In the Faroe Islands, Denmark and
Greenland, headed by Per Sjørup Christiansen, Head of Personal Banking
■ Products support, headed by Turið F. Arge, Chief Operating Officer
2.1 Introduction
Page 6 Risk Management Report 2018
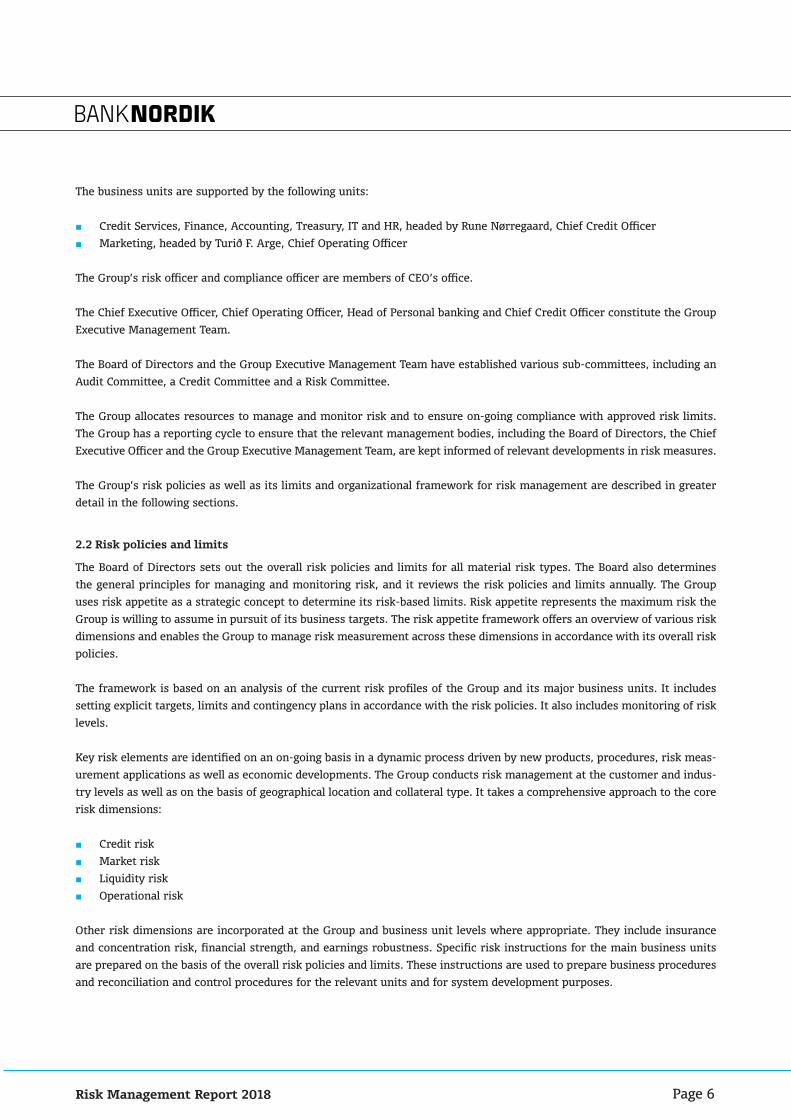
The business units are supported by the following units:
■ Credit Services, Finance, Accounting, Treasury, IT and HR, headed by Rune Nørregaard, Chief Credit Officer
■ Marketing, headed by Turið F. Arge, Chief Operating Officer
The Group’s risk officer and compliance officer are members of CEO’s office.
The Chief Executive Officer, Chief Operating Officer, Head of Personal banking and Chief Credit Officer constitute the Group
Executive Management Team.
The Board of Directors and the Group Executive Management Team have established various sub-committees, including an
Audit Committee, a Credit Committee and a Risk Committee.
The Group allocates resources to manage and monitor risk and to ensure on-going compliance with approved risk limits.
The Group has a reporting cycle to ensure that the relevant management bodies, including the Board of Directors, the Chief
Executive Officer and the Group Executive Management Team, are kept informed of relevant developments in risk measures.
The Group’s risk policies as well as its limits and organizational framework for risk management are described in greater
detail in the following sections.
The Board of Directors sets out the overall risk policies and limits for all material risk types. The Board also determines
the general principles for managing and monitoring risk, and it reviews the risk policies and limits annually. The Group
uses risk appetite as a strategic concept to determine its risk-based limits. Risk appetite represents the maximum risk the
Group is willing to assume in pursuit of its business targets. The risk appetite framework offers an overview of various risk
dimensions and enables the Group to manage risk measurement across these dimensions in accordance with its overall risk
policies.
The framework is based on an analysis of the current risk profiles of the Group and its major business units. It includes
setting explicit targets, limits and contingency plans in accordance with the risk policies. It also includes monitoring of risk
levels.
Key risk elements are identified on an on-going basis in a dynamic process driven by new products, procedures, risk meas-
urement applications as well as economic developments. The Group conducts risk management at the customer and indus-
try levels as well as on the basis of geographical location and collateral type. It takes a comprehensive approach to the core
risk dimensions:
■ Credit risk
■ Market risk
■ Liquidity risk
■ Operational risk
Other risk dimensions are incorporated at the Group and business unit levels where appropriate. They include insurance
and concentration risk, financial strength, and earnings robustness. Specific risk instructions for the main business units
are prepared on the basis of the overall risk policies and limits. These instructions are used to prepare business procedures
and reconciliation and control procedures for the relevant units and for system development purposes.
2.2 Risk policies and limits
Page 7 Risk Management Report 2018
BankNordik’s “Rules of procedure” for the Board of Directors and the “Board of Directors’ Instructions to the Executive
Board” specifies the responsibilities of the Board of Directors and the Executive Board and the division of responsibilities
between them. This two-tier management structure has been developed in accordance with Faroese and Danish legislation,
and the “Rules of procedure” and “Board of Directors’ Instructions to the Executive Board” are key documents in the Group’s
management structure, including the organization of risk management and authorizations.
The Board of Directors lays down overall policies, while the Executive Board is in charge of the Group’s day-to-day manage-
ment and reports to the Board of Directors. None of the Group’s executive managers serve on the Board of Directors of the
parent company. The risk and capital management functions are separate from the credit assessment and credit-granting
functions, as shown in figure 2.
2.3 Risk organization
Board of Directors
Internal AuditAudit Committee
Group RiskCommittee
Focus AreaThe Group Risk Committee is in charge of implementing the Group’s:
Credit Committee
Nomination committeeRemuneration committee
Chief Executive Officer
CEOs OfficeCompliance
Risk appetite process
Overall structure and development of policy for the balance sheet
Target for capital structure and solvency
Overall funding structure
General principles for measuring, managing and reporting on the Group’s risks
Risk policies for relevant business units
Overall risk exposure guidelines, managing risk concentrations and follow-up measures
Capital deployment
Handling of operational risk
Risk Manager
The committee evaluates risk reports to be submitted to the Executive Board and Board of Directors.
Members of the committee are the CEO, Risk Officer, CCO, CIO, Head of Personal Banking, Compliance Officer, Head of IT and the Financial Manager.
Focus Area
The Credit Committee is a decision panel for major credit exposures, monitors trends in the credit quality of the Group’s exposures and evaluates special renewal applications and facilities.
Credit applications that exceed the lending authorities of the business units must be submitted to the Credit Committee for approval. The Committee is also in charge of preparing operational credit policies and approving or rejecting credit applications involving issues of principle.
The Board of Directors determines the lending authorities. In addition the Credit Committee participates in decisions regarding the valuation of the Group’s loan portfolio in connection with the determination of impairment charges.
Members of the committee are the CEO, the CCO and a senior credit adviser.
figure 2
Page 8 Risk Management Report 2018
The Group’s management structure also reflects the statutory requirements governing listed Faroese companies in general
and financial services institutions in particular. The BankNordik Group applies the comply or explain principle set out in the
recommendations issued by the Committee of Corporate Governance. These recommendations apply to companies listed on
NASDAQ Copenhagen.
The Board of Directors has established an Audit Committee. The Audit Committee examines accounting, auditing and secu-
rity issues that the Board of Directors, the Audit Committee, the internal auditor or the external auditors believe deserve
attention. The committee also reviews the internal control and risk management system.
The Audit Committee consists of Stine Bosse, Chairman of the Board, Kim Jacobsen, member of the board, and Jógvan Jes-
persen, member of the board.
The Executive Board has assembled the Group Executive Management Team and established the two risk-orientated
sub-committees, the Risk Committee and the Credit Committee.
2.3.1 Board of Directors
The Board of Directors must ensure that the Group is appropriately organized. As part of this duty, it appoints the members
of the Executive Board and the Group’s Chief Internal Auditor.
The largest credit facilities are submitted to the Board of Directors for approval, and the Board defines overall limits for
market risk and liquidity risk. Regular reporting enables the Board of Directors to monitor whether the overall risk policies
and systems are being complied with and whether they meet the Group’s needs. In addition, the Board of Directors reviews
reports analyzing the Group’s portfolio, particularly information about industry concentrations, large exposures and im-
paired exposures.
Internal Audit examines accounting, auditing and security issues. These are issues that the Board of Directors or the ex-
ternal auditors believe deserve day-to-day attention. Internal Audit also reviews the internal control and risk management
systems.
2.3.2 Executive Board
The Executive Board is responsible for the day-to-day management of the Group as stated in the “Rules of procedure” for
the Board of Directors and the “Board of Directors’ Instructions to the Executive Board”.
The Executive Board sets forth specific risk instructions and supervises the Group’s risk management practices. It reports
to the Board of Directors on the Group’s risk exposures and approves material business transactions, including credit ap-
plications up to a defined limit.
The Executive Board has assembled the Group Executive Management Team and established two committees to be in charge
of day-to-day risk management, the Risk Committee and the Credit Committee.
The Group has also organized various subcommittees/functions for specific risk management areas such as asset and liabil-
ity management and the management of risk parameters and models affecting the Group’s capital and risk-weighted assets.
The subcommittees consist mostly of members of the management team.
Page 9 Risk Management Report 2018
The Risk Committee consists of:
■ The Chief Executive Officer
■ The Head of Personal Banking
■ The Chief Operating Officer
■ The Chief Credit Officer
■ The Compliance Officer
■ The Risk Officer
■ The Financial Manager
■ The Head of IT
■ The head of Insurance activities
The Risk Committee is in charge of identifying all main risks of the Group with the aim of optimizing the Group’s revenue
compared to risk, e.g. by setting out guidelines for implementing and changing internal procedures for measuring and con-
trolling risk, modelling principles etc.
The Risk Committee processes all risk-related matters, including:
■ The Capital Requirements Directive and related legislation
■ Internal procedures for measuring and controlling risk
■ The capital structure and targets for and levels of solvency and liquidity
■ Allocation of risk capital to units and risk types, e.g. as part of the solvency requirement
■ Material changes in model principles for risk management and yearly evaluations of such principles and models
In addition, the Committee evaluates the risk report to be submitted to the Board of Directors. The Committee also assists
the Executive Board in its functions and processes related to operational risk management.
2.3.3 Risk Committee
2.3.4 Credit Committee
The Credit Committee consists of the CEO, the CCO and a Senior Credit Adviser.
Credit applications that exceed the lending authorities of the Credit Department (personal customers) or the Group’s Cor-
porate Department (corporate customers) must be submitted to the Credit Committee for approval along with a credit
recommendation.
The Committee is in charge of preparing operational credit policies and approving or rejecting credit applications involving
issues of principle.
The Board of Directors determines the lending authorities. In addition, the Credit Committee participates in decisions
regarding the valuation of the Group’s loan portfolio in connection with the determination of impairment charges.
2.3.5 Staff departments
The Group’s overall risk issues including credit, market, liquidity and operational risks are monitored by the Group Risk
Committee, in co-operation with managers of business units and subsidiaries, reporting directly to the Executive Board.
The Finance department oversees the Group’s financial reporting, budgeting, liquidity and capital structure. It also has
overall responsibility for the Group’s compliance with the Capital Requirements Directive and related legislation and for the
internal capital adequacy assessment process.
Page 10 Risk Management Report 2018
The Group has established a functional separation between units that enter into business transactions with customers or
otherwise expose the Group to risk on the one hand and units in charge of overall risk management on the other.
The Group’s Risk Management is carried out by the Group’s Risk Officer which is a part of the CEO’s office with reporting
rights and obligations to the Executive Board and reporting rights to the Board of Directors in risk-related matters. Risk
Management has overall responsibility for monitoring the Group’s risk portfolio and reporting on overall risk measures. In
addition, Risk Management is responsible for the implementation of risk models and risk analysis and for providing support
to the Risk Committee.
The Credit Department has the overall responsibility for the credit process in all of the Group’s business units. This includes
responsibility for developing credit classification and valuation models and for seeing that they are used by the local units
in their day-to-day credit processing.
The Credit Department is in charge of determining the utilization of portfolio limits for industries and countries and of the
quarterly process of calculating the impairment of exposures. It also keeps track of the credit quality of the Group’s loan
portfolio by monitoring trends in unauthorized overdrafts and overdue payments, new approvals to weak customers and
other factors.
In addition, the Credit Department reports to the Group management and to business units on developments in the Group’s
credit risk. Finally, the department is in charge of providing management information about credits, of monitoring credit
approvals in the business units, and of determining the Group’s requirements relating to its credit systems and processes.
The CEO’s office is in charge of analyzing and monitoring strategic business risk and corporate governance. Furthermore the
CEO’s office is in charge of the Group’s investor relations.
2.3.6 Business units
Core risk dimensions such as market risk and liquidity risk are managed centrally. For credit risk, however, lending author-
ity for specific customer segments and products has been delegated to the individual business units. The business units
carry out the fundamental tasks required for optimal risk management. This includes updating the necessary registrations
about customers that are used in risk management tools and models, as well as maintaining and following up on customer
relationships.
Each business unit is responsible for preparing carefully drafted documentation before business transactions are undertaken
and for properly recording the transactions. Each business unit is also required to update information on customer relations
and other issues as may be necessary.
The business units must ensure that all risk exposures comply with specific risk instructions as well as the Group’s other
guidelines. Loan and credit approvals to retail customers and small business customers are given according to the lending
authorities delegated to the individual branches.
Customer advisers are responsible for the basic credit assessment of customers. Their lending authority depends on cus-
tomer classification, and they can approve credits up to certain amounts. Advisers must for¬ward applications for credit
facilities beyond their lending authority to the branch management, which may decide to submit applications to the Credit
Department.
Page 11 Risk Management Report 2018
The Group has a reporting cycle to ensure that the relevant management bodies, including the Board of Directors, the Ex-
ecutive Board and the Group Executive Management Team, are kept informed of, among other things, developments in risk
measures, the credit portfolio, non-performing loans, market risk, strategic and operational risk.
The Board of Directors receives the principal risk reports (see Table 1) and the principle solvency requirement in the form of
the Group’s annual solvency handbook. As part of the quarterly evaluation of the Group’s solvency requirement, the Board of
Directors receives up-to-date information on any material changes in the Group’s risk profile. On a monthly basis the Board
of Directors receives a report on the Group’s market and liquidity risk.
2.4 Reporting
Risk appetite
Risk policy
Strategic determination of risk-based limits, representing the maximum risk that the Group is .seicilop ksir llarevo sti htiw ecnadrocca ni dna stegrat ssenisub fo tiusrup ni emussa ot gnilliw
Models and parameters
Review of the Group´s overall risk policy to determine whether revisions are required.
Update on the use of risk models and risk parameters.
Quality of credit portfolio
Table 1
Analysis of impairment charges and losses by business unit and portfolio break-downs by category, size, business unit, etc.
BankNordik Group Methodology Evaluation of the preferred risk and the level of capital according to the FSA’s 8+ approach.
Key figures for the credit portfolio
Market risk
An overview of credit-quality indicators, classifications and trends in lending volumes.
Large exposures
Analysis of the Group’s current equity, fixed income and currency positions and report on the .troper gnidecerp eht ecnis stimil devorppa draoB fo noitasilitu
Table 2
An overview of exposures equal to or exceeding 10% of the Group total capital and the sum of these exposures, including the percentage of the Group’s total capital it represents.
Liquidity risk
Market risk
Analysing and stress tests of the Group’s current liquidity
Table 3
Analysis of the Group’s current equity, fixed income and currency positions and report on the .troper gnidecerp eht ecnis stimil devorppa draoB fo noitasilitu
Page 12 Risk Management Report 2018
3. Capital Management
BankNordik is well capitalised with a high solvency ratio and excess cover relative to the statutory requirements. The Board
of Directors is focused on maintaining the capital base necessary to fulfil its strategic goals and sustain the Bank’s continued
business development. Constant monitoring and valuation of the Group solvency ratio forms an integral part of the Group’s
capital management.
The basis of the BankNordik Group’s capital management is the CRD IV requirements and the Internal Capital
Adequacy Assessment Process (ICAAP), which consists of three pillars.
■ Pillar I contains a set of rules for a mathematical calculation of the Total capital and the risk weighted assets (RWA).
■ Pillar II describes the supervisory review and evaluation process and contains the framework for the internal capital
adequacy assessment process.
■ Pillar III deals with market discipline and sets forth disclosure requirements for risk and capital management.
3.1 Framework of the Group’s capital management
In accordance with the CRD IV requirements stipulated in the regulation (EU) No 575/2013 of the European parliament and of
the Council of 26 June 2013, total RWA is calculated as the sum of RWA for credit, market and operational risk. Total capital
is calculated as the sum of common equity tier 1 (CET1) and additional tier 1 and tier 2 instruments.
Table 4 sets out the Bank’s Solvency statement as of 31 December 2018, including the basis for calculating risk-weighted
items, core capital, core capital after deductions and Total capital after deductions and equity.
3.2 Pillar I
While Pillar I contains uniform rules for capturing a financial institution’s risk and calculating the capital requirements in
accordance with the CRD IV requirements, it does not necessarily capture all risk affecting individual institutions. Pillar II
contains a framework for an Own Risk Solvency Assessment process based on the situation and characteristics of the in-
dividual institution. The underlying aim of the Pillar II process is to enhance the link between an institution’s risk profile,
its risk management systems and its capital. Institutions are expected to develop sound risk management processes that
properly identify, measure, aggregate and monitor their risk.
Pillar II is underpinned by four principles:
■ Assessment of capital adequacy in relation to the institution’s risk profile and capital strategy.
■ Review and evaluation of the assessment and its ability to monitor and ensure compliance with its own requirement.
■ The expectation that the institution will operate above the Minimum Capital Requirement and the ability of the Danish
FSA to require a financial institution to maintain a capital buffer relative to the MCR.
■ FSA intervention at an early stage to prevent capital from falling below the minimum level required to support the risk
profile or to require rapid remedial action if capital is not maintained or restored.
3.3 Pillar II
Page 13 Risk Management Report 2018
In order to measure and identify all risk exposure to the Group, the Group applies a Danish FSA approved capital adequacy
assessment process.
The method is based on an 8+ approach. An 8+ approach means that a review takes, as its baseline, the minimum require-
ment of 8 per cent of the risk-weighted items (pillar 1) plus a margin for risks and matters that are not fully reflected in the
statement of risk-weighted items. In other words, ordinary risks are assumed to be covered by the 8 per cent requirement,
and the question to consider is whether a bank is exposed to other risks that necessitate an increase in the solvency re-
quirement (pillar II).
Capital and Solvency - BankNordik Table 4
DKK 1.000 2018 2017
Core capital 1,874,689 1,731,404
Total capital 2,098,167 1,954,272
Risk-weighted items not included in the trading portfolio 8,248,858 7,575,236
Risk-weighted items with market risk etc. 1,176,636 1,022,062
Risk-weighted items with operational risk 1,195,955 1,298,065
Total risk-weighted items 10,621,449 9,895,363
Core capital rato, excl. hybrid core capital 17.7% 17.5%
Core capital ratio 17.7% 17.5%
Solvency ratio 19.8% 19.7%
Core Capital and Shareholders’ equity
Share capital 200,000 200,000
Reserves 10,968 0
Net profit 262,097 189,078
Retained earnings, previous years 1,557,762 1,460,582
Shareholders’ equity, before deduction of holdings of own shares 2,030,828 1,849,660
Deduction of dividend 70,000 40,000
Deduction due to excess holdings of shares in the fincial sector 5,740 0
Deduction of holdings of own shares 44,076 29,568
Deduction of intangible assets 6,678 0
Deductions regarding planned purchase of own chares 6,713 0
Deduction of deferred tax assets 18,496 44,553
Deduction regarding prudent valuation of financial instruments 4,436 4,136
Core capital exclusive of hybrid core capital 1,874,689 1,731,404
Hybrid core capital before deductions 0 0
Core capital 1,874,689 1,731,404
Total capital
Core capital 1,874,689 1,731,404
Subordinated loan capital, before deductions 223,477 222,868
Total capital 2,098,167 1,954,272
The BankNordik Group holds a license to operate as a bank and is therefore subject to a capital requirement under the Faroese Financial Business Act and to CRR. The Faroese provisions on capital requirements apply to both the Parent Company and the Group. The capital requirementprovisions stipulate a minimum capital of 8% of the identified risks. A detailed body of rules determines the calculation of capital as well as risks (risk-weighted items). The capital comprises core capital and subordinated loan capital. The core capital corre-sponds to the carrying amount of equity, after deductions of holdings of own shares, deffered tax assets and other minor deductions.
Page 14 Risk Management Report 2018
The Group’s Executive Board and Board of Directors are responsible for maintaining a sufficient capital base and lay down
requirements for individual solvency. The Group’s Risk Committee is responsible for monitoring and making sure on an on-
going basis that the solvency requirements (methodological) determined by the Executive Board and the Board of Directors
are complied with at all times. The overall responsibility for reporting to the Executive Board and the Board of Directors
regarding solvency requirements lies with the Finance Department.
3.3.1 Solvency requirement
The Group has implemented a methodology approved by the Danish FSA to ensure that BankNordik can expose/identify any
potential risk and meet the requirements set by the Executive Board and the Board of Directors. The methodology forms
an integral part of the Group’s organisation and the Finance Department prepares a quarterly report. The report is then
submitted to the Executive Board. The Board of Directors receives a condensed quarterly report and a full annual solvency
requirement report that is submitted to the Board for approval.
The method can be split into two main parts. The first part involves the calculation of the minimal capital requirement (see
the 8+ approach). The second part consists of eight underlying risk factors:
■ Earnings
■ Growth in lending
■ Credit risk
■ Market risk
■ Liquidity risk
■ Operational risk
■ Leverage risk
■ Statutory requirements
In addition to these eight risk factors, the Bank calculates potential premiums for special risks believed not to be covered by
the calculation of minimal risk. See the calculation of the 8+ capital requirement below in table 5.
3.3.2 The methodology
Capital and solvency adequacy pr. Dec. 31 2018 Table 5
DKK 1.000 Capital requirementRWA Capital
requirement, per cent
1) Basic Capital requirement, 8 % of RWA 849,716 8.0%
+ 2) Earnings (capital for risk coverage due to weak earnings) 25,559 0.2%
+ 3) Growth in lending (capital to cover organic growth in business volume) 0.0%
+ 4) Credit risk, of which: 69,198 0.7%
4a) Credit risk on major customers in financial distress 22,674 0.2%
4b) Other credit risk 16,583 0.2%
4c) Concentration risk on individual exposures 29,941 0.3%
4d)Concntration risk on industries 0.0%
+ 5) Market risk, of which: 81,000 0.8%
5a) Interest risk 17,600 0.2%
5b) Credit spread risk 63,400 0.6%
5c) Equity risk 0.0%
5d) Foreign exchange risk 0.0%
+ 6) Liquidity risk (capital to cover more expensive liquidity) 0.0%
+ 7) Operational risk (capital to cover operational risk in excess of pillar I) 0.0%
+ 8) Gearing (capital to cover risk due to gearing) 0.0%
+ 9) Margins due to statutoryrequirements 0.0%
Capital requirement and solvency requirement ratio 1,025,473 9.7%
Page 15 Risk Management Report 2018
If any other areas of special risk are identified that are not listed in the model set out above, the Bank calculates an extra
capital requirement for such risk. In addition to stress testing different risk parameters, the second part of the model in-
volves additional capital requirements for specific additional individual risk exposures, where every potential material risk
specific to BankNordik is taken into account and any potential risk is included in order to determine a possible additional
capital requirement. The summary of the minimal 8+ capital requirement and any possible individual additional capital re-
quirement constitute BankNordik’s total individual capital requirement.
The Group’s solvency requirement has been calculated using the method illustrated above. At the end of December 2018, the
solvency requirement was 9.7%, the risk-weighted items were DKK 10.6 bn and the capital requirement was DKK 1,025m.
3.3.3 Group solvency requirement
Excess capital according to adequacy requirements Table 6
DKK 1.000 31.12.2018 31.12.2017 Change
Total risk-weighted items 10,621,449 9,895,363 726,086
Total capital 2,098,167 1,954,272 143,895
Core capital 1,874,689 1,731,404 143,286
Solvency ratio 19.8% 19.7% 0.0%
Core capital ratio 17.7% 17.5% 0.2%
Capital requirement 1,025,473 921,463 104,010
Solvency requirement 9.7% 9.3% 0.3%
Excess Subordinated loan capital (> 2% of RWA), DKK
-11,082 -24,950 13,868
Excess Subordinated loan capital (> 2% of RWA), per cent
Smaller villages Medium villages Tórshavn (Capital) Average
House Price Development Index (2000=100)
Denmark
Faroe Islands
Figure 3
Figure 3 illustrates the general price developments in the Faroe Islands and Denmark.Source: Statistics Denmark and the Association of Danish Mortgage Banks Source: Own research
The Group offers fixed-rate and floating rate mortgage loans to private customers in the Faroese market in cooperation with
Danish mortgage provider DLR Kredit. In the Danish and Greenlandic markets, mortgage loans are distributed in cooperation
with Danish mortgage providers Totalkredit and DLR Kredit.
4.7 Monitoring and portfolio management
BankNordik monitors credit facilities centrally through its credit systems. Customers showing a weak financial performance
are transferred to a watch list enabling the Group to monitor them more closely and thereby reduce the risk of losses. At
least once a year, a review of all exposures above a certain amount is performed.
Page 23 Risk Management Report 2018
Unauthorised overdrafts are automatically referred to the customer’s adviser, who decides whether or not to accept the
overdraft. For good customers, the Group often accepts one or more accounts being overdrawn for a certain period of time.
If the overdraft is not accepted, a reminder procedure is initiated. As shown in table 13, DKK 4m is more than 90 days past
Loans & guarantees, individual impairments, collateral and unsecured by sector
Table 15
(DKKm) 2018 2017
Loans and Guarantees
Impairments/Provisions Collateral Blanco
Loans and Guarantees
Impairments/Provisions Collateral Blanco
Public
Private 310 204 99 7 314 199 111 4
Corporate 533 274 174 85 372 233 116 24
Total 843 479 273 91 686 432 227 27
From 1 January 2018, the Group’s impairments reflect the expected credit loss impairment model in IFRS 9 and Executive
Order on Financial Reports for Credit Institutions and Investment Firms, etc. as valid in the Faroe Islands. The expected
credit loss is calculated for all individual facilities as a function of the probability of default (PD), the exposure at default
(EAD) and the loss given default (LGD). All expected credit loss impairments are allocated to individual exposures. For all
exposures with objective indication of being subject to an impairment in creditworthiness, stage 3 exposures, the Group
determines the expected credit losses individually.
If a loan, advance or amount due is classified to stage 3, the Group determines the individual impairment charge. The charge
equals the difference between the carrying amount and the present value of the estimated future cash flow from the asset,
including the realisation value of collateral, in three weighted scenarios – the basecase, upside and downside scenario. Loans
and advances not classified as stage 3 are classified in stage 1 or stage 2 and the expected credit loss is calculated in accord-
ance with the function described above and then impaired. Table 16 provides a breakdown of individual impairments, stage
3, and statistical based impairments, stage 1 and 2.
In connection with the acquisition of Sparbank (2010) and Amagerbanken (2011), the Group took over some of the exposures
that were individually impaired. These impairments are recognised as part of the purchase price for the acquired exposures.
In 2018 DKK 134.2m of the impairments reflected in the table below are individual impairments recognised up to 12 months
after the acquisition of the relevant exposure, see Table 16 second column.
Specification of individual and statistic impairments Table 16
2018 2017
DKKm Loans grossIndividual
impairments Loans grossIndividual
impairments
Impairments from acquired
portfolio
Individual impairments:
Faroe Islands 369 164 263 196
Denmark 422 268 344 185 135
Greenland 72 31 33 27 0
Total 862 463 640 408 135
Statistic impairments*:
Faroe Islands 6,391 46 6,038 40 0
Denmark 2,839 45 3,346 38 0
Greenland 558 26 0
Total 9,788 117 9,384 78 0
In 2018 the IFRS 9 implementation has caused a change in calculation of impairments. The 2017 comparison figures are based on Group impairments, and not statistic impairments
Page 25 Risk Management Report 2018
4.9 The Supervisory Diamond
The Danish FSA applies a model for measuring whether a bank has a high-risk profile — the Supervisory Diamond. The model
identifies five areas considered to be indicators of increased risk if not within certain limits. The Group meets by a wide
margin the limits for large exposures, loan growth, exposures towards property, funding-ratio and the liquidity indicator.
The Supervisory Diamond
Sum of large exposures < 175 %
Funding-ratio < 1.0
2018 2017
2018 2017
2018 2017
2018 2017
2018 2017
Liquidity indicator >100%
Property exposure < 25%
Loan growth <20 %
122.2% 119.2%
0.63 0.64
266.0%
5.6% 5.6%
4.7% 4.3%
N/A
figure 4
Page 26 Risk Management Report 2018
5. Market Risk
The Bank has established an Investment Working Group to monitor the financial markets and continuously update its view
on the financial markets. The Investment Working Group meets once a month to discuss the outlook for the financial mar-
kets and make an update containing a recommendation on tactical asset allocation to the Investment Group.
The Investment Working Group refers to the Investment Group. Participants in the Investment Group are the CEO, the
CFO, the COO, the CIO, the Financial Manager and Treasury. Based on the recommendation, the Investment Group decides
whether to retain or revise the Bank’s official outlook.
The Investment Group’s decisions are communicated throughout the organization and form the basis for all advice provided
to customers and included in the Bank’s official Markets Update, which is forwarded by e-mail to a wide range of recipients
and published on the Bank’s website.
5.1 Organisation
The Group defines market risk as the risks taken in relation to price fluctuations in the financial markets. Several types of
risk may arise and the Bank manages and monitors these risks carefully.
BankNordik’s market risks are
■ Interest rate risk: risk of loss caused by changes in interest rates
■ Exchange rate risk: risk of loss from positions in foreign currency when exchange rates change
■ Equity market risk: risk of loss from falling equity values
5.2 Definition
Reporting of Market risk
Monthly
Board of Directors
Executive Board
Monthly
Overview of
— Interest risk
— Exchange risk
— Equity market risk
— Liquidity risk
Daily Overview of
— Interest risk
Overview of
— Interest risk
— Exchange risk
— Equity market risk
— Liquidity risk
Table 17
— Equity market risk
— Liquidity risk
The Group’s market risk management relates to the Group’s as-
sets, liabilities and off-balance-sheet items. The Board of Direc-
tors defines the overall policies / limits for the Group’s market
risk exposures, including the overall risk limits. The limits on
market risks are set with consideration of the risk they imply,
and how they match the Group’s strategic plans.
On behalf of the Executive Board, the Group Risk Committee is
responsible for allocating the market risk to the Group’s major
business areas. Historically, lines have mainly been granted to
Treasury.
Treasury is responsible for monitoring and handling the Bank’s
market risks and positions. Markets have been granted small
market risk lines for its daily operations. The Finance Depart-
ment reports market risks to the Executive Board on a monthly
basis.
5.3 Policy and responsibility
Page 27 Risk Management Report 2018
The stringent exchange rate risk policies support the Group’s investment policy of mainly holding listed Danish government
and mortgage bonds, and to a lesser extent investing in other markets and currencies.
5.4 Control and management
The Finance Department monitors and reports market risk to the Board of Directors and the Executive Board on a monthly
basis.
Table 19 shows the likely effects on the Bank’s share capital from likely market changes.
5.5 Market risk
■ All equity prices fall by 10%.
■ All currencies change by 10% (EUR by 2.25%)
■ Upwards parallel shift of the yield curve of 100 bp.
The calculations show the potential losses for the Group deriving from market volatility.
The Group’s policy is to invest most of its excess liquidity in LCR compliant bonds. As a consequence, BankNordik holds a
large portfolio of bonds, and most of the Group’s interest rate risk stems from this portfolio.
The Group’s interest rate risk is calculated according to the requirements of the Danish FSA. The interest rate risk is defined
as the effects of a one percentage point parallel shift of the yield curve. BankNordik offers fixed rate loans to corporate cus-
tomers. The interest rate risk from these loans is hedged with interest rate swaps on a one-to-one basis.
5.6 Interest rate risk
Table 20 shows the Group’s overall interest rate risk measured
as the expected loss on interest rate positions that would result
from a parallel upward shift of the yield curve. Interest rate risk
Other liabilities 576,971 70,644 1,898 39,104 380 688,998
Provisions for liabilities 29,880 29,880
Subordinated debt 952 1,903 6,662 281,968 291,484
Equity 1,935,362 1,935,362
Total 10,425,927 1,805,128 50,314 1,735,498 1,935,742 15,952,609
Off-balance sheet items
Financial Guarantees 318,943 318,943
Other commitments 157,480 157,480
Total 476,423 476,423
DKK 1,000
Page 32 Risk Management Report 2018
7. Operational Risk
Operational risk is defined as follows:
“Risk of loss resulting from inadequate or faulty internal procedures, human errors and system errors, or because of exter-
nal events, including legal risks.”
Operational risk is thus often associated with specific and non-recurring events, such as clerical or record-keeping errors,
defects or breakdowns of the technical infrastructure, fraud by employees or third-parties, failure to comply with regulatory
requirements, fire and storm damage, litigation or codes of conduct or adverse effects of external events that may affect the
operations and reputation of the Bank.
7.1 Definition
The capital adequacy regulation stipulates that banks must disclose all operational risks.
The Bank seeks to minimise its operational risks throughout the organisation by means of an extensive system of policies
and control arrangements, which are designed to optimise procedures.
7.2 Policy
At the organisational level, banking activities are kept separate from the control function. Independent auditors perform the
internal auditing in order to ensure that principles and procedures are complied with at all times.
Although the Bank has implemented risk controls and taken loss-mitigating actions, and substantial resources have been de-
voted to developing efficient procedures and training staff, it is not possible to implement procedures that are fully effective
in controlling all operational risks. The Bank has therefore taken out insur¬ance in respect of property, office equipment,
vehicles and employee compensation as well as general liability and directors’ and officers’ liability. In addition, the Bank
has taken out insurance against theft, robbery, amounts lost in cash transports between branches or in the post up to a
reasonable figure. The Bank believes that the type and relative amounts of insurance that it holds are in accordance with
customary practice in its business area.
Assessing the Bank’s operational risks in the IT field is considered an important area. The Bank’s IT department and man-
agement regularly review IT security, including contingency plans for IT breakdowns etc., that are designed to ensure that
operations can continue at a satisfactory level in case of extraordinary events. All IT systems running at BankNordik and
from the bank’s service providers must adhere to documented running schedules and guidelines. IT operations must be safe
and stable, a requirement complied with through the greatest possible degree of automation and capacity adjustments. IT
services run by service providers must be based on written agreements.
The Bank has not been involved in any governmental, legal or arbitration proceedings (nor is the Bank aware of any such
proceedings pending or being threatened) during a period covering at least the preceding 12 months, which may have, or
have had in the recent past a material adverse impact on the Bank’s financial position or profitablity.
Pursuant to the Executive Order for the Faroe Islands on the governance and management of banks, etc. (Bekendtgørelse for
Færøerne om ledelse og styring af pengeinstitutter m.fl.) and the Danish FSA’s guidelines, the Bank is required to perform
a qualitative assessment of its control environment. Control environment is a collective term for the resources the bank
applies to minimise the risks involved in carrying on the financial business. Such resources would include an assessment
of the scope of internal business procedures, the degree of functional segregation, and whether the necessary management
and control tools are in place in all relevant business areas.
7.3 Measurement and control
Page 33 Risk Management Report 2018
In addition to monitoring the level of risk for assessing the capital requirement for operational risk, the Bank’s monitor-
ing system is designed to gather new statistics on operational risk. The long-term objective is for the monitoring system
monitoring the level of operational risk in the Bank’s branches on a monthly basis to have a preventive effect and to help to
minimise the Bank’s operational risk.
7.4 Long-term goals in operational risk management
Page 34 Risk Management Report 2018
8. Insurance Risk
Insurance risk in the Group consists mostly of non-life insurance risk. The Group has a non-life insurance company, Trygd
and a life insurance company, NordikLív.
Risk exposure for an insurance company can be defined as a contingency event, chain of events or bad management which
can by itself, or by accumulation, seriously affect the annual results of the insurer and in extreme cases make it unable to
meet its liabilities. Risks for an insurance operation are typically categorized as insurance risk and market risk. Among other
risks are currency exchange risk, liquidity risk, counterparty and concentration risk and operational risk.
Careful and prudent risk management forms an integral part of any insurance operations. The nature of insurance is to deal
with unknown future incidents resulting in a payment obligation. An important part of managing insurance risk is reinsur-
ance. The Group must protect itself against dramatic fluctuations in technical results by entering into agreements on rein-
surance so that the risk of the Group having to pay claims from its own funds is reasonable in relation to the risks assumed,
their composition and Trygd’s equity. This is done with statistical spread of risks and accumulation of funds, quantified by
statistical methods, to meet these obligations.
The Group has defined internal procedures to minimise the possible loss regarding insurance liabilities. Trygd evaluate their
insurance risk on a regular basis for the purpose of optimising the risk profile. Risk management also involves holding a
well-diversified insurance portfolio. The insurance portfolio of Trygd is well diversified in personal and commercial lines
(see table 25).
Trygd covers the insurance liabilities through a portfolio of securities and investment assets exposed to market risk.
8.1 Insurance risk
Trygd has invested in investment securities and cash and cash equivalents in the effort to balance the exposure to market
and currency risk (see table 26).
Distrubution of portfolio of Trygd
Table 25
(in %) 2018 2017
Commercial lines 65% 67%
Personal lines 35% 33%
Financial assets linked to insurance risk
Table 26
DKKm 2018 2017
Listed securities on stock exchange
154 140
Accounts receivable (total technical provisions)
3 2
Cash and cash equivalents 13 16
Total 170 158
Likely effects from changes in markets value
Table 27
DKKm Change 2018 2017
Equity risk DKKm (+/-) 10%
Exchange risk DKKm (+/-) in euro
2.25%
Exchange risk DKKm (+/-) others currency
10%
Interest rate risk DKKm (parallel shift) - Trygd
100 bp 1.2 0.66
Interest rate risk DKKm (parallel shift) Total
100 bp
Page 35 Risk Management Report 2018
The effects on BankNordiks solvency, due to the ownership of the insurance company’s Trygd and NordikLív, are considered
low. According to CRR the risk weighted assets has increased DKK 299m. The negative effect on the solvency thus is 0.5%
points.
8.2 Capital requirements
The Board of Directors and Executive Management of Trygd must ensure that the company has an adequate capital base
and internal procedures for risk measurement and risk management to assess the necessary capital base applying a spread
appropriate to cover Trygd’s risks.
In order to meet these requirements Trygd´s policies and procedures are regularly updated. Risk management at Trygd is
based on a number of policies, business procedures and risk assessments which are reviewed and must be approved by the
Board of Directors annually.
The size of provisions for claims is based on individual assessments of the final costs of individual claims, supplemented
with statistical analyses.
The company´s acceptance policy is based on a full customer relationship, which is expected to contribute to the overall
profitability of the Group. In relation to acceptance of corporate insurance products, the Board of Directors has approved a
separate acceptance policy, which is implemented in the handling process of the corporate department.
Reinsurance is an important aspect of managing insurance risk. The Group must protect itself against dramatic fluctuations
in technical results by entering into agreements on reinsurance so as to make the risk of the Group having to pay claims
from its own funds reasonable in relation to the size of the risk assumed, the risk composition and Trygd´s equity.
8.3 Trygd non-life insurance
Trygd has organised a reinsurance programme which ensures that e.g. large natural disasters and significant individual
claims do not compromise Trygd´s ability to meet its obligations. For large natural disasters, the total cost to Trygd will
amount to a maximum of DKK 10m. The reinsurance program is reviewed once a year and approved by the Board of Direc-
tors. Trygd uses reputable reinsurance companies with strong ratings and financial positions.
Trygd’s Claims Department is responsible for handling all claims and only claims employees may deal with claims matters
or advise claimants in specific claim cases. Technical provisions to cover future payments for claims arising are calculated
using appropriate and generally recognised methods. Insurance provisions are made to cover the future risk on the basis of
experience from previous and similar claims. These methods and analyses are subject to the natural uncertainty inherent in
estimating future payments, both in terms of size and date of payment.
The board of directors of Trygd applies a low risk investment policy. The company´s main investments are in bonds and
deposits. There is no exchange rate risk, as all investements are based in DKK.
Run-off gains/losses in Trygd
Table 28
DKKm
Sector: 2018 2017 2016 2015 2014
Industry -0,68 1,25 2,5 1,12 1,95
Private -0,10 0,46 0,43 0,64 -0,18
Accidents -1,05 0,19 -0,32 0,27 -0,07
Automobile 3,11 2,93 3,39 2,3 0,99
Total 1,28 4,82 6,00 4,33 2,69
Page 36 Risk Management Report 2018
Contractual maturity for the insurance segment Table 29
2018 On demand0-12
months 1-5 yearsOver 5
yearsNo stated maturity Total
Assets
Securities 191,023 191,023
Reinsurance assets 2,399 2,399
Accounts receivables 3,451 3,451
Restricted cash
Cash and cash equivalents 17,089 17,089
Total financial assets 208,111 5,850 213,961
Liabilities
Technical provision 90,243 90,243
Account payable 7,133 7,133
Total financial liabilities 97,377 97,377
Assets - liabilities 208,111 -91,527 116,584
Contractual maturity for the insurance segment
2017 On demand0-12
months 1-5 yearsOver 5
yearsNo stated maturity Total
Assets
Securities 171,553 171,553
Reinsurance assets 6,383 6,383
Accounts receivables 2,191 2,191
Restricted cash
Cash and cash equivalents 19,846 19,846
Total financial assets 191,399 8,574 199,973
Liabilities
Technical provision 81,736 81,736
Account payable 5,445 5,445
Total financial liabilities 87,182 87,182
Assets - liabilities 191,399 -78,608 112,791
Assets and liabilities are offset when the Group and the counterparty have a legally enforceable right to offset recognised amounts and have agreed to settle the balances on a net basis or to realise the asset and settle the liability simultaneously. Master netting agreements or similar agreements give the right to additional offset in the event of default.
Page 37 Risk Management Report 2018
NordikLív is a life insurance company established in 2015 and wholly owned by BankNordik. The company began operations
in 2016.
NordikLív issues regular life, disability and critical illness insurance covers in the Faroese market and in 2018 the total pre-
miums amounted to DKK 14.4m compared to DKK 13.2m in 2017, and the individual solvency requirement was much lower
than the minimum capital requirement defined by law, leaving NordikLív with a capital requirement of DKK 27.7m compared
to a total capital of DKK 33.9m
The primary risks of NordikLív are financial risks, insurance risks, operational risks and commercial risks.
NordikLív’s investment policy is restrictive and at present NordikLív only holds government bonds and Danish mortgaged
backed bonds limiting the primary financial risk to interest rate risk.
In respect of insurance risks these are, due to the company’s limited product portfolio, mainly related to disability, costs and
the occurrence of a catastrophe. To mitigate these risks NordikLív’s under-writing policy is aimed at securing that only risks
that can be characterized as normal for the relevant area of insurance are accepted. Further, NordikLív reinsures it’s against
larger claims, e.g. because of the occurrence of a catastrophe.
Operational risks are the risks of suffering an economic loss due insufficient or the complete lack of internal procedures,
human or system based errors or due to external events, including a change in legislation. In respect of the latter, besides an
expected minor increase in the minimum capital requirement defined by law, the proposed upcoming Solvency II inspired
Faroese regulation is not expected to have any major influence on NordikLív.
Commercial risks are related to the uncertainty of the development of the Faroese life insurance market, change in customer
behaviour and demands, a shift in technology and reputational risk.
In order to mitigate operational and commercial risks NordikLív has entered into a cooperation agreements with Forenede
Gruppeliv and BankNordik providing the company with expert resources within production, administration, internal audit,