76


RISK MANAGEMENT REPORT BANCO DO BRASIL S.A.
2nd quarter of 2011

Risk Management Report
Banco do Brasil S.A. 2
Summary List of Tables ......................................................................................................................... 3
List of Figures ........................................................................................................................ 5
1. Introduction ........................................................................................................................ 6
2. CEO’s Message ................................................................................................................. 7
3. Governance ....................................................................................................................... 8
Risk Exposure........................................................................................................................ 8
Types of Risks ....................................................................................................................... 8
Corporate Risk Governance ................................................................................................. 10
Risk Management Process .................................................................................................. 11
Reports ................................................................................................................................ 11
4. Regulation ....................................................................................................................... 12
Basel Accord ....................................................................................................................... 12
Background ...................................................................................................................... 12
Basel I .............................................................................................................................. 12
1996 Market Risk Amendment ......................................................................................... 13
Basel II ............................................................................................................................. 13
Basel III ............................................................................................................................ 17
5. Basel II at Banco do Brasil ............................................................................................... 19
6. Regulations ...................................................................................................................... 21
7. Financial Conglomerate ................................................................................................... 22
8.1 Financial Conglomerate .............................................................................................. 23
8.1.1 Credit Risk ........................................................................................................... 23
8.1.2 Market and Liquidity Risks .................................................................................. 43
8.1.3 Operational Risk .................................................................................................. 54
8.2 Non-financial Companies ........................................................................................... 59
9. Capital ............................................................................................................................. 60
9.1 Regulatory Capital ...................................................................................................... 60
9.1.1 Referential Equity (PR) ........................................................................................ 60
9.1.2 Required Referential Equity (PRE) ....................................................................... 68
9.1.3 Basel Index (IB) ................................................................................................... 71
9.2 Economic Capital ....................................................................................................... 73

Risk Management Report
Banco do Brasil S.A. 3
List of Tables Table 1. Timetable for Basel III Implementation in Brazil ...................................................... 19
Table 2. Credit-risk exposure by Risk Weights ..................................................................... 30
Table 3. Average credit-risk exposure in each quarter ......................................................... 30
Table 4. Credit-risk exposure by geographic region and country .......................................... 31
Table 5. Credit-risk exposure of the financial conglomerate by economic sector .................. 32
Table 6. Credit-risk exposure of the economic-financial consolidated group by economic sector: .................................................................................................................................. 33
Table 7. Amount of transactions in arrears ........................................................................... 33
Table 8. Concentration levels of the ten biggest clients in relation to the total from lending transactions. ........................................................................................................................ 34
Table 9. Flow of transactions written-off ............................................................................... 34
Table 10. Stock of allowances for doubtful accounts ............................................................ 34
Table 11. Loss operations assigned, with substantial transfer of risks and benefits ............. 35
Table 12. Value of the exposures derived from acquiring FIDC and CRI .............................. 36
Table 13. Notional value of contracts to be liquidated in clearing house liquidation systems, in which the house acts as central counterparty ...................................................................... 38
Table 14. Notional value of contracts subject to counterparty credit risks in which clearing houses do not act as central counterparty. ........................................................................... 38
Table 15. Notional value of contracts where clearing houses did not act as central counterparty, and which do not have guarantees. ................................................................ 39
Table 16. Notional value of contracts where clearing houses did not act as central counterparty, and which do have guarantees. ...................................................................... 39
Table 17. Positive gross value of contracts subject to counterparty credit risks, not taking into account the positive values from compensation agreements, as set forth in CMN Resolution 3.263/05. .............................................................................................................................. 40
Table 18. The value of guarantees which cumulatively meet the requirements of paragraph VI, Article 8, of Bacen Circular 3.477/09:.............................................................................. 41
Table 19. Notional value of credit derivatives ....................................................................... 41
Table 20. Mitigated value of exposure, weighted by respective risk factors .......................... 42
Table 21. Derivative financial instruments in the country and abroad, by market risk factor, with and without central counterparty – 2Q10 ...................................................................... 44
Table 22. Derivative financial instruments in the country and abroad, by market risk factor, with and without central counterparty – 3Q10 ...................................................................... 44
Table 23. Derivative financial instruments in the country and abroad, by market risk factor, with and without central counterparty – 4Q10 ...................................................................... 45
Table 24. Derivative financial instruments in the country and abroad, by market risk factor, with and without central counterparty – 1Q11 ...................................................................... 45
Table 25. Derivative financial instruments in the country and abroad, by market risk factor, with and without central counterparty – 2Q11 ...................................................................... 46
Table 26. Total value of the Negotiable Portfolio by relevant market risk factor, divided into positions bought and positions sold – 2Q10 .................................................................. 49
Table 27. Total value of the Negotiable Portfolio by relevant market risk factor, divided into positions bought and positions sold – 3Q10 ......................................................................... 49
Table 28. Total value of the Negotiable Portfolio by relevant market risk factor, divided into positions bought and positions sold – 4Q10 ......................................................................... 49

Risk Management Report
Banco do Brasil S.A. 4
Table 29. Total value of the Negotiable Portfolio by relevant market risk factor, divided into positions bought and positions sold – 1Q11 ......................................................................... 49
Table 30. Total value of the Negotiable Portfolio by relevant market risk factor, divided into positions bought and positions sold – 2Q11 ......................................................................... 50
Table 31. Phases of the operational risk management process ........................................... 55
Table 32. Monitoring of operating losses.............................................................................. 58
Table 33. Referential Equity ................................................................................................. 61
Table 34. Capital and Retained Earnings ............................................................................. 62
Table 35. Equity valuation adjustments ................................................................................ 62
Table 36. Non Controlling Participation ................................................................................ 63
Table 37. Perpetual Bonds .................................................................................................. 63
Table 38. Subordinated Debt ............................................................................................... 65
Table 39. Subordinated Debt Eligible as Capital .................................................................. 65
Table 40. Perpetual Bonds .................................................................................................. 65
Table 41. Financial Instruments excluded from the PR ........................................................ 67
Table 42. PR historical series – Financial Conglomerate ..................................................... 67
Table 43. PR historical series – Consolidated Economic and Financial ............................... 67
Table 44. Required Referential Equity for the Financial Conglomerate ................................ 69
Table 45. Required Referential Equity for the Consolidated Economic – Financial .............. 70
Table 46. The Basel ratio and capital margin — Financial Conglomerate. ........................... 72
Table 47. The Basel ratio and capital margin — Consolidated Economic and Financial ....... 72
Table 48. Economic Capital ................................................................................................. 73
Table 49. Distribution of economic capital in the credit portfolio. .......................................... 74
Table 50. Economic capital for market risk, by risk factors ................................................... 74
Table 51. Economic capital for operational risk, by loss event category ............................... 75
Risk Management Report
Banco do Brasil S.A. 5
List of Figures Figure 1. Governance Structure ........................................................................................... 10
Figure 2. Management Structure and Process ..................................................................... 11
Figure 3. Basel II Pillars ....................................................................................................... 14
Figure 4. Capital allocation................................................................................................... 14
Figure 5. Pillar III Structure .................................................................................................. 16
Figure 6. Credit-risk management ........................................................................................ 23
Figure 7. Credit-risk management structure ......................................................................... 26
Figure 8. Operational risk management structure ................................................................ 54

Risk Management Report
Banco do Brasil S.A. 6
1. Introduction BB considers risk and capital management as its fundamental vectors for decision-making, providing greater stability, better capital allocation, and optimization of the risk-return ratio. The objective of this section is to inform shareholders and interested parties of the management practices and policies that comprise risk management at BB.

Risk Management Report
Banco do Brasil S.A. 7
2. CEO’s Message Participation by the country’s representative in the Basel Committee on Banking Supervision in Switzerland is a source of pride for Brazilians, reaffirming the new level of stability achieved by Brazil’s financial system. As is well-known, banking system sustainability is indissolubly linked with risk-management policies and mechanisms. The methods of identifying, measuring, assessing, monitoring, and controlling risk safeguard financial institutions in adverse situations and provide support for positive, recurring earnings over time. The expectation of smaller bank spreads reinforces that conviction. Just as important as increasing the volume of business is the consistency of a company’s risk governance and the efficiency of its management processes. Institutions that are able to transcend mere compliance with regulatory requirements and take risk into account in a quick and accurate way when making decisions are the ones that will rise to the challenge. Brazil’s participation in the Basel Committee on Banking Supervision will encourage broader, timelier adoption of international prudential standards. These new frontiers of the regulatory environment will require Brazilian financial institutions to become more agile and adaptable. In these aspects the bank is mature and conscious of its commitment to its clients, shareholders, investors, and society. Banco do Brasil continually seeks to keep pace with best management practices, including its risk-management architecture, which has a multidimensional scope to address credit, liquidity, market, and operational risks. The specifics are described in this space. Aldemir Bendine

Risk Management Report
Banco do Brasil S.A. 8
3. Governance Risk Exposure
Changes to the global financial environment, such as market integration through globalization, the emergence of new transactions and products, increasing technological sophistication, and new regulations, have made financial activities and processes - and their risks - ever more complex. Additionally, the lessons learned from financial disasters, such as those of the Metallgesellschatt Group and Barings, have helped show the essential need for risk management in the banking industry. These factors have influenced regulatory agencies and financial institutions to invest in risk management, seeking to strengthen the financial health of banks and to prevent detrimental effects on the financial system. In concert with this outlook, BB has invested in the continual improvement of its risk-management process and practices, in accordance with international market benchmarks and the New Basel Accord, known as Basel II, and by the fine-tuning provided by Basel III. Types of Risks
The main risks to which BB is exposed in its business are: Situational Risk: arises from the possibility of losses caused by changes to political, cultural, social, economic, or financial conditions in Brazil and other countries. It includes the following risks: a) Strategic Risk – risk of losses from adopting unsuccessful strategies, taking into
account the dynamics of business and competition, political changes in the country and abroad, and changes in the domestic and global economy;
b) Country Risk – understood as the possibility of losses associated with non-fulfillment of financial obligations according to negotiated terms by a borrower or counterparty located outside of the country, resulting from actions taken by the government of the country where the borrower or counterparty is located; and transfer risk, understood as the possibility of difficulties occurring during currency conversion of funds received; and
c) Systemic Risk – Possibility of losses due to the financial difficulties of one or more institutions that cause substantial damage to others, or a disruption of normal operations of the national financial system.
Credit Risk: defined as the possibility of losses associated with non-fulfillment by a buyer or a counterparty of their respective financial obligations according to negotiated terms, the devaluation of a loan agreement due to a drop in the borrower’s risk rating, a decline in gains or earnings, advantages offered during renegotiation, and recovery costs. Among other things, credit risk is defined as including:
Risk Management Report
Banco do Brasil S.A. 9
− counterparty credit risk, understood as the possibility of a given counterparty not fulfilling its obligations related to settlement of transactions that involve trading financial assets, including those related to the settlement of financial derivatives;
− country risk – understood as the possibility of losses associated with non-fulfillment of financial obligations according to negotiated terms by a borrower or counterparty located outside of the country, resulting from actions taken by the government of the country where the borrower or counterparty is located; and transfer risk, understood as the possibility of difficulties occurring during currency conversion of funds received;
− the possibility of having to make disbursements to honor guarantees, bonds, co-obligations, credit commitments, or other transactions of a similar nature; and
− the possibility of losses associated with a loan broker or intervening party not fulfilling their financial obligations according to negotiated terms.
Image Risk: possibility of losses from the institution having its name sullied on the market or with authorities, as a result of negative publicity, whether true or not. Market Risk: the possibility of losses from fluctuations of the market value of positions held by a financial institution. It includes the risks of transactions subject to fluctuations of exchange rates, interest rates, share prices, and commodity prices. Legal Risk: this can be defined as the possibility of losses due to fines, penalties or indemnities arising from actions by regulators, and losses due to unfavorable rulings in lawsuits and administrative actions. Liquidity Risk: is the occurrence of imbalances between tradable assets and liabilities payable - "mismatches" between payments and receipts - which can affect the institution’s payment ability, taking into account the various currencies and settlement terms of its rights and obligations.
Operational Risk: possibility of losses due to failures, deficiencies, or improper internal processes, people and systems or external events. This definition includes the legal risk associated with improper or deficient contracts signed by the institution, as well as sanctions resulting from noncompliance with legal provisions and compensation for damages to third parties resulting from activities engaged in by the institution.
Risk Management Report
Banco do Brasil S.A. 10
Corporate Risk Governance
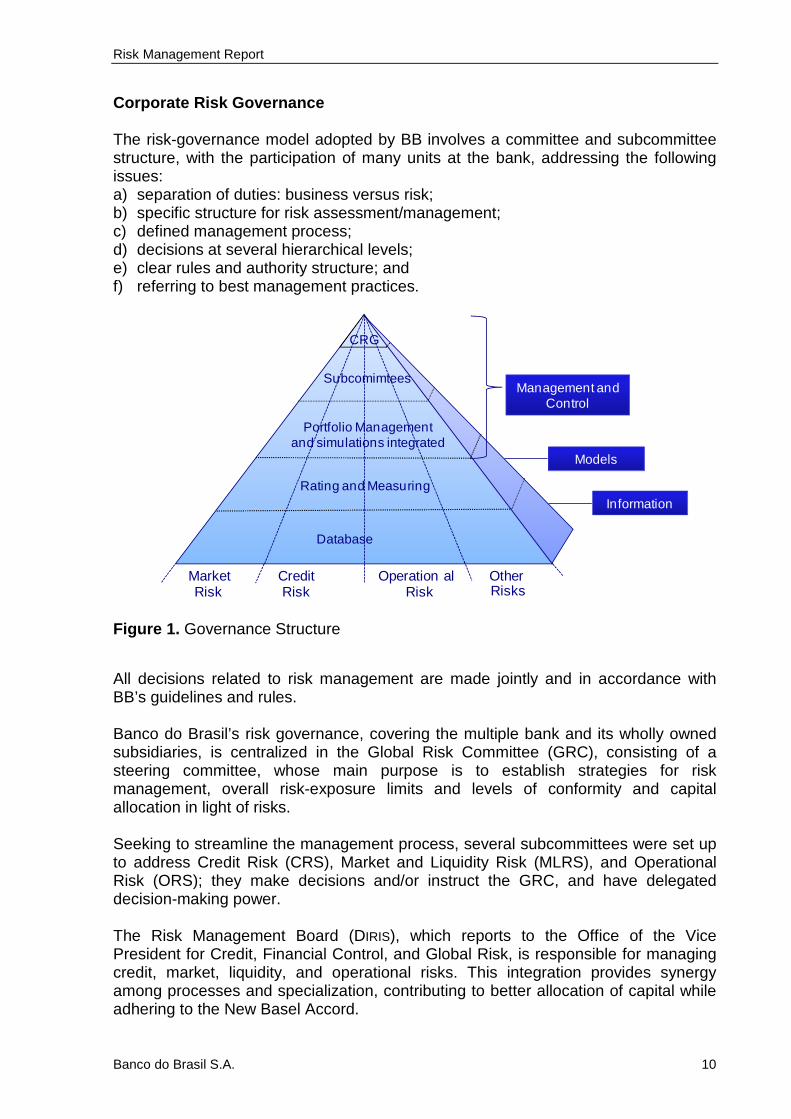
The risk-governance model adopted by BB involves a committee and subcommittee structure, with the participation of many units at the bank, addressing the following issues: a) separation of duties: business versus risk; b) specific structure for risk assessment/management; c) defined management process; d) decisions at several hierarchical levels; e) clear rules and authority structure; and f) referring to best management practices.
CRG
MarketRisk
CreditRisk
Operation alRisk
OtherRisks
Database
Rating and Measuring
Portfolio Managementand simulations integrated
SubcomimteesManagement and
Control
Models
Information
Figure 1. Governance Structure
All decisions related to risk management are made jointly and in accordance with BB’s guidelines and rules. Banco do Brasil’s risk governance, covering the multiple bank and its wholly owned subsidiaries, is centralized in the Global Risk Committee (GRC), consisting of a steering committee, whose main purpose is to establish strategies for risk management, overall risk-exposure limits and levels of conformity and capital allocation in light of risks. Seeking to streamline the management process, several subcommittees were set up to address Credit Risk (CRS), Market and Liquidity Risk (MLRS), and Operational Risk (ORS); they make decisions and/or instruct the GRC, and have delegated decision-making power. The Risk Management Board (DIRIS), which reports to the Office of the Vice President for Credit, Financial Control, and Global Risk, is responsible for managing credit, market, liquidity, and operational risks. This integration provides synergy among processes and specialization, contributing to better allocation of capital while adhering to the New Basel Accord.

Risk Management Report
Banco do Brasil S.A. 11
Figure 2. Management Structure and Process Decisions are reported to intervening units through decisions that objectively express the position taken by executive management, guaranteeing application throughout the bank. Risk Management Process
The risk-management process involves a continuous flow of information, abiding by the following phases: a) preparation: data gathering and analysis phase. During this stage, risk measures
are analyzed and proposed for discussion and deliberation in the subcommittees, and if necessary, for later discussion and deliberation in the GRC;
b) decision: decisions are made jointly at the appropriate levels and reported to the intervening units;
c) execution: the intervening units implement the decisions made; and d) monitoring/management: the Risk Management Board oversees the process,
evaluating compliance with deliberations and their impacts on BB, reporting the status of these actions to the appropriate forum (subcommittee or GRC). Oversight of these decisions and reporting to subcommittees/GRC allows for improvement of the management process.
Reports
Risk-management reports provide support for risk-related decisions in the subcommittees, the Global Risk Committee, the Board of Officers, and the Board of Directors. They are prepared every month and have qualitative and quantitative managerial information about the bank’s exposure to risk. They support the
Aréas de Negócio
Aréas de Negócio
SRML SRC SRO
Risk Management Board
Global Risk Committee
Boards
Officers
President &
Vice-
Presidents
CRG Decision
Business Units
Monitoring Units

Risk Management Report
Banco do Brasil S.A. 12
information disclosed to the market in the Management Report and the Performance Analysis Report.
4. Regulation Basel Accord The rules established by the Basel Committee, from the outset, have always sought to create an international standard that regulators could use to defend the market against risks specific to the financial industry. Background In 1973, the global financial market was undergoing a period of intense volatility with the end of the International Monetary System based on fixed exchange rates. Liberalization of rates required measures to minimize the system’s risk. The fragility reached a critical level in 1974 with the occurrence of disruptions on international markets, such as the failure to settle currency contracts due to the insolvency of Germany’s Bankhaus Herstatt. At the end of that year, those in charge of banking oversight in the G-10 countries decided to create the Committee on Banking Regulation and Supervision of Practices, headquartered at the Bank of International Settlements (BIS) in Basel, Switzerland. Thus the name, the Basel Committee. The Committee consists of representatives from central banks and authorities with formal responsibility for banking oversight in the G-10 member countries. This Committee discusses issues related to the banking industry, seeking to improve the quality of banking supervision and to strengthen the security of the international banking system. The Committee does not have formal authority for supranational supervision, but it has the goal of inducing behavior in countries that are not members of the G-10. By following committee guidelines, those countries will contribute to improving practices on the international financial market. Basel I In July 1988, after an intense debate, the Basel Accord was executed, defining the mechanisms for measuring credit risk and establishing the minimum-capital requirements to endure risks. This accord is now known as Basel I. The accord’s objectives were to strengthen the health and the stability of the international banking system and to minimize the competitive inequalities among internationally active banks. These inequalities were the result of different minimum-capital requirement rules by national regulators. The 1988 Basel Accord defined three concepts:
Risk Management Report
Banco do Brasil S.A. 13
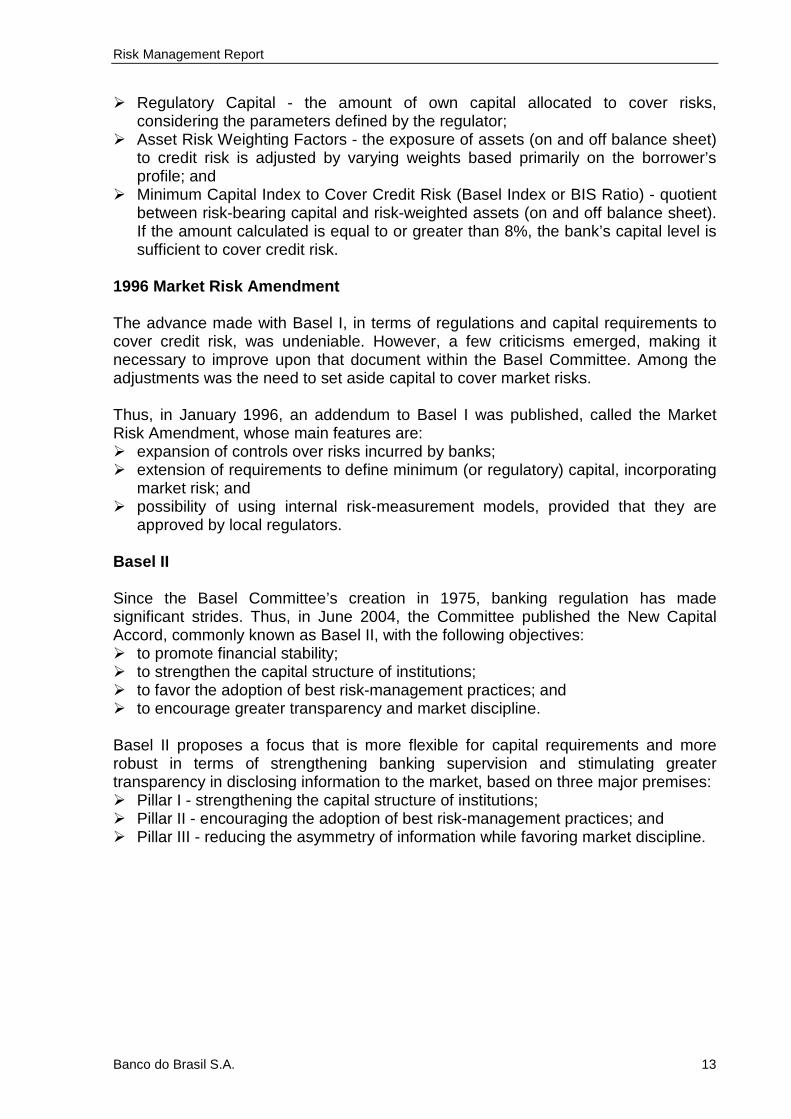
� Regulatory Capital - the amount of own capital allocated to cover risks, considering the parameters defined by the regulator;
� Asset Risk Weighting Factors - the exposure of assets (on and off balance sheet) to credit risk is adjusted by varying weights based primarily on the borrower’s profile; and
� Minimum Capital Index to Cover Credit Risk (Basel Index or BIS Ratio) - quotient between risk-bearing capital and risk-weighted assets (on and off balance sheet). If the amount calculated is equal to or greater than 8%, the bank’s capital level is sufficient to cover credit risk.
1996 Market Risk Amendment The advance made with Basel I, in terms of regulations and capital requirements to cover credit risk, was undeniable. However, a few criticisms emerged, making it necessary to improve upon that document within the Basel Committee. Among the adjustments was the need to set aside capital to cover market risks. Thus, in January 1996, an addendum to Basel I was published, called the Market Risk Amendment, whose main features are: � expansion of controls over risks incurred by banks; � extension of requirements to define minimum (or regulatory) capital, incorporating
market risk; and � possibility of using internal risk-measurement models, provided that they are
approved by local regulators. Basel II Since the Basel Committee’s creation in 1975, banking regulation has made significant strides. Thus, in June 2004, the Committee published the New Capital Accord, commonly known as Basel II, with the following objectives: � to promote financial stability; � to strengthen the capital structure of institutions; � to favor the adoption of best risk-management practices; and � to encourage greater transparency and market discipline. Basel II proposes a focus that is more flexible for capital requirements and more robust in terms of strengthening banking supervision and stimulating greater transparency in disclosing information to the market, based on three major premises: � Pillar I - strengthening the capital structure of institutions; � Pillar II - encouraging the adoption of best risk-management practices; and � Pillar III - reducing the asymmetry of information while favoring market discipline.

Risk Management Report
Banco do Brasil S.A. 14
Management of the national financial
system and financial information
Lessen asymmetry of information
Assessment in how banks are adjusting
needs to risks incurred
PILAR IIBanking Supervision
and Governance
Disclosure of relevant information
to the market
PILAR IIIMarket Discipline
System Stability
Solidity
Risks
- Credit
- Market
- Operational
PILAR IMinimum
Capital Requirements
Figure 3. Basel II Pillars
Pillar I defines the treatment to be given to determine capital requirements in light of risks incurred in the activities engaged in by financial institutions. In relation to the 1988 Accord, Basel II introduces a capital requirement for operational risk and refines the discussion of credit risk.
Market RiskCredit Risk Operational Risk
Modified Maintened Added
IRB Models�Standard�Advanced
Standard Aproach�Standard�StandardSimplified
**********
IRB Model
Standard Aproach
**********
IRB Model�Advanced
Standard Aproach�Standard�StandardAlternative
Basic
Figure 4 . Capital allocation
Basel II encourages the adoption of proprietary models to measure risks (credit, market, and operational), with differing degrees of complexity, subject to regulatory approval, and the possibility of benefits from lower capital requirements by adopting internal approaches. Pillar II reaffirms and strengthens the participation and role of the regulator in the banking supervision process and evaluation of risk governance at institutions, and how they manage capital to deal with the risks that they incur.
Risk Management Report
Banco do Brasil S.A. 15
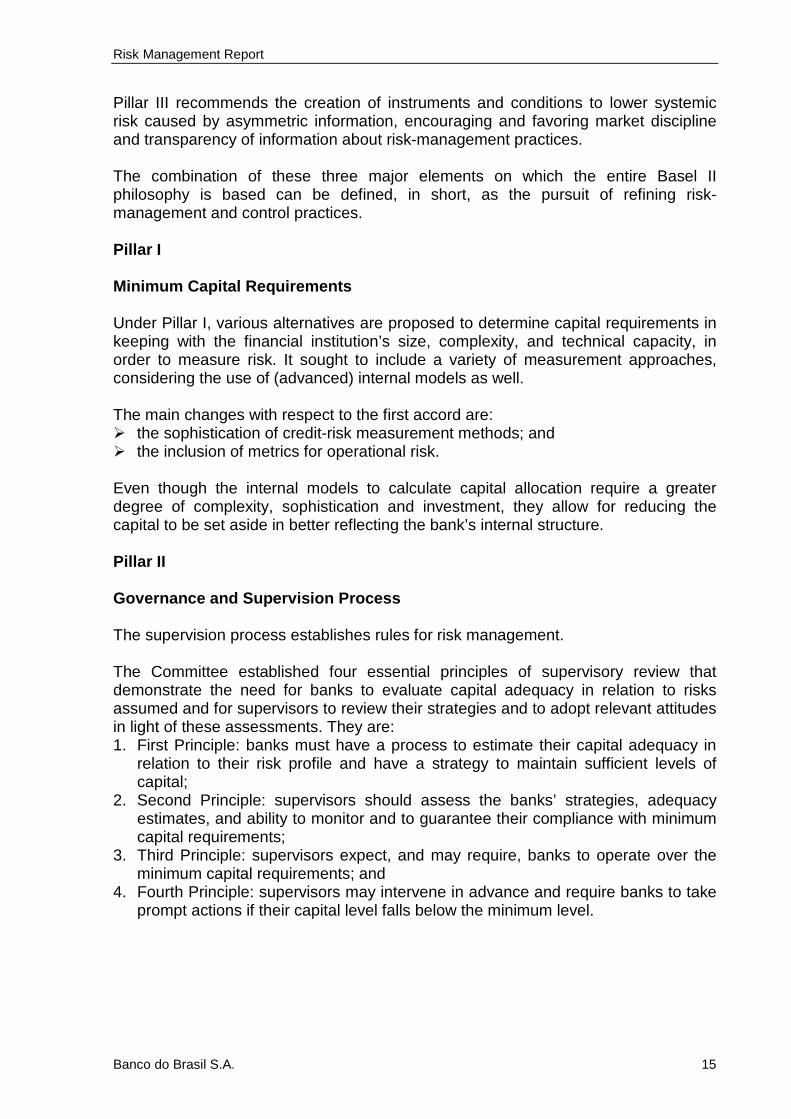
Pillar III recommends the creation of instruments and conditions to lower systemic risk caused by asymmetric information, encouraging and favoring market discipline and transparency of information about risk-management practices. The combination of these three major elements on which the entire Basel II philosophy is based can be defined, in short, as the pursuit of refining risk-management and control practices. Pillar I Minimum Capital Requirements Under Pillar I, various alternatives are proposed to determine capital requirements in keeping with the financial institution’s size, complexity, and technical capacity, in order to measure risk. It sought to include a variety of measurement approaches, considering the use of (advanced) internal models as well. The main changes with respect to the first accord are: � the sophistication of credit-risk measurement methods; and � the inclusion of metrics for operational risk. Even though the internal models to calculate capital allocation require a greater degree of complexity, sophistication and investment, they allow for reducing the capital to be set aside in better reflecting the bank’s internal structure. Pillar II Governance and Supervision Process The supervision process establishes rules for risk management. The Committee established four essential principles of supervisory review that demonstrate the need for banks to evaluate capital adequacy in relation to risks assumed and for supervisors to review their strategies and to adopt relevant attitudes in light of these assessments. They are: 1. First Principle: banks must have a process to estimate their capital adequacy in
relation to their risk profile and have a strategy to maintain sufficient levels of capital;
2. Second Principle: supervisors should assess the banks’ strategies, adequacy estimates, and ability to monitor and to guarantee their compliance with minimum capital requirements;
3. Third Principle: supervisors expect, and may require, banks to operate over the minimum capital requirements; and
4. Fourth Principle: supervisors may intervene in advance and require banks to take prompt actions if their capital level falls below the minimum level.
Risk Management Report
Banco do Brasil S.A. 16
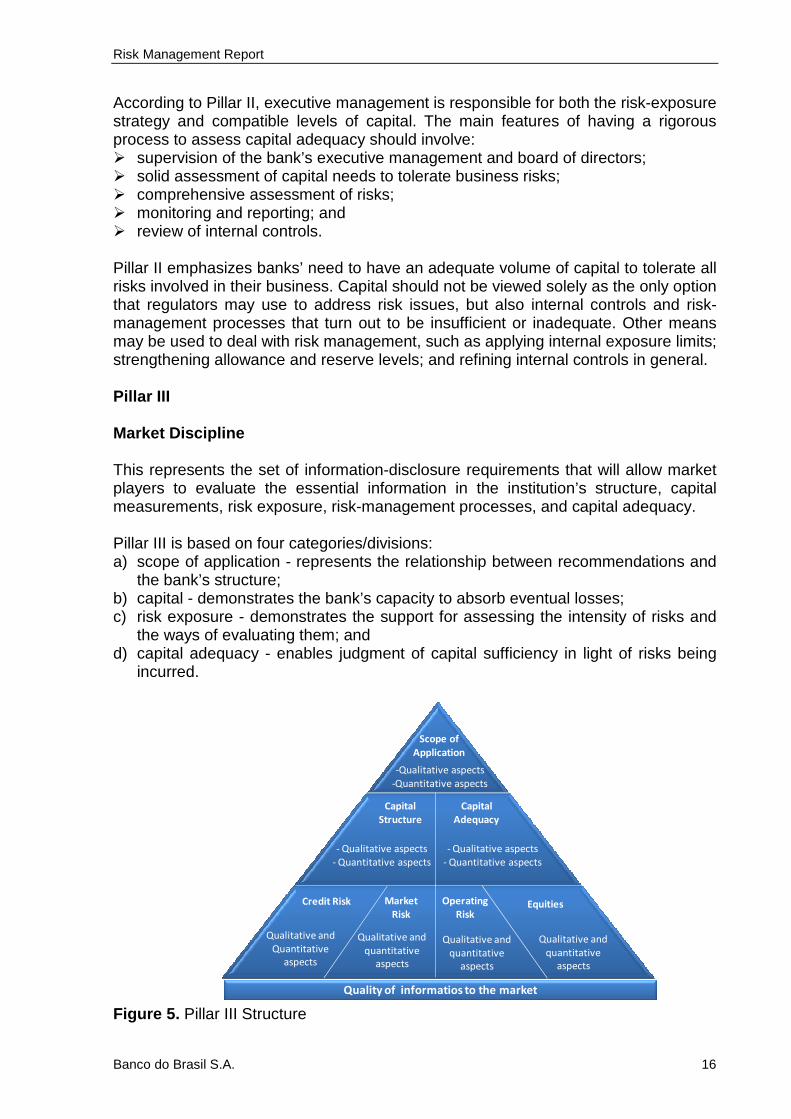
According to Pillar II, executive management is responsible for both the risk-exposure strategy and compatible levels of capital. The main features of having a rigorous process to assess capital adequacy should involve: � supervision of the bank’s executive management and board of directors; � solid assessment of capital needs to tolerate business risks; � comprehensive assessment of risks; � monitoring and reporting; and � review of internal controls. Pillar II emphasizes banks’ need to have an adequate volume of capital to tolerate all risks involved in their business. Capital should not be viewed solely as the only option that regulators may use to address risk issues, but also internal controls and risk-management processes that turn out to be insufficient or inadequate. Other means may be used to deal with risk management, such as applying internal exposure limits; strengthening allowance and reserve levels; and refining internal controls in general. Pillar III Market Discipline This represents the set of information-disclosure requirements that will allow market players to evaluate the essential information in the institution’s structure, capital measurements, risk exposure, risk-management processes, and capital adequacy. Pillar III is based on four categories/divisions: a) scope of application - represents the relationship between recommendations and
the bank’s structure; b) capital - demonstrates the bank’s capacity to absorb eventual losses; c) risk exposure - demonstrates the support for assessing the intensity of risks and
the ways of evaluating them; and d) capital adequacy - enables judgment of capital sufficiency in light of risks being
incurred.
Credit Risk
Qualitative and
Quantitative
aspects
Market
Risk
Qualitative and
quantitative
aspects
Operating
RiskEquities
Capital
Structure
- Qualitative aspects
- Quantitative aspects
Capital
Adequacy
- Qualitative aspects
- Quantitative aspects
Scope of
Application
-Qualitative aspects
-Quantitative aspects
Quality of informatios to the market
Qualitative and
quantitative
aspects
Qualitative and
quantitative
aspects
Figure 5. Pillar III Structure
Risk Management Report
Banco do Brasil S.A. 17
The rationale for creating this third pillar is to complement minimum capital requirements (Pillar I) and the supervisory review process (Pillar II). This means that with the development of rules that encourage and require more open information about banks’ risk profiles and capitalization levels, market players will feel encouraged to exercise discipline on this market. The use of certain transparency levels will be the benchmark for recognition and qualification of a financial institution in a specific capital-measurement approach. Examples include disclosing qualitative information about the structure of internal rating systems and the process to manage and to recognize the mitigation of credit risk. To guarantee compliance with transparency, Basel II calls for supervisors to have a greater number of persuasive instruments, ranging from dialogue with the bank’s management to financial fines, depending on the disclosure deficiency in question. With this format, the role of regulators grows in the sense of accessing and evaluating banks’ positions, given their risk exposures, with an emphasis on their supervisory role. By encouraging open information, the New Accord seeks to potentialize market players’ power of evaluation and action. Basel III Given the guidelines from the Basel Banking Supervision Committee, the Central Bank of Brazil (BACEN) published Notice 20,615 on 2/17/2011, which set out preliminary guidelines and a timetable for implementation in Brazil of the capital structure, leverage, and liquidity requirements known as Basel III. The main definitions and guidelines of this notice are presented below: a) New definition of capital: Tier I Capital of Referential Equity (PR) will consist of
two parts: Principal and Additional Capital;
b) Principal: will essentially consist of capital stock and retained earnings, after deduction of following items from Common Equity Tier 1 (CET1): � deferred tax assets from temporary differences; � deferred tax assets from tax losses and a negative basis for the social
contribution on net income; � premiums paid in acquiring investments based on the expectation of future
profitability and payroll rights, constituted starting on 01/01/2012; � deferred permanent assets and other intangible assets; � assets related to defined-benefit pension funds to which the financial institution
does not have unrestricted access; � holdings of non-controlled insurance firms; � investments in own shares (treasury stocks); � minority holdings that exceed the minimum required of CET1 and Capital
Conservation Buffer, defined in paragraph 16 of the notice, recorded at financial institutions that are part of a financial conglomerate or in the consolidated economic/financial group; and
� funding instruments issued by other financial institutions.
Risk Management Report
Banco do Brasil S.A. 18
Deferred tax assets from temporary differences and significant investments in non-controlled insurance firms may be recognized in the capital structure up to an individual limit of 10% of Common Equity Tier 1, and in the aggregate, along with other capital adjustments cited in paragraph 4 of the notice, up to 15% of Common Principal. These deductions shall occur progressively between 07/01/2012 and 01/01/2018.
c) Additional Capital: the trend is for it to consist of authorized hybrid capital and debt instruments that meet the requirements of loss-absorption during a financial institution’s operation; of subordination; of perpetuity; and of non-cumulative dividends;
d) Tier II Capital: it will likely consist of hybrid capital and debt instruments that do not qualify to be part of Additional Capital, along with subordinated debt instruments. For instruments that do not meet the eligibility requirements set out in Basel III, including the conversion clauses disclosed in the Basel Committee press release on 01/13/2011 (BIS, Press Release 03/2011), a gradual timetable for deductions will be defined, initially forecast as follows: 10% deduction of the nominal value of ineligible instruments, on 01/01/2013, adding 10% a year, so as to be completely excluded by 01/01/2022. The rule states that the BACEN shall publish a new referential equity definition by December 2011;
e) New minimum capital indices: two new indices were created: i) the Minimum
CET1, consisting of the ratio of CET1 to risk-weighted assets (RWA); and ii) Minimum Tier I Capital Index, consisting of the ratio of Tier 1 Capital and RWA;
f) Counterparty credit risk: modifications are anticipated to the capital requirements for counterparty credit risk, both for the standard approach and for internal risk rating (IRR) based approaches, to guarantee the inclusion of relevant risks in the capital structure;
g) Conservation Capital: this amount will complement the minimum regulatory requirements and will consist of elements accepted to comprise CET1;
h) Countercyclical Capita: this should also consist of elements accepted in the
CET1 and will be required in the event of excessive growth of credit associated with the potential accumulation of systemic risk. The established timetable notwithstanding, any increases to the percent of Countercyclical Capital will be published by the BACEN at least 12 months in advance;
i) Leverage Index: Basel III recommends implementation of a Leverage Index as a
complementary capital measure, determined by dividing Tier I Capital by the amount of total exposure. As of 01/01/2018, the minimum required amount for the Leverage Index is scheduled to begin, initially forecast at 3%; and
j) Liquidity measures: two liquidity indices are proposed, one short-term and the
other long-term, as described below: � Short-Term Liquidity Index (LCR): the purpose is to demonstrate that
institutions have highly liquid funds to make it through a scenario of acute
Risk Management Report
Banco do Brasil S.A. 19
financial stress lasting one month, and it will be calculated based on the ratio of highly liquid assets to net outflows over a period of up to 30 days; and
� Long-Term Liquidity Index (NSFR): this seeks to encourage institutions to finance their activities with more stable funding sources and will be calculated by the ratio of total available stable funding to total required stable funding.
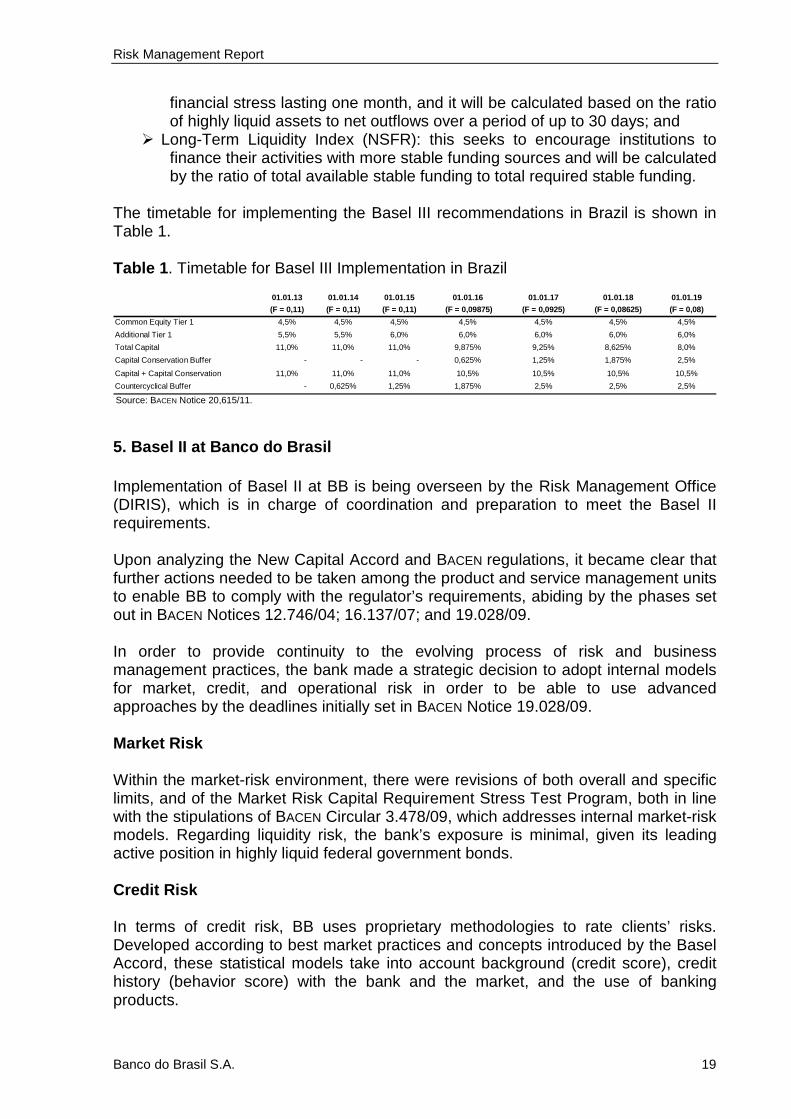
The timetable for implementing the Basel III recommendations in Brazil is shown in Table 1. Table 1 . Timetable for Basel III Implementation in Brazil
01.01.13 01.01.14 01.01.15 01.01.16 01.01.17 01.01.18 01.01.19
(F = 0,11) (F = 0,11) (F = 0,11) (F = 0,09875) (F = 0,0925) (F = 0,08625) (F = 0,08)
Common Equity Tier 1 4,5% 4,5% 4,5% 4,5% 4,5% 4,5% 4,5%
Additional Tier 1 5,5% 5,5% 6,0% 6,0% 6,0% 6,0% 6,0%
Total Capital 11,0% 11,0% 11,0% 9,875% 9,25% 8,625% 8,0%
Capital Conservation Buffer - - - 0,625% 1,25% 1,875% 2,5%
Capital + Capital Conservation 11,0% 11,0% 11,0% 10,5% 10,5% 10,5% 10,5%
Countercyclical Buffer - 0,625% 1,25% 1,875% 2,5% 2,5% 2,5% Source: BACEN Notice 20,615/11.
5. Basel II at Banco do Brasil Implementation of Basel II at BB is being overseen by the Risk Management Office (DIRIS), which is in charge of coordination and preparation to meet the Basel II requirements. Upon analyzing the New Capital Accord and BACEN regulations, it became clear that further actions needed to be taken among the product and service management units to enable BB to comply with the regulator’s requirements, abiding by the phases set out in BACEN Notices 12.746/04; 16.137/07; and 19.028/09. In order to provide continuity to the evolving process of risk and business management practices, the bank made a strategic decision to adopt internal models for market, credit, and operational risk in order to be able to use advanced approaches by the deadlines initially set in BACEN Notice 19.028/09. Market Risk Within the market-risk environment, there were revisions of both overall and specific limits, and of the Market Risk Capital Requirement Stress Test Program, both in line with the stipulations of BACEN Circular 3.478/09, which addresses internal market-risk models. Regarding liquidity risk, the bank’s exposure is minimal, given its leading active position in highly liquid federal government bonds. Credit Risk In terms of credit risk, BB uses proprietary methodologies to rate clients’ risks. Developed according to best market practices and concepts introduced by the Basel Accord, these statistical models take into account background (credit score), credit history (behavior score) with the bank and the market, and the use of banking products.

Risk Management Report
Banco do Brasil S.A. 20
Operational Risk To manage operational risk, Banco do Brasil - adhering to best market practices - monitors operational losses by making use of systematized internal databases, exposure limits, and key risk indicators, in addition to risk matrices to evaluate relevant outsourced services. Seeking continual improvement of the operational-risk management process, in 2010 BB implemented specific limits for operational losses related to “Labor Issues”, “Business Failures”, “Process Failures” and “External Fraud and Theft”, with the goal of providing more flexibility when proposing mitigation actions. Particularly important was the work done to adjust to the guidelines published by the BACEN in Notice 19.217/09, which involved using four essential elements in the internal model for measuring operational risk: Internal Database, External Database, Scenario Analysis, Internal Control Factors, and Business Environment. To prevent, correct, or inhibit weaknesses that might cause risks to BB, and to reduce losses and to strengthen the risk culture, the Technical Risk Recommendation was created, issued to units that manage processes or products when a need is identified to take a loss-mitigation action, and to guarantee compliance with the responsibilities defined in the risk-management phases.
Risk Management Report
Banco do Brasil S.A. 21
6. Regulations The BACEN, in concert with the procedures of regulators in developed countries, has issued a series of prudential regulations. Current regulations can be consulted on its website.
Risk Management Report
Banco do Brasil S.A. 22
7. Financial Conglomerate Risk management in the Banco do Brasil financial conglomerate is comprehensive and covers credit, market, liquidity, and operational risks. Management activities are performed by specific, specialized structures, pursuant to objectives, policies, strategies, processes, and systems described in each of these risks. Even though activities focus on credit, market, liquidity, and operational risk, the bank uses mechanisms to guarantee capital sufficiency to cover other risks incurred.

Risk Management Report
Banco do Brasil S.A. 23
8. Risk Management 8.1 Financial Conglomerate 8.1.1 Credit Risk Management Objectives Exposures subject to credit risk are a big part of Banco doBrasil’s assets. That is why risk management of these exposures is fundamental for the bank to achieve its objectives. Banco do Brasil’s credit risk is managed according to best market practices and following banking supervision and regulatory rules. It seeks to identify, measure, control, and mitigate the risk of exposure, contribute to maintaining the bank’s health and solvency, and guarantee that shareholders’ interests are being met. Credit-risk management at the financial conglomerate involves credit policy, management strategies, management processes, operational procedures, and management systems, as shown in the figure below:
CREDIT POLICY
MANAGEMENT PROCESSES
OPERATIONAL PROCEDURES
MANAGEMENT SYSTEMS
MANAGEMENT STRATEGY
CA
CRG
DICRE
DIRAO
DIRIS
STRATEGIC LEVEL
RISK MANAGEMENT STRUCTUREOPERATIONAL LEVEL
SRC
TATICAL LEVEL
Figure 6. Credit-risk management Note: CA = Board of Directors; CRG = Global Risk Committee; SRC = Credit Risk Subcommittee; DICRE = Credit Board; DIRAO = Asset Restructuring Board; DIRIS = Risk Management Board.
Risk Management Report
Banco do Brasil S.A. 24
In accordance with CMN Decision 3.721/09, the Board of Directors (CA) approved the credit-risk management structure of Banco do Brasil, consisting of the Global Risk Committee (CRG), Credit Risk Subcommittee (SRC), Credit Board (DICRE), Operational Asset Restructuring Board (DIRAO), and Risk Management Board (DIRIS). Given that the DIRIS is the unit at the bank in charge of overall risk management and does not have any ties to the management of third-party funds or to performing transactions subject to credit risk, the CA appointed the Director of Risk Management as the person in charge of BB’s credit-risk management with respect to the BACEN. This credit-risk management structure is compatible with the nature of transactions, the complexity of products and services, and in proportion to the size of the credit-risk exposure incurred by Banco do Brasil. Credit Policy Banco do Brasil’s credit policy contains strategic guidelines to direct credit-risk management actions at the financial conglomerate. It is approved by the Board of Directors and reviewed every year. It is available to all employees, and applies to all business that involves credit risk. The policy is divided up into four blocks: General Aspects, Assuming Credit Risk, Collections and Credit Recovery, and Credit Risk Management. Each block has a broad set of statements that encompass all stages of credit-risk management at Banco do Brasil. Listed below are a few of the topics addressed in Banco do Brasil’s credit policy: � concept of credit risk; � conditions for assuming risk; � separation of duties; � guidelines for collections and credit
recovery; � joint decisions; � expected loss, economic and regulatory
capital; � risk appetite; � allowance and capital levels; � risk limits; � stress tests and sensitivity analysis; and � client rating; � capital planning

Risk Management Report
Banco do Brasil S.A. 25
Management Strategies Management strategies are established by the CA and the CRG, and implemented tactically by the SRC, all in accordance with the credit-risk management objectives and credit policy of Banco do Brasil. The CRG consists of the President and Vice Presidents of the units involved with credit-risk management. The Committee sets strategies for credit-risk management, defines overall exposure limits, and approves capital allocation. The SRC was created to make faster decisions about credit-risk management. It is a tactical structure, subordinated to the CRG, which has delegated decision-making authority to deliberate on certain issues, instructing the CRG on other issues. The SRC consists of officers from the units involved in credit-risk management, coordinated by the Director of the Risk Management Board. Credit-risk management strategies guide actions at the operational level. Strategic decisions include: � materializing the risk appetite of Banco do Brasil; � approving credit-risk management models; � setting goals for fulfillment, recovery, maximum loss, and quality of the credit
portfolio; � setting risk and concentration limits; � keeping adequate levels of allowances and capital; and � management of the risk-return ratio Management Processes According to Banco do Brasil’s credit-risk management structure, the Credit (DICRE), Operational Asset Restructuring (DIRAO) and Risk Management (DIRIS) units are responsible for implementing strategic decisions approved by the CA, CRG and SRC, keeping exposure at the risk levels set by the executive management. The DICRE focuses on clients and operations. Its main products are: registration, marketing studies and information on economic sectors, methodologies (risk, risk components, and credit limits), risk analysis (clients, operations, projects, economic sectors, countries, and projects), pre-validation and monitoring of risk methodology and credit-risk components, study of investment and leasing transactions, economic/financial evaluation and diagnosis of businesses/business groups, monitoring the credit portfolio, and producing inputs to price credit risk. The DIRAO deals with, collects, and recovers problem credits. Its main products are: models to rate clients under collections and recovery, collection and recovery strategies, recovery quality indicators, management of collections and recovery channels, rescheduling debt, restructuring transactions, setting negotiating floors and methodologies for dealing with problem credits and/or defaults. The DIRIS focuses on managing the credit risk of aggregate positions. Its main products are: policies, risk limits, credit risk models, information on credit risk,

Risk Management Report
Banco do Brasil S.A. 26
indicators of credit portfolio quality, capital allocation as a function of risk, management of the credit portfolio’s risk, and monitoring of risk versus return.
DICRE DIRAO DIRIS Prepare sector studies and a panorama
Manage default portfolio
Control risk limits for aggregate exposure
Analyze clients and set limits
Develop models and strategies to deal with, collect, and recover problem credits
Determine regulatory capital for credit risk
Analyze credit risk of transactions
Manage collection and recovery channels
Determine economic capital for credit risk
Create and monitor credit-risk methodologies
Propose strategies to pursue debts in higher courts
Manage credit portfolio
Figure 7. Credit-risk management structure
The processes and procedures of the credit-risk management structure are validated and evaluated by two internal units at different points in time, a fact that ensures adequate separation of duties and the independence of work. The Internal Control Board (DICOI) is responsible for validating the financial conglomerate’s risk determination and measurement models and the bank’s internal control system. Internal Audit (AUDIT) periodically evaluates credit-risk management processes to verify whether they are consistent with the strategic guidelines, credit policy, and internal rules. In addition to the units above, independent auditors analyze some of the processes and procedures of credit-risk management, helping to verify whether they are in accordance with regulatory requirements and internal definitions. Communication and Information Processes Disclosure of credit-risk information is a continual and ongoing process. The premises considered when selecting and disclosing information include: best practices, banking laws, user needs, the bank’s interests, confidentiality, and the relevance of the information. The communication and information on credit-risk management is provided to internal and external clients, pursuant to the following processes:
Risk Management Report
Banco do Brasil S.A. 27
Communication process for internal clients The operational units of the credit-risk management structure always communicate with upper management about risk exposure in order to monitor management actions and for executive management to make decisions. The communication process involves several reports on credit-risk management. These documents are produced periodically and are the result of analyses done by professionals from the units. They demonstrate the credit risk of all exposure or in certain portfolios, such as: � Credit Risk Exposure Portfolio Report; � BB vs. SFN Comparison Report (BACEN data); � Bank Comparison Report (accounting data from banks); � Capital Management Report; � Risk-Return Analysis of the Credit Portfolio; � Stress Monitoring Report; and � Risk Panel. Communication process for external clients The operational units of the credit-risk management structure produce information for external users and send it to the Investor Relations Unit (IRU). The IRU discloses this information to the market, as a transparent governance practice, allowing investors and interested parties to monitor risk-management actions and the evolution of credit risk, and to prove the bank’s capital adequacy to cover all of the risks that it has assumed. Information for external users is provided on a publicly accessible location, easily found on the bank’s website. The following documents are published: � Performance Analysis Report; � Notes to the Financial Statements; and � Annual Report.
Measurement Systems Credit risk is measured in many ways: by default, arrears, portfolio quality, allowance for doubtful accounts, concentration, expected losses, and regulatory and economic capital requirements, among others. The quantity and nature of our operations, the diversity and complexity of our products and services, and the volume exposed to credit risk require systematic measurement of credit risk at Banco do Brasil. The bank has enough databases and corporate-system infrastructure to ensure comprehensive measurement of credit risk. Some of these risk measures are highlighted below.
Risk Management Report
Banco do Brasil S.A. 28
Concentration The bank developed and implemented a system to measure and monitor credit-risk concentration in the corporate portfolio. The model is based on the Herfindahl Index. It evaluates concentration based on borrowers’ credit risk, and it considers the interrelationship of the various economic sectors that comprise the corporate credit portfolio. Expected Loss The bank also developed specific methodologies and proprietary systems to determine risk components1 that are used to determine expected loss and economic capital. Expected loss is used in numerous processes and procedures, such as: pricing products and services, verifying allowance levels, and calculating risk-adjusted return on capital (RAROC). In addition, an analysis of historic expected loss provides important information about the behavior of credit risk. Regulatory and Economic Capital Requirements The bank measures the regulatory capital requirements for credit risk through a standard simplified approach, whose procedures for calculating Risk-Weighted Exposure were published by the BACEN in Circular 3.360/07, and updates. These procedures were implemented in a proprietary system that determines the capital requirements quickly and securely, allowing for timely verification of the bank’s solvency under the regulator’s rules. The bank uses regulatory-capital information to assess the efficiency of capital allocation and planning. The bank developed an internal model to measure economic capital whose theoretical foundation is based on an actuarial approach that is now very widely used in the banking industry. Because it was modeled internally, this measure better reflects the risk profile of exposure, which is why it is used managerially in calculating RAROC and in measuring the Herfindahl concentration index. Additionally, the analysis of the historic evolution of economic capital provides important information on capital consumption resulting from exposure of certain clients and/or segments of clients.
1 It is in the refining stage, to comply with regulatory requirements.
Risk Management Report
Banco do Brasil S.A. 29
Mitigation Policy Banco do Brasil has a conservative attitude toward credit risk. When doing any business subject to credit risk, the bank’s general rule is to tie it to a mechanism that will provide partial or complete hedging of the risk incurred. In managing credit risk on the aggregate level, to keep exposure within the risk levels determined by executive management, the bank seeks to transfer or to share credit risk. The use of credit-risk mitigating instruments is stated in the credit policy, present in strategic decisions, and formalized in credit rules, affecting all levels of the organization and covering all stages of credit-risk management. Credit rules provide clear, comprehensive guidelines for the operational units. Among other aspects, the rules address ratings, requirements, choices, assessments, formalization, control, and reinforcement of guarantees, assuring the adequacy and sufficiency of the mitigator throughout the transaction’s cycle. Strategies to Monitor the Effectiveness of Mitigato rs Strategies that monitor the effectiveness of credit-risk mitigation consist of: � continually monitoring credit-risk exposure and comparing the default index with
the level of allowances for exposure, with and without related guarantees; � constantly managing capital and comparing regulatory capital requirements with
economic capital consumption of exposure, with and without related guarantees; and
� periodically evaluating information from collection and recovery of credits and determining which mitigators contribute effectively to exercising the bank’s rights.
Processes for Monitoring the Effectiveness of Mitig ators Monitoring the effectiveness of mitigators is part of the bank’s credit-risk management processes. For example, there are the processes to monitor credit-risk exposure, the risk ratings of credit transactions, capital management, and collections and recovery of credits. The processes of monitoring credit-risk exposure and rating credit-transaction risks produce important information for verifying the effectiveness of mitigating instruments. A low default index in certain segments of the credit portfolio and a low level of allowances in certain transactions may mean that the existence of guarantees tied to exposure is lowering credit risk. The capital management process allows for verifying whether a lower regulatory capital requirement and/or less consumption of economic capital in a given product or service is related to the existence of guarantees tied to exposure to credit risk, lowering the bank’s exposure to credit risk. The process of collecting and recovering credits generates information that enables the bank to verify which mitigating factors were the most important for receiving credits in default and for recovering problem credits, allowing for a revision of the criteria for choosing guarantees, allowances, and capital allocation.
Risk Management Report
Banco do Brasil S.A. 30
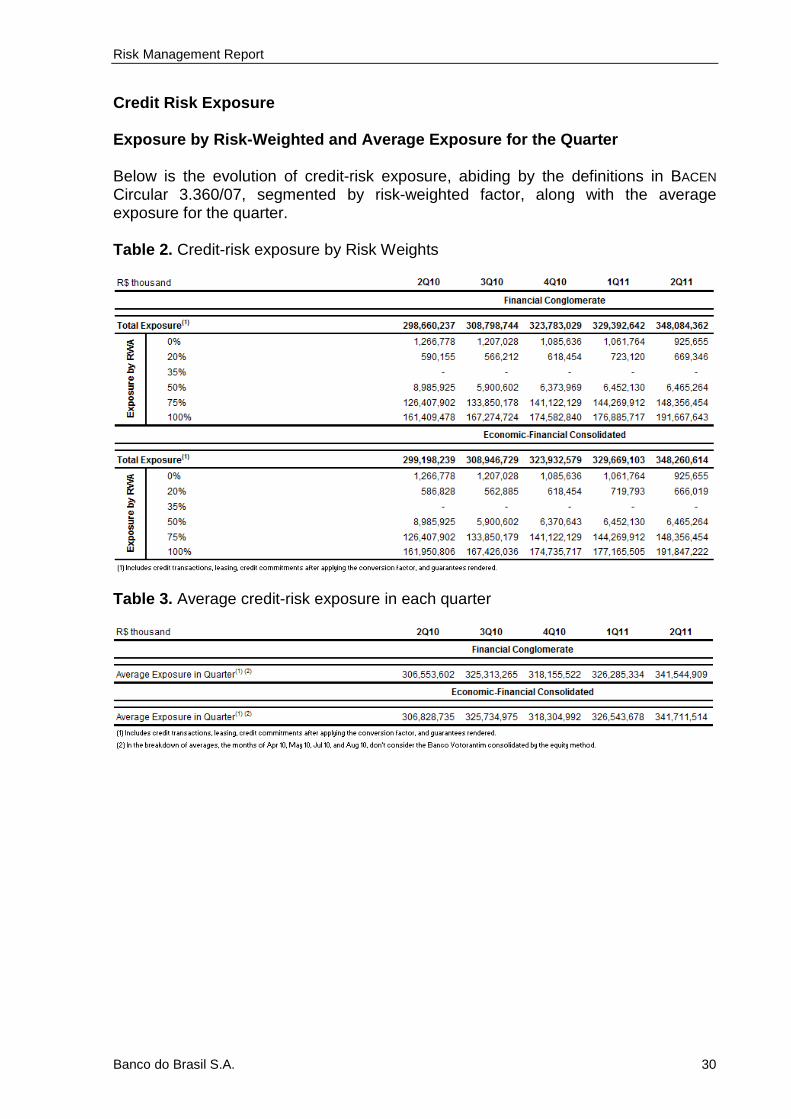
Credit Risk Exposure Exposure by Risk-Weighted and Average Exposure for the Quarter Below is the evolution of credit-risk exposure, abiding by the definitions in BACEN Circular 3.360/07, segmented by risk-weighted factor, along with the average exposure for the quarter. Table 2. Credit-risk exposure by Risk Weights
Table 3. Average credit-risk exposure in each quarter
Risk Management Report
Banco do Brasil S.A. 31
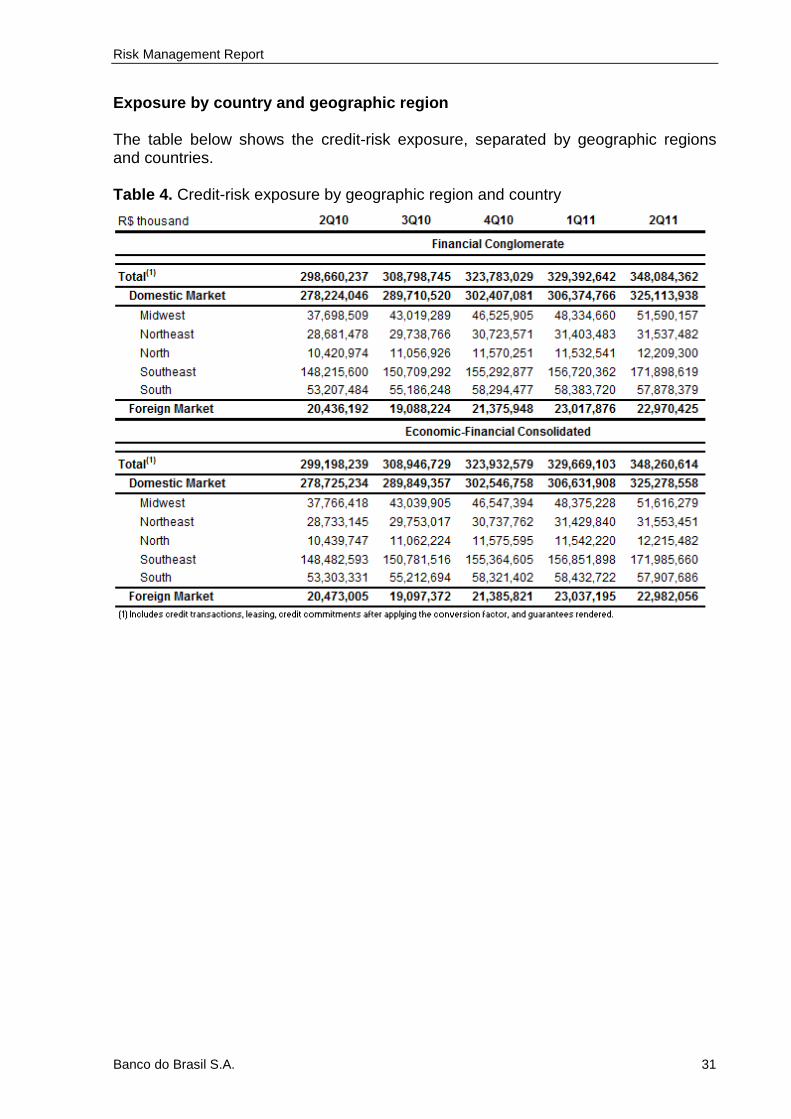
Exposure by country and geographic region The table below shows the credit-risk exposure, separated by geographic regions and countries. Table 4. Credit-risk exposure by geographic region and country
Risk Management Report
Banco do Brasil S.A. 32
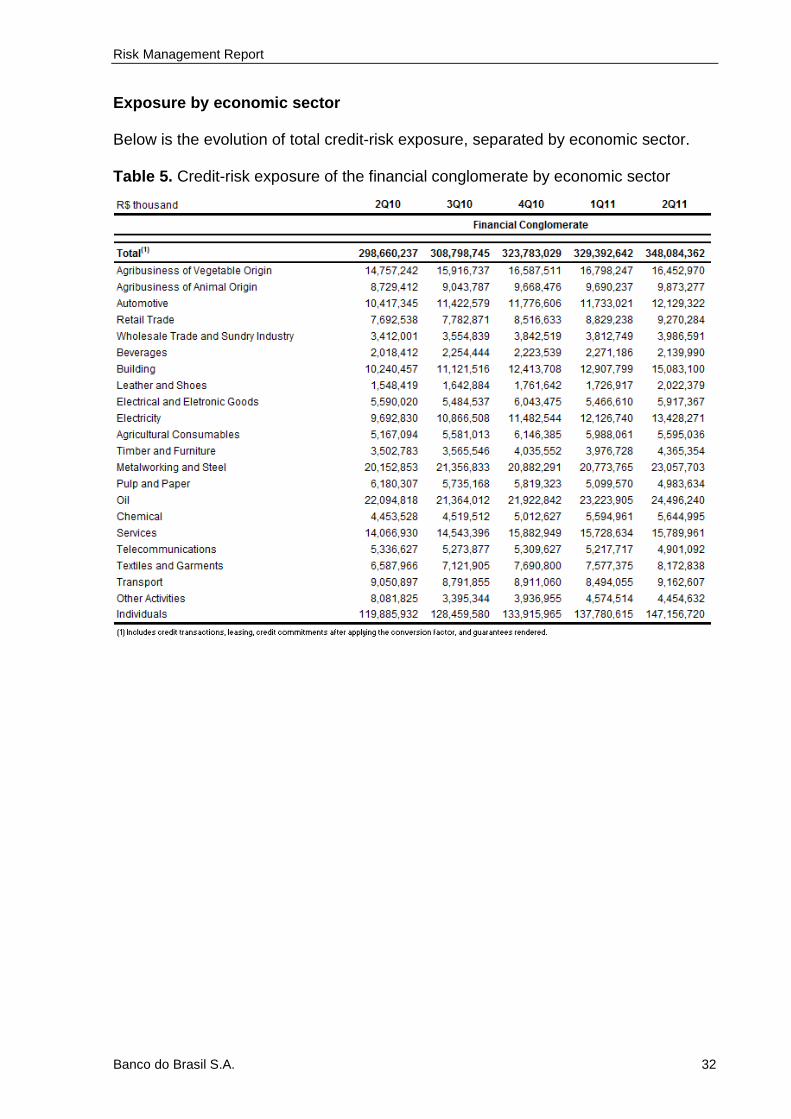
Exposure by economic sector Below is the evolution of total credit-risk exposure, separated by economic sector. Table 5. Credit-risk exposure of the financial conglomerate by economic sector

Risk Management Report
Banco do Brasil S.A. 33
Table 6. Credit-risk exposure of the economic-financial consolidated group by economic sector:
Credit-risk exposure by arrears period The table below shows the portfolio, by arrears period. Table 7. Amount of transactions in arrears
R$ thousand Up to 60 days From 61 to 90 days From 91 to 180 days Over 180 days
2Q10 6,669,589 1,164,539 2,811,537 5,255,302
3Q10 6,275,003 1,347,684 2,894,201 5,407,058
4Q10 5,969,969 1,144,144 3,231,475 4,146,733
1Q11 6,253,704 1,210,927 2,688,850 4,312,166
2Q11 6,081,696 1,293,508 2,961,151 3,883,726
Note: This information covers the branches of BB in Brazil and abroad (BB-Multiple Bank).
Risk Management Report
Banco do Brasil S.A. 34
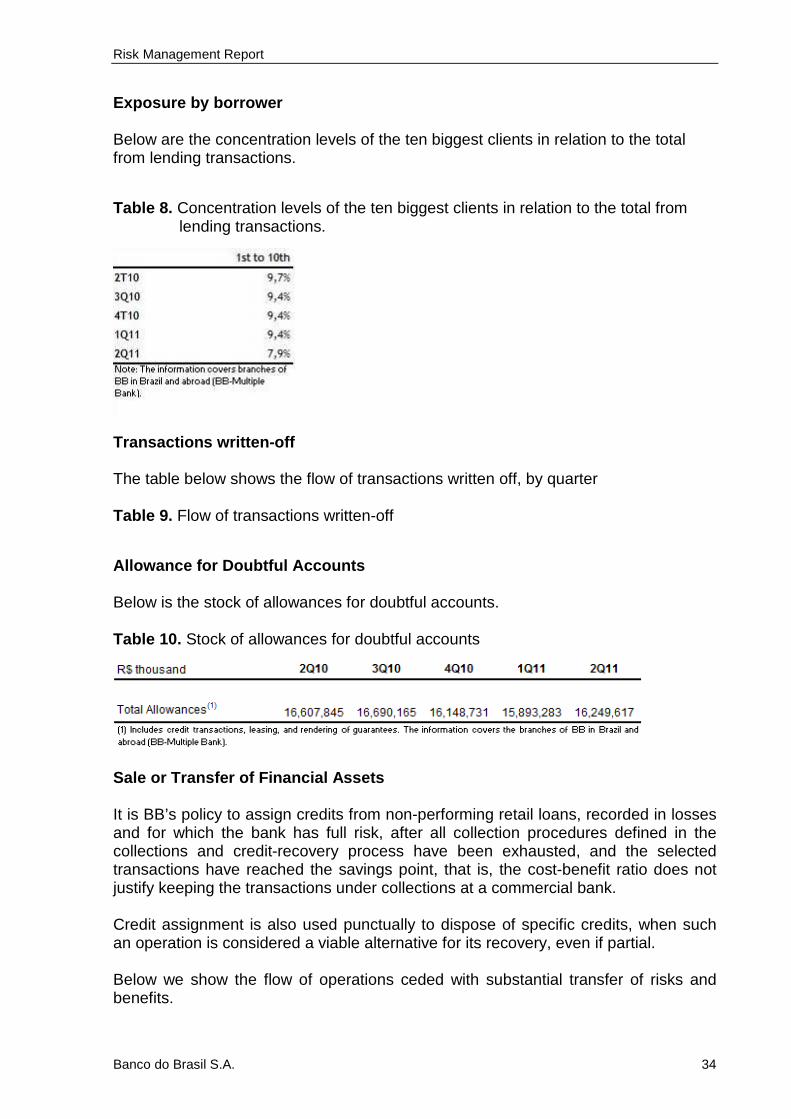
Exposure by borrower Below are the concentration levels of the ten biggest clients in relation to the total from lending transactions.
Table 8. Concentration levels of the ten biggest clients in relation to the total from lending transactions.
Transactions written-off The table below shows the flow of transactions written off, by quarter Table 9. Flow of transactions written-off
Allowance for Doubtful Accounts Below is the stock of allowances for doubtful accounts. Table 10. Stock of allowances for doubtful accounts
Sale or Transfer of Financial Assets It is BB’s policy to assign credits from non-performing retail loans, recorded in losses and for which the bank has full risk, after all collection procedures defined in the collections and credit-recovery process have been exhausted, and the selected transactions have reached the savings point, that is, the cost-benefit ratio does not justify keeping the transactions under collections at a commercial bank. Credit assignment is also used punctually to dispose of specific credits, when such an operation is considered a viable alternative for its recovery, even if partial. Below we show the flow of operations ceded with substantial transfer of risks and benefits.
Risk Management Report
Banco do Brasil S.A. 35
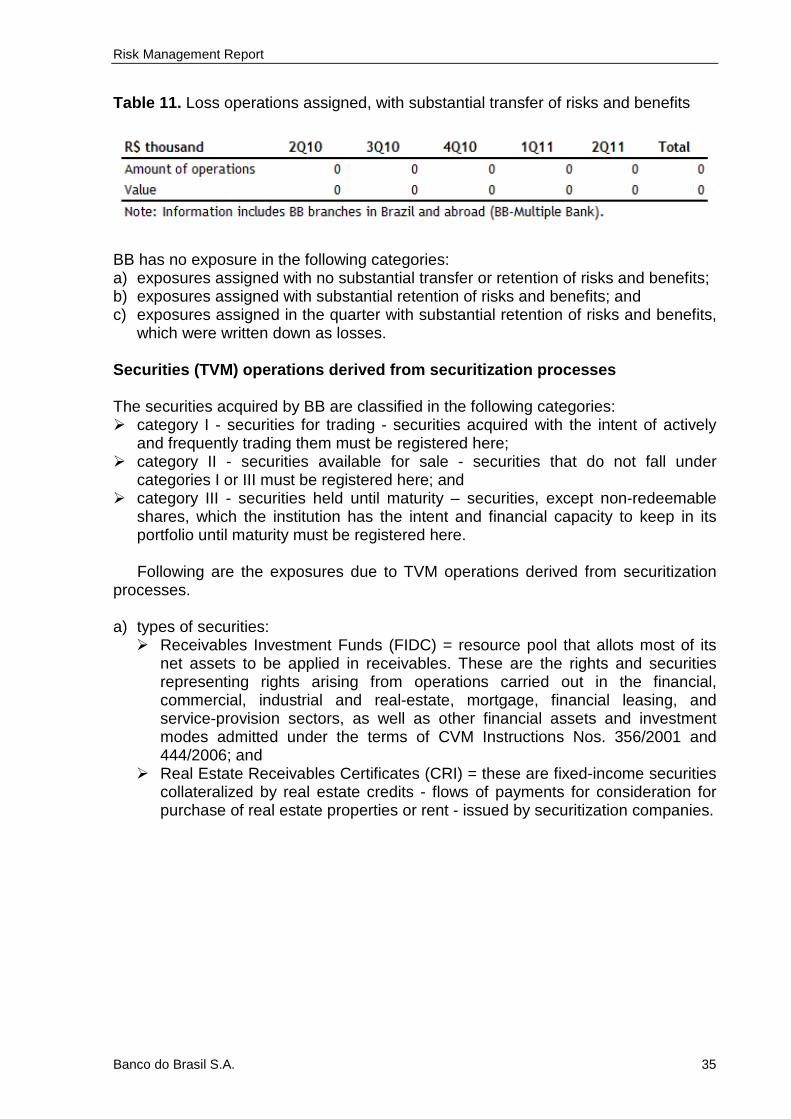
Table 11. Loss operations assigned, with substantial transfer of risks and benefits
BB has no exposure in the following categories: a) exposures assigned with no substantial transfer or retention of risks and benefits; b) exposures assigned with substantial retention of risks and benefits; and c) exposures assigned in the quarter with substantial retention of risks and benefits,
which were written down as losses. Securities (TVM) operations derived from securitiza tion processes The securities acquired by BB are classified in the following categories: � category I - securities for trading - securities acquired with the intent of actively
and frequently trading them must be registered here; � category II - securities available for sale - securities that do not fall under
categories I or III must be registered here; and � category III - securities held until maturity – securities, except non-redeemable
shares, which the institution has the intent and financial capacity to keep in its portfolio until maturity must be registered here.
Following are the exposures due to TVM operations derived from securitization
processes. a) types of securities:
� Receivables Investment Funds (FIDC) = resource pool that allots most of its net assets to be applied in receivables. These are the rights and securities representing rights arising from operations carried out in the financial, commercial, industrial and real-estate, mortgage, financial leasing, and service-provision sectors, as well as other financial assets and investment modes admitted under the terms of CVM Instructions Nos. 356/2001 and 444/2006; and
� Real Estate Receivables Certificates (CRI) = these are fixed-income securities collateralized by real estate credits - flows of payments for consideration for purchase of real estate properties or rent - issued by securitization companies.
Risk Management Report
Banco do Brasil S.A. 36
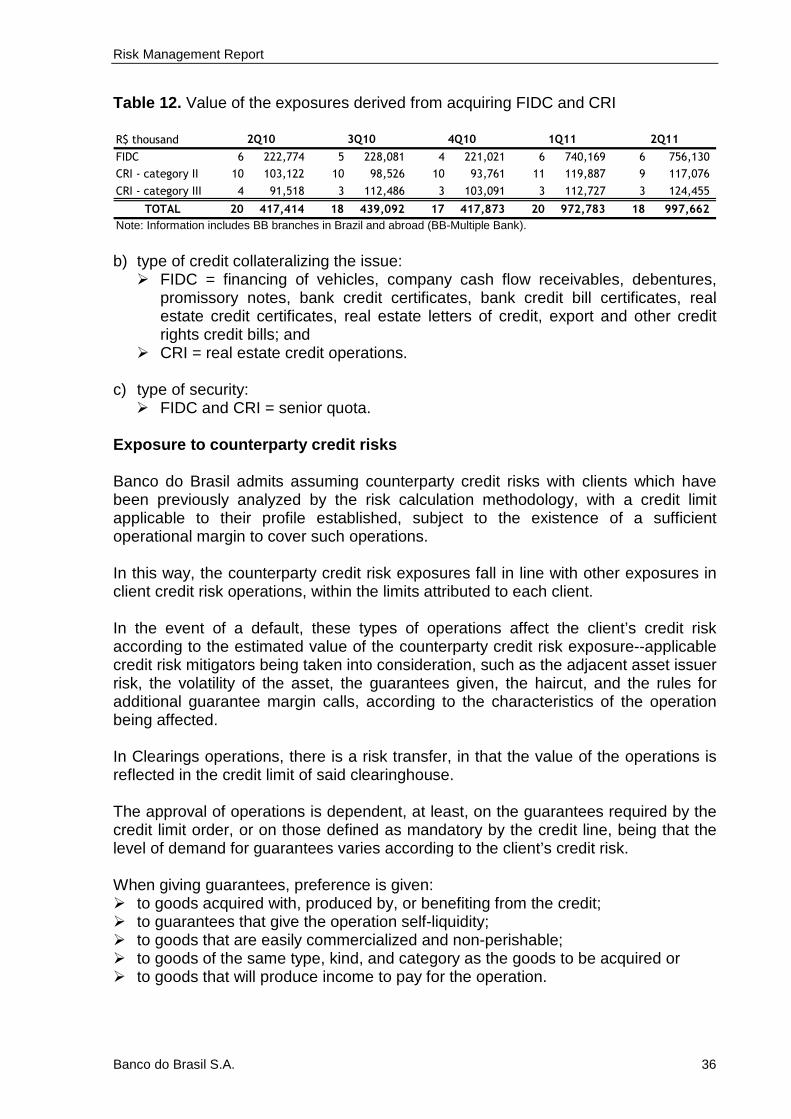
Table 12. Value of the exposures derived from acquiring FIDC and CRI R$ thousand
FIDC 6 222,774 5 228,081 4 221,021 6 740,169 6 756,130
CRI - category II 10 103,122 10 98,526 10 93,761 11 119,887 9 117,076
CRI - category III 4 91,518 3 112,486 3 103,091 3 112,727 3 124,455
TOTAL 20 417,414 18 439,092 17 417,873 20 972,783 18 997,662
Note: Information includes BB branches in Brazil and abroad (BB-Multiple Bank).
4Q10 1Q11 2Q112Q10 3Q10
b) type of credit collateralizing the issue: � FIDC = financing of vehicles, company cash flow receivables, debentures,
promissory notes, bank credit certificates, bank credit bill certificates, real estate credit certificates, real estate letters of credit, export and other credit rights credit bills; and
� CRI = real estate credit operations. c) type of security:
� FIDC and CRI = senior quota. Exposure to counterparty credit risks Banco do Brasil admits assuming counterparty credit risks with clients which have been previously analyzed by the risk calculation methodology, with a credit limit applicable to their profile established, subject to the existence of a sufficient operational margin to cover such operations. In this way, the counterparty credit risk exposures fall in line with other exposures in client credit risk operations, within the limits attributed to each client. In the event of a default, these types of operations affect the client’s credit risk according to the estimated value of the counterparty credit risk exposure--applicable credit risk mitigators being taken into consideration, such as the adjacent asset issuer risk, the volatility of the asset, the guarantees given, the haircut, and the rules for additional guarantee margin calls, according to the characteristics of the operation being affected. In Clearings operations, there is a risk transfer, in that the value of the operations is reflected in the credit limit of said clearinghouse. The approval of operations is dependent, at least, on the guarantees required by the credit limit order, or on those defined as mandatory by the credit line, being that the level of demand for guarantees varies according to the client’s credit risk. When giving guarantees, preference is given: � to goods acquired with, produced by, or benefiting from the credit; � to guarantees that give the operation self-liquidity; � to goods that are easily commercialized and non-perishable; � to goods of the same type, kind, and category as the goods to be acquired or � to goods that will produce income to pay for the operation.
Risk Management Report
Banco do Brasil S.A. 37
In order to earmark goods as a guaranty, they are valued by a technical appraisal or by an opinion of value, the validity of which is up to twelve months. In the case of a personal guaranty, the economic-financial situation of guarantors or sureties is analyzed, as are the Bank’s direct and indirect liabilities, with debts to third parties being taken into account, especially tax, social welfare, and labor debts. When accepting a good or right as guaranty, the maximum value considered is reached by applying a percentage on the value of said good or right, according to the type and kind of good. In the case of a trade bill or check in custody, the maximum value is obtained by applying the percentage of advance corresponding to the Annual Liquidity Ratio (ILA) of the client’s portfolio on the amount given as a guaranty. Goods received as guaranty in credit operations must be backed until the operation is concluded, or, in the case of funds given as guaranty, remain frozen until the operation is concluded. Guarantees linked to credit operations are registered on a corporate basis, which allows automatic control of the linked goods and rights, and the generation of administrative information, such as the guaranty sufficiency analysis, and an adequacy analysis. For operations subject to counterparty credit risks, Banco do Brasil follows the provisions of BACEN Circular 3,068/01, using such risks as a parameter when adjusting the market value of such exposures, which affects the profit/loss for the period, or a Net Worth highlighted account, subject to the exposure’s classification. Below is the notional value of contracts subject to counterparty credit risks to be liquidated in clearing house liquidation systems, in which the house acts as central counterparty.
Risk Management Report
Banco do Brasil S.A. 38
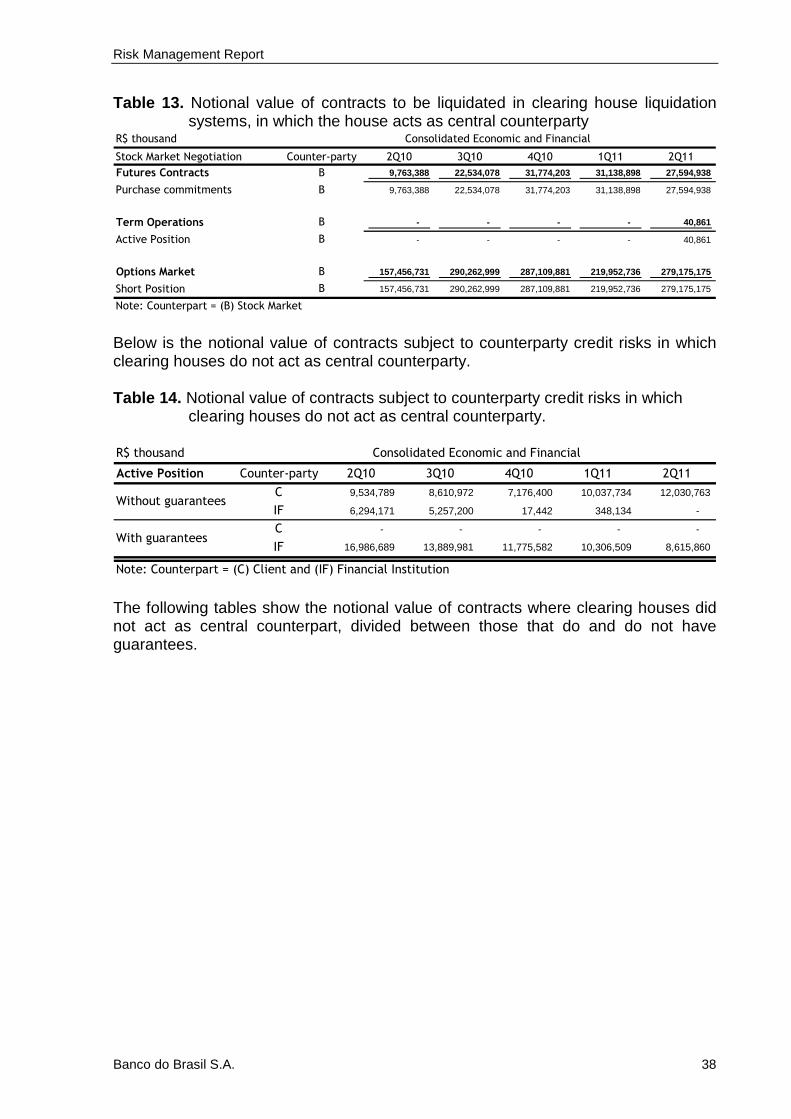
Table 13. Notional value of contracts to be liquidated in clearing house liquidation systems, in which the house acts as central counterparty
R$ thousand
Stock Market Negotiation Counter-party 2Q10 3Q10 4Q10 1Q11 2Q11
Futures Contracts B 9,763,388 22,534,078 31,774,203 31,138,898 27,594,938
Purchase commitments B 9,763,388 22,534,078 31,774,203 31,138,898 27,594,938
Term Operations B - - - - 40,861
Active Position B - - - - 40,861
Options Market B 157,456,731 290,262,999 287,109,881 219,952,736 279,175,175
Short Position B 157,456,731 290,262,999 287,109,881 219,952,736 279,175,175
Consolidated Economic and Financial
Note: Counterpart = (B) Stock Market Below is the notional value of contracts subject to counterparty credit risks in which clearing houses do not act as central counterparty. Table 14. Notional value of contracts subject to counterparty credit risks in which
clearing houses do not act as central counterparty. R$ thousand
Active Position Counter-party 2Q10 3Q10 4Q10 1Q11 2Q11
C 9,534,789 8,610,972 7,176,400 10,037,734 12,030,763
IF 6,294,171 5,257,200 17,442 348,134 -
C - - - - -
IF 16,986,689 13,889,981 11,775,582 10,306,509 8,615,860
Note: Counterpart = (C) Client and (IF) Financial Institution
Consolidated Economic and Financial
Without guarantees
With guarantees
The following tables show the notional value of contracts where clearing houses did not act as central counterpart, divided between those that do and do not have guarantees.

Risk Management Report
Banco do Brasil S.A. 39
Table 15. Notional value of contracts where clearing houses did not act as central counterparty, and which do not have guarantees.
R$ thousand 2Q10 3Q10 4Q10 1Q11 2Q11
Active Position 25,230,043 26,438,635 23,016,639 22,099,886 25,625,395
22,984,196 22,248,987 21,149,157 20,319,074 21,411,855
Inter-bank deposits 22,242,243 19,453,846 16,428,027 15,323,033 16,619,367
Foreign Currency Investments 741,953 2,795,141 4,721,130 4,996,041 4,792,488
Operations to liquidate in the purchase
and sale of foreign currency, securities,
and gold no in the spot market
1,666,810 2,212,787 86,576 67,421 2,031,195
Currency arbitrage 1,507,810 1,464,881 86,576 67,421 54,163
Inter-bank exchange 159,001 747,906 - - 1,977,032
Operations to liquidate in the purchase
and sale of foreign currency, securities,
and gold in the spot market 579,037 1,976,860 1,780,906 1,713,391 2,182,345
Currency arbitrage 295,486 617,701 610,517 224,719 111,669
Inter-bank exchange 283,551 1,359,159 1,170,389 1,488,672 2,070,676
Financial Conglomerate
Table 16. Notional value of contracts where clearing houses did not act as central
counterparty, and which do have guarantees.
R$ thousand 2Q10 3Q10 4Q10 1Q11 2Q11
Long position 101,515,736 101,781,289 78,507,871 117,081,032 115,395,029
Repos donated 101,515,736 101,781,289 78,507,871 117,081,032 115,395,029
Short position – without brokerage 246,617,835 244,919,234 198,978,917 276,706,385 283,758,964
Repos taken – own and third-party portfolios 146,723,571 144,939,574 120,614,973 159,780,091 166,064,996
Repurchase agreements “repos” (Brokerage) 99,894,264 99,979,660 78,363,944 116,926,294 117,693,968
Operations to liquidate in the purchase and sale
of foreign currency, securities, and gold no in
the spot market - - - - 15,230
Inter-bank exchange - - - - 15,230
Operations to liquidate in the purchase and sale
of foreign currency, securities, and gold in the
spot market 1,205,551 212,973 502,200 3,583,018 207,049
Inter-bank exchange 1,205,551 212,973 502,200 3,583,018 207,049
Financial Conglomerate
The following table shows the positive gross value of contracts subject to counterparty credit risks, including derivatives, outstanding operations, asset loans and repo transactions, not taking into account the positive values from compensation agreements, as set forth in CMN Resolution 3.263/05.
Risk Management Report
Banco do Brasil S.A. 40
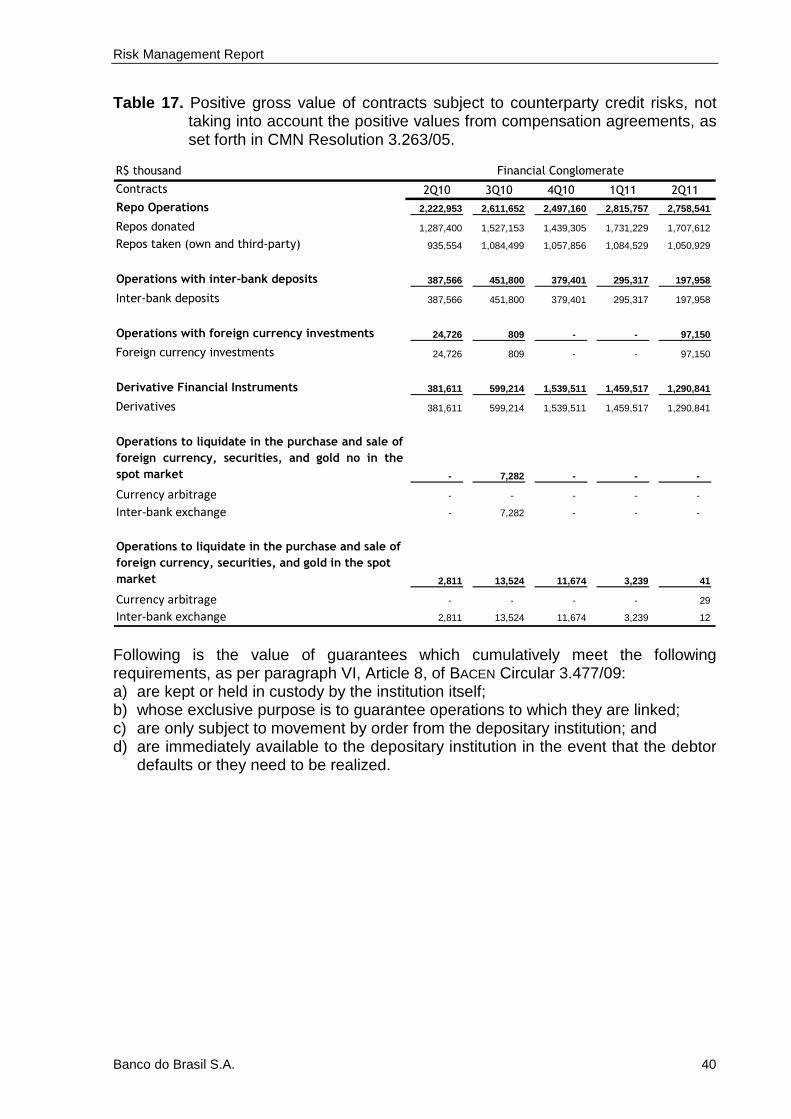
Table 17. Positive gross value of contracts subject to counterparty credit risks, not taking into account the positive values from compensation agreements, as set forth in CMN Resolution 3.263/05.
R$ thousand
Contracts 2Q10 3Q10 4Q10 1Q11 2Q11
Repo Operations 2,222,953 2,611,652 2,497,160 2,815,757 2,758,541
Repos donated 1,287,400 1,527,153 1,439,305 1,731,229 1,707,612
Repos taken (own and third-party) 935,554 1,084,499 1,057,856 1,084,529 1,050,929
Operations with inter-bank deposits 387,566 451,800 379,401 295,317 197,958
Inter-bank deposits 387,566 451,800 379,401 295,317 197,958
Operations with foreign currency investments 24,726 809 - - 97,150
Foreign currency investments 24,726 809 - - 97,150
Derivative Financial Instruments 381,611 599,214 1,539,511 1,459,517 1,290,841
Derivatives 381,611 599,214 1,539,511 1,459,517 1,290,841
Operations to liquidate in the purchase and sale of
foreign currency, securities, and gold no in the
spot market - 7,282 - - -
Currency arbitrage - - - - -
Inter-bank exchange - 7,282 - - -
Operations to liquidate in the purchase and sale of
foreign currency, securities, and gold in the spot
market 2,811 13,524 11,674 3,239 41
Currency arbitrage - - - - 29
Inter-bank exchange 2,811 13,524 11,674 3,239 12
Financial Conglomerate
Following is the value of guarantees which cumulatively meet the following requirements, as per paragraph VI, Article 8, of BACEN Circular 3.477/09: a) are kept or held in custody by the institution itself; b) whose exclusive purpose is to guarantee operations to which they are linked; c) are only subject to movement by order from the depositary institution; and d) are immediately available to the depositary institution in the event that the debtor
defaults or they need to be realized.

Risk Management Report
Banco do Brasil S.A. 41
Table 18. The value of guarantees which cumulatively meet the requirements of paragraph VI, Article 8, of Bacen Circular 3.477/09:
R$ thousand 2Q10 3Q10 4Q10 1Q11 2Q11
Financial investments – fixed-income Checks 3,062,957 2,953,887 3,340,184 3,219,978 3,402,271
Checks 423,334 537,538 616,925 630,871 702,033
Agricultural products – with warrant 97,610 87,897 81,524 86,972 56,206
Financial investments – variable yield 137 130 875 926 155
TOTAL 3,584,039 3,579,451 4,039,509 3,938,746 4,160,666
Note: Information includes BB branches in Brazil and abroad (BB-Multiple Bank). According to the classification of types of guarantees adopted by the BACEN, we have identified those which cumulatively meet the conditions established in BACEN Circular 3.477/09, being that for this calculation we have considered the value committed as guaranty to the linked operation. BB has no compensation and liquidation of obligations agreements, as defined in CMN Resolution 3.263/05. The table below shows the notional value of credit derivatives, divided by type of operation. Table 19. Notional value of credit derivatives
R$ thousand 2Q10 3Q10 4Q10 1Q11 2Q11
Active Position – Transferred Risk 1,582,618 1,392,181 1,012,217 2,524,485 1,789,802
Credit swaps – derivatives with banks 1,582,618 1,392,181 1,012,217 2,524,485 1,646,961
Others - - - - 142,841
Passive Position – Risk Received 4,229,514 2,911,541 1,759,596 2,524,485 723,188
Credit swaps – derivatives with banks 4,229,514 2,911,541 1,759,596 2,524,485 655,662
Others - - - - 67,526
Consolidated Economic and Financial
Mitigating instruments When accepting guarantees in credit operations, preference is given to guarantees which help the operation self-liquidate. In order to accept a guaranty, the maximum value considered is reached by applying a certain percentage on the value of said good or right. The following goods or rights are considered with a 100.0% advance: a) receivables represented by RDB, CDB, savings, fixed income investment funds,
and Pledge Agreements - cash collateral, gold deposits or ingots, and Standby Letters of Credit;
b) Guaranty funds: Guaranty Fund for Creation of Jobs and Income (Funproger), Guaranty Fund for Small Companies (Fampe), and Operations Guaranty Fund (FGO), Investment Guarantee Fund (FGI), among others; and
c) guaranty given by a banking institution that has a credit limit with the Bank with sufficient margin to back the joint liability, and credit insurance.
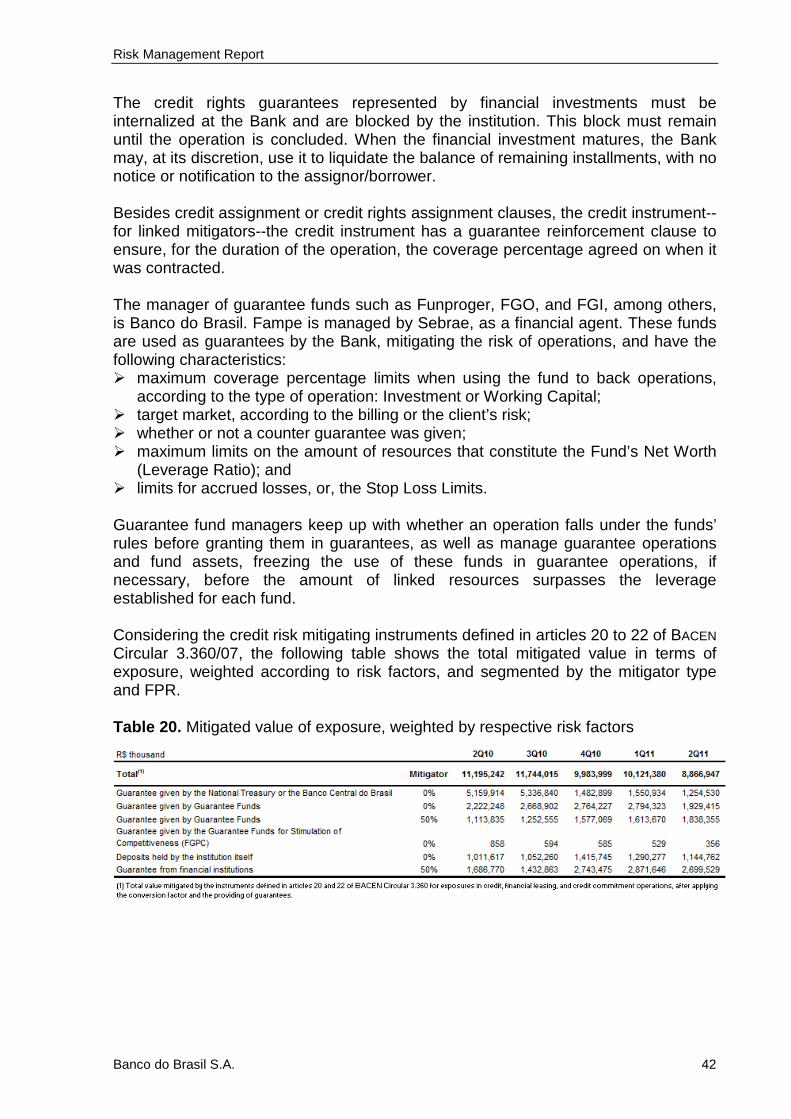
Risk Management Report
Banco do Brasil S.A. 42
The credit rights guarantees represented by financial investments must be internalized at the Bank and are blocked by the institution. This block must remain until the operation is concluded. When the financial investment matures, the Bank may, at its discretion, use it to liquidate the balance of remaining installments, with no notice or notification to the assignor/borrower. Besides credit assignment or credit rights assignment clauses, the credit instrument--for linked mitigators--the credit instrument has a guarantee reinforcement clause to ensure, for the duration of the operation, the coverage percentage agreed on when it was contracted. The manager of guarantee funds such as Funproger, FGO, and FGI, among others, is Banco do Brasil. Fampe is managed by Sebrae, as a financial agent. These funds are used as guarantees by the Bank, mitigating the risk of operations, and have the following characteristics: � maximum coverage percentage limits when using the fund to back operations,
according to the type of operation: Investment or Working Capital; � target market, according to the billing or the client’s risk; � whether or not a counter guarantee was given; � maximum limits on the amount of resources that constitute the Fund’s Net Worth
(Leverage Ratio); and � limits for accrued losses, or, the Stop Loss Limits. Guarantee fund managers keep up with whether an operation falls under the funds’ rules before granting them in guarantees, as well as manage guarantee operations and fund assets, freezing the use of these funds in guarantee operations, if necessary, before the amount of linked resources surpasses the leverage established for each fund. Considering the credit risk mitigating instruments defined in articles 20 to 22 of BACEN Circular 3.360/07, the following table shows the total mitigated value in terms of exposure, weighted according to risk factors, and segmented by the mitigator type and FPR. Table 20. Mitigated value of exposure, weighted by respective risk factors
Risk Management Report
Banco do Brasil S.A. 43
8.1.2 Market and Liquidity Risks Management Objectives The objective of Banco do Brasil’s market and liquidity risk management process is to identify, assess, monitor, and control risks related to each individual institution, and to the financial conglomerate, as well as identify and monitor the risks associated with the rest of the companies who are part of the consolidated economic and financial. In line with best practices in the market, the Bank regularly uses procedures that enable managing the market and liquidity risks of its positions, taking internal and external economic scenarios into account and aiming to minimize possible effects on the net financials. Management Policies and Strategies The Bank has established policies and strategies for managing market and liquidity risks, and to manage derivative financial instruments. These policies and strategies determine the Company’s operating directives in the risk management process. In the scope of Banco do Brasil’s market and liquidity risks management policies and strategies, the general principle adopted is that the liquidity and market risks management model’s purpose is to identify, assess, monitor, and control the market and liquidity risk exposures of its own positions. Additionally, the market and liquidity risks management process uses mechanisms set forth in regulatory systems which detail the operational procedures necessary to implement the organizational decisions related to the Company’s business and activities and to meet legal, as well as regulatory and oversight bodies’ requirements. Finally, note that in market and liquidity risks management, systems are used that guarantee that positions registered in negotiable and non-negotiable portfolios are measured, monitored, and controlled, as are operations aimed at meeting the hedge objectives established. Regarding the use of derivative financial instruments, the Bank stipulates in its strategies and policies that operations to meet clients’ needs and to manage its own positions are to be carried out, taking into consideration the many risk categories and adopting a consolidated vision of the different risk factors. It’s also worth noting that negotiating with derivative financial instruments is subject to prior evaluation of the nature and scale of risks involved. The tables below represent the entire exposure to derivative financial instruments by category of market risk factor, segmented into positions bought and sold in the following way: I. derivative financial instrument transactions carried out with a central counterparty,
subdivided into those in Brazil and those abroad; and II. derivative financial instrument transactions carried out without a central
counterparty, subdivided into those in Brazil and those abroad.
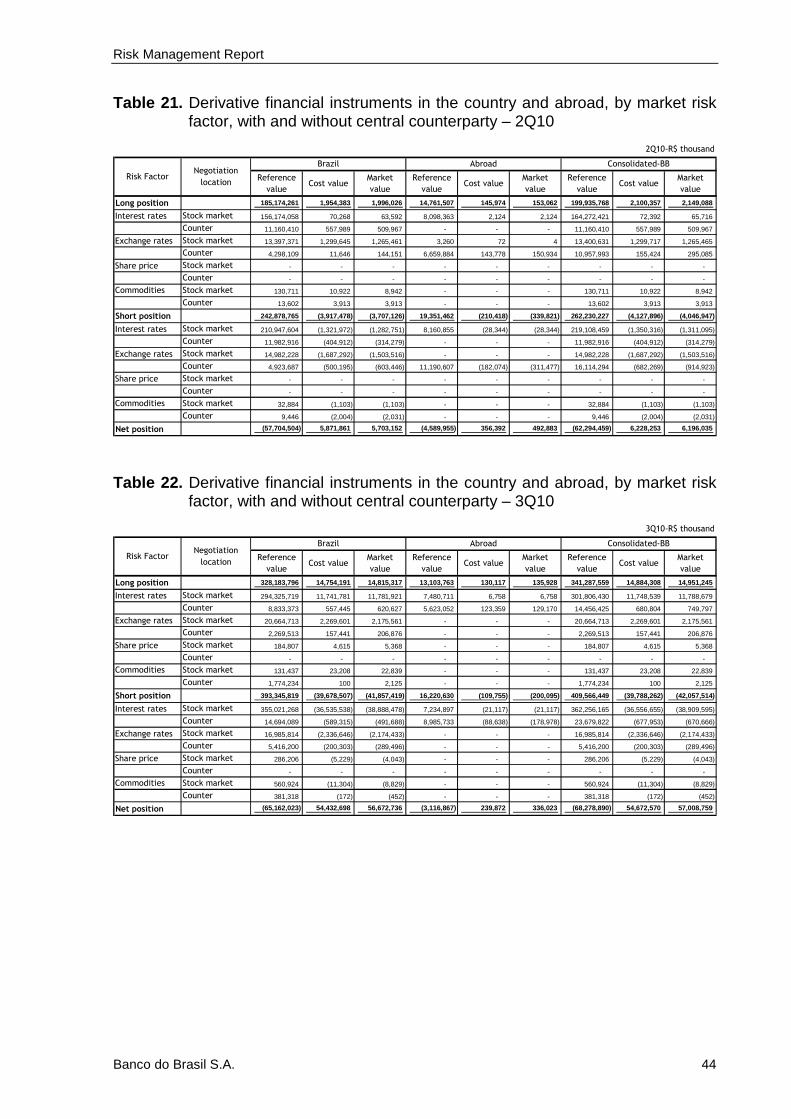
Risk Management Report
Banco do Brasil S.A. 44
Table 21. Derivative financial instruments in the country and abroad, by market risk factor, with and without central counterparty – 2Q10
Reference
valueCost value
Market
value
Reference
valueCost value
Market
value
Reference
valueCost value
Market
value
Long position 185,174,261 1,954,383 1,996,026 14,761,507 145,974 153,062 199,935,768 2,100,357 2,149,088
Interest rates Stock market 156,174,058 70,268 63,592 8,098,363 2,124 2,124 164,272,421 72,392 65,716
Counter 11,160,410 557,989 509,967 - - - 11,160,410 557,989 509,967
Exchange rates Stock market 13,397,371 1,299,645 1,265,461 3,260 72 4 13,400,631 1,299,717 1,265,465
Counter 4,298,109 11,646 144,151 6,659,884 143,778 150,934 10,957,993 155,424 295,085
Share price Stock market - - - - - - - - -
Counter - - - - - - - - -
Commodities Stock market 130,711 10,922 8,942 - - - 130,711 10,922 8,942
Counter 13,602 3,913 3,913 - - - 13,602 3,913 3,913
Short position 242,878,765 (3,917,478) (3,707,126) 19,351,462 (210,418) (339,821) 262,230,227 (4,127,896) (4,046,947)
Interest rates Stock market 210,947,604 (1,321,972) (1,282,751) 8,160,855 (28,344) (28,344) 219,108,459 (1,350,316) (1,311,095)
Counter 11,982,916 (404,912) (314,279) - - - 11,982,916 (404,912) (314,279)
Exchange rates Stock market 14,982,228 (1,687,292) (1,503,516) - - - 14,982,228 (1,687,292) (1,503,516)
Counter 4,923,687 (500,195) (603,446) 11,190,607 (182,074) (311,477) 16,114,294 (682,269) (914,923)
Share price Stock market - - - - - - - - -
Counter - - - - - - - - -
Commodities Stock market 32,884 (1,103) (1,103) - - - 32,884 (1,103) (1,103)
Counter 9,446 (2,004) (2,031) - - - 9,446 (2,004) (2,031)
Net position (57,704,504) 5,871,861 5,703,152 (4,589,955) 356,392 492,883 (62,294,459) 6,228,253 6,196,035
2Q10-R$ thousand
Risk FactorNegotiation
location
Brazil Abroad Consolidated-BB
Table 22. Derivative financial instruments in the country and abroad, by market risk
factor, with and without central counterparty – 3Q10
Reference
valueCost value
Market
value
Reference
valueCost value
Market
value
Reference
valueCost value
Market
value
Long position 328,183,796 14,754,191 14,815,317 13,103,763 130,117 135,928 341,287,559 14,884,308 14,951,245
Interest rates Stock market 294,325,719 11,741,781 11,781,921 7,480,711 6,758 6,758 301,806,430 11,748,539 11,788,679
Counter 8,833,373 557,445 620,627 5,623,052 123,359 129,170 14,456,425 680,804 749,797
Exchange rates Stock market 20,664,713 2,269,601 2,175,561 - - - 20,664,713 2,269,601 2,175,561
Counter 2,269,513 157,441 206,876 - - - 2,269,513 157,441 206,876
Share price Stock market 184,807 4,615 5,368 - - - 184,807 4,615 5,368
Counter - - - - - - - - -
Commodities Stock market 131,437 23,208 22,839 - - - 131,437 23,208 22,839
Counter 1,774,234 100 2,125 - - - 1,774,234 100 2,125
Short position 393,345,819 (39,678,507) (41,857,419) 16,220,630 (109,755) (200,095) 409,566,449 (39,788,262) (42,057,514)
Interest rates Stock market 355,021,268 (36,535,538) (38,888,478) 7,234,897 (21,117) (21,117) 362,256,165 (36,556,655) (38,909,595)
Counter 14,694,089 (589,315) (491,688) 8,985,733 (88,638) (178,978) 23,679,822 (677,953) (670,666)
Exchange rates Stock market 16,985,814 (2,336,646) (2,174,433) - - - 16,985,814 (2,336,646) (2,174,433)
Counter 5,416,200 (200,303) (289,496) - - - 5,416,200 (200,303) (289,496)
Share price Stock market 286,206 (5,229) (4,043) - - - 286,206 (5,229) (4,043)
Counter - - - - - - - - -
Commodities Stock market 560,924 (11,304) (8,829) - - - 560,924 (11,304) (8,829)
Counter 381,318 (172) (452) - - - 381,318 (172) (452)
Net position (65,162,023) 54,432,698 56,672,736 (3,116,867) 239,872 336,023 (68,278,890) 54,672,570 57,008,759
3Q10-R$ thousand
Risk FactorNegotiation
location
Brazil Abroad Consolidated-BB

Risk Management Report
Banco do Brasil S.A. 45
Table 23 . Derivative financial instruments in the country and abroad, by market risk factor, with and without central counterparty – 4Q10
Reference
valueCost value
Market
value
Reference
valueCost value
Market
value
Reference
valueCost value
Market
value
Long position 331,472,147 5,297,793 1,541,473 10,819,530 78,843 68,945 342,291,677 5,376,636 1,610,418
Interest rates Stock market 278,688,592 94,017 14,161 6,249,420 - - 284,938,012 94,017 14,161
Counter 8,965,789 3,903,874 618,917 - - - 8,965,789 3,903,874 618,917
Exchange rates Stock market 41,614,653 963,103 663,367 - - - 41,614,653 963,103 663,367
Counter 1,117,627 308,841 228,835 4,570,110 78,843 68,945 5,687,737 387,684 297,780
Share price Stock market 22,639 26,242 7,014 - - - 22,639 26,242 7,014
Counter - - - - - - - - -
Commodities Stock market 179,683 428 428 - - - 179,683 428 428
Counter 883,164 1,288 8,751 - - - 883,164 1,288 8,751
Short position 357,437,912 3,709,006 (5,185,063) 11,487,035 35,129 (94,803) 368,924,947 3,744,135 (5,279,866)
Interest rates Stock market 293,692,373 (2,760,221) (2,912,423) 5,455,137 - - 299,147,510 (2,760,221) (2,912,423)
Counter 17,288,927 7,481,467 (1,428,853) - - - 17,288,927 7,481,467 (1,428,853)
Exchange rates Stock market 41,249,376 (1,253,854) (683,346) - - - 41,249,376 (1,253,854) (683,346)
Counter 1,377,085 183,941 (140,853) 6,031,898 35,129 (94,803) 7,408,983 219,070 (235,656)
Share price Stock market 196,966 66,796 (3,402) - - - 196,966 66,796 (3,402)
Counter - - - - - - - - -
Commodities Stock market 1,237,744 (9,748) (163) - - - 1,237,744 (9,748) (163)
Counter 2,395,441 625 (16,023) - - - 2,395,441 625 (16,023)
Net position (25,965,765) 1,588,787 6,726,536 (667,505) 43,714 163,748 (26,633,270) 1,632,501 6,890,284
4Q10-R$ thousand
Risk FactorNegotiation
location
Brazil Abroad Consolidated-BB
Table 24. Derivative financial instruments in the country and abroad, by market risk
factor, with and without central counterparty – 1Q11
Reference
valueCost value
Market
value
Reference
valueCost value
Market
value
Reference
valueCost value
Market
value
Long position 266,699,433 1,786,755 1,335,962 8,603,536 40,481 44,754 275,302,969 1,827,236 1,380,716
Interest rates Stock market 226,502,425 292,611 283,743 4,778,732 - - 231,281,157 292,611 283,743
Counter 12,547,300 566,878 695,239 - - - 12,547,300 566,878 695,239
Exchange rates Stock market 26,332,106 904,146 105,017 - - - 26,332,106 904,146 105,017
Counter 1,200,256 18,507 242,840 3,824,804 40,481 44,754 5,025,060 58,988 287,594
Share price Stock market 4,161 2,213 3,300 - - - 4,161 2,213 3,300
Counter - - - - - - - - -
Commodities Stock market 113,185 2,400 5,823 - - - 113,185 2,400 5,823
Counter - - - - - - - - -
Short position 322,473,216 (7,244,942) (4,837,532) 6,811,385 90,390 (67,133) 329,284,601 (7,154,552) (4,904,665)
Interest rates Stock market 275,669,097 (3,209,987) (2,619,151) 3,695,110 - - 279,364,207 (3,209,987) (2,619,151)
Counter 11,218,050 (809,464) (670,916) - - - 11,218,050 (809,464) (670,916)
Exchange rates Stock market 29,386,577 (2,331,309) (417,249) - - - 29,386,577 (2,331,309) (417,249)
Counter 4,855,307 (888,187) (1,124,846) 3,116,275 90,390 (67,133) 7,971,582 (797,797) (1,191,979)
Share price Stock market 1,064,854 (3,519) (179) - - - 1,064,854 (3,519) (179)
Counter 36,343 (971) (987) - - - 36,343 (971) (987)
Commodities Stock market 242,987 (1,505) (4,204) - - - 242,987 (1,505) (4,204)
Counter - - - - - - - - -
Net position (55,773,783) 9,031,697 6,173,494 1,792,151 (49,909) 111,887 (53,981,632) 8,981,788 6,285,381
1Q11-R$ thousand
Risk FactorNegotiation
location
Brazil Abroad Consolidated-BB

Risk Management Report
Banco do Brasil S.A. 46
Table 25. Derivative financial instruments in the country and abroad, by market risk
factor, with and without central counterparty – 2Q11
Reference
valueCost value
Market
value
Reference
valueCost value
Market
value
Reference
valueCost value
Market
value
Long position 323,218,163 1,080,765 1,201,179 4,239,434 39,214 47,238 327,457,597 1,119,979 1,248,417
Interest rates Stock market 295,778,693 93,333 98,509 1,716,085 - - 297,494,778 93,333 98,509
Counter 13,932,714 718,926 702,998 - - - 13,932,714 718,926 702,998
Exchange rates Stock market 11,389,415 225,359 158,670 - - - 11,389,415 225,359 158,670
Counter 1,888,417 38,151 237,352 2,523,349 39,214 47,238 4,411,766 77,365 284,590
Share price Stock market 216,020 4,776 3,451 - - - 216,020 4,776 3,451
Counter - - - - - - - - -
Commodities Stock market 12,399 118 97 - - - 12,399 118 97
Counter 505 102 102 - - - 505 102 102
Short position 387,837,455 (4,850,814) (4,214,973) 4,594,749 (43,669) (59,870) 392,432,204 (4,894,483) (4,274,843)
Interest rates Stock market 360,044,109 (2,272,927) (1,672,028) 1,631,399 - - 361,675,508 (2,272,927) (1,672,028)
Counter 15,770,830 (1,859,615) (1,767,886) - - - 15,770,830 (1,859,615) (1,767,886)
Exchange rates Stock market 11,162,425 (693,711) (613,049) - - - 11,162,425 (693,711) (613,049)
Counter 418,563 (14,671) (153,242) 2,963,350 (43,669) (59,870) 3,381,913 (58,340) (213,112)
Share price Stock market 284,270 (6,015) (5,643) - - - 284,270 (6,015) (5,643)
Counter - - - - - - - - -
Commodities Stock market 156,806 (3,839) (3,086) - - - 156,806 (3,839) (3,086)
Counter 451 (36) (39) - - - 451 (36) (39)
Net position (64,619,292) 5,931,579 5,416,152 (355,315) 82,883 107,108 (64,974,607) 6,014,462 5,523,260
2Q11-R$ thousand
Risk FactorNegotiation
location
Brazil Abroad Consolidated-BB
Hedge Policies Regarding hedge policies adopted for market and liquidity risk management, the consolidated hedge operations objectives for the entire Financial Conglomerate are set, with individual operational efficiency guaranteed and local regulations observed, in the case of foreign offices. Operations with derivative financial instruments with the objective of hedging are separated from those not intended for hedging, both of which have their own limits and objectives.
Communication and Notification Process Proposals for market and liquidity risk limits are submitted by the Risk Management Director to group and book managers, taking into account the set global limits and risk appetite. These limit proposals are formalized in technical notes. When regular strategic market risk committee (Global Risk Committee - CRG and Subcommittee for Market and Liquidity Risk - SRML) meetings are held, the technical notes are submitted for approval, and then new limits go into effect, if approved. After approval by the competent bodies, the limits are managed by the Risk Management Director (DIRIS). Group and book managers linked to Negotiable and Non-negotiable Portfolios receive the limit usage report daily, supported by Banco do Brasil’s intranet. Note that, in the event that limits are exceeded, DIRIS, which is responsible for controlling and monitoring a portfolio which exceeds its limit, issues a document named “Record of Limit Exceeded.” Next, the group and book manager must present his/her justifications for exceeding the limits, and specify a deadline to regularize the situation. In turn, the hierarchical
Risk Management Report
Banco do Brasil S.A. 47
level responsible for conducting the case must issue a finding on the manager’s declaration. Finally, the team responsible for monitoring the limit monitors the regularization actions. The process of communicating the risks incurred by the Bank to the Top Management occurs in regular meetings of the Strategic Risks Committees and Subcommittees, which are ordinarily held every month. Measurement Systems The market and liquidity risk measurement process uses corporate systems and the Riskwatch market risk analytics application, developed by Algorithmics, a Canadian company. The IT infrastructure for the market risk measurement process is installed at facilities located in Brasília (DF), and Rio de Janeiro (RJ). Market Risk Management Process Banco do Brasil uses statistical and simulation methods to analyze the market risk of its exposures. Of the metrics used in the application of these methods, we highlight the following: � sensitivities; � Value at Risk (VaR); and, � stress. Sensitivity metrics simulate the effects on the value of exposures resulting from variations in the level of market risk factors. VaR is a metric used to assess the potential loss under routine market conditions, dimensioned daily in monetary values, under a set confidence interval and time frame. The risk factors used in VaR metrics to analyze the market risk of exposures are classified into the following categories: � interest rates; � exchange rates; � share prices; and, � commodity prices.
The VaR metrics performance is assessed monthly by a backtesting process. This assessment is segregated from the processes for development and use of VaR metrics. Finally, BB uses stress metrics resulting from simulations on the behavior of its exposures subject to market risks under extreme conditions, such as financial crises and economic shocks. The objective of stress tests is to calculate the impact of events which are plausible, but very unlikely to occur, on regulatory and economic capital requirements. Stress tests include exposure simulations, both retrospective--based on historical series of shocks to market risk factors--and prospective--based on projected economic and financial scenarios.
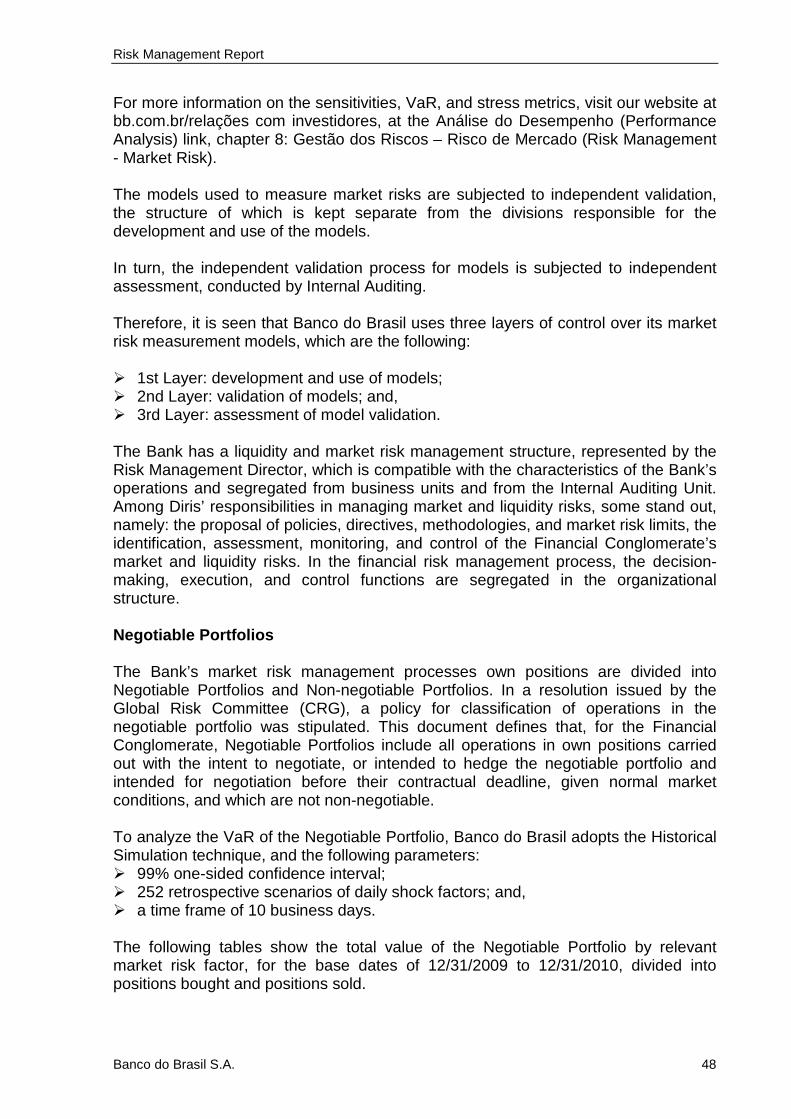
Risk Management Report
Banco do Brasil S.A. 48
For more information on the sensitivities, VaR, and stress metrics, visit our website at bb.com.br/relações com investidores, at the Análise do Desempenho (Performance Analysis) link, chapter 8: Gestão dos Riscos – Risco de Mercado (Risk Management - Market Risk). The models used to measure market risks are subjected to independent validation, the structure of which is kept separate from the divisions responsible for the development and use of the models. In turn, the independent validation process for models is subjected to independent assessment, conducted by Internal Auditing. Therefore, it is seen that Banco do Brasil uses three layers of control over its market risk measurement models, which are the following: � 1st Layer: development and use of models; � 2nd Layer: validation of models; and, � 3rd Layer: assessment of model validation.
The Bank has a liquidity and market risk management structure, represented by the Risk Management Director, which is compatible with the characteristics of the Bank’s operations and segregated from business units and from the Internal Auditing Unit. Among Diris’ responsibilities in managing market and liquidity risks, some stand out, namely: the proposal of policies, directives, methodologies, and market risk limits, the identification, assessment, monitoring, and control of the Financial Conglomerate’s market and liquidity risks. In the financial risk management process, the decision-making, execution, and control functions are segregated in the organizational structure. Negotiable Portfolios The Bank’s market risk management processes own positions are divided into Negotiable Portfolios and Non-negotiable Portfolios. In a resolution issued by the Global Risk Committee (CRG), a policy for classification of operations in the negotiable portfolio was stipulated. This document defines that, for the Financial Conglomerate, Negotiable Portfolios include all operations in own positions carried out with the intent to negotiate, or intended to hedge the negotiable portfolio and intended for negotiation before their contractual deadline, given normal market conditions, and which are not non-negotiable. To analyze the VaR of the Negotiable Portfolio, Banco do Brasil adopts the Historical Simulation technique, and the following parameters: � 99% one-sided confidence interval; � 252 retrospective scenarios of daily shock factors; and, � a time frame of 10 business days.
The following tables show the total value of the Negotiable Portfolio by relevant market risk factor, for the base dates of 12/31/2009 to 12/31/2010, divided into positions bought and positions sold.
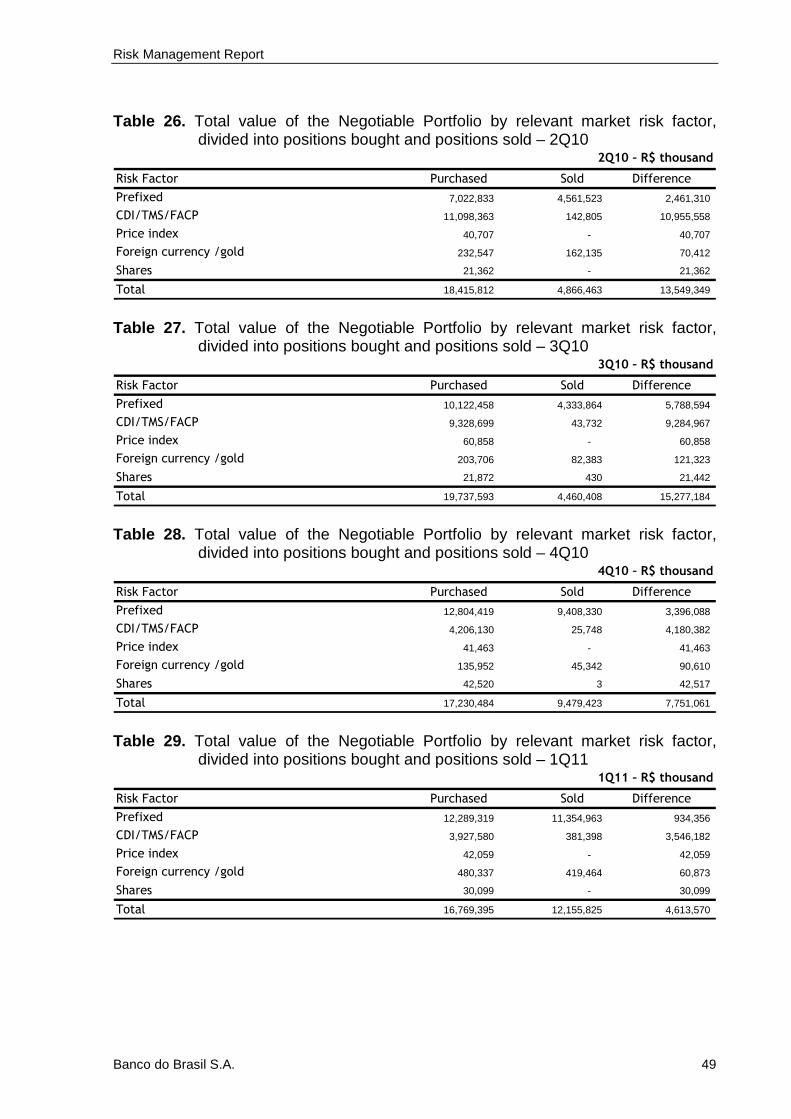
Risk Management Report
Banco do Brasil S.A. 49
Table 26. Total value of the Negotiable Portfolio by relevant market risk factor,
divided into positions bought and positions sold – 2Q10
Risk Factor Purchased Sold Difference
Prefixed 7,022,833 4,561,523 2,461,310
CDI/TMS/FACP 11,098,363 142,805 10,955,558
Price index 40,707 - 40,707
Foreign currency /gold 232,547 162,135 70,412
Shares 21,362 - 21,362
Total 18,415,812 4,866,463 13,549,349
2Q10 – R$ thousand
Table 27. Total value of the Negotiable Portfolio by relevant market risk factor,
divided into positions bought and positions sold – 3Q10
Risk Factor Purchased Sold Difference
Prefixed 10,122,458 4,333,864 5,788,594
CDI/TMS/FACP 9,328,699 43,732 9,284,967
Price index 60,858 - 60,858
Foreign currency /gold 203,706 82,383 121,323
Shares 21,872 430 21,442
Total 19,737,593 4,460,408 15,277,184
3Q10 – R$ thousand
Table 28. Total value of the Negotiable Portfolio by relevant market risk factor,
divided into positions bought and positions sold – 4Q10
Risk Factor Purchased Sold Difference
Prefixed 12,804,419 9,408,330 3,396,088
CDI/TMS/FACP 4,206,130 25,748 4,180,382
Price index 41,463 - 41,463
Foreign currency /gold 135,952 45,342 90,610
Shares 42,520 3 42,517
Total 17,230,484 9,479,423 7,751,061
4Q10 – R$ thousand
Table 29. Total value of the Negotiable Portfolio by relevant market risk factor,
divided into positions bought and positions sold – 1Q11 1Q11 – R$ thousand
Risk Factor Purchased Sold Difference
Prefixed 12,289,319 11,354,963 934,356
CDI/TMS/FACP 3,927,580 381,398 3,546,182
Price index 42,059 - 42,059
Foreign currency /gold 480,337 419,464 60,873
Shares 30,099 - 30,099
Total 16,769,395 12,155,825 4,613,570
Risk Management Report
Banco do Brasil S.A. 50
Table 30. Total value of the Negotiable Portfolio by relevant market risk factor,
divided into positions bought and positions sold – 2Q11
2Q11 – R$ thousand
Risk Factor Purchased Sold Difference
Prefixed 12,190,683 11,609,150 581,533
CDI/TMS/FACP 3,895,277 - 3,895,277
Price index 42,513 - 42,513
Foreign currency /gold 1,070,306 17,355 1,052,950
Shares 24,387 - 24,387
Total 17,223,167 11,626,505 5,596,661
Risk Management Report
Banco do Brasil S.A. 51
Non-negotiable Portfolios The Financial Conglomerate’s own operations positions not classified under the Negotiable Portfolio are considered components of the Non-negotiable Portfolio. Note too that the own positions held by the companies that are not a part of the Financial Conglomerate cannot be classified under the Negotiable Portfolio. To analyze the VaR of the Non-negotiable Portfolio, Banco do Brasil adopts the Historical Simulation technique, and the following parameters: � 99% one-sided confidence interval; � 1,260 retrospective scenarios of daily shock factors; and, � a time frame of 10 business days.
Among other aspects, it’s worth noting that the Historical Simulation VaR technique: � includes all operations which are sensitive to variations in interest rates, and uses
widely accepted risk-measurement techniques and financial concepts; � considers data on fees, deadlines, prices, optionalities, and other suitably
specified information; � requires that suitable premises be defined to transform positions into cash flow; � measures sensitivity to changes in the temporal structure of interest rates,
between the different rate frameworks and in the premises; � is integrated into daily risk management practices; � allows the simulation of extreme market conditions (stress tests); and, � allows an estimation of the Referential Equity (PR) that is compatible with the
risks, as determined in Article 3 of CMN Resolution 3.490/07.
Banco do Brasil uses statistical and econometric methods, as referenced in literature, to analyze temporal series, more specifically, methods known as ARIMA (Autoregressive, Integrated, and Moving Average) to handle products with no set maturity. In line with the Historical Simulation methodology adopted by Banco do Brasil to calculate the Value-at-Risk (VaR) metrics, the models for products with no set maturity assume the hypothesis that the retrospective behavior of the variations observed in the balances is relevant to forecasting the future behavior of cash flow from redemptions (random variable of interest) of the balances of the deposit products referenced. Therefore, such methods assume the possibility of future balance (financial amount of partial redemptions) fluctuations with a scope similar to that observed in the historical series. The criteria for identifying operations that fall under the classification of the Non-negotiable Portfolio follow the definitions and objectives defined in the resolution issued by the Global Risk Committee. It’s also worth noting that the definitions, criteria, and procedures established must be reviewed annually. The Negotiable and Non-negotiable Portfolios are divided into Groups and Books, always observing the internal norms (technical notes and resolutions) approved by the Liquidity and Market Risks Subcommittee (SRML) and by the Global Risk Committee (CRG), which establish the objectives, makeup, financial limits, and

Risk Management Report
Banco do Brasil S.A. 52
market and liquidity risk limits for each Group or Book. The main types of limits used for market risk management are: � Value-at-Risk – VaR; and, � Stress.
In order to provide suitable conditions for assessing the capacity for loss absorption and identifying future risk reduction measures, global limits are defined as a percentage of Referential Equity (PR). The VaR and Stressed VaR metrics are used to demonstrate the level of market risk generated by exposures, and the respective effect in terms of capital required to cover said risk, for the VaR limits of the Negotiable Portfolio. Liquidity Risk Management Process Banco do Brasil maintains liquidity levels suitable to the Institution’s commitments in Brazil and abroad, which are the result of its broad and diversified base of depositors, the quality of its assets, the capillarity of its network of external offices and of its access to international capital markets. The strict liquidity risk control is in line with the Liquidity and Market Risks Policy established for the Conglomerate, meeting the requirements of national banking oversight, as well as of the other countries in which the Bank operates. Banco doBrasil’s liquidity risk management segregates the liquidity in Reais from the liquidity in Foreign Currencies. For this, the following instruments are used: � Maps of Deadline Gaps; � Short, Medium, and Long-term Liquidity Projections; � Stress test; � Liquidity Risk Limits; � Liquidity Contingency Plan; and, � Liquidity Contingency Measures Potential Test. The liquidity risk management instruments are regularly monitored and reported to the institutions’ Strategic Committees. Deadline Gap Maps show expected contractual payments and receivables, distributed in previously defined time intervals, and presented both jointly and in detail by operation indexer. Deadline Gap Maps are analyzed in order to determine the contractual cash flow of the institution at a set date. Short, Medium, and Long-term Liquidity Projections allow a prospective assessment of the effect of the gap between deposits and investments, with the objective of identifying situations that may compromise the liquidity of the Institution, taking into account both budgetary planning and market conditions. Periodically, Short-term Liquidity Projections are assessed under alternative and stress scenarios. If the result of any of these liquidity projection scenarios is below the adopted liquidity level limit, then the previously established Contingency Measures Potential is put into effect, in order to recover the Institutions’ liquidity. Furthermore, Banco do Brasil uses the following metrics:
Risk Management Report
Banco do Brasil S.A. 53
� Liquidity Reserves (RL); and, � Free Resources Statement (DRL).
Liquidity Reserves is the metric used in short-term liquidity risk management. It is the minimum level of high liquidity assets the Bank must maintain, compatible with the risk exposure due to the nature of its operations and market conditions. The Liquidity Reserves methodology is used as a parameter to identify a liquidity contingency and to activate the Liquidity Contingency Plan, and is monitored daily. The Availability of Free Resources (DRL) indicator, used in planning and in the execution of its annual budget, is intended to ensure a balance between resources deposited and resources invested, with a focus on Commercial Divisions and on guaranteeing liquidity financing. The DRL limit used to guide the execution and planning of the budget, according to the deposit and investment goals, is defined annually by the Global Risk Committee (CRG), and is monitored monthly. The Liquidity Contingency Plan, in turn, establishes a set of procedures and responsibilities to be adopted in liquidity contingency situations. In the event of a liquidity contingency, one or more contingency measures can be adopted in order to safeguard the institution’s ability to pay. The liquidity contingency measures are assessed monthly.

Risk Management Report
Banco do Brasil S.A. 54
8.1.3 Operational Risk Management Objectives In compliance with Article 4 of CMN Resolution 3.380/06, Banco do Brasil’s operating risk management structure was defined as being composed of the Risk Management Director (DIRIS), Internal Controls Director (DICOI) and Security Management Director (DIGES), being that the Administration Council (CA) is responsible for information published. The Risk Management Director, by recommendation of the Administration Council, is responsible to the Banco Central do Brasil (BACEN), for managing Banco do Brasil’s operating risks. The chart below shows the main responsibilities of the divisions that comprise the operational risk management structure.
DIRIS DICOI DIGES
Operational Risk standards and policies
Compliance, process and business failures
Corporate security governance
Establishment and control of RO limits
Support for divisions managing products and services
Policies, methodologies, standards, and plans regarding safety, fraud, money laundering, and business continuity
ICR establishment and control
Backtesting
RO capital allocation models and methodologies
Compliance policies
Operational Risk Measurement
Figure 8. Operational risk management structure
Internal auditing is responsible for verifying operational risk management and that its structure is functioning. It is to be noted that the operational risk analysis process is assessed by external auditors, and the results are submitted to the Board of Officers, and Tax and Administration Boards. In order to guarantee efficiency in the management of BB’s operational risk, as well as to ensure that each division performs the functions it’s responsible for, five management phases were defined. The main activities linked to each phase are summarized in the table below:

Risk Management Report
Banco do Brasil S.A. 55
Table 31. Phases of the operational risk management process
Management Phase Summary of activities
Identification Determine the vulnerabilities in the Bank’s processes and in relevant services performed by third parties, as well as identify loss events related to these.
Evaluation and assessment
Propose Exposure Limits and Key Risk Indicators (ICR), capture loss events and calculate capital to be allocated to operational risk.
Mitigation Develop mechanisms and action plans to mitigate operational risks identified, and create business continuity plans.
Control Monitor mitigation actions; propose, implement, and monitor control actions; determine the level of compliance of processes; backtesting.
Monitoring Monitor operational loss events, the behavior of Key Risk Indicators (ICR), exposure limits, as well as of the existence of internal controls and business continuity plans.
The activities linked to each phase have predefined responsibilities, either individually or jointly, involving product and service managers and the Risk Management, Internal Controls, and Security Management Directors. Operational Risk Policy The Operational Risk Policy that is reviewed and approved annually by the Board of Directors (CA) contains instructions for the Bank’s divisions, the purpose of which is to guarantee the effectiveness of the operational risk management model. This Policy, which adheres to the recommendations in Basel II and the requirements of CMN Resolution 3.380/06, pervades all activities related to operational risk management, with the objective of identifying, evaluating/assessing, mitigating, controlling, and monitoring the operational risks inherent to products, services, processes and systems within the scope of Banco do Brasil, its Wholly-owned Subsidiaries, and Financial Conglomerate Subsidiaries. The Operational Risk Policy includes guidelines that involve the main management instruments, the composition of the Internal Database, the calculation of expected and unexpected losses, and documentation and reporting to various levels of the Bank and the general public of the main aspects involved in operational risk management. Management Processes and Strategies Banco do Brasil’s objective is to manage its operational risks conservatively, segregating the risk management and business functions. For this, the Bank adopts best practices in risk management, observing the norms and directives of banking oversight and regulation. The Bank’s current Strategic Planning, composed of the 2010–14 Long-term Plan and the 2010-11 Master Plan, approved by the Board of Directors (CA), includes operational risk among internal processes, aiming to reduce losses, as measured by the Global Operating Loss Limit indicator.
Risk Management Report
Banco do Brasil S.A. 56
Aiming to be qualified to use the advanced operational risk measurement model, Banco do Brasil has currently been concentrating efforts on managing its operational risks, based on using the four essential elements to achieve a desired standard strength, which are: an internal database, external data, scenario analysis, and the factors that reflect the Bank’s business environment and internal controls (BEICF – Business Environment and Internal Control Factors). Strategic management is done by the Global Risk Committee (CRG), composed of the Chairman and Vice Chairmen of different divisions, whose purpose is to decide on risk policies and directives. In particular, this Committee sets and monitors the global risk limits. In an effort to speed up the management process, the Bank uses the Operational Risk Subcommittee to monitor operational risk in a consolidated way, at least every month, and to propose measures to keep it within the risk tolerance predefined by the Bank’s Top Management. Communication and Notification Processes The operational risk communication and notification process aims to maintain effective reporting channels that ensure that all employees at all hierarchical levels have access to the operational risk management policies, norms, and procedures, as does the general public, by means of quarterly and semiannual reports made available on the Bank’s website. Every month, members of the Global Risk Committee (CRG) and of the Operational Risk Subcommittee (SRO) receive information on losses and Key Risk Indicators related to static and dynamic positions, qualitative and quantitative assessments, and global and specific limits. CRG and SRO’s functional dynamics give the strategic levels—represented by executive directors of the divisions represented in these forums—access to operational risk information that enables the Bank’s decision-making process to function. Measurement Systems CMN Resolution 3.490/07 established the inclusion of the Operational Risk Factor ( ) in the calculation of the Required Referential Equity (PRE). BACEN defined the procedures for calculating the portion and the makeup of the Operational Risk Exposure Indicator (IE) in Circular 3.383/08 and Letter-Circulars 3.315/08 and 3.316/08. Regarding measurement approaches, in Circular 3.383/08, BACEN left the calculation of the portion at the discretion of financial institutions, based on one of the following approaches: Basic Indicator, Standardized Alternative, and Simplified Standardized Alternative. BB decided to allocate capital to operational risks under the Standardized Alternative Approach, based on segregating the IE by lines of business.
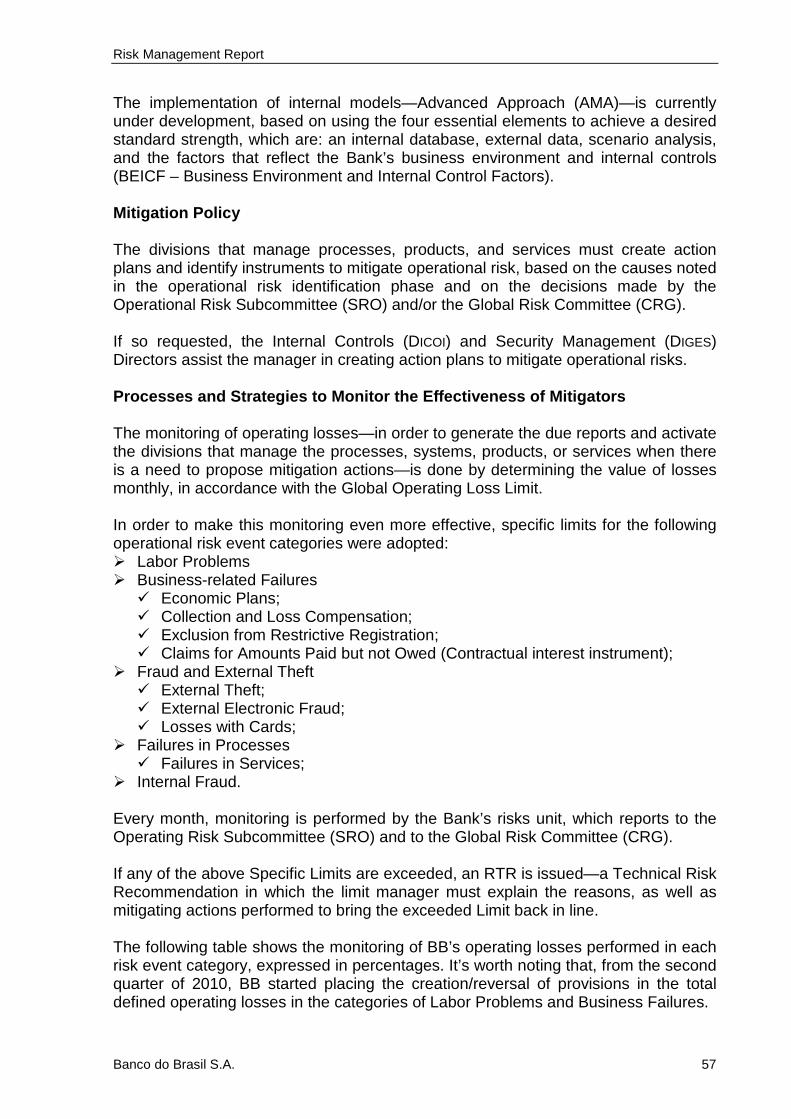
Risk Management Report
Banco do Brasil S.A. 57
The implementation of internal models—Advanced Approach (AMA)—is currently under development, based on using the four essential elements to achieve a desired standard strength, which are: an internal database, external data, scenario analysis, and the factors that reflect the Bank’s business environment and internal controls (BEICF – Business Environment and Internal Control Factors). Mitigation Policy The divisions that manage processes, products, and services must create action plans and identify instruments to mitigate operational risk, based on the causes noted in the operational risk identification phase and on the decisions made by the Operational Risk Subcommittee (SRO) and/or the Global Risk Committee (CRG). If so requested, the Internal Controls (DICOI) and Security Management (DIGES) Directors assist the manager in creating action plans to mitigate operational risks. Processes and Strategies to Monitor the Effectivene ss of Mitigators The monitoring of operating losses—in order to generate the due reports and activate the divisions that manage the processes, systems, products, or services when there is a need to propose mitigation actions—is done by determining the value of losses monthly, in accordance with the Global Operating Loss Limit. In order to make this monitoring even more effective, specific limits for the following operational risk event categories were adopted: � Labor Problems � Business-related Failures
� Economic Plans; � Collection and Loss Compensation; � Exclusion from Restrictive Registration; � Claims for Amounts Paid but not Owed (Contractual interest instrument);
� Fraud and External Theft � External Theft; � External Electronic Fraud; � Losses with Cards;
� Failures in Processes � Failures in Services;
� Internal Fraud. Every month, monitoring is performed by the Bank’s risks unit, which reports to the Operating Risk Subcommittee (SRO) and to the Global Risk Committee (CRG). If any of the above Specific Limits are exceeded, an RTR is issued—a Technical Risk Recommendation in which the limit manager must explain the reasons, as well as mitigating actions performed to bring the exceeded Limit back in line. The following table shows the monitoring of BB’s operating losses performed in each risk event category, expressed in percentages. It’s worth noting that, from the second quarter of 2010, BB started placing the creation/reversal of provisions in the total defined operating losses in the categories of Labor Problems and Business Failures.

Risk Management Report
Banco do Brasil S.A. 58
Table 32. Monitoring of operating losses

Risk Management Report
Banco do Brasil S.A. 59
8.2 Non-financial Companies Banco do Brasil’s Board of Directors has determined that non-financial companies that are part of the Consolidated Economic and Financial, in Brazil or abroad, must identify and monitor credit, market, and operational risks by means of their representatives in these companies’ Boards of Directors, or, in the lack of these, by members of the Executive Committee, using the instructions in the Corporate Risk Management Guide from the Brazilian Corporate Governance Institute (IBGC). Besides this, the Bank measures the required regulatory capital for the credit, market and operational risks of non-financial companies, ensuring that there is enough capital to cover these risks in the scope of the Consolidated Economic and Financial.

Risk Management Report
Banco do Brasil S.A. 60
9. Capital 9.1 Regulatory Capital The implementation of the Basel II rules in Brazil, especially in regards to capital requirements, brought many changes to the method of measuring capital to back the risks inherent to banking activities. The implementation timetable for Basel II in Brazil was made official by BACEN in Communiqué 12,746/04, and was later adjusted in Communiqué 16,137/07. This schedule was set up in phases, establishing first, regarding capital requirements, the use of a standardized approach (defined by BACEN) and, finally, the use of advanced models. On 10/29/2009, in Communiqué 19,028, BACEN adjusted the previously published timetables in an attempt to complement the measures and procedures necessary for proper implementation of Basel II in Brazil. In order to govern the transition from Basel I to Basel II (standardized approach), BACEN published different rules on capital requirements (Pillar I), the oversight process and transparency of information (Pillars II and III). BB uses the Prudential Basel Index (IB) and the Regulatory Capital Forum, among other tools, to manage its regulatory capital. The Prudential IB represents the Bank’s directive to maintain this index two points above the regulatory minimum, in order to cover the interest rate risk of operations not included in the negotiable portfolio ( portion) and to serve as a prudential margin to tackle other risks not considered in current capital requirements (Pillar II). This indicator is under review due to the new capital requirements under Basel III, which were defined in a preliminary manner in BACEN Communiqué 20,615/11. Representatives from different divisions of BB meet in the Regulatory Capital Forum monthly, with the intent of analyzing the behavior of and projections for the IB, the effects of modifications in the regulatory environment, and any measures to reconstitute the Prudential IB. 9.1.1 Referential Equity (PR) On 02/28/2007, the National Monetary Council approved changes to the rules for defining and determining the Referential Equity of financial institutions, in CMN Resolution No. 3,444/07. On 03/01/2007, Circular 3,343/07 was published by BACEN. It elaborates on the procedures to be adopted to request that deposit instruments be placed under Tier I and Tier II PR. For the purpose of verifying compliance with the operational limits of financial institutions, the PR is composed of the sum of Tier I and Tier II, minus the balance of the assets represented by the following deposit instruments issued by the financial institution: shares, hybrid capital and debt instruments, subordinate debt instruments, and other financial instruments described in CMN Resolution 3,444/07, article 12, and article 13, paragraph 3.

Risk Management Report
Banco do Brasil S.A. 61
Only the accounting information and balances of Votorantim Bank are not included in the operational limit statements and risk management documents, as well as in the basis for determining the Bank’s Basel Ratio. Table 33. Referential Equity
Tier I Capital The capital of R$ 33,122,569 thousand (R$ 26,028,096 thousand on 06/30/2010) of Banco do Brasil is divided into 2,860,729,247 book-entry common shares without par value. The Federal Government is the largest shareholder, holding the control. The capital increased R$ 7,094,473 thousand from 06/30/2010 to 06/30/2011 due to a 286 million shares Primary Offering valued at R$ 7,049,900 thousand and to the exercise of subscription of 1,496,831 bonuses "C" of R$ 44.573 thousand. The Bank may, even without amend bylaws, if approved by a General Meeting, and in the conditions established therein, increase its capital up to the limit of R$ 50 billion, by issuing common shares, granting shareholders preference for subscribing the capital increase proportionally to the number of held shares, while maintaining the rights of subscription bonus holders issued by the Bank

Risk Management Report
Banco do Brasil S.A. 62
Revaluation Reserves The revaluation reserves, totaling R$ 5,960 thousand (R$ 6,372 thousand on 06/30/2010), refer to revaluations of assets made by the associated/subsidiary companies. The realizations of the reserves in the period totaling R$ 412 thousand (R$131 thousand in the second half of 2010 and R$281 thousand in the first half of 2011), were transferred to "Retained earnings (accumulated losses)". The remaining balance will be held until to the date of its effective realization, in conformity with CMN Resolution n.° 3,565/2008. Capital and Retained Earnings Table 34. Capital and Retained Earnings
The Capital Reserve derived from recording tax incentive balances originating from non-financial subsidiaries as reserves was capitalized in April 2010, as resolved by the Banco do Brasil Extraordinary General Shareholders’ Meeting on 04/13/2010. The objective of the Operating Margin Statutory Reserve is to guarantee an operating margin compatible with the operations the company is carrying out, and consists of up to 100% out of net profit, after legal allocations, including dividends, limited to 80% of the company’s capital. The Dividend Equalization Statutory Reserve guarantees resources for the payment of dividends, and consists of up to 50% out of net profit, after legal allocations, including dividends, up to the limit of 20% of the company’s capital. Equity valuation adjustments Table 35. Equity valuation adjustments
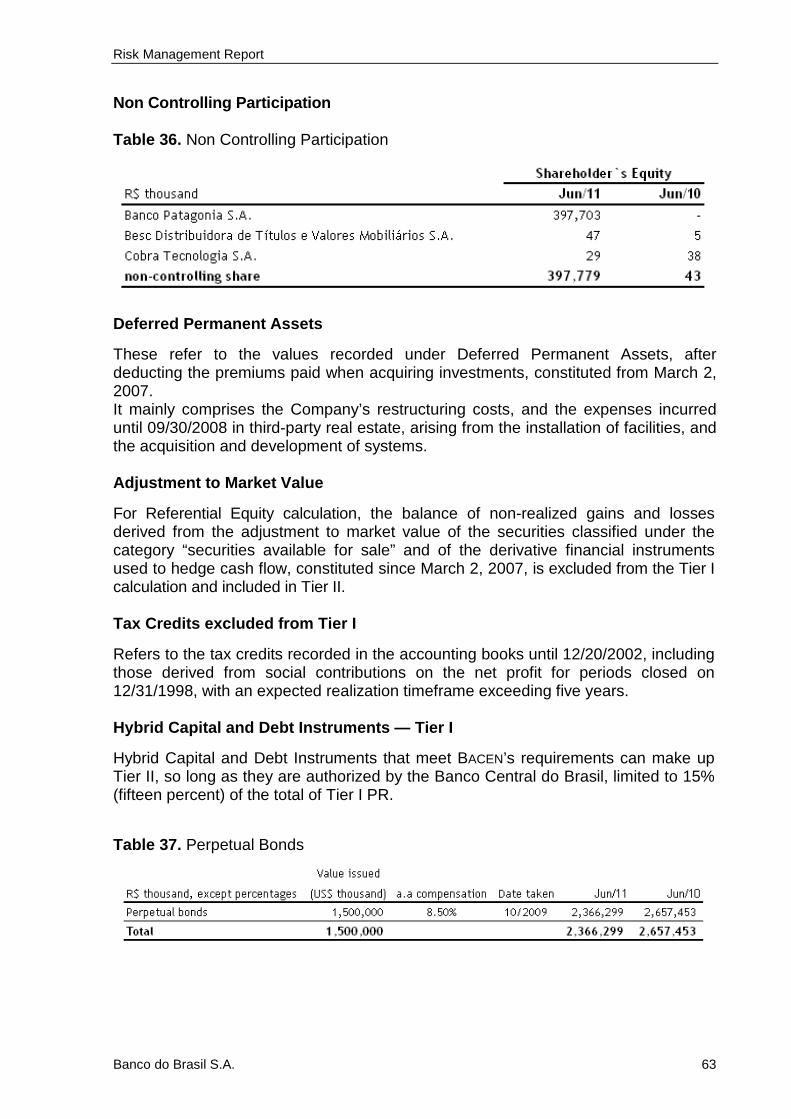
Risk Management Report
Banco do Brasil S.A. 63
Non Controlling Participation Table 36. Non Controlling Participation
Deferred Permanent Assets
These refer to the values recorded under Deferred Permanent Assets, after deducting the premiums paid when acquiring investments, constituted from March 2, 2007. It mainly comprises the Company’s restructuring costs, and the expenses incurred until 09/30/2008 in third-party real estate, arising from the installation of facilities, and the acquisition and development of systems. Adjustment to Market Value
For Referential Equity calculation, the balance of non-realized gains and losses derived from the adjustment to market value of the securities classified under the category “securities available for sale” and of the derivative financial instruments used to hedge cash flow, constituted since March 2, 2007, is excluded from the Tier I calculation and included in Tier II. Tax Credits excluded from Tier I
Refers to the tax credits recorded in the accounting books until 12/20/2002, including those derived from social contributions on the net profit for periods closed on 12/31/1998, with an expected realization timeframe exceeding five years. Hybrid Capital and Debt Instruments — Tier I
Hybrid Capital and Debt Instruments that meet BACEN’s requirements can make up Tier II, so long as they are authorized by the Banco Central do Brasil, limited to 15% (fifteen percent) of the total of Tier I PR.
Table 37. Perpetual Bonds

Risk Management Report
Banco do Brasil S.A. 64
O valor de R$ 2.262.435 mil (R$ 2.611.015 mil, em 30.06.2010) dos Bônus Perpétuos compõe o Patrimônio de Referência Nível I, em conformidade com a Resolução CMN n.º 3.444/2007. Tier II Subordinated debt Eligible as Capital Subordinated Debt Instruments that meet BACEN’s requirements can make up Tier II, so long as they are authorized by the Banco Central do Brasil, limited to 50% (fifteen percent) of Tier I PR. A reducer will be applied to the value of subordinated debt instruments authorized to be a part of Tier II PR, according to the remaining time until maturity.

Risk Management Report
Banco do Brasil S.A. 65
Table 38. Subordinated Debt
Table 39. Subordinated Debt Eligible as Capital
Hybrid Capital and Debt Instruments — Tier II Hybrid Capital and Debt Instruments which meet BACEN’s requirements can make up Tier II, so long as they are authorized by the Banco Central do Brasil, limited to the value of the Tier I PR, having subtracted the existing amount of Subordinated Debt and its remaining issue margin. Table 40. Perpetual Bonds
The Bank settled, in January 2011, the US$ 500,000 thousand bonus, issued in January 2006, through the exercise of the redemption option provided in the
Risk Management Report
Banco do Brasil S.A. 66
operation. The amount of R$882,343 thousand of perpetual bonds comprises the Tier II Referential Equity, in 06/30/2010 according to the percepts of CMN Resolution 3,444/07. Referential Equity Deductions
Financial Instruments excluded from the PR Since July 2, 2007, the balance of assets represented by the following deposit instruments issued by financial institutions and other institutions authorized to operate by the Banco Central do Brasil are deducted from the PR.

Risk Management Report
Banco do Brasil S.A. 67
Table 41. Financial Instruments excluded from the PR
Table 42. PR historical series – Financial Conglomerate
Table 43. PR historical series – Consolidated Economic and Financial

Risk Management Report
Banco do Brasil S.A. 68
9.1.2 Required Referential Equity (PRE) The Required Referential Equity (PRE) is the equity required of institutions, financial conglomerates, and other institutions authorized by BACEN to function, to back the risks to which they are exposed due to the activities they are involved in. According to CMN Resolution 3,490/07, the PRE is made of the following parts:
,
where:
= portion of exposures weighted by the risk weighting factor attributed to them;
= portion of risk from exposures to gold, foreign currency, and in operations subject to exchange fluctuations;
portion of risk from operations subject to fluctuating interest rates and classified under the negotiable portfolio;
= portion of risk from operations subject to commodity price fluctuations; = portion of risk from operations subject to share price fluctuations; and, = portion of operational risk.
The tables below show the PRE of the Financial Conglomerate and the Consolidated Economic and Financial, by type of risk.
Credit Risk Operational Risk Market Risk

Risk Management Report
Banco do Brasil S.A. 69
Table 44. Required Referential Equity for the Financial Conglomerate

Risk Management Report
Banco do Brasil S.A. 70
Table 45. Required Referential Equity for the Consolidated Economic – Financial
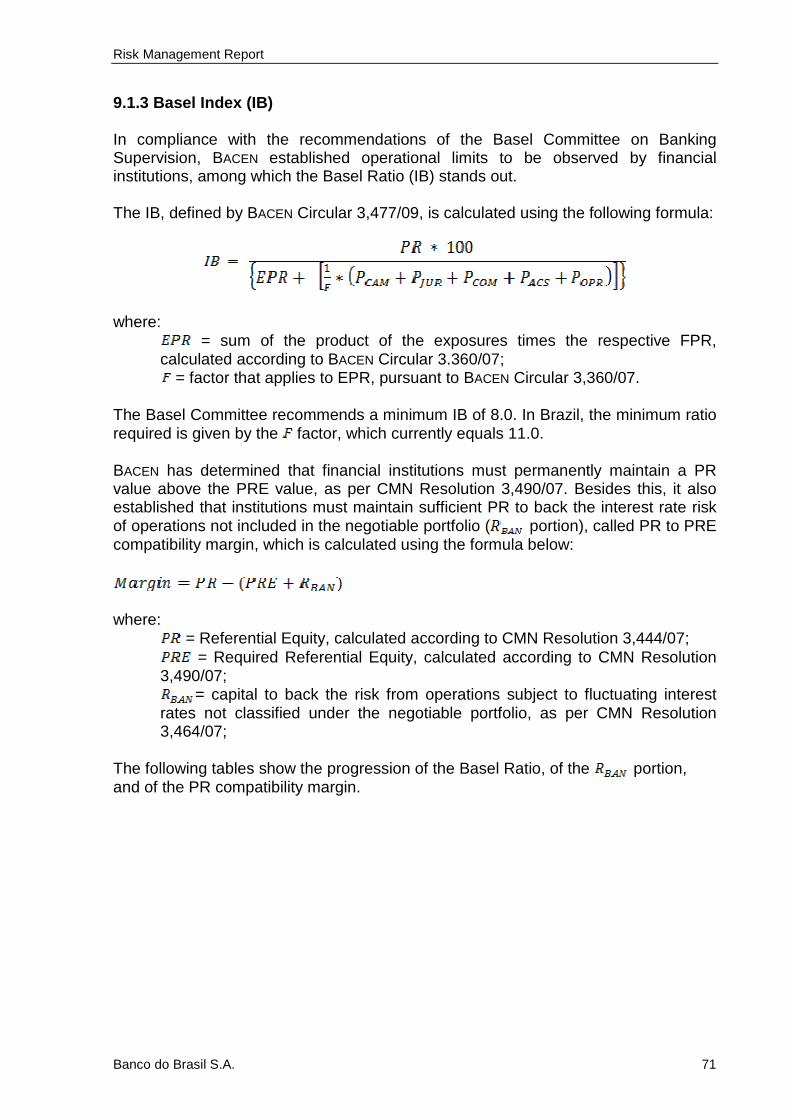
Risk Management Report
Banco do Brasil S.A. 71
9.1.3 Basel Index (IB) In compliance with the recommendations of the Basel Committee on Banking Supervision, BACEN established operational limits to be observed by financial institutions, among which the Basel Ratio (IB) stands out. The IB, defined by BACEN Circular 3,477/09, is calculated using the following formula:
where:
= sum of the product of the exposures times the respective FPR, calculated according to BACEN Circular 3.360/07;
= factor that applies to EPR, pursuant to BACEN Circular 3,360/07. The Basel Committee recommends a minimum IB of 8.0. In Brazil, the minimum ratio required is given by the factor, which currently equals 11.0. BACEN has determined that financial institutions must permanently maintain a PR value above the PRE value, as per CMN Resolution 3,490/07. Besides this, it also established that institutions must maintain sufficient PR to back the interest rate risk of operations not included in the negotiable portfolio ( portion), called PR to PRE compatibility margin, which is calculated using the formula below:
where:
= Referential Equity, calculated according to CMN Resolution 3,444/07; = Required Referential Equity, calculated according to CMN Resolution
3,490/07; = capital to back the risk from operations subject to fluctuating interest
rates not classified under the negotiable portfolio, as per CMN Resolution 3,464/07;
The following tables show the progression of the Basel Ratio, of the portion, and of the PR compatibility margin.

Risk Management Report
Banco do Brasil S.A. 72
Table 46. The Basel ratio and capital margin — Financial Conglomerate.
Table 47 . The Basel ratio and capital margin — Consolidated Economic and
Financial

Risk Management Report
Banco do Brasil S.A. 73
9.2 Economic Capital In its internal risk management processes, Banco do Brasil uses the economic capital concept. The following table shows the total economic capital requirement, segregated by type of risk. Table 48 . Economic Capital
R$ thousand 2Q10 3Q10 4Q10 1Q11 2Q11
Credit Risk(1)8,203,893 8,009,650 9,077,765 9,367,851 9,562,984
Market Risk(2)
107,955 440,956 217,117 226,836 155,127
Operational Risk 2,108,852 2,137,135 2,275,429 2,544,910 2,662,162
TOTAL 10,420,700 10,587,741 11,570,311 12,139,597 12,380,273
(1) For the credit portfolio and giving guarantees
(2) Capital to back the Negotiable Portfolio’s market risk (Bacen Circ. 3,354), Foreign Exchange and
Commodities. Next is the economic capital required for credit risks, detailed by macro-sectors and by company or individual, not considering Banco Votorantim S.A.’s operations.
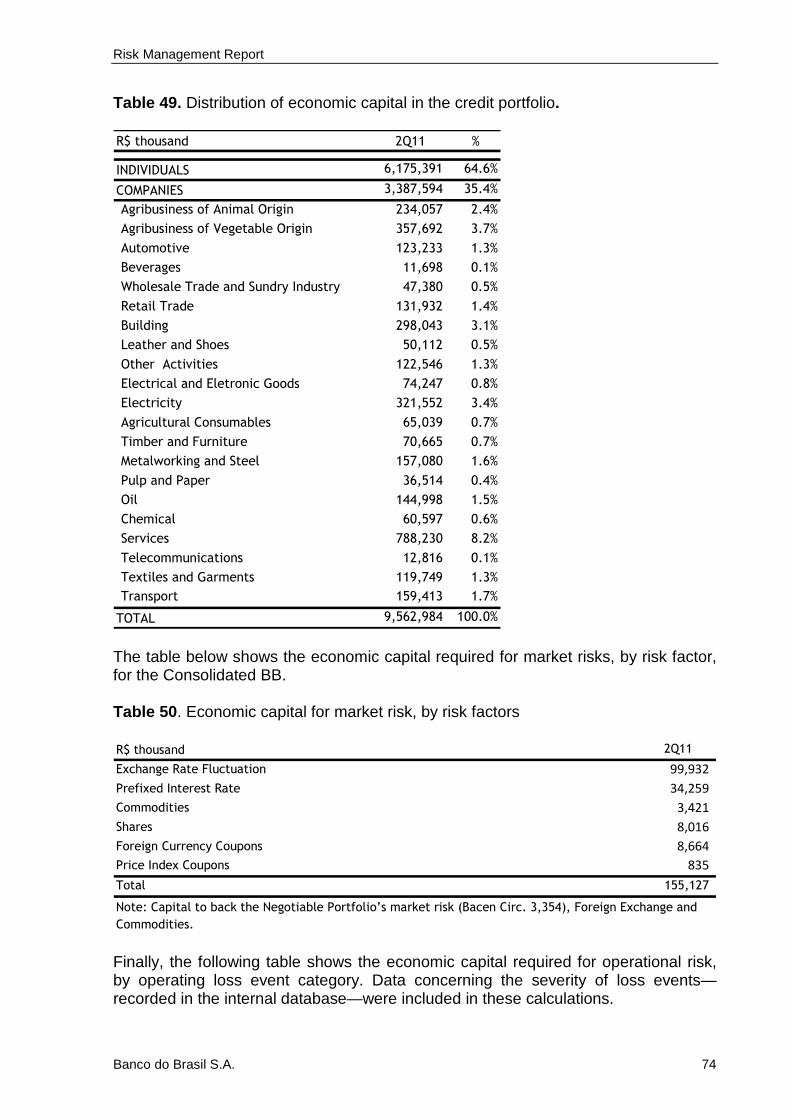
Risk Management Report
Banco do Brasil S.A. 74
Table 49. Distribution of economic capital in the credit portfolio. R$ thousand 2Q11 %
INDIVIDUALS 6,175,391 64.6%
COMPANIES 3,387,594 35.4%
Agribusiness of Animal Origin 234,057 2.4%
Agribusiness of Vegetable Origin 357,692 3.7%
Automotive 123,233 1.3%
Beverages 11,698 0.1%
Wholesale Trade and Sundry Industry 47,380 0.5%
Retail Trade 131,932 1.4%
Building 298,043 3.1%
Leather and Shoes 50,112 0.5%
Other Activities 122,546 1.3%
Electrical and Eletronic Goods 74,247 0.8%
Electricity 321,552 3.4%
Agricultural Consumables 65,039 0.7%
Timber and Furniture 70,665 0.7%
Metalworking and Steel 157,080 1.6%
Pulp and Paper 36,514 0.4%
Oil 144,998 1.5%
Chemical 60,597 0.6%
Services 788,230 8.2%
Telecommunications 12,816 0.1%
Textiles and Garments 119,749 1.3%
Transport 159,413 1.7%
TOTAL 9,562,984 100.0% The table below shows the economic capital required for market risks, by risk factor, for the Consolidated BB. Table 50 . Economic capital for market risk, by risk factors R$ thousand 2Q11
Exchange Rate Fluctuation 99,932
Prefixed Interest Rate 34,259
Commodities 3,421
Shares 8,016
Foreign Currency Coupons 8,664
Price Index Coupons 835
Total 155,127
Note: Capital to back the Negotiable Portfolio’s market risk (Bacen Circ. 3,354), Foreign Exchange and
Commodities. Finally, the following table shows the economic capital required for operational risk, by operating loss event category. Data concerning the severity of loss events—recorded in the internal database—were included in these calculations.

Risk Management Report
Banco do Brasil S.A. 75
Table 51 . Economic capital for operational risk, by loss event category
R$ thousand 2Q11
External Fraud and Theft 293,885
Internal Fraud 73,094
Labor Problems 812,215
Business-related Failures 1,017,956
Damage to Physical Assets 11,170
Systems Failures 12,194
Failures in Processes 441,648
Total 2,662,162


