Risk of Opioid Overdose Death in North Carolina by Type of Opioid and Other Controlled Substances Prescribed Nabarun Dasgupta, PhD Epidemico, Inc. University of North Carolina at Chapel Hill CPDD – Phoenix June 15, 2015 Slides Twitter @epidemico 1
Transcript
Risk of Opioid Overdose Death in North Carolina by Type of Opioid and
Other Controlled Substances Prescribed
Nabarun Dasgupta, PhD
Epidemico, Inc.University of North
Carolina at Chapel Hill
CPDD – Phoenix
June 15, 2015
Slides Twitter @epidemico
1
Disclosures
Nabarun is a full-time employee of Epidemico, Inc., a public health informatics company, which is a subsidiary of Booz Allen Hamilton.
No opioid manufacturers were involved in this study.
This research was conducted in fulfillment of a doctoral dissertation requirement and funded in part by CDC.
2
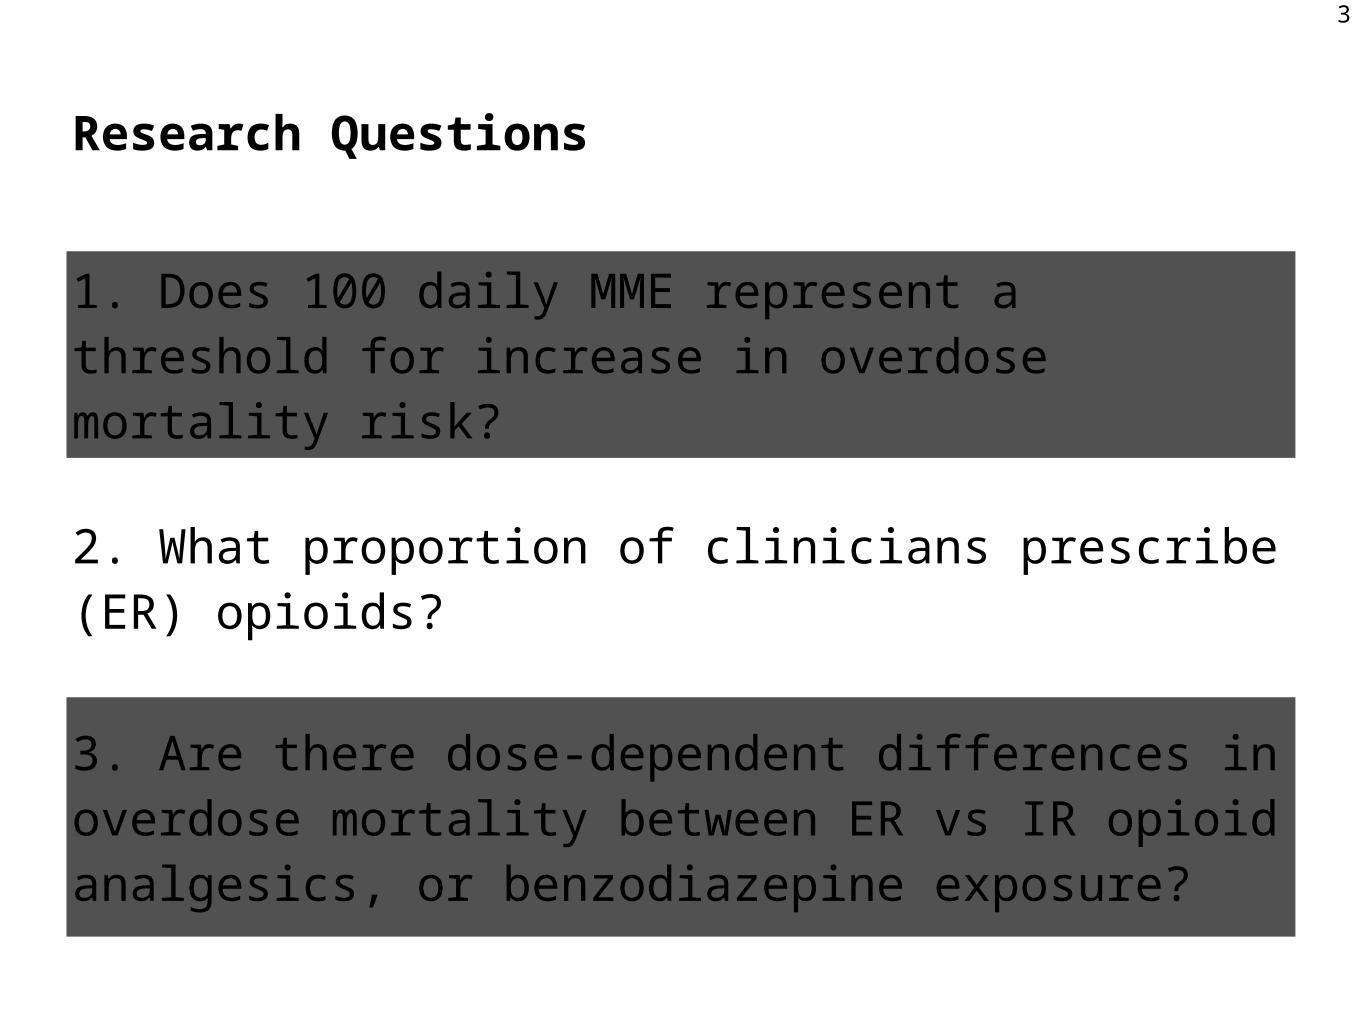
Research Questions
1. Does 100 daily MME represent a threshold for increase in overdose mortality risk?
2. What proportion of clinicians prescribe (ER) opioids?
3. Are there dose-dependent differences in overdose mortality between ER vs IR opioid analgesics, or benzodiazepine exposure?
3
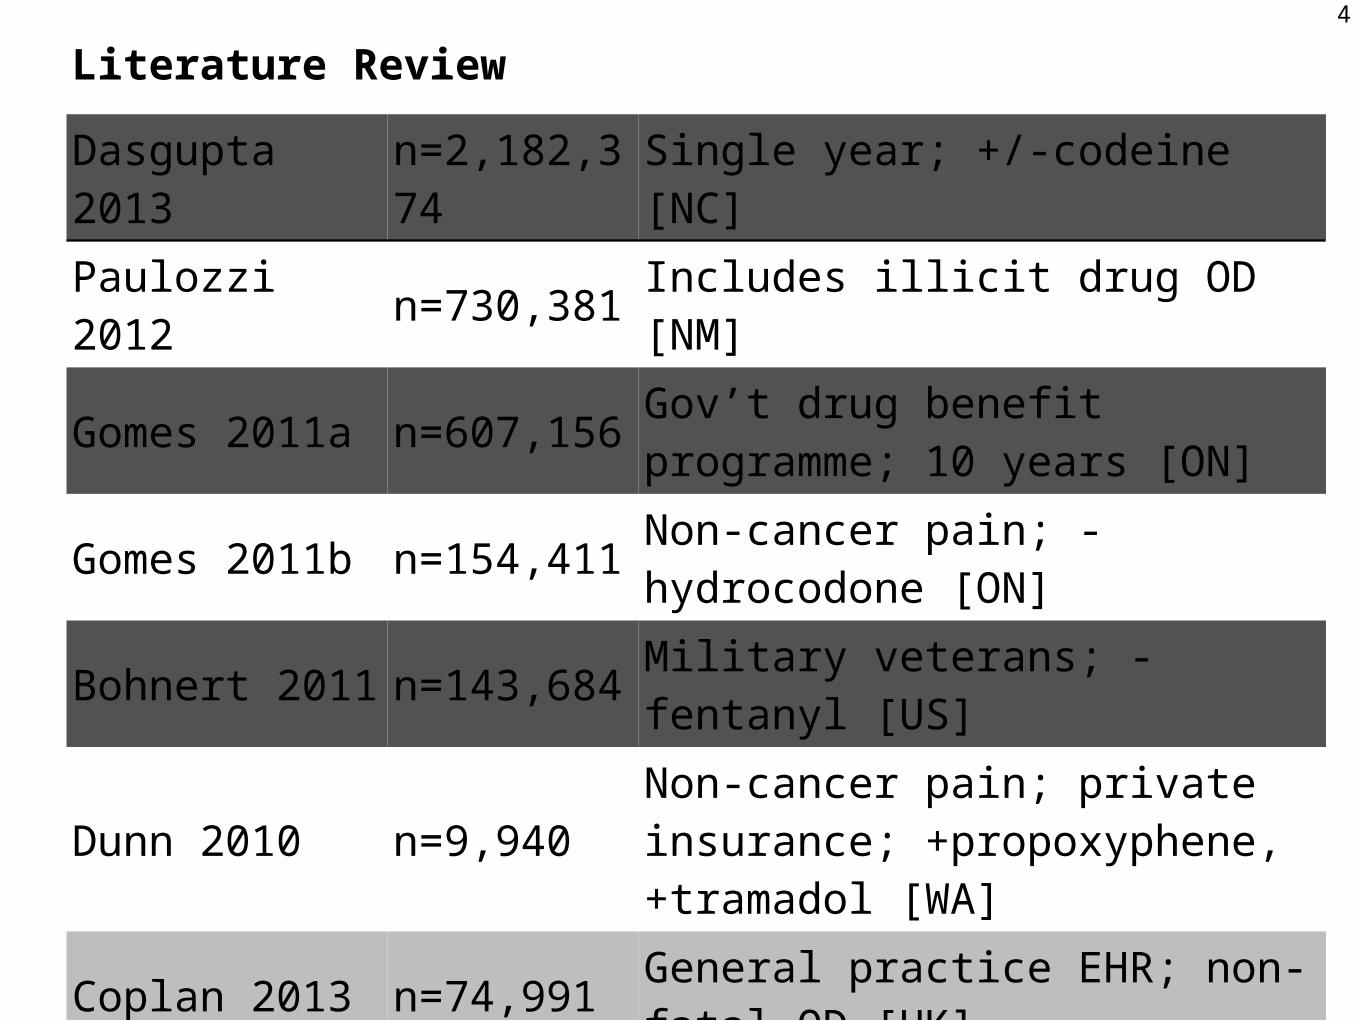
Literature Review
Dasgupta 2013
n=2,182,374
Single year; +/-codeine [NC]
Paulozzi 2012 n=730,381 Includes illicit drug OD [NM]
Gomes 2011a n=607,156Gov’t drug benefit programme; 10 years [ON]
No benzodiazepine aHR 3.3 (2.6, 4.2) for 100+ mg/dayFormer benzodiazepine aHR 3.0 (2.2, 4.1) for 100+ mg/dayCurrent benzodiazepine aHR 3.9 (3.2, 4.8) for 100+ mg/dayRef: >0 to < 20 mg/day
5
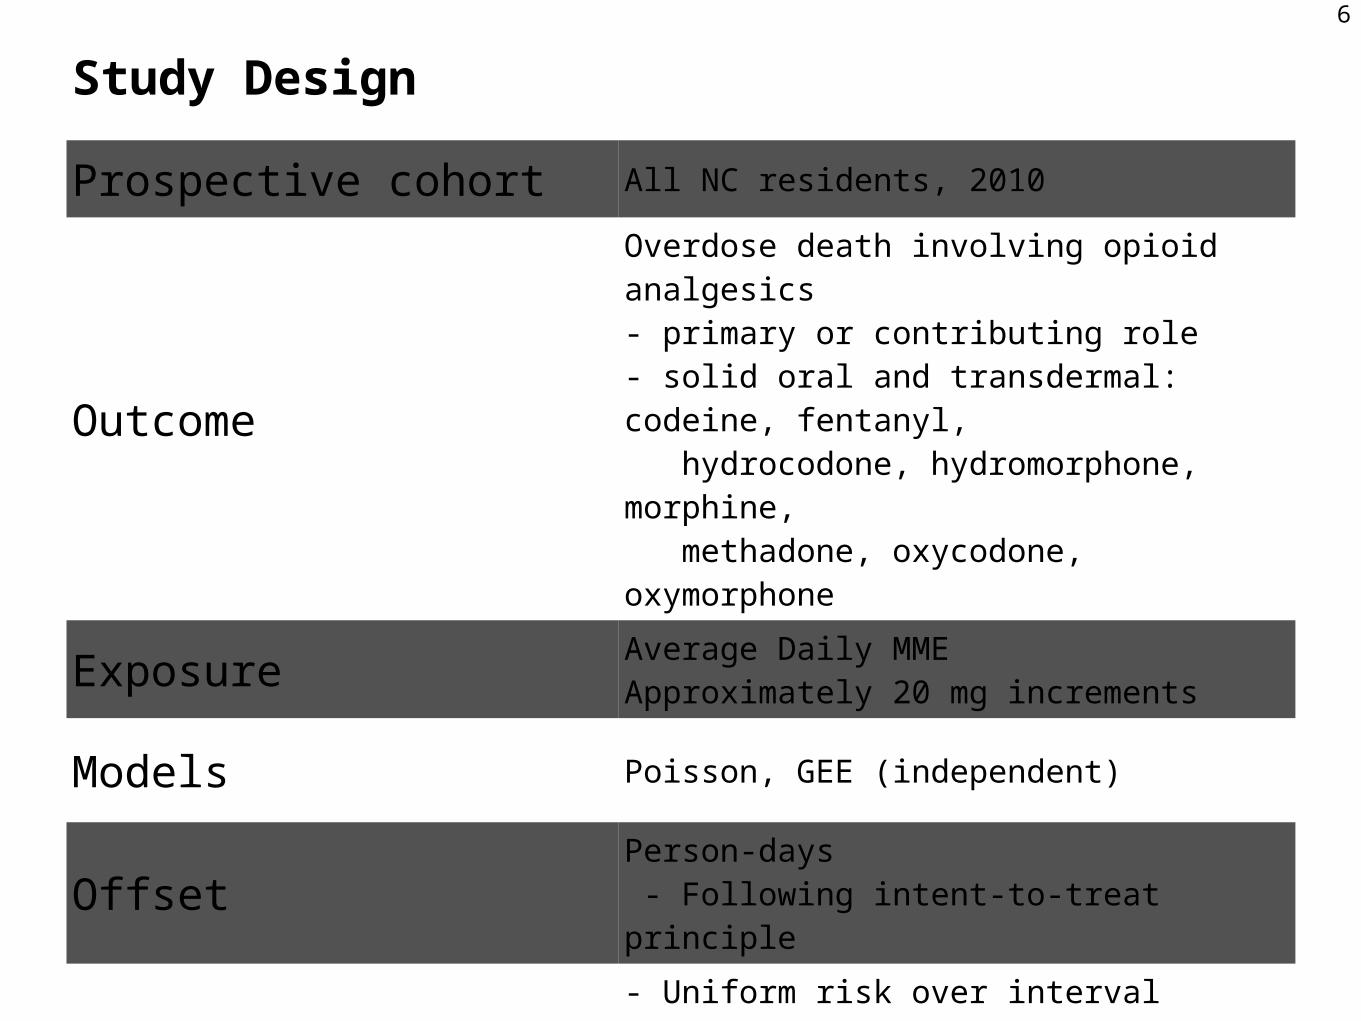
Study Design
Prospective cohort All NC residents, 2010
Outcome
Overdose death involving opioid analgesics- primary or contributing role- solid oral and transdermal: codeine, fentanyl, hydrocodone, hydromorphone, morphine, methadone, oxycodone, oxymorphone
Exposure Average Daily MMEApproximately 20 mg increments
Models Poisson, GEE (independent)
Offset Person-days - Following intent-to-treat principle
Assumptions
- Uniform risk over interval- Prescription status in one period does not influence prescription status in subsequent period- Risk not influenced by: prior exposure, other substances, number of prescriptions or pharmacies, opioid formulation
6
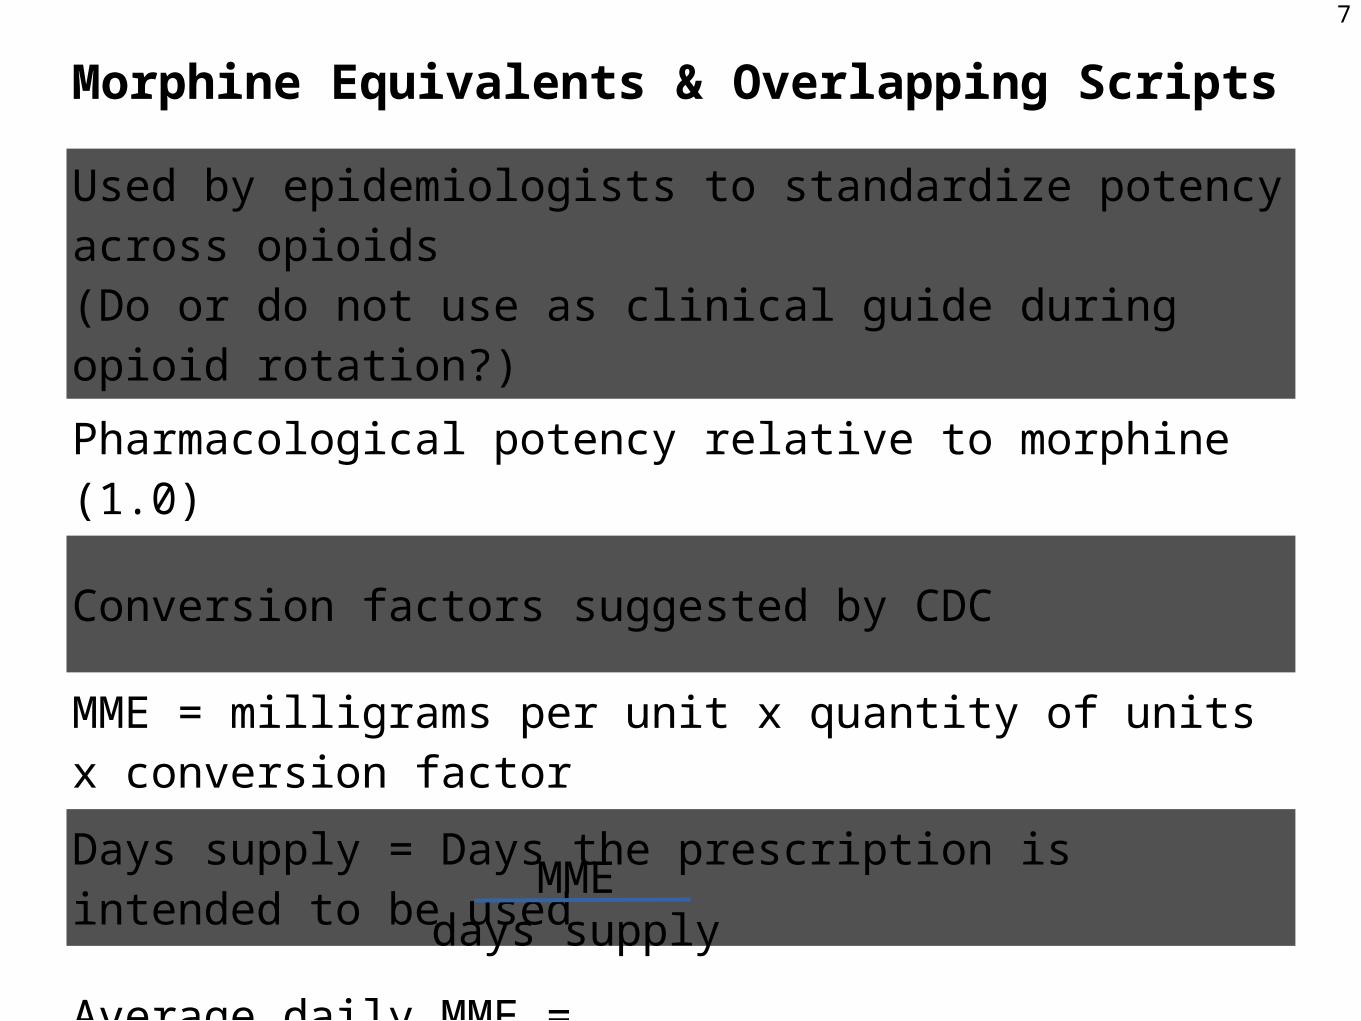
Morphine Equivalents & Overlapping Scripts
Used by epidemiologists to standardize potency across opioids(Do or do not use as clinical guide during opioid rotation?)
Pharmacological potency relative to morphine (1.0)
Conversion factors suggested by CDC
MME = milligrams per unit x quantity of units x conversion factor
Days supply = Days the prescription is intended to be used
Average daily MME =
7
MMEdays supply
8
Study FlowNumbers of participants
Data Processing9
Numbers of dispensed prescription records
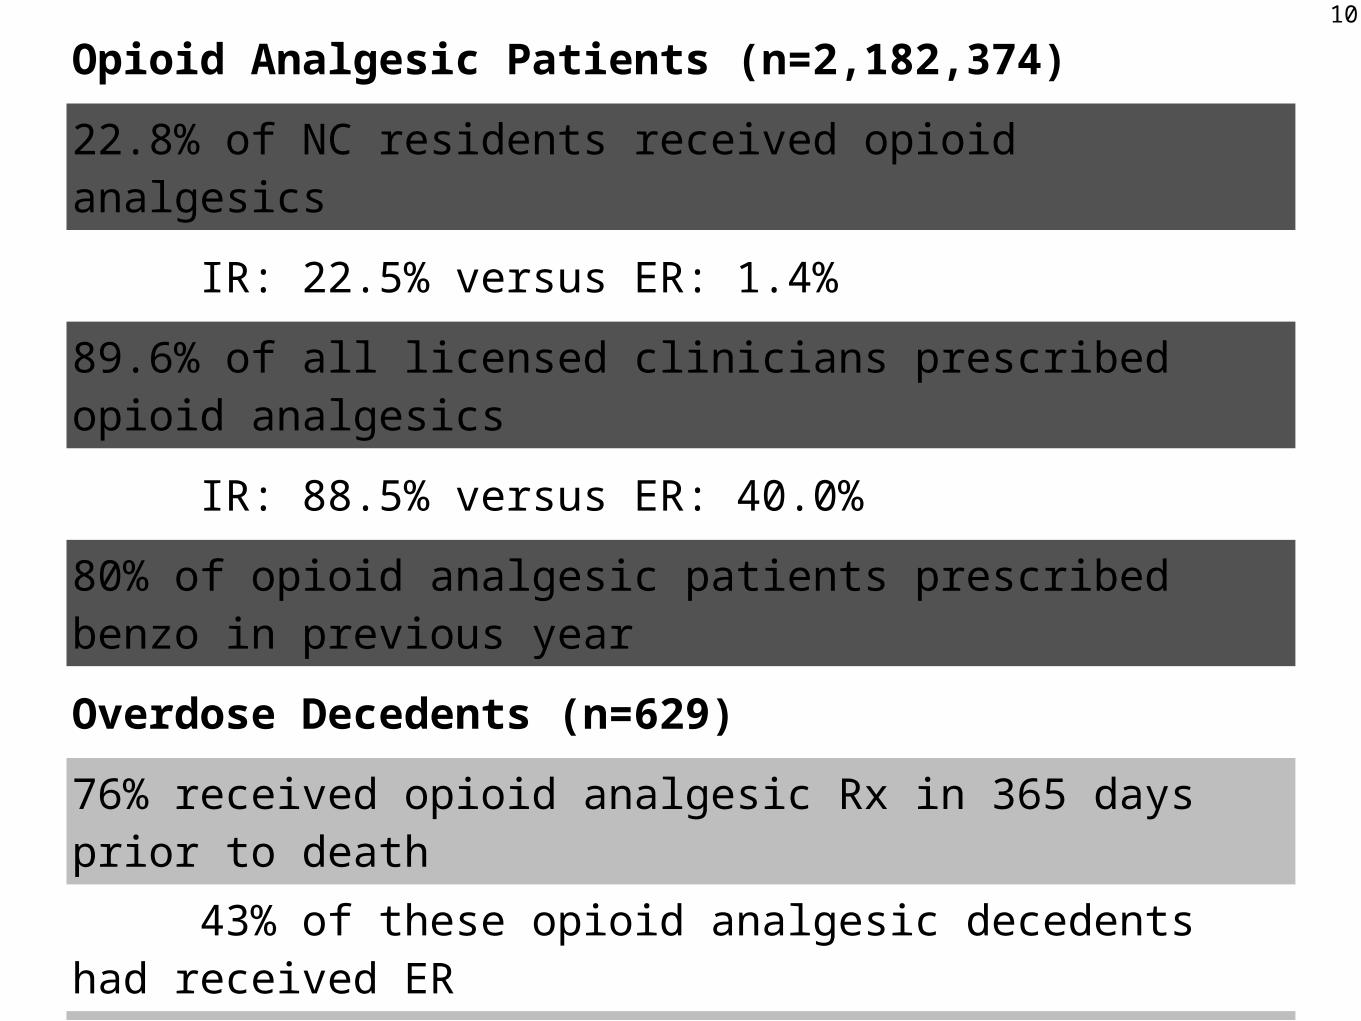
Opioid Analgesic Patients (n=2,182,374)
22.8% of NC residents received opioid analgesics
IR: 22.5% versus ER: 1.4%
89.6% of all licensed clinicians prescribed opioid analgesics
IR: 88.5% versus ER: 40.0%
80% of opioid analgesic patients prescribed benzo in previous year
Overdose Decedents (n=629)
76% received opioid analgesic Rx in 365 days prior to death 43% of these opioid analgesic decedents had received ER51% has active opioid analgesic prescription at time of death61% of opioid analgesic overdose deaths also implicated benzos
10
11
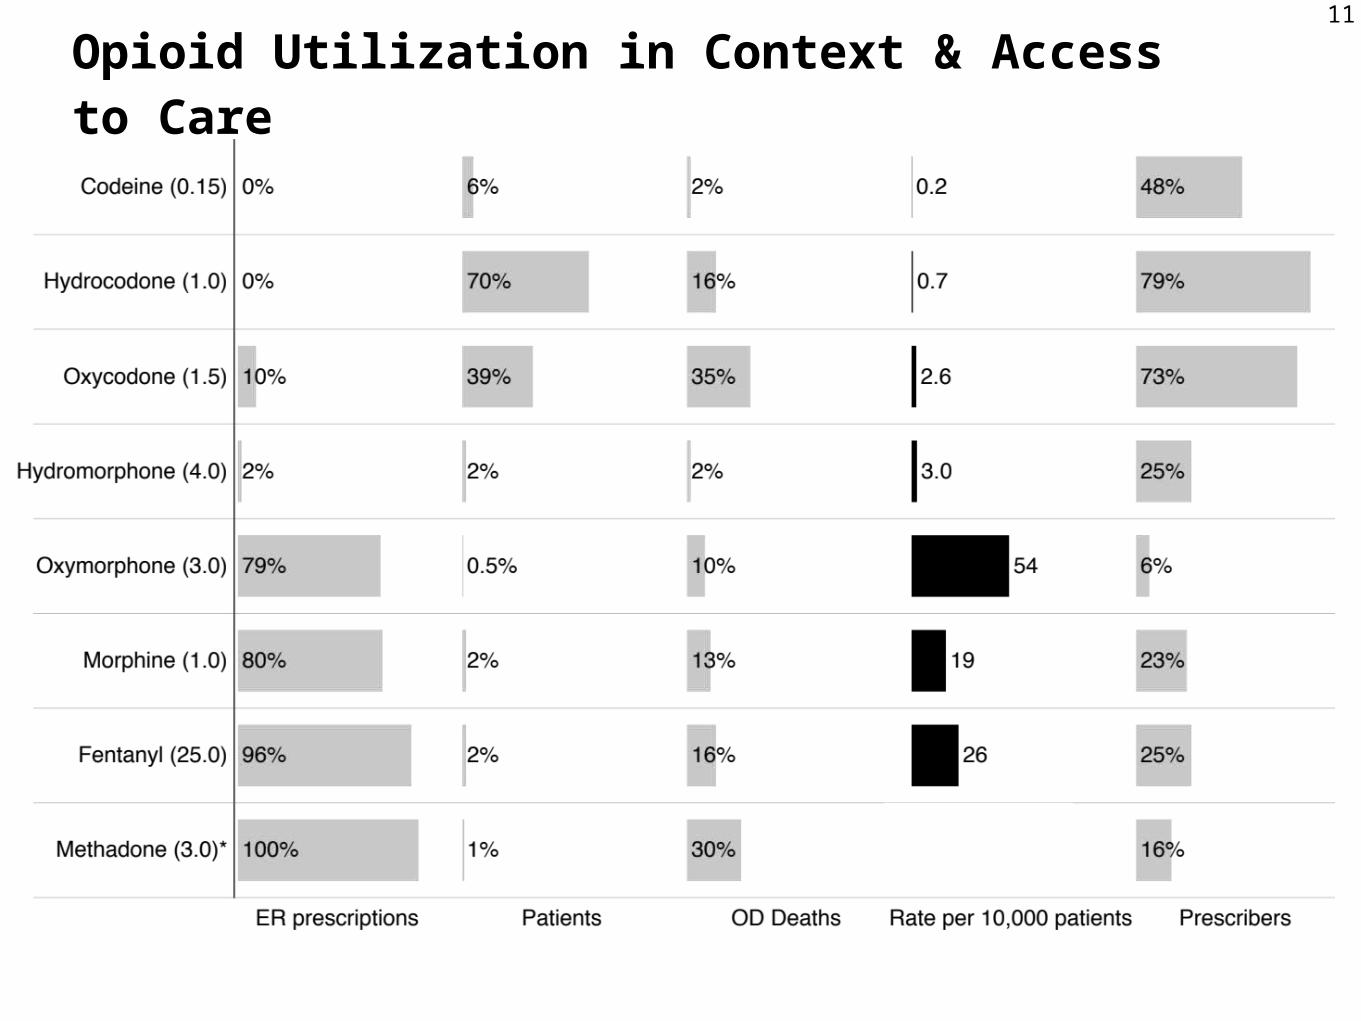
Opioid Utilization in Context & Access to Care
12
13
14
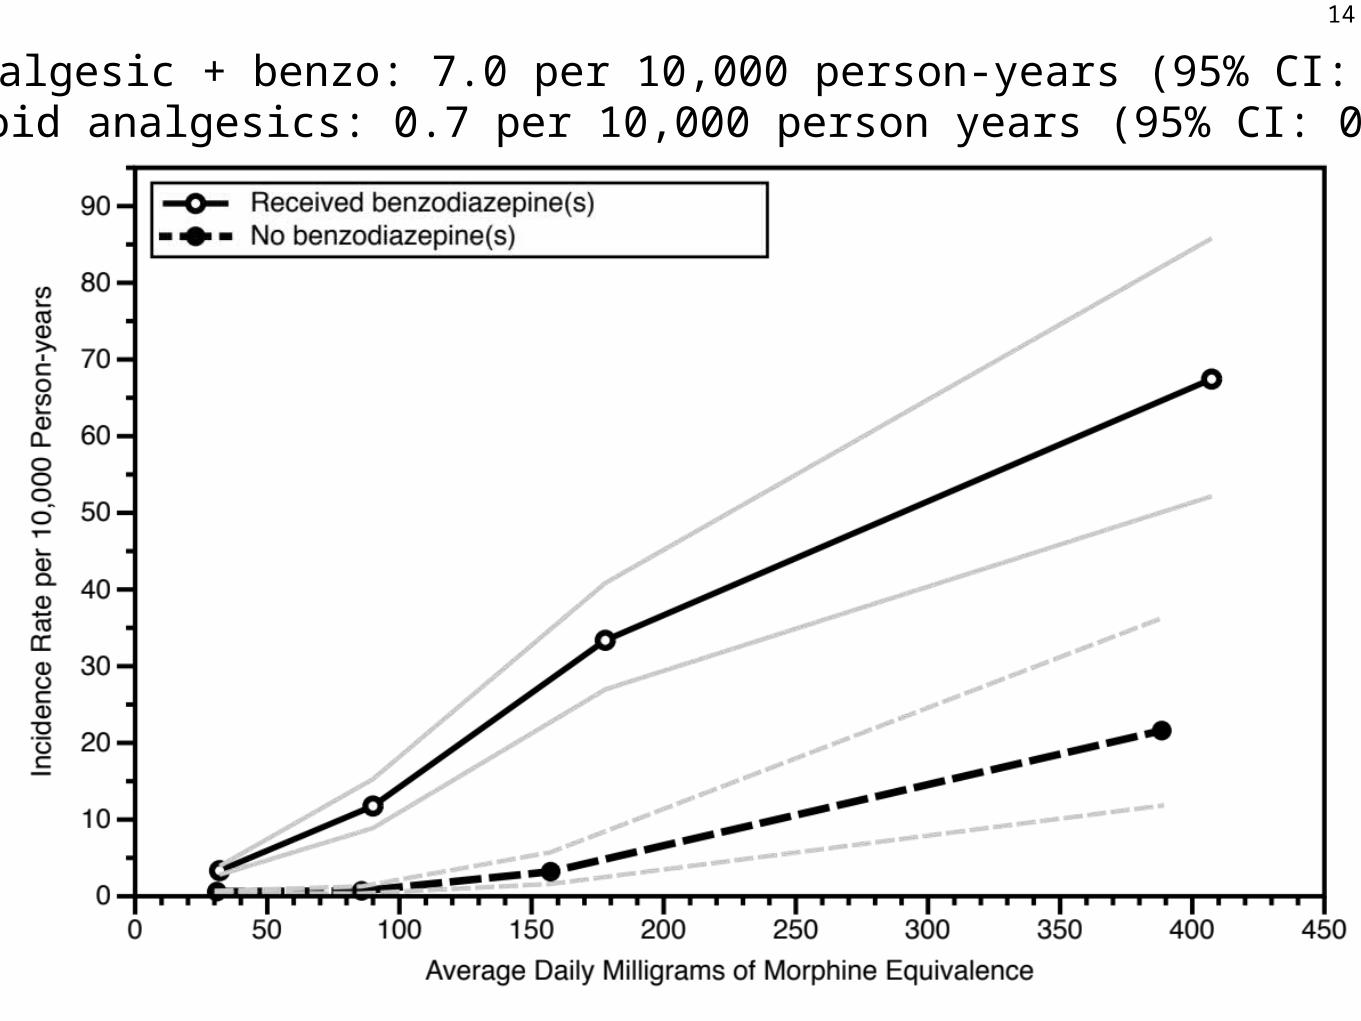
Opioid analgesic + benzo: 7.0 per 10,000 person-years (95% CI: 6.3, 7.8)Only opioid analgesics: 0.7 per 10,000 person years (95% CI: 0.6, 0.9)
15
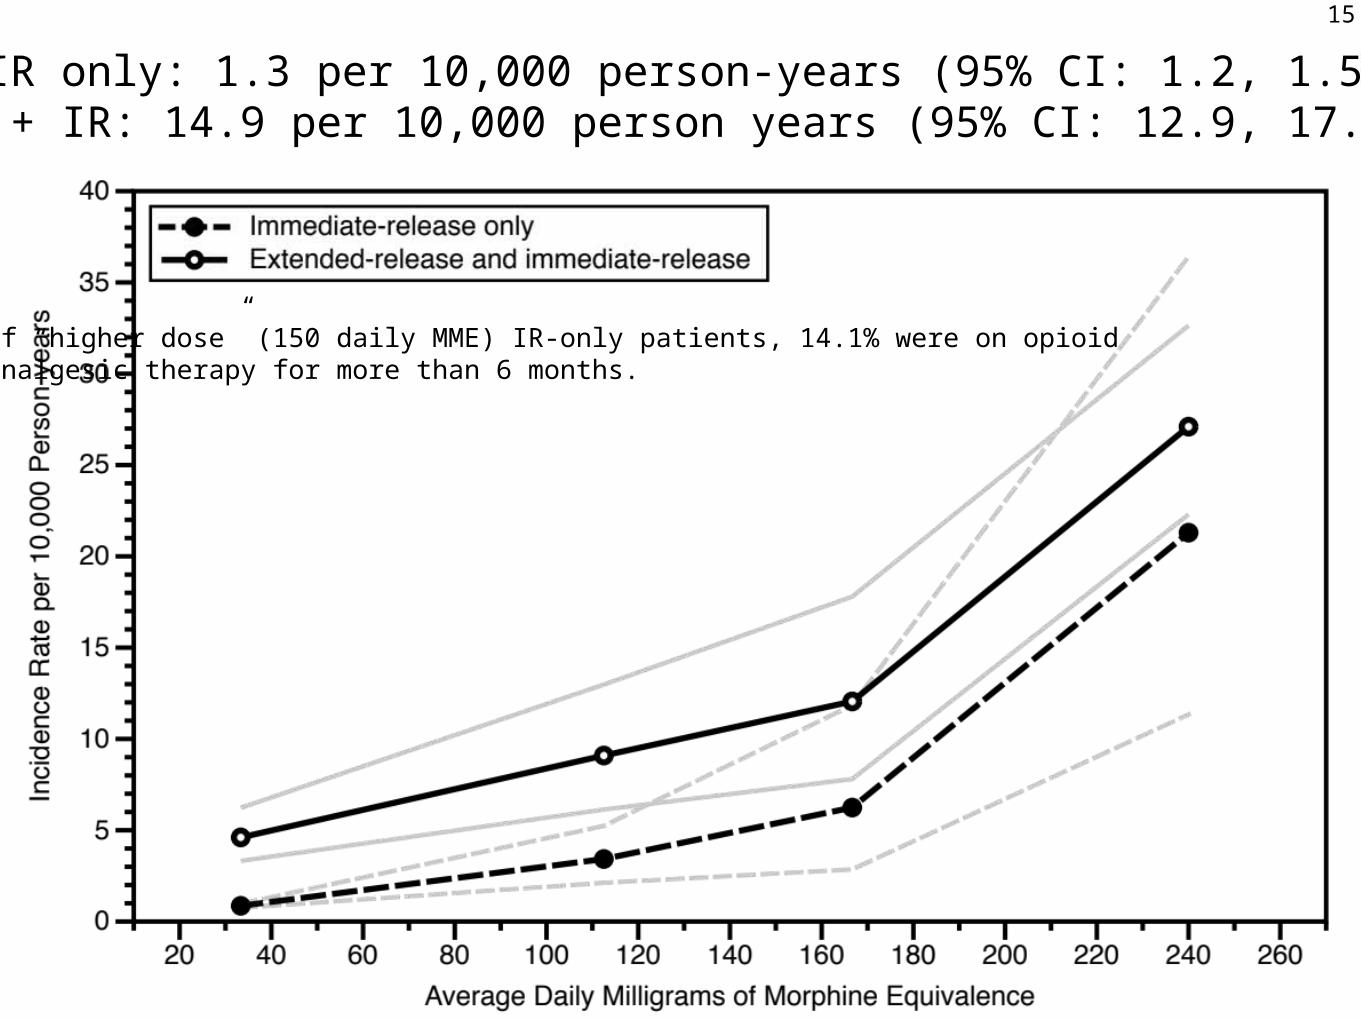
IR only: 1.3 per 10,000 person-years (95% CI: 1.2, 1.5)ER + IR: 14.9 per 10,000 person years (95% CI: 12.9, 17.1)
Of “higher dose” (150 daily MME) IR-only patients, 14.1% were on opioidanalgesic therapy for more than 6 months.
Limitations
Exchangeability - why do patients receive higher doses?
Assumption of continuous risk during time exposed
Previous therapy and opioid tolerance not assessed
External factors that influence opioid mortality (e.g., ADFs)
Identification of overdose deaths and causality assessment
Adherence to therapy and exposure to diverted opioids
16
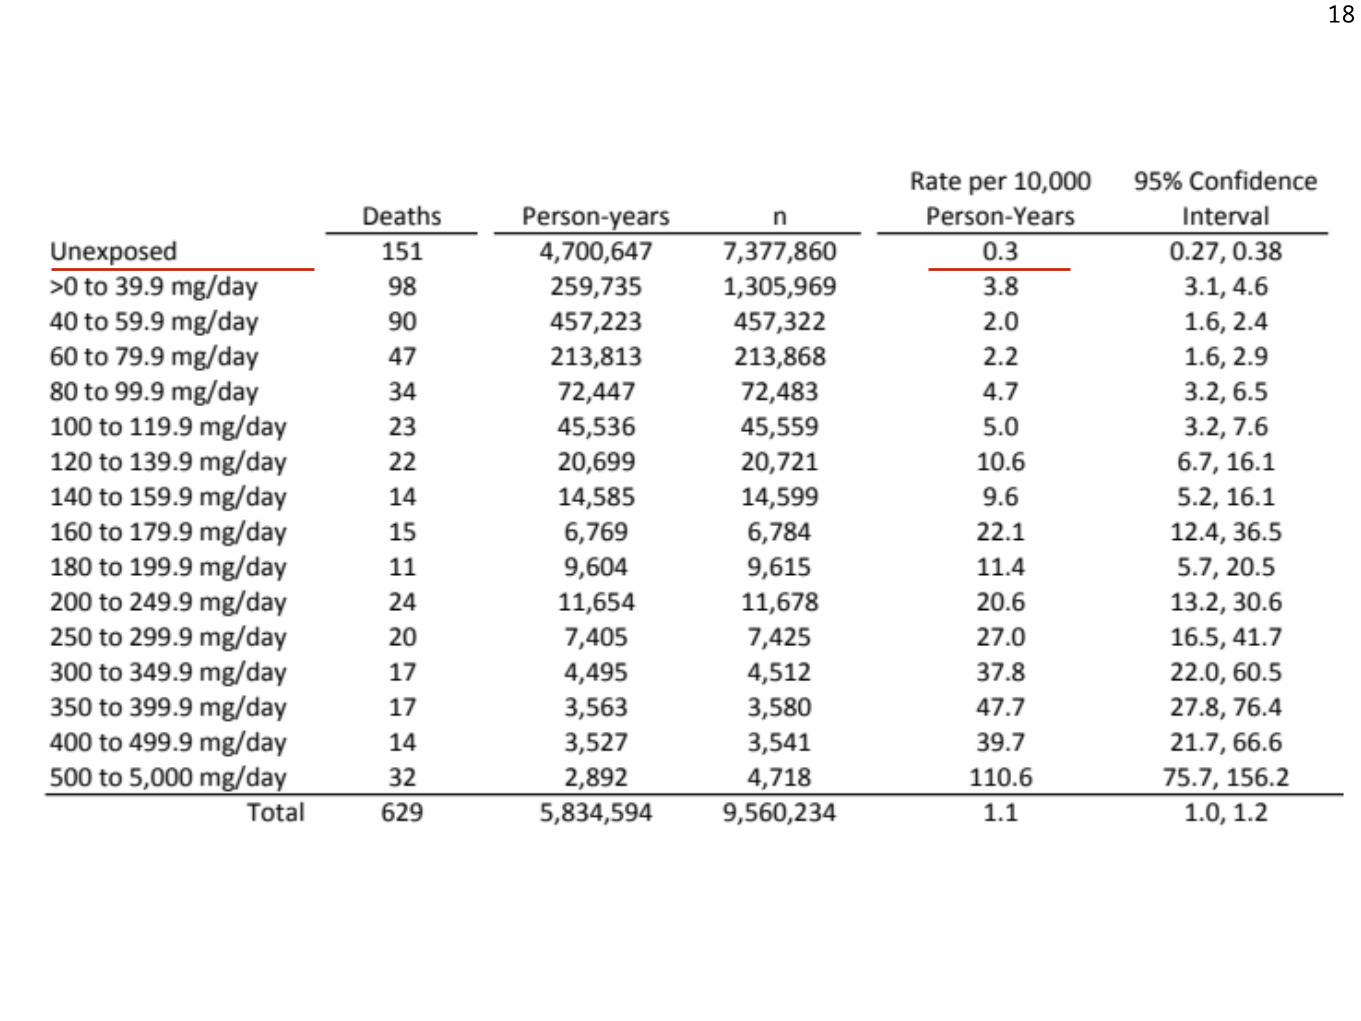
Source: Dasgupta 2014, Drug & Alcohol Dependence
17
18
19
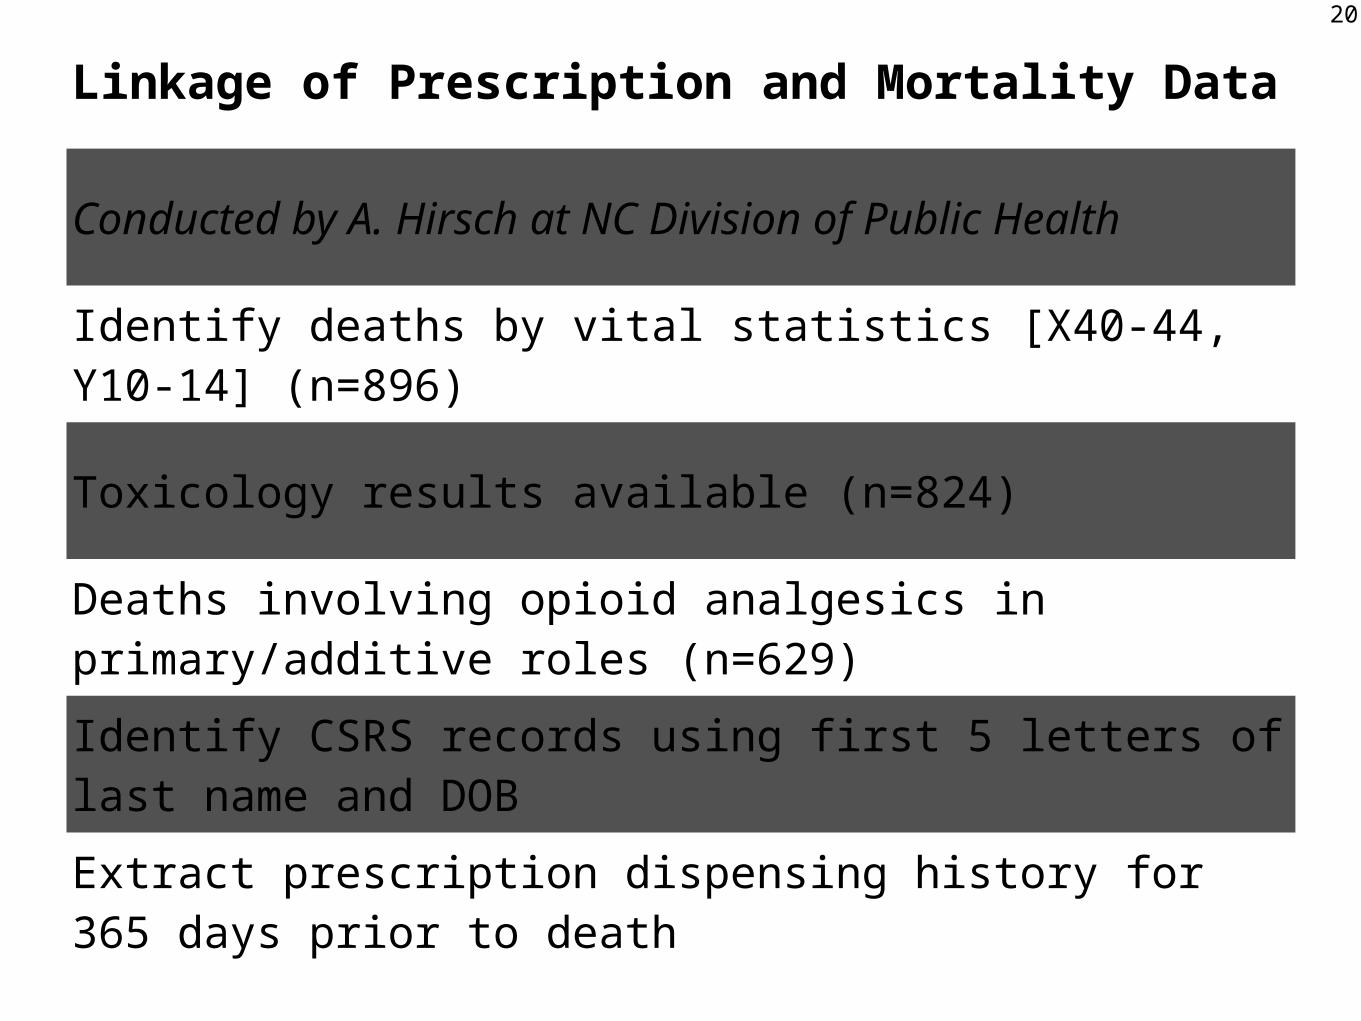
Linkage of Prescription and Mortality Data
Conducted by A. Hirsch at NC Division of Public Health
Identify deaths by vital statistics [X40-44, Y10-14] (n=896)
Toxicology results available (n=824)
Deaths involving opioid analgesics in primary/additive roles (n=629)
Identify CSRS records using first 5 letters of last name and DOB
Extract prescription dispensing history for 365 days prior to death