86
Risk, Resilience, and Behavioral Health in the Ohio National Guard, 2008-2012
| Date post: | 28-Dec-2015 |
| Category: |
Documents |
| Upload: | claude-obrien |
| View: | 216 times |
| Download: | 2 times |

Risk, Resilience, and Behavioral Health in the Ohio National Guard, 2008-2012

I. DEMOGRAPHICS: The Who
2

male female white black other 17 - 24 25 - 34 35 - 44 45+0
10
20
30
40
50
60
70
80
90
100
85
15
88
75
3432
24
10
86
14
89
74
26
36
25
13
84.9
15.1
87.3
7.45.3
33.6 34.8
19.6
11.9
85
15
88
75
3134
21
14
W1W2W3W4
ONG sample demographics (1)
race agegender
*Waves 3 and 4 include the dynamic cohorts
% a
mon
g th
ose
in e
ach
wav
e

0
10
20
30
40
50
60
70
80
90
100
4743
10
86
1
12
52
37
11
83
2
15
46 45
9
82
1
16
48
42
10
80
1
18
W1
W2
W3
W4
ONG sample demographics (2)
rankmarital status
*Waves 3 and 4 include the dynamic cohorts
% a
mon
g th
ose
in e
ach
wav
e

male female white black other 17-24 25-34 35-44 45+0
10
20
30
40
50
60
70
80
90
100
88
12
90.1
72.9
30
37.8
21
11.2
88
12
90
73
24
39
23
13
88
12
89
74
29
37
20
14
88
12
88
84
27
37
21
15
W1
W2
W3
W4
Clinical sub-sample demographics (1)
race agegender
% a
mon
g th
ose
in e
ach
wav
e
*Waves 3 and 4 include the dynamic cohorts

0
10
20
30
40
50
60
70
80
90
100
41
48
11
88.6
2
9.4
35.6
53
11.5
88
2.5
9.5
41
48
10
87
3
10
40
50
10
86
2
12
W1
W2
W3
W4
Clinical sub-sample demographics (2)
rankmarital status
*Waves 3 and 4 include the dynamic cohorts
% a
mon
g th
ose
in e
ach
wav
e

II. DEPLOYMENT CYCLES
7

Number of lifetime deployments per person at baseline
0 1 2 3 4 5 ≥ 6 0
5
10
15
20
25
30
35
4036.0
31.3
17.9
8.2
2.7 2.0 2.0
Number of lifetime deployments
% o
f sol
dier
s
%
%
%
%
% % %

Proportion deployed within past year by wave and location
0
5
10
15
20
25
30
26.4
9.8 10.2
25.7
8.6 8.17.1
18.917.7
1.63.1
6.8
Total Deployed
Area of Conflict
Non-conflict Area
2009 2010 2011 20122008
W1 W2 W3 W4
Area of conflict = Iraq or Afghanistan. Non-conflict area = U.S, Saudi Arabia and Kuwait, other
% o
f sol
dier
s de
ploy
ed
Kuwait and domestic hurricane relief
Afghanistan surge

Year 2 Year 3 Year 40.0
5.0
10.0
15.0
20.0
25.0
30.0
35.0
40.0
9.8 10.2
25.7
9.2 9.2
24.4
0.6 0.7 0.90.1 0.3 0.4
Total Deployed
1 Deployment
2 Deployments
≥ 3 Deployments
Number of deployments per person within past year through the course of the study
III. RISK AND RESILIENCE
12

13
Three elements of risk
Pre-deployment
Peri-deployment
Post-deployment

14
Pre-deployment risk factors
Pre-deployment
Peri-deployment
Post-deployment

Sexual assault: most lifetime sexual traumas reported at baseline occurred outside of a deployment setting
5% 7%
Women Men
Rape
(n=61)
6% 4%
Sexual assault
(n=114) (n=106)
(n=14)
(n=2228)(n=388)n=2616
Not deployment-related
Deployment-related

Pre-deployment preparation: Most soldiers in the sample agreed that they felt well-prepared
16
Strongly disagree
Strongly agree
Scale from the Deployment Risk and Resilience Inventory: A Collection of Measures for Studying Deployment-Related Experiences of Military Personnel and Veterans
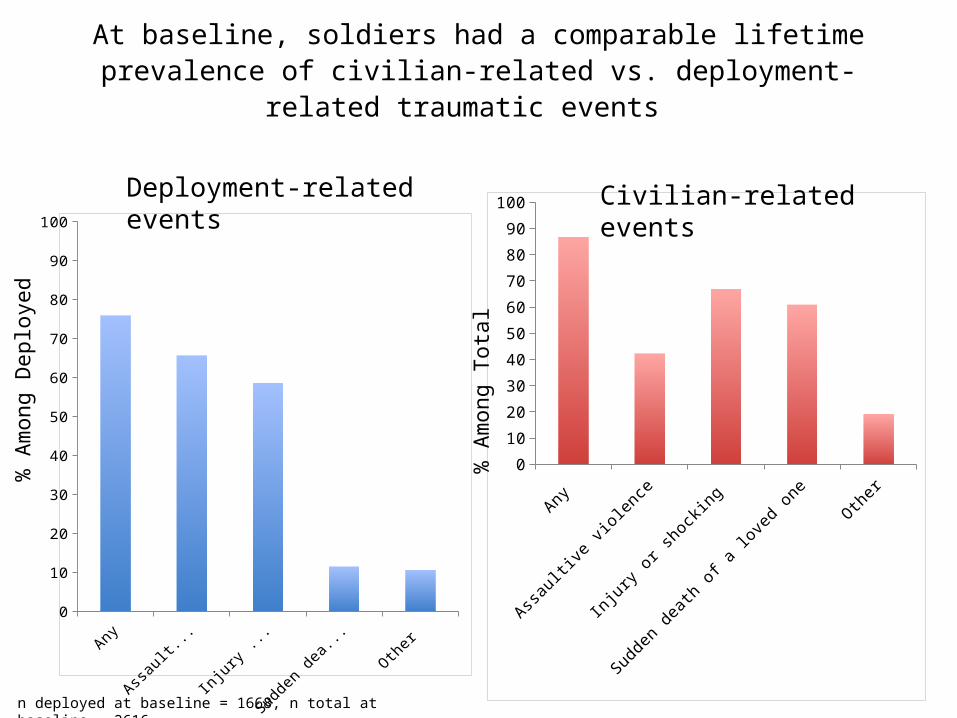
At baseline, soldiers had a comparable lifetime prevalence of civilian-related vs. deployment-related traumatic events
Any Assaultive violence
Injury or shocking
Sudden death of a loved one
Other 0
10
20
30
40
50
60
70
80
90
100
Deployment-related events
% A
mon
g D
eplo
yed
Any Assaultive violence
Injury or shocking
Sudden death of a loved one
Other0
10
20
30
40
50
60
70
80
90
100
% A
mon
g To
tal
Civilian-related events
n deployed at baseline = 1668, n total at baseline = 2616

Assaultive events
58%
Non-assaultive events or no
events42%
n = 1839, respondents in baseline who specified their deployment status and did not have events of ambiguous settings or types
Among both settings, assaultive-type events were more common

19
Peri-deployment risk factors
Pre-deployment
Peri-deployment
Post-deployment
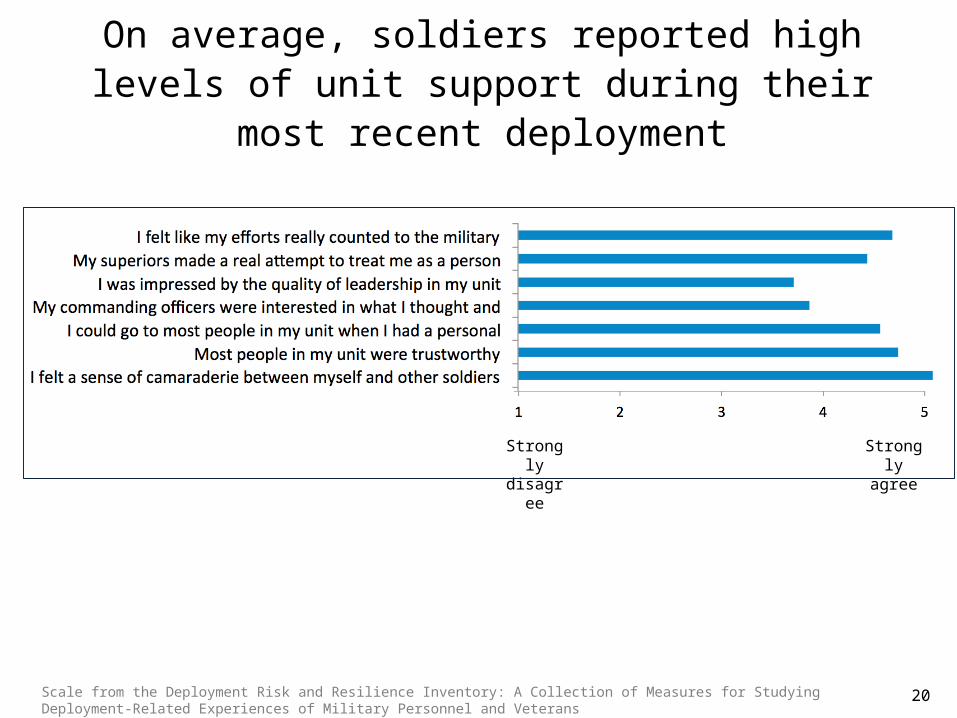
On average, soldiers reported high levels of unit support during their most recent deployment
20Scale from the Deployment Risk and Resilience Inventory: A Collection of Measures for Studying Deployment-Related Experiences of Military Personnel and Veterans
Strongly disagree
Strongly agree
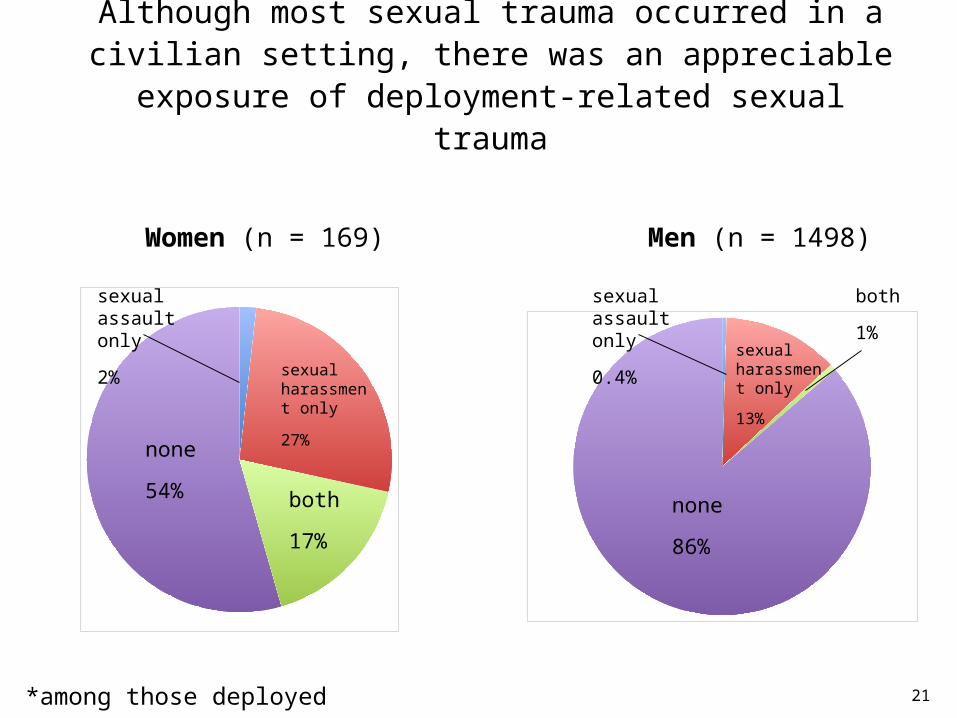
Although most sexual trauma occurred in a civilian setting, there was an appreciable exposure of deployment-related
sexual trauma
21
Women (n = 169) Men (n = 1498)
none
54%none
86%
sexual harassment only
27%
sexual harassment only
13%
both
17%
sexual assault only
0.4%
both
1%
sexual assault only
2%
*among those deployed

Many soldiers experienced extremely stressful combat-related events during deployment
22
Saw dead bodies
Saw severely w
ounded people
Took care of in
jured or dying people
0
10
20
30
40
50
60
70
34.8
41.3
24.7
% a
mon
g th
ose
depl
oyed
n = 1668
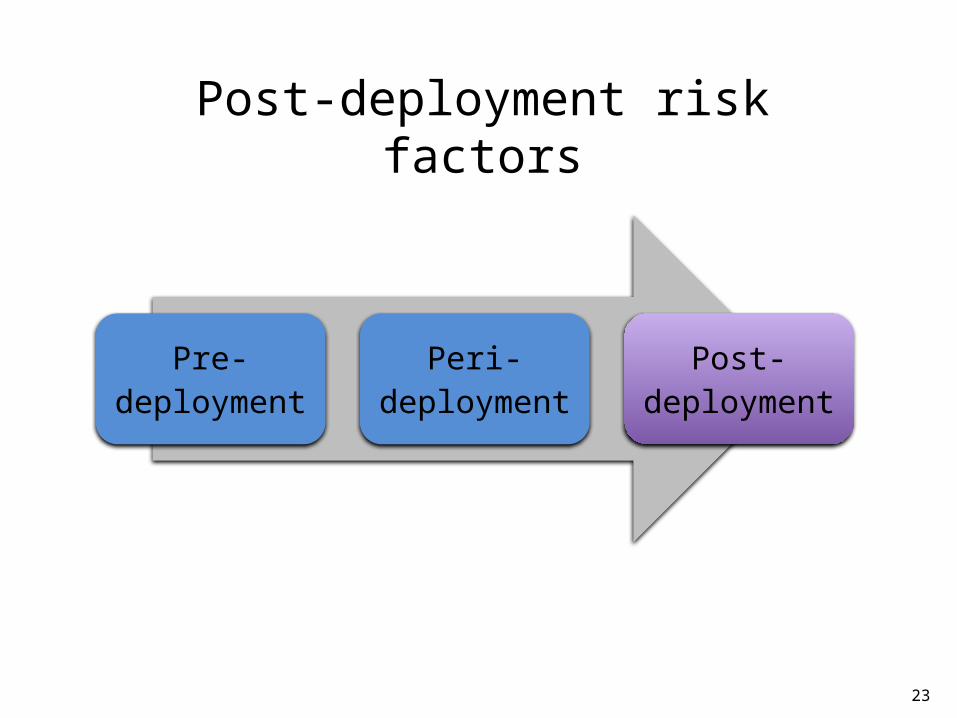
23
Post-deployment risk factors
Pre-deployment
Peri-deployment
Post-deployment

Soldiers in general reported feeling supported post-deployment, but not necessarily understood
24Scale from the Deployment Risk and Resilience Inventory: A Collection of Measures for Studying Deployment-Related Experiences of Military Personnel and Veterans
Strongly disagree
Strongly agree

25
Post-deployment unemployment: At each wave, about 18% of soldiers deployed in the past year lost a job, were laid off, or
lost a large part of their income in the past year
010203040506070
19.2 17.3 18
% o
ut o
f tho
se d
eplo
yed
in p
ast y
ear
IV. Psychiatric disorders

27
IV. Psychiatric disorders
-An overview
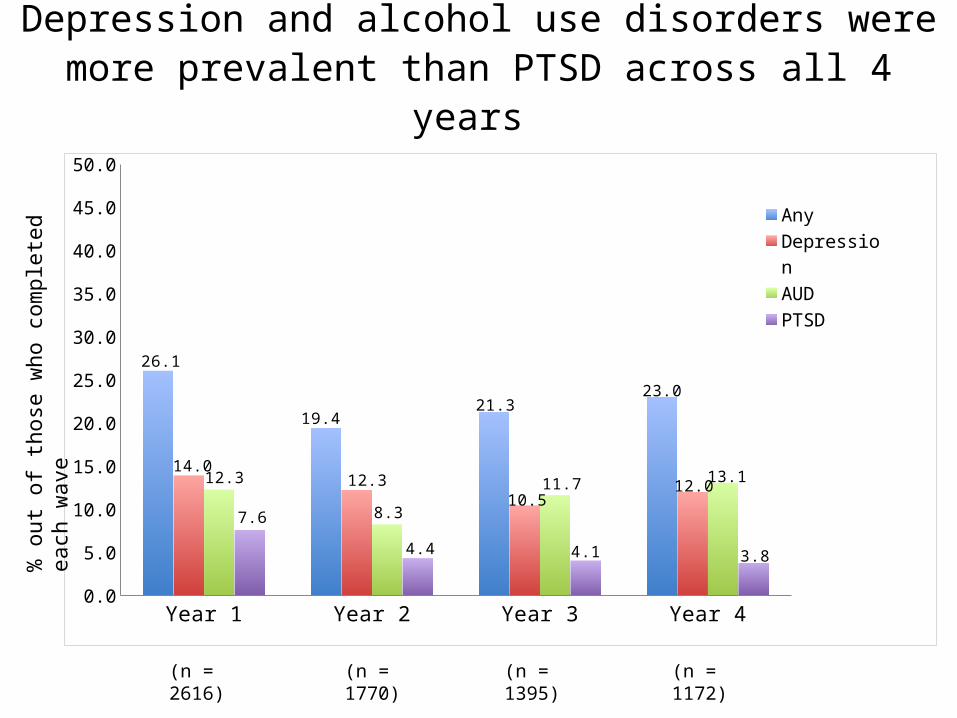
Year 1 Year 2 Year 3 Year 40.0
5.0
10.0
15.0
20.0
25.0
30.0
35.0
40.0
45.0
50.0
26.1
19.421.3
23.0
14.012.3
10.512.012.3
8.3
11.7 13.1
7.6
4.4 4.1 3.8
Any
Depression
AUD
PTSD
Depression and alcohol use disorders were more prevalent than PTSD across all 4 years
% o
ut o
f tho
se w
ho c
ompl
eted
eac
h w
ave
(n = 2616) (n = 1770) (n = 1395) (n = 1172)

Prevalence of all condition co-morbidity at baseline
42%
41%
17%
74%
19%
7%
85%
12%3%
Past 30 days Past year Lifetime
No disorder One disorder At least two disorders
29

Baseline prevalence of other conditions among those with PTSD within the past year (N=188)
30
Alcohol abuse Generalized anxiety disorder
Alcohol dependence Depressive disorder0
10
20
30
40
50
60
7.45
15.96 17.02
48.94
% w
ith c
ondi
tion
amon
g th
ose
with
PTS
D
38% has no other condition, 41% had one other condition, and 20% had 2 or more.
V. Psychopathology by risk and resilience factors:
How do the “pre-, peri-, and post-” matter?
31
32
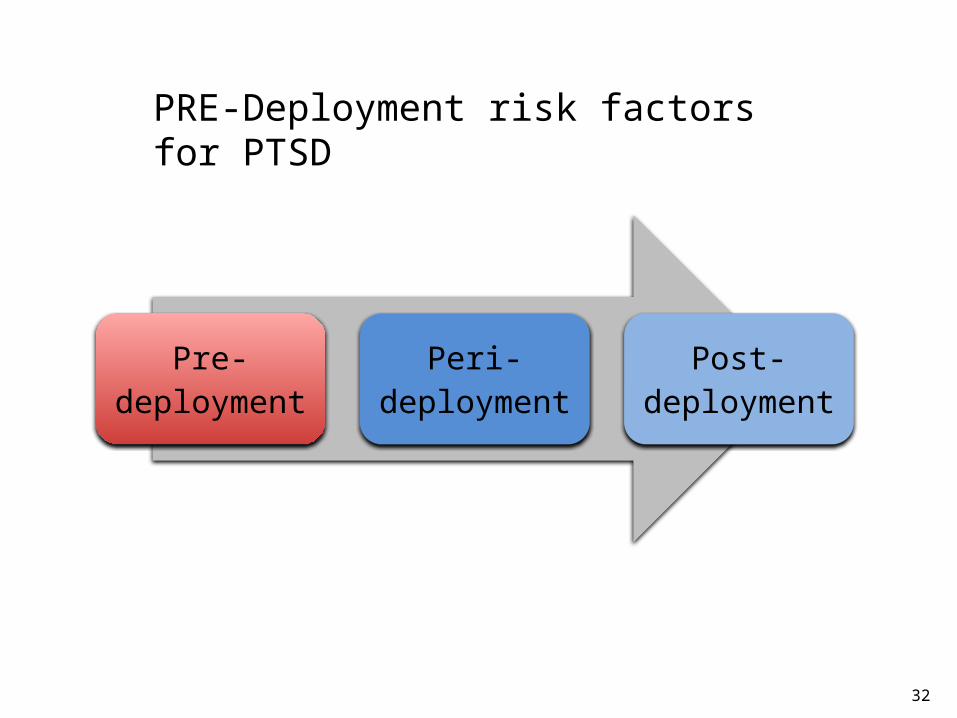
PRE-Deployment risk factors for PTSD
Pre-deployment
Peri-deployment
Post-deployment

women* men*
Those with prior lifetime sexual trauma exposure had a higher prevalence of past-year PTSD
33
(n=388) (n=2228)
n=2616; *all comparisons significant at p<0.001
% w
ith p
ast-y
ear P
TSD
0
5
10
15
20
25
30
23.6
18.2
4.76.3
Prior sexual traumaNo prior sexual trama

34
PERI-Deployment risk factors for PTSD
Pre-deployment
Peri-deployment
Post-deployment

82%
18%
Soldiers with traumas during deployment were more likely than those with non-deployment traumas to experience flashbacks and
insomnia
35
flashbacks
72%
28%
insomnia
Deployment events Non-deployment events
87%
13%
flashbacks
insomnia
84%
16%

31%
69%59%
41%
However, those with traumas during deployment were less likely than those with non-deployment-related events to report
intrusive memories and fear/helplessness/horror
36
Deployment events Non-deployment events
fear, helplessness, or horror
66%
34%
intrusive memories
fear, helplessness, or horror
61%
39%
intrusive memories

37
POST-Deployment risk factors for PTSD
Pre-deployment
Peri-deployment
Post-deployment
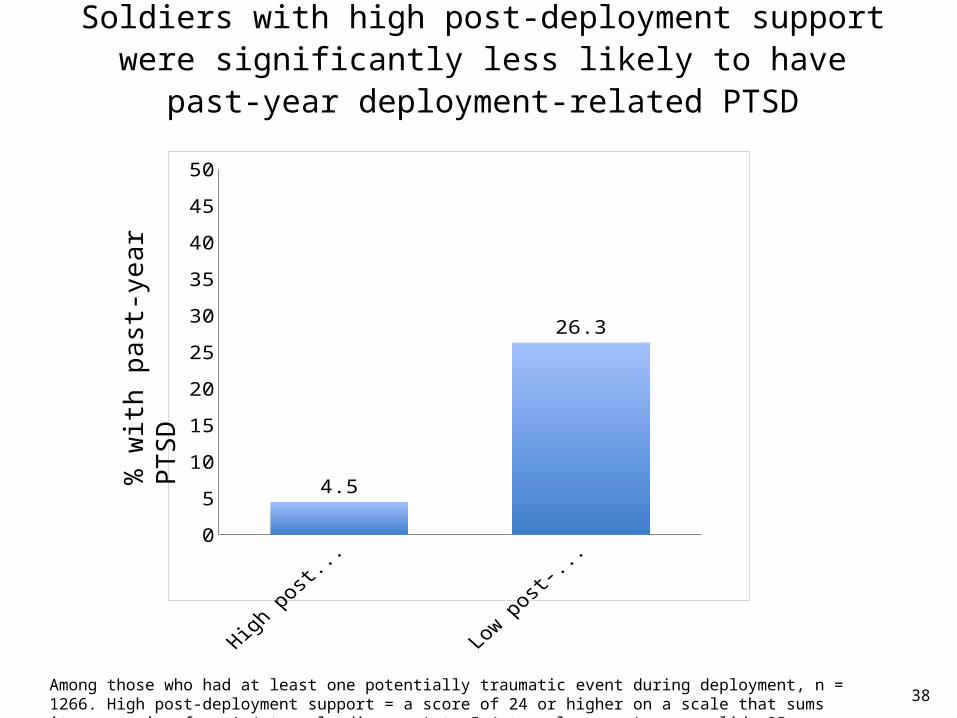
Soldiers with high post-deployment support were significantly less likely to have past-year deployment-related PTSD
38Among those who had at least one potentially traumatic event during deployment, n = 1266. High post-deployment support = a score of 24 or higher on a scale that sums items ranging from 1 (strongly disagree) to 5 (strongly agree) – see slide 25
High post-deployment support
Low post-deployment support
0
5
10
15
20
25
30
35
40
45
50
4.5
26.3
% w
ith p
ast-y
ear P
TSD

A combination:
Pre-, peri-, and post-deployment factors all matter for PTSD
39

Those with low levels of preparedness, unit support and post-deployment support have the highest prevalence of PTSD
e.g. HLH = high preparedness, low unit support, high post-deployment support.Among those who have been deployed and experienced a traumatic event during their most recent deployment (n=1294)
HLH HHH LHH LLH HHL HLL LHL LLL0.0
5.0
10.0
15.0
20.0
25.0
Perc
ent
40
Combination of the three factors

41
PRE-Deployment risk factors for depression
Pre-deployment
Peri-deployment
Post-deployment

women* men*
Those with lifetime sexual trauma exposure had a higher prevalence of past-year depression
42
(n=388) (n=2228)
n=2616; *all comparisons significant at p<0.001
% w
ith p
ast-y
ear d
epre
ssio
n
0
5
10
15
20
25
30
35
4037.1
19.8
10.612.5
Prior sexual traumaNo prior sexual trama

43
PERI-Deployment risk factors for depression
Pre-deployment
Peri-deployment
Post-deployment

Soldiers who experienced potentially traumatic events during their most recent deployment were more likely to have past-year depression than
those who experienced non-deployment-related events
44
% w
ith p
ast-y
ear d
epre
ssio
n
0.0
5.0
10.0
15.0
20.0
25.0
30.0
12.9
5.3
12.4 13.1
17.1
Includes respondents in baseline who specified their deployment status and did not have events of ambiguous settings or types (n = 1839).

45
POST-Deployment risk factors for depression
Pre-deployment
Peri-deployment
Post-deployment

Soldiers with high post-deployment support were significantly less likely to have past-year Depression
46Among those who have been deployed at baseline (N = 1668). High post-deployment support = a score of 24 or higher on a scale that sums items ranging from 1 (strongly disagree) to 5 (strongly agree) – see slide 25
% w
ith p
ast-y
ear D
epre
ssio
n
High post-
deployment s
upport
Low post-
deployment s
upport0
10
20
30
40
50
10.9
24.0

A combination of pre- and peri- deployment risk:
What is it about trauma that matters?
47
0
5
10
15
20
25
30
35
40
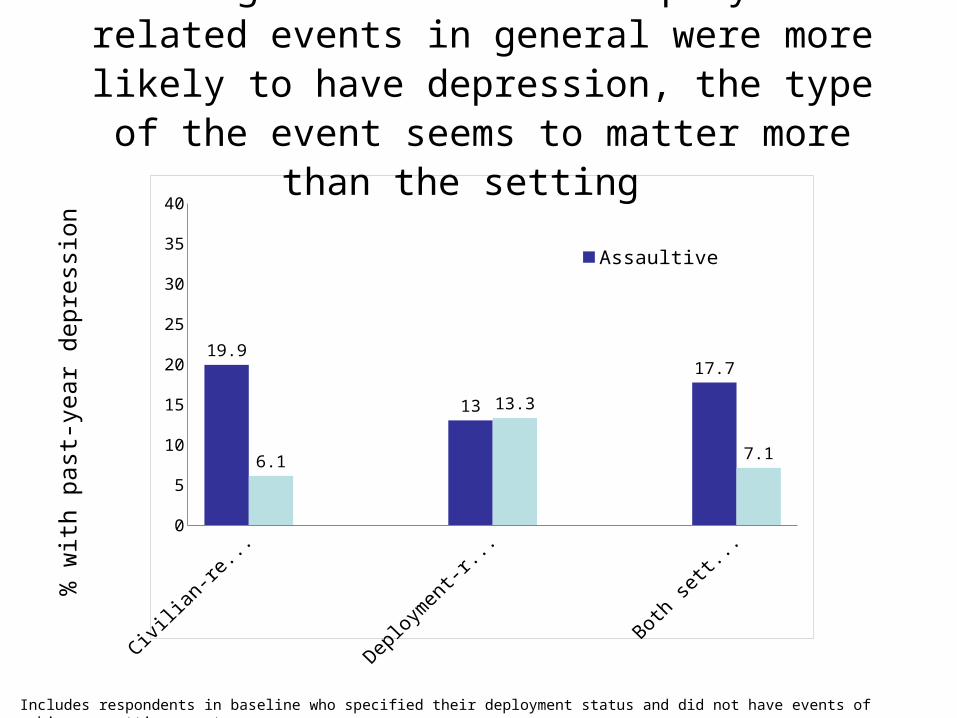
19.9
13
17.7
6.1
13.3
7.1
AssaultiveNon-assaultive
Although soldiers with deployment-related events in general were more likely to have depression, the type of the event seems to matter more than the setting
Includes respondents in baseline who specified their deployment status and did not have events of ambiguous settings or types
% w
ith p
ast-y
ear d
epre
ssio
n

V. A look over time:
Knowledge requires a longitudinal approach

Individuals show different trajectories of stress response after traumatic events
Norris FH. Looking for resilience: Understanding the longitudinal trajectories of responses to stress . Social Science & Medicine 2009; 68(12):2190-2198.

Most ONG soldiers show resistance to PTSD symptoms across four years
51
7 20 32 4517
27
37
47
57
67
77
Resistance: 50%Mild, recovery: 36%Mild, stable: 11%Chronic dysfunction: 3%
PTSD
sym
ptom
sca
le
Months after event
*n=469, participants who completed at least two waves of the study, had a traumatic event during a deployment within 2 years of baseline assessment, and were bothered by the same event throughout the follow-up interviews.

Risk factors at baseline affect what group each respondent belongs in
52
7 20 32 4517
27
37
47
57
67
77
Resistance: 50%Mild, recovery: 36%Mild, stable: 11%Chronic dysfunction: 3%
PTSD
sym
ptom
sca
le
*n=469, participants who completed at least two waves of the study, had a traumatic event during a deployment within 2 years of baseline assessment, and were bothered by the same event throughout the follow-up interviews.
Low income Low education High number of lifetime
traumatic events
Months after event
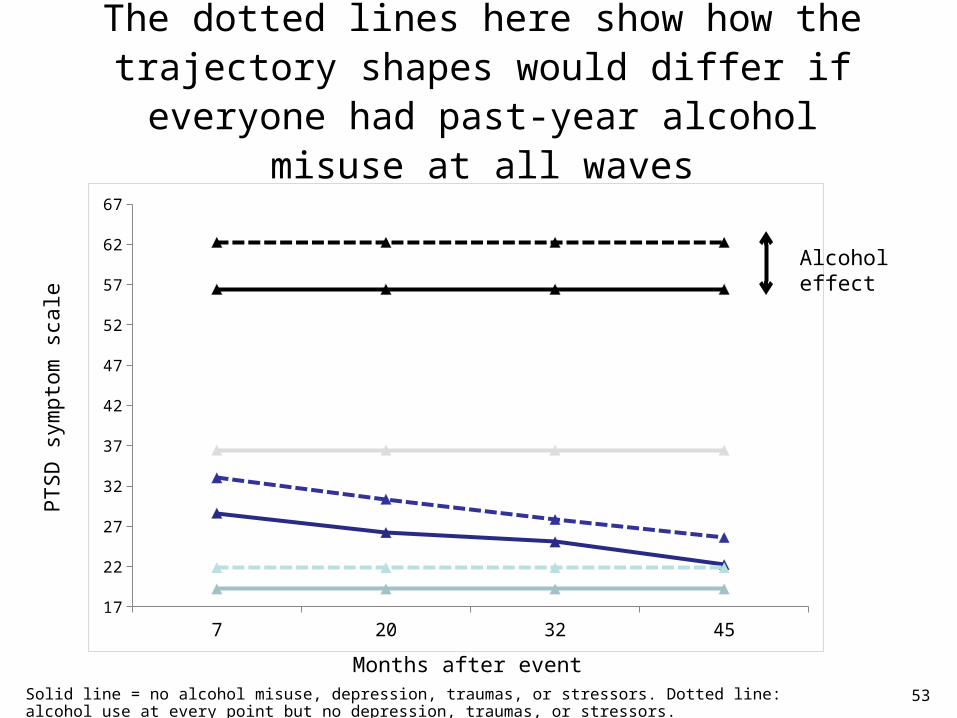
The dotted lines here show how the trajectory shapes would differ if everyone had past-year alcohol misuse
at all waves
53
7 20 32 4517
22
27
32
37
42
47
52
57
62
67
PTSD
sym
ptom
sca
le
Months after event
Alcohol effect
Solid line = no alcohol misuse, depression, traumas, or stressors. Dotted line: alcohol use at every point but no depression, traumas, or stressors.

7 20 32 4510
20
30
40
50
60
70
80
The dotted lines here show how the trajectory shapes would differ if everyone had past-year depression at
all waves
54
PTSD
sym
ptom
sca
le
Months after event
Depression effect
Solid line = no alcohol misuse, depression, traumas, or stressors. Dotted line: depression at every point but no alcohol misuse, traumas, or stressors.
55
7 20 32 450
10
20
30
40
50
60
70
80
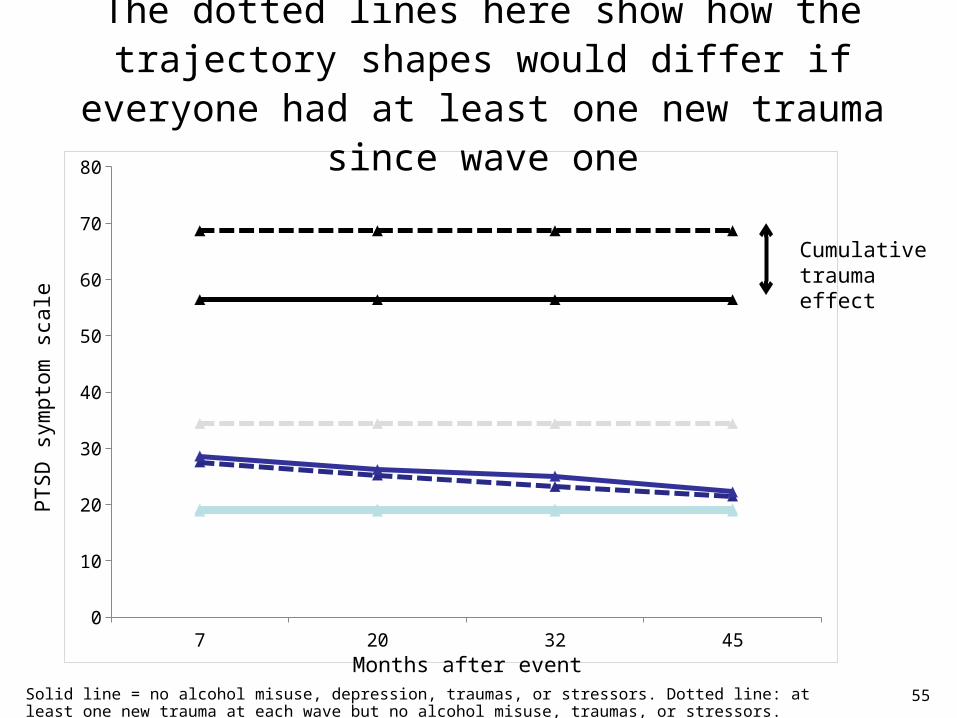
The dotted lines here show how the trajectory shapes would differ if everyone had at least one new trauma
since wave one
PTSD
sym
ptom
sca
le
Months after eventSolid line = no alcohol misuse, depression, traumas, or stressors. Dotted line: at least one new trauma at each wave but no alcohol misuse, traumas, or stressors.
Cumulative trauma effect

Most ONG soldiers show resistance to depression symptoms across four years
56
Num
ber o
f dep
ress
ion
sym
ptom
s
Months after event
*n=727, participants who completed at least two waves of the study and were deployed within 2 years of baseline assessment
7 20 32 450
1
2
3
4
5
6
7
8
9
Resistance: 52%
Mild, recovery: 17%
Mild, increasing: 20%
Chronic dysfunction: 11%

Risk factors at baseline affect what group each respondent belongs in
57
Num
ber o
f dep
ress
ion
sym
ptom
s
Months after event
*n=727, participants who completed at least two waves of the study and were deployed within 2 years of baseline assessment
7 20 32 450
1
2
3
4
5
6
7
8
9
Resistance: 52%
Mild, recovery: 17%
Mild, increasing: 20%
Chronic dysfunction: 11%
Childhood adversity High number of lifetime
stressors High number of lifetime
traumatic events
Not currently married

7 20 32 450
1
2
3
4
5
6
7
58
The dotted lines here show how the trajectory shapes would differ if everyone had past-year alcohol misuse
at all waves
Num
ber o
f dep
ress
ion
sym
ptom
s
Months after event
Solid line = no alcohol misuse or PTSD. Dotted line: alcohol misuse at each wave but no PTSD
Alcohol effect

59
The dotted lines here show how the trajectory shapes would differ if everyone had past-year PTSD at all
waves
Num
ber o
f dep
ress
ion
sym
ptom
s
Months after event
Solid line = no alcohol misuse or PTSD. Dotted line: PTSD at each wave but no alcohol misuse
PTSD effect
7 20 32 450
1
2
3
4
5
6
7
8
9

VI. ALCOHOL MISUSE: Some findings
60

What is the relationship between mental health disorders and peri- / post-deployment alcohol
abuse?

Both civilian and deployment-related factors are associated with incident alcohol abuse
62
Yes No Yes No Never Before During/After
Never Before During/After
0
5
10
15
20
25
30
35
40
% w
ho d
evel
oped
alc
ohol
abu
se s
ympt
oms
duri
ng o
r aft
er
depl
oym
ent
Family history of drug/alcohol
abuse
Experienced combat on most recent conflict
Depressive disorder
Post-traumatic stress disorder

Those with both PTSD and depression have the highest probability of developing alcohol abuse
63
No PTSD or DD PTSD only DD Only Both PTSD and DD0.00
0.10
0.20
0.30
0.40
0.50
7.6%
18.4%
24.3%
46.7%
Cond
ition
al P
roba
bilit
y of
an
Alco
hol A
buse
Dis-
orde
r Firs
t Occ
urin
g D
urin
g/Fo
llow
ing
Dep
loy-
men
t
DD – any depressive disorder.These are the predicted probabilities from multivariable logistic regressions adjusted for other variables (age, gender, race, education, income, deployment location, marital status, family history of substance abuse) entered in the multivariate regression model. Note: depression and PTSD are both defined as first occurring during or following deployment.

VII. SUICIDAL IDEATION: Some findings
64

About 2% of the soldiers reported suicidal ideation in the past month, and 11% in their lifetime
Lifetime suicidal Ideation Suicidal Ideation within past 30 days
0
5
10
15
20
25
30
% fr
om b
asel
ine
sam
ple
Calculated within baseline sample (N≈2616). This is “thought (they) would be better off dead, or had thoughts of hurting (themselves)” from the Patient Health Questionnaire - 9. Kroenke K, Spitzer R. The PHQ-9: A new depression diagnostic and severity measure. Psychiatric Annals 2002;32:1. Compared to general population with a prevalence of lifetime suicidal ideation between 4.8% and 18% (cdc.gov/ncipc/wisqars)
10.7
1.9
65

66
In the past 6 months, 7% of the clinical sub-sample have thought about suicide
-1.0
3.0
7.0
11.0
15.0
6.8
2.8
7.0
1.64.4
% fr
om w
ave
1
Wave 1 in-person sample N=500

Deployment experience at baseline was not associated with current suicidal ideation
Never deployed Have been deployed
Not deployed in past 3 years
Deployed in past 3 years
0.0
1.0
2.0
3.0
4.0
5.0
6.0
7.0
% w
ith su
icid
al id
eatio
n th
e pa
st 3
0 da
ys
1.8 2.1
67
1.9 1.9
Telephone sample

68
However, those with deployment history had fewer suicidal outcomes
0.0
2.0
4.0
6.0
8.0
% fr
om w
ave
1 cl
inic
al s
ampl
e Deployed
Never deployed
Wave 1 in-person sample N=500

69
Women were more likely than men to make a suicide plan in the past 6 months
0.0
4.0
8.0
12.0
16.0
% fr
om w
ave
1 MaleFemale
Wave 1 in-person sample N=500

70
In the past 6 months, those with a history of mood disorder had the highest level of suicide risk
Any Anxiety Disorder Any Mood Disorder Any Substance Use Disorder
Any0.0
5.0
10.0
15.0
20.0
25.0
30.0
11.6
26.2
2.9
11.2
% o
f tho
se w
ith su
icid
e ris
k
Wave 1 in-person sample N=500

71
Soldiers with more co-morbidity throughout their lifetime show a higher level of suicide risk
None One Two Three 0.0
5.0
10.0
15.0
20.0
25.0
30.0
1.3
6.4
17.1
27.3
% o
f tho
se w
ith su
icid
e ris
k
Wave 1 in-person sample N=500
Number of disorders

How do deployment, lifetime stressors and mental health affect suicidal ideation?
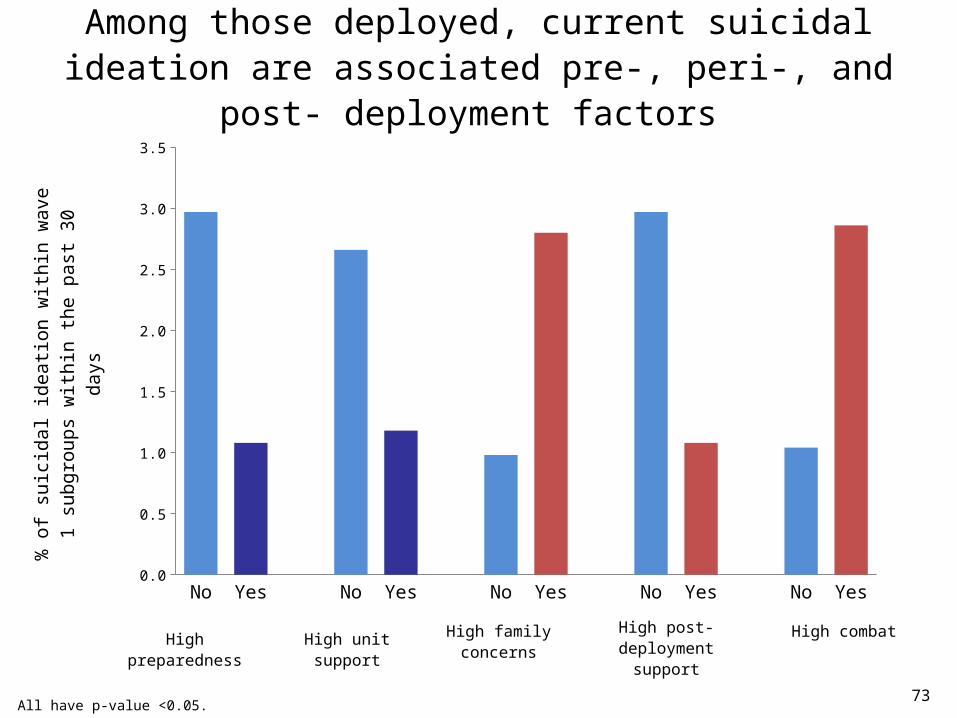
Among those deployed, current suicidal ideation are associated pre-, peri-, and post- deployment factors
No Yes No Yes No Yes No Yes No Yes0.0
0.5
1.0
1.5
2.0
2.5
3.0
3.5
% o
f sui
cida
l ide
ation
with
in w
ave
1 su
bgro
ups
with
in th
e pa
st 3
0 da
ys
High preparedness High unit support High family concerns
High post-deployment
support
High combat
All have p-value <0.05. 73

No Yes No Yes No Yes No Yes No Yes No Yes0.0
0.5
1.0
1.5
2.0
2.5
3.0
3.5
4.0
4.5
5.0
% w
ithin
pas
t 30
days
Stressors experienced over lifespan are associated with current suicidal ideation
Currentincome < 60,000
All have p-value <0.05. n = 2,508. Calculated with in baseline sample that answered all questions.
Low social support
Parents abused each
other
Caregivers fought
Ever unemployed > 3 months
Serious financial problems
74

No Yes No Yes No Yes No Yes0
1
2
3
4
5
6
7
8
9
% w
ithin
the
past
30
days
Among those never deployed, current suicidal ideation was associated with a lifetime occurrence of mental health conditions
Posttraumatic stress disorder Depression Anxiety disorder Alcohol
dependence
All p-value <0.05. Diagnoses by DSM-IV using: PTSD using the PTSD Checklist, Depression using the Patient Health Questionnaire, Anxiety Disorder using the Generalized Anxiety Disorder questionnaire and alcohol dependence using the MINI. For alcohol dependence the N=831 compared to N=907 for the other analyses.
75

How does alcohol dependence relate to suicidal ideation?

Baseline alcohol dependence is significantly associated with incident suicidal ideation at follow-up
6%9%
Baseline Alcohol dependence Follow-up incident suicidal ideation
2%
p=0.0002
n=1587; percent alcohol dependence and suicidal ideation reported for participants meeting criteria

How does co-morbidity relate to suicidal ideation?
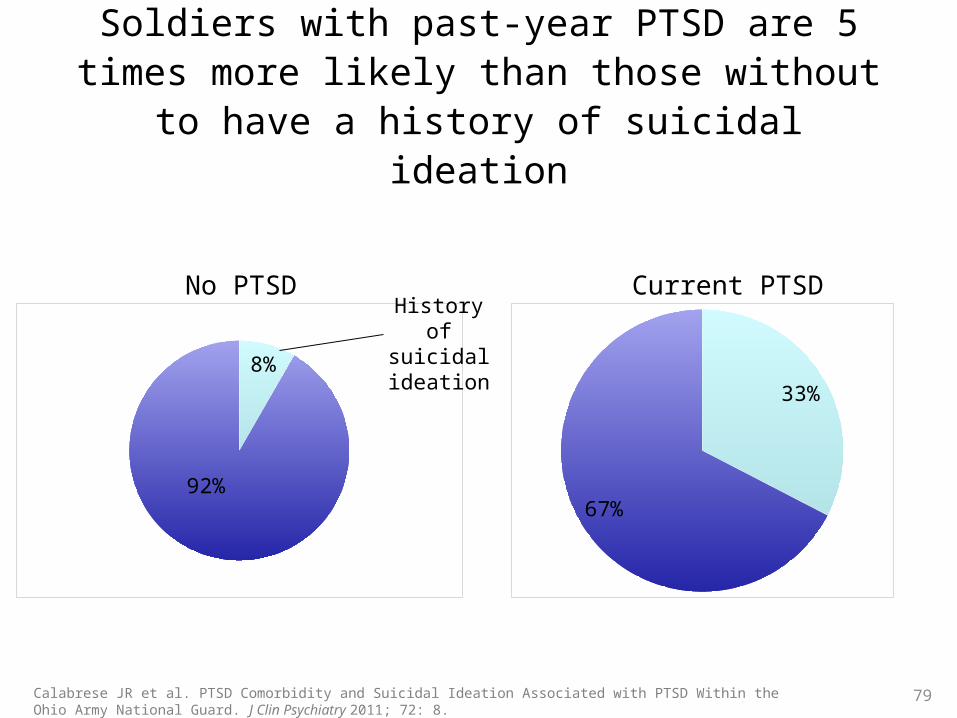
Soldiers with past-year PTSD are 5 times more likely than those without to have a history of suicidal ideation
79
33%
67%
8%
92%
No PTSD Current PTSDHistory of
suicidal ideation
Calabrese JR et al. PTSD Comorbidity and Suicidal Ideation Associated with PTSD Within the Ohio Army National Guard. J Clin Psychiatry 2011; 72: 8.

Compared to PTSD alone, those with 2 or more conditions within the past year are 7 times more likely to have a history of suicidal
ideation
80Calabrese JR et al. PTSD Comorbidity and Suicidal Ideation Associated with PTSD Within the Ohio Army National Guard. J Clin Psychiatry 2011; 72: 8.
18%
82%
62%38%
History of suicidal ideation
Current PTSD only Current PTSD and 2+ conditions

VIII. Mental health service utilization

Among soldiers with mental health care need, less than half reported service use
83%
17%
37%
63%
(N=218)(N=1319)
yes
no
yes
no
*mental health need was defined as ≥ 1 mental health disorder, including PTSD, depression, GAD, or an alcohol use disorder (AUD; including abuse or dependence), or past month suicidal ideation
mental health service need at wave 2
mental health service use among those with need
between waves 2 & 3
37%
63%
yes
no
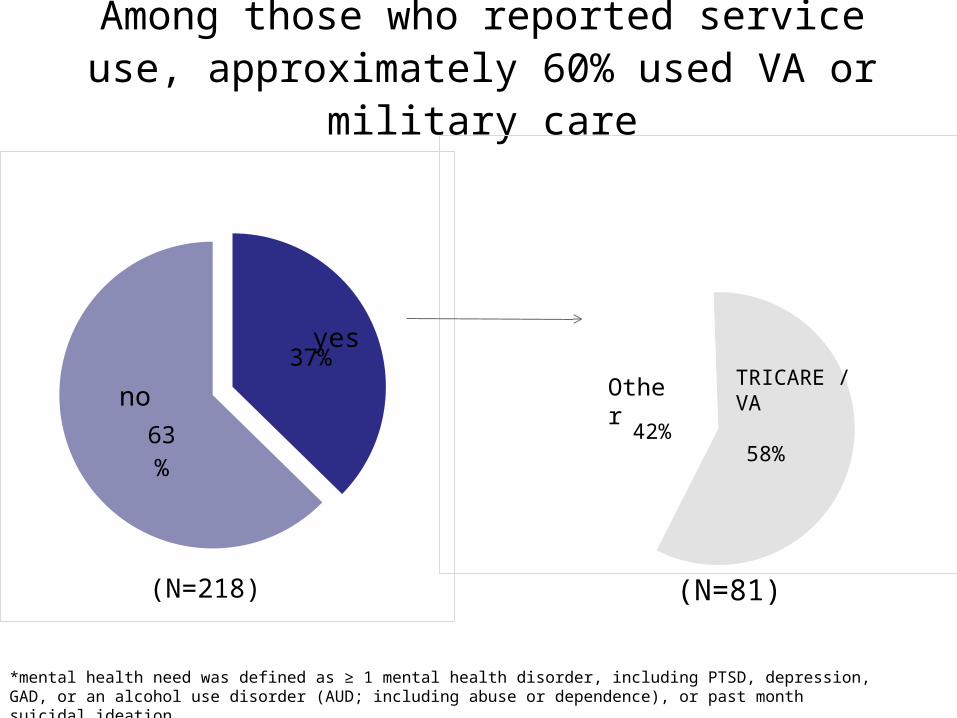
Among those who reported service use, approximately 60% used VA or military care
58%42%
any use of military mental health services between waves 2 & 3
(N=81)(N=218)
TRICARE / VAOther
*mental health need was defined as ≥ 1 mental health disorder, including PTSD, depression, GAD, or an alcohol use disorder (AUD; including abuse or dependence), or past month suicidal ideation

Utilization of mental health differs by psychiatric disorder
0
10
20
30
40
50
60
70
80
90
100
61
43
57
23
47
mental health condition*
*n=218
GAD
(n=68)
PTSD
(n=41)
past month suicidal ideation
(n=19)
depression
(n=128)
AUD
(n=86)
% w
ith a
ny m
enta
l hea
lth c
ondi
tion
repo
rting
any
men
tal
heal
th s
ervi
ce u
se in
pas
t yea
r

Greater psychiatric burden was associated with higher utilization of mental health services
0
10
20
30
40
50
60
70
80
90
100
30
5055
two (n=42)
one(n=145)
three or more(n=29)
Number of mental health diagnoses*
*n=218; p<0.01; mental health diagnoses included PTSD, depression, GAD, or an alcohol use disorder (AUD; including abuse or dependence)
% w
ith a
ny m
enta
l hea
lth c
ondi
tion
repo
rting
any
men
tal
heal
th s
ervi
ce u
se in
pas
t yea
r

Service use conclusions
the majority of ONG soldiers who have mental health care need do not report accessing services
greater psychiatric burden was associated with higher utilization of mental health services
alcohol use disorder by far most common reported psychopathology
those with AUD also least likely to use mental health services a little over half of those who access care report utilizing VA or
DoD services the youngest group of veterans were least likely to use VA/DoD
services


