Risk, Return, and Income Mix at Commercial Banks: Cross-Country Evidence Rifat Gorener Roosevelt University Sungho Choi Chonnam National University The paper examines whether and how increased reliance on non-interest income affects the financial performance of banks, as measured by stock market return data for publicly traded commercial banking companies in 42 countries. In general, we find that non-interest income is associated with riskier stock returns at commercial banking companies, due primarily to increased market, or systematic, risk. This finding is new to the literature, and suggests that fee-based banking activities increase banks’ exposure to the business cycle. In contrast, we find almost no evidence linking non-interest income to changes in the total risk, interest rate risk, or idiosyncratic risk. Our results also suggest that the stock markets efficiently price the increased risk associated with the non-interest income market. That is, after controlling for cross-sectional differences in risk, market returns do not fluctuate with the mix of bank income. This result offers a potential explanation for the initial conventional wisdom among industry participants that expansion into non-interest activities would result in an improved risk–return trade-off at commercial banks. Finally, we find that cross-country differences in regulatory practices, economic conditions, and social institutions influence our main results in important ways, but on average our risk– return results appear to be robust across countries. INTRODUCTION In the traditional sense, banks are intermediaries that add value and earn income based on the spread between the interest paid on deposits and the interest received on loans. Market analysis of bank performance, prudential regulation of banks, and theoretical models of bank “uniqueness” are all based primarily on this framework of intermediation and spread income. However, non-interest or “fee-based” activities account for a substantial and growing portion of the earnings in the banking sector. For example, non-interest income comprised about 47 percent of the net revenue on average at the 25 largest US banking companies in 2004, a rise from about 40 percent in the mid-1990s and about 35 percent in the mid-1980s. Banking companies in other developed economies have experienced similar trends. 1 The surge in non-interest income at commercial banks has come from two sources: the non-traditional financial services that banks have only recently begun to provide and the traditional activities that commercial banks have always provided but that are now produced and priced differently. 2 During the 1990s, industry deregulation permitted commercial banks in many countries to expand into non- traditional product offerings, such as investment banking, merchant banking, insurance agency, and Journal of Applied Business and Economics vol. 14(3) 2013 123
Transcript
Risk, Return, and Income Mix at Commercial Banks: Cross-Country Evidence
Rifat Gorener
Roosevelt University
Sungho Choi Chonnam National University
The paper examines whether and how increased reliance on non-interest income affects the financial performance of banks, as measured by stock market return data for publicly traded commercial banking companies in 42 countries. In general, we find that non-interest income is associated with riskier stock returns at commercial banking companies, due primarily to increased market, or systematic, risk. This finding is new to the literature, and suggests that fee-based banking activities increase banks’ exposure to the business cycle. In contrast, we find almost no evidence linking non-interest income to changes in the total risk, interest rate risk, or idiosyncratic risk. Our results also suggest that the stock markets efficiently price the increased risk associated with the non-interest income market. That is, after controlling for cross-sectional differences in risk, market returns do not fluctuate with the mix of bank income. This result offers a potential explanation for the initial conventional wisdom among industry participants that expansion into non-interest activities would result in an improved risk–return trade-off at commercial banks. Finally, we find that cross-country differences in regulatory practices, economic conditions, and social institutions influence our main results in important ways, but on average our risk–return results appear to be robust across countries. INTRODUCTION
In the traditional sense, banks are intermediaries that add value and earn income based on the spread between the interest paid on deposits and the interest received on loans. Market analysis of bank performance, prudential regulation of banks, and theoretical models of bank “uniqueness” are all based primarily on this framework of intermediation and spread income. However, non-interest or “fee-based” activities account for a substantial and growing portion of the earnings in the banking sector. For example, non-interest income comprised about 47 percent of the net revenue on average at the 25 largest US banking companies in 2004, a rise from about 40 percent in the mid-1990s and about 35 percent in the mid-1980s. Banking companies in other developed economies have experienced similar trends.1
The surge in non-interest income at commercial banks has come from two sources: the non-traditional financial services that banks have only recently begun to provide and the traditional activities that commercial banks have always provided but that are now produced and priced differently.2 During the 1990s, industry deregulation permitted commercial banks in many countries to expand into non-traditional product offerings, such as investment banking, merchant banking, insurance agency, and
Journal of Applied Business and Economics vol. 14(3) 2013 123
securities brokerage. Unlike traditional intermediation business, which generates an interest margin between depositors and borrowers, these new banking activities primarily generate fee income.3 At around the same time, the advances in information, communications, and financial technologies altered the production and distribution of many traditional banking products; in the process, these products became sources of non-interest income. For example, credit scoring and asset securitization have transformed the production of consumer credit and home mortgages from a traditional portfolio lending process in which banks earn mostly interest income into a transactions lending process in which banks earn mostly non-interest income from loan origination and servicing fees. Similarly, some deposit customers have demonstrated a willingness to pay higher fees (or accept lower interest rates on their balances) for the convenience associated with widespread networks of branches, ATMs, and/or Internet banking facilities.4
Initially, there was conventional wisdom among bankers, regulators, and industry analysts that increased non-interest income would reduce the risk profile of commercial banks: less exposure to interest rate movements and credit risk would stabilize bank revenues and diversification gains from a broader business mix of fee-based activities would stabilize bank profits. However, the empirical literature has not systematically confirmed these initial beliefs. While a handful of studies have found evidence linking non-interest income to lower bank risk, a growing majority of studies are finding contradictory evidence. In practice, the diversification gains appear to be limited (Stiroh, 2004) and/or tend to be consumed by increased risk-taking in other areas (Demsetz & Strahan, 1997). Streams of non-interest revenue from some activities appear to be more, rather than less, volatile than traditional loan-based revenue streams and expose the bank to risk from increased operating leverage (DeYoung & Roland, 2001). Additionally, at the average bank, expansion into non-interest activities appears to offer a poor risk–return trade-off (DeYoung & Rice, 2004).
In this study, we examine whether and how increased reliance on non-interest income affects the financial performance of banks, as measured by the stock market return data for 877 publicly traded commercial banking companies in 42 countries between 1995 and 2002. By examining these relationships in this broad, multi-national, financial markets framework, we advance the literature in at least three important ways. First, we provide a global robustness test for previous studies, which have focused on banks in single countries or small groups of similar countries. Second, most (though not all) previous studies have been based on performance data from banks’ financial statements, and as such may reflect the myriad economic misrepresentations embedded in accounting documents. Third, we can exploit the substantial cross-country heterogeneity in our data to test how regulatory practices, economic conditions, and social institutions affect these relationships.
Our main results are derived from a two-stage risk–return regression framework, which we estimate multiple times using a variety of risk measures derived from a two-factor market model. In general, we find that non-interest income is associated with riskier stock returns at commercial banking companies, due primarily to increased market, or systematic, risk. The magnitude of this relationship is non-trivial: a one-standard-deviation increase in cross-sectional non-interest income is associated with about a 6 percent increase in the market beta for the average bank in our sample. These findings are new to the literature, and they suggest that fee-based banking activities (e.g., merger financing, loan origination fees, brokerage commissions) increase banks’ exposure to the business cycle. In contrast, we find almost no evidence linking non-interest income to changes in total risk (the variability of stock returns), interest rate risk (a second factor in a market model), or idiosyncratic risk (the residual from a two-factor market model).
Our estimation results suggest that, on average, the stock markets in these 42 countries efficiently price the increased risk associated with the non-interest income market. That is, after controlling for cross-sectional differences in risk, the market returns do not fluctuate with the mix of bank income. However, when we re-estimate our models using accounting returns (ROA and ROE) rather than market returns, we find evidence of a premium in accounting returns that is positively related to non-interest income. This set of results is also new to the literature, and it offers a potential explanation for the initial
124 Journal of Applied Business and Economics vol. 14(3) 2013
conventional wisdom among industry participants that expansion into non-interest activities would result in an improved risk–return trade-off at commercial banks.
Finally, we find that cross-country differences in regulatory practices, economic conditions, and social institutions influence our main results in important ways, but on average our risk–return results appear to be robust across countries. Because deregulation was important in removing the constraints that prevented banks from participating in certain fee-based activities, reliance on non-interest income will vary across banks based on country-specific regulations. In contrast, increased reliance on non-interest income due to innovations in financial markets and information flows is less likely to vary across countries, because technology allowing more efficient production of traditional banking products spreads quickly. In general, we find that tight controls of the banking system designed to reduce risk (e.g., entry restrictions, explicit deposit insurance, activity restrictions, ownership restrictions, competition policy) are associated with less risky non-interest activities.
Our findings have implications for regulation. Activities that generate non-interest income can be less transparent than traditional banking activities, and thus more difficult to monitor for safety and soundness. For example, reductions in equity capital caused by credit losses are obvious and easily identifiable (i.e., the progression of loan delinquency, loan classification, loan provisioning, and loan charge-off), but shocks to non-interest income affect equity capital more subtly through ex post reductions in retained earnings, which for most established firms are the primary source of capital. Activities that generate volatile earnings streams make this source of capital riskier, and this volatility is exacerbated by financial leverage. Under the current regulatory capital rules, banks are not required to hold capital against most fee-generating activities.5 Our findings invite a discussion about whether the risk associated with certain non-interest activities is large enough and systematic enough to merit a required capital charge in future versions of these capital regulations. Our findings also have implications for investors. If the additional risk associated with non-interest income is predominantly systematic risk (as we find here), then investors will require higher expected returns to accept this non-diversifiable risk in their portfolios.
The rest of paper is set out as follows. In Section 2, we discuss the literature that investigates the relation between non-interest income and bank profitability and risk. Section 3 describes our data set and presents the methodology employed in our paper. In Section 4, we report our empirical results. Section 5 examines the effect of cross-country institutional difference on banks. Then, in Section 6, we conclude our analysis with a brief summary of our main findings and an assessment of their implications. LITERATURE REVIEW
The impact of non-interest income and non-traditional activities on commercial bank performance has been the subject of academic and regulatory study for three decades. Most of these studies were performed prior to the large expansion of permissible commercial bank activities made possible by the major deregulatory acts, e.g., the Gramm–Leach–Bliley (GLB) Act of 1999, allowing US financial holding companies to participate in both banking and non-banking activities, and the Second Banking Co-ordination Directive of 1989 (implemented in 1993–94), permitting universal banks to expand anywhere within the EU regardless of the host country restrictions on product powers. These early studies were limited to examining the small number of non-interest activities permissible at the time, and they produced a mixture of interesting although somewhat contradictory results. In general, the studies found that diversifying into non-traditional financial activities could potentially reduce risk, but in practice the post-diversification changes in risk followed no clear patterns, either increasing, decreasing, or remaining unchanged across the various studies. Moreover, the risk reductions that were achievable in practice tended to diminish quickly, and in some instances were reversed as banks ramped up their risk-taking in other areas, such as greater financial leverage. More recent studies—performed after the implementation of the major deregulatory acts, and also in the wake of the financial and technical innovations that changed the production processes for generating both interest and non-interest income—have been able to examine a much broader set of non-interest activities. These later studies have generally concluded that expansion into fee-based financial activities has increased the riskiness of banking companies.
Journal of Applied Business and Economics vol. 14(3) 2013 125
The earliest group of studies provided suggestive evidence that banks could potentially reduce their riskiness by diversifying into non-banking activities. Heggestad (1975), Johnson and Meinster (1974), Litan (1985), and Wall and Eisenbeis (1984) used industry-level IRS data from the 1950s, 1960s, and 1970s to compare the aggregate earnings stream of the banking industry with the aggregate earnings streams of other financial industries (e.g., securities firms, insurance companies, real estate brokers, leasing companies, thrift institutions). While the results of these studies did not always agree across industries, a common thread ran through the studies: over long periods of time, banking industry earnings and non-banking financial industry earnings were quite uncorrelated with each other, and in extreme cases these correlations were close to zero or even negative. This basic result suggested that if banks were allowed to add some non-banking financial products to their traditional mix of banking services, the resulting portfolio diversification effects could potentially increase banks’ expected returns without increasing their riskiness (or, equivalently, reduce banks’ riskiness without reducing their expected returns).
Most studies have used firm-level data rather than industry averages, and have found mixed results. One set of these studies concluded that diversification into non-banking activities increased the riskiness of banks. Boyd and Graham (1986) examined large bank holding companies (BHCs) that diversified into non-banking activities during the 1970s and concluded that, in the absence of strict regulatory oversight and control, expansion into these activities can increase the risk of failure. Sinkey and Nash (1993) found that commercial banks that specialized in credit card lending (an often-securitized type of lending that generates substantial fee income) generated higher and more volatile accounting returns, and had higher probabilities of insolvency, than commercial banks with traditional product mixes during the 1980s. Demsetz and Strahan (1997) studied the stock returns of BHCs and found that greater diversification across product lines did not necessarily reduce risk because the diversifying BHCs tended to shift to riskier mixes of activities and hold less equity. Roland (1997) discovered that abnormal returns from fee-based activities were less persistent (more short-lived or volatile) than abnormal returns from lending and deposit-taking at large BHCs. Kwan (1998) found that the accounting returns of Section 20 securities affiliates tended to be more volatile, but not necessarily higher, than the accounting returns of their commercial banking affiliates.
On the contrary, other firm-level studies found that diversifying into non-banking activities reduced the bank risk, although these gains tended to be limited in size, scope, or practice. Boyd et al. (1980) measured the correlations between accounting returns at the bank and non-bank affiliates of BHCs during the 1970s, and found that the potential for risk reduction was exhausted at relatively low levels of non-banking activities. Eisenbeis, Harris, and Lakonishok (1984) found positive abnormal stock returns associated with the formation of one-bank holding companies between 1968 and 1970, a brief time period during which these firms were permitted to engage in a wide variety of non-banking activities. Kwast (1989) examined the accounting returns of the securities and non-securities activities of commercial banking companies between 1976 and 1985, and found limited potential for risk reduction by diversifying into securities activities. Brewer (1989) reached similar results using the market returns of US bank holding companies. Gallo, Apilado, and Kolari (1996) ascertained that high levels of mutual fund activity were associated with increased profitability, but only slightly moderated risk levels, at large BHCs between 1987 and 1994. Rogers and Sinkey (1999) found that non-traditional activities were associated with larger size, smaller interest margins, less core deposit funding, and less risk.
Because the set of permissible non-banking activities was substantially constrained prior to the late 1990s and early 2000s, an alternative research approach examined the return streams of unrelated banking firms and non-banking financial firms, and then calculated the hypothetical reduction in earnings variability based on the covariances of those earnings streams. Rosen et al. (1989) found minimal financial benefits from the hypothetical diversification of banking companies into real estate activities. Wall et al. (1993) constructed synthetic portfolios based on the accounting returns of banks and non-banking financial firms, and concluded that banks would have experienced higher returns and lower risk had they been able to diversify into small amounts of insurance, mutual fund, securities brokerage, or real estate activities during the 1980s. Using both accounting data and market data from the 1970s and 1980s,
126 Journal of Applied Business and Economics vol. 14(3) 2013
Boyd, Graham, and Hewitt (1993) concluded that BHCs could have reduced their riskiness by merging with life insurance or property/casualty insurance firms, but would likely have increased their riskiness by merging with securities or real estate firms. Laderman (1998) applied a similar synthetic merger approach to data from the 1980s and 1990s, and concluded that BHCs could have reduced the volatility of their accounting returns by offering “modest to relatively substantial amounts” of life insurance or casualty insurance underwriting. Allen and Jagtiani (2000) used stock market data to construct return streams for synthetic “universal banks” consisting of a commercial banking company, a securities firm, and an insurance company, and found that the exposure to market risk increased with the addition of these non-banking activities. While these studies yielded provocative results, this research approach is limited because (by construction and by necessity) it cannot capture the positive and/or negative synergies in production, marketing, or organizational control from combining banking activities with non-banking activities.
Despite the very mixed evidence produced by the academic research outlined above, by the late 1990s there was still conventional wisdom among industry participants that fee-based activities had a stabilizing effect on bank income and that diversifying into non-banking activities reduced bank risk. This conventional wisdom was documented by DeYoung and Roland (2001), who also provided three new conceptual arguments for why non-interest income may be less stable than income from traditional banking activities. First, the revenue from traditional lending activities may be relatively stable over time because switching costs and information costs make it costly for either borrowers or lenders to walk away from a lending relationship; in contrast, the revenue from some fee-based activities may be relatively unstable because banks face a high level of competitive rivalry, low information costs, and fluctuating demand in a number of these product markets (e.g., investment banking, retail brokerage, securitized mortgage refinance). Second, fee-based services can require the bank to increase its ratio of fixed-to-variable expenses (e.g., skilled labor, retail sales space); the higher operating leverage that results increases the sensitivity of the bank earnings to fluctuations in the bank revenues. Third, although banks internally allocate some capital to their fee-based lines of business, there is no regulatory capital requirement for most of these activities, which suggests a higher degree of financial leverage—and thus higher earnings volatility—for these activities. Using quarterly data from US commercial banks between 1988 and 1995, DeYoung and Roland (2001) showed that non-interest income (from non-deposit-related activities) was associated with more volatile revenue streams, a higher degree of total leverage, and more volatile earnings streams, when compared with interest-based lending activities.
Similarly, the studies of US banking companies that followed also contradicted the conventional industry wisdom. Cooper, Jackson, and Patterson (2003) found that non-interest income was associated with lower risk-adjusted stock returns at bank holding companies. Stiroh (2004a) found little risk-reduction benefit for small banking companies that engaged in both traditional and non-traditional banking activities, although he found substantial diversification benefits for small banks that diversified within traditional or non-traditional areas. In another study that included data from both large and small banks, Stiroh (2004b) found reductions in earnings volatility at banks with large amounts of non-interest income, but concluded that these were due to the reduced volatility of net interest income at those banks, and were not due to diversification gains. DeYoung and Rice (2004) concluded that expansion into non-interest activities appeared to offer a poor risk–return trade-off. Studies using non-US data remain rare, and to date have found mixed results. Esho, Kofman, and Sharpe (2005) found that increased reliance on fee-based activities was associated with increased risk at Australian credit unions. Like the US studies, Smith, Staikouras, and Wood (2003) found that non-interest income exhibited more volatility than net interest income over time; the negative correlations between these two income streams led them to conclude that diversification effects exist. Overall, these more recent studies have benefited from the availability of more detailed information about the composition of non-interest-based activities and, since they used more recent data either wholly or partially drawn from post-deregulation markets, as such reflected less constrained behavior and performance of banking companies.
Journal of Applied Business and Economics vol. 14(3) 2013 127
METHODOLOGY
Our primary objective is to determine whether and how non-interest income affects the riskiness of banking companies, and whether the market returns of these companies are sensitive to any such changes in risk. To answer these questions, we first need to generate bank-level measures of risk (RISK) and return (RETURN). We use the following two-factor market model to generate bank-level measures of RISK:
Rit = αi + βi MRit + γi INTit + εit (1)
where Rit is the return on the stock of bank i during period t, MRit is the return on a stock market index in bank i’s country during period t, INTit is the change in the market interest rate on a benchmark long-term government bond in bank i’s country during period t, and the error term εit is assumed to be distributed symmetrically with mean zero. We estimate (1) separately for each bank i in each year of our 1995–2002 database, using weekly data (i.e., t = one week) and ordinary least squares techniques with robust errors.
We use four different RISK measures in our tests, each of which is derived from equation (1). Systematic or market risk (MKTRISK) is the estimated value of βi. Interest rate risk (IRRISK) is the estimated value of γi. Idiosyncratic risk (IDIORISK) is the standard deviation of the estimated residual terms εit. Total risk (TOTRISK) is the standard deviation of Rit. Our primary RETURN measure is the annualized average of the weekly returns Rit. In alternative tests, we use two accounting return measures, the annual return on assets (ROAi) and the annual return on equity (ROEi).
We estimate the relationships between non-interest income and banking company performance in the following system of RISK–RETURN equations:
which we estimate using two-stage least squares estimation techniques and an unbalanced panel of annual data from 1995 through 2002.6 NII equals the ratio of non-interest income to total assets at bank i in year t. We use alternative definitions of NII in robustness tests. Thus, the main test statistics are the estimated coefficients λ, φ, and δ. Yit and Zit are vectors of control variables (described below). T is a vector of time fixed-effects dummies. We also use bank fixed effects and country fixed effects in robustness tests. The error terms πit and ηit are assumed to be distributed symmetrically with mean zero.
The coefficient λ has a straightforward interpretation: it is the sensitivity of a bank’s riskiness to increases in its non-interest income. As the previous literature has found evidence of both positive and negative associations between non-interest income and risk, we have no a priori expectations about the sign of λ. However, the interpretation of λ will depend on how RISK is defined. If RISK = TOTRISK, then we are testing whether non-interest income increases the risk exposure of undiversified stakeholders, such as bank employees, bank managers, or bank regulators. However, if RISK = IDIORISK, then we are testing whether the risk associated with non-interest income is idiosyncratic to bank i, and hence is of no concern to a diversified investor. Conversely, if RISK = MKTRISK, then we are testing whether non-interest income increases banks’ exposure to the ups and downs of the stock market and the economy in general, creating risk that cannot be avoided by diversified shareholders. Finally, if RISK = IRRISK, then we are testing whether non-interest income reduces banks’ exposure to movements in interest rates, part of the conventional wisdom initially posited by bankers and industry analysts.
The coefficient δ also has a straightforward interpretation: it measures the marginal risk–return trade-off required by investors in banking company stock. Obviously, we expect this effect to be positive in an efficient market. Because this trade-off may not be linear, we also estimate alternative regression specifications that include both linear and quadratic RISK terms. The coefficient φ has a more subtle
128 Journal of Applied Business and Economics vol. 14(3) 2013
interpretation: it is the sensitivity of stock returns to increases in non-interest income after controlling for any change in the risk–return trade-off (i.e., δRISK) caused by the increase in non-interest income. A zero estimated value for φ would be consistent with an efficient stock market in which the risks associated with non-interest activities are priced just as efficiently as the risks associated with more traditional, interest-based banking activities. However, it is possible that the risks associated with relatively new banking activities are not yet well understood by investors, and hence may be poorly priced.7 If the market systematically underprices (overprices) the risk associated with non-interest activities, then we expect a positive (negative) φ coefficient.
Given the large number (42) of nations in our data, it is not possible to observe the various sources of non-interest income and how they may differ across banks. Our non-interest income variable NII combines all the non-interest income earned by a bank—fees, commissions, trading gains/losses, etc.—from all its lines of business. Because demand schedules and production functions can vary greatly across these different lines of business, the unobserved composition of NII may drive some of our findings. For example, if we find that NII is positively associated with MKTRISK, then we might infer that NII is weighted toward activities that are especially sensitive to the business cycle, such as investment banking, merger finance, or retail brokerage. Similarly, if we find that NII is positively associated with IRRISK, then we might infer that NII is weighted toward activities that are especially sensitive to interest rate fluctuations, such as the fee income earned via loan origination, securitization, and servicing. Not having access to the line-of-business composition of non-interest income also limits our ability to test for diversification effects. At best, we can draw inferences about whether combining non-interest income with all the other banking activities creates diversification gains. For instance, a finding that NII is positively associated with MKTRISK, but negatively associated or neutral with respect to TOTRISK, would imply that an increase in non-interest income generates gains from diversification within the average bank. These gains could be due to cost synergies (input sharing), revenue synergies (e.g., cross-selling), or less than perfect covariation of the cash flows between interest-based and non-interest-based activities.
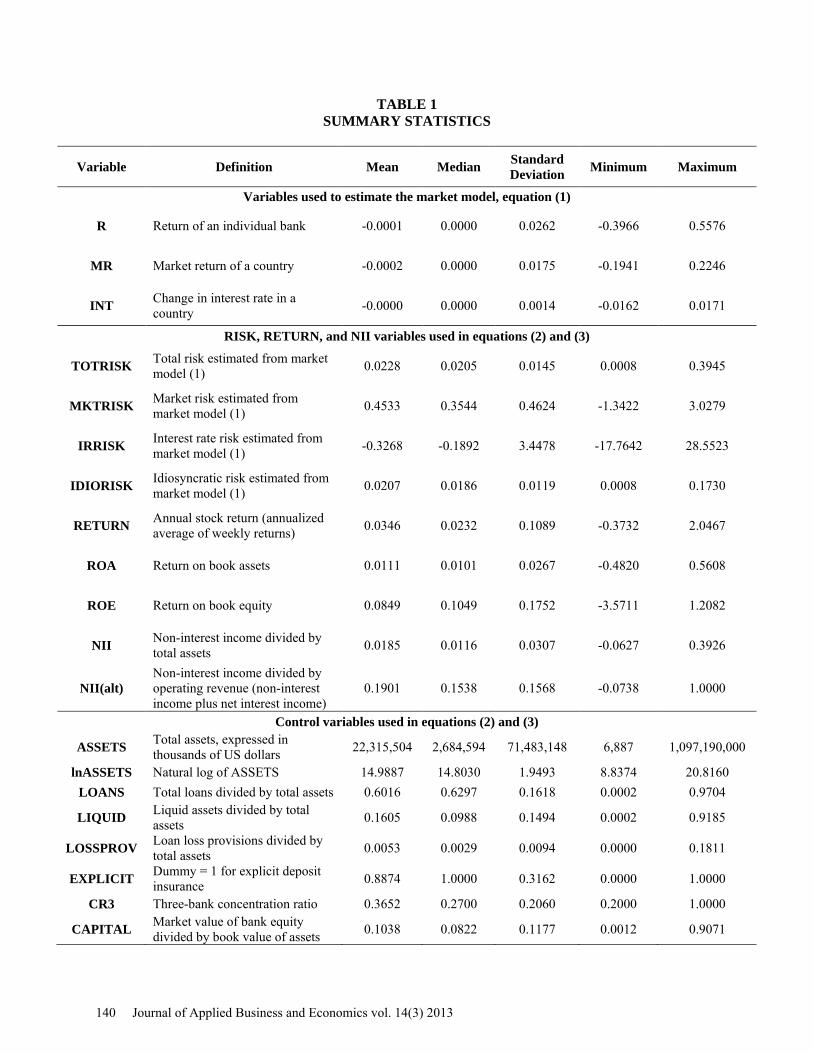
The variable definitions, data sources, and summary statistics for all of the regression variables used to estimate (1), (2), and (3) are displayed in Table 1. Our primary data source was the Fitch-IBCA Bankscope database, from which we drew our initial data set of 14,404 financial institutions and banks from 46 different countries observed annually from 1995 through 2002. From this large initial sample, we retained only publicly traded bank holding companies (BHCs), commercial banks, and savings banks for which we had full information.8 This resulted in a final data set of 877 banking companies from 42 countries. Table 1 displays some descriptive information for our bank data set. The accounting data for banks come from the Fitch-IBCA Bankscope database and the market data, including individual stock return data, interest rate data, and market index, for each country come from Datastream. The mean NII is 1.85 percent with a range from -6.27 percent to 39.26 percent, which indicates the wide variation among our sample banks. For the US studies, DeYoung and Rice (2004) reported that the aggregate non-interest income was 2.39 percent for the year 2001 and differed greatly between larger banks and smaller banks. Smith et al. (2003) reported that in EU countries, the average non-interest income increased from 0.88 percent of the total assets in 1994 to 1.09 percent in 1998. The difference among studies is mainly caused by the different samples under study. The mean TOTRISK is 2.28 percent, with a range from 0.08 to 39.45 percent. Our sample banks on average are less risky than the overall market of their country: the mean market risk is 0.45, which is substantially smaller than the market beta of 1. The mean of the interest rate risk and bank-specific risk is -0.3268 and 0.0207, respectively. Finally, the average stock return of banks is 3.46 percent per annum, with wide variation among banks. Control Variables
We include vectors of control variables in equations (2) and (3), denoted as Y in the RISK regression and Z in the RETURN regression. These variables are included to specify each equation better and to identify the system of equations. In addition, we include a vector of fixed time effects T in each regression to absorb the average year-to-year variation in risk and return in the banking sector.
Journal of Applied Business and Economics vol. 14(3) 2013 129
Six of the control variables appear in both the RISK equation (2) and the RETURN equation (3). lnASSETS is the natural logarithm of assets for bank i. Size may be risk-reducing because it increases the potential for diversification and gives banks greater access to sophisticated risk-management tools; however, the very largest banks may have greater systematic risk since their earnings are likely to be closely aligned with the general economy. Holding risk constant (recall that RISK appears on the right-hand side of the RETURN regression), the returns will increase (decrease) with the bank size if the average bank experiences scale economies (diseconomies); if the bank size is associated with a high-volume, low-margin, transactions banking strategy, then the returns may decline with the bank size (DeYoung, Hunter, & Udell, 2004); and there may be higher returns if the market prices-in a “too big to fail” premium for the very largest banks. LOANS is the ratio of total loans to total assets for bank i. A high loan-to-asset ratio may be risk-increasing because loans expose the bank to greater credit risk and greater market risk than other assets do; however, this ratio may signal an efficiently run bank, and hence less risk due to effective risk management. Holding risk constant, a high loan-to-asset ratio is likely to generate higher returns. LIQUID is the ratio of liquid assets to total assets for bank i. A store of liquid assets may represent a risk cushion that allows a bank to take on more risk, or it could signal risk-averse management, in which case it will be associated with lower levels of risk. Holding risk constant, a large store of low-yielding liquid assets is an opportunity cost and hence will be likely to be associated with lower returns. LOSSPROV is the ratio of provisions for loan losses to total assets for bank i. Assuming that this ratio indicates a bank’s expected credit risk, it should be associated with higher total risk, market risk, and idiosyncratic risk. Holding risk constant, high provisioning should reduce the returns.
EXPLICIT is a dummy variable indicating that bank i operates in a country with explicit deposit insurance. If explicit deposit insurance schemes increase the moral hazard incentives for bank managers, banks may take more risks on average; however, if market investors interpret this policy as an implicit government guarantee, the market risk may decline. Depositors can discipline banks by demanding higher interest rates or withdrawing their deposit. However, the explicit deposit insurance reduces depositors’ incentives to monitor a bank. Therefore, the explicit deposit insurance lowers banks’ interest expenses and makes interest payments less sensitive to bank risk. Therefore, we expect that EXPLICIT has a positive impact on returns. CR3 is the three-bank concentration ratio in bank i’s country. In the absence of competitive rivalry (high CR3), managers may choose the “quiet life,” in which case the risk will decline, and/or they may slacken off and run the bank poorly, in which case the earnings could grow more volatile. Holding risk constant, high market concentration will be associated with higher returns due to less competitive rivalry.
There are five control variables that appear only in the RISK equation (2). CAPITAL is the ratio of market-value equity to book-value assets for bank i. A large store of market-value equity (relative to the size of the bank) indicates a vote of confidence from investors that allows the bank to take on more risk without immediate penalty. RESTRICT is an index constructed by Barth, Caprio, and Levine (2001) that increases with the restrictions on permissible bank activities (e.g., securities, insurance, real estate) in bank i’s country. To the extent that these restrictions prevent banks from achieving their most efficient (or most preferred) risk–return trade-off, this index could be either positively or negatively related to risk. CORPGOV is an index constructed by Kaufman, Kraay, and Zoido-Lobaton (the KKZ index,9 1999 and 2005) that increases as the governance environment in bank i’s country improves. We expect this index to be negatively related to risk, because poor corporate governance is typically associated with higher risk-taking by managers. BANKFREE10 is an index that increases as restrictions on the banking and finance decline (easier entry, less state ownership, less government credit allocation, etc.) in bank i’s country. The sign of this variable is ambiguous: while greater bank freedom allows banks to engage in risky activities, it also removes the impediments to achieving an efficient risk–return trade-off. MULTSUPS is a dummy variable that indicates that bank i’s country has more than one bank supervisory body. If coordination between supervisors is difficult, or if multiple chartering authorities precipitate a “race to the bottom,” then this variable will be associated with greater risk.
There are two control variables that appear only in the RETURN equation (3). The coefficients for these variables should be interpreted holding risk constant. STATE and FOREIGN are dummy variables
130 Journal of Applied Business and Economics vol. 14(3) 2013
and measure the ownership of bank i by either the state or foreign, respectively. The expected coefficient sign for STATE would depend on whether bank i is a private bank expecting greater returns because state-owned rival banks provide poor competition or a state bank expecting lower returns. A similar story holds for foreign ownership. BASIC RESULTS
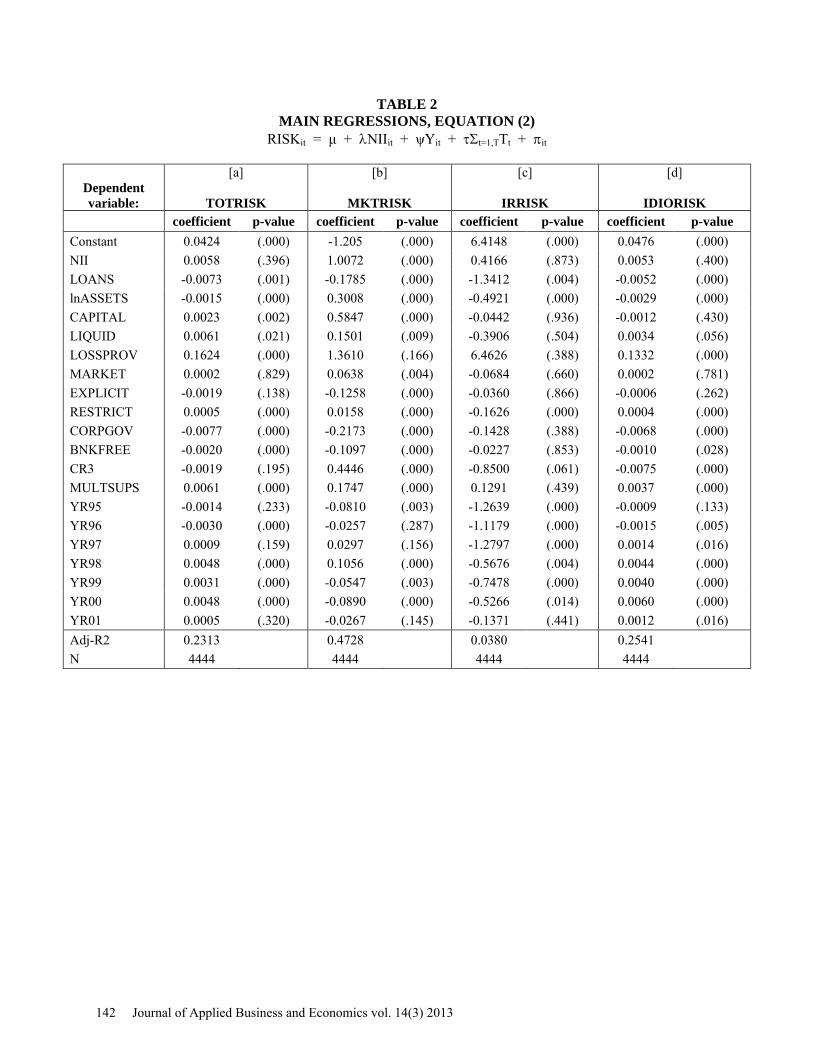
The results from the full-sample estimations of equations (2) and (3) are displayed, respectively, in Tables 2 and 3. There are three main findings in these regressions. First, non-interest income alters the composition of risk at the average bank in our sample, but neither increases nor decreases the overall risk. Second, we find positive associations in the data between the various risk measures and market returns, an indication that investors are pricing bank risk in these 42 countries. Third, after controlling for risk, we find no statistical relationship between non-interest income and market returns—that is, there is no premium or discount associated with non-interest activities on average.
In Table 2, we find a positive and statistically significant association between non-interest income and bank risk only when risk is defined as MKTRISK. Based on our estimates, a one-standard-deviation increase in NII is associated with a 6 percent increase in market risk at the means of the data. There is no evidence linking non-interest income to total risk, interest rate risk, or idiosyncratic risk. These results imply the existence of gains from diversification: greater reliance on non-interest activities makes the average bank in our data more sensitive to general market volatility (systematic risk) without increasing its overall return volatility.
In Table 3, we find positive and statistically significant risk–return relationships, evidence that investors require higher returns in exchange for accepting higher (diversifiable and non-diversifiable) risks. Based on our estimates, one-standard-deviation increases in TOTRISK, MKTRISK, and IDIORISK are associated with 82 percent, 94 percent, and 80 percent increases in RETURN, respectively, at the means of the data. Given this robust evidence of risk pricing in the data, we conclude that the lack of statistical significance for IRRISK in column [c] is likely to be due to the difficulties associated with measuring interest rate risk. The coefficient for NII is statistically non-significant in all four regressions, consistent with efficient markets that bid away any excess risk-adjusted returns associated with the product mix. Control Variables
The bank’s total assets might be the most obvious factor related to the level of bank risk. In Table 1, the sign of LogAssets is negative and significant in three regression models, except the market risk model, which indicates that larger banks are relatively more diversified, which lowers their total, bank-specific, and interest risk. However, as banks’ size grows, they involve more non-interest income activities, which have more comovements with the market, and thus their systematic market risk increases. The bank size has a negative effect on the stock return controlling for the risk–return trade-off. This result indicates that the average bank experiences scale diseconomies or is associated with a high-volume, low-margin, transactions banking strategy.
LOANS is negative and significantly associated with all four risk measures. The results indicate that a high loan-to-asset ratio may signal an efficiently run bank, and hence less risk due to effective risk management. Holding risk constant, however, we find that a high loan-to-asset ratio is likely to generate lower returns. The measure of financial leverage (CAPITAL) is positive and significantly associated with total risk as well as market risk measures. The result is consistent with our expectation: a large store of market-value equity indicates a vote of confidence from investors that allows the bank to take on more risk without immediate penalty. The measure of asset liquidity (LIQUID) is positively and significantly related to most risk measures and this effect might be due to the fact that liquid assets are shifty assets that are more difficult to monitor and can be moved quickly into other investments, meaning that as banks increase their liquid assets, the risk increases. The liquidity reduces the profitability significantly. The ratio of a provision for loan losses to total assets (LOSSPROV) in our regression to control for the credit
Journal of Applied Business and Economics vol. 14(3) 2013 131
risk is positively related to all the risk measures. Obviously, LOSSPROV reduces the performance of a bank significantly.
The country-specific variables are significantly associated with the risk of banks as well as the performance of banks. The dummy variable for a market-based economy (MARKET) is positive and weakly significant, indicating that banks in a market-based country have higher risk than banks in a bank-based country. This is mainly due to the limited positive role of banks in a market-based country. The existence of explicit deposit insurance (EXPLICIT) reduces the risk of banks. This result is not consistent with the moral hazard of bank managers. The result indicates that market investors interpret this policy as an implicit government guarantee, resulting in lower risk. However, we do not find any significant effect on the stock return. CORPGOV is highly significant and negative in risk regressions. This suggests that better governance reduces the risk of banks significantly. Better governance is associated with lower risk-taking behavior of managers in general. BANKFREE is negative and significantly associated with bank risk. This indicates that if a bank is more free and open, then it can achieve an efficient risk–return trade-off. The banking concentration increases the bank’s market risk significantly, while it also increases its profitability. This is consistent with the “too-big-to-fail” argument. Multiple existences of bank supervisory bodies increase banks’ risk in general. The state ownership of banks significantly reduces the performance of banks.
Non-Linear Risk–Return Trade-Off
It is unlikely that the risk–return trade-offs for non-interest banking activities and interest-based banking activities will be the same. Non-interest income derived from traditional banking activities, such as fees charged to core depositors, is likely to be relatively stable, while non-interest income derived from less traditional activities, such as investment banking, securities brokerage, or mortgage origination/securitization, may fluctuate substantially with the local, regional, or international business conditions (DeYoung & Roland, 2001). We cannot test this proposition directly because, as stated above, our non-interest income data are not reported by lines of business; however, if we reasonably assume that banks with especially large volumes of non-interest income tend to have less traditional business mixes, then we can test this proposition indirectly. Table 4 shows the partial results from alternative specifications of equation (3) that include the interaction variable RISK*NII, and reports the partial derivatives with respect to both RISK and NII. The coefficients of the RISK*NII term offer weak evidence that the market requires a higher return by banks with especially high levels of non-interest income: these coefficients are positive (negative for IRRISK) but not statistically significant. We conduct two additional tests in Table 4. First, we calculate a partial derivative of return with respective to NII and RISK and test whether the partial derivatives are statistically different from zero. Generally, we find that the partial derivatives are significantly different from zero, which suggests that both NII and Risk have a significant effect on the returns of banks. Second, we conduct the joint significance test to determine the joint significance of NII and RISK*NII as well as the joint significance of RISK and RISK*NII. While we find that NII and RISK*NII are weakly jointly significant, RISK and RISK*NII are always jointly significant. Overall, the findings suggest weak evidence that the market requires a higher return from banks with especially high levels of non-interest income. Accounting Returns
Strategic investment and product mix decisions at all firms, including banking companies, are often made and evaluated based on accounting information rather than market returns. Perhaps the main reason for this is that, while it is difficult to isolate the impact of a given business decision or investment project on a firm’s stock price, the project’s accounting-based rate of return can be calculated by tracing the impact of that project on the revenue and expense lines in the firm’s income statement. It is also likely that managers make investment and product mix decisions based on the probable impact of those decisions on their firms’ financial statements, because their promotions and compensation (and this is especially true for middle-level and quasi-upper-level managers) are heavily influenced by easily quantifiable information in financial statements. Thus, having found no statistical relationship between
132 Journal of Applied Business and Economics vol. 14(3) 2013
non-interest income and risk-adjusted market returns, we are interested in whether non-interest income is related to accounting rates of return.
Table 5 displays the results of equation (3) re-estimated using accounting returns (ROA and ROE) in place of RETURNS as the dependent variable. We find a strong statistical relationship between NII and ROA (first panel) and also between NII and ROE (second panel). Based on our column [a] estimates, a one-standard-deviation increase in NII is associated with a 76 percent increase in ROA (84 basis points) and a 41 percent increase in ROE (347 basis points) at the means of the data. Indeed, the evidence here suggests that had an accounting-based financial analysis been performed during our sample period, there would have appeared to be a risk-adjusted return premium associated with non-interest income. This is consistent with the conventional wisdom at the time among industry participants that expansion into non-interest activities resulted in improved risk–return trade-offs at commercial banks. Subsamples by Time
Non-interest income has been increasing as a percentage of commercial bank income in the US since the early 1980s (e.g., DeYoung & Rice, 2004; Kaufman & Mote, 1994,). Figure 1 shows that non-interest income increased for both US and non-US commercial banks during our 1995–2002 sample period, although the increase moderated in the later years. This change in the income composition has required banks to conduct many things differently from in the past, including using new production processes, new financial products and services, and new pricing methods. As discussed above, it is likely that these changes affected banks’ risk profiles through changes in their revenue streams, operating and/or financial leverage, exposure to interest rate risk, etc. It is also likely that these continuous innovations made it difficult at first for market investors to price commercial bank equity shares accurately; risk-averse investors with little knowledge of the true risk profiles of these new business methods may have initially priced-in a large risk premium, and relaxed this stance after several years of financial performance data observations made the risks associated with these new methods more transparent.11
We re-estimated our system of equations (2, 3) after splitting the data into an early time period (1995–1998) and a later time period (1999–2001). The results are shown in Tables 6 and 7. These subsample regressions are important tests of robustness, as they are largely consistent with our main full-sample results (see Tables 2 and 3) in both the early and the later subsamples. In the equation (2) regressions displayed in Table 6, MKTRISK is positively and significantly associated with NII in both time periods, while TOTRISK and IDIORISK continue to be statistically unrelated to NII in both time periods. In the equation (3) regressions displayed in Table 7, there is a positive estimated trade-off between RETURN and TOTRISK, MKTRISK, and IDIORISK in both time periods, and no statistical relationships between RETURN and NII in either time period.
Moreover, these regressions are consistent with (though by no means constitute strong proof of) our above conjecture that investors reduced their assessments of the riskiness of non-interest income as time passed. For example, in Table 6, the positive coefficient for NII declines in size, suggesting that the market scaled back its perception of the riskiness of non-interest income as time passed. Similarly, the market associated non-interest income with decreased interest rate risk early in the sample period, but this belief disappeared in the later period. The data in Table 7 tell a similar story. The positive risk–return trade-offs declined by about 50 percent for TOTRISK and IDIORISK, and by about 25 percent for MKTRISK, as time elapsed.12 Additional Robustness Tests
We performed a number of additional robustness tests of the main results displayed in Tables 2 and 3. When we imposed bank fixed effects on the model, the signs and statistical significance levels for all the main test coefficients, NII in equation (2), and NII and RISK in equation (3), were unchanged. The results are not reported here, but they are available from the authors upon request.
Journal of Applied Business and Economics vol. 14(3) 2013 133
CROSS-COUNTRY RESULTS
To investigate further the relationship between the non-traditional activities of a bank and its risk and return, in this section we examine the extent to which the institutional environment affects the relationship. Many economists have argued that bank-based systems are better at mobilizing funds, managing risk, and exerting sound corporate control, especially in weak institutional environments (Levine, 1997). Calomiris (1994) showed that the historical evidence indicates that German universal banks (with a relatively high level of non-traditional activities) were more efficient (lower cost of capital) than US banks and suffered fewer systemic problems than the US banking system. On the other hand, if a bank is operating in a market-based economy, its positive role is relatively limited and results in low demand for non-traditional activities. Therefore, banks are not good at managing risk due to non-interest income activities. Tables 8A and 8B show the results. In a market-based country, NII has a significant and positive association with the market risk. We do not find any impact of NII on risk in a bank-based country. In Table 8B, we find a more interesting result. In a market-based country, there is a significantly positive risk–return trade-off. On the other hand, we do not find a significant risk–return trade-off in a bank-based country. The result, however, shows that NII has a significantly positive relationship with stock returns. This suggests that the market efficiently prices the risk–return trade-off in a market-based economy, but not in a bank-based economy.
The risk of non-traditional activities can be contained through effective and prudential regulation and supervision. Depositors frequently lack the incentives and capabilities to monitor and discipline banks. Hence, governmental regulation and supervision may reduce the information asymmetries and are often essential to ensure the solvency of the whole banking system. The stronger supervisory power and strict regulation will improve the governance of banks by direct monitoring and discipline and will increase the likelihood that banks will allocate resources efficiently based on risk–return trade-offs. The enhanced governance of banks through strengthened supervisory power and stringent regulation may reduce the moral hazard of banks engaging in non-traditional activities. Therefore, tougher supervision and regulation lead to risk reduction. On the other hand, supervisors may maximize their private welfare instead of maximizing more social welfare, which preserves the safety and soundness of the banking system. In addition, tighter regulation and more supervision may reduce the competition, efficiency, and competitiveness of the banking system. This view, therefore, suggests that the risk profile due to non-traditional activities may differ among the levels of supervision and regulation. We use the bank freedom index as our main variable to test the potential different effects of NII on risk and return. Tables 9A and 9B document the findings. We find that NII has a significant and positive association with the total and market risk if the bank freedom is high. In contrast, there is a negative association between NII and risk in a low-bank-freedom country. The results, therefore, suggest that stronger supervisory power and strict regulation will improve governance and lead to risk reduction. In Table 9B, we find a significant risk–return trade-off in both countries.
The deposit insurance, especially explicit deposit insurance (EDI), reduces the losses that depositors incur in the case of bank failure. However, having an explicit deposit insurance scheme may lead to greater moral hazard for bank managers, who may take advantage of the deposit insurance program by engaging in more activities that may increase risk. The banking literature suggests that the more generous deposit insurance is, the greater are the risk-taking incentives for banks. Deposit insurance may make depositors less likely to enforce market discipline on banks and may induce banks to take additional risks.13 The empirical evidence also shows that deposit insurance increases the probability of banking crisis (Demirguc-Kunt & Detragiache, 2002; Demirguc-Kunt & Huizinga, 2004). A more generous deposit insurance scheme may therefore lead to greater moral hazard for the bank managers. Bank managers may take advantage of the explicit deposit insurance by greatly engaging in non-traditional activities, which may be riskier than traditional lending activities. Tables 10A and 10B show the results based on the existence of EDI. Consistent with the literature, we find a strong and positive association between NII and market risk in a country with EDI, while we find a negative relationship in a country
134 Journal of Applied Business and Economics vol. 14(3) 2013
without EDI. The finding suggests that explicit deposit insurance increases the moral hazard and thereby induces the risk-taking incentives for banks, resulting in a great risk to banks.
Finally, concentration (CONCEN) is the share of assets of the three largest banks in a country. If the banking sector is concentrated due to regulation, few large banks may enjoy rents. Bank concentration may lead to a “too-big-to-fail” policy and depositors do not have to care about bank failure. Bank concentration may also lead banks to engage in more non-traditional activities by exploiting the implicit guarantee from the government. We include a measure of banking concentration of each country from the World Bank Database (2004). This is the measure of the fraction of assets in the five largest banks that is owned by commercial banks and/or financial conglomerates. If there are fewer than five banks, it uses that number to calculate the index. Bank concentration may lead to the TBTF policy and depositors not having to care about bank failure. Bank concentration may also lead banks to engage in more risky activities by exploiting the implicit guarantee from the government. Tables 11A and 11B show the results based on the concentration. We find a strong and positive association between NII and market risk in a less concentrated market. The finding suggests that concentration leads banks to engage in more non-traditional activities by exploiting the implicit guarantee from the government and it results in a great risk to banks. CONCLUSION
Even though there is evidence of decreasing traditional activities among banks, the empirical studies on banks have mainly analyzed the role of the banks in terms of the traditional activities generating interest income. Kaufman and Mote (1994) argued that the nature of banking activities changed steadily in the 1990s. DeYoung and Roland (2001) showed that non-interest income at FDIC-insured commercial banks increased from 25% to over 40% of their aggregate income over the period 1984 to 2001. This is not only a trend for US banks, but also a trend for banks worldwide. The growth of non-interest income seems to have a positive effect on bank profitability and few studies have found consistent evidence on this trend in European countries (Smith et al., 2003).
Although there is a general belief that fee-based earnings are more stable than loan-based income, DeYoung and Roland (2001) provided three potential observations that explain that fee-based income may not be more stable than income from traditional banking activities: the low switching and information costs, the need to hire an additional fixed labor input (more expense ratio), and the no regulatory capital requirement that banks do not need to hold capital against fee-based activities (higher degree of leverage). The empirical results of the effects of non-traditional banking activities on the riskiness of bank are mixed. It is therefore interesting and important to know whether and how these new activities affect the nature of riskiness and the performance of banks.
This paper investigates the effect of non-interest income on the riskiness and profitability of banks. Specifically, using the data of 877 banks in 42 countries, we investigate whether non-traditional activities of banking institutions affect the risk and returns of banks. This is the first paper to examine this issue in a global context using capital market measures of risk as well as market and book value measures for performance. In general, we find that non-interest income is associated with riskier stock returns at commercial banking companies, due primarily to increased market, or systematic, risk. These findings are new to the literature, and they suggest that fee-based banking increases banks’ exposure to the business cycle. In contrast, we find almost no evidence linking non-interest income to changes in other risk measures, such as total risk, interest rate risk, or idiosyncratic risk. In addition, our findings suggest that, on average, the stock markets efficiently price the increased risk associated with the non-interest income market. That is, after controlling for cross-sectional differences in risk, market returns do not fluctuate with the mix of bank income. However, we find evidence of a premium in accounting returns that is positively related to non-interest income. This set of results is also new to the literature, and offers a potential explanation for the initial conventional wisdom among industry participants that expansion into non-interest activities would result in an improved risk–return trade-off at commercial banks. Finally, we find that cross-country differences in regulatory practices, economic conditions, and social institutions
Journal of Applied Business and Economics vol. 14(3) 2013 135
influence our main results in important ways, but on average our risk–return results appear to be robust across countries.
Our findings have several policy implications for regulation. Non-traditional activities can be less transparent than traditional banking activities, thus they are more difficult to monitor for safety and soundness. For example, reductions in equity capital caused by credit losses are obvious and easily identifiable (i.e., the progression of loan delinquency, loan classification, loan provisioning, and loan charge-off), but shocks to non-interest income affect equity capital more subtly through ex post reductions in retained earnings, which for most established firms are the primary source of capital. Activities that generate volatile earnings streams make this source of capital riskier, and this volatility is exacerbated by financial leverage. Under the current regulatory capital rules, banks are not required to hold capital against most fee-generating activities. Our findings invite a discussion about whether the risk associated with certain non-interest activities is large enough and systematic enough to merit a required capital charge in future versions of these capital regulations. Our findings also have implications for investors. If the additional risk associated with non-interest income is predominantly systematic risk (as we find here), then investors will require higher expected returns to accept this non-diversifiable risk in their portfolios.
ENDNOTES
1. Based on Federal Reserve Y-9C filings. We define net revenue as net interest income plus non-interest income. See Table 1 and Figure 1 below for some trends in non-interest income for non-US banking companies. Early studies documenting increases in non-interest income at commercial banks include those by Boyd and Gertler (1994) and Kaufman and Mote (1994). Choi (2005) documents the differences in the growth and determinants of non-interest income across banks in 42 different nations.
2. This organizational dichotomy follows the analysis of DeYoung and Rice (2004, Table 1). 3. In the US, the barriers between banking, securities, and insurance activities were reduced on an ad hoc
basis during the late 1980s and early 1990s; the crowning blow was the Gramm–Leach–Bliley (GLB) Act of 1999, which allowed banking and non-banking activities to be affiliated within a single financial holding company. In the EU, the Second Banking Co-ordination Directive of 1989 (implemented in 1993–94) permitted universal banks to expand anywhere within the EU regardless of the host country restrictions on product powers.
4. The elimination of deposit interest-rate ceilings in many countries has also led to increased fee income from depositor services, by allowing banks to price depositor services in a more rational and competitive fashion.
5. The yet-to-be-implemented Basel II capital framework includes capital charges on various fee-generating lines of business, but it uses largely ad hoc risk weights with no rigorous justification for the magnitudes. There is also a capital charge for operational risk, which is determined by the level of total operating (net interest plus non-interest) income.
6. Equation (2) is estimated by itself, and then equation (2) is estimated using the fitted value of RISK from (1) as a right-hand-side instrumental variable.
7. DeLong and DeYoung (2007) provided evidence that stock investors learn with experience how better to price new phenomena such as large, complex bank M&As.
8. We excluded central banks, cooperative banks, investment banks, Islamic banks, medium- and long-term credit banks, non-banking credit institutions, real estate/mortgage banks, and specialized governmental credit institutions.
9. The KKZ index is the aggregate indicators of six dimensions of governance: 1. Voice and Accountability—measuring political, civil, and human rights; 2. Political Instability and Violence—measuring the likelihood of violent threats to, or changes in, government, including terrorism; 3. Government Effectiveness—measuring the competence of the bureaucracy and the quality of public service delivery; 4. Regulatory Burden—measuring the incidence of market-unfriendly policies; 5. Rule of Law—measuring the quality of contract enforcement, the police, and the courts, as well as the likelihood of crime and violence; 6. Control of Corruption—measuring the exercise of public power for private gain, including both petty and grand corruption and state capture. The indicators are constructed using an unobserved components methodology described in detail in the paper. The index is measured ranging from about -2.5 to 2.5, with higher values
136 Journal of Applied Business and Economics vol. 14(3) 2013
corresponding to better governance. References: Kaufmann, D., Kraay, A., & Zoido-Lobaton, P. (1999a). Aggregating Governance Indicators. World Bank Policy Research Department Working Paper No. 2195; Kaufmann, D., Kraay, A., & Zoido-Lobaton, P. (1999a). Governance Matters. World Bank Policy Research Department Working Paper No. 2196.
10. The index is from the Heritage Foundation and the WSJ—the Heritage Foundation/Wall Street Journal Index of Economic Freedom.
11. Recent studies by DeLong and DeYoung (2007) and Pastor and Veronesi (2003) provided empirical evidence linking stock market prices to investor learning.
12. We acknowledge that other phenomena may be partially or wholly responsible for the observed reductions in the perception and pricing of risk associated with non-interest income in Tables 6 and 7. For example, the mix of financial services that generated the non-interest income in the two subsample periods may have been different.
13. See Bhattacharya, Boot, and Thakor (1998) and Demirguc-Kunt and Detragiache (2002). REFERENCES Allen, L.G., & Jagtiani, J. (2000). The Risk Effects of Combining Banking, Securities, and Insurance Activities. Journal of Economics and Business, 52, 485–497. Barth, J.R., Caprio Jr., G., & Levine, R. (2001). The Regulation and Supervision of Bank around World: A New Fatabase. In R.E. Litan, & R. Herring (Eds.), Integrating Emerging Market Countries into the Global Financial System. Washington, DC: Brooking Institution Press. Bhattacharya, S., Boot, A., & Thakor, A.V. (1998). The Economics of Bank Regulation. Journal of Money, Credit & Banking, 30, 745–770. Boyd, J.H., & Gertler, M. (1994). Are banks dead? Or are the reports greatly exaggerated? Quarterly Review, Federal Reserve Bank of Minneapolis, 2-23. Boyd, J. H., Hanweck, G. A., and Pithyachariyakul, P. (1980). Bank Holding Company Diversification, Federal Reserve Bank of Chicago, Proceedings from a Conference on Bank Structure and Competition, 105-120. Boyd, J.H., & Graham, S.L. (1986). Risk, Regulation, and Bank Holding Company Expansion into Nonbanking. Federal Reserve Bank of Minneapolis Quarterly Review, 10 (2), 2–17. Boyd, J.H., Graham, S.L., & Hewitt, R.S. (1993). Bank Holding Company Mergers with Nonbank Financial Firms: Effects on the Risk of Failure. Journal of Banking & Finance, 17, 43–63. Brewer III, E. (1989). Relationship between Bank Holding Company Risk and Nonbank Activity. Journal of Economics and Business, 41 (4), 337–353. Calomiris, C.W. (1994). The Costs of Rejecting Universal Banking: American Finance in German Mirror, 1870–1914. In N. Lamoreau, & D. Raff (Eds.), The Coordination of Economic Activities Within and Between Firms. Chicago: University of Chicago Press. Choi, S. (2005). Three Essays in Banking and Finance. Rensselaer Polytechnic Institute, PhD Dissertation. Cooper, M.J., Jackson III, W.E., & Patterson, G.A. (2003). Evidence of Predictability in the Cross-Section of Bank Stock Returns. Journal of Banking & Finance, 27, 817–850.
Journal of Applied Business and Economics vol. 14(3) 2013 137
DeLong, G. and DeYoung, R. (2007), Learning by Observing: Information Spillovers in the Execution and Valuation of Commercial Bank M&As. The Journal of Finance, 62, 181–216. doi: 10.1111/j.1540-6261.2007.01205.x DeYoung, R., Hunter, W., & Udell, G. (2004). The Past, Present, and Probable Future for Community Banks. Journal of Financial Services Research, 25(2), 85-133. DeYoung, R., & Roland, K.P. (2001). Product Mix and Earnings Volatility at Commercial Banks: Evidence from a Degree of Leverage Model. Journal of Financial Intermediation, 10, 54–84. DeYoung, R., & Rice T. (2004). Noninterest Income and Financial Performance at U.S. Commercial Banks. Financial Review, 39, 101-127. doi: 10.1111/j.0732-8516.2004.00069.x Demirguc-Kunt, A., & Detragiache, E. (2002). Does Deposit Insurance Increase Banking System Stability? An Empirical Investigation. Journal of Monetary Economics, 49, 1373–1406. Demirguc-Kunt, A., & Huizinga, H. (2004). Market Discipline and Deposit Insurance. Journal of Monetary Economics, 51, 375–399. Demsetz, R.S., & Strahan, P.E. (1997). Diversification, Size, and Risk at Bank Holding Companies. Journal of Money, Credit, and Banking, 29, 300–313. Eisenbeis, R.A., Harris, R.S., & Lakonishok, J. (1984). Benefits of Bank Diversification: The Evidence from Shareholder Returns. Journal of Finance, 34, 881–892. Esho, N., Kofman, P., & Sharpe., I. G. (2005). Diversification, Fee Income, and Credit Union Risk. Journal of Financial Services Research, 27(3), 259-281. Gallo, J.G., Apilado, V.P., & Kolari, J.W. (1996). Commercial Bank Mutual Fund Activities: Implications for Bank Risk and Profitability. Journal of Banking & Finance, 20, 1775–1791. Heggestad, A. (1975). Riskiness of Investments in Nonbank Activities by Bank Holding Companies. Journal of Economics & Business, 219–223. Johnson R.N. & Meinster, D.R. (1974). Bank Holding Companies: Diversification Opportunities in Nonbank Activities. Eastern Economic Journal, 1, 316-323. Kaufmann, D., Kraay, A., & Zoido-Lobaton, P. (1999). Aggregating Governance Indicators. Manuscript, The World Bank. Kaufman, G.G., & Mote, L.R. (1994). Is Banking a Declining Industry? A Historical Perspective. FBR NY Economic Perspectives, 18, 2–21. Kwan, S.H. (1997). Securities Activities by Commercial Banking Firms’ Section 20 Subsidiaries: Risk, Return, and Diversification Benefits. Working paper, Federal Reserve Bank of San Francisco. Kwast, M.L. (1989). The Impact of Underwriting and Dealing on Bank Returns and Risks. Journal of Banking and Finance, 13, 101–125. Laderman, E. S. (1998). The Potential Diversification and Failure Reduction Benefits of Bank Expansion into Nonbanking Activities. Federal Reserve Bank of San Francisco, Working Paper 2000-01.
138 Journal of Applied Business and Economics vol. 14(3) 2013
Levine, R. (1997). Financial Development and Economic Growth: Views and Agenda. Journal of Economic Literature, 688–726. Litan, R.E. (1985). Evaluating and Controlling the Risks of Financial Product Deregulation. Yale Journal of Regulation, 3, 1-52. Pastor, L., & Veronesi, P.. (2003). Stock Valuation and Learning about Profitability. Journal of Finance, 58:1749–89. Rogers, K.E., & Sinkey, J.F., Jr. (1999). An Analysis of Nontraditional Activities at US Commercial Banks. Review of Financial Economics, 8, 25–39. Roland, K. P. (1997). Profit Persistence in Large U.S. Bank Holding Companies: An Empirical Investigation. Office of the Comptroller of the Currency, Economics Working Paper, 97-2. Rosen, R. J., Lloyd-Davies, P. R., Kwast, M.L., & Humphrey, D. B. (1989). New Banking Powers. Journal of Banking and Finance, 13, 355–366. Sinkey J., & Nash, R. (1993). Assessing the Riskiness and Profitability of Credit Card Banks. Journal of Financial Services Research, 7, 127-150. Smith, R., Staikouras, C., & Wood, G. (2003). Noninterest Income and Total Income Stability. Working paper, Bank of England. Stiroh, K.J. (2004a). Diversification in Banking: Is Noninterest Income the Answer? Journal of Money, Credit, and Banking, 36(5), 853-882. Stiroh, K.J. (2004b). Do Community Banks Benefit from Diversification? Journal of Financial Services Research, 25(2-3), 135-160. doi: 10.1023/B:FINA.0000020657.59334.76 Wall, L.D. & Eisenbeis, R. A.(1984). Risk Considerations in Deregulating Bank Activities. Federal Reserve Bank of Atlanta, Economic Review, 69, 6-18. Wall, L. D., Reichert, A. K., & Mohanty, S. (1993). Deregulation and the Opportunities for Commercial Bank Diversification. Federal Reserve Bank Atlanta Economic Review, 1-25.
Journal of Applied Business and Economics vol. 14(3) 2013 139
TABLE 1 SUMMARY STATISTICS
Variable Definition Mean Median Standard Deviation Minimum Maximum
Variables used to estimate the market model, equation (1)
R Return of an individual bank -0.0001 0.0000 0.0262 -0.3966 0.5576
MR Market return of a country -0.0002 0.0000 0.0175 -0.1941 0.2246
INT Change in interest rate in a country -0.0000 0.0000 0.0014 -0.0162 0.0171
RISK, RETURN, and NII variables used in equations (2) and (3)
TOTRISK Total risk estimated from market model (1) 0.0228 0.0205 0.0145 0.0008 0.3945
MKTRISK Market risk estimated from market model (1) 0.4533 0.3544 0.4624 -1.3422 3.0279
IRRISK Interest rate risk estimated from market model (1) -0.3268 -0.1892 3.4478 -17.7642 28.5523
IDIORISK Idiosyncratic risk estimated from market model (1) 0.0207 0.0186 0.0119 0.0008 0.1730
RETURN Annual stock return (annualized average of weekly returns) 0.0346 0.0232 0.1089 -0.3732 2.0467
ROA Return on book assets 0.0111 0.0101 0.0267 -0.4820 0.5608
ROE Return on book equity 0.0849 0.1049 0.1752 -3.5711 1.2082
NII Non-interest income divided by total assets 0.0185 0.0116 0.0307 -0.0627 0.3926
NII(alt) Non-interest income divided by operating revenue (non-interest income plus net interest income)
0.1901 0.1538 0.1568 -0.0738 1.0000
Control variables used in equations (2) and (3)
ASSETS Total assets, expressed in thousands of US dollars 22,315,504 2,684,594 71,483,148 6,887 1,097,190,000
lnASSETS Natural log of ASSETS 14.9887 14.8030 1.9493 8.8374 20.8160 LOANS Total loans divided by total assets 0.6016 0.6297 0.1618 0.0002 0.9704
LIQUID Liquid assets divided by total assets 0.1605 0.0988 0.1494 0.0002 0.9185
LOSSPROV Loan loss provisions divided by total assets 0.0053 0.0029 0.0094 0.0000 0.1811
MARKET Dummy = 1 if economy is market-based (versus bank-based) 0.6858 1.0000 0.4642 0.0000 1.0000
FOREIGN Dummy = 1 if bank is a foreign-owned bank 0.0416 0.0000 0.1998 0.0000 1.0000
STATE Dummy = 1 if bank is a state-owned bank 0.0209 0.0000 0.1432 0.0000 1.0000
The Fitch-IBCA Bankscope database is our primary source for annual bank-level financial data. The bank stock returns Rit, stock market indices MRit, and interest rates INTit come from Datastream. Appendix I contains additional details about the data sources for MR. Datastream does not report long-term government bond yields for all countries; in these cases, we use a long-term corporate bond yield to calculate INT. The remainder of the control variables are observed from various sources.
Journal of Applied Business and Economics vol. 14(3) 2013 141
150 Journal of Applied Business and Economics vol. 14(3) 2013
FIGURE 1
Noninterest Income as Percentage of Total Revenues
10%12%14%16%18%20%22%24%26%28%
1995 1996 1997 1998 1999 2000 2001 2002
ALL
US
NON-US
Noninterest Income as Percentage of Total Assets
1.00%
1.20%
1.40%
1.60%
1.80%
2.00%
2.20%
2.40%
2.60%
1995 1996 1997 1998 1999 2000 2001 2002
ALL
US
NON-US
Noninterest Income as Percentage of Net Operating Revenues
20%
22%
24%
26%
28%
30%
32%
34%
36%
38%
1995 1996 1997 1998 1999 2000 2001 2002
ALL
US
NON-US
Journal of Applied Business and Economics vol. 14(3) 2013 151
APPENDIX I
Country Country Code Name of Index Datastream Mnemonic
Argentina AR Merval ARGMERV Austria AT ATX ATXINDX Australia AU ASX ALL ORDINARY ASXAORD Belgium BE Bel20 BGBEL20 Brazil BR BOVESPA BRBOVES Canada CA S&P/TSX Composite TTOCOMP Chile CL IGPA General IGPAGEN Czech Republic CZ PX50 CZPX50I Denmark DK KFX index DKKFXIN Estonia EE Talse index ESTALSE Finland FI HEX General Index HEXINDX France FR CAC40 FRCAC40 Germany DE DAX 30 Performance DAXINDX Greece GR ASE General GRAGENL Hong Kong HK Hang Seng Index HNGKNGI Hungary HU Budapest index BUXINDX India IN Bombay SE 200 IBOM200 Indonesia ID Jakarta Composite Index JAKCOMP Ireland IE Overall index ISEQUIT Israel IL Tel Aviv SE Moaf 25 ISTMAOF Italy IT MIB 30 ITMIB30 Japan JP TOPIX TOKYOSE Luxembourg LU Datastream market index TOTMKLX Malaysia MY Kuala Lumpur Composite Index KLPCOMP Mexico MX IPC (Bolsa) MXIPC35 Netherlands NL AEX NLALAEX Norway NO OBX OSLOOBX Pakistan PK Karachi SE 100 PKSE100 Poland PL WIG POLWIGI Portugal PT PSI (BVL) General POPSIGN Singapore SG STI SNGPORI South Korea KR KOSPI KORCOMP South Africa ZA JSE All Share JSEOVER Spain ES IBEX 35 IBEX35I Sri Lanka LK Colombo SE All Share SRALLSH Sweden SE Affarsvarlden General Index AFFGENL Switzerland CH Swiss Market Index SWISSMI Taiwan TW TWSE TAIWGHT Thailand TH SET Index BNGKSET Turkey TR ISE National 100 TRKISTB UK GB FTSE 100 FTSE100 US US S&P 500 S&PCOMP
152 Journal of Applied Business and Economics vol. 14(3) 2013