42
Risks, Vulnerabilities and the Social Protection System in Jamaica Presentation by Faith Innerarity Director General Ministry of Labour and Social Security
| Date post: | 14-Jul-2015 |
| Category: |
Government & Nonprofit |
| Upload: | food-and-agriculture-organization-of-the-united-nations |
| View: | 264 times |
| Download: | 0 times |

Risks, Vulnerabilities and the Social Protection System in Jamaica
Presentation by Faith Innerarity
Director General
Ministry of Labour and Social Security
Outline of Presentation
• Introduction – Integrating Economic and Social policies
• Background – Conceptual Underpinning of Social Protection System and the Rights-based Approach
• Government of Jamaica Response to Risk and vulnerability: Life Cycle Approach
• Comparative situation of Jamaica within LAC • Challenges – Coverage Gap and Incidence of
Poverty • Conclusion
2

Integrating Economic and social policies
• The integration of economic and social policies is indispensable to the realization of the goal of sustainable national development.
• This constitutes one of the greatest challenges in public policy in developing countries such as Jamaica.
3
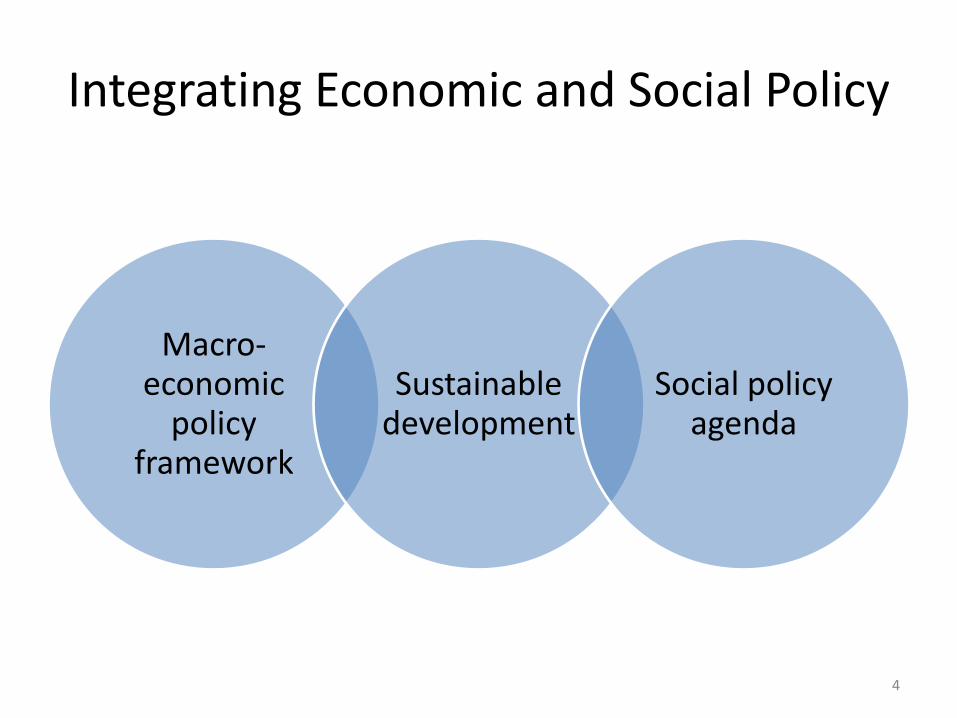
Integrating Economic and Social Policy
Macro-economic
policy framework
Sustainable development
Social policy agenda
4

Social Protection and Political Economy
• The design of social protection systems critical for balancing economic and social imperatives for desired development outcomes.
• Debates on social security and economic theory since classical economists
• Focus on political economy of social policies in context of neo-liberalism and globalisation.
5

Social Protection, Growth and social Progress
• Promotion of social protection, and reduction in levels of poverty, vulnerability and inequality linked to economic growth and social progress.
• Social protection contributes to economic growth by raising labour productivity and enhancing social stability.
• Investing in social protection is an investment in social justice and economic development
6

Social Protection System
• Conceptually social protection:
– Embodies the response of society to levels of risk and deprivation deemed unacceptable.
– Reflects a social consensus on fundamental values concerning acceptable levels and security of access to the means of meeting basis needs and basic rights.
– Includes secure access to income, health, education, nutrition and shelter.
7

Social Protection System
Two main sub-categories of social protection:
1. Social insurance which is social security that is financed by contributions and based on the insurance principle: that is, individuals or households protect themselves against risks by combining to pool resources with a larger number of similarly exposed individuals;
2. Social assistance which encompasses public actions that are designed to transfer resources to groups deemed eligible as a result of deprivation.
8

Social Protection System
Social Protection
Social Insurance
Active Labour Market Policies
Social Assistance
Shelter Nutrition
Education
Health
9

Rights-Based Approach to Social Protection
Universal Declaration of Human Rights, 1948, Article 22, states that “everyone as a member of society has the right to social security”.
International Covenant on Economic, Social and Cultural Rights 1966, Article 9, refers to “the right of everyone social security including social insurance”.
10

Rights-Based Approach to Social Protection
• As is the case with many other developing countries, over the years Jamaica has become signatory to a range of international instruments which promote the provision of social protection as a right.
• This has significantly influenced the formulation of social policies, the review of existing social legislation as well as the introduction of new laws and social assistance programmes.
11

Rights-Based Approach to Social Protection
• The Convention on the Rights of the Child (CRC) provided the context for the passage of the Child Care and Protection Act (2004) and the related Office of the Children’s Advocate, as well as the creation of the Child Care and Development Agency.
• International Labour Organization (ILO) instruments such the Convention on the Minimum Age for Admission to Employment – C138 and the Convention on the Worst Forms of Child Labour – C182 have also influenced the development of programmes for vulnerable children.
12

Rights-Based Approach to Social Protection
• Policies and programmes for senior citizens and persons with disabilities have been developed within the framework of the rights-based framework. These include: – National Policy Statement on Senior Citizens (1997) and
the programmes of the National Council for Senior Citizens which reflect the Vienna (1982) and Madrid (2002) Plan of Action on Ageing;
– National Policy for Persons with Disabilities (2000) and the Draft National Disability Bill based, respectively, on the UN Standard Rules for the Equalization of Opportunities for Persons with Disabilities (1994) and the Convention on the Rights of Persons with Disabilities (2006).
13

Rights-Based Approach to Social Protection
• Gender policies and programmes under the purview of the Bureau of Women’s Affairs and the Women’s Centre Foundation, as well as those under a range of other sectors and institutions are being implemented based on the principles of gender equality guided by the Convention on the Elimination of all Forms of Discrimination Against Women (CEDAW) and the Beijing Platform for Action.
14

Government Response to Increasing Risk and Vulnerability
• In spite of the decline in economic activity and public revenues in the last four years, in part as a result of the global financial crisis, the GOJ has managed not only to maintain but to increase spending on education and health and major social assistance programmes such as the PATH.
• Such expenditure is critical to ensure adequacy of the social protection system.
15

Age Group/Risk/ Indicator Population/Households at Risk Programmes Coverage Cost
(J$ million)
0- 5 years old
Poor Birth Conditions
Low birth weight
Infant mortality rate
Under five mortality rate
Maternal mortality rate
Lack of Registration
Lack of Physical, Socio-emotional,
and Cognitive Development
Malnutrition (< 5 years)
Overweighed (<5 years)
Low pre-primary attendance
0-5 : (9.9%) 267,285
Poor: (19.3%) 51,586
Non-poor: (80.7%) 215,699
12.1% live births (MOH)
24.1 per 1,000 (2008) (MOH)
25.7 per 1,000 (2008) (MOH)
84 per 100,000 (2004/7) (MOH)
11% (under 5, MICS 2005)
4% stunt (8,925 children)
5.8% overweighed (12,941
children)
Less than 80% of days
Children’s Advocate
ECC (MOE)
PATH Health Grants (under 6)
PATH- pregnant and lactating
Child Health and Development Passport
(MOH)
CHASE (ECD)
PATH/UNICEF
Early Childhood Feeding/Material program
(MOE)
Early Stimulation Program (MLSS)
-
2,834 ECI
51,713
1,093
45,000 (2010/11)
Build 3 and
equip/ 15 schools
30,000 meals
Occasional
campaigns
86,000 children
1,915 children
50.6
166.1
423.1
8.7
17.5
223.6
-
-
-
26.5
14.9
Sub-total : 931.0
6-18 years old
Low Primary Education Attendance
and Achievement (6-11)
Children not accounted for in school
Low attendance
Low student achievement
Low Secondary Education
Attendance and Achievement (12-18)
Low student attendance
Low student achievement
Vulnerable Children/Teens
Children with disabilities
Child labour
Street children
Orphan and vulnerable children
Children in difficulties with law
School age mothers
Unattached Youth (15-17 years)
6-18: (25.2%) 680,573
Poor: (20.8%) 141,559
Non-poor: (79.2%) 539,014
12.9% (39,917 children)
84.2% (Boys 83.2% girls 85.2%)
35% of primary leavers illiterate
(Vision 2030)
81.5% total: 83.9% girls; 79.1%
boys
78.4% secondary leavers lack
preparation (Vision 2030)
15% (56,628 children)
0.8% (4,582 children 5-14)
2,000 children (14-17 years)
-
375 in correctional facilities
7% (7,350 children out of school)
7,726 live births, under 20 years (
2008)
School Feeding Program (cooked meal,
MOE)
Nutribun (NPL, MOE)
Management of Oversee food aid receipts
(MLSS)
School Textbook –Primary (MOE)
School Textbooks-Secondary (MOE)
PATH Education Grants (6-18)
Special Education (MOE)
Elimination of Child labour
(IPEC/MLSS/ILO)
TACKLE (EU)
Possibility Program /Street Children (MLSS)
Children under the Care of the State (CDA)
Women’s Centre of Jamaica Foundation
(MYSC)
(For unattached youth see youth programs
below)
175,000
136,000
-
282,000 students
341,841 books
171,491
-
4,554
N/A
500-600
40
5,961
1,573
-
1,842.4
717.4
13.3
374.0
960.0
1,633.0
-
847.0
15.0
-
12.0
1,365.4
126.0
-
Sub-total: 7,905.5
Jamaica- Population at Risk: Programme Coverage and Cost (2009/10)
16

Age Group/Risk
Indicator Population/Households at Risk Programs Coverage
Cost
(J$ million)
19-24 years old
Vulnerable Youth
Unemployed/jobless
19-24: (9.4%) 253,811
Poor: (16.7%) 42,386
Non-poor: (83.3%) 211,425
43.1% (35,738 youth 20-24 years)
Scholarships (MOF)
Scholarships (MOE)
Student Loan Bureau (amount grants
only)
Step-to-Work (MLSS)
SYEAT (MLSS)
YES (MLSS)
NCYD (MYSC)
National Youth Services (MYSC)
Youth Empowerment and
Participation (MYSC)
(MYSC/UNICEF)
Youth Empowerment and
Participation (MYSC/Korea)
300
1,088
Loans 7,332/grants
925
1,586
3,600 (since 2008)
53
325,000
12,000
-
-
-
-
40.0
178.0
40.3
-
42.5
-
178.3
570.0
3.4
-
11.4
Sub-total:
1,023.9
25-59 years old
Low and Unstable
Income
Working poor
Unemployed
Low Human Capital
Not passed any exam
25-59: (44.5%) 1,197,103
Poor: (12.7%) 152,032
Non-poor: (87.3%) 1,045,071
6.4% (71,500) of those employed
work less than 33 hours (only part-
time work available)
11.6% (145,800 ) (8.1% male;
15.9% female)
14% adult illiteracy
72% labour force no training
Employment Services/Exchange
(MLSS)
Overseas Employment Family
Services (MLSS)
HEART Trust/NTA
PATH-Adult Poor/Poor Relief
2,027 registered
10,200 workers
83,000 persons
17,295
-
22.2
76.1
4,791.3
156.1
Sub-total:
5,045.7
60 years and older
Lack of Income
No pension
60+: (11%) 296,811
Poor: (17.2%) 51,051
Non-poor: (82.8%) 245,760
Without Pension from NIS: 71.3%
(162,825 over 65 years)
NIS (MLSS)
Public Pension System (MOF)
JADEP (NHF)
NI Gold Health Plan
Poor Relief (OPM/DLG)
PATH- Elderly
National Council Senior Citizens
(MLSS)
65,610 (old age
pensioners)
25,370 (pensioners)
196,100
84,817
1,81
48,775
32,902/715 clubs
7,737.4
14,689.0
577.0
292.2
150.0
392.9
55.6
Sub-total:
23,894.10
Jamaica- Population at Risk: Programme Coverage and Cost (2009/10)
17

Age Group/Risk
Indicator
Population/Households at
Risk Programs Coverage
Cost (J$
million)
Households in General
Poverty
Incidence
Homeless
Increase Lifestyle Diseases
and HIV/AIDS:
No health insurance
HIV/AIDS incidence
Person with Disabilities
Needs
Disability Incidence
Public and Domestic
Violence
Murder rate
Major crime rate
Cases of domestic violence
Deportees and Refugees
Lack of Low Income
Housing
Overcrowded
Lack of Basic Services
HH without piped water
HH without toilet facility
(exc.)
HH without electricity
Natural Disasters
HH: 771,086
HH Poor: (12%) 92,530
HH Non-poor: (88%)
678,556
686 (women 113; man
576) (BOS)
80% (2,156,000 persons)
HIV 1.2% (total: 33,000)
HIV 1.6% (15-49: 23,235)
6.3% (163,206) (2001
Census)
62/100,000
437/100,000
6.9% (2,523) cases of
Family Court
45.9% (353,928)
21.3% (164,214s)
15.7% ( 121,061)
7.1% (54,747)
Out Door Poor (Poor Relief)
Homeless Program (Board of
Supervision)
Rehabilitation Grants (MLSS)
Compassionate Grants (MLSS)
Emergency Grants (MLSS)
Public Assistance Services
(MLSS/Operations)
National Health Fund
Civil Servants Health Scheme (MOF)
CHASE- Health program
HIV Control/Prevention
(MOH/WB/G. Fund)
Jamaica Council for Persons with
Disability (MLSS)
Empowerment and Assistive Aids
Grant (PM)
The Abilities Foundations (MLSS)
PATH-Disabled
Poverty Reduction II (MONS/EU)
Violence Prevention (MONS
/UNDP/CIDA)
Rehabilitation/Reintegration
Deportees (MNS/UK)
YES (MSLL)
Indigent Housing (units)
JSIF
Social Development Commission
Constituency Development Fund
ODPEM/Operations
ODPEM/CCRIF insurance coverage
12,981
686
1,131
2,529
619
N/A
208,505
135,370 (incl.
pensioner)
150 persons; 68
projects
N/A
-
300
80
7,922
N/A
N/A
N/A
See above
100 news/480
repaired
130,000 persons
371 community
profiles
N/A
nationwide
nationwide
36.1
10.0
15.0
39.0
9.9
196.1
2,664.0
2,234.0
119.7
996.0
59.3
8.9
7.5
89.4
48.6
12.4
57.5
-
-
1,544.7
532.8
1,259.0
128.8
356.0
Subtotal:
10,424.7
Total SA J$ 21,031
Total SI: J$ 28,194
Total: J$49,225
Jamaica- Population at Risk: Programme Coverage and Cost ( 2009/10)
18
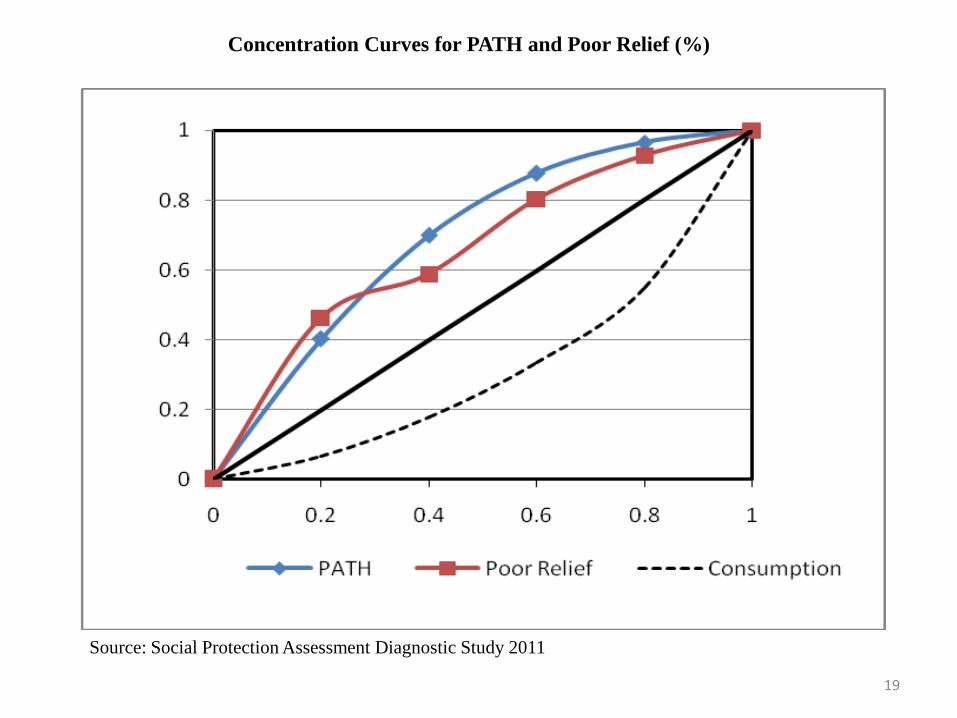
Concentration Curves for PATH and Poor Relief (%)
Source: Social Protection Assessment Diagnostic Study 2011
19
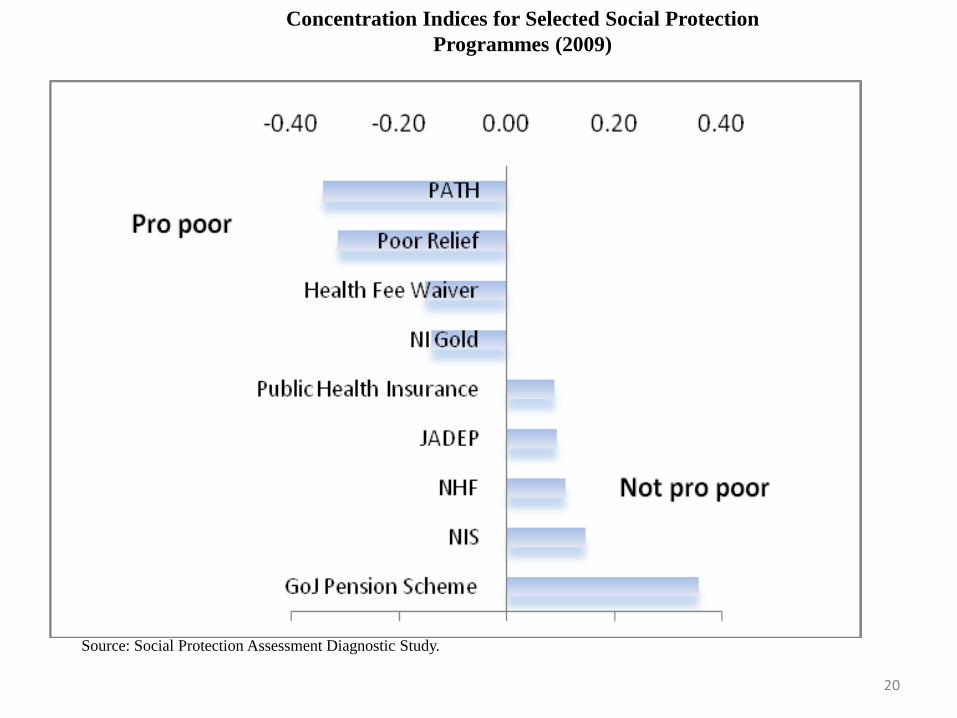
Concentration Indices for Selected Social Protection
Programmes (2009)
Source: Social Protection Assessment Diagnostic Study.
20

Cost Effectiveness
• Margaret Grosh, et al (2008) notes that PATH has the lowest administrative cost (around 0.3) of ten countries considered.
21

Generosity of PATH Benefit
• PATH education grant is not exceptionally generous when compared to international benchmarks or to the costs of sending the children to school in Jamaica.
• The grant to the elderly (social pension) is also very modest compared to other countries or the national poverty line.
• In general, therefore, there is no danger of creating working or saving disincentives with this CCT programme.
22
Coverage Versus Generosity of Transfer
• Within the framework of fiscal constraints the issue to consider is the trade-off between higher coverage and higher transfers.
• While in many LAC countries, CCT programmes target those in extreme poverty or the food poor; in the case of Jamaica poor households in general are targeted.
23

Country Social
Insurance
Social
Assistance
Social
Protection
Education Health Social
Sectors
Year
Jamaica 2.6 1.9 4.5 6.3 2.5 13.3 2009/10
Average 2.4 1.8 4.0 6.3 4.1 14.5
Antigua
&Barbuda 3.6 1.6 5.2 3.9 3.2 12.3 2009
Dominica 3.4 2.2 5.6 5 4.6 15.2 2000
Grenada 1.8 1.6 3.4 5.2 5.9 14.5 2001
St. Kitts & Nevis 2.7 1 3.7 6.4 3.6 13.7 2000
St. Lucia 1.3 1.6 2.6 7.5 3.3 13.4 2000/01
St. Vincent & the
Grenadines 1.4 2.5 3.6 9.9 4.1 17.6 2002
Regional Comparison of Social
Protection Spending (% of GDP)
Source: Jose Silverio Marques “Antigua and Barbuda Social Protection Assessment 24

Conditional Transfer
Programmes
Median
Transfer as
%
of Average
Consumption
a/
Range
Transfer as %
of Average
Consumption
No of
Countries
Non-contributory Pensions 20% 7%-59% 14
Generosity of Social Pension Programmes
Source: Margaret Grosh et al. “For Protection and Promotion: The Design and
Implementation of Effective Safety Nets”. World Bank, 2008. Table 5.1 (p. 137).
a/ Consumption expenditures excludes durables, housing and health of the
poorest quintile.
25

Country Year
of Pension
Information
Pension
Monthly
Amount
US$
Gross National
Income per
capita (GNI) US$
Pension / GNI
per capita (%)
Jamaica 2010 10.4 4,590 2.7
Antigua & Barbuda 2010 95.0 12,130 9.4
Belize 50.0 3,740 16.0
Bolivia a/ 2007 27.0 1,630 19.9
El Salvador 2009 50.0 3,370 17.8
Panamá 2009 100.0 6,570 18.3
Costa Rica 2010 135.0 6,260 25.9
Chile 2009 144.0 9,470 18.2
Generosity of the Non-contributory Pensions
Source: Social security systems and GNI from the World Bank (2009 for all
countries). Bolivia: Robert Holzmann, David A Robalino and Noriyuki Takayma,
editors “Closing the Coverage Gap” World Bank, 2009. Page 75
26

Number/Percentage
Population 60 years and older a/ 298, 060
No. NIS Pensioners 60 years and older b/ 84,817
No. PATH Beneficiaries 60 years and older c/ 58,133
Number persons 60 years and older covered by NIS and
PATH combined
142,950
Number persons 60 years and older not covered by NIS
or PATH
155,110
Percentage population 60 years and older covered by
NIS and PATH combined
47.96
Percentage population 60 years and older not covered by
NIS or PATH
52.04
Social Protection Coverage Gap: Income Support for Elderly
(Jamaica 2010)
Source: a/ STATIN, End of Year Population 2000; b/ MLSS - Number of NIS
Pensioners as at 31 March 2010; c/ MLSS - PATH beneficiaries 60+ as at February
2010 27

Incidence of Poverty in Jamaica
• The incidence of poverty declined gradually from 18.7 per cent in 2000 to 16.5 per cent in 2009. In 2007, there was a sharp decline in the incidence of poverty to the level of 9.9 per cent from 14.3 per cent in 2006, owing in part to exceptional economic activity associated with the World Cup Cricket; since then poverty has increased because of the impact of the global financial crisis.
• Poverty in Jamaica, as in most LAC countries, is associated with large households, low educational attainment, unemployment, and dependence on rural employment.
28

Groups Vulnerable to Poverty
• Female-headed households and households with more children are more likely to be poor. Approximately 21 per cent of Jamaica’s children (0-18 years) live in poverty and they account for about half (47 per cent) of all people living in poverty.
• The incidence of poverty among seniors (18.7 per cent) also tends to be higher than the national average.
• Poverty also appears to be strongly correlated with a range of social factors including: teenage pregnancy; single parenting; drug abuse; domestic violence; child abuse and delinquency, though these associations are both a cause and a result of poverty.
29

Groups Vulnerable to Poverty
• The incidence of poverty is computed by PIOJ from the annual Jamaica Survey of Living Conditions (JSLC). Based on a basket of goods and services, which include the minimum dietary allowances set by WHO/PAHO, a poverty line is estimated nationally and regionally for individuals and households. Consumption levels below the relevant poverty line are deemed inadequate to provide the minimum nutrition and associated basic necessities.
• The national poverty line (adult equivalent per capita consumption) was J$110,100 in 2009.
30

Poverty and Vulnerability: Female- Headed Households
• Female headed of households is a particularly vulnerable group. The JSLC data indicates that consumption levels among this group are lower than their male counterparts.
• Poverty among female headed households in 2009 was 12.8 per cent compared to 11.4 per cent for male heads of households. Women are also more likely to be represented among the working poor
31

2006 2007 2008 2009
Jamaica (% of individuals) 14.3 9.9 12.3 16.5
By Region
KMA 9.4 6.2 7.0 12.8
Other Towns 9.2 4.0 10.7 10.2
Rural Areas 19.8 15.3 17.0 22.5
By Gender (%)
Male 14.6 11.2 13.3 17.7
Female 13.9 8.8 11.3 15.4
By Household Head (%)
Male 9.9 7.2 7.9 11.4
Female 10.8 8.0 9.1 12.8
All Households 10.3 7.6 8.5 12.0
By Age Group (%)
0-5 18.6 11.2 15.7 19.3
6-18 17.0 12.2 15.2 20.8
19-24 14.0 10.2 13.9 16.7
25-59 11.9 7.9 9.7 12.7
60+ 12.1 10.8 10.3 17.2
Memoranda items:
Number of poor 380,824 264,907 330,531 444,771
A. E. Poverty Line (All JA) J$/annual 74,349 80,090 104,737 110,100
Food Poverty Line (A.E., All JA) J$/annual 59,908 52,712 68,933 72,463
Mean Per capita Consumption J$/annual 139,597 165,761 214,015 205,693
Mean Per capita Consumption (1990 prices) 9,531 10,508 10,377 9,578
Incidence of Poverty: 2006-2009 (%)
Source: Special tabulations prepared by PIOJ based on JSLC.
32

Trends in Urban and Rural Poverty
• Between 2005 and 2008, poverty has declined in KMA and in the Rural areas but the trend was halted with an increase in poverty in 2009.
• In Other Towns, poverty has increased between 2005 and 2008 and only declined slightly in 2009.
33

Trends in Urban and Rural Poverty
• Not only has the incidence of poverty increased in 2009 relative to 2006 but also the poor have become poorer (Table 2.2). The poverty gap which measures the average distance of the poor to the poverty line has increased nationally, in the KMA and in Rural areas. The severity of poverty, which measures the inequality among the poor, has also increased for Jamaica as a whole as well as for the KMA and Rural areas
34

Rural Poverty
• Poverty is more prevalent in rural areas which account for about two-third of the country’s poor.
• In general, rural populations are disadvantaged in terms of access to quality education and other social services and to employment opportunities. The decline in traditional agricultural exports such as banana and sugar cane owing to the erosion of trade preferences, as well as the downturn in the bauxite industry since 2008 because of the world economic recession has made the situation worse. (See Vision 2030 Jamaica National Development Plan- Poverty Reduction Strategic Plan, June 2009. p. 15)
35

Urban Poverty
• The KMA has about one-fourth of the poor;
• In KMA, there are pockets of poverty that tend to grow with rural-urban migration as the rural poor seek better job opportunities in the capital city.
36

Jamaica KMA Other
Towns
Rural
Areas 2006
Poverty Line +25% 24.9 17.5 16.2 33.8
Poverty Line +20% 22.7 15.0 14.4 31.4
Poverty Line +10% 19.3 12.5 14.0 26.1
Poverty Line +5% 17.0 10.6 11.9 23.6
Official Poverty Line 14.3 9.4 9.2 19.8
Poverty Line -5% 11.4 7.2 6.3 16.4
Poverty Line -10% 9.6 6.7 5.0 13.6
Poverty Line -20% 6.4 4.6 3.6 8.8
Poverty Line -25% 5.2 3.8 3.0 7.0
Total 100.0 100.0 100.0 100.0
2009
Poverty Line +25% 25.2 19.6 17.0 33.3
Poverty Line +20% 23.0 18.3 14.8 30.6
Poverty Line +10% 19.4 15.1 12.7 26.0
Poverty Line +5% 17.9 13.8 10.9 24.4
Official Poverty Line 16.5 12.8 10.2 22.5
Poverty Line -5% 14.2 11.5 7.4 19.6
Poverty Line -10% 12.3 10.3 5.0 17.6
Poverty Line -20% 8.2 7.0 3.1 11.7
Poverty Line -25% 6.6 5.2 2.2 9.9
Total 100.0 100.0 100.0 100.0
Dispersion of Population around Poverty Line: 2006/2009 (%) .
Source: Special tabulations prepared by PIOJ based on JSLC
37
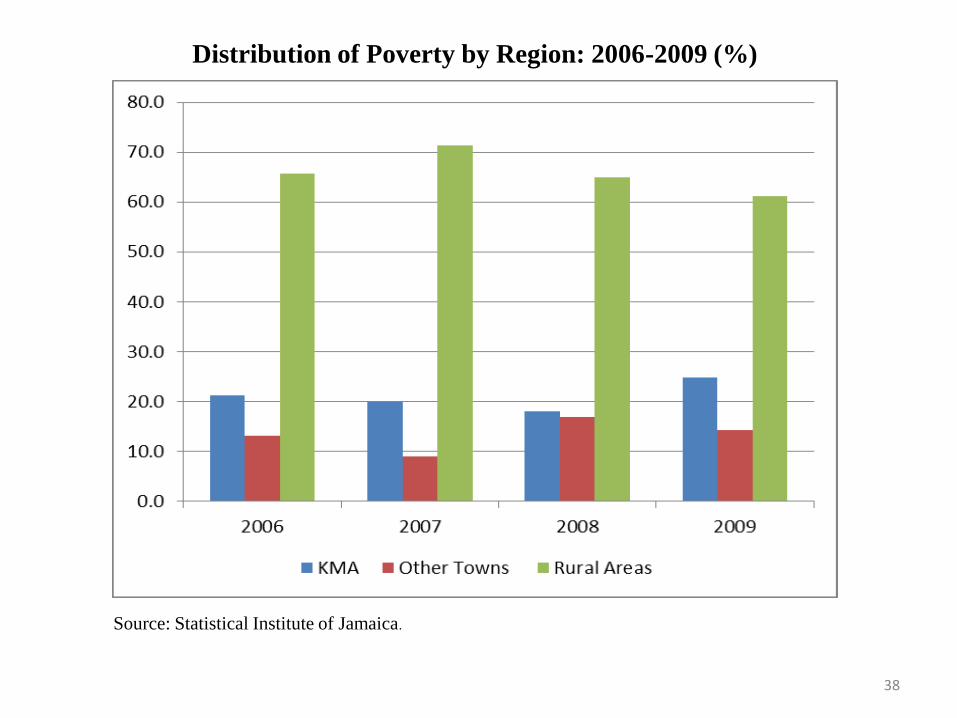
Distribution of Poverty by Region: 2006-2009 (%)
Source: Statistical Institute of Jamaica.
38

Deepening of Poverty
• The poverty gap which measures the average distance of the poor to the poverty line has increased nationally, in the KMA and in Rural areas.
• The severity of poverty, which measures the inequality among the poor, has also increased for Jamaica as a whole as well as for the KMA and Rural areas.
39

2006 2009
Jamaica KMA Other
Towns
Rural
Areas Jamaica KMA Other
Towns
Rural
Areas
Poverty Headcount
(H0)
14.3 9.4 9.2 19.8 16.5 12.8 10.2 22.5
Poverty Gap (H1) 3.2 2.2 1.5 4.5 3.8 3.1 1.5 5.6
Severity of Poverty
(H2)
1.2 0.9 0.4 1.7 1.4 1.1 0.4 2.0
Poverty Measures: 2006/2009
Source: Special tabulations prepared by PIOJ based on JSLC
Note
The poverty gap captures the mean aggregate income or consumption shortfall
relative to the poverty line across the whole population. It is obtained by
addition of all the shortfalls of the poor (assuming that the non-poor have a
shortfall of zero) and dividing the total by the population.
The severity of poverty takes into account not only the distance separating the
poor from the poverty line (the poverty gap), but also the inequality among the
poor. That is, a higher weight is placed on those households further away from
the poverty line. 40

Increased Vulnerability to Poverty
• Vulnerability to poverty, measured as the probability of falling below the poverty line, has increased. This indicates that many Jamaican are so close to the poverty line that they are at risk of falling into poverty by adverse shocks.
• One in every four Jamaicans (25.2 per cent) was within 25 per cent of the poverty line (33.3 per cent in Rural Areas) in 2009.
• Between 2006 and 2009, not only the incidence of poverty increased but also the share of those just above the poverty line (poverty line + 5%) from 17 per cent in 2006 to 17.7 per cent in 2009. This increase in vulnerability to poverty was more pronounced in the KMA and Rural Areas. In the case of ‘Other Towns’, the incidence of poverty increased but the share of those just above the poverty line declined.
• The share of those below -25% of the poverty line also increased from 5.2 per cent to 6.6 per cent during 2006-2009, implying that that the number of very poor also increased.
41

CONCLUSION
• Employment and sustainable livelihood constitute the first entry point for income security and social protection.
• Social insurance and social assistance benefits are intended to cover contingencies arising from reduced or non existent earning capacity resulting from life cycle vulnerabilities, macro-economic and other shocks.
• As Government seeks to strengthen the social protection system, it is necessary to pursue policies which foster economic and development including job creation.
42


![[PPT]Threats, Vulnerabilities, and Risks - Old Dominion …mukka/cs795sum15.net/Lecturenotes/day2/... · Web viewInformation security vulnerabilities are weaknesses that expose an](https://static.documents.pub/doc/80x56/5ace92407f8b9a71028b8fdf/pptthreats-vulnerabilities-and-risks-old-dominion-mukka-viewinformation.jpg)


