28
River Flood Plains: Some Observations On Their Formation GEOLOGICAL SURVEY PROFESSIONAL PAPER 282-C
River Flood Plains:
Some Observations
On Their FormationGEOLOGICAL SURVEY PROFESSIONAL PAPER 282-C
River Flood Plains:
Some Observations
On Their FormationBy M. GORDON WOLMAN and LUNA B. LEOPOLD
PHYSIOGRAPHIC AND HYDRAULIC STUDIES OF RIVERS
GEOLOGICAL SURVEY PROFESSIONAL PAPER 282-C
UNITED STATES GOVERNMENT PRINTING OFFICE, WASHINGTON : 1957
UNITED STATES DEPARTMENT OF THE INTERIOR
STEWART L. UDALL, Secretary
GEOLOGICAL SURVEY
William T. Pecora, Director
First Printing 1957
Second Printing 1959
Third Printing 1965
Fourth Printing 1967
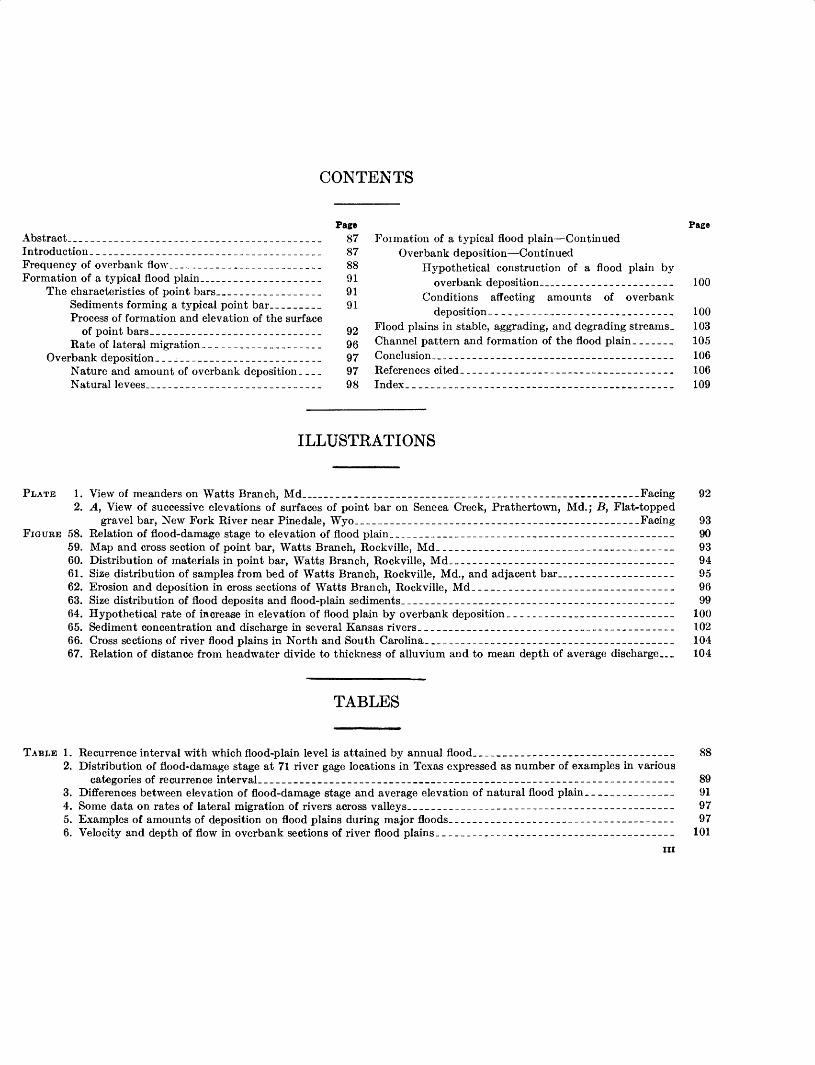
CONTENTS
Abstract.____-----__-___-___..______-_--_-__________Introduction_______________________________________Frequency of overbank flow.__________________________Formation of a typical flood plain_____._______________
The characteristics of point bars._________________Sediments forming a typical point bar_________Process of formation and elevation of the surface
of point bars.____________________________Rate of lateral migration.___________________
Overbank deposition.__^________________________Nature and amount of overbank deposition Natural levees,_____________________________
Page878788919191
92969797
PageFoimation of a typical flood plain—Continued
Overbank deposition—ContinuedHypothetical construction of a flood plain by
overbank deposition______________________ 100Conditions affecting amounts of overbank
deposition. ______________________________ 100Flood plains in stable, aggrading, and degrading streams _ 103 Channel pattern and formation of the flood plain.______ 105Conclusion,_ _______________________________________ 106References cited--___-__--__-----_--_-_--______----- 106Index. ______...______________________ 109
ILLUSTRATIONS
PLATE 1. View of meanders on Watts Branch, Md______.___________-______________-_---______-_-_-_-___-Facing 922. A, View of successive elevations of surfaces of point bar on Seneca Creek, Prathertown, Md.; B, Flat-topped
gravel bar, New Fork River near Pinedale, Wyo____-____-__-__--_----_-_-__---__--_------_-----Facing 93FIGURE 58. Relation of flood-damage stage to elevation of flood plain._______________________________________________ 90
59. Map and cross section of point bar, Watts Branch, Rockville, Md_ _______________________________________ 9360. Distribution of materials in point bar, Watts Branch, Rockville, Md___________________--_-__-__-__-_--__- 9461. Size distribution of samples from bed of Watts Branch, Rockville, Md., and adjacent bar__________________ 9562. Erosion and deposition in cross sections of Watts Branch, Rockville, Md_ _________________________________ 9663. Size distribution of flood deposits and flood-plain sediments.______________________-__--__--__--_-_-_-____ 9964. Hypothetical rate of increase in elevation of flood plain by overbank deposition____________________________ 10065. Sediment concentration and discharge in several Kansas rivers__.._-________-___-_-_-__---__-----__------- 10266. Cross sections of river flood plains in North and South Carolina._________________________________________ 10467. Relation of distance from headwater divide to thickness of alluvium and to mean depth of average discharge.._ 104
TABLES
TABLE 1. Recurrence interval with which flood-plain level is attained by annual flood_________________________________ 882. Distribution of flood-damage stage at 71 river gage locations in Texas expressed as number of examples in various
categories of recurrence interval_________________________.____________________--_--__-_---_-_---_---- 893. Differences between elevation of flood-damage stage and average elevation of natural flood plain_______________ 914. Some data on rates of lateral migration of rivers across valleys___-_-__-_---_------------------------------- 975. Examples of amounts of deposition on flood plains during major floods.________--_-__---____---------_------ 976. Velocity and depth of flow in overbank sections of river flood plains.__________________-_-__-____--_--_-_--- 101
HI
PHYSIOGRAPHIC AND HYDRAULIC STUDIES OF RIVERS
RIVER FLOOD PLAINS: SOME OBSERVATIONS ON THEIR FORMATION
By M. GORDON WOLMAN and LUNA B. LEOPOLD
ABSTRACT
On many small rivers and most great rivers, the flood plain consists of channel and overbank deposits. The proportion of the latter is generally very small.
Frequency studies indicate that the flood plains of many streams of different sizes flowing in diverse physiographic and climatic regions are subject to flooding about once a year.
The uniform frequency of flooding of the flood-plain surface and the small amount of deposition observed in great floods (average 0.07 foot) support the conclusion that overbank deposition contributes only a minor part of the material con stituting the flood plain. The relatively high velocities (1 to 4 fps) which can occur in overbank flows and the reduction in sediment concentration which often accompanies large floods may also help account for this. Although lateral migration of channels is important in controlling the elevation of the flood plain, rates of migration are extremely variable and alone cannot account for the uniform relation the flood-plain surface bears to the channel.
Detailed studies of flood plains in Maryland and in North Carolina indicate that it is difficult to differentiate between channel and overbank deposits in a stratigraphic section alone.
Because deposition on the flood plain does not continue indefinitely, the flood-plain surface can only be transformed into a terrace surface by some tectonic or climatic change which alters the regimen of the river and causes it to entrench itself below its established bed and associated flood plain. A terrace, then, is distinguished from a flood plain by the frequency with which each is overflowed.
INTRODUCTION
Owing to the extensive use of river flood plains by industry and agriculture, there is practical as well as intellectual interest in the mode of formation, stability of the flood plain, and the frequency of flooding of its surface. If maximum use is to be made of the broad, level surfaces provided by flood plains, it is important to know the natural conditions controlling their development and preservation. The geologist has long been interested in the characteristics of flood plains and has written much about them. For the most part, previous papers have dealt primarily with individual examples. The authors believe that the hydrologic as well as the additional stratigraphic observations presented here may help in developing a more general ized picture of the characteristics of river flood plains. Conclusions based upon the data now at hand should
be considered tentative, as many additional data will be needed to verify them adequately.
A definition of allood plain often quoted is "a strip of relatively smooth land bordering a stream * * * called a living flood plain if it is overflowed in times of high water" (Rice, 1949, p. 139). Valley flats which would usually be considered "flood plains" may include those formed by different processes such as landslides, low-angle fans, and perhaps others. The distinction between valley flats formed by different processes may not be apparent to the casual observer and, indeed, detailed work might be necessary to determine the origin of a given feature. However, an important process resulting in the formation of valley flats is a combination of deposition on the inside of river curves and deposition from overbank flows. This process produced many of the flat areas adjoining river channels and probably most of the flood plains of the great rivers of the world. It is the flood plains produced by this process with which the present paper is concerned.
The data supplied to us by several district engineers of the Geological Survey are essential to the tentative conclusions reached in this paper. We are indebted to H. C. Bolon, L. R. Sawyer, M. T. Wilson, and E. A. Johnson. We also express our appreciation to D. M. Culbertson for detailed analyses of hydrographs of water and sediment in several streams in Kansas. Shri B. N. Chatterjea kindly obtained certain field data in India at our request, and furnished us flood frequency tabulations for which we are grateful.
We have profited from discussion of the subject with J. T. Hack of the Geological Survey. In addition to colleagues in the Survey who read earlier drafts, we thank Prof. John C. Geyer of Johns Hopkins University, H. T. U. Smith of the University of Kansas, and Mr. Cole Fisher of the Virginia Geologi cal Survey for their helpful criticisms of the manuscript. Thanks are due also to Miss Gladys Braden of Minne apolis, Minn., for a number of references with which she provided us.
We are grateful to the Viers family of Rockville, Md., and especially to Caroline Viers Mudgett, for permission to study the stream on their property over a period of years.
87
PHYSIOGRAPHIC AND HYDRAULIC STUDIES OF RIVERS
FREQUENCY OF OVERBANK FLOW
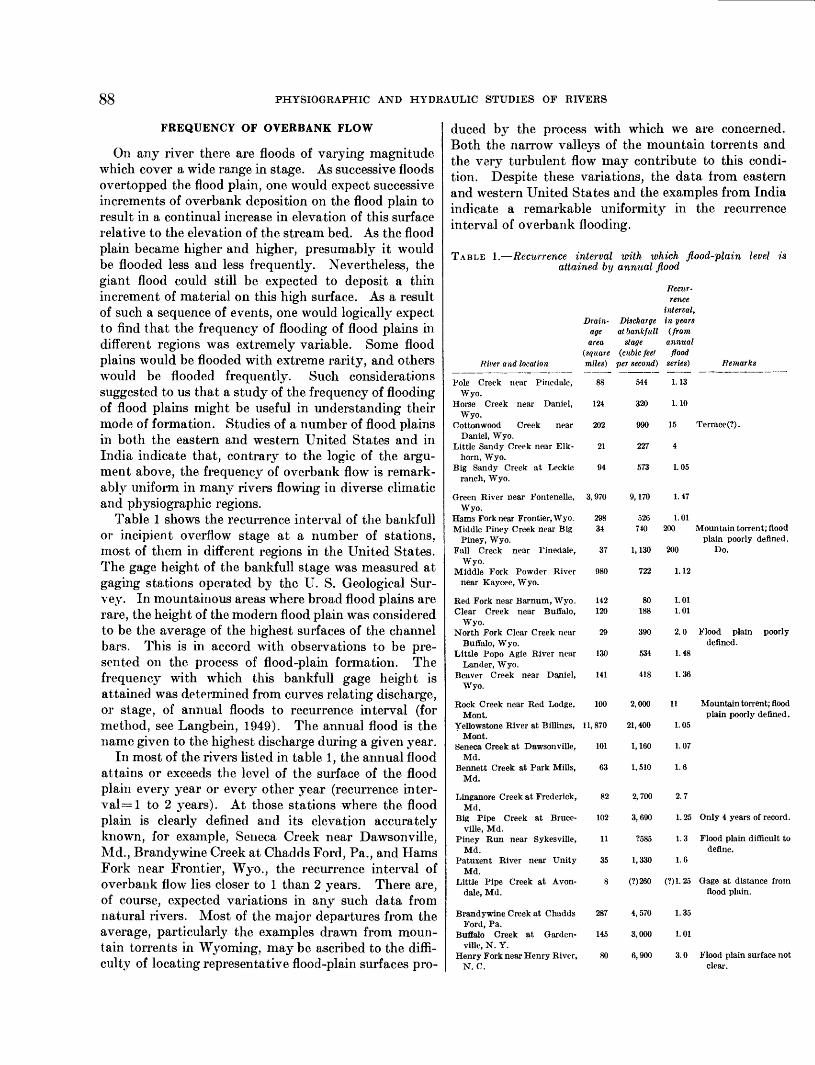
On any river there are floods of varying magnitude which cover a wide range in stage. As successive floods overtopped the flood plain, one would expect successive increments of overbank deposition on the flood plain to result in a continual increase in elevation of this surface relative to the elevation of the stream bed. As the flood plain became higher and higher, presumably it would be flooded less and less frequently. Nevertheless, the giant flood could still be expected to deposit a thin increment of material on this high surface. As a result of such a sequence of events, one would logically expect to find that the frequency of flooding of flood plains in different regions was extremely variable. Some flood plains would be flooded with extreme rarity, and others would be flooded frequently. Such considerations suggested to us that a study of the frequency of flooding of flood plains might be useful in understanding their mode of formation. Studies of a number of flood plains in both the eastern and western United States and in India indicate that, contrary to the logic of the argu ment above, the frequency of overbank flow is remark ably uniform in many rivers flowing in diverse climatic and physiographic regions.
Table 1 shows the recurrence interval of the bankf ull or incipient overflow stage at a number of stations, most of them in different regions in the United States. The gage height of the bankfull stage was measured at gaging stations operated by the U. S. Geological Sur vey. In mountainous areas where broad flood plains are rare, the height of the modern flood plain was considered to be the average of the highest surfaces of the channel bars. This is in accord with observations to be pre sented on the process of flood-plain formation. The frequency with which this bankfull gage height is attained was determined from curves relating discharge, or stage, of annual floods to recurrence interval (for method, see Langbein, 1949). The annual flood is the name given to the highest discharge during a given year.
In most of the rivers listed in table 1, the annual flood attains or exceeds the level of the surface of the flood plain every year or every other year (recurrence inter- val=l to 2 years). At those stations where the flood plain is clearly defined and its elevation accurately known, for example, Seneca Creek near Dawsonville, Md., Brandywine Creek at Chadds Ford, Pa., and Hams Fork near Frontier, Wyo., the recurrence interval of overbank flow lies closer to 1 than 2 years. There are, of course, expected variations in any such data from natural rivers. Most of the major departures from the average, particularly the examples drawn from moun tain torrents in Wyoming, may be ascribed to the diffi culty of locating representative flood-plain surfaces pro
duced by the process with which we are concerned. Both the narrow valleys of the mountain torrents and the very turbulent flow may contribute to this condi tion. Despite these variations, the data from eastern and western United States and the examples from India indicate a remarkable uniformity in the recurrence interval of overbank flooding.
TABLE 1.—Recurrence interval with which flood-plain level is attained by annual flood
Recur rence
interval,Drain- Discharge in years
age at bankfull (from area stage annual
(square (cubic fee! flood River and location miles) per second) series) Remarks
Pole Creek near Pinedale, 88Wyo.
Horse Creek near Daniel, 124Wyo.
Cottonwood Creek near 202Daniel, Wyo.
Little Sandy Creek near Elk- 21horn, Wyo.
Big Sandy Creek at Leckie 94ranch, Wyo.
Green River near Fontenelle, 3,970Wyo.
Hams Fork near Frontier, Wyo. 298 Middle Piney Creek near Big 34
Piney, Wyo. Fall Creek near Pinedale, 37
Wyo. Middle Fork Powder River 980
near Kaycee, Wyo.
Red Fork near Barnum, Wyo. Clear Creek near Buffalo,
Wyo. North Fork Clear Creek near
Buffalo, Wyo. Little Popo Agie River near
Lander, Wyo. Beaver Creek near Daniel,
Wyo.
142120
29
130
141
100Rock Creek near Red Lodge,Mont.
Yellowstone River at Billings, 11,870Mont.
Seneca Creek at Dawsonville, 101Md.
Bennett Creek at Park Mills, 63Md.
Linganore Creek at Frederick, 82Md.
Big Pipe Creek at Bruce- 102ville, Md.
Piney Run near Sykesville, 11Md.
Patuxent River near Unity 35Md.
Little Pipe Creek at Avon- 8dale, Md.
Brandywine Creek at Chadds 287Ford, Pa.
Buffalo Creek at Garden- 145ville, N. Y.
Henry Fork near Henry River, 80N. C.
544
320
990
227
573
526740 200
1,130 200
722 1.12
80188
390
534
418
2,000
21,400
1,160
1,510
2,700
3,690
?585
1,330
1.13
1.10
15 Terrace (?).
4
1.05
1.47
1.01Mountain torrent; flood
plain poorly defined. Do.
1.011.01
2.0 Flood plain poorlydenned.
1.48
1.36
Mountain torrent; flood plain poorly defined.
11
1.05
1.07
1.6
2.7
1.25 Only 4 years of record.
1.3 Flood plain difficult todefine.
1.6
(?)260 (?)1.25 Gage at distance from flood plain.
4,570 1.35
3,000 1.01
6,900 3.0 Flood plain surface not clear.
RIVER FLOOD PLAINS: SOME OBSERVATIONS ON THEIR FORMATION 89
TABLE 1.—Recurrence interval with which flood-plain level is attained by annual flood—Continued
River and location
First Broad River near Lawn- dale, N. C.
South Tyger River near Reid- ville, S. C.
Drain age area
(square miles)
198
106
Discharge at ban kf nil
stage (cubic feet per second)
5,900
3,400
Recur rence
interval, in years
(from annual flood
series) Remarks
1.16
2.2
South Tyger River near Wood ruff, S. C.
Middle Tyger River at Ly- man, S. C.
Tyger River near Woodruff, S. C.
Willimantic River near South Coventry, Conn.
Hop River near Columbia, Conn.
Pomperaug River at South- bury, Conn.
Burhi Gandak River at Sikan- darpur, Bihar, India.
Bagmati River at Dhang rail road bridge, Bihar, India
1 Estimated maximum.
174
68
351
121
76
15,000 +20 Flood plain difficult todefine.
1,200 1.18
13,500
1,050
730
75 1,550
.... (?)24,000
—... '146,000
5
1.15
1.04 Flood plain elevation not accurately deter mined.
1.05
2.05 "Danger stage" as sumed from local information to equal bankfull stage; data from series of gage height observations.
2.2 Do.
Critera for defining a "flood" vary, but in general all definitions imply overbank flow. Despite this varia tion in definition of a "flood," there is some consistency in frequency of overbank flows. For example, on the Elkhorn Kiver in Nebraska the U. S. Corps of Engi neers (1949a, p. 18) found evidence "of the occurrence of 33 floods on the Elkhorn River and of a greater number of floods on tributary streams during the 66-year period since 1881." Thirty-three flood occurrences in 66 years represent an average frequency of one flood every 2 years. On the Yellowstone River the Corps of En gineers (1949b, p. 22) reports that "records indicate that at least 48 floods have caused serious inundation of farm lands and damage to property along the main stem in the 64-year period from 1882 to 1945." That is, floods have occurred with a frequency of approximately one in 1.3 years.
Flood-damage stage, as used by the U. S. Weather Bureau, refers to the gage elevation at which overflow begins to cause damage. In an unpublished study of the U. S. Weather Bureau data on flood-damage stage in rivers, W. B. Langbein found that the median recur rence interval of the damage stage at 140 stations was 2.1 years, based on annual flood series. "Flood stage" in most instances is a term used synonymously with "flood-damage stage." Its designation at any partic ular place is sometimes a reflection of local experience
but usually results from an engineering investigation of flood-control needs and becomes accepted as an "offi cial" designation. Additional data from records of the Corps of Engineers on the frequency of flood-damage stage are provided in table 2. The median recurrence interval in this table is about 2 years, a value which is somewhat higher than we have found it in the majority of our direct field observations.
TABLE 2.—Distribution of flood-damage stage at 71 river gages in Texas expressed as number of examples in various categories of recurrence interval (Data from Corps of Engineers')
Categories of recurrence interval, in years (an nual flood series) __—— ——— - ——
Number of cases in each category.-.--..1.0 1.0-1.5 1.5-2 2-3 3-5 5-8 8
3 7 16 22 12 4 7
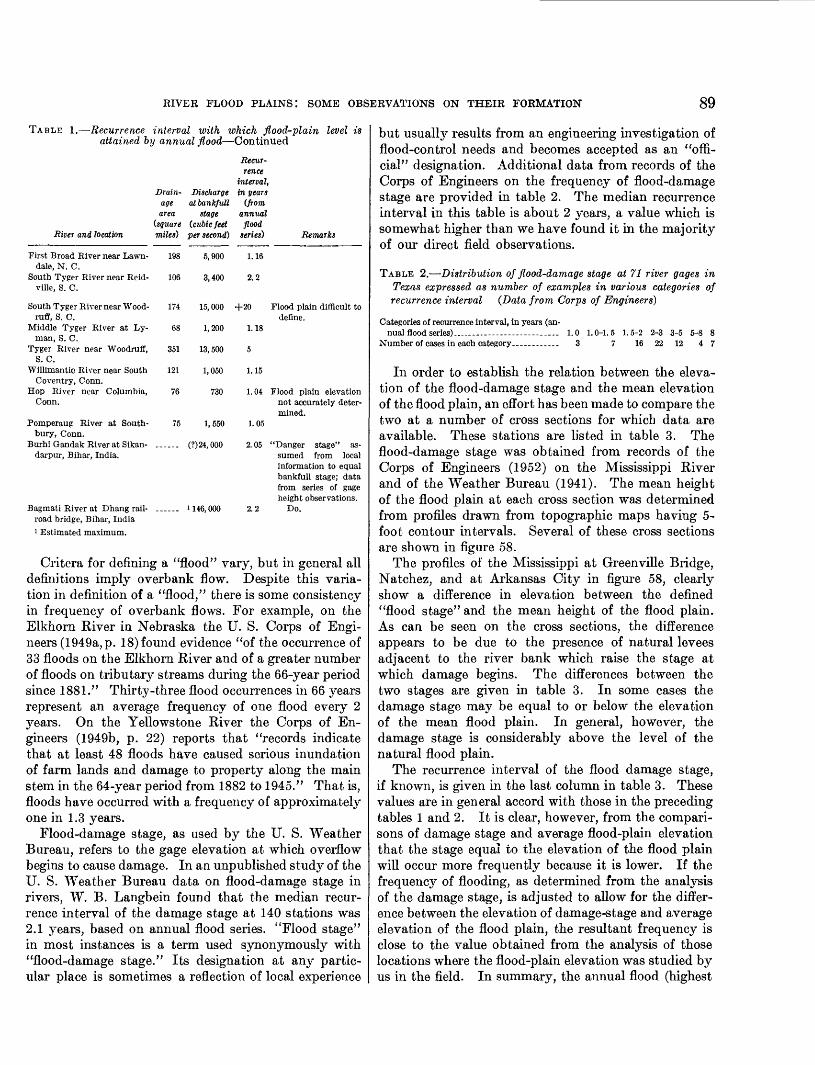
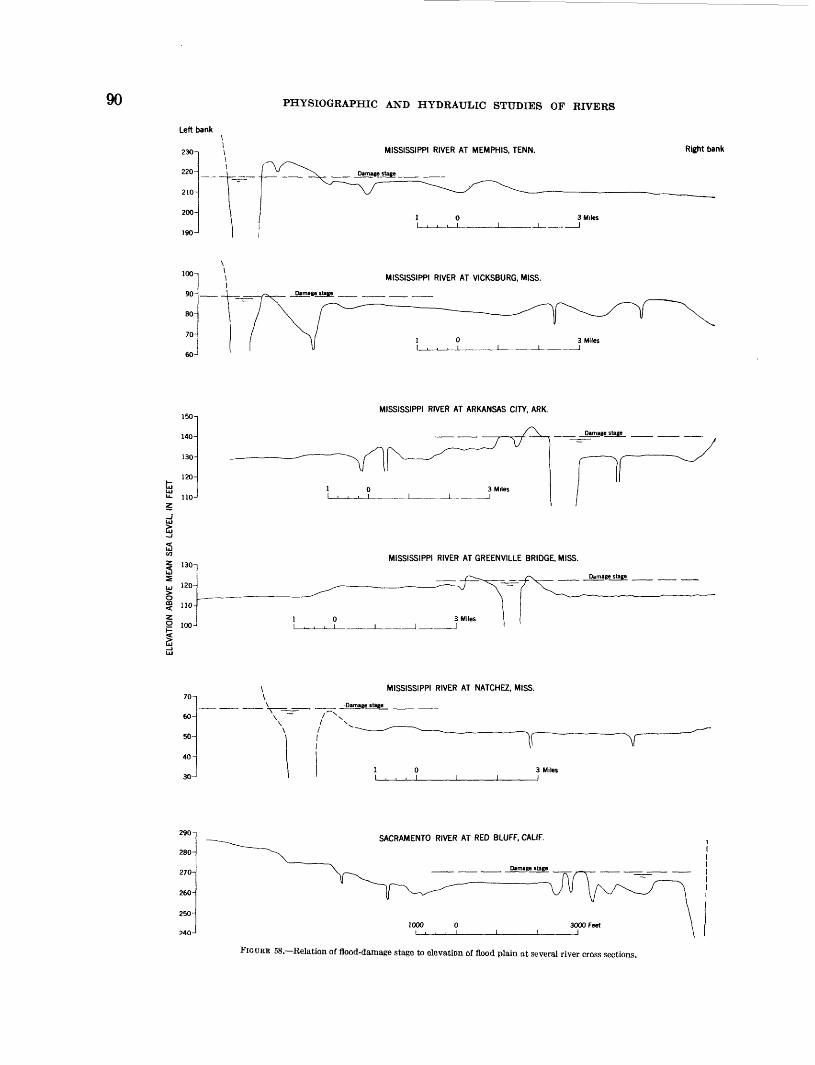
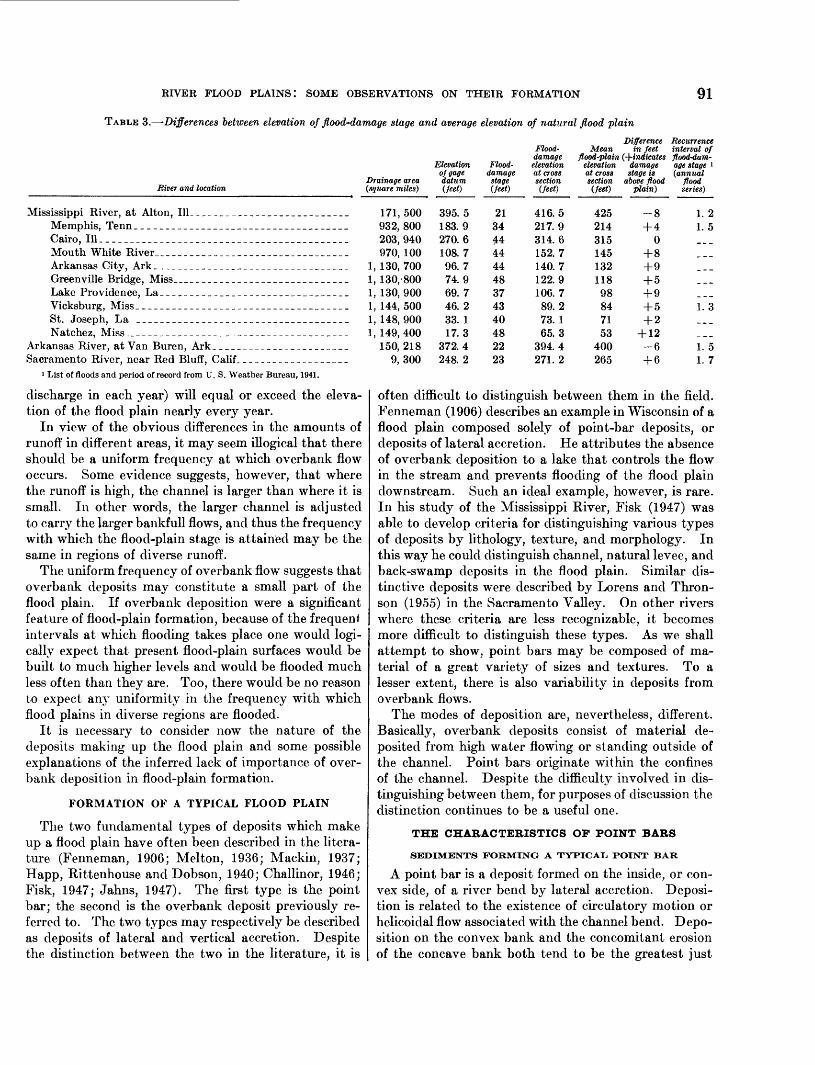
In order to establish the relation between the eleva tion of the flood-damage stage and the mean elevation of the flood plain, an effort has been made to compare the two at a number of cross sections for which data are available. These stations are listed in table 3. The flood-damage stage was obtained from records of the Corps of Engineers (1952) on the Mississippi River and of the Weather Bureau (1941). The mean height of the flood plain at each cross section was determined from profiles drawn from topographic maps having 5- foot contour intervals. Several of these cross sections are shown in figure 58.
The profiles of the Mississippi at Greenville Bridge, Natchez, and at Arkansas City in figure 58, clearly show a difference in elevation between the defined "flood stage" and the mean height of the flood plain. As can be seen on the cross sections, the difference appears to be due to the presence of natural levees adjacent to the river bank which raise the stage at which damage begins. The differences between the two stages are given in table 3. In some cases the damage stage may be equal to or below the elevation of the mean flood plain. In general, however, the damage stage is considerably above the level of the natural flood plain.
The recurrence interval of the flood damage stage, if known, is given in the last column in table 3. These values are in general accord with those in the preceding tables 1 and 2. It is clear, however, from the compari sons of damage stage and average flood-plain elevation that the stage equal to the elevation of the flood plain will occur more frequently because it is lower. If the frequency of flooding, as determined from the analysis of the damage stage, is adjusted to allow for the differ ence between the elevation of damage-stage and average elevation of the flood plain, the resultant frequency is close to the value obtained from the analysis of those locations where the flood-plain elevation was studied by us in the field. In summary, the annual flood (highest
90
Left bank
230-
220-
210-
200-
190-
100-
90-
80-
70-
60-
150-
140-
130-
120-
110-
\
-L £y^n\ \ i i1 r* °*
~~
PHYSIOGRAPHIC AND HYDRAULIC STUDIES OF RIVERS
MISSISSIPPI RIVER AT MEMPHIS, TENN.
Damage stage
Damage stage
1 0 3 MilesI i , i i_______I_______J_ __I
MISSISSIPPI RIVER AT VICKSBURG, MISS.
MISSISSIPPI RIVER AT ARKANSAS CITY, ARK.
VDamage stage
Right bank
MISSISSIPPI RIVER AT GREENVILLE BRIDGE, MISS.
>>
g
130-
110-
100-
^-— ̂
1 0 31 , , , 1 I 1 1
Damage stage
MISSISSIPPI RIVER AT NATCHEZ, MISS.70-1
60-
50-
40-
\\ -Damage stage
\ ~^ /^N^ ' X x.
1 030-J 1 , , , 1 1
1( V
3 Miles1 |
290
280-
270-
260-
250-
240-
SACRAMENTO RIVER AT RED BLUFF, CALIF.
Damage stage
FIGURE 58.—Kelation of flood-damage stage to elevation of flood plain at several river cross sections.
RIVER FLOOD PLAINS! SOME OBSERVATIONS ON THEIR FORMATION 91
TABLE 3.—Differences between elevation of flood-damage stage and average elevation of natural flood plain
River and location
Memphis, Tenn___ .__ ____ _ _ ___ _Cairo, 111. _ _____.________... ______________ _ _____Mouth White River __ _ _____ _____ __ _Arkansas City, Ark_ . _ _Greenville Bridge, Miss _____ __ _ ____
Natchez, Miss _ _ _____ __
Sacramento River, near Red Bluff, Calif. _ _ ______ _ ____1 List of floods and period of record from U. S. Weather Bureau, 1941.
Drainage area (square miles)
171,500932, 800203, 940970, 100
1, 130, 7001, 130/8001, 130, 9001, 144, 5001, 148, 9001, 149, 400
150, 2189, 300
Elevation of gage datum (feet)
395. 5 183.9 270.6 108. 7 96. 7 74.9 69. 7 46. 2 33. 1 17.3
372.4 248. 2
Flood- damage stage (feet)
21 34 44 44 44 48 37 43 40 48 22 23
Difference Recurrence Flood- Mean in feet interval of damage flood-plain (-^-indicates flood-darn- elevation elevation damage age stage 1 at cross at cross stage is (annual section section above flood flood (feet) (feet) plain) series)
416.5 217.9 314.6 152. 7 140.7 122.9 106. 7 89.2 73. 1 65.3
394.4 271. 2
425 214 315 145 132 118 98 84 71 53
400 265
Qo + 4
0 + 8 + 9 + 5 + 9 + 5 + 2
+ 12 -6 + 6
1. 2 1. 5
1.3
1. 5 1.7
discharge in each year) will equal or exceed the eleva tion of the flood plain nearly every year.
In view of the obvious differences in the amounts of runoff in different areas, it may seem illogical that there should be a uniform frequency at which overbank flow occurs. Some evidence suggests, however, that where the runoff is high, the channel is larger than where it is small. In other words, the larger channel is adjusted to carry the larger bankfull flows, and thus the frequency with which the flood-plain stage is attained may be the same in regions of diverse runoff.
The uniform frequency of overbank flow suggests that overbank deposits may constitute a small part of the flood plain. If overbank deposition were a significant feature of flood-plain formation, because of the frequent intervals at which flooding takes place one would logi cally expect that present flood-plain surfaces would be built to much higher levels and would be flooded much less often than they are. Too, there would be no reason to expect any uniformity in the frequency with which flood plains in diverse regions are flooded.
It is necessary to consider now the nature of the deposits making up the flood plain and some possible explanations of the inferred lack of importance of over- bank deposition in flood-plain formation.
FORMATION OF A TYPICAL FLOOD PLAIN
The two fundamental types of deposits which make up a flood plain have often been described in the litera ture (Fenneman, 1906; Melton, 1936; Mackin, 1937; Happ, Kittenhouse and Dobson, 1940; Challinor, 1946; Fisk, 1947; Jahns, 1947). The first type is the point bar; the second is the overbank deposit previously re ferred to. The two types may respectively be described as deposits of lateral and vertical accretion. Despite the distinction between the two in the literature, it is
often difficult to distinguish between them in the field. Fenneman (1906) describes an example in Wisconsin of a flood plain composed solely of point-bar deposits, or deposits of lateral accretion. He attributes the absence of overbank deposition to a lake that controls the flow in the stream and prevents flooding of the flood plain downstream. Such an ideal example, however, is rare. In his study of the Mississippi River, Fisk (1947) was able to develop criteria for distinguishing various types of deposits by lithology, texture, and morphology. In this way he could distinguish channel, natural levee, and back-swamp deposits in the flood plain. Similar dis tinctive deposits were described by Lorens and Thron- son (1955) in the Sacramento Valley. On other rivers where these criteria are less recognizable, it becomes more difficult to distinguish these types. As we shall attempt to show, point bars may be composed of ma terial of a great variety of sizes and textures. To a lesser extent, there is also variability in deposits from overbank flows.
The modes of deposition are, nevertheless, different. Basically, overbank deposits consist of material de posited from high water flowing or standing outside of the channel. Point bars originate within the confines of the channel. Despite the difficulty involved in dis tinguishing between them, for purposes of discussion the distinction continues to be a useful one.
THE CHARACTERISTICS OF POINT BARS
SEDIMENTS FORMING A TYPICAL POINT BAR
A point bar is a deposit formed on the inside, or con vex side, of a river bend by lateral accretion. Deposi tion is related to the existence of circulatory motion or helicoidal flow associated with the channel bend. Depo sition on the convex bank and the concomitant erosion of the concave bank both tend to be the greatest just
92 PHYSIOGRAPHIC AND HYDRAULIC STUDIES OF RIVERS
downstream from the position of maximum curvature (see Mackin, 1937, p. 827; Eardley, 1938; Fisk, 1947, p. 32; Dietz, 1952). Together the processes of erosion and deposition tend to maintain a constant channel width during lateral shifts of the channel.
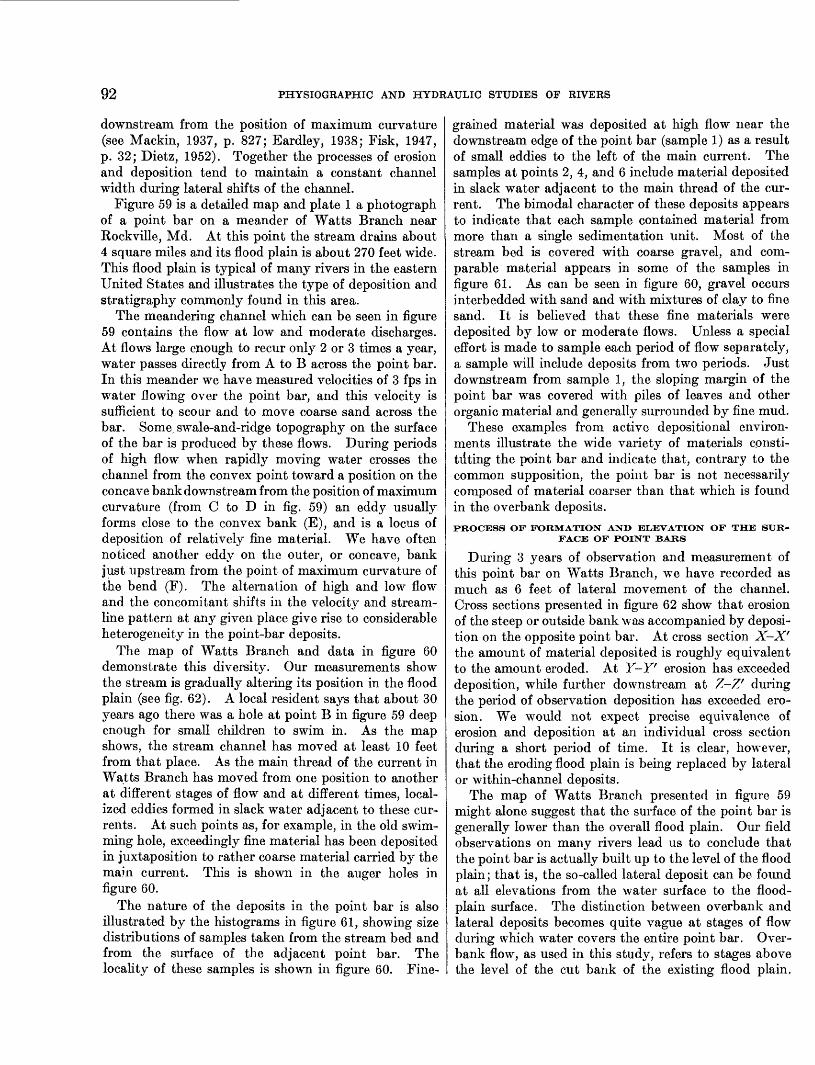
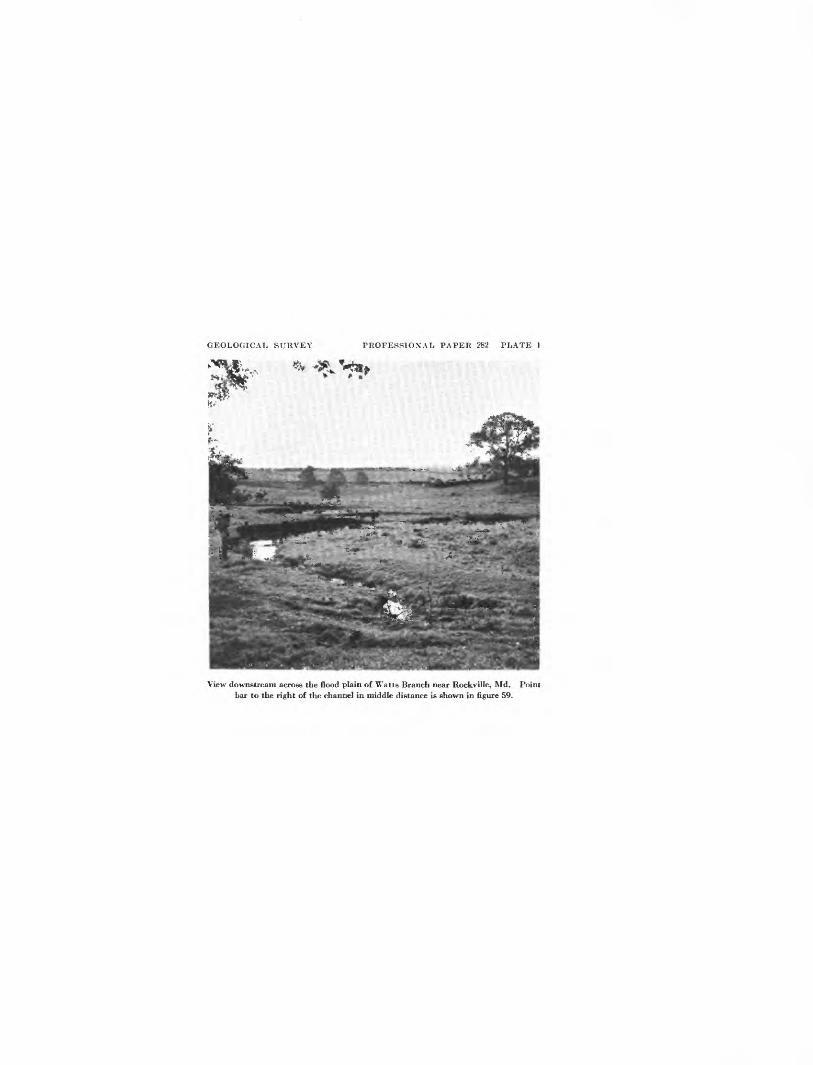
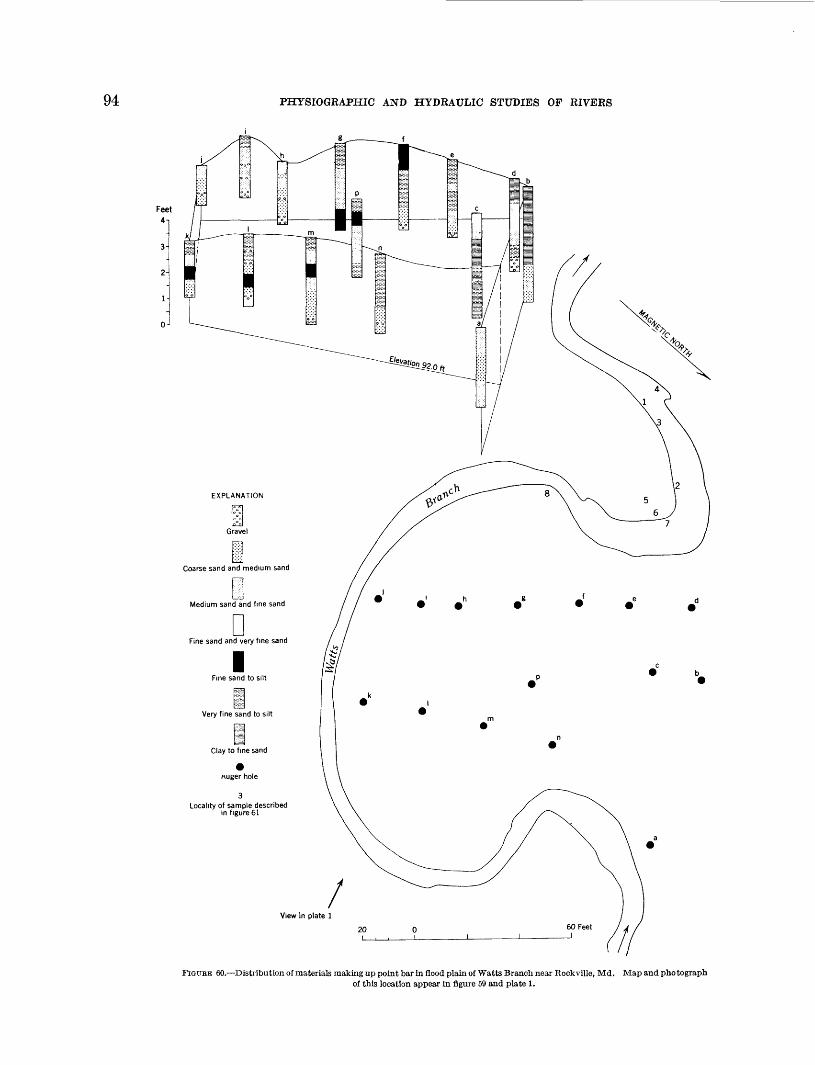
Figure 59 is a detailed map and plate 1 a photograph of a point bar on a meander of Watts Branch near Rockville, Md. At this point the stream drains about 4 square miles and its flood plain is about 270 feet wide. This flood plain is typical of many rivers in the eastern United States and illustrates the type of deposition and stratigraphy commonly found in this area.
The meandering channel which can be seen in figure 59 contains the flow at low and moderate discharges. At flows large enough to recur only 2 or 3 times a year, water passes directly from A to B across the point bar. In this meander we have measured velocities of 3 fps in water flowing over the point bar, and this velocity is sufficient tq scour and to move coarse sand across the bar. Some swale-and-ridge topography on the surface of the bar is produced by these flows. During periods of high flow when rapidly moving water crosses the channel from the convex point toward a position on the concave bank downstream from the position of maximum curvature (from C to D in fig. 59) an eddy usually forms close to the convex bank (E), and is a locus of deposition of relatively fine material. We have often noticed another eddy on the outer, or concave, bank just upstream from the point of maximum curvature of the bend (F). The alternation of high and low flow and the concomitant shifts in the velocity and stream line pattern at any given place give rise to considerable heterogeneity in the point-bar deposits.
The map of Watts Branch and data in figure 60 demonstrate this diversity. Our measurements show the stream is gradually altering its position in the flood plain (see fig. 62). A local resident says that about 30 years ago there was a hole at point B in figure 59 deep enough for small children to swim in. As the map shows, the stream channel has moved at least 10 feet from that place. As the main thread of the current in Watts Branch has moved from one position to another at different stages of flow and at different times, local ized eddies formed in slack water adjacent to these cur rents. At such points as, for example, in the old swim ming hole, exceedingly fine material has been deposited in juxtaposition to rather coarse material carried by the main current. This is shown in the auger holes in figure 60.
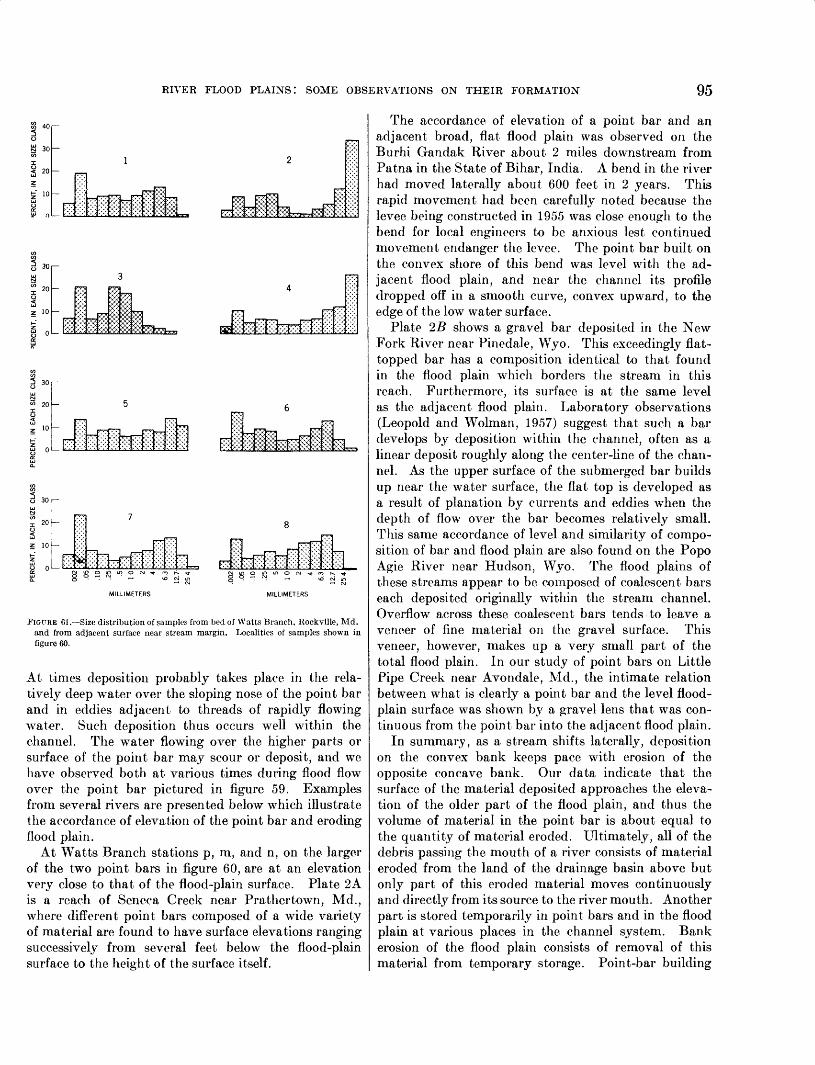
The nature of the deposits in the point bar is also illustrated by the histograms in figure 61, showing size distributions of samples taken from the stream bed and from the surface of the adjacent point bar. The locality of these samples is shown in figure 60. Fine
grained material was deposited at high flow near the downstream edge of the point bar (sample 1) as a result of small eddies to the left of the main current. The samples at points 2, 4, and 6 include material deposited in slack water adjacent to the main thread of the cur rent. The bimodal character of these deposits appears to indicate that each sample contained material from more than a single sedimentation unit. Most of the stream bed is covered with coarse gravel, and com parable material appears in some of the samples in figure 61. As can be seen in figure 60, gravel occurs interbedded with sand and with mixtures of clay to fine sand. It is believed that these fine materials were deposited by low or moderate flows. Unless a special effort is made to sample each period of flow separately, a sample will include deposits from two periods. Just downstream from sample 1, the sloping margin of the point bar was covered with piles of leaves and other organic material and generally surrounded by fine mud.
These examples from active depositional environ ments illustrate the wide variety of materials consti tuting the point bar and indicate that, contrary to the common supposition, the point bar is not necessarily composed of material coarser than that which is found in the overbank deposits.
PROCESS OF FORMATION AND ELEVATION OF THE SUR FACE OF POINT BARS
During 3 years of observation and measurement of this point bar on Watts Branch, we have recorded as much as 6 feet of lateral movement of the channel. Cross sections presented in figure 62 show that erosion of the steep or outside bank was accompanied by deposi tion on the opposite point bar. At cross section X-Xr the amount of material deposited is roughly equivalent to the amount eroded. At Y-Y' erosion has exceeded deposition, while further downstream at Z-Z' during the period of observation deposition has exceeded ero sion. We would not expect precise equivalence of erosion and deposition at an individual cross section during a short period of time. It is clear, however, that the eroding flood plain is being replaced by lateral or within-channel deposits.
The map of Watts Branch presented in figure 59 might alone suggest that the surface of the point bar is generally lower than the overall flood plain. Our field observations on many rivers lead us to conclude that the point bar is actually built up to the level of the flood plain; that is, the so-called lateral deposit can be found at all elevations from the water surface to the flood- plain surface. The distinction between overbank and lateral deposits becomes quite vague at stages of flow during which water covers the entire point bar. Over- bank flow, as used in this study, refers to stages above the level of the cut bank of the existing flood plain.
GEOLOGICAL SURVEY PROFESSIONAL PAPER 282 PLATE 1
View downstream across the flood plain of Watts Branch near Rockville, Md. Point bar to the right of the channel in middle distance is shown in figure 59.

GEOLOGICAL, SURVEY PROFESSIONAL PAPER 282 PLATE 2
A, Point bar deposits and flood-plain surface adjacent to channel of Seneca Creek near Pralhertown, Md. The surfaces of point bars occur at various elevations up to the general level of the flood-plain surface.
B, Flat-topped gravel bar in the New Fork River, 3 miles below Pinedale, Wyo. This bar occupies a position near the center of the channel of a braided river and emerges as an island at low flow. Bar surface ie at same elevation as wooded flood plain seen in background.
RIVER FLOOD PLAINS! SOME OBSERVATIONS ON THEIR FORMATION
View in plate 1EXPLANATION
Edge of low-water surface60 Feet
Contour interval 0.5 foot Arbitrary datum
Steep or vertical bank
FIGURE 59.—Map and cross section of a typical point bar of the flood plain of Watts Branch, 1 mile northwest of Rockville, Md.
94 PHYSIOGRAPHIC AND HYDRAULIC STUDIES OF RIVERS
Feet
3-
2-J
0 J
X II i
«uger hole
Locality of sample described in figure 61
View in plate 1
FIGUBE 60.—Distribution of materials making up point bar in flood plain of Watts Branch near Rockville, Md. Map and photographof this location appear in figure 59 and plate 1.
RIVER FLOOD PLAINS I SOME OBSERVATIONS ON THEIR FORMATION 95
w
1*0
55 20I os
FIGURE Gl.—Size distribution of samples from bed of Watts Branch, Rockville, Md. and from adjacent surface near stream margin. Localities of samples shown in figure 60.
At times deposition probably takes place in the rela tively deep water over the sloping nose of the point bar and in eddies adjacent to threads of rapidly flowing water. Such deposition thus occurs well within the channel. The water flowing over the higher parts or surface of the point bar may scour or deposit, and we have observed both at various times during flood flow over the point bar pictured in figure 59. Examples from several rivers are presented below which illustrate the accordance of elevation of the point bar and eroding flood plain.
At Watts Branch stations p, m, and n, on the larger of the two point bars in figure 60, are at an elevation very close to that of the flood-plain surface. Plate 2A is a reach of Seneca Creek near Prathertown, Md., where different point bars composed of a wide variety of material are found to have surface elevations ranging successively from several feet below the flood-plain surface to the height of the surface itself.
The accordance of elevation of a point bar and an adjacent broad, flat flood plain was observed on the Burhi Gandak River about 2 miles downstream from Patna in the State of Bihar, India. A bend in the river had moved laterally about 600 feet in 2 years. This rapid movement had been carefully noted because the levee being constructed in 1955 was close enough to the bend for local engineers to be anxious lest continued movement endanger the levee. The point bar built on the convex shore of this bend was level with the ad jacent flood plain, and near the channel its profile dropped off in a smooth curve, convex upward, to the edge of the low water surface.
Plate 25 shows a gravel bar deposited in the New Fork River near Pinedale, Wyo. This exceedingly flat- topped bar has a composition identical to that found in the flood plain wThich borders the stream in this reach. Furthermore, its surface is at the same level as the adjacent flood plain. Laboratory observations (Leopold and Wolman, 1957) suggest that such a bar develops by deposition within the channel, often as a linear deposit roughly along the center-line of the chan nel. As the upper surface of the submerged bar builds up near the water surface, the flat top is developed as a result of planation by currents and eddies when the depth of flow over the bar becomes relatively small. This same accordance of level and similarity of compo sition of bar and flood plain are also found on the Popo Agie River near Hudson, Wyo. The flood plains of these streams appear to be composed of coalescent bars each deposited originally within the stream channel. Overflow across these coalescent bars tends to leave a veneer of fine material on the gravel surface. This veneer, however, makes up a very small part of the total flood plain. In our study of point bars on Little Pipe Creek near Avondale, Md., the intimate relation between what is clearly a point bar and the level flood- plain surface was shown by a gravel lens that was con tinuous from the point, bar into the adjacent flood plain.
In summary, as a stream shifts laterally, deposition on the convex bank keeps pace with erosion of the opposite concave bank. Our data indicate that the surface of the material deposited approaches the eleva tion of the older part of the flood plain, and thus the volume of material in the point bar is about equal to the quantity of material eroded. Ultimately, all of the debris passing the mouth of a river consists of material eroded from the land of the drainage basin above but only part of this eroded material moves continuously and directly from its source to the river mouth. Another part is stored temporarily in point bars and in the flood plain at various places in the channel system. Bank erosion of the flood plain consists of removal of this material from temporary storage. Point-bar building

96 PHYSIOGRAPHIC AND HYDRAULIC STUDIES OF RIVERS
x'
EXPLANATION
1953 ' 19*55
FIGUKE 62.—Progressive erosion and deposition in measured cross sections of Watts Branch near Rockville, Md., from 1953 to 1956.
consists of placing in storage a similar quantity of mate rial derived either from storage elsewhere in the system or directly from the drainage basin.
Those examples in the West are in accord with the previous observations in the eastern United States. Both illustrate similar principles of flood-plain forma tion. These observations indicate that as much as 80 to 90 percent of a normal flood plain may be composed of deposits of lateral accretion, and the remaining 10 or 20 percent consists of the overbank deposit.
KATE OF LATERAL MIGRATION
The more sensational changes in river course fre quently attract the attention of geologists as well as newspaper reporters. When, for example, a slice of Arkansas is contributed to the State of Mississippi by a change in the position of the channel of the Missis sippi River we hear about it. Yet, it is extremely dif ficult to get reliable data on the normal rate of lateral migration, in rivers; that is, movement laterally across
their valleys. Table 4 gives a list of measured and esti mated rates of lateral migration from a number of sources. These are at best crude. They demonstrate, more than anything else, the variability of lateral move ment. Although the larger streams tend to have the more rapid rate of migration, the data show no con sistent rates of lateral movement related to the size or position of the channel. In many instances a stream channel may maintain a reasonably stable position and have but little lateral movement over a long period of time. The same site may experience very rapid move ment during a succeeding period. Considerable error might result from extrapolation of these rapid small- scale shifts in position to long-term movements in a constant direction across an entire flood-plain surface. Even the slower rates shown in table 4 when considered over periods of 500 to 1,000 years permit the river to move readily from one side of its valley to the other. The very existence of the broad valley indicates that it has done so in the past.

RIVER FLOOD PLAINS! SOME OBSERVATIONS ON THEIR FORMATION 97
River and location
TABLE 4.—Some data on rates of lateral migration of rivers across valleys
Approxi mate
size of Amount Rate of drainage of move-
area move- ment(square ment Period of (feet per Remarks bearing on measurement and miles) (feet) measurement year) amount of movement Source of information
Tidal creeks in Massachusetts..— — —Normal Brook near Terre Haute, Ind.Watts Branch near Rockville, Md...
Do.—............................
±1 44
7-60 18
10-15
50101
Rock Creek near Washington, D. C——..__ Middle River near Bethlehem Church, near
Staunton, Va. Tributary to Minnesota River near New Ulm,
Minn.North River, Parnassus quadrangle, Va__... Seneca Creek at Dawsonville, Md___-....
Laramie River near Fort Laramie, Wyo....._
Minnesota River near New Ulm, Minn._-_...
Ramganga Rivet near Shahabad, India........
Do........................................ 100,000
Do.
Colorado River near Needles, Calif—. — — ..
Do——————.————————————. Do——— —— ————— — — ———— .Do-—————————————————.Do.—— —— ———— ———————— —— .
Yukon River at Kayukuk River Alaska__.. 320,000
Yukon River at Holy Cross, Alaska——....... 320,000 2,400 1896-1916... 120Kosi River, North Bihar, India............_ .....__ 369,000 ISOyr...... 2,460Missouri River near Peru, Nebr..—————— 350,000 5,000 1883-1903— 250Mississippi River near Rosedale, Miss..——— 1,100,000 2,380 1930-45—— 158
0 60-75 yr.... 0 —————————————————— Qoldthwait, 1937.30 1897-1910_ 2.3 Average movement downvalley___ Dryer and Davis, 1910.
0-10 1915-55__ 0-0.25 ___________________... Topographic map and ground survey.6 1953-56__ 2 Maximum movement; locally in Successive planetable surveys.
downvalley direction.0-20 1915-55__ 0-0.50 _________________-__ Topographic map and ground survey.
25 10-15 yr__ 2.5 __________________ __.. Local observer.
250 1910-38__ 9 Tributary near railroad..______ U. S. Corps Engrs. map and aerialphotographs.
410 1834-84-— 8 ———————.—.————————— Account by local observers. 0-10 50-100yr_ 0-0.20 ____________________- Maximum age of trees on flood plain
is 100 years. Average movement in }•§ mile reach; Hieb, 1954.
old map. Most of 10-mile reach______.... U. S. Corps Engrs. map and aerial
photographs. Movement to west; drainage area Central Board of Irrigation, 1947.
only approximate. Movement to east; same bend as Do.
above. Movement to west; same bend as Do
above. One bend (maximum movement in Means.*
short period). ._—do._—————— —————-- Do.__.do.._.___———...——.— Do. Minimum movement in short period. Do. Median total movement———— ——— Do. From evidence furnished by forest Eardley, 1938.
succession. Local observer-_____.....———— Do.——....................._...—— Qhosh, 1942.Rate varied from 50-500 feet annually. Duncanson, 1909. About average movement; move- Fisk, 1951, fig. 9.
ment variable because of variations in bank material.
Maximum movement; cutoff channel Do. not included.
4,600
10,000
100,000
100,000
100,000
170,600
170,600 170,600 170,600 170,600 320,000
100
0
2,900
1,050
790
20,000
3,000 4,000
100 3,800 5,500
1851-1954—
1910-38——
1795-1806—
1806-1883—
1883-1945...
1858-83——
1883-1903— 1903-1952— 1942-52——— 1903-42——— 170 yr—— ..
1
0
264
14
13
800
150 82 10 98 32
Do—————————————— —— —— —— 1,100,000 9,500 1881-1913— 630
1 Means, T. H., 1953, The Colorado River in Mohave Valley—meanderings of the stream in historic times: U. S. Bur. Reclamation unpub. rept
OVEBBANK DEPOSITION
NATURE AND AMOUNT
There is adequate evidence to show that in some places and at some times significant amounts of material are deposited on flood plains by overbank flow. We shall consider some specific examples, as well as some reasons that might account for the small amount of deposition which appears to occur at many localities.
At Prentiss Landing on the Mississippi River oppo site the mouth of the Arkansas River, the Mississippi River exposed in 1955 a section containing an old court house buried by the river in 1865. The flood plain at this site contains a basal section of crossbedded coarse sand and silt constituting channel or point-bar deposits about 50 feet thick. This is capped by about 4 feet of finer, banded overbank deposits. Some of this overbank material is probably natural levee de posit, and thus the overbank section may be somewhat thicker than the normal. In either event, the propor
tion of the total section made up of overbank deposits is small.
Table 5 presents some data on the average thickness of sediment deposited on flood plains by great floods.
TABLE 5.—Examples of amounts of deposition on flood plains during major floods
Average thickness
Piver basin Date of flood tion (feet) Source of data
Ohio River————. Jan.-Feb. 1937...Connecticut River— Mar. 1936—— ...
Do_.———... Sept. 1938———Kansas River._.— July 1951...„„..
0.008 Mansfield, 1939.. 114 Johns, 1947.. 073 Do.. 098 Carlson and Runnels, 1952.
Because of the magnitude of these record floods, it is impossible to specify exactly their recurrence inter val. From the known record, the Ohio flood of 1937 certainly exceeded a 100-year flood. It must be recog nized, of course, that the figures in table 5 are averages. Under special conditions a foot or several feet of ma terial were deposited. In other places scour rather
98 PHYSIOGRAPHIC AND HYDRAULIC STUDIES OF RIVERS
than deposition occurred. From the data presented by Mansfield (1939, p. 700) the record flood of 1937 on the Ohio River deposited material which would amount to about % inch if spread uniformly over the area flooded. However, certain areas were subject to scour, not deposition, and the amount removed was approximately one-quarter as much as the total of the material deposited.
In his study of the Connecticut Valley, Jahns (1947) describes deposits of the record floods of 1936 and 1938 (table 5) and Pleistocene terrace sequences composed of flood-plain materials. For the most part the over- bank deposits of the modern floods ranged in thickness from 6 feet near the stream, to a thin veneer at the margins. Jahns (p. 85) estimated that "* * * a blanket of sediment was deposited over the entire flooded area to an average depth of 1% inches during March, 1936. About % inch was added during the hurricane flood of September, 1938." The stratigraphy of the terraces described by Jahns consists of channel and overbank deposits, although he uses different terms for these features. He (p. 49) identified overbank de posits in these sections primarily by their stratification and finer texture.
The thicknesses of channel and overbank deposits respectively, in the Connecticut Valley appear in the ratio of about 2 to 1; this is a somewhat larger propor tion of material derived from overbank flows than we have found elsewhere. The difficulty of distinguishing point-bar from overbank deposits may account, in part at least, for the difference.
Happ, Rittenhouse, and Dobson (1940) and many others have noted large amounts of overbank deposi tion from individual floods. Occurrences of thick local deposits, even as coarse as gravel, are not uncommon. For example, Harrod and Suter (1881, p. 136) reported that in the Missouri River flood of 1881 the "immediate banks were raised for long distances from 4 to 6 feet" between Sioux City and Glasgow, Iowa. Although they also noted deposits from 6 to 12 feet in width within the channel in areas which were "sheltered from the fierce current," even this report makes no mention of widespread deposits sufficient to raise the general level of the flood plain.
Obviously, it is difficult to estimate accurately the thickness of sediment deposited over large areas. Al though there are examples of thick local deposits from overbank flows, there are also contrasting examples of local scour (see Davis and Carlson, 1952, p. 232; Breed ing and Montgomery, 1954, p. 6). Observations in Connecticut following the disastrous record-breaking flood of August, 1955 indicate that deposition was extremely irregular and cannot be considered as if it were uniform over the entire area flooded (Wolman and
Eiler, 1957). The local nature of thick deposits, the large variation in thickness of deposits even within a small area, and the occurrence of areas of scour suggest that widespread deposition of sediment by major floods is not so well established a fact as a glance at table 5 might imply. These observations suggest that, com pared with the overall volume of the flood plain, incre ments added by overbank deposition are on the average quite small.
An economic study of effects of a great flood add collateral evidence on the magnitude of deposition by overbank flow. In a study of the flood of 1951 on the Kansas River, it was found that, in general, damage resulting from deposition on agricultural lands during floods was extremely low (Wolman, Howson, and Veatch, 1952). Locally, overbank deposits may be significant, but such occurrences appear to be anomalies rather than usual.
If successive increments of overbank deposition were responsible for building a flood plain, we might expect to find minute laminations representing these deposits. The data in table 5 indicate that these laminations would be so fine that they could hardly be found, much less sampled. Although we have observed short stringers and very thin layers of sand, or even pebbles, in exposures of the flood plain, they have little or no lateral extent. They are certainly lenses rather than extensive overbank layers.
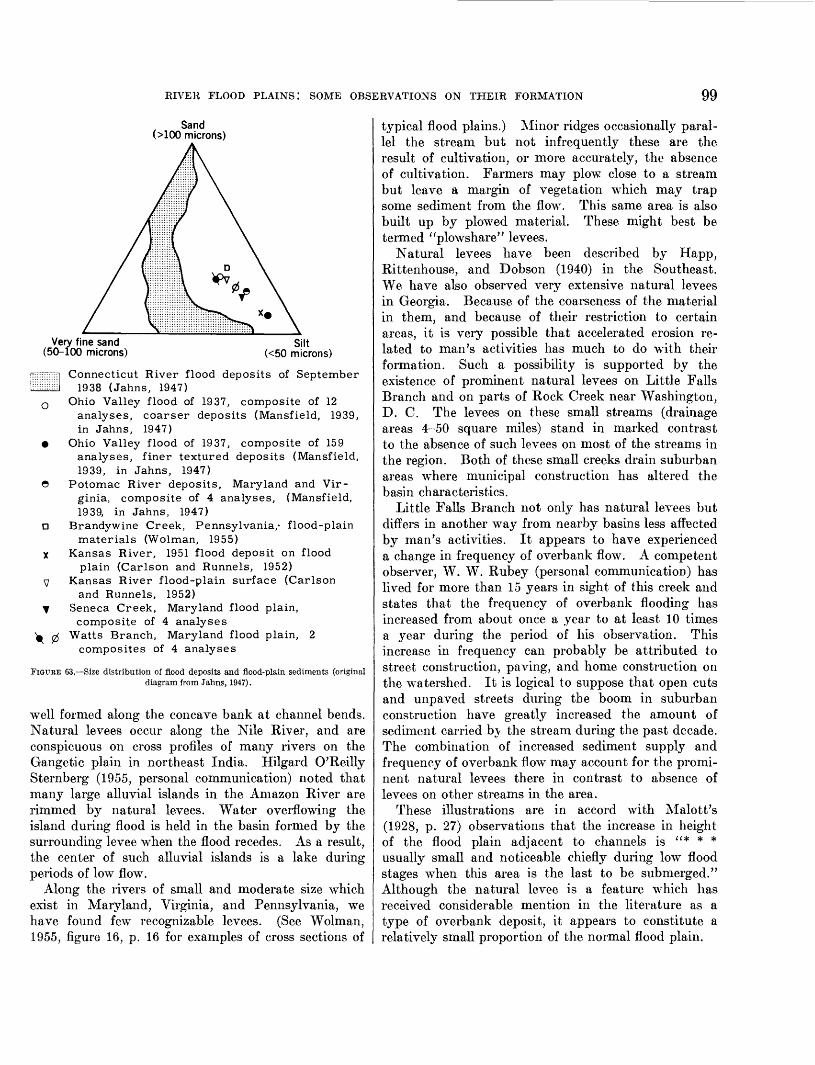
Because material is distributed in the vertical of a stream of flowing water according to size or settling velocity, one would expect the deposits in a flood plain to be successively finer from bottom to top. Examples from Brandywine Creek (Wolman, 1955, p. 18), Watts Branch, Seneca Creek, and elsewhere indicate that such a gradation in size is virtually impossible to find in an individual section. Available data show primarily that flood plains may include materials of quite different sizes. Figure 63 gives examples of flood deposits and flood-plain sediments from several regions and shows that the greatest diversity in size is in the basin for which most data are available, the Connecticut River basin. Here the major differences in size are due prin cipally to differences in source material within the basin.
NATURAL LEVEES
The report of Harrod and Suter on deposition along the "immediate banks" leads to a consideration of the importance of natural levees in the formation of flood plains. Many observers have pointed out that when the flow leaves the stream channel its velocity is checked, and as a result the stream is unable to carry its load and deposits material adjacent to the bank. Natural levees are prominent along the Mississippi and Sacramento Rivers where they are particularly
RIVER FLOOD PLAINS I SOME OBSERVATIONS ON THEIR FORMATION 99
Sand (>100 microns)
Very fine sand (50-100 microns)
Silt (<50 microns)
!;;;;;i:::::| Connecticut River flood deposits of September li^illllJil 1938 (Jahns, 1947)
o Ohio Valley flood of 1937, composite of 12analyses, coarser deposits (Mansfield, 1939,in Jahns, 1947)
• Ohio Valley flood of 1937, composite of 159analyses, finer textured deposits (Mansfield,1939, in Jahns, 1947)
9 Potomac River deposits, Maryland and Vir ginia, composite of 4 analyses, (Mansfield,1939, in Jahns, 1947)
o Brandywine Creek, Pennsylvania,- flood-plainmaterials (Wolman, 1955)
X Kansas River, 1951 flood deposit on floodplain (Carlson and Runnels, 1952)
y Kansas River flood-plain surface (Carlsonand Runnels, 1952)
j Seneca Creek, Maryland flood plain,composite of 4 analyses
^ 0 Watts Branch, Maryland flood plain, 2composites of 4 analyses
FIGUKE 63.—Size distribution of flood deposits and flood-plain sediments (original diagram from Jahns, 1947).
well formed along the concave bank at channel bends. Natural levees occur along the Nile River, and are conspicuous on cross profiles of many rivers on the Gangetic plain in northeast India. Hilgard O'Reilly Sternberg (1955, personal communication) noted that many large alluvial islands in the Amazon River are rimmed by natural levees. Water overflowing the island during flood is held in the basin formed by the surrounding levee when the flood recedes. As a result, the center of such alluvial islands is a lake during periods of low flow.
Along the rivers of small and moderate size which exist in Maryland, Virginia, and Pennsylvania, we have found few recognizable levees. (See Wolman, 1955, figure 16, p. 16 for examples of cross sections of
typical flood plains.) Minor ridges occasionally paral lel the stream but not infrequently these are the result of cultivation, or more accurately, the absence of cultivation. Farmers may plow close to a stream but leave a margin of vegetation which may trap some sediment from the flow. This same area is also built up by plowed material. These might best be termed "plowshare" levees.
Natural levees have been described by Happ, Rittenhouse, and Dobson (1940) in the Southeast. We have also observed very extensive natural levees in Georgia. Because of the coarseness of the material in them, and because of their restriction to certain areas, it is very possible that accelerated erosion re lated to man's activities has much to do with their formation. Such a possibility is supported by the existence of prominent natural levees on Little Falls Branch and on parts of Rock Creek near Washington, D. C. The levees on these small streams (drainage areas 4-50 square miles) stand in marked contrast to the absence of such levees on most of the streams in the region. Both of these small creeks drain suburban areas where municipal construction has altered the basin characteristics.
Little Falls Branch not only has natural levees but differs in another way from nearby basins less affected by man's activities. It appears to have experienced a change in frequency of overbank flow. A competent observer, W. W. Rubey (personal communication) has lived for more than 15 years in sight of this creek and states that the frequency of overbank flooding has increased from about once a year to at least 10 times a year during the period of his observation. This increase in frequency can probably be attributed to street construction, paving, and home construction on the watershed. It is logical to suppose that open cuts and unpaved streets during the boom in suburban construction have greatly increased the amount of sediment carried b\ the stream during the past decade. The combination of increased sediment supply and frequency of overbank flow may account for the promi nent natural levees there in contrast to absence of levees on other streams in the area.
These illustrations are in accord with Malott's (1928, p. 27) observations that the increase in height of the flood plain adjacent to channels is "* * * usually small and noticeable chiefly during low flood stages when this area is the last to be submerged." Although the natural levee is a feature which has received considerable mention in the literature as a type of overbank deposit, it appears to constitute a relatively small proportion of the normal flood plain.
100 PHYSIOGRAPHIC AND HYDRAULIC STUDIES OF RIVERS
HYPOTHETICAL CONSTRUCTION OF A FLOOD PLAIN BY OVERBANK DEPOSITION
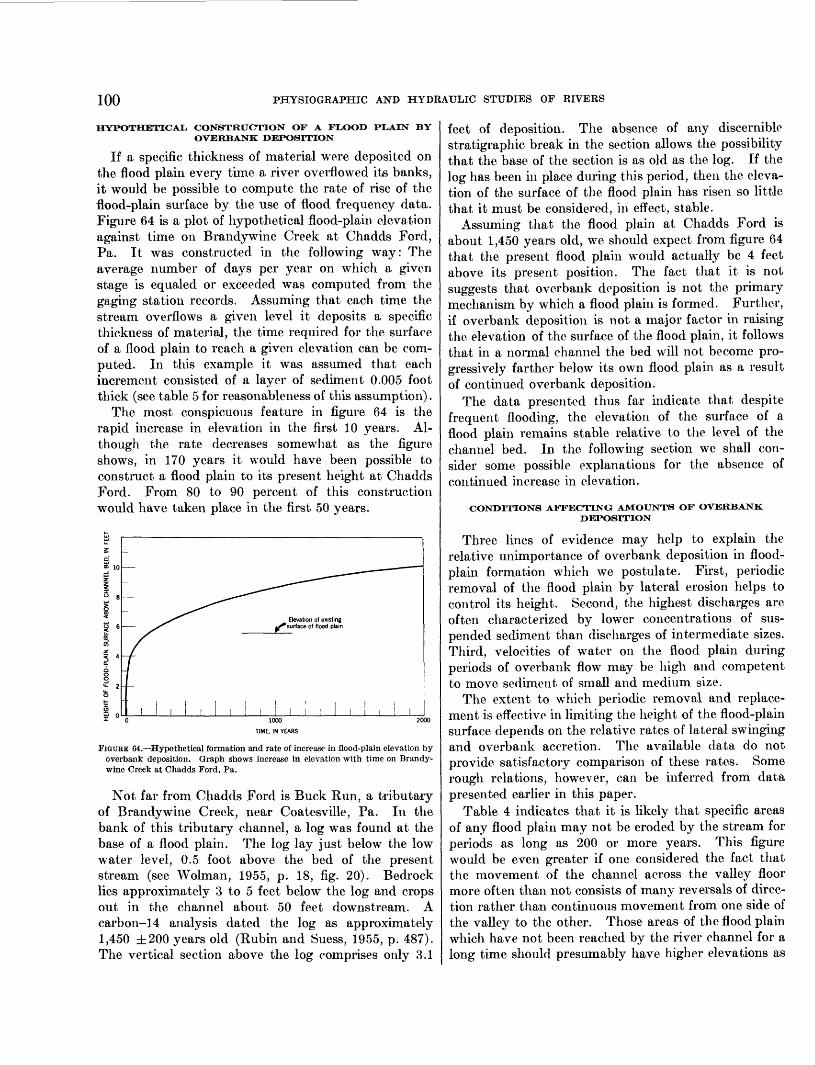
If a specific thickness of material were deposited on the flood plain every time a river overflowed its banks, it would be possible to compute the rate of rise of the flood-plain surface by the use of flood frequency data. Figure 64 is a plot of hypothetical flood-plain elevation against time on Brandywine Creek at Chadds Ford, Pa. It was constructed in the following way: The average number of days per year on which a given stage is equaled or exceeded was computed from the gaging station records. Assuming that each time the stream overflows a given level it deposits a specific thickness of material, the time required for the surface of a flood plain to reach a given elevation can be com puted. In this example it was assumed that each increment consisted of a layer of sediment 0.005 foot thick (see table 5 for reasonableness of this assumption).
The most conspicuous feature in figure 64 is the rapid increase in elevation in the first 10 years. Al though the rate decreases somewhat as the figure shows, in 170 years it would have been possible to construct a flood plain to its present height at Chadds Ford. From 80 to 90 percent of this construction would have taken place in the first 50 years.
1000
TIME, IN YEARS
FIGUEE 64.—Hypothetical formation and rate of increase in flood-plain elevation by overbank deposition. Graph shows increase in elevation with time on Brandy- wine Creek at Chadds Ford, Pa.
Not far from Chadds Ford is Buck Run, a tributary of Brandywine Creek, near Coatesville, Pa. In the bank of this tributary channel, a log was found at the base of a flood plain. The log lay just below the low water level, 0.5 foot above the bed of the present stream (see Wolman, 1955, p. 18, fig. 20). Bedrock lies approximately 3 to 5 feet below the log and crops out in the channel about 50 feet downstream. A carbon-14 analysis dated the log as approximately 1,450 ±200 years old (Rubin and Suess, 1955, p. 487). The vertical section above the log comprises only 3.1
feet of deposition. The absence of any discernible stratigraphic break in the section allows the possibility that the base of the section is as old as the log. If the log has been in place during this period, then the eleva tion of the surface of the flood plain has risen so little that it must be considered, in effect, stable.
Assuming that the flood plain at Chadds Ford is about 1,450 years old, we should expect from figure 64 that the present flood plain would actually be 4 feet above its present position. The fact that it is not suggests that overbank deposition is not the primary mechanism by which a flood plain is formed. Further, if overbank deposition is not a major factor in raising the elevation of the surface of the flood plain, it follows that in a normal channel the bed will not become pro gressively farther below its own flood plain as a result of continued overbank deposition.
The data presented thus far indicate that despite frequent flooding, the elevation of the surface of a flood plain remains stable relative to the level of the channel bed. In the following section we shall con sider some possible explanations for the absence of continued increase in elevation.
CONDITIONS AFFECTING AMOUNTS OF OVERBANK DEPOSITION
Three lines of evidence may help to explain the relative unimportance of overbank deposition in flood- plain formation which we postulate. First, periodic removal of the flood plain by lateral erosion helps to control its height. Second, the highest discharges are often characterized by lower concentrations of sus pended sediment than discharges of intermediate sizes. Third, velocities of water on the flood plain during periods of overbank flow may be high and competent to move sediment of small and medium size.
The extent to which periodic removal and replace ment is effective in limiting the height of the flood-plain surface depends on the relative rates of lateral swinging and overbank accretion. The available data do not provide satisfactory comparison of these rates. Some rough relations, however, can be inferred from data presented earlier in this paper.
Table 4 indicates that it is likely that specific areas of any flood plain may not be eroded by the stream for periods as long as 200 or more years. This figure would be even greater if one considered the fact that the movement of the channel across the valley floor more often than not consists of many reversals of direc tion rather than continuous movement from one side of the valley to the other. Those areas of the flood plain which have not been reached by the river channel for a long time should presumably have higher elevations as
RIVER FLOOD PLAINS I SOME OBSERVATIONS ON THEIR FORMATION 101
a result of continued overbank deposition than the more recently constructed areas of the flood plain. Figure 64 suggests that in 200 to 400 years one could expect 1 to 2 feet of deposition above present flood-plain level as a result of overbank flows. The relief on any flood plain would then be a function of rate of migration or of difference in age. When a flood plain is flat as many are, the low relief suggests that although the elevation of the flood plain is partially controlled by lateral migration, additional factors also control the amount of overbank deposition.
Contrary to some expectations, high discharges are often associated with lower concentrations of suspended load than are more moderate floods. The curves of sediment concentration and discharge presented in figure 65 show, for example, that in several Kansas streams concentration reaches a maximum and declines while discharge is continuing to increase. In addition, during individual floods the peak of the sediment con centration often precedes or follows the peak discharge.
It has been suggested that the decrease in concentra tion may result from deposition on the flood plain as a stream goes out of its banks. In the South Fork Solomon River at Alton, Kans., and in the Solomon River at Beloit, Kans. (fig. 65), the maximum sediment concentration occurs in discharges well below bankfull stage, and thus the decrease of concentration at high flow cannot be attributed to deposition on the flood plain. If we consider the fact that the load is primarily a function of the physiographic and climatic conditions in the contributing drainage area and, although corre lated with discharge, is not a function of the discharge itself, it is by no means necessary that the highest con centrations be associated with the highest flows. The fact that high flows may not be associated with the highest sediment concentration may help to account for a paucity of deposition during these periods.
Another possible mechanism contributing to small amounts of overbank deposition relates to the ability of overbank flows to transport material across the flood plain. There are many streams transporting material having a moderate range of sizes that do not have natural levees, nor do they display a major amount of overbankod position. Only the finer particles are car ried near the water surface or in the upper part of the flow, and these sizes are not likely to drop out along the edge of the channel in accord with the simple natural- levee explanation, nor need they be deposited to any great extent on the surface of the flood plain. Water which leaves the channel and flows over the flood plain tends to move directly downvalley rather than to follow the longer distance along the more sinuous
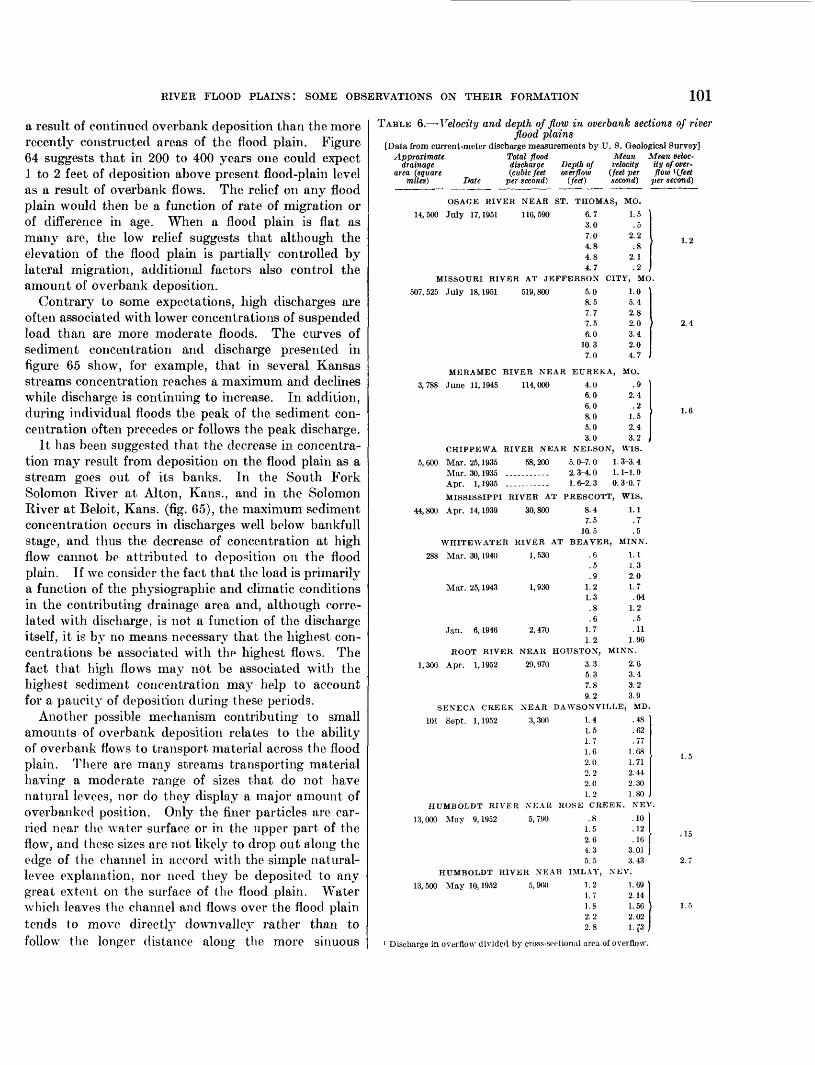
TABLE 6.— Velocity and depth of flow in overbank sections of riverflood plains
[Data from current-meter discharge measurements by U. S. Geological Survey] Approximate Total flood Mean Mean veloe-
drainage discharge Depth of velocity ity of over- area (square (cubic feet overflow (feet per flow l (feet
miles) Date per second) (feet) second) per second)
1.2
OSAGE RIVER NEAR ST.
14,500 July 17,1951 116,590
THOMAS,
6.73.07.04.84.84.7
MO.
1.5.5
2.2.8
2.1.2
MISSOURI RIVER AT JEFFERSON CITY, MO
507,525 July 18,1951 519,800
MERAMEC RIVER NEAR
3,788 June 11,1945 114,000
5.08.57.77.56.0
10.37.0
EUREKA,
4.06.06.08.05.03.0
1.0 '5.42.82.03.42.04.7 ,
MO.
.92.4.2
1.52.43.2
CHIPPEWA RIVER NEAR NELSON, WIS.
5, 600 Mar. 25,1935 58,200 5.0-7. 0 1. 3-3.4Mar. 30,1935 ....... — . 2.3-4.0 1.1-1.9Apr. 1,1935 ..... — ... 1.6-2.3 0.3-0.7
MISSISSIPPI RIVER AT PRESCOTT, WIS.
44,800 Apr. 14,1939 30,800 8.4 1.17.5
10.5 WHITEWATER RIVER AT BEAVER,
288 Mar. 30,1940
Mar. 25,1943
Jan. 6,1946
1,530
1,930
2,470
1.21.3
1.7 1.2
.7
.5MINN.
1.11.32.01.7.04
1.2.5.11
1.96ROOT RIVER NEAR HOUSTON, MINN.
1,300 Apr. 1,1952 29,970 3.3 2.65.3 3.4 7.8 3. 2 9. 2 3.9
SENECA CREEK NEAR DAWSONVILLE, MD.
101 Sept. 1,1952 3,300 .48 .62 .77
1.68 1.71 2.44 2.30 1.80 NEV
.10
.12
.16 3.01 3.43
HUMBOLDT RIVER NEAR IMLAY, NEV.
1.69 2.14 1.56 2.02 1.13
1 Discharge in overflow divided by cross-sectional area of overflow.
1.41.5 1.7 1.6 2.0 2.2 2.0 1.2
HUMBOLDT RIVER NEAR ROSE CREEK.
13,000 May 9,1952 5,790 .81.5 2.6 4.3 5.5
13,500 May 10,1952 5, 900 3.2 1. 7 1.8 2. 2 2. 8
2.4
1.6
1.5
1.5

102 PHYSIOGRAPHIC AND HYDRAULIC STUDIES OP RIVERS
10,000
• • • -. •• ^ • ••• • .»••_ *••*••
1000
10,000
1000
SOUTH FORK SOLOMON RIVER ALTON, KANS.
10,000
1000
50 100 500 1000
DISCHARGE, IN CUBIC FEET PER SECOND
5000
FIGURE 65.—Relation of sediment concentration to discharge in several rivers in Kansas.
RIVER FLOOD PLAINS I SOME OBSERVATIONS ON THEIR FORMATION 103
path of the channel. The downvalley slope may be considerably greater than that of the channel, and this higher gradient tends to keep the velocity high and reduces the probability of deposition.
Some data on the conditions of overbank flow are available in measurements of velocity made by the Geological Survey. Although such measurements on truly natural, unobstructed flood plains are difficult to find, table 6 shows measured depths and velocities from 10 overbank sections. Some of the observed velocities are rather high, even as great as mean velocities ob served in natural channels themselves. These results are plausible if one considers that the slope may be greater and the roughness of the flood-plain section may be less than the roughness of the main channel. These observed velocities exceed the velocities competent to transport silts and sands (Inman, 1949). Because silt and sand are the predominant sizes carried in the over- bank section where such velocities occur, it is perhaps to be expected that much of the material can be carried downvalley and not deposited on the flood plain.
The data from the Humboldt River in table 6 repre sent velocities measured in overflow sections which are former channels of the river (M. T. Wilson, personal communication). As in the main channel, depending upon the depth and proximity to the banks, great vari ation is to be expected in the velocity. In a flood plain constructed by lateral migration accompanied by abandonment of old channels, the remnants of these channels may serve at high flows as avenues of trans port or as places for deposition, depending upon their orientation in relation to the direction of overbank flows. On many streams where flood plains are several hundred to several thousand feet wide, channels are often found at the margin of the flood plain adjacent to the valley wall. These may represent courses of former channels but their position suggests that they are probably drainage channels on the surface of the flood plain created and maintained by overbank flows. Only where oxbows or distinct relics of a channel pat tern exist elsewhere on the flood plain, is it possible to distinguish between remnants of abandoned channels and surficial drainage channels produced by floods.
It has been pointed out to us that conditions on the present flood plain may not be representative of the period of flood-plain formation. In particular, the removal of trees from flood plains in the East and in the Middle West may have markedly reduced the likelihood of deposition (H. C. Bolon, 1954, personal communica tion). In some areas, however, including many in the
flood-frequency study previously mentioned, there has probably been little or no change in the plant cover and there is no apparent difference between these and the other flood plains studied.
In summary, we suggest that one possible reason for the general lack of deposition by overbank flow may be the ability of the overbank section itself to transport sediment.
FLOOD PLAINS IN STABLE, AGGRADING, AND DEGRAD ING STREAMS
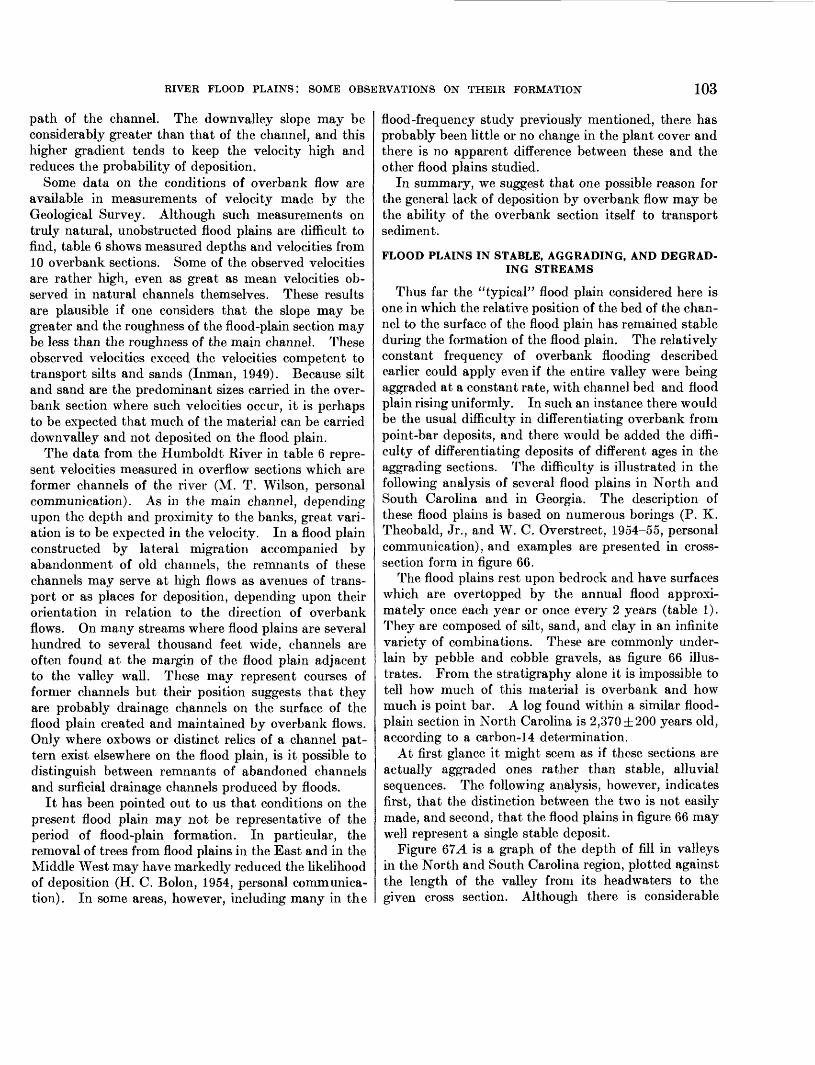
Thus far the "typical" flood plain considered here is one in which the relative position of the bed of the chan nel to the surface of the flood plain has remained stable during the formation of the flood plain. The relatively constant frequency of overbank flooding described earlier could apply even if the entire valley were being aggraded at a constant rate, with channel bed and flood plain rising uniformly. In such an instance there would be the usual difficulty in differentiating overbank from point-bar deposits, and there would be added the diffi culty of differentiating deposits of different ages in the aggrading sections. The difficulty is illustrated in the following analysis of several flood plains in North and South Carolina and in Georgia. The description of these flood plains is based on numerous borings (P. K. Theobald, Jr., and W. C. Overstreet, 1954-55, personal communication), and examples are presented in cross- section form in figure 66.
The flood plains rest upon bedrock and have surfaces which are overtopped by the annual flood approxi mately once each year or once every 2 years (table 1). They are composed of silt, sand, and clay in an infinite variety of combinations. These are commonly under lain by pebble and cobble gravels, as figure 66 illus trates. From the stratigraphy alone it is impossible to tell how much of this material is overbank and how much is point bar. A log found within a similar flood- plain section in North Carolina is 2,370 ±200 years old, according to a carbon-14 determination.
At first glance it might seem as if these sections are actually aggraded ones rather than stable, alluvial sequences. The following analysis, however, indicates first, that the distinction between the two is not easily made, and second, that the flood plains in figure 66 may well represent a single stable deposit.
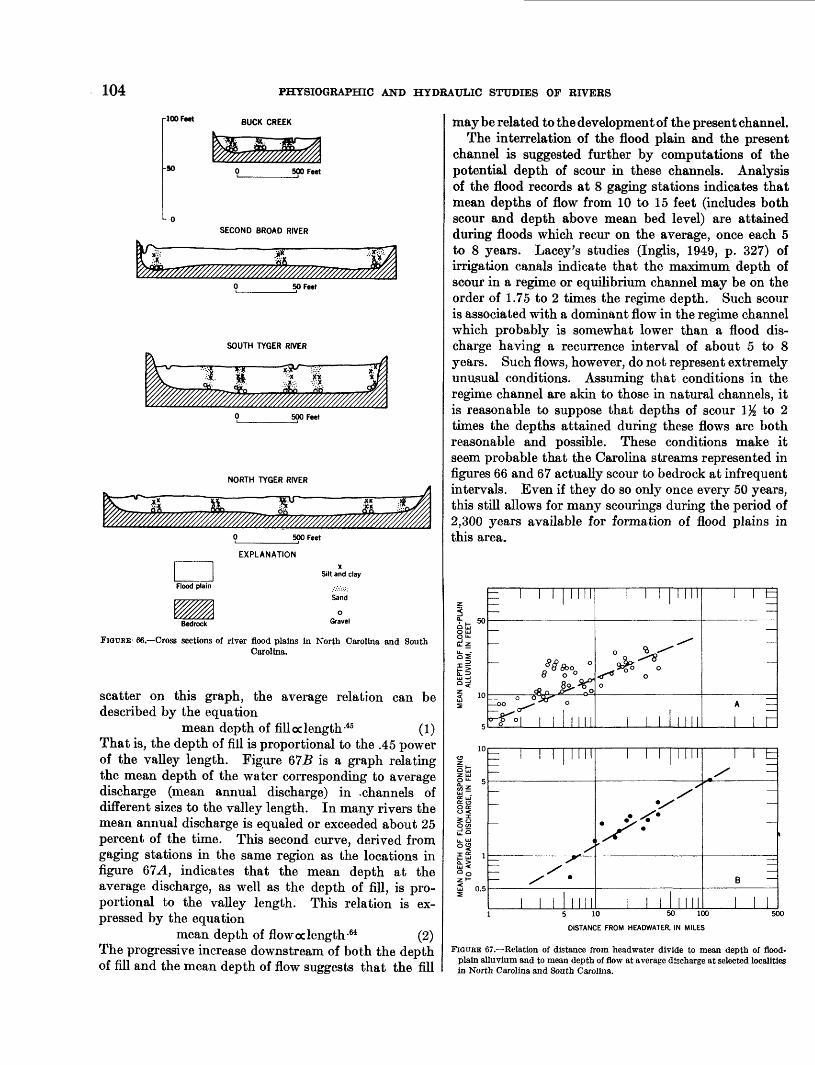
Figure 67A is a graph of the depth of fill in valleys in the North and South Carolina region, plotted against the length of the valley from its headwaters to the given cross section. Although there is considerable
104 PHYSIOGRAPHIC AND HYDRAULIC STUDIES OP RIVERS
100 Feet BUCK CREEK
500 Feet
L 0
13SECOND BROAD RIVER
50 Feet
SOUTH TYGER RIVER
500 Feet
NORTH TYGER RIVER
%^%%%^^%^500 Feet
EXPLANATION
Bedrock
Silt and clay
Sand
o Gravel
FiouRE 1 66.—Cross sections of river flood plains in North Carolina and SouthCarolina.
scatter on this graph, the average relation can be described by the equation
mean depth of filloclength-45 (1) That is, the depth of fill is proportional to the .45 power of the valley length. Figure 67J5 is a graph relating the mean depth of the water corresponding to average discharge (mean annual discharge) in .channels of different sizes to the valley length. In many rivers the mean annual discharge is equaled or exceeded about 25 percent of the time. This second curve, derived from gaging stations in the same region as the locations in figure 67A, indicates that the mean depth at the average discharge, as well as the depth of fill, is pro portional to the valley length. This relation is ex pressed by the equation
mean depth of flow oc length-64 (2) The progressive increase downstream of both the depth of fill and the mean depth of flow suggests that the fill
may be related to the development of the present channel. The interrelation of the flood plain and the present
channel is suggested further by computations of the potential depth of scour in these channels. Analysis of the flood records at 8 gaging stations indicates that mean depths of flow from 10 to 15 feet (includes both scour and depth above mean bed level) are attained during floods which recur on the average, once each 5 to 8 years. Lacey's studies (Inglis, 1949, p. 327) of irrigation canals indicate that the maximum depth of scour in a regime or equilibrium channel may be on the order of 1.75 to 2 times the regime depth. Such scour is associated with a dominant flow in the regime channel which probably is somewhat lower than a flood dis charge having a recurrence interval of about 5 to 8 years. Such flows, however, do not represent extremely unusual conditions. Assuming that conditions in the regime channel are akin to those in natural channels, it is reasonable to suppose that depths of scour IK to 2 times the depths attained during these flows are both reasonable and possible. These conditions make it seem probable that the Carolina streams represented in figures 66 and 67 actually scour to bedrock at infrequent intervals. Even if they do so only once every 50 years, this still allows for many scourings during the period of 2,300 years available for formation of flood plains in this area.
O iu
5£Z Ul
g z<n ?
Tl I
„>*:
MM
-tf*5
t=
B —
1 5 10 50 100 500
DISTANCE FROM HEADWATER, IN MILES
FIGURE 67.—Relation of distance from headwater divide to mean depth of flood- plain alluvium and to mean depth of flow at average discharge at selected localities in North Carolina and South Carolina.
RIVER FLOOD PLAINS: SOME OBSERVATIONS ON THEIR FORMATION 105
Evidence of this scour is also provided by observa tions of the flood of 1903(?), which occurred on the Pacolet River in North Carolina (P. K. Theobald, Jr., 1954-55, personal communication). Observers re ported that "the entire alluvial fill was removed to bed rock" by this flood. Allowing for possible exaggera tions, it is probably safe to say that scour to bedrock occurred even if "the entire alluvial fill" was not re moved. Because the bedrock is occasionally reached by the flowing water, one must suppose that slow degrada tion of the valley is taking place; but the rate of degra dation is extremely slow and, in relation to flood-plain formation, the elevation of the river is in effect stable. Both the frequency of flooding and the calculated potentialities for scour imply that these flood plains are being continuously constructed and reconstructed by the streams which now flow within them in accord with the processes described earlier.
Although the active flood plain associated with the present regimen of the river has been emphasized here, it has already been pointed out that flood plains can exist in aggrading channels. During the process of aggradation the discharge regimen of a stream may be maintained; that is, floods occur and the stream as a rule experiences a certain range in discharge. During the process of aggradation both the bed of the channel and the surface of the flood plain continue to rise. Although the channel may be choked with material at times (Happ, 1950), there is no reason to believe that a flood plain will not continue to be constructed during the rise.
In those cases where continual aggradation produced the valley fill, it is difficult to explain how the relative position of the channel to the flood plain remained fixed during aggradation if overbank deposition is considered the principal mechanism of laying down the valley fill. Rather, concomitant rise of both stream bed and flood-plain surface appears to be best explained by attributing the bulk of the deposited material to the process of point bar formation.
The uniform frequency of flooding of flood plains does not rule out the possibility that both the surface of the flood plain and the bed of the channel are being built simultaneously. Gages on the Nile River, which pro vide the longest periods of record of any river in the world, indicate that both the bed and the flood plain of the Nile are being raised at a rate of about 3 to 4 feet in 1,000 years (Lyons, 1906, p. 313-317). Such rates are unmeasurable in the brief periods of record with which we are dealing. The 1,500 to 2,300-year-old logs be neath the flood plain in Pennsylvania and North Caro lina, respectively, provide the only fairly good evidence of the age of the modern flood plain. These dates are in general in accord with dates derived from terrace
sequences found in the West (Leopold and Miller, 1954).It must be admitted that at this time the stability of
the absolute elevation of the surfaces of most flood plains cannot be proven. The evidence demonstrates, however, that even during aggradation the difference in elevation between the river bed and the surface of its flood plain does in many instances remain constant over long periods of time. That the same may be true during periods of rapid degradation as well as the slow degradation previously mentioned (p. 33) is indicated by observations of the Ukak River in Alaska. In 1912 volcanic ash from the eruption of Katmai filled the river valley. In the 40-year period since the eruption, the river has cut down 10 to 40 feet and is continuing to do so (H. Coulter, 1955, personal communication). At the same time the Ukak has and is continuing to con struct a flood plain. These observations of a variety of rivers indicate that a channel may have a flood plain associated with it when it is stable and flowing on bed rock, gradually eroding a valley, or gradually depositing a fill.
When aggraded valley fill or any flood plain is incised after its formation, the former flood plain becomes a terrace. An alluvial terrace is an abandoned flood plain whose surface no longer bears the normal relation to the stream bed. This study indicates that the normal relation between the surface of the active flood plain and the stream bed on many streams can be de fined by the frequency of flooding. Where such is the case a flood plain becomes a terrace when the channel incises itself to the point where the former active flood plaiii is no longer overtopped by that annual flood, which on the average occurs less than once every 2 3Tears.
CHANNEL PATTERN AND FORMATION OF THE FLOODPLAIN
Point bars have been described in the literature primarily in relation to meandering streams. Many of the examples given above are from such streams. We have shown (Leopold and Wolman, 1957), however, that there are only small differences in the fundamental characteristics of so-called straight channels, meanders, and braids. Very few straight channels are actually straight. An inspection of their thalwegs reveals bars and pools analogous to those found in meanders. The wandering straight channel deposits material in the same way as does a meander and hence, is equally capable of forming a true flood plain even though the process of formation may be somewhat more difficult to recognize. Braided channels also build islands and bars to elevations correlative with the flood-plain surface. The New Fork River example (pi. 2B) shows one such bar. The data also show that such incipient flood plains are overtopped at a frequency similar to that of
106 PHYSIOGRAPHIC AND HYDRAULIC STUDIES OF RIVERS
flood plains elsewhere in the United States. In sum mary, flood plains may be constructed by channels of any type or size.
CONCLUSION
This study supports the views of several authors that the flood plain is composed of channel deposits, or point bars, and some overbank deposits. The relative amounts of each vary, but on the average, the proportion of overbank material appears to be small. This conclusion is supported by the uniform frequency of flooding and by the small amount of deposition ob served in great floods. Lateral migration, relatively high velocities which can occur in overbank flows, and the decrease in sediment concentration at high flows contribute to this result.
In many instances it is difficult to differentiate in stratigraphic section alone the two fundamental types of deposits. Point bars are extremely heterogeneous, and where overbank deposition does take place the small amount of material deposited and its irregular distribution usually make it difficult to identify.
Frequency studies indicate that many flood plains are subject to flooding at approximately yearly intervals. These studies, as well as stratigraphic observations, indicate that the flood plain is also related to the present regimen of the stream flowing within it.
If neither natural nor man-induced changes take place in the structural, climatic, or physiographic con ditions which control the regimen of a natural channel, the channel will not form terraces by gradually building up its own flood plain until flooding no longer occurs. The flood plain can only be transformed into a terrace by some tectonic, climatic, or man-induced change which alters the regimen of the river, causing it to intrench itself below its established bed and associated flood plain.
Lateral migration of a stream across its flood plain takes place with almost no change in channel width. The volume of material deposited tends to be about equal to the volume eroded. Material eroded from the drainage basin is only temporarily stored in the flood plain. Only when the stream erodes laterally into terraces or hillsides higher than the flood plain does the volume eroded exceed the volume deposited. Only in this case can stream-bank protection be expected to reduce the total sediment yield from a drainage basin.
Although we recognize the conclusions presented here require much additional supporting data, we give them forthrightly in the hope that they will stimulate fur ther observation and study.
REFERENCES CITED
Breeding, S. D., and Montgomery, J. H., 1954, Floods of Septem ber 1952 in the Colorado and Guadalupe River basins, central Texas: U. S. Geol. Survey Water-Supply Paper, 1260-A, 46 p.
Carlson, W. A., and Runnels, R. T., 1952, A study of silt de posited by the July 1951 flood, central Kansas River valley: Kans. Acad. Sci. Trans., v. 55, p. 209-213.
Central Board of Irrigation, India, 1947; Annual report (techni cal), part II, p. 552.
Challinor, J., 1946, Two contrasted types of alluvial deposits: Geol. Mag., v. 83, p. 162-164.
Davis, S. N., and Carlson, W. A., 1952, Geological and ground water resources of the Kansas River valley between Law rence and Topeka, Kans.: Kans. Geol. Survey Bull. 96, p. 201-276.
Dietz, R. A., 1952, The evolution of a gravel bar: Mo. Bot. Garden Ann., v. 39, p. 249-254.
Dryer, C. R., and Davis, M. K., 1910, The work done by Normal Brook in 13 years: Ind. Acad. Sci. Proc., p. 147-152.
Duncanson, H. H., 1909, Observations on the shifting of the channel of the Missouri River since 1883: Science, v. 29, p. 869-871.
Eardley, A. J., 1938, Yukon channel shifting: Geol. Soc. Am. Bull., v. 49, 343-358.
Fenneman, N. M., 1906, Floodplains produced without floods: Am. Geog. Soc. Bull. 38, p. 89-91.
Fisk, H. N., 1947, Fine grained alluvial deposits and their effects on Mississippi River activity: U. S. Waterways Exp. Sta., 2 v., 82 p.
———— 1951, Mississippi River Valley geology, relation to river regime: Am. Soc. Civil Eng. Trans., v. 117, p. 667-689.
Ghosh, B. P. C., 1942, A comprehensive treatise on North Bihar flood problems: Govt. Printing, Patna, Bihar (India), 200 p.
Goldthwait, J. W., 1937, Unchanging meanders of tidal creeks, Massachusetts [abs.]: Geol. Soc. America Proc., 1936, p. 73-74.
Goldthwait, R. P., 1941, Changes on the intervales of Connecticut and Merrimac Rivers: N. H. Acad. Sci. Proc., v. 1, p. 17.
Happ, S. C., 1950, Geological classification of alluvial soils Labs.]: Geol. Soc. America Bull., v. 61, p. 1568.
Happ, S. C., Rittenhouse, G., and Dobson, G. C., 1940, Some principles of accelerated stream and valley sedimentation: U. S. Dept. Agricultural Tech. Bull. 695, 133 p.
Harrod, B. M., and Suter, C. R., 1881, Report of the Committee on Outlets and Levees upon the floods of the Missouri River in the spring of 1881: 47th Cong., 1st sess., S. Ex. Doc. no. 10, pt. I, p. 135-139 (app. H.).
Hieb, D. L., 1954, Fort Laramie National Monument, Wyo., U. S. Dept. Interior, Natl. Park Service Hist. Handbook, series 20, 43 p.
Inglis, C. C., 1949, The behavior and control of rivers and canals, Central Water-power Irrigation and Navigation Res. Sta., Poona: Res. Pub. 13, 2 v., 486 p.
Inman, D. L., 1949, Sorting of sediments in the light of fluid mechanics: Jour. Sed. Petrology, v. 19, p. 51-70.
Jahns, R. H., 1947, Geologic features of the Connecticut Valley, Mass., as related to recent floods: U. S. Geol. Survey Water-Supply Paper, 996, 158 p.
RIVER FLOOD PLAINS! SOME OBSERVATIONS ON THEIR FORMATION 107
Langbein, W. B., 1949, Annual floods and the partial-duration flood series: Am. Geophys. Union Trans., v. 30, p. 879-881.
Leopold, L. B., and Miller, J. P., 1954, A postglacial chronology for some alluvial valleys in Wyoming: U. S. Geol. Survey Water-Supply Paper 1261, 90 p.
Leopold, L. B., and Wolman, M. G., 1957, River channel pat terns—braided, meandering, and straight: U. S. Geol. Survey Prof. Paper 282-B.
Lorens, P. J., and Thronson, R. E., 1955, Geology of the fine grained alluvial deposits in Sacramento Valley and their relationship to seepage, p. A1-A26, in, Seepage conditions in Sacramento Valley: Rept. to Calif. Water Project Authority by Dept. Public Works, Div. Water Res.
Lyons, II. G., 1906, The physiography of the River Nile and its basin: Survey Dept., Egypt, Cairo, 411 p.
Mackin, J. H., 1937, Erosional history of the Big Horn Basin, Wyo.: Geol. Soc. Am. Bull., v. 48, p. 813-894.
Malott, C. A., 1928, Valley form and its development: Ind. Univ. Studies no. 81, p. 26-31.
Mansfield. G. R., 1939, Flood deposits of the Ohio River January- February, 1937—a study of sedimentation: U. S. Geol. Survey Water-supply Paper 838, p. 693-733.
Melton, F. A., 1936, An empirical classification of flood plain streams: Geog. Rev., v. 26, p. 593-609.
Rice. C. M., 1949, Dictionary of geological terms: Ann Arbor,Mich., Edwards Bros.
Rubin, Meyer and Suess, II. E., 1955, U. S. Geological Surveyradiocarbon dates II: Science, v. 121, p. 481-488.
U. S. Army Corps of Engineers, 1949a, Examination ElkhornRiver and tributaries, Nebr.: 81st Cong., 1st sess., H. Doe.no. 215, 60 p.
———— 1949b, Examination Yellowstone River and tributaries: 81st Cong., 1st sess., H. Doc. no. 216, 71 p.
———— 1952, Stages and discharges of the Mississippi River and tributaries in the Vicksburg district: Vicksburg Dist., 281 p.
U. S. Weather Bureau, 1941, The river and flood forecasting service of the Weather Bureau, Washington, p. 16.
Wolman, Abel, Howson, L. R., and Veatch, K. T., 1953, Report on flood protection, Kansas River basin, Kans.: Indus. Devel. Comm., Kansas City, Mo., 105 p.
Wolman, M. G., 1955, The natural channel of Brandywine Creek, Pa.: U. S. Geol. Survey Prof. Paper 271, 56 p.
Wolman, M. G., and Eiler, J. P., 1957, Reconnaissance study of erosion and deposition produced by the flood of August 1955 in Connecticut: Am. Geophys. Union Trans. (in press)
INDEX
Page Acknowledgments_..___.-.-._._____..---.__.--______ 87Age of flood-plain deposits___._____________...___ 100,103,104,105 Aggrading streams, flood plains in.__________..._________ 103,105 Annual flood, defined-.—.____________________________ 88
Bank erosion, as source of sediment_______......___..____ 106rate measured...-...-...-.___.____._____________... 96
Bankful stage, recurrence interval..._.._____.._____________ 88-89 Brandywine Creek, Chadds Ford, Pa.__._______._____._____ 100 Braided ̂ channels, flood plains on........_____...._______ 95,105, pi. 2BBuck Run, Coatesville, Pa..-..---...-...__........_..................... 100
Channel patterns, relation of flood plains to..__.........__..._...._ 105-106Conclusions..___-...._._.._____...____.__________ 106Connecticut Valley, flood-plain deposits______._______________ 98,99
Degrading streams, flood plains in.___...--___....._____...... 105Depth of fill, variation with valley length_____-.-_._________. 104Depth of flow, in overbank sections...__.————...__________ 101 (table)
variation with valley length at average discharge.._........__.._. 104
Equilibrium channels, scour and depth of flow...._____________.. 104Elkhorn River, Nebr., flood frequency ________....._...______ 89Erosion and deposition in bends, measured______......_______.. 96
Flood, annual, defined_..._______________________ 88Flood, defined-________________. _______.__.______ 89Flood flow. See Overbank flow.Flood plains, cross sections in North and South Carolina...__________ 104
defined.._________________.______.__._______ 87 formation...________________________.___________ 91-103
Flood-damage stage, defined-___________________________ 89 frequency distribution table.________________________ 89 relation to height of flood plain...__...__________...__._ 89-91 table showing differences from natural flood-plain elevations______.. 91
Flow, relation of sediment load to rate of....__.______.._.___ 101,102 velocity and depth in overbank sections.._________________ 101
Jahns, R. H., quoted..—_____________________________ 98,99
Lateral accretion deposits, amount in flood plains__.____________ 96 defined....................——......——........................__.. 91See Point-bar deposits;
Page Lateral migration of channels, rate. --------------—...... —..--—— 96,97 (table)Little Falls Branch, near Washington, D. C-—.........__...-.-........-- 99Little Pipe Creek, Avondale, Md—----———-„.--—--—.......—.... 95
Mississippi River, at Arkansas City, cioss section showing flood-damage stage. 90at Greenville bridge, Miss., cross section showing flood-damage stage..— 90at Memphis, cross section showing flood-damage stage—————————— 90at Natchez, cross section showing flood-damage stage...——————_— 90at Vicksburg, cross section showing flood-damage stage... — -. —....—— 90
Natural levees, effect on flood and flood-damage stages...--..--....-..__... 89 formation and distribution__---------- ——— ---------- — -.---.....—— 98-99
New Fork River, PInedale, Wyo., flat-topped gravel bar.... ——— —— —— pi. 2B
Overbank and point-bar deposits, distinguishing-—....——. ——. —....—— 91Overbank deposition, construction of flood plains by_—-... — -.--...——— 100
nature---.--..------..--—--..---————.-—--—--——------—— 97-98Overbank deposits, amount......—————————————————————— 96.97-98
conditions affecting amounts.—... —.————.. — -..————————... 100-103 natural levees.__.__..-________.__.___———.—————.—— 98-99 size-distribution diagram.---------—._ — — --—.-- — — ———————.... 99
Overbank flow, frequency...___..-.__._..__-... —— ———...__— 88-91 transport ability— — ———.——..— —————————..— 101, 103
Point-bar and overbank deposits, distinguishing___....____.___— 91Point-bar deposits, deposition and sediments._-...---.—-—.-— ——.-.— 91-92
distribution of materials in....———————.——————————————— 94elevation..--.—_————— —— ———————————— - 92-93,95-96
Popo Agie River, Hudson, Wyo______________-———————————— 95
Sacramento River, at Red Bluff, Calif., cross section showing flood-damagestage.......——.——....——„——— —— „..——....—..._—— 90
Sediment load, time of maximum concentration...._—————.........— 101Seneca Creek, Prathertown, Md., views of elevations.. ————...._...... pi. 2AStable streams, flood plains in.....————————— — ——— — ——— 103-105Stream length, relation to mean depths of fill and flow...........—.......— 104
Velocity of flow in overbank sections.------- —...——————.. 101 (table), 103
Watts Branch, Rockville, Md., point bar in.....__——...——...— 92-94, pi-
Yellowstone River, flood frequency———.--. ——.—————————————— 89
109
•;VU.S. GOVERNMENT PRINTING OFFICE: 1967 O—256-926


