Variable Capital Investment Fund Luxembourg R.C.S. Luxembourg B57138 This report is the English translation of the annual, respectively half-yearly report in French. In case of discrepancy of content and/or meaning between the French and English versions, the French version shall prevail. No subscription can be received on the basis of this financial report. Subscriptions are only valid if made on the basis of the current prospectus respectively the key investor information document ("KIID"), supplemented by the subscription form, the latest annual report and the most recent half-yearly report, if published thereafter. RIVERTREE Fd Half-yearly report (unaudited) as at 30 June 2019
Transcript
Variable Capital Investment Fund Luxembourg R.C.S. Luxembourg B57138 This report is the English translation of the annual, respectively half-yearly report in French. In case of discrepancy of content and/or meaning between the French and English versions, the French version shall prevail. No subscription can be received on the basis of this financial report. Subscriptions are only valid if made on the basis of the current prospectus respectively the key investor information document ("KIID"), supplemented by the subscription form, the latest annual report and the most recent half-yearly report, if published thereafter.
Combined statement of net assets .......................................................................................................................................... 4
Combined statement of operations and other changes in net assets ................................................................................. 5
Rivertree Fd - Bond Euro Short Term ...................................................................................................................................... 6 Statement of net assets .......................................................................................................................................................... 6 Statement of operations and other changes in net assets ...................................................................................................... 7 Statistical information .............................................................................................................................................................. 8 Statement of investments and other net assets ...................................................................................................................... 9 Industrial and geographical classification of investments ..................................................................................................... 11
Rivertree Fd - Flagship ........................................................................................................................................................... 12 Statement of net assets ........................................................................................................................................................ 12 Statement of operations and other changes in net assets .................................................................................................... 13 Statistical information ............................................................................................................................................................ 14 Statement of investments and other net assets .................................................................................................................... 15 Industrial and geographical classification of investments ..................................................................................................... 16
Rivertree Fd - Strategic Defensive ......................................................................................................................................... 17 Statement of net assets ........................................................................................................................................................ 17 Statement of operations and other changes in net assets .................................................................................................... 18 Statistical information ............................................................................................................................................................ 19 Statement of investments and other net assets .................................................................................................................... 20 Industrial and geographical classification of investments ..................................................................................................... 25
Rivertree Fd - Strategic Balanced .......................................................................................................................................... 27 Statement of net assets ........................................................................................................................................................ 27 Statement of operations and other changes in net assets .................................................................................................... 28 Statistical information ............................................................................................................................................................ 29 Statement of investments and other net assets .................................................................................................................... 30 Industrial and geographical classification of investments ..................................................................................................... 35
Rivertree Fd - Strategic Dynamic ........................................................................................................................................... 37 Statement of net assets ........................................................................................................................................................ 37 Statement of operations and other changes in net assets .................................................................................................... 38 Statistical information ............................................................................................................................................................ 39 Statement of investments and other net assets .................................................................................................................... 40 Industrial and geographical classification of investments ..................................................................................................... 44
Rivertree Fd - Strategic Conservative ................................................................................................................................... 45 Statement of net assets ........................................................................................................................................................ 45 Statement of operations and other changes in net assets .................................................................................................... 46 Statistical information ............................................................................................................................................................ 47 Statement of investments and other net assets .................................................................................................................... 48 Industrial and geographical classification of investments ..................................................................................................... 50
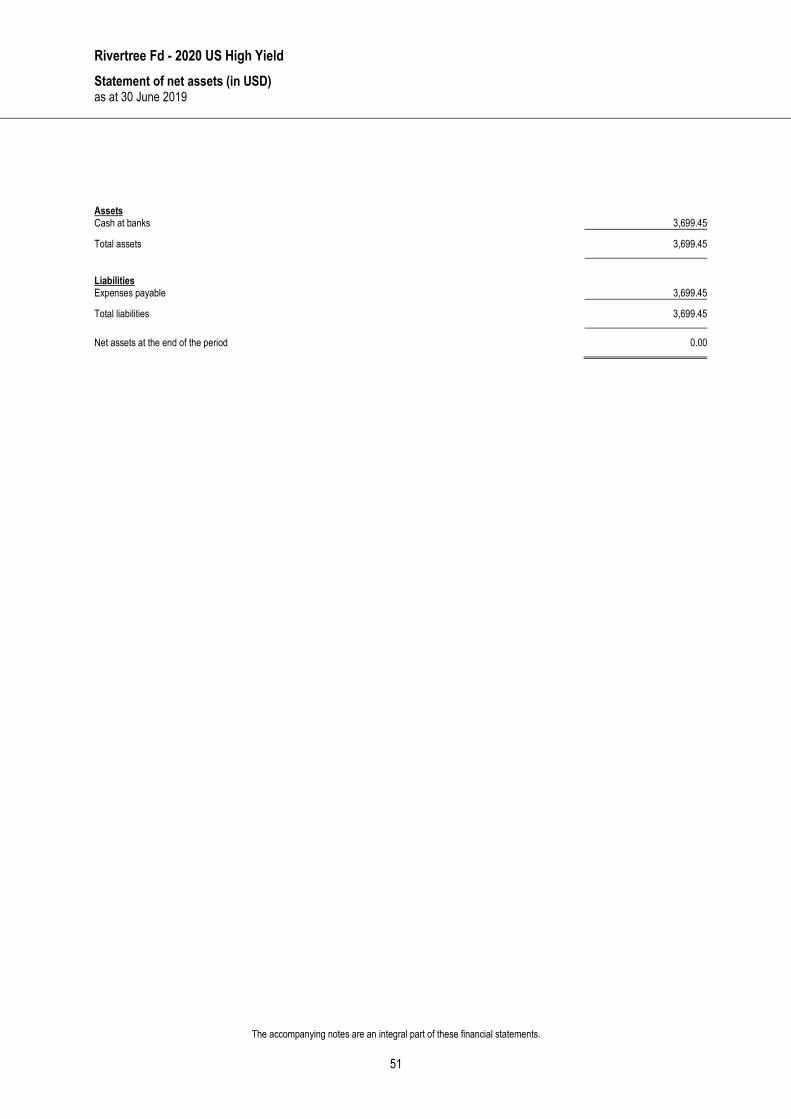
Rivertree Fd - 2020 US High Yield .......................................................................................................................................... 51 Statement of net assets ........................................................................................................................................................ 51 Statement of operations and other changes in net assets .................................................................................................... 52 Statistical information ............................................................................................................................................................ 53
Notes to the financial statements .......................................................................................................................................... 54
Additional information ............................................................................................................................................................ 61
Rivertree Fd
2
Organisation
Registered office 11, rue Aldringen L-1118 LUXEMBOURG Board of Directors Chairman Rafik FISCHER Head of Group Business Development
KBL EUROPEAN PRIVATE BANKERS S.A. 43, boulevard Royal L-2955 LUXEMBOURG
Directors Philippe AUQUIER Head of Group ALM & Treasury KBL EUROPEAN PRIVATE BANKERS S.A. 43, boulevard Royal L-2955 LUXEMBOURG Aurélien BARON Head of Legal, Risk Management & Domiciliation KREDIETRUST LUXEMBOURG S.A. 11, rue Aldringen L-2960 LUXEMBOURG Management Company KREDIETRUST LUXEMBOURG S.A. 11, rue Aldringen L-2960 LUXEMBOURG Board of Directors of the Management Company Chairman Vincent DECALF Director Olivier de JAMBLINNE de MEUX Managing Director Stefan VAN GEYT Conducting Officers of the Aurélien BARON Management Company Kristel COOLS Stefan VAN GEYT Manager of the Sub-Fund PUILAETCO DEWAAY PRIVATE BANKERS S.A. Richelieu Fd - Flagship 46, avenue Herrmann Debroux B-1160 BRUSSELS Co-Manager of the Sub-Funds PUILAETCO DEWAAY PRIVATE BANKERS S.A. Rivertree Fd - Strategic Defensive, 46, avenue Herrmann Debroux Rivertree Fd - Strategic Balanced, B-1160 BRUSSELS Rivertree Fd - Strategic Dynamic and Rivertree Fd - Strategic Conservative
Rivertree Fd
Organisation (continued)
3
Co-Manager of the Sub-Fund KBL RICHELIEU GESTION Richelieu Fd - Bond Euro Short Term 22, boulevard Malesherbes F-75008 PARIS Domiciliary, administrative, KREDIETRUST LUXEMBOURG S.A. registrar and transfer agent 11, rue Aldringen L-2960 LUXEMBOURG Depositary and main paying agent KBL EUROPEAN PRIVATE BANKERS S.A.
43, boulevard Royal L-2955 LUXEMBOURG
Cabinet de révision agréé DELOITTE AUDIT Société à responsabilité limitée 20, boulevard de Kockelscheuer L-1821 LUXEMBOURG Distribution agent in Luxembourg KBL EUROPEAN PRIVATE BANKERS S.A. 43, boulevard Royal L-2955 LUXEMBOURG Representative and local paying agent MERCK FINCK PRIVATBANKIERS AG In Germany 16, Pacellistrasse
D-80333 MUNICH Financial service in Belgium PUILAETCO DEWAAY PRIVATE BANKERS S.A.
46, avenue Herrmann Debroux B-1160 BRUSSELS
Distribution agent in Spain ALLFUNDS BANK S.A.
Calle Estafeta 6, La Moraleja E-28109 MADRID
Central correspondent in France CM-CIC MARKET SOLUTIONS
6, avenue de Provence F-75009 PARIS
Representative in Switzerland CARNEGIE FUND SERVICES S.A.
11, rue du Général Dufour CH-1204 GENEVA
Local paying agent in Switzerland BANQUE CANTONALE DE GENEVE
17, quai de l’Ile CH-1204 GENEVA
Rivertree Fd
Combined statement of net assets (in EUR) as at 30 June 2019
The accompanying notes are an integral part of these financial statements.
4
Assets Securities portfolio at market value 1,132,500,626.63 Cash at banks 126,554,394.45 Formation expenses, net 2,178.53 Receivable on sales of securities 923,556.24 Receivable on issues of shares 612,895.29 Income receivable on portfolio 3,185,148.04 Interest receivable on bank accounts 436.45 Other receivables 24,850.00
Total assets 1,263,804,085.63
Liabilities Bank overdrafts 0.46 Payable on redemptions of shares 1,443,009.36 Unrealised loss on futures contracts 24,850.00 Expenses payable 3,179,501.08
Total liabilities 4,647,360.90
Net assets at the end of the period 1,259,156,724.73
Rivertree Fd
Combined statement of operations and other changes in net assets (in EUR) from 1 January 2019 to 30 June 2019
The accompanying notes are an integral part of these financial statements.
5
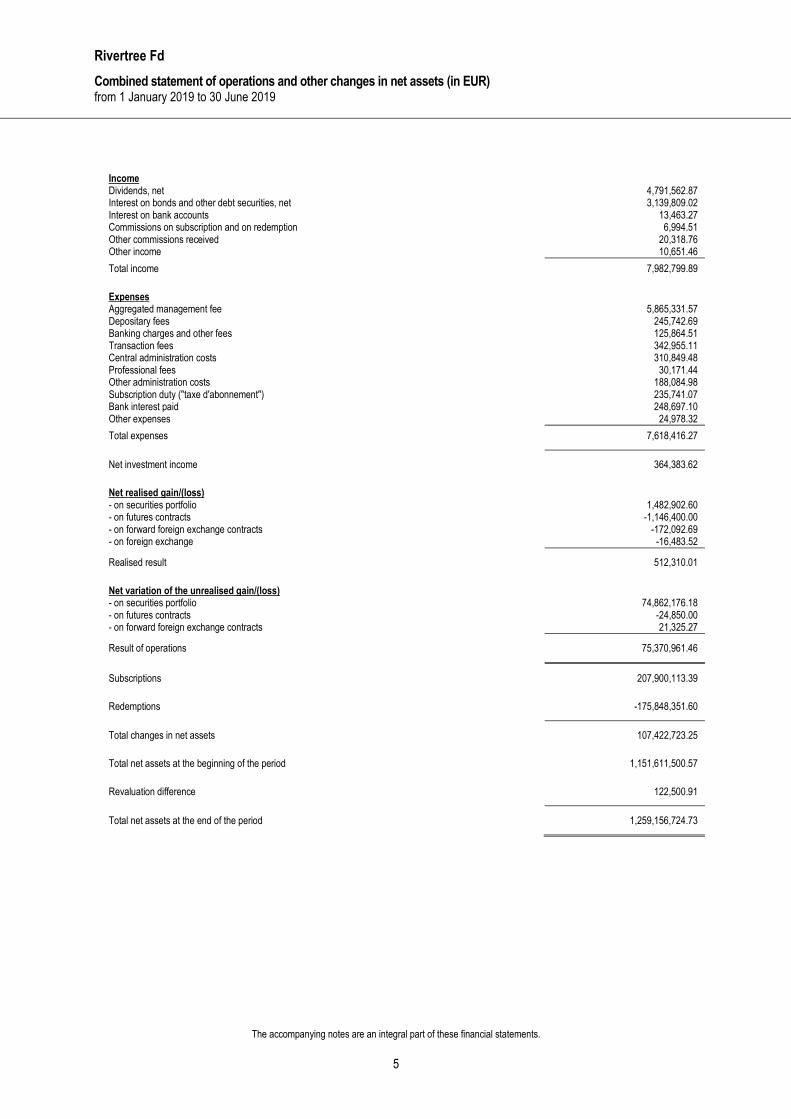
Income Dividends, net 4,791,562.87 Interest on bonds and other debt securities, net 3,139,809.02 Interest on bank accounts 13,463.27 Commissions on subscription and on redemption 6,994.51 Other commissions received 20,318.76 Other income 10,651.46
Total income 7,982,799.89
Expenses Aggregated management fee 5,865,331.57 Depositary fees 245,742.69 Banking charges and other fees 125,864.51 Transaction fees 342,955.11 Central administration costs 310,849.48 Professional fees 30,171.44 Other administration costs 188,084.98 Subscription duty ("taxe d'abonnement") 235,741.07 Bank interest paid 248,697.10 Other expenses 24,978.32
Total expenses 7,618,416.27
Net investment income 364,383.62
Net realised gain/(loss) - on securities portfolio 1,482,902.60 - on futures contracts -1,146,400.00 - on forward foreign exchange contracts -172,092.69 - on foreign exchange -16,483.52
Realised result 512,310.01
Net variation of the unrealised gain/(loss) - on securities portfolio 74,862,176.18 - on futures contracts -24,850.00 - on forward foreign exchange contracts 21,325.27
Result of operations 75,370,961.46
Subscriptions 207,900,113.39
Redemptions -175,848,351.60
Total changes in net assets 107,422,723.25
Total net assets at the beginning of the period 1,151,611,500.57
Revaluation difference 122,500.91
Total net assets at the end of the period 1,259,156,724.73
Rivertree Fd - Bond Euro Short Term
Statement of net assets (in EUR) as at 30 June 2019
The accompanying notes are an integral part of these financial statements.
6
Assets Securities portfolio at market value 160,835,378.00 Cash at banks 349,508.16 Receivable on issues of shares 15,209.10 Income receivable on portfolio 1,387,625.86
Total assets 162,587,721.12
Liabilities Payable on redemptions of shares 77,304.86 Expenses payable 127,981.15
Total liabilities 205,286.01
Net assets at the end of the period 162,382,435.11
Breakdown of net assets per share class
Share class Number of
shares
Currency of
share class
NAV per share in currency of
share class
Net assets per share class
(in EUR)
I Cap 46,097.281 EUR 510.89 23,550,485.87 F Cap 55,824.050 EUR 511.41 28,549,215.33 F Dis 195,766.175 EUR 563.34 110,282,733.91
162,382,435.11
Rivertree Fd - Bond Euro Short Term
Statement of operations and other changes in net assets (in EUR) from 1 January 2019 to 30 June 2019
The accompanying notes are an integral part of these financial statements.
7
Income Interest on bonds and other debt securities, net 1,400,046.43
Total income 1,400,046.43
Expenses Aggregated management fee 212,713.25 Depositary fees 39,444.10 Banking charges and other fees 13,804.01 Transaction fees 872.98 Central administration costs 39,695.80 Professional fees 3,841.49 Other administration costs 30,632.94 Subscription duty ("taxe d'abonnement") 36,509.02 Bank interest paid 1,123.90 Other expenses 6,951.53
Total expenses 385,589.02
Net investment income 1,014,457.41
Net realised gain/(loss) - on securities portfolio -243,966.33
Realised result 770,491.08
Net variation of the unrealised gain/(loss) - on securities portfolio 2,163,684.08
Result of operations 2,934,175.16
Subscriptions 11,977,719.82
Redemptions -21,583,475.24
Total changes in net assets -6,671,580.26
Total net assets at the beginning of the period 169,054,015.37
Total net assets at the end of the period 162,382,435.11
Rivertree Fd - Bond Euro Short Term
Statistical information (in EUR) as at 30 June 2019
The accompanying notes are an integral part of these financial statements.
8
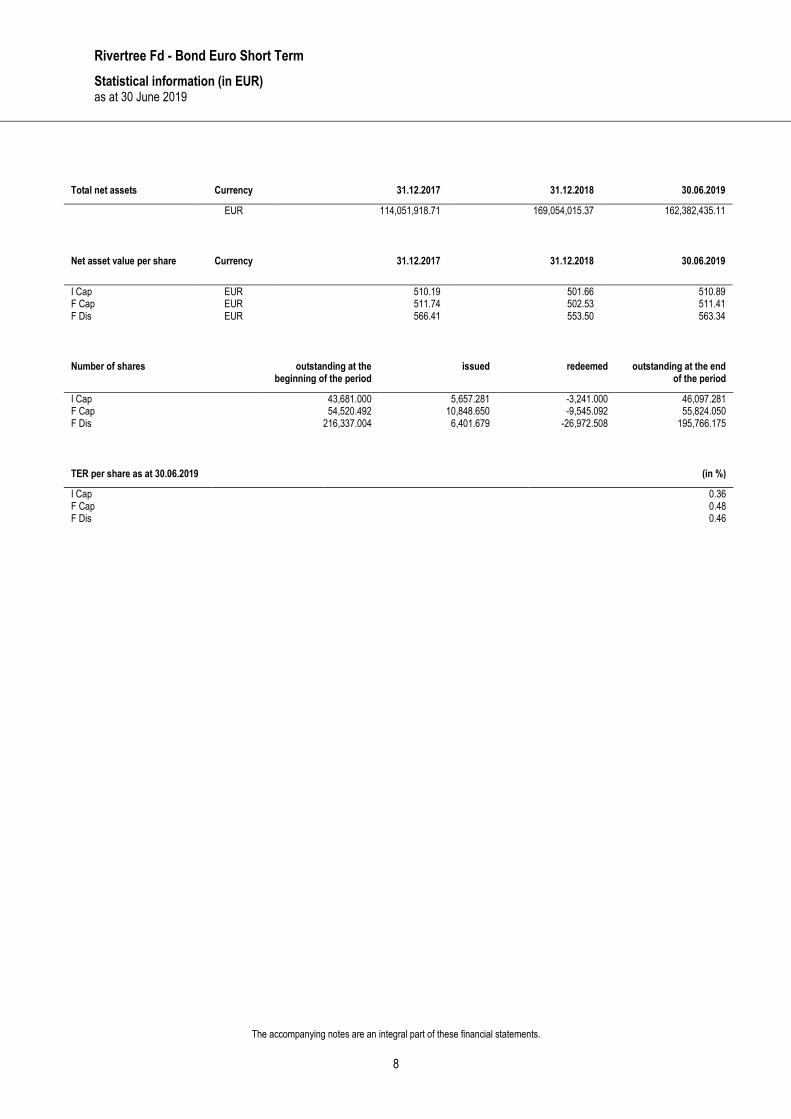
Total net assets Currency 31.12.2017 31.12.2018 30.06.2019
EUR 114,051,918.71 169,054,015.37 162,382,435.11
Net asset value per share Currency 31.12.2017 31.12.2018 30.06.2019
I Cap EUR 510.19 501.66 510.89 F Cap EUR 511.74 502.53 511.41 F Dis EUR 566.41 553.50 563.34
Number of shares outstanding at the
beginning of the period issued redeemed outstanding at the end
of the period
I Cap 43,681.000 5,657.281 -3,241.000 46,097.281 F Cap 54,520.492 10,848.650 -9,545.092 55,824.050 F Dis 216,337.004 6,401.679 -26,972.508 195,766.175
TER per share as at 30.06.2019 (in %)
I Cap 0.36 F Cap 0.48 F Dis 0.46
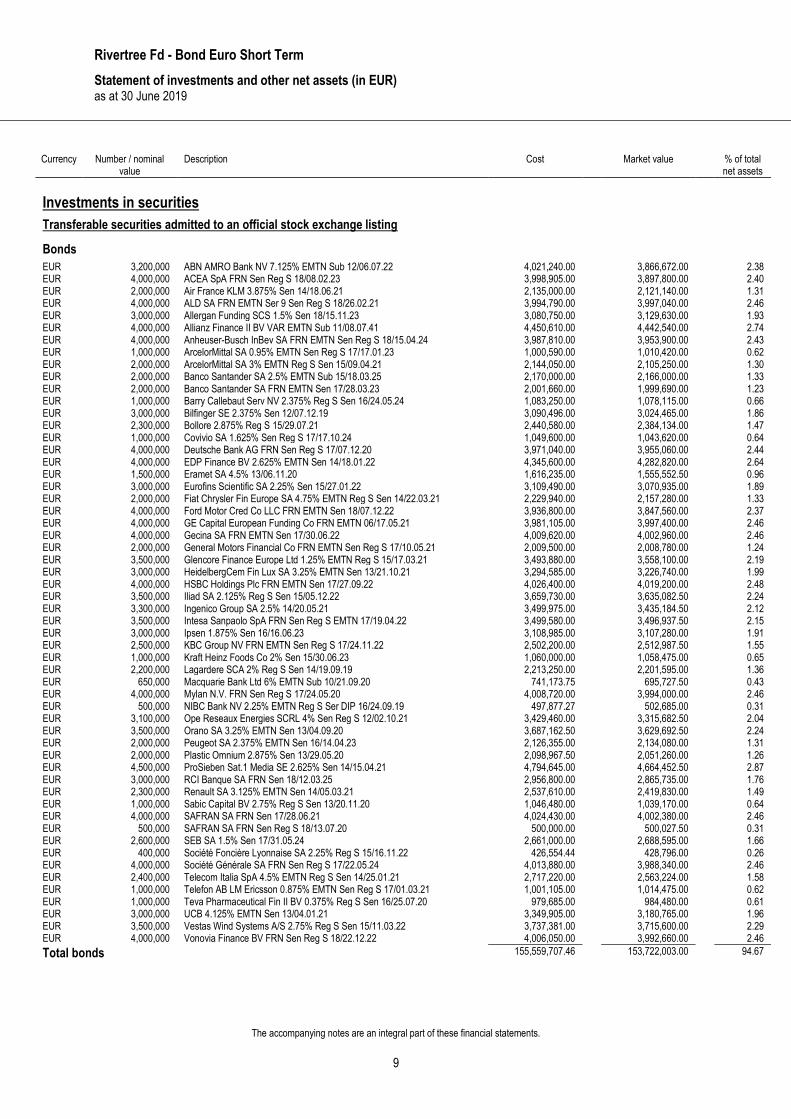
Rivertree Fd - Bond Euro Short Term
Statement of investments and other net assets (in EUR) as at 30 June 2019
The accompanying notes are an integral part of these financial statements.
9
Currency Number / nominal value
Description Cost Market value % of total net assets
Investments in securities
Transferable securities admitted to an official stock exchange listing
Bonds
EUR 3,200,000 ABN AMRO Bank NV 7.125% EMTN Sub 12/06.07.22 4,021,240.00 3,866,672.00 2.38 EUR 4,000,000 ACEA SpA FRN Sen Reg S 18/08.02.23 3,998,905.00 3,897,800.00 2.40 EUR 2,000,000 Air France KLM 3.875% Sen 14/18.06.21 2,135,000.00 2,121,140.00 1.31 EUR 4,000,000 ALD SA FRN EMTN Ser 9 Sen Reg S 18/26.02.21 3,994,790.00 3,997,040.00 2.46 EUR 3,000,000 Allergan Funding SCS 1.5% Sen 18/15.11.23 3,080,750.00 3,129,630.00 1.93 EUR 4,000,000 Allianz Finance II BV VAR EMTN Sub 11/08.07.41 4,450,610.00 4,442,540.00 2.74 EUR 4,000,000 Anheuser-Busch InBev SA FRN EMTN Sen Reg S 18/15.04.24 3,987,810.00 3,953,900.00 2.43 EUR 1,000,000 ArcelorMittal SA 0.95% EMTN Sen Reg S 17/17.01.23 1,000,590.00 1,010,420.00 0.62 EUR 2,000,000 ArcelorMittal SA 3% EMTN Reg S Sen 15/09.04.21 2,144,050.00 2,105,250.00 1.30 EUR 2,000,000 Banco Santander SA 2.5% EMTN Sub 15/18.03.25 2,170,000.00 2,166,000.00 1.33 EUR 2,000,000 Banco Santander SA FRN EMTN Sen 17/28.03.23 2,001,660.00 1,999,690.00 1.23 EUR 1,000,000 Barry Callebaut Serv NV 2.375% Reg S Sen 16/24.05.24 1,083,250.00 1,078,115.00 0.66 EUR 3,000,000 Bilfinger SE 2.375% Sen 12/07.12.19 3,090,496.00 3,024,465.00 1.86 EUR 2,300,000 Bollore 2.875% Reg S 15/29.07.21 2,440,580.00 2,384,134.00 1.47 EUR 1,000,000 Covivio SA 1.625% Sen Reg S 17/17.10.24 1,049,600.00 1,043,620.00 0.64 EUR 4,000,000 Deutsche Bank AG FRN Sen Reg S 17/07.12.20 3,971,040.00 3,955,060.00 2.44 EUR 4,000,000 EDP Finance BV 2.625% EMTN Sen 14/18.01.22 4,345,600.00 4,282,820.00 2.64 EUR 1,500,000 Eramet SA 4.5% 13/06.11.20 1,616,235.00 1,555,552.50 0.96 EUR 3,000,000 Eurofins Scientific SA 2.25% Sen 15/27.01.22 3,109,490.00 3,070,935.00 1.89 EUR 2,000,000 Fiat Chrysler Fin Europe SA 4.75% EMTN Reg S Sen 14/22.03.21 2,229,940.00 2,157,280.00 1.33 EUR 4,000,000 Ford Motor Cred Co LLC FRN EMTN Sen 18/07.12.22 3,936,800.00 3,847,560.00 2.37 EUR 4,000,000 GE Capital European Funding Co FRN EMTN 06/17.05.21 3,981,105.00 3,997,400.00 2.46 EUR 4,000,000 Gecina SA FRN EMTN Sen 17/30.06.22 4,009,620.00 4,002,960.00 2.46 EUR 2,000,000 General Motors Financial Co FRN EMTN Sen Reg S 17/10.05.21 2,009,500.00 2,008,780.00 1.24 EUR 3,500,000 Glencore Finance Europe Ltd 1.25% EMTN Reg S 15/17.03.21 3,493,880.00 3,558,100.00 2.19 EUR 3,000,000 HeidelbergCem Fin Lux SA 3.25% EMTN Sen 13/21.10.21 3,294,585.00 3,226,740.00 1.99 EUR 4,000,000 HSBC Holdings Plc FRN EMTN Sen 17/27.09.22 4,026,400.00 4,019,200.00 2.48 EUR 3,500,000 Iliad SA 2.125% Reg S Sen 15/05.12.22 3,659,730.00 3,635,082.50 2.24 EUR 3,300,000 Ingenico Group SA 2.5% 14/20.05.21 3,499,975.00 3,435,184.50 2.12 EUR 3,500,000 Intesa Sanpaolo SpA FRN Sen Reg S EMTN 17/19.04.22 3,499,580.00 3,496,937.50 2.15 EUR 3,000,000 Ipsen 1.875% Sen 16/16.06.23 3,108,985.00 3,107,280.00 1.91 EUR 2,500,000 KBC Group NV FRN EMTN Sen Reg S 17/24.11.22 2,502,200.00 2,512,987.50 1.55 EUR 1,000,000 Kraft Heinz Foods Co 2% Sen 15/30.06.23 1,060,000.00 1,058,475.00 0.65 EUR 2,200,000 Lagardere SCA 2% Reg S Sen 14/19.09.19 2,213,250.00 2,201,595.00 1.36 EUR 650,000 Macquarie Bank Ltd 6% EMTN Sub 10/21.09.20 741,173.75 695,727.50 0.43 EUR 4,000,000 Mylan N.V. FRN Sen Reg S 17/24.05.20 4,008,720.00 3,994,000.00 2.46 EUR 500,000 NIBC Bank NV 2.25% EMTN Reg S Ser DIP 16/24.09.19 497,877.27 502,685.00 0.31 EUR 3,100,000 Ope Reseaux Energies SCRL 4% Sen Reg S 12/02.10.21 3,429,460.00 3,315,682.50 2.04 EUR 3,500,000 Orano SA 3.25% EMTN Sen 13/04.09.20 3,687,162.50 3,629,692.50 2.24 EUR 2,000,000 Peugeot SA 2.375% EMTN Sen 16/14.04.23 2,126,355.00 2,134,080.00 1.31 EUR 2,000,000 Plastic Omnium 2.875% Sen 13/29.05.20 2,098,967.50 2,051,260.00 1.26 EUR 4,500,000 ProSieben Sat.1 Media SE 2.625% Sen 14/15.04.21 4,794,645.00 4,664,452.50 2.87 EUR 3,000,000 RCI Banque SA FRN Sen 18/12.03.25 2,956,800.00 2,865,735.00 1.76 EUR 2,300,000 Renault SA 3.125% EMTN Sen 14/05.03.21 2,537,610.00 2,419,830.00 1.49 EUR 1,000,000 Sabic Capital BV 2.75% Reg S Sen 13/20.11.20 1,046,480.00 1,039,170.00 0.64 EUR 4,000,000 SAFRAN SA FRN Sen 17/28.06.21 4,024,430.00 4,002,380.00 2.46 EUR 500,000 SAFRAN SA FRN Sen Reg S 18/13.07.20 500,000.00 500,027.50 0.31 EUR 2,600,000 SEB SA 1.5% Sen 17/31.05.24 2,661,000.00 2,688,595.00 1.66 EUR 400,000 Société Foncière Lyonnaise SA 2.25% Reg S 15/16.11.22 426,554.44 428,796.00 0.26 EUR 4,000,000 Société Générale SA FRN Sen Reg S 17/22.05.24 4,013,880.00 3,988,340.00 2.46 EUR 2,400,000 Telecom Italia SpA 4.5% EMTN Reg S Sen 14/25.01.21 2,717,220.00 2,563,224.00 1.58 EUR 1,000,000 Telefon AB LM Ericsson 0.875% EMTN Sen Reg S 17/01.03.21 1,001,105.00 1,014,475.00 0.62 EUR 1,000,000 Teva Pharmaceutical Fin II BV 0.375% Reg S Sen 16/25.07.20 979,685.00 984,480.00 0.61 EUR 3,000,000 UCB 4.125% EMTN Sen 13/04.01.21 3,349,905.00 3,180,765.00 1.96 EUR 3,500,000 Vestas Wind Systems A/S 2.75% Reg S Sen 15/11.03.22 3,737,381.00 3,715,600.00 2.29 EUR 4,000,000 Vonovia Finance BV FRN Sen Reg S 18/22.12.22 4,006,050.00 3,992,660.00 2.46
Total bonds 155,559,707.46 153,722,003.00 94.67
Rivertree Fd - Bond Euro Short Term
Statement of investments and other net assets (in EUR) (continued) as at 30 June 2019
The accompanying notes are an integral part of these financial statements.
10
Currency Number / nominal value
Description Cost Market value % of total net assets
Transferable securities dealt in on another regulated market
Bonds
EUR 4,000,000 AT&T Inc FRN 18/05.09.23 4,047,239.79 4,052,340.00 2.50 EUR 3,000,000 Havas SA 1.875% Reg S Sen 15/08.12.20 3,036,895.00 3,061,035.00 1.88
Total bonds 7,084,134.79 7,113,375.00 4.38
Total investments in securities 162,643,842.25 160,835,378.00 99.05
Cash at banks 349,508.16 0.22
Other net assets/(liabilities) 1,197,548.95 0.73
Total 162,382,435.11 100.00
Rivertree Fd - Bond Euro Short Term
Industrial and geographical classification of investments as at 30 June 2019
11
Industrial classification
(in percentage of net assets)
Financials 39.90 %
Cyclical consumer goods 14.63 %
Utilities 9.32 %
Healthcare 8.83 %
Telecommunications services 6.32 %
Industrials 5.94 %
Non-cyclical consumer goods 3.74 %
Raw materials 2.88 %
Technologies 2.74 %
Real estate 2.46 %
Energy 2.29 %
Total 99.05 %
Geographical classification
(by domicile of the issuer) (in percentage of net assets)
France 34.02 %
The Netherlands 14.24 %
Luxembourg 9.06 %
Belgium 8.64 %
Germany 7.17 %
United States of America 6.76 %
Italy 6.13 %
Spain 2.56 %
United Kingdom 2.48 %
Ireland 2.46 %
Denmark 2.29 %
Jersey 2.19 %
Sweden 0.62 %
Australia 0.43 %
Total 99.05 %
Rivertree Fd - Flagship
Statement of net assets (in EUR) as at 30 June 2019
The accompanying notes are an integral part of these financial statements.
12
Assets Securities portfolio at market value 71,476,119.31 Cash at banks 4,258,983.27 Receivable on sales of securities 923,556.24 Income receivable on portfolio 776.03
Total assets 76,659,434.85
Liabilities Payable on redemptions of shares 848,368.06 Expenses payable 273,805.49
Total liabilities 1,122,173.55
Net assets at the end of the period 75,537,261.30
Breakdown of net assets per share class
Share class Number of
shares
Currency of
share class
NAV per share in currency of
share class
Net assets per share class
(in EUR)
R Cap 45,452.919 EUR 564.41 25,654,271.69 R Dis 48,123.332 EUR 481.96 23,193,475.98 F Cap 21,635.166 EUR 467.39 10,112,048.92 F Dis 5,191.106 EUR 467.88 2,428,832.00 F1 Cap 10,268.340 EUR 996.44 10,231,734.79 F1 Dis 4,116.356 EUR 951.54 3,916,897.92
75,537,261.30
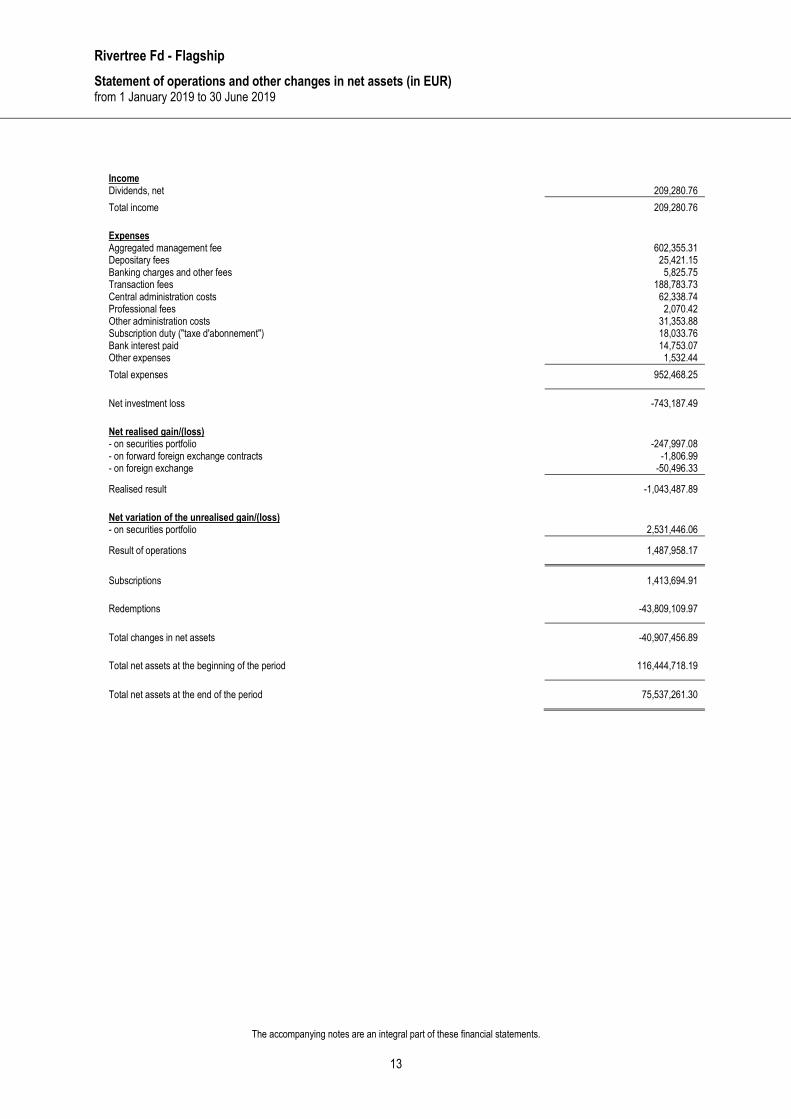
Rivertree Fd - Flagship
Statement of operations and other changes in net assets (in EUR) from 1 January 2019 to 30 June 2019
The accompanying notes are an integral part of these financial statements.
13
Income Dividends, net 209,280.76
Total income 209,280.76
Expenses Aggregated management fee 602,355.31 Depositary fees 25,421.15 Banking charges and other fees 5,825.75 Transaction fees 188,783.73 Central administration costs 62,338.74 Professional fees 2,070.42 Other administration costs 31,353.88 Subscription duty ("taxe d'abonnement") 18,033.76 Bank interest paid 14,753.07 Other expenses 1,532.44
Total expenses 952,468.25
Net investment loss -743,187.49
Net realised gain/(loss) - on securities portfolio -247,997.08 - on forward foreign exchange contracts -1,806.99 - on foreign exchange -50,496.33
Realised result -1,043,487.89
Net variation of the unrealised gain/(loss) - on securities portfolio 2,531,446.06
Result of operations 1,487,958.17
Subscriptions 1,413,694.91
Redemptions -43,809,109.97
Total changes in net assets -40,907,456.89
Total net assets at the beginning of the period 116,444,718.19
Total net assets at the end of the period 75,537,261.30
Rivertree Fd - Flagship
Statistical information (in EUR) as at 30 June 2019
The accompanying notes are an integral part of these financial statements.
14
Total net assets Currency 31.12.2017 31.12.2018 30.06.2019
EUR 147,718,175.32 116,444,718.19 75,537,261.30
Net asset value per share Currency 31.12.2017 31.12.2018 30.06.2019
R Cap EUR 611.84 557.98 564.41 R Dis EUR 537.78 476.46 481.96 F Cap EUR 502.91 460.94 467.39 F Dis EUR 503.36 461.36 467.88 F1 Cap EUR 1,065.82 980.78 996.44 F1 Dis EUR 1,047.50 936.59 951.54
Number of shares outstanding at the
beginning of the period issued redeemed outstanding at the end
of the period
R Cap 60,547.864 27.000 -15,121.945 45,452.919 R Dis 90,331.521 175.331 -42,383.520 48,123.332 F Cap 29,556.612 1,157.000 -9,078.446 21,635.166 F Dis 23,576.269 - -18,385.163 5,191.106 F1 Cap 11,222.399 789.075 -1,743.134 10,268.340 F1 Dis 4,391.856 - -275.500 4,116.356
Synthetic TER per share as at 30.06.2019
(in %)
R Cap 2.02 R Dis 2.02 F Cap 1.52 F Dis 1.51 F1 Cap 1.14 F1 Dis 1.15
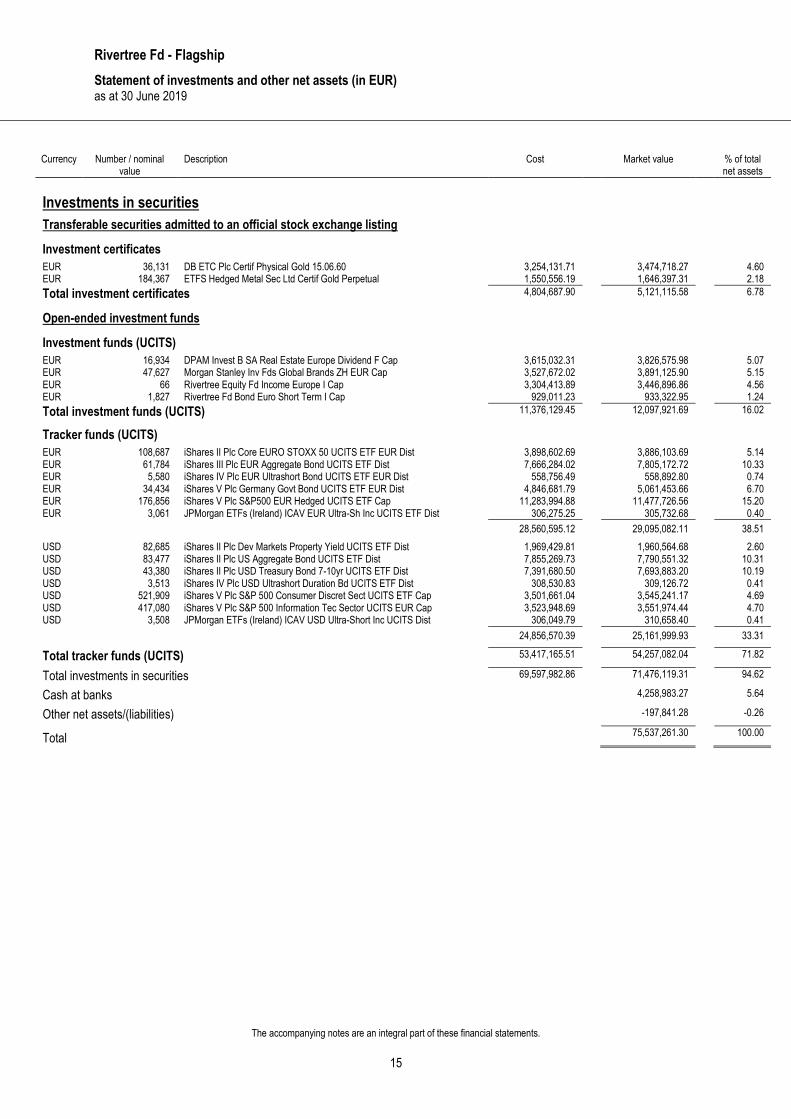
Rivertree Fd - Flagship
Statement of investments and other net assets (in EUR) as at 30 June 2019
The accompanying notes are an integral part of these financial statements.
15
Currency Number / nominal value
Description Cost Market value % of total net assets
Investments in securities
Transferable securities admitted to an official stock exchange listing
Total investment certificates 4,804,687.90 5,121,115.58 6.78
Open-ended investment funds
Investment funds (UCITS)
EUR 16,934 DPAM Invest B SA Real Estate Europe Dividend F Cap 3,615,032.31 3,826,575.98 5.07 EUR 47,627 Morgan Stanley Inv Fds Global Brands ZH EUR Cap 3,527,672.02 3,891,125.90 5.15 EUR 66 Rivertree Equity Fd Income Europe I Cap 3,304,413.89 3,446,896.86 4.56 EUR 1,827 Rivertree Fd Bond Euro Short Term I Cap 929,011.23 933,322.95 1.24
Total investment funds (UCITS) 11,376,129.45 12,097,921.69 16.02
Tracker funds (UCITS)
EUR 108,687 iShares II Plc Core EURO STOXX 50 UCITS ETF EUR Dist 3,898,602.69 3,886,103.69 5.14 EUR 61,784 iShares III Plc EUR Aggregate Bond UCITS ETF Dist 7,666,284.02 7,805,172.72 10.33 EUR 5,580 iShares IV Plc EUR Ultrashort Bond UCITS ETF EUR Dist 558,756.49 558,892.80 0.74 EUR 34,434 iShares V Plc Germany Govt Bond UCITS ETF EUR Dist 4,846,681.79 5,061,453.66 6.70 EUR 176,856 iShares V Plc S&P500 EUR Hedged UCITS ETF Cap 11,283,994.88 11,477,726.56 15.20 EUR 3,061 JPMorgan ETFs (Ireland) ICAV EUR Ultra-Sh Inc UCITS ETF Dist 306,275.25 305,732.68 0.40
28,560,595.12 29,095,082.11 38.51
USD 82,685 iShares II Plc Dev Markets Property Yield UCITS ETF Dist 1,969,429.81 1,960,564.68 2.60 USD 83,477 iShares II Plc US Aggregate Bond UCITS ETF Dist 7,855,269.73 7,790,551.32 10.31 USD 43,380 iShares II Plc USD Treasury Bond 7-10yr UCITS ETF Dist 7,391,680.50 7,693,883.20 10.19 USD 3,513 iShares IV Plc USD Ultrashort Duration Bd UCITS ETF Dist 308,530.83 309,126.72 0.41 USD 521,909 iShares V Plc S&P 500 Consumer Discret Sect UCITS ETF Cap 3,501,661.04 3,545,241.17 4.69 USD 417,080 iShares V Plc S&P 500 Information Tec Sector UCITS EUR Cap 3,523,948.69 3,551,974.44 4.70 USD 3,508 JPMorgan ETFs (Ireland) ICAV USD Ultra-Short Inc UCITS Dist 306,049.79 310,658.40 0.41
24,856,570.39 25,161,999.93 33.31
Total tracker funds (UCITS) 53,417,165.51 54,257,082.04 71.82
Total investments in securities 69,597,982.86 71,476,119.31 94.62
Cash at banks 4,258,983.27 5.64
Other net assets/(liabilities) -197,841.28 -0.26
Total 75,537,261.30 100.00
Rivertree Fd - Flagship
Industrial and geographical classification of investments as at 30 June 2019
16
Industrial classification
(in percentage of net assets)
Investment funds 87.84 %
Financials 6.78 %
Total 94.62 %
Geographical classification
(by domicile of the issuer) (in percentage of net assets)
Ireland 71.82 %
Luxembourg 10.95 %
Jersey 6.78 %
Belgium 5.07 %
Total 94.62 %
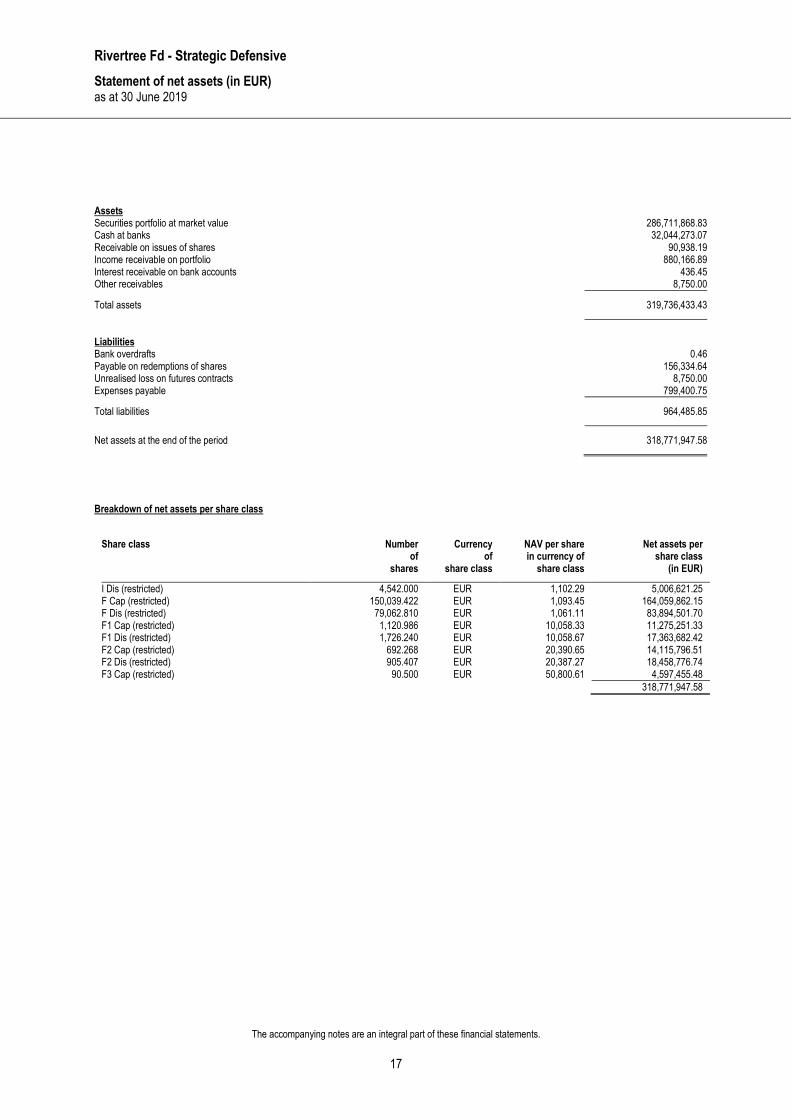
Rivertree Fd - Strategic Defensive
Statement of net assets (in EUR) as at 30 June 2019
The accompanying notes are an integral part of these financial statements.
17
Assets Securities portfolio at market value 286,711,868.83 Cash at banks 32,044,273.07 Receivable on issues of shares 90,938.19 Income receivable on portfolio 880,166.89 Interest receivable on bank accounts 436.45 Other receivables 8,750.00
Total assets 319,736,433.43
Liabilities Bank overdrafts 0.46 Payable on redemptions of shares 156,334.64 Unrealised loss on futures contracts 8,750.00 Expenses payable 799,400.75
Total liabilities 964,485.85
Net assets at the end of the period 318,771,947.58
Breakdown of net assets per share class
Share class Number of
shares
Currency of
share class
NAV per share in currency of
share class
Net assets per share class
(in EUR)
I Dis (restricted) 4,542.000 EUR 1,102.29 5,006,621.25 F Cap (restricted) 150,039.422 EUR 1,093.45 164,059,862.15 F Dis (restricted) 79,062.810 EUR 1,061.11 83,894,501.70 F1 Cap (restricted) 1,120.986 EUR 10,058.33 11,275,251.33 F1 Dis (restricted) 1,726.240 EUR 10,058.67 17,363,682.42 F2 Cap (restricted) 692.268 EUR 20,390.65 14,115,796.51 F2 Dis (restricted) 905.407 EUR 20,387.27 18,458,776.74 F3 Cap (restricted) 90.500 EUR 50,800.61 4,597,455.48
318,771,947.58
Rivertree Fd - Strategic Defensive
Statement of operations and other changes in net assets (in EUR) from 1 January 2019 to 30 June 2019
The accompanying notes are an integral part of these financial statements.
18
Income Dividends, net 856,812.76 Interest on bonds and other debt securities, net 995,814.83 Interest on bank accounts 436.45 Other commissions received 7,711.65 Other income 2,328.82
Total income 1,863,104.51
Expenses Aggregated management fee 1,449,725.41 Depositary fees 62,473.71 Banking charges and other fees 29,812.28 Transaction fees 31,560.26 Central administration costs 59,015.84 Professional fees 7,211.98 Other administration costs 37,065.07 Subscription duty ("taxe d'abonnement") 56,318.94 Bank interest paid 64,914.48 Other expenses 3,339.54
Total expenses 1,801,437.51
Net investment income 61,667.00
Net realised gain/(loss) - on securities portfolio 899,694.08 - on futures contracts -500,900.00 - on foreign exchange 58,861.53
Realised result 519,322.61
Net variation of the unrealised gain/(loss) - on securities portfolio 16,216,009.55 - on futures contracts -8,750.00
Result of operations 16,726,582.16
Subscriptions 43,415,634.70
Redemptions -23,872,064.54
Total changes in net assets 36,270,152.32
Total net assets at the beginning of the period 282,501,795.26
Total net assets at the end of the period 318,771,947.58
Rivertree Fd - Strategic Defensive
Statistical information (in EUR) as at 30 June 2019
The accompanying notes are an integral part of these financial statements.
19
Total net assets Currency 31.12.2017 31.12.2018 30.06.2019
EUR 268,959,133.59 282,501,795.26 318,771,947.58
Net asset value per share Currency 31.12.2017 31.12.2018 30.06.2019
I Dis (restricted) EUR 1,090.48 1,039.38 1,102.29 F Cap (restricted) EUR 1,080.93 1,034.23 1,093.45 F Dis (restricted) EUR 1,059.63 1,003.65 1,061.11 F1 Cap (restricted) EUR 9,914.15 9,504.27 10,058.33 F1 Dis (restricted) EUR 9,914.84 9,504.66 10,058.67 F2 Cap (restricted) EUR 20,054.09 19,253.43 20,390.65 F2 Dis (restricted) EUR 20,051.75 19,250.25 20,387.27 F3 Cap (restricted) EUR - 47,944.87 50,800.61
Number of shares outstanding at the
beginning of the period issued redeemed outstanding at the end
of the period
I Dis (restricted) 4,552.000 - -10.000 4,542.000 F Cap (restricted) 141,858.076 18,032.207 -9,850.861 150,039.422 F Dis (restricted) 77,624.620 7,471.270 -6,033.080 79,062.810 F1 Cap (restricted) 1,236.212 78.100 -193.326 1,120.986 F1 Dis (restricted) 1,403.322 451.600 -128.682 1,726.240 F2 Cap (restricted) 633.980 131.288 -73.000 692.268 F2 Dis (restricted) 695.318 309.000 -98.911 905.407 F3 Cap (restricted) 51.500 47.000 -8.000 90.500
Synthetic TER per share as at 30.06.2019
(in %)
I Dis (restricted) 0.80 F Cap (restricted) 1.42 F Dis (restricted) 1.42 F1 Cap (restricted) 1.23 F1 Dis (restricted) 1.24 F2 Cap (restricted) 1.08 F2 Dis (restricted) 1.09 F3 Cap (restricted) 0.98
Rivertree Fd - Strategic Defensive
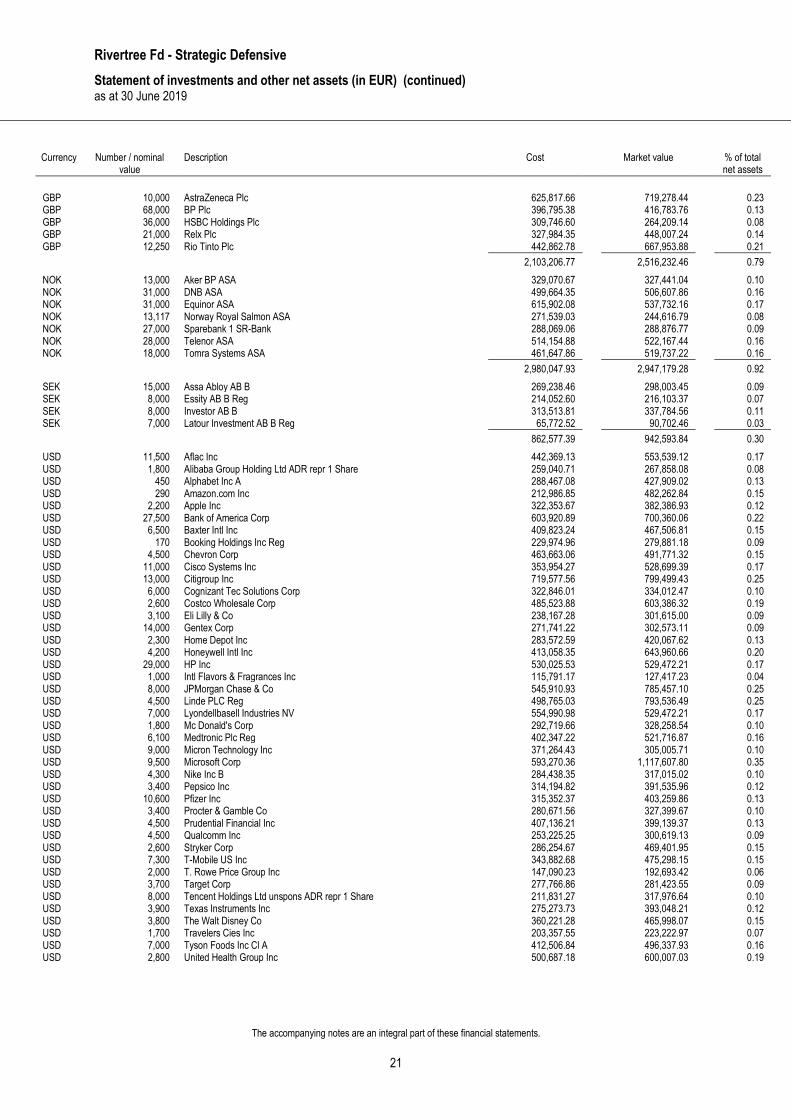
Statement of investments and other net assets (in EUR) as at 30 June 2019
The accompanying notes are an integral part of these financial statements.
20
Currency Number / nominal value
Description Cost Market value % of total net assets
Investments in securities
Transferable securities admitted to an official stock exchange listing
Shares
CHF 400 Geberit AG Reg 158,815.46 164,289.91 0.05 CHF 5,100 HBM Healthcare Inv AG A Reg 630,877.25 844,309.64 0.26 CHF 1,700 Roche Holding Ltd Pref 388,242.87 420,547.05 0.13
1,177,935.58 1,429,146.60 0.44
DKK 18,500 Ambu AS B Bearer Reg 550,395.27 263,605.04 0.08 DKK 5,000 Chr. Hansen Holding A/S 392,121.95 412,930.65 0.13 DKK 7,700 Novo Nordisk AS B 330,190.24 345,089.17 0.11 DKK 4,500 Orsted Reg 335,291.33 342,215.27 0.11 DKK 2,400 Schouw & Co 192,413.74 160,777.67 0.05 DKK 18,000 Tryg A/S 369,562.02 514,649.32 0.16
2,169,974.55 2,039,267.12 0.64
EUR 2,000 Ackermans & Van Haaren SA 245,691.84 263,800.00 0.08 EUR 8,000 Ageas NV 285,333.47 365,680.00 0.11 EUR 7,200 Anheuser-Busch InBev SA 611,476.10 560,448.00 0.18 EUR 10,000 Aperam SA 278,609.58 248,300.00 0.08 EUR 2,500 Argenx SE 281,207.70 308,000.00 0.10 EUR 28,000 Aroundtown SA Bearer 214,988.70 202,888.00 0.06 EUR 3,000 ASML Holding NV 299,334.87 551,220.00 0.17 EUR 22,000 Axa SA 503,512.15 508,200.00 0.16 EUR 60,000 Banco Santander Reg SA 255,292.50 244,830.00 0.08 EUR 4,100 CapGemini SE 368,261.17 448,335.00 0.14 EUR 2,000 Colruyt NV 115,208.79 102,000.00 0.03 EUR 25,000 Crédit Agricole SA 267,924.76 263,625.00 0.08 EUR 6,000 Deutsche Boerse AG Reg 636,419.08 746,400.00 0.23 EUR 11,258 Edenred SA 384,341.62 505,033.88 0.16 EUR 63,000 ENEL SpA 334,733.40 386,820.00 0.12 EUR 20,000 Engie SA 296,336.99 266,800.00 0.08 EUR 2,000 Galapagos Genomics NV 168,813.91 226,900.00 0.07 EUR 4,400 Gaztransport et technigaz SA 316,897.81 387,860.00 0.12 EUR 2,300 Groupe Bruxelles Lambert SA 178,241.07 198,444.00 0.06 EUR 32,000 ING Groep NV 413,646.42 326,272.00 0.10 EUR 50,000 Intesa Sanpaolo SpA 156,796.26 94,100.00 0.03 EUR 7,500 KBC Group SA 441,944.11 432,300.00 0.14 EUR 800 Kering Reg 373,416.97 416,080.00 0.13 EUR 3,600 Kerry Group Plc A 291,728.01 378,000.00 0.12 EUR 6,293 Koninklijke DSM NV 456,489.38 684,049.10 0.21 EUR 1,800 L'Oréal SA 317,082.20 450,900.00 0.14 EUR 3,500 LEG Immobilien AG Reg 334,369.85 347,200.00 0.11 EUR 2,200 LVMH Moët Hennessy L Vuit SE 400,234.43 823,460.00 0.26 EUR 4,600 Melexis NV 361,124.06 273,700.00 0.09 EUR 4,800 Michelin SA 481,294.31 535,440.00 0.17 EUR 70,000 Navigator (The) Co SA Reg 341,182.46 235,060.00 0.07 EUR 7,763 NN Group NV 290,494.72 274,810.20 0.09 EUR 20,000 Orange SA 279,929.48 277,300.00 0.09 EUR 3,500 Pernod-Ricard SA 469,703.54 567,175.00 0.18 EUR 8,500 Puma SE 403,486.83 498,525.00 0.16 EUR 6,000 Renault SA 502,527.24 331,740.00 0.10 EUR 18,000 Royal Dutch Shell Plc A 444,173.74 516,780.00 0.16 EUR 12,264 Royal Philips NV 408,343.75 468,300.84 0.15 EUR 2,800 SAP SE 227,037.70 338,128.00 0.11 EUR 7,000 Schneider Electric SE 423,151.14 558,320.00 0.18 EUR 3,200 Teleperformance SE 288,335.62 563,840.00 0.18 EUR 17,300 Total SA 782,023.51 852,457.50 0.27 EUR 14,000 Umicore SA 543,906.55 394,800.00 0.12 EUR 16,000 UPM-Kymmene Corp 468,756.98 373,920.00 0.12 EUR 7,000 Vinci SA 549,179.98 630,420.00 0.20 EUR 17,500 Vonovia SE 707,017.26 735,000.00 0.23
17,200,002.01 19,163,661.52 6.02
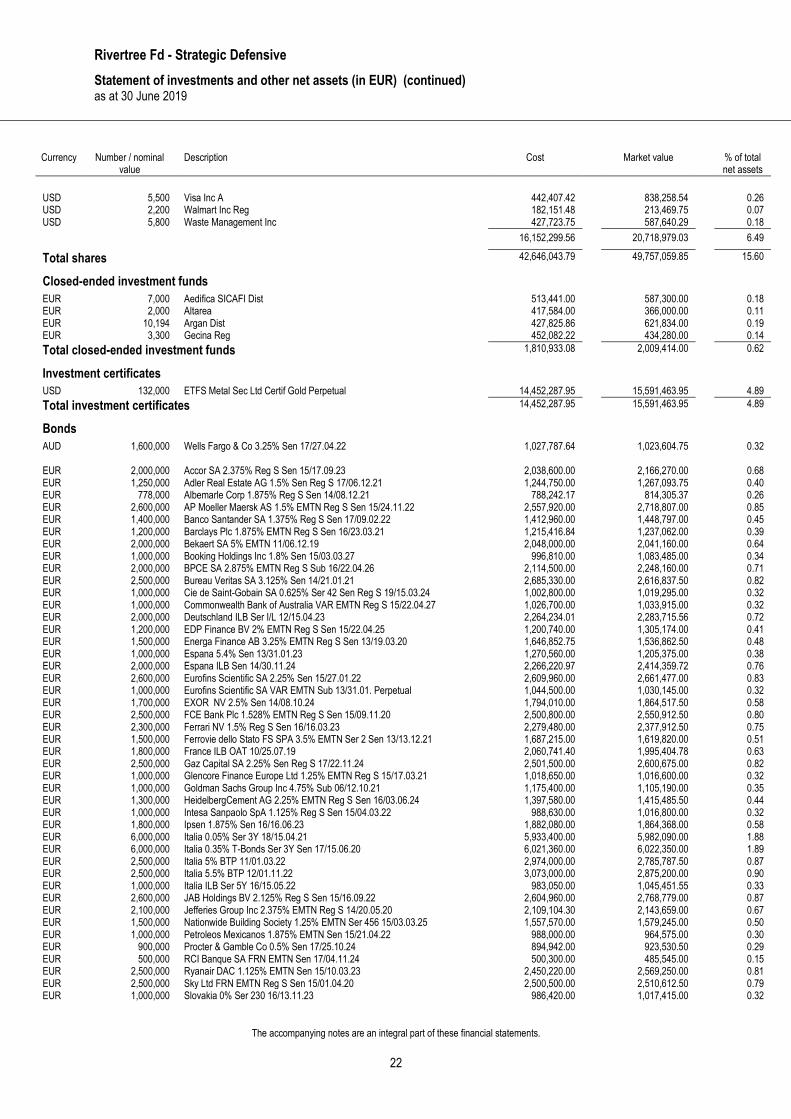
Rivertree Fd - Strategic Defensive
Statement of investments and other net assets (in EUR) (continued) as at 30 June 2019
The accompanying notes are an integral part of these financial statements.
21
Currency Number / nominal value
Description Cost Market value % of total net assets
NOK 13,000 Aker BP ASA 329,070.67 327,441.04 0.10 NOK 31,000 DNB ASA 499,664.35 506,607.86 0.16 NOK 31,000 Equinor ASA 615,902.08 537,732.16 0.17 NOK 13,117 Norway Royal Salmon ASA 271,539.03 244,616.79 0.08 NOK 27,000 Sparebank 1 SR-Bank 288,069.06 288,876.77 0.09 NOK 28,000 Telenor ASA 514,154.88 522,167.44 0.16 NOK 18,000 Tomra Systems ASA 461,647.86 519,737.22 0.16
2,980,047.93 2,947,179.28 0.92
SEK 15,000 Assa Abloy AB B 269,238.46 298,003.45 0.09 SEK 8,000 Essity AB B Reg 214,052.60 216,103.37 0.07 SEK 8,000 Investor AB B 313,513.81 337,784.56 0.11 SEK 7,000 Latour Investment AB B Reg 65,772.52 90,702.46 0.03
Total investment certificates 14,452,287.95 15,591,463.95 4.89
Bonds
AUD 1,600,000 Wells Fargo & Co 3.25% Sen 17/27.04.22 1,027,787.64 1,023,604.75 0.32 EUR 2,000,000 Accor SA 2.375% Reg S Sen 15/17.09.23 2,038,600.00 2,166,270.00 0.68 EUR 1,250,000 Adler Real Estate AG 1.5% Sen Reg S 17/06.12.21 1,244,750.00 1,267,093.75 0.40 EUR 778,000 Albemarle Corp 1.875% Reg S Sen 14/08.12.21 788,242.17 814,305.37 0.26 EUR 2,600,000 AP Moeller Maersk AS 1.5% EMTN Reg S Sen 15/24.11.22 2,557,920.00 2,718,807.00 0.85 EUR 1,400,000 Banco Santander SA 1.375% Reg S Sen 17/09.02.22 1,412,960.00 1,448,797.00 0.45 EUR 1,200,000 Barclays Plc 1.875% EMTN Reg S Sen 16/23.03.21 1,215,416.84 1,237,062.00 0.39 EUR 2,000,000 Bekaert SA 5% EMTN 11/06.12.19 2,048,000.00 2,041,160.00 0.64 EUR 1,000,000 Booking Holdings Inc 1.8% Sen 15/03.03.27 996,810.00 1,083,485.00 0.34 EUR 2,000,000 BPCE SA 2.875% EMTN Reg S Sub 16/22.04.26 2,114,500.00 2,248,160.00 0.71 EUR 2,500,000 Bureau Veritas SA 3.125% Sen 14/21.01.21 2,685,330.00 2,616,837.50 0.82 EUR 1,000,000 Cie de Saint-Gobain SA 0.625% Ser 42 Sen Reg S 19/15.03.24 1,002,800.00 1,019,295.00 0.32 EUR 1,000,000 Commonwealth Bank of Australia VAR EMTN Reg S 15/22.04.27 1,026,700.00 1,033,915.00 0.32 EUR 2,000,000 Deutschland ILB Ser I/L 12/15.04.23 2,264,234.01 2,283,715.56 0.72 EUR 1,200,000 EDP Finance BV 2% EMTN Reg S Sen 15/22.04.25 1,200,740.00 1,305,174.00 0.41 EUR 1,500,000 Energa Finance AB 3.25% EMTN Reg S Sen 13/19.03.20 1,646,852.75 1,536,862.50 0.48 EUR 1,000,000 Espana 5.4% Sen 13/31.01.23 1,270,560.00 1,205,375.00 0.38 EUR 2,000,000 Espana ILB Sen 14/30.11.24 2,266,220.97 2,414,359.72 0.76 EUR 2,600,000 Eurofins Scientific SA 2.25% Sen 15/27.01.22 2,609,960.00 2,661,477.00 0.83 EUR 1,000,000 Eurofins Scientific SA VAR EMTN Sub 13/31.01. Perpetual 1,044,500.00 1,030,145.00 0.32 EUR 1,700,000 EXOR NV 2.5% Sen 14/08.10.24 1,794,010.00 1,864,517.50 0.58 EUR 2,500,000 FCE Bank Plc 1.528% EMTN Reg S Sen 15/09.11.20 2,500,800.00 2,550,912.50 0.80 EUR 2,300,000 Ferrari NV 1.5% Reg S Sen 16/16.03.23 2,279,480.00 2,377,912.50 0.75 EUR 1,500,000 Ferrovie dello Stato FS SPA 3.5% EMTN Ser 2 Sen 13/13.12.21 1,687,215.00 1,619,820.00 0.51 EUR 1,800,000 France ILB OAT 10/25.07.19 2,060,741.40 1,995,404.78 0.63 EUR 2,500,000 Gaz Capital SA 2.25% Sen Reg S 17/22.11.24 2,501,500.00 2,600,675.00 0.82 EUR 1,000,000 Glencore Finance Europe Ltd 1.25% EMTN Reg S 15/17.03.21 1,018,650.00 1,016,600.00 0.32 EUR 1,000,000 Goldman Sachs Group Inc 4.75% Sub 06/12.10.21 1,175,400.00 1,105,190.00 0.35 EUR 1,300,000 HeidelbergCement AG 2.25% EMTN Reg S Sen 16/03.06.24 1,397,580.00 1,415,485.50 0.44 EUR 1,000,000 Intesa Sanpaolo SpA 1.125% Reg S Sen 15/04.03.22 988,630.00 1,016,800.00 0.32 EUR 1,800,000 Ipsen 1.875% Sen 16/16.06.23 1,882,080.00 1,864,368.00 0.58 EUR 6,000,000 Italia 0.05% Ser 3Y 18/15.04.21 5,933,400.00 5,982,090.00 1.88 EUR 6,000,000 Italia 0.35% T-Bonds Ser 3Y Sen 17/15.06.20 6,021,360.00 6,022,350.00 1.89 EUR 2,500,000 Italia 5% BTP 11/01.03.22 2,974,000.00 2,785,787.50 0.87 EUR 2,500,000 Italia 5.5% BTP 12/01.11.22 3,073,000.00 2,875,200.00 0.90 EUR 1,000,000 Italia ILB Ser 5Y 16/15.05.22 983,050.00 1,045,451.55 0.33 EUR 2,600,000 JAB Holdings BV 2.125% Reg S Sen 15/16.09.22 2,604,960.00 2,768,779.00 0.87 EUR 2,100,000 Jefferies Group Inc 2.375% EMTN Reg S 14/20.05.20 2,109,104.30 2,143,659.00 0.67 EUR 1,500,000 Nationwide Building Society 1.25% EMTN Ser 456 15/03.03.25 1,557,570.00 1,579,245.00 0.50 EUR 1,000,000 Petroleos Mexicanos 1.875% EMTN Sen 15/21.04.22 988,000.00 964,575.00 0.30 EUR 900,000 Procter & Gamble Co 0.5% Sen 17/25.10.24 894,942.00 923,530.50 0.29 EUR 500,000 RCI Banque SA FRN EMTN Sen 17/04.11.24 500,300.00 485,545.00 0.15 EUR 2,500,000 Ryanair DAC 1.125% EMTN Sen 15/10.03.23 2,450,220.00 2,569,250.00 0.81 EUR 2,500,000 Sky Ltd FRN EMTN Reg S Sen 15/01.04.20 2,500,500.00 2,510,612.50 0.79 EUR 1,000,000 Slovakia 0% Ser 230 16/13.11.23 986,420.00 1,017,415.00 0.32
Rivertree Fd - Strategic Defensive
Statement of investments and other net assets (in EUR) (continued) as at 30 June 2019
The accompanying notes are an integral part of these financial statements.
23
Currency Number / nominal value
Description Cost Market value % of total net assets
EUR 1,000,000 Syngenta Finance NV 1.875% EMTN Sen 14/02.11.21 1,034,900.00 1,031,970.00 0.32 EUR 1,000,000 Telia Co AB 3.875% EMTN Ser 69 Sen Reg S 10/01.10.25 1,183,500.00 1,202,665.00 0.38 EUR 802,000 Tesco Plc 1.375% EMTN Sen 14/01.07.19 789,045.12 802,224.56 0.25 EUR 2,100,000 Vestas Wind Systems A/S 2.75% Reg S Sen 15/11.03.22 2,090,700.00 2,229,360.00 0.70 EUR 1,500,000 VGP SA 3.5% Sen Reg S 18/19.03.26 1,501,875.00 1,555,860.00 0.49
90,898,029.56 92,055,551.79 28.89
JPY 140,000,000 EIB 1.9% Reg S Sen 06/26.01.26 1,258,225.76 1,314,757.59 0.41 JPY 150,000,000 Japan 0.1% Ser 398 Sen 19/01.03.21 1,226,191.14 1,229,117.63 0.39 JPY 150,000,000 Japan 0.1% T-Bonds Ser 400 19/01.05.21 1,226,715.91 1,229,783.95 0.39
3,711,132.81 3,773,659.17 1.19
NOK 5,000,000 BMW Finance NV 1.375% EMTN Reg S Sen 16/25.10.19 517,512.93 514,565.28 0.16 NOK 8,500,000 Cooperatieve Rabobank UA 1.625% EMTN Gl Ser 3066A17/20.01.22 899,903.46 876,345.26 0.27 NOK 8,500,000 Deutsche Bank AG 2.5% EMTN Sen Reg S 16/20.09.22 914,950.15 868,305.71 0.27 NOK 10,000,000 EIB 1.5% EMTN Sen 15/12.05.22 1,036,980.92 1,030,402.30 0.32 NOK 5,000,000 JPMorgan Chase & Co 1.375% EMTN Sen Reg S 17/01.06.21 512,282.94 511,156.79 0.16 NOK 3,000,000 Nestle Holdings Inc 2.75% EMTN Ser 78 Sen Reg S 14/15.04.20 309,460.00 312,154.34 0.10 NOK 8,500,000 Nordic Investment Bank 1.375% GMTN Sen 15/15.07.20 911,849.75 873,644.98 0.27 NOK 10,000,000 Volkswagen Financial Serv NV 1.75% EMTN Sen 17/14.04.20 1,043,434.87 1,028,368.54 0.32
6,146,375.02 6,014,943.20 1.87
Total bonds 101,783,325.03 102,867,758.91 32.27
Transferable securities dealt in on another regulated market
Bonds
EUR 1,000,000 AT&T Inc FRN 18/05.09.23 1,012,330.00 1,013,085.00 0.32 JPY 160,000,000 Japan ILB Ser 21 16/10.03.26 1,314,580.35 1,375,629.69 0.43
Total bonds 2,326,910.35 2,388,714.69 0.75
Other transferable securities
Bonds
EUR 1,400,000 De Persgroep NV 2.15% 19/28.06.26 1,400,000.00 1,399,524.00 0.44
Total bonds 1,400,000.00 1,399,524.00 0.44
Open-ended investment funds
Investment funds (UCITS)
EUR 948,587 Aegon Asset Mgt Europe ICAV European ABS Fd K Cap 9,475,814.98 9,502,090.84 2.98 EUR 24,167 Aviva Investors Short Duration Global HY Bond Fd Ih EUR Cap 2,667,623.54 2,712,317.99 0.85 EUR 55,000 AXA IM Fixed Inc Inv Str Europe Short Duration HY B EUR Cap 7,335,900.00 7,425,550.00 2.33 EUR 126,000 Fidelity Fds Asia Focus Y EUR Cap 1,587,935.54 2,184,840.00 0.69 EUR 60 Richelieu Obli Court Terme I Cap 6,456,435.90 6,632,146.20 2.08 EUR 18,971 Rivertree Bond Corporate EUR F Cap 12,173,811.86 12,524,274.78 3.93 EUR 177 Rivertree Bond EUR Green Bonds I Cap 8,910,821.47 9,242,258.55 2.90 EUR 177 Rivertree Bond EUR I Cap 8,815,327.52 8,810,378.55 2.76 EUR 20,533 Rivertree Bond Government EUR F Cap 12,460,102.13 12,680,154.15 3.98 EUR 24 Rivertree Equity Fd Income Europe I Cap 1,217,004.92 1,253,330.64 0.39 EUR 45 Rivertree Equity Fd Japan I Cap 2,446,399.10 2,446,756.65 0.77 EUR 96 Rivertree Equity Fd Small & Mid Cap Europe I EUR Cap 4,922,404.88 4,617,428.16 1.45 EUR 6,729 Rivertree Fd Bond Euro Short Term I Cap 3,383,145.77 3,437,778.81 1.08 EUR 681,807 SICAV Oddo BHF EUR Cred Short Duration CI Cap 8,310,954.44 8,383,498.87 2.63
90,163,682.05 91,852,804.19 28.82
USD 1,070 Essential Portfolio Selection US Equity I Cap 4,725,207.33 5,226,367.88 1.64 USD 4,100 Fidelity Active Strategy Emerging Mks Fd Fd Y USD Cap 614,408.84 563,133.40 0.18 USD 12,500 HSBC Global Inv Fds Asia ex Japan Eq Sm Cies I Cap 666,945.61 761,679.99 0.24 USD 1,660 Rivertree Equity Fd US Value USD Cap 2,059,624.60 2,315,107.40 0.73
8,066,186.38 8,866,288.67 2.79
Total investment funds (UCITS) 98,229,868.43 100,719,092.86 31.61
Rivertree Fd - Strategic Defensive
Statement of investments and other net assets (in EUR) (continued) as at 30 June 2019
The accompanying notes are an integral part of these financial statements.
24
Currency Number / nominal value
Description Cost Market value % of total net assets
Tracker funds (UCITS)
EUR 45,000 iShares III Plc Core MSCI Japan IMI UCITS ETF Cap 1,388,619.62 1,597,725.00 0.50 EUR 8,000 Multi Units Lux Lyxor China Enterp (HSCEI) UCITS ETF Cap 1,090,331.49 1,151,216.00 0.36
2,478,951.11 2,748,941.00 0.86
USD 38,564 iShares II Plc JPM USD Em Mkt Bond Fd UCITS ETF Dist 3,830,043.51 3,818,807.97 1.20 USD 183,000 iShares III Plc MSCI Emerging Markets (Acc) Cap 5,096,756.03 5,411,091.60 1.70
8,926,799.54 9,229,899.57 2.90
Total tracker funds (UCITS) 11,405,750.65 11,978,840.57 3.76
Total investments in securities 274,055,119.28 286,711,868.83 89.94
Cash at banks 32,044,273.07 10.05
Bank overdrafts -0.46 0.00
Other net assets/(liabilities) 15,806.14 0.01
Total 318,771,947.58 100.00
Rivertree Fd - Strategic Defensive
Industrial and geographical classification of investments as at 30 June 2019
25
Industrial classification
(in percentage of net assets)
Investment funds 35.37 %
Financials 16.20 %
Countries and governments 9.89 %
Cyclical consumer goods 5.93 %
Industrials 5.56 %
Healthcare 3.47 %
Energy 2.92 %
Technologies 2.18 %
Non-cyclical consumer goods 2.11 %
Raw materials 1.87 %
Real estate 1.62 %
Telecommunications services 1.10 %
International institutions 1.00 %
Utilities 0.72 %
Total 89.94 %
Rivertree Fd - Strategic Defensive
Industrial and geographical classification of investments (continued) as at 30 June 2019
26
Geographical classification
(by domicile of the issuer) (in percentage of net assets)
Luxembourg 29.75 %
France 9.05 %
United States of America 8.54 %
Ireland 7.72 %
Italy 6.85 %
Jersey 5.21 %
The Netherlands 4.83 %
United Kingdom 3.52 %
Germany 2.67 %
Belgium 2.63 %
Denmark 2.19 %
Spain 1.67 %
Japan 1.21 %
Sweden 1.16 %
Norway 0.92 %
Switzerland 0.44 %
Finland 0.39 %
Slovakia 0.32 %
Australia 0.32 %
Mexico 0.30 %
Cayman Islands 0.18 %
Portugal 0.07 %
Total 89.94 %
Rivertree Fd - Strategic Balanced
Statement of net assets (in EUR) as at 30 June 2019
The accompanying notes are an integral part of these financial statements.
27
Assets Securities portfolio at market value 486,615,337.08 Cash at banks 73,859,909.92 Receivable on issues of shares 298,161.29 Income receivable on portfolio 748,142.66 Other receivables 16,100.00
Total assets 561,537,650.95
Liabilities Payable on redemptions of shares 255,261.56 Unrealised loss on futures contracts 16,100.00 Expenses payable 1,606,365.36
Total liabilities 1,877,726.92
Net assets at the end of the period 559,659,924.03
Breakdown of net assets per share class
Share class Number of
shares
Currency of
share class
NAV per share in currency of
share class
Net assets per share class
(in EUR)
I Cap (restricted) 10,205.031 EUR 1,188.78 12,131,547.67 I Dis (restricted) 4,487.000 EUR 1,159.81 5,204,048.12 F Cap (restricted) 141,585.700 EUR 1,136.76 160,948,364.25 F Dis (restricted) 188,250.158 EUR 1,088.64 204,937,410.20 F1 Cap (restricted) 4,578.342 EUR 10,143.03 46,438,280.71 F1 Dis (restricted) 3,098.921 EUR 10,142.43 31,430,586.96 F2 Cap (restricted) 1,784.532 EUR 20,366.82 36,345,235.84 F2 Dis (restricted) 1,048.630 EUR 20,365.77 21,356,159.65 F3 Cap (restricted) 426.325 EUR 51,517.05 21,963,004.83 F3 Dis (restricted) 366.911 EUR 51,525.54 18,905,285.80
559,659,924.03
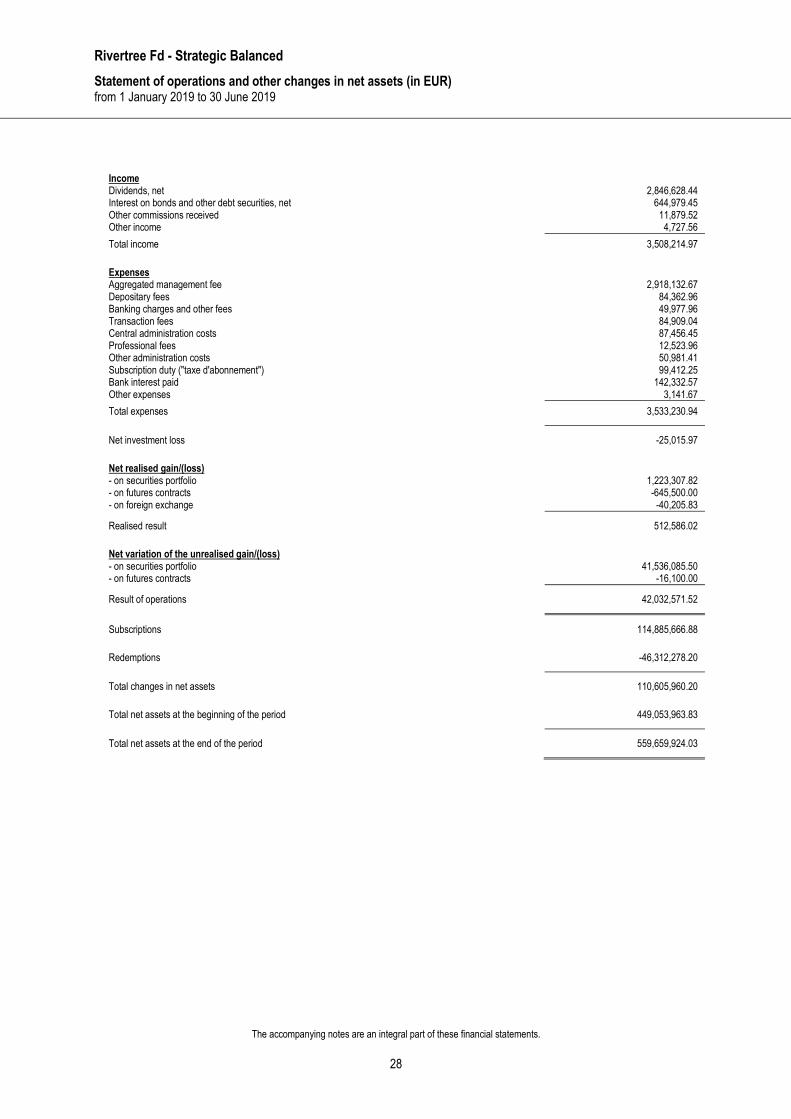
Rivertree Fd - Strategic Balanced
Statement of operations and other changes in net assets (in EUR) from 1 January 2019 to 30 June 2019
The accompanying notes are an integral part of these financial statements.
28
Income Dividends, net 2,846,628.44 Interest on bonds and other debt securities, net 644,979.45 Other commissions received 11,879.52 Other income 4,727.56
Total income 3,508,214.97
Expenses Aggregated management fee 2,918,132.67 Depositary fees 84,362.96 Banking charges and other fees 49,977.96 Transaction fees 84,909.04 Central administration costs 87,456.45 Professional fees 12,523.96 Other administration costs 50,981.41 Subscription duty ("taxe d'abonnement") 99,412.25 Bank interest paid 142,332.57 Other expenses 3,141.67
Total expenses 3,533,230.94
Net investment loss -25,015.97
Net realised gain/(loss) - on securities portfolio 1,223,307.82 - on futures contracts -645,500.00 - on foreign exchange -40,205.83
Realised result 512,586.02
Net variation of the unrealised gain/(loss) - on securities portfolio 41,536,085.50 - on futures contracts -16,100.00
Result of operations 42,032,571.52
Subscriptions 114,885,666.88
Redemptions -46,312,278.20
Total changes in net assets 110,605,960.20
Total net assets at the beginning of the period 449,053,963.83
Total net assets at the end of the period 559,659,924.03
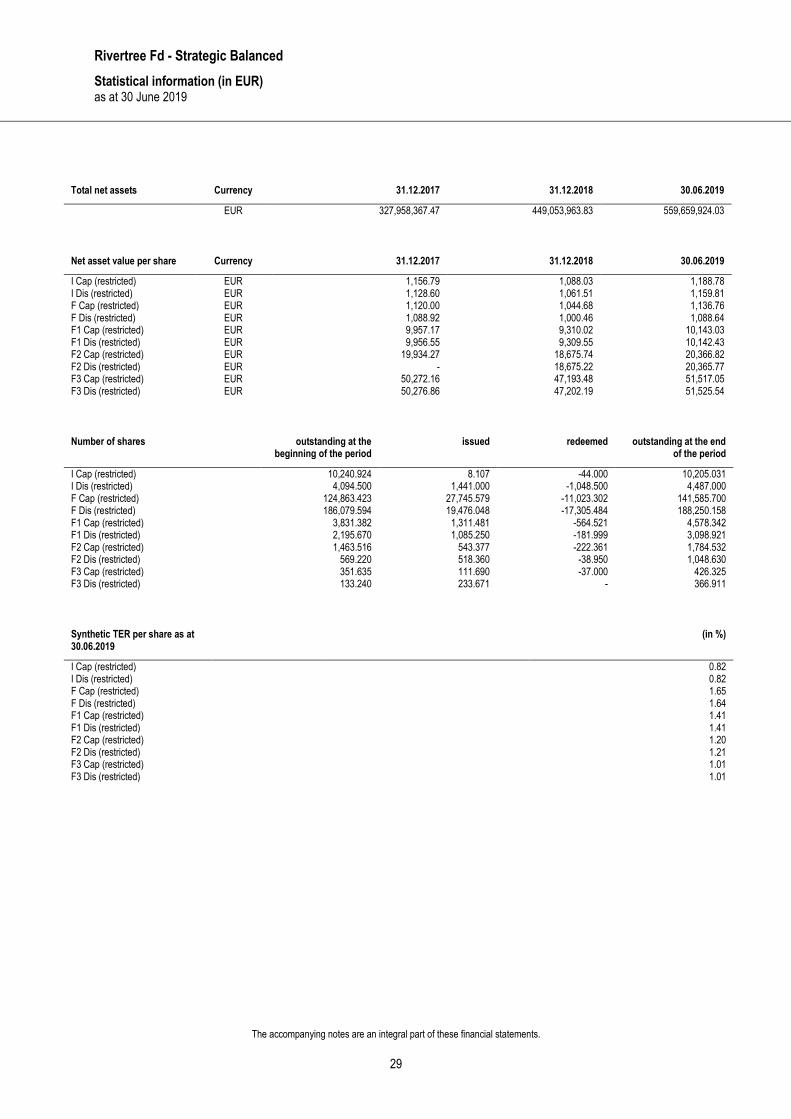
Rivertree Fd - Strategic Balanced
Statistical information (in EUR) as at 30 June 2019
The accompanying notes are an integral part of these financial statements.
29
Total net assets Currency 31.12.2017 31.12.2018 30.06.2019
EUR 327,958,367.47 449,053,963.83 559,659,924.03
Net asset value per share Currency 31.12.2017 31.12.2018 30.06.2019
I Cap (restricted) EUR 1,156.79 1,088.03 1,188.78 I Dis (restricted) EUR 1,128.60 1,061.51 1,159.81 F Cap (restricted) EUR 1,120.00 1,044.68 1,136.76 F Dis (restricted) EUR 1,088.92 1,000.46 1,088.64 F1 Cap (restricted) EUR 9,957.17 9,310.02 10,143.03 F1 Dis (restricted) EUR 9,956.55 9,309.55 10,142.43 F2 Cap (restricted) EUR 19,934.27 18,675.74 20,366.82 F2 Dis (restricted) EUR - 18,675.22 20,365.77 F3 Cap (restricted) EUR 50,272.16 47,193.48 51,517.05 F3 Dis (restricted) EUR 50,276.86 47,202.19 51,525.54
Number of shares outstanding at the
beginning of the period issued redeemed outstanding at the end
of the period
I Cap (restricted) 10,240.924 8.107 -44.000 10,205.031 I Dis (restricted) 4,094.500 1,441.000 -1,048.500 4,487.000 F Cap (restricted) 124,863.423 27,745.579 -11,023.302 141,585.700 F Dis (restricted) 186,079.594 19,476.048 -17,305.484 188,250.158 F1 Cap (restricted) 3,831.382 1,311.481 -564.521 4,578.342 F1 Dis (restricted) 2,195.670 1,085.250 -181.999 3,098.921 F2 Cap (restricted) 1,463.516 543.377 -222.361 1,784.532 F2 Dis (restricted) 569.220 518.360 -38.950 1,048.630 F3 Cap (restricted) 351.635 111.690 -37.000 426.325 F3 Dis (restricted) 133.240 233.671 - 366.911
Synthetic TER per share as at 30.06.2019
(in %)
I Cap (restricted) 0.82 I Dis (restricted) 0.82 F Cap (restricted) 1.65 F Dis (restricted) 1.64 F1 Cap (restricted) 1.41 F1 Dis (restricted) 1.41 F2 Cap (restricted) 1.20 F2 Dis (restricted) 1.21 F3 Cap (restricted) 1.01 F3 Dis (restricted) 1.01
Rivertree Fd - Strategic Balanced
Statement of investments and other net assets (in EUR) as at 30 June 2019
The accompanying notes are an integral part of these financial statements.
30
Currency Number / nominal value
Description Cost Market value % of total net assets
Investments in securities
Transferable securities admitted to an official stock exchange listing
Shares
CHF 1,400 Geberit AG Reg 545,790.45 575,014.69 0.10 CHF 16,400 HBM Healthcare Inv AG A Reg 2,062,943.85 2,715,034.91 0.48 CHF 8,000 Roche Holding Ltd Pref 1,861,920.37 1,979,044.93 0.35
4,470,654.67 5,269,094.53 0.93
DKK 66,000 Ambu AS B Bearer Reg 1,917,698.25 940,428.79 0.17 DKK 20,000 Chr. Hansen Holding A/S 1,577,698.49 1,651,722.60 0.30 DKK 28,000 Novo Nordisk AS B 1,202,601.63 1,254,869.72 0.22 DKK 15,000 Orsted Reg 1,122,982.69 1,140,717.57 0.20 DKK 7,000 Schouw & Co 565,034.83 468,934.87 0.08 DKK 66,000 Tryg A/S 1,350,709.98 1,887,047.52 0.34
7,736,725.87 7,343,721.07 1.31
EUR 6,500 Ackermans & Van Haaren SA 808,250.75 857,350.00 0.15 EUR 28,000 Ageas NV 1,028,386.96 1,279,880.00 0.23 EUR 27,000 Anheuser-Busch InBev SA 2,274,615.70 2,101,680.00 0.38 EUR 36,000 Aperam SA 995,056.06 893,880.00 0.16 EUR 10,000 Argenx SE 1,065,627.47 1,232,000.00 0.22 EUR 100,000 Aroundtown SA Bearer 768,480.65 724,600.00 0.13 EUR 9,500 ASML Holding NV 1,055,982.43 1,745,530.00 0.31 EUR 84,000 Axa SA 1,912,409.98 1,940,400.00 0.35 EUR 230,000 Banco Santander Reg SA 990,239.72 938,515.00 0.17 EUR 14,200 CapGemini SE 1,267,990.47 1,552,770.00 0.28 EUR 7,000 Colruyt NV 415,444.17 357,000.00 0.06 EUR 105,000 Crédit Agricole SA 1,260,653.95 1,107,225.00 0.20 EUR 21,700 Deutsche Boerse AG Reg 2,329,700.21 2,699,480.00 0.48 EUR 43,500 Edenred SA 1,505,199.15 1,951,410.00 0.35 EUR 235,000 ENEL SpA 1,207,522.98 1,442,900.00 0.26 EUR 72,000 Engie SA 1,034,693.69 960,480.00 0.17 EUR 10,000 Galapagos Genomics NV 839,991.08 1,134,500.00 0.20 EUR 15,000 Gaztransport et technigaz SA 1,098,246.23 1,322,250.00 0.24 EUR 8,500 Groupe Bruxelles Lambert SA 682,536.24 733,380.00 0.13 EUR 120,000 ING Groep NV 1,537,263.19 1,223,520.00 0.22 EUR 200,000 Intesa Sanpaolo SpA 578,665.87 376,400.00 0.07 EUR 24,500 KBC Group SA 1,420,023.19 1,412,180.00 0.25 EUR 2,800 Kering Reg 1,300,594.57 1,456,280.00 0.26 EUR 13,400 Kerry Group Plc A 1,120,097.40 1,407,000.00 0.25 EUR 22,551 Koninklijke DSM NV 1,682,922.11 2,451,293.70 0.44 EUR 6,200 L'Oréal SA 1,107,702.85 1,553,100.00 0.28 EUR 12,500 LEG Immobilien AG Reg 1,218,152.29 1,240,000.00 0.22 EUR 100 Lotus Bakeries NV 228,000.00 235,000.00 0.04 EUR 7,300 LVMH Moët Hennessy L Vuit SE 1,267,340.04 2,732,390.00 0.49 EUR 16,000 Melexis NV 1,123,373.12 952,000.00 0.17 EUR 17,000 Michelin SA 1,689,001.17 1,896,350.00 0.34 EUR 250,000 Navigator (The) Co SA Reg 1,216,690.40 839,500.00 0.15 EUR 27,947 NN Group NV 1,041,004.78 989,323.80 0.18 EUR 60,000 Orange SA 831,086.30 831,900.00 0.15 EUR 13,000 Pernod-Ricard SA 1,749,177.27 2,106,650.00 0.38 EUR 35,000 Puma SE 1,722,134.41 2,052,750.00 0.37 EUR 30,000 Recticel SA 251,528.61 237,900.00 0.04 EUR 24,500 Renault SA 1,993,411.64 1,354,605.00 0.24 EUR 59,000 Royal Dutch Shell Plc A 1,473,702.91 1,693,890.00 0.30 EUR 39,000 Royal Philips NV 1,282,559.77 1,489,215.00 0.27 EUR 9,000 SAP SE 712,165.66 1,086,840.00 0.19 EUR 23,000 Schneider Electric SE 1,425,237.73 1,834,480.00 0.33 EUR 11,400 Teleperformance SE 1,029,763.69 2,008,680.00 0.36 EUR 60,000 Total SA 2,831,996.98 2,956,500.00 0.53 EUR 47,000 Umicore SA 1,861,375.90 1,325,400.00 0.24
Rivertree Fd - Strategic Balanced
Statement of investments and other net assets (in EUR) (continued) as at 30 June 2019
The accompanying notes are an integral part of these financial statements.
31
Currency Number / nominal value
Description Cost Market value % of total net assets
NOK 45,000 Aker BP ASA 1,224,924.16 1,133,449.74 0.20 NOK 111,000 DNB ASA 1,796,242.99 1,813,982.98 0.32 NOK 107,000 Equinor ASA 2,153,786.05 1,856,043.27 0.33 NOK 50,500 Norway Royal Salmon ASA 1,074,794.04 941,766.27 0.17 NOK 100,000 Sparebank 1 SR-Bank 1,051,095.27 1,069,913.95 0.19 NOK 94,000 Telenor ASA 1,717,691.61 1,752,990.68 0.31 NOK 65,000 Tomra Systems ASA 1,640,766.80 1,876,828.84 0.34
10,659,300.92 10,444,975.73 1.86
SEK 54,000 Assa Abloy AB B 981,633.78 1,072,812.40 0.19 SEK 18,000 Catena AB Reg 446,701.57 497,476.93 0.09 SEK 27,000 Essity AB B Reg 727,340.29 729,348.88 0.13 SEK 48,000 Hufvudstaden AB A 751,536.63 717,366.27 0.13 SEK 27,000 Investor AB B 1,060,292.52 1,140,022.90 0.20 SEK 28,000 Latour Investment AB B Reg 304,091.13 362,809.85 0.06
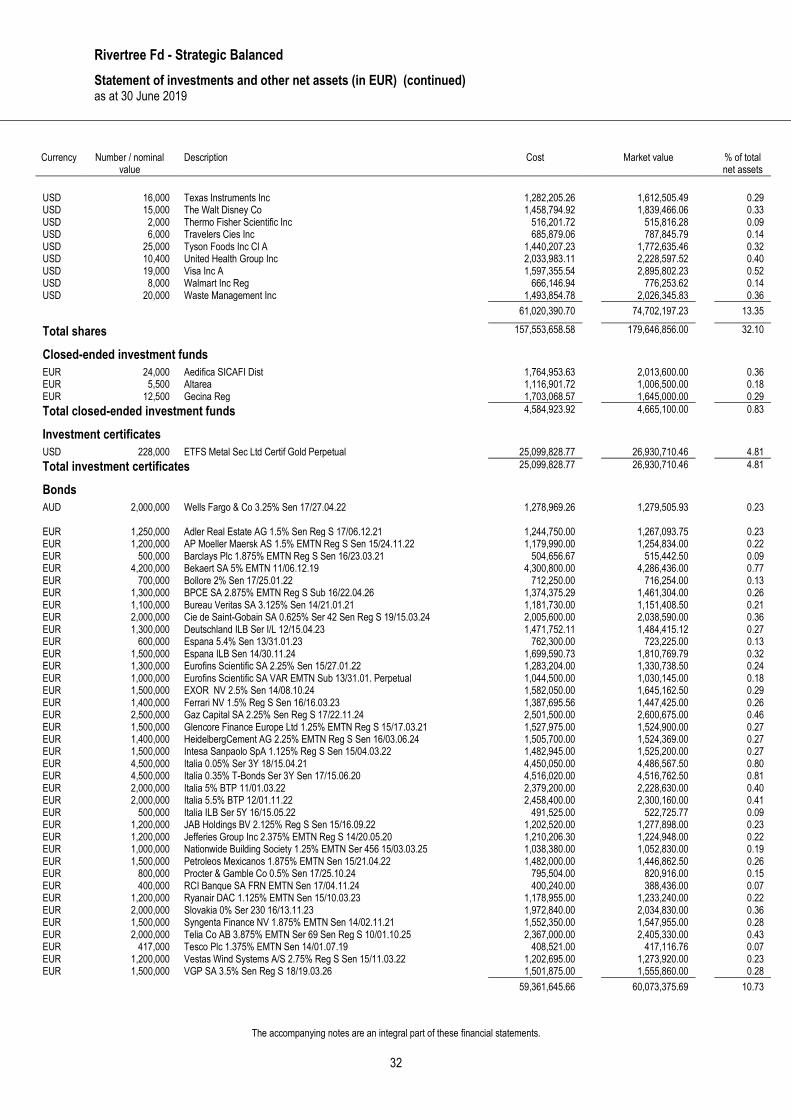
Total investment certificates 25,099,828.77 26,930,710.46 4.81
Bonds
AUD 2,000,000 Wells Fargo & Co 3.25% Sen 17/27.04.22 1,278,969.26 1,279,505.93 0.23 EUR 1,250,000 Adler Real Estate AG 1.5% Sen Reg S 17/06.12.21 1,244,750.00 1,267,093.75 0.23 EUR 1,200,000 AP Moeller Maersk AS 1.5% EMTN Reg S Sen 15/24.11.22 1,179,990.00 1,254,834.00 0.22 EUR 500,000 Barclays Plc 1.875% EMTN Reg S Sen 16/23.03.21 504,656.67 515,442.50 0.09 EUR 4,200,000 Bekaert SA 5% EMTN 11/06.12.19 4,300,800.00 4,286,436.00 0.77 EUR 700,000 Bollore 2% Sen 17/25.01.22 712,250.00 716,254.00 0.13 EUR 1,300,000 BPCE SA 2.875% EMTN Reg S Sub 16/22.04.26 1,374,375.29 1,461,304.00 0.26 EUR 1,100,000 Bureau Veritas SA 3.125% Sen 14/21.01.21 1,181,730.00 1,151,408.50 0.21 EUR 2,000,000 Cie de Saint-Gobain SA 0.625% Ser 42 Sen Reg S 19/15.03.24 2,005,600.00 2,038,590.00 0.36 EUR 1,300,000 Deutschland ILB Ser I/L 12/15.04.23 1,471,752.11 1,484,415.12 0.27 EUR 600,000 Espana 5.4% Sen 13/31.01.23 762,300.00 723,225.00 0.13 EUR 1,500,000 Espana ILB Sen 14/30.11.24 1,699,590.73 1,810,769.79 0.32 EUR 1,300,000 Eurofins Scientific SA 2.25% Sen 15/27.01.22 1,283,204.00 1,330,738.50 0.24 EUR 1,000,000 Eurofins Scientific SA VAR EMTN Sub 13/31.01. Perpetual 1,044,500.00 1,030,145.00 0.18 EUR 1,500,000 EXOR NV 2.5% Sen 14/08.10.24 1,582,050.00 1,645,162.50 0.29 EUR 1,400,000 Ferrari NV 1.5% Reg S Sen 16/16.03.23 1,387,695.56 1,447,425.00 0.26 EUR 2,500,000 Gaz Capital SA 2.25% Sen Reg S 17/22.11.24 2,501,500.00 2,600,675.00 0.46 EUR 1,500,000 Glencore Finance Europe Ltd 1.25% EMTN Reg S 15/17.03.21 1,527,975.00 1,524,900.00 0.27 EUR 1,400,000 HeidelbergCement AG 2.25% EMTN Reg S Sen 16/03.06.24 1,505,700.00 1,524,369.00 0.27 EUR 1,500,000 Intesa Sanpaolo SpA 1.125% Reg S Sen 15/04.03.22 1,482,945.00 1,525,200.00 0.27 EUR 4,500,000 Italia 0.05% Ser 3Y 18/15.04.21 4,450,050.00 4,486,567.50 0.80 EUR 4,500,000 Italia 0.35% T-Bonds Ser 3Y Sen 17/15.06.20 4,516,020.00 4,516,762.50 0.81 EUR 2,000,000 Italia 5% BTP 11/01.03.22 2,379,200.00 2,228,630.00 0.40 EUR 2,000,000 Italia 5.5% BTP 12/01.11.22 2,458,400.00 2,300,160.00 0.41 EUR 500,000 Italia ILB Ser 5Y 16/15.05.22 491,525.00 522,725.77 0.09 EUR 1,200,000 JAB Holdings BV 2.125% Reg S Sen 15/16.09.22 1,202,520.00 1,277,898.00 0.23 EUR 1,200,000 Jefferies Group Inc 2.375% EMTN Reg S 14/20.05.20 1,210,206.30 1,224,948.00 0.22 EUR 1,000,000 Nationwide Building Society 1.25% EMTN Ser 456 15/03.03.25 1,038,380.00 1,052,830.00 0.19 EUR 1,500,000 Petroleos Mexicanos 1.875% EMTN Sen 15/21.04.22 1,482,000.00 1,446,862.50 0.26 EUR 800,000 Procter & Gamble Co 0.5% Sen 17/25.10.24 795,504.00 820,916.00 0.15 EUR 400,000 RCI Banque SA FRN EMTN Sen 17/04.11.24 400,240.00 388,436.00 0.07 EUR 1,200,000 Ryanair DAC 1.125% EMTN Sen 15/10.03.23 1,178,955.00 1,233,240.00 0.22 EUR 2,000,000 Slovakia 0% Ser 230 16/13.11.23 1,972,840.00 2,034,830.00 0.36 EUR 1,500,000 Syngenta Finance NV 1.875% EMTN Sen 14/02.11.21 1,552,350.00 1,547,955.00 0.28 EUR 2,000,000 Telia Co AB 3.875% EMTN Ser 69 Sen Reg S 10/01.10.25 2,367,000.00 2,405,330.00 0.43 EUR 417,000 Tesco Plc 1.375% EMTN Sen 14/01.07.19 408,521.00 417,116.76 0.07 EUR 1,200,000 Vestas Wind Systems A/S 2.75% Reg S Sen 15/11.03.22 1,202,695.00 1,273,920.00 0.23 EUR 1,500,000 VGP SA 3.5% Sen Reg S 18/19.03.26 1,501,875.00 1,555,860.00 0.28
59,361,645.66 60,073,375.69 10.73
Rivertree Fd - Strategic Balanced
Statement of investments and other net assets (in EUR) (continued) as at 30 June 2019
The accompanying notes are an integral part of these financial statements.
33
Currency Number / nominal value
Description Cost Market value % of total net assets
JPY 220,000,000 EIB 1.9% Reg S Sen 06/26.01.26 1,977,211.91 2,066,047.63 0.37 JPY 200,000,000 Japan 0.1% Ser 398 Sen 19/01.03.21 1,634,921.51 1,638,823.51 0.29 JPY 200,000,000 Japan 0.1% T-Bonds Ser 400 19/01.05.21 1,635,621.22 1,639,711.93 0.29
5,247,754.64 5,344,583.07 0.95
NOK 5,000,000 BMW Finance NV 1.375% EMTN Reg S Sen 16/25.10.19 517,512.93 514,565.28 0.09 NOK 8,500,000 Cooperatieve Rabobank UA 1.625% EMTN Gl Ser 3066A17/20.01.22 899,903.46 876,345.26 0.16 NOK 8,500,000 Deutsche Bank AG 2.5% EMTN Sen Reg S 16/20.09.22 914,950.15 868,305.71 0.16 NOK 10,000,000 EIB 1.5% EMTN Sen 15/12.05.22 1,036,980.92 1,030,402.30 0.18 NOK 5,000,000 JPMorgan Chase & Co 1.375% EMTN Sen Reg S 17/01.06.21 512,282.94 511,156.79 0.09 NOK 3,000,000 Nestle Holdings Inc 2.75% EMTN Ser 78 Sen Reg S 14/15.04.20 309,460.00 312,154.34 0.06 NOK 8,500,000 Nordic Investment Bank 1.375% GMTN Sen 15/15.07.20 911,849.75 873,644.98 0.16 NOK 10,000,000 Volkswagen Financial Serv NV 1.75% EMTN Sen 17/14.04.20 1,043,434.87 1,028,368.54 0.18
6,146,375.02 6,014,943.20 1.08
Total bonds 72,034,744.58 72,712,407.89 12.99
Transferable securities dealt in on another regulated market
Bonds
EUR 1,000,000 AT&T Inc FRN 18/05.09.23 1,012,330.00 1,013,085.00 0.18 JPY 230,000,000 Japan ILB Ser 21 16/10.03.26 1,889,709.26 1,977,467.69 0.35
Total bonds 2,902,039.26 2,990,552.69 0.53
Other transferable securities
Bonds
EUR 3,000,000 De Persgroep NV 2.15% 19/28.06.26 3,000,000.00 2,998,980.00 0.54
Total bonds 3,000,000.00 2,998,980.00 0.54
Open-ended investment funds
Investment funds (UCITS)
EUR 1,652,068 Aegon Asset Mgt Europe ICAV European ABS Fd K Cap 16,503,168.08 16,548,930.36 2.96 EUR 62,000 Aviva Investors Short Duration Global HY Bond Fd Ih EUR Cap 6,843,739.80 6,958,402.60 1.24 EUR 45,000 AXA IM Fixed Inc Inv Str Europe Short Duration HY B EUR Cap 6,002,100.00 6,075,450.00 1.09 EUR 420,000 Fidelity Fds Asia Focus Y EUR Cap 5,678,740.48 7,282,800.00 1.30 EUR 20 Richelieu Obli Court Terme I Cap 2,150,177.45 2,210,715.40 0.39 EUR 22,974 Rivertree Bond Corporate EUR F Cap 14,687,813.18 15,166,975.32 2.71 EUR 223 Rivertree Bond EUR Green Bonds I Cap 11,232,259.66 11,644,201.45 2.08 EUR 211 Rivertree Bond EUR I Cap 10,503,262.71 10,502,767.65 1.88 EUR 23,798 Rivertree Bond Government EUR F Cap 14,369,530.13 14,696,454.90 2.63 EUR 37 Rivertree Equity Fd Income Europe I Cap 1,870,559.80 1,932,218.07 0.35 EUR 123 Rivertree Equity Fd Japan I Cap 6,704,615.62 6,687,801.51 1.19 EUR 258 Rivertree Equity Fd Small & Mid Cap Europe I EUR Cap 12,969,527.56 12,409,338.18 2.22 EUR 11,236 Rivertree Fd Bond Euro Short Term I Cap 5,657,502.77 5,740,360.04 1.03 EUR 1,019,342 SICAV Oddo BHF EUR Cred Short Duration CI Cap 12,427,419.11 12,533,829.23 2.24
127,600,416.35 130,390,244.71 23.31
USD 3,950 Essential Portfolio Selection US Equity I Cap 17,682,114.07 19,293,601.04 3.45 USD 18,500 Fidelity Active Strategy Emerging Mks Fd Fd Y USD Cap 2,682,904.39 2,540,967.77 0.45 USD 2,900 Rivertree Equity Fd US Value USD Cap 3,854,768.12 4,044,464.74 0.72
24,219,786.58 25,879,033.55 4.62
Total investment funds (UCITS) 151,820,202.93 156,269,278.26 27.93
Tracker funds (UCITS)
EUR 8,500 iShares III Plc Core EUR Government Bond UCITS ETF Dist 1,047,973.83 1,101,600.00 0.20 EUR 196,364 iShares III Plc Core MSCI Japan IMI UCITS ETF Cap 6,156,192.30 6,971,903.82 1.25 EUR 29,000 Multi Units Lux Lyxor China Enterp (HSCEI) UCITS ETF Cap 4,058,047.10 4,173,158.00 0.75
11,262,213.23 12,246,661.82 2.20
Rivertree Fd - Strategic Balanced
Statement of investments and other net assets (in EUR) (continued) as at 30 June 2019
The accompanying notes are an integral part of these financial statements.
34
Currency Number / nominal value
Description Cost Market value % of total net assets
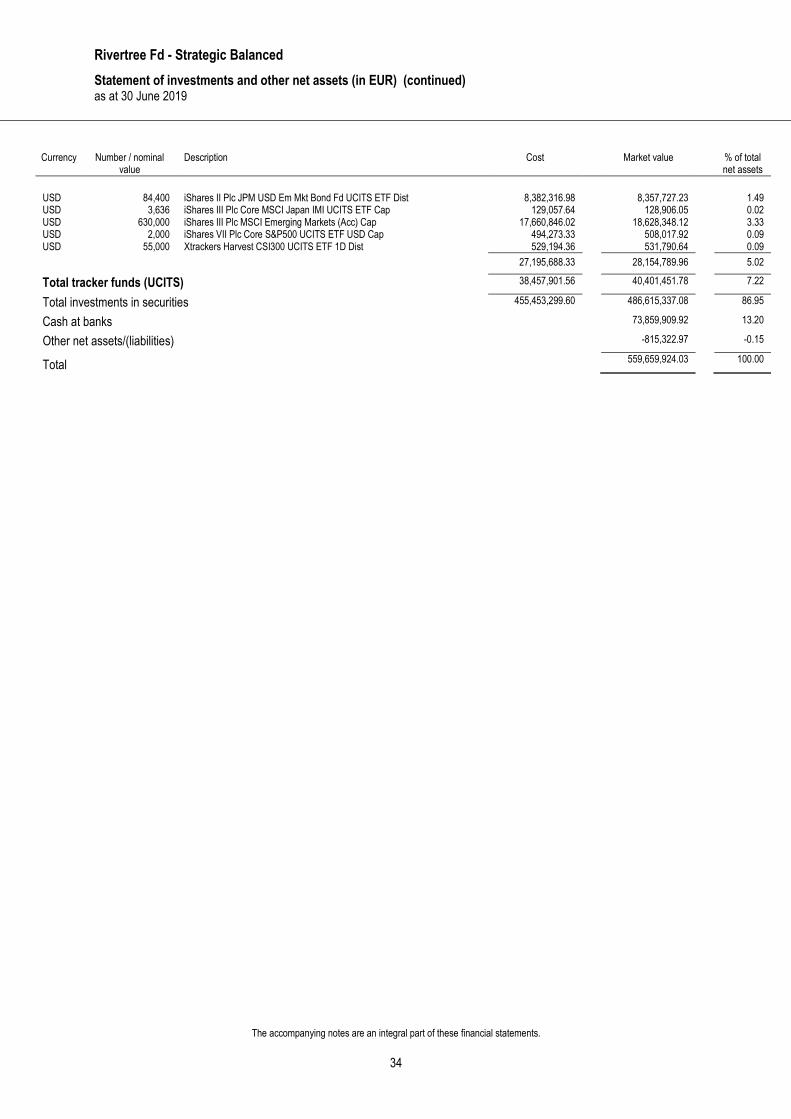
USD 84,400 iShares II Plc JPM USD Em Mkt Bond Fd UCITS ETF Dist 8,382,316.98 8,357,727.23 1.49 USD 3,636 iShares III Plc Core MSCI Japan IMI UCITS ETF Cap 129,057.64 128,906.05 0.02 USD 630,000 iShares III Plc MSCI Emerging Markets (Acc) Cap 17,660,846.02 18,628,348.12 3.33 USD 2,000 iShares VII Plc Core S&P500 UCITS ETF USD Cap 494,273.33 508,017.92 0.09 USD 55,000 Xtrackers Harvest CSI300 UCITS ETF 1D Dist 529,194.36 531,790.64 0.09
27,195,688.33 28,154,789.96 5.02
Total tracker funds (UCITS) 38,457,901.56 40,401,451.78 7.22
Total investments in securities 455,453,299.60 486,615,337.08 86.95
Cash at banks 73,859,909.92 13.20
Other net assets/(liabilities) -815,322.97 -0.15
Total 559,659,924.03 100.00
Rivertree Fd - Strategic Balanced
Industrial and geographical classification of investments as at 30 June 2019
35
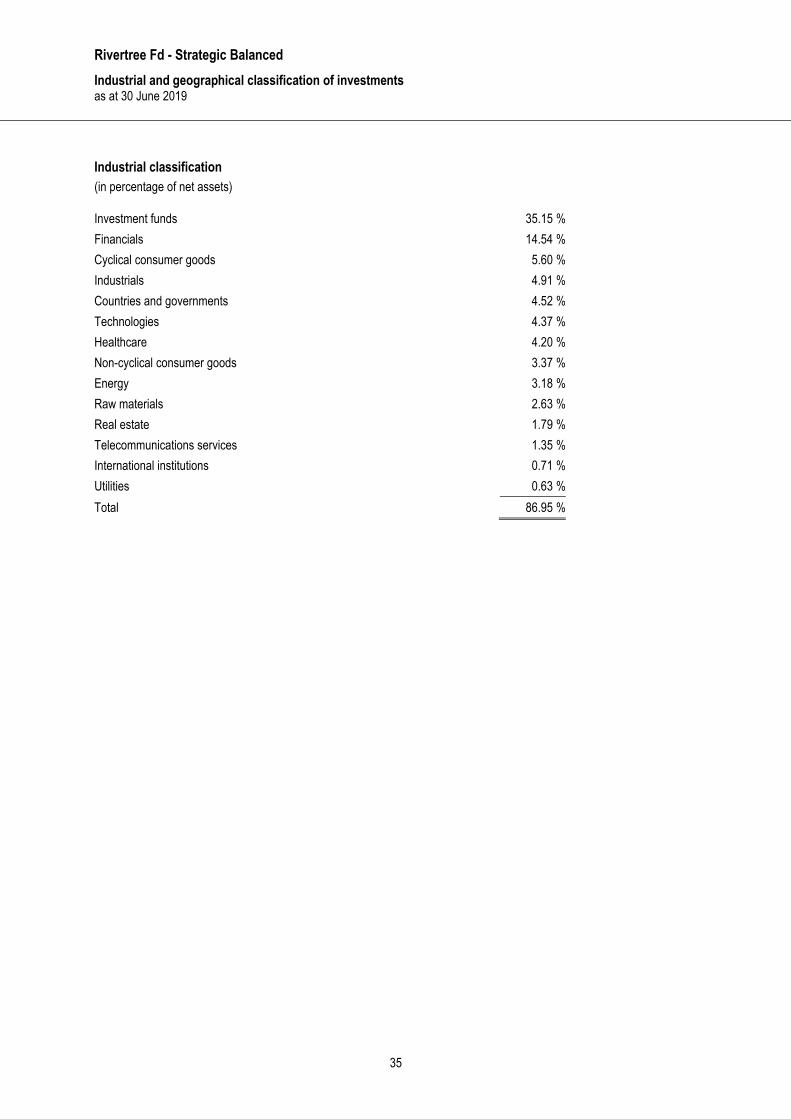
Industrial classification
(in percentage of net assets)
Investment funds 35.15 %
Financials 14.54 %
Cyclical consumer goods 5.60 %
Industrials 4.91 %
Countries and governments 4.52 %
Technologies 4.37 %
Healthcare 4.20 %
Non-cyclical consumer goods 3.37 %
Energy 3.18 %
Raw materials 2.63 %
Real estate 1.79 %
Telecommunications services 1.35 %
International institutions 0.71 %
Utilities 0.63 %
Total 86.95 %
Rivertree Fd - Strategic Balanced
Industrial and geographical classification of investments (continued) as at 30 June 2019
36
Geographical classification
(by domicile of the issuer) (in percentage of net assets)
Luxembourg 27.14 %
United States of America 12.67 %
Ireland 10.74 %
France 7.19 %
Jersey 5.08 %
Belgium 3.84 %
The Netherlands 3.74 %
Italy 3.11 %
Germany 2.70 %
United Kingdom 1.88 %
Norway 1.86 %
Denmark 1.76 %
Sweden 1.23 %
Japan 0.93 %
Switzerland 0.93 %
Spain 0.62 %
Finland 0.39 %
Cayman Islands 0.37 %
Slovakia 0.36 %
Mexico 0.26 %
Portugal 0.15 %
Total 86.95 %
Rivertree Fd - Strategic Dynamic
Statement of net assets (in EUR) as at 30 June 2019
The accompanying notes are an integral part of these financial statements.
37
Assets Securities portfolio at market value 114,240,281.92 Cash at banks 14,049,076.22 Receivable on issues of shares 198,520.81 Income receivable on portfolio 73,228.99
Total assets 128,561,107.94
Liabilities Payable on redemptions of shares 103,726.78 Expenses payable 346,947.21
Total liabilities 450,673.99
Net assets at the end of the period 128,110,433.95
Breakdown of net assets per share class
Share class Number of
shares
Currency of
share class
NAV per share in currency of
share class
Net assets per share class
(in EUR)
I Cap (restricted) 1.000 EUR 10,442.26 10,442.26 F Cap (restricted) 37,026.768 EUR 1,206.55 44,674,828.50 F Dis (restricted) 33,693.864 EUR 1,140.80 38,438,017.04 F1 Cap (restricted) 1,324.769 EUR 10,375.21 13,744,751.25 F1 Dis (restricted) 135.200 EUR 10,374.81 1,402,674.19 F2 Cap (restricted) 508.251 EUR 20,421.60 10,379,298.83 F2 Dis (restricted) 370.918 EUR 20,420.22 7,574,226.61 F3 Cap (restricted) 232.300 EUR 51,167.44 11,886,195.27
128,110,433.95
Rivertree Fd - Strategic Dynamic
Statement of operations and other changes in net assets (in EUR) from 1 January 2019 to 30 June 2019
The accompanying notes are an integral part of these financial statements.
38
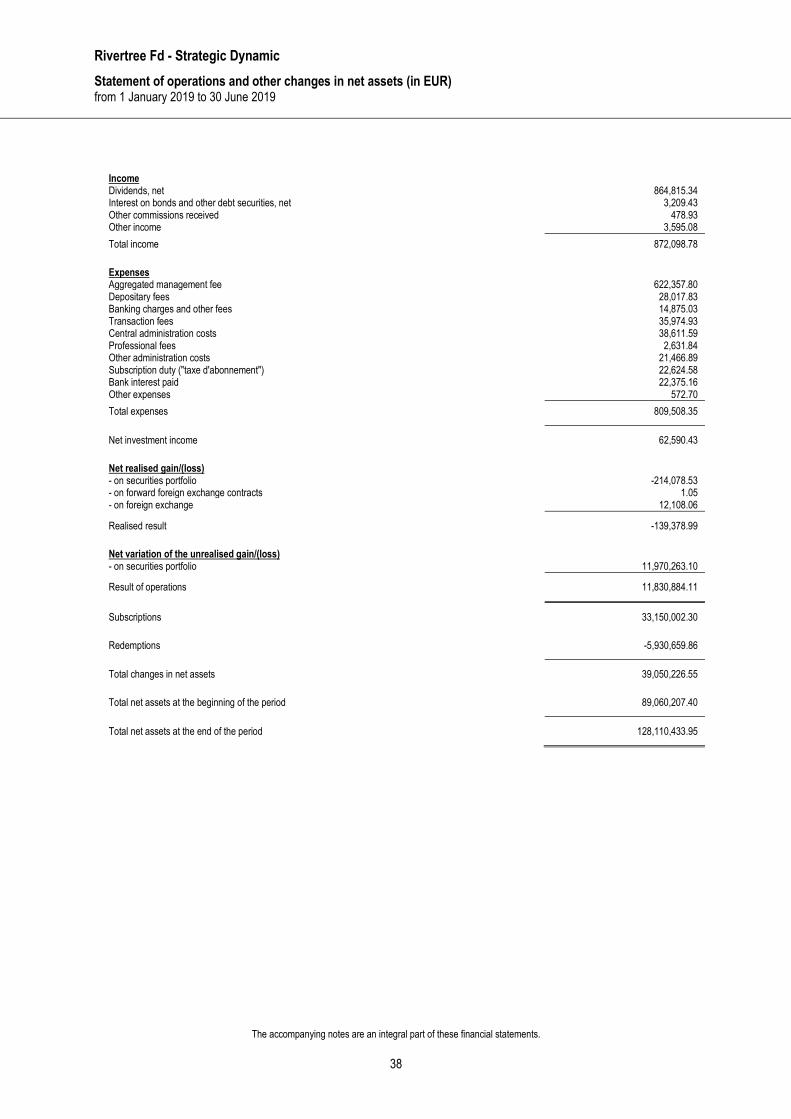
Income Dividends, net 864,815.34 Interest on bonds and other debt securities, net 3,209.43 Other commissions received 478.93 Other income 3,595.08
Total income 872,098.78
Expenses Aggregated management fee 622,357.80 Depositary fees 28,017.83 Banking charges and other fees 14,875.03 Transaction fees 35,974.93 Central administration costs 38,611.59 Professional fees 2,631.84 Other administration costs 21,466.89 Subscription duty ("taxe d'abonnement") 22,624.58 Bank interest paid 22,375.16 Other expenses 572.70
Total expenses 809,508.35
Net investment income 62,590.43
Net realised gain/(loss) - on securities portfolio -214,078.53 - on forward foreign exchange contracts 1.05 - on foreign exchange 12,108.06
Realised result -139,378.99
Net variation of the unrealised gain/(loss) - on securities portfolio 11,970,263.10
Result of operations 11,830,884.11
Subscriptions 33,150,002.30
Redemptions -5,930,659.86
Total changes in net assets 39,050,226.55
Total net assets at the beginning of the period 89,060,207.40
Total net assets at the end of the period 128,110,433.95
Rivertree Fd - Strategic Dynamic
Statistical information (in EUR) as at 30 June 2019
The accompanying notes are an integral part of these financial statements.
39
Total net assets Currency 31.12.2017 31.12.2018 30.06.2019
EUR 79,074,808.72 89,060,207.40 128,110,433.95
Net asset value per share Currency 31.12.2017 31.12.2018 30.06.2019
I Cap (restricted) EUR 10,118.99 9,260.95 10,442.26 F Cap (restricted) EUR 1,183.89 1,074.45 1,206.55 F Dis (restricted) EUR 1,141.98 1,015.90 1,140.80 F1 Cap (restricted) EUR 10,143.53 9,228.07 10,375.21 F1 Dis (restricted) EUR 10,142.27 9,228.00 10,374.81 F2 Cap (restricted) EUR 19,905.80 18,146.03 20,421.60 F2 Dis (restricted) EUR - 18,145.09 20,420.22 F3 Cap (restricted) EUR - 45,423.17 51,167.44
Number of shares outstanding at the
beginning of the period issued redeemed outstanding at the end
of the period
I Cap (restricted) 1.000 - - 1.000 F Cap (restricted) 32,060.914 6,626.002 -1,660.148 37,026.768 F Dis (restricted) 30,635.914 5,262.200 -2,204.250 33,693.864 F1 Cap (restricted) 951.594 492.375 -119.200 1,324.769 F1 Dis (restricted) 61.000 74.300 -0.100 135.200 F2 Cap (restricted) 341.672 180.579 -14.000 508.251 F2 Dis (restricted) 172.000 201.918 -3.000 370.918 F3 Cap (restricted) 106 126 - 232
Synthetic TER per share as at 30.06.2019
(in %)
I Cap (restricted) 0.93 F Cap (restricted) 1.76 F Dis (restricted) 1.76 F1 Cap (restricted) 1.53 F1 Dis (restricted) 1.53 F2 Cap (restricted) 1.33 F2 Dis (restricted) 1.33 F3 Cap (restricted) 1.14
Rivertree Fd - Strategic Dynamic
Statement of investments and other net assets (in EUR) as at 30 June 2019
The accompanying notes are an integral part of these financial statements.
40
Currency Number / nominal value
Description Cost Market value % of total net assets
Investments in securities
Transferable securities admitted to an official stock exchange listing
Shares
CHF 400 Geberit AG Reg 159,230.16 164,289.91 0.13 CHF 6,100 HBM Healthcare Inv AG A Reg 802,862.29 1,009,860.55 0.79 CHF 2,500 Roche Holding Ltd Pref 580,488.40 618,451.54 0.48
1,542,580.85 1,792,602.00 1.40
DKK 22,000 Ambu AS B Bearer Reg 621,401.45 313,476.26 0.24 DKK 5,500 Chr. Hansen Holding A/S 437,494.91 454,223.71 0.35 DKK 9,800 Novo Nordisk AS B 417,648.14 439,204.40 0.34 DKK 7,000 Orsted Reg 511,070.14 532,334.87 0.42 DKK 3,500 Schouw & Co 283,831.25 234,467.44 0.18 DKK 25,000 Tryg A/S 544,694.70 714,790.73 0.56
2,816,140.59 2,688,497.41 2.09
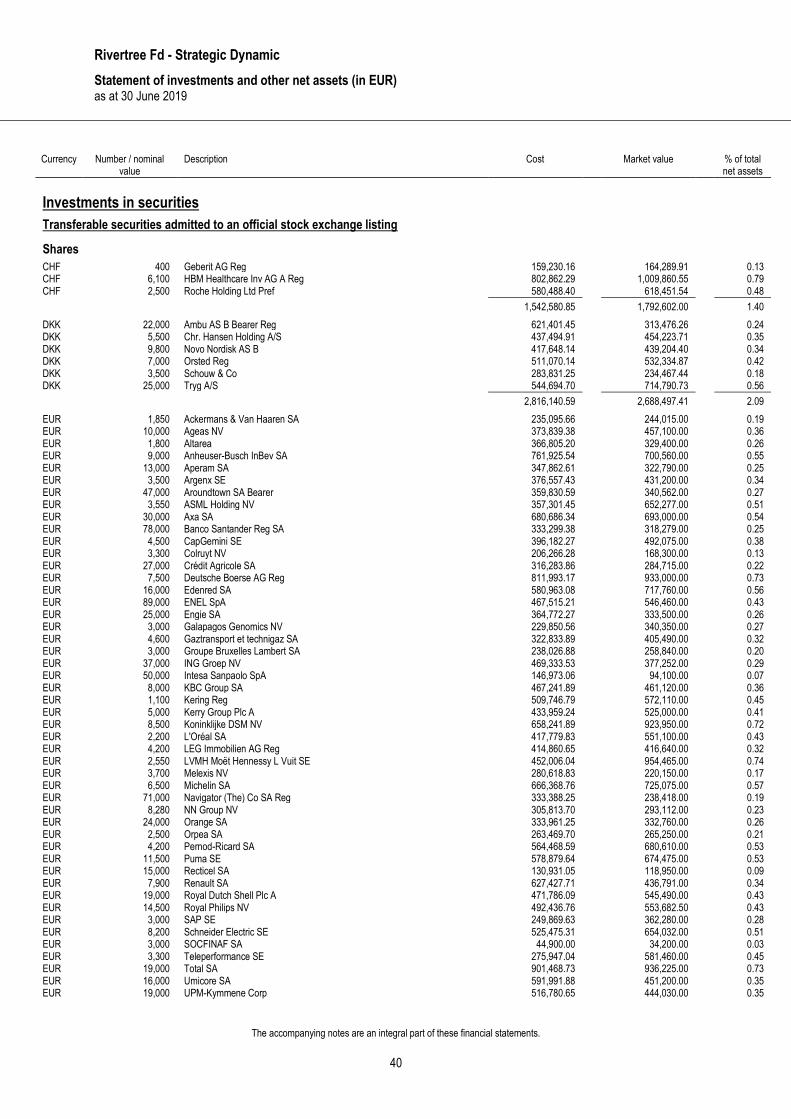
EUR 1,850 Ackermans & Van Haaren SA 235,095.66 244,015.00 0.19 EUR 10,000 Ageas NV 373,839.38 457,100.00 0.36 EUR 1,800 Altarea 366,805.20 329,400.00 0.26 EUR 9,000 Anheuser-Busch InBev SA 761,925.54 700,560.00 0.55 EUR 13,000 Aperam SA 347,862.61 322,790.00 0.25 EUR 3,500 Argenx SE 376,557.43 431,200.00 0.34 EUR 47,000 Aroundtown SA Bearer 359,830.59 340,562.00 0.27 EUR 3,550 ASML Holding NV 357,301.45 652,277.00 0.51 EUR 30,000 Axa SA 680,686.34 693,000.00 0.54 EUR 78,000 Banco Santander Reg SA 333,299.38 318,279.00 0.25 EUR 4,500 CapGemini SE 396,182.27 492,075.00 0.38 EUR 3,300 Colruyt NV 206,266.28 168,300.00 0.13 EUR 27,000 Crédit Agricole SA 316,283.86 284,715.00 0.22 EUR 7,500 Deutsche Boerse AG Reg 811,993.17 933,000.00 0.73 EUR 16,000 Edenred SA 580,963.08 717,760.00 0.56 EUR 89,000 ENEL SpA 467,515.21 546,460.00 0.43 EUR 25,000 Engie SA 364,772.27 333,500.00 0.26 EUR 3,000 Galapagos Genomics NV 229,850.56 340,350.00 0.27 EUR 4,600 Gaztransport et technigaz SA 322,833.89 405,490.00 0.32 EUR 3,000 Groupe Bruxelles Lambert SA 238,026.88 258,840.00 0.20 EUR 37,000 ING Groep NV 469,333.53 377,252.00 0.29 EUR 50,000 Intesa Sanpaolo SpA 146,973.06 94,100.00 0.07 EUR 8,000 KBC Group SA 467,241.89 461,120.00 0.36 EUR 1,100 Kering Reg 509,746.79 572,110.00 0.45 EUR 5,000 Kerry Group Plc A 433,959.24 525,000.00 0.41 EUR 8,500 Koninklijke DSM NV 658,241.89 923,950.00 0.72 EUR 2,200 L'Oréal SA 417,779.83 551,100.00 0.43 EUR 4,200 LEG Immobilien AG Reg 414,860.65 416,640.00 0.32 EUR 2,550 LVMH Moët Hennessy L Vuit SE 452,006.04 954,465.00 0.74 EUR 3,700 Melexis NV 280,618.83 220,150.00 0.17 EUR 6,500 Michelin SA 666,368.76 725,075.00 0.57 EUR 71,000 Navigator (The) Co SA Reg 333,388.25 238,418.00 0.19 EUR 8,280 NN Group NV 305,813.70 293,112.00 0.23 EUR 24,000 Orange SA 333,961.25 332,760.00 0.26 EUR 2,500 Orpea SA 263,469.70 265,250.00 0.21 EUR 4,200 Pernod-Ricard SA 564,468.59 680,610.00 0.53 EUR 11,500 Puma SE 578,879.64 674,475.00 0.53 EUR 15,000 Recticel SA 130,931.05 118,950.00 0.09 EUR 7,900 Renault SA 627,427.71 436,791.00 0.34 EUR 19,000 Royal Dutch Shell Plc A 471,786.09 545,490.00 0.43 EUR 14,500 Royal Philips NV 492,436.76 553,682.50 0.43 EUR 3,000 SAP SE 249,869.63 362,280.00 0.28 EUR 8,200 Schneider Electric SE 525,475.31 654,032.00 0.51 EUR 3,000 SOCFINAF SA 44,900.00 34,200.00 0.03 EUR 3,300 Teleperformance SE 275,947.04 581,460.00 0.45 EUR 19,000 Total SA 901,468.73 936,225.00 0.73 EUR 16,000 Umicore SA 591,991.88 451,200.00 0.35 EUR 19,000 UPM-Kymmene Corp 516,780.65 444,030.00 0.35
Rivertree Fd - Strategic Dynamic
Statement of investments and other net assets (in EUR) (continued) as at 30 June 2019
The accompanying notes are an integral part of these financial statements.
41
Currency Number / nominal value
Description Cost Market value % of total net assets
EUR 8,000 Vinci SA 643,325.13 720,480.00 0.56 EUR 25,000 Vonovia SE 1,029,811.73 1,050,000.00 0.82
NOK 16,000 Aker BP ASA 421,100.80 403,004.35 0.31 NOK 39,000 DNB ASA 628,474.07 637,345.37 0.50 NOK 35,000 Equinor ASA 674,178.91 607,116.96 0.47 NOK 19,000 Norway Royal Salmon ASA 375,813.17 354,327.90 0.28 NOK 35,000 Sparebank 1 SR-Bank 370,320.38 374,469.88 0.29 NOK 31,000 Telenor ASA 575,647.28 578,113.95 0.45 NOK 24,000 Tomra Systems ASA 626,722.65 692,982.96 0.54
3,672,257.26 3,647,361.37 2.84
SEK 19,000 Assa Abloy AB B 345,092.00 377,471.03 0.29 SEK 6,000 Catena AB Reg 165,297.76 165,825.64 0.13 SEK 12,500 Essity AB B Reg 334,845.67 337,661.52 0.26 SEK 23,000 Hufvudstaden AB A 357,269.70 343,738.01 0.27 SEK 11,000 Investor AB B 435,767.08 464,453.77 0.36 SEK 10,000 Latour Investment AB B Reg 134,099.13 129,574.95 0.10
Total investment certificates 5,873,421.95 6,260,209.01 4.89
Bonds
EUR 1,000,000 Bekaert SA 5% EMTN 11/06.12.19 1,024,000.00 1,020,580.00 0.80
Total bonds 1,024,000.00 1,020,580.00 0.80
Other transferable securities
Bonds
EUR 500,000 De Persgroep NV 2.15% 19/28.06.26 500,000.00 499,830.00 0.39
Total bonds 500,000.00 499,830.00 0.39
Open-ended investment funds
Investment funds (UCITS)
EUR 231,147 Aegon Asset Mgt Europe ICAV European ABS Fd K Cap 2,309,019.84 2,315,422.61 1.81 EUR 8,000 Aviva Investors Short Duration Global HY Bond Fd Ih EUR Cap 887,003.20 897,858.40 0.70 EUR 175,000 Fidelity Fds Asia Focus Y EUR Cap 2,293,184.95 3,034,500.00 2.37 EUR 4,735 Rivertree Bond Corporate EUR F Cap 3,011,410.06 3,125,952.30 2.44 EUR 21 Rivertree Bond EUR Green Bonds I Cap 1,042,808.13 1,096,539.15 0.86 EUR 3,681 Rivertree Bond Government EUR F Cap 2,224,315.70 2,273,201.55 1.77 EUR 10 Rivertree Equity Fd Income Europe I Cap 518,814.40 522,221.10 0.41 EUR 50 Rivertree Equity Fd Japan I Cap 2,733,252.17 2,718,618.50 2.12 EUR 87 Rivertree Equity Fd Small & Mid Cap Europe I EUR Cap 4,484,457.12 4,184,544.27 3.27 EUR 3,562 Rivertree Fd Bond Euro Short Term I Cap 1,787,585.54 1,819,790.18 1.42 EUR 66,931 SICAV Oddo BHF EUR Cred Short Duration CI Cap 814,282.55 822,983.58 0.64
22,106,133.66 22,811,631.64 17.81
USD 1,300 Essential Portfolio Selection US Equity I Cap 5,892,730.57 6,349,792.75 4.96 USD 5,700 Fidelity Active Strategy Emerging Mks Fd Fd Y USD Cap 844,798.52 782,892.77 0.61 USD 15,295 HSBC Global Inv Fds Asia ex Japan Eq Sm Cies I Cap 813,243.79 931,991.63 0.73 USD 900 Rivertree Equity Fd US Value USD Cap 1,168,937.50 1,255,178.71 0.98
8,719,710.38 9,319,855.86 7.28
Total investment funds (UCITS) 30,825,844.04 32,131,487.50 25.09
Tracker funds (UCITS)
EUR 45,000 iShares III Plc Core MSCI Japan IMI UCITS ETF Cap 1,417,069.49 1,597,725.00 1.25 EUR 12,000 Multi Units Lux Lyxor China Enterp (HSCEI) UCITS ETF Cap 1,663,042.93 1,726,824.00 1.35
3,080,112.42 3,324,549.00 2.60
USD 19,270 iShares II Plc JPM USD Em Mkt Bond Fd UCITS ETF Dist 1,913,829.95 1,908,215.68 1.49 USD 161,500 iShares III Plc MSCI Emerging Markets (Acc) Cap 4,503,851.41 4,775,362.26 3.73
Rivertree Fd - Strategic Dynamic
Statement of investments and other net assets (in EUR) (continued) as at 30 June 2019
The accompanying notes are an integral part of these financial statements.
43
Currency Number / nominal value
Description Cost Market value % of total net assets
Total tracker funds (UCITS) 9,932,491.95 10,457,971.50 8.17
Total investments in securities 104,333,991.24 114,240,281.92 89.17
Cash at banks 14,049,076.22 10.97
Other net assets/(liabilities) -178,924.19 -0.14
Total 128,110,433.95 100.00
Rivertree Fd - Strategic Dynamic
Industrial and geographical classification of investments as at 30 June 2019
44
Industrial classification
(in percentage of net assets)
Investment funds 33.26 %
Financials 15.55 %
Cyclical consumer goods 6.70 %
Technologies 6.28 %
Healthcare 5.99 %
Industrials 5.48 %
Non-cyclical consumer goods 4.80 %
Raw materials 3.54 %
Energy 3.13 %
Real estate 2.17 %
Telecommunications services 1.16 %
Utilities 1.11 %
Total 89.17 %
Geographical classification
(by domicile of the issuer) (in percentage of net assets)
Luxembourg 25.29 %
United States of America 17.63 %
Ireland 10.32 %
France 8.81 %
Jersey 4.89 %
Belgium 4.44 %
The Netherlands 3.39 %
Norway 2.84 %
Germany 2.68 %
United Kingdom 2.17 %
Denmark 2.09 %
Sweden 1.41 %
Switzerland 1.40 %
Cayman Islands 0.52 %
Italy 0.50 %
Finland 0.35 %
Spain 0.25 %
Portugal 0.19 %
Total 89.17 %
Rivertree Fd - Strategic Conservative
Statement of net assets (in EUR) as at 30 June 2019
The accompanying notes are an integral part of these financial statements.
45
Assets Securities portfolio at market value 12,621,641.49 Cash at banks 1,989,394.97 Formation expenses, net 2,178.53 Receivable on issues of shares 10,065.90 Income receivable on portfolio 95,207.61
Total assets 14,718,488.50
Liabilities Payable on redemptions of shares 2,013.46 Expenses payable 21,752.28
Total liabilities 23,765.74
Net assets at the end of the period 14,694,722.76
Breakdown of net assets per share class
Share class Number of
shares
Currency of
share class
NAV per share in currency of
share class
Net assets per share class
(in EUR)
I Cap (restricted) 0.100 EUR 10,103.50 1,010.35 F Cap (restricted) 5,417.887 EUR 1,006.43 5,452,713.22 F Dis (restricted) 7,237.838 EUR 1,006.57 7,285,425.88 F2 Cap (restricted) 1,904.000 EUR 1,027.09 1,955,573.31
14,694,722.76
Rivertree Fd - Strategic Conservative
Statement of operations and other changes in net assets (in EUR) from 1 January 2019 to 30 June 2019
The accompanying notes are an integral part of these financial statements.
46
Income Dividends, net 14,025.57 Interest on bonds and other debt securities, net 95,758.88 Other commissions received 248.66
Total income 110,033.11
Expenses Aggregated management fee 51,565.33 Depositary fees 4,907.19 Banking charges and other fees 2,215.82 Transaction fees 854.17 Central administration costs 18,283.14 Professional fees 336.49 Other administration costs 10,354.87 Subscription duty ("taxe d'abonnement") 2,842.52 Bank interest paid 3,146.75 Other expenses 379.94
Total expenses 94,886.22
Net investment income 15,146.89
Net realised gain/(loss) - on securities portfolio 36,066.94 - on foreign exchange 1,684.73
Realised result 52,898.56
Net variation of the unrealised gain/(loss) - on securities portfolio 463,534.77
Result of operations 516,433.33
Subscriptions 3,044,381.48
Redemptions -1,922,945.74
Total changes in net assets 1,637,869.07
Total net assets at the beginning of the period 13,056,853.69
Total net assets at the end of the period 14,694,722.76
Rivertree Fd - Strategic Conservative
Statistical information (in EUR) as at 30 June 2019
The accompanying notes are an integral part of these financial statements.
47
Total net assets Currency 31.12.2017 31.12.2018 30.06.2019
EUR 12,465,569.33 13,056,853.69 14,694,722.76
Net asset value per share Currency 31.12.2017 31.12.2018 30.06.2019
I Cap (restricted) EUR 9,994.50 9,717.90 10,103.50 F Cap (restricted) EUR 1,001.88 970.00 1,006.43 F Dis (restricted) EUR 1,001.92 970.12 1,006.57 F2 Cap (restricted) EUR - 989.18 1,027.09
Number of shares outstanding at the
beginning of the period issued redeemed outstanding at the end
of the period
I Cap (restricted) 0.100 - - 0.100 F Cap (restricted) 3,727.007 1,761.800 -70.920 5,417.887 F Dis (restricted) 8,951.470 155.138 -1,868.770 7,237.838 F2 Cap (restricted) 765 1,139 - 1,904
Synthetic TER per share as at 30.06.2019
(in %)
I Cap (restricted) 1.13 F Cap (restricted) 1.53 F Dis (restricted) 1.51 F2 Cap (restricted) 1.37
Rivertree Fd - Strategic Conservative
Statement of investments and other net assets (in EUR) as at 30 June 2019
The accompanying notes are an integral part of these financial statements.
48
Currency Number / nominal value
Description Cost Market value % of total net assets
Investments in securities
Transferable securities admitted to an official stock exchange listing
Total investment certificates 648,620.02 720,514.62 4.90
Bonds
EUR 100,000 Anglo American Capital Plc 2.5% EMTN Sen 13/29.04.21 107,150.00 104,789.50 0.71 EUR 100,000 AP Moeller Maersk AS 1.5% EMTN Reg S Sen 15/24.11.22 104,010.00 104,569.50 0.71 EUR 300,000 Bekaert SA 5% EMTN 11/06.12.19 307,200.00 306,174.00 2.08 EUR 100,000 Belgium 0.2% Ser 79 16/22.10.23 100,132.00 103,161.50 0.70 EUR 200,000 Belgium 2.6% Reg S Ser 72 14/22.06.24 230,854.00 230,799.00 1.57 EUR 100,000 Bollore 2.875% Reg S 15/29.07.21 105,680.00 103,658.00 0.71 EUR 100,000 CNH Industrial Fin Europe SA 1.375% EMTN Sen 17/23.05.22 101,510.00 103,222.50 0.70 EUR 100,000 Deutschland 1.75% 12/04.07.22 109,703.00 107,660.00 0.73 EUR 100,000 Deutschland 3.25% Ser 09 09/04.01.20 109,611.00 102,037.50 0.69 EUR 100,000 E.ON SE 0.375% EMTN Sen Reg S 17/23.08.21 101,052.00 101,057.50 0.69 EUR 100,000 ENI SpA 3.25% EMTN Reg S Ser 11 13/10.07.23 114,994.52 113,708.50 0.77 EUR 100,000 Espana 4.3% Sen 09/31.10.19 110,290.00 101,572.00 0.69 EUR 100,000 Espana 4.6% 09/30.07.19 109,866.00 100,387.50 0.68 EUR 100,000 Espana 4.8% Sen 08/31.01.24 125,240.00 123,142.50 0.84 EUR 100,000 Espana 5.85% 11/31.01.22 125,255.00 116,229.00 0.79 EUR 100,000 European Fin Stability Facilit 1.875% EMTN 13/23.05.23 110,300.00 109,225.00 0.74 EUR 100,000 Eutelsat SA 3.125% Reg S Sen 12/10.10.22 112,550.00 109,927.00 0.75 EUR 100,000 France 2.25% OAT 13/25.05.24 113,323.00 113,787.50 0.77 EUR 100,000 France 3.75% T-Bond 09/25.10.19 109,692.00 101,365.50 0.69 EUR 200,000 France 8.5% OAT 92/25.04.23 289,570.00 270,732.00 1.84 EUR 200,000 Gaz Capital SA 2.25% Sen Reg S 17/22.11.24 200,120.00 208,054.00 1.42 EUR 100,000 Glencore Finance Europe Ltd 1.25% EMTN Reg S 15/17.03.21 102,970.00 101,660.00 0.69 EUR 100,000 Hammerson Plc 2% Sen Reg S 14/01.07.22 106,020.00 103,669.50 0.71 EUR 100,000 HeidelbergCem Fin Lux SA 0.5% EMTN Reg S Sen 17/18.01.21 101,160.00 100,857.50 0.69 EUR 100,000 Ingenico Group SA 2.5% 14/20.05.21 106,110.00 104,096.50 0.71 EUR 100,000 Intesa Sanpaolo SpA 1.125% Reg S Sen 15/04.03.22 102,357.66 101,680.00 0.69 EUR 200,000 Ireland 0.8% T-Notes Reg S 15/15.03.22 207,408.00 207,282.00 1.41 EUR 200,000 Ireland 3.9% T-Bonds 13/20.03.23 241,923.00 232,894.00 1.59 EUR 100,000 Ireland 5.9% T-Bond 09/18.10.19 114,210.00 101,940.50 0.69 EUR 100,000 Italia 0.05% Ser 3Y 18/15.04.21 98,890.00 99,701.50 0.68 EUR 100,000 Italia 0.35% T-Bonds Ser 3Y Sen 17/15.06.20 100,356.00 100,372.50 0.68 EUR 100,000 Italia 0.65% T-Bills Sen 16/15.10.23 96,244.35 98,305.50 0.67 EUR 100,000 Italia 4.25% BTP 09/01.03.20 110,592.00 102,886.50 0.70 EUR 100,000 Italia 4.25% BTP 09/01.09.19 108,988.00 100,731.00 0.69 EUR 100,000 Italia 4.75% BTP 11/01.09.21 116,650.00 109,239.00 0.74 EUR 100,000 Italia 5.5% BTP 12/01.11.22 122,525.00 115,008.00 0.78 EUR 100,000 Lagardere SCA 1.625% Sen Reg S 17/21.06.24 99,370.00 100,765.50 0.69 EUR 100,000 Metro AG 1.375% EMTN Sen 14/28.10.21 103,140.00 102,170.00 0.70 EUR 100,000 mFinance France SA 2% EMTN Reg S Ser 5 14/26.11.21 105,924.00 104,446.00 0.71 EUR 100,000 Natwest Markets Plc VAR Sen 09/08.10.19 100,990.00 100,365.50 0.68 EUR 100,000 NET4GAS Sro 2.5% EMTN Reg S Ser 1 14/28.07.21 107,490.00 104,823.00 0.71 EUR 100,000 Netherlands 1.75% Reg S 13/15.07.23 110,700.00 109,849.00 0.75 EUR 100,000 Netherlands 3.25 11/15.07.21 114,355.00 108,174.50 0.74 EUR 100,000 Netherlands 3.5% 10/15.07.20 111,380.00 104,343.50 0.71 EUR 200,000 Oesterreich 3.9% Sen 05/15.07.20 225,892.00 209,413.00 1.43 EUR 100,000 OMV AG 2.625% EMTN Ser 5 Sen Reg S 12/27.09.22 110,610.00 109,394.50 0.75 EUR 100,000 Orange 2.5% EMTN Ser 128 Sen Reg S 12/01.03.23 109,998.00 109,518.50 0.75 EUR 100,000 Origin Energy Finance Ltd 2.5% EMTN Reg S Sen 13/23.10.20 106,910.00 103,368.00 0.70 EUR 100,000 Petroleos Mexicanos 1.875% EMTN Sen 15/21.04.22 99,980.00 96,457.50 0.66 EUR 100,000 Portugal 4.8% Obr Tesouro 10/15.06.20 113,080.00 104,953.00 0.71 EUR 100,000 Portugal 5.65% OT'S 13/15.02.24 121,955.00 127,068.00 0.87 EUR 100,000 Procter & Gamble Co 0.5% Sen 17/25.10.24 99,438.00 102,614.50 0.70 EUR 100,000 Raiffeisen Bank Intl AG 6.625% EMTN Reg S Sub 11/18.05.21 117,200.00 112,152.00 0.76 EUR 100,000 RCI Banque SA FRN EMTN Sen 17/04.11.24 100,060.00 97,109.00 0.66 EUR 100,000 Slovenia 2.125% Ser RS75 Sen Reg S 15/18.07.25 111,435.00 114,278.00 0.78 EUR 100,000 Standard Chartered Plc 3.625% EMTN Sub 12/23.11.22 111,250.00 110,773.00 0.75
Rivertree Fd - Strategic Conservative
Statement of investments and other net assets (in EUR) (continued) as at 30 June 2019
The accompanying notes are an integral part of these financial statements.
49
Currency Number / nominal value
Description Cost Market value % of total net assets
EUR 100,000 Syngenta Finance NV 1.875% EMTN Sen 14/02.11.21 103,030.00 103,197.00 0.70 EUR 100,000 Vestas Wind Systems A/S 2.75% Reg S Sen 15/11.03.22 108,160.00 106,160.00 0.72 EUR 100,000 VGP SA 3.5% Sen Reg S 18/19.03.26 100,125.00 103,724.00 0.71 EUR 100,000 Wendel SE 2.75% Sen 14/02.10.24 110,190.00 110,658.00 0.75
Total bonds 7,437,168.53 7,271,358.50 49.48
Other transferable securities
Bonds
EUR 100,000 De Persgroep NV 2.15% 19/28.06.26 100,000.00 99,966.00 0.68
Total bonds 100,000.00 99,966.00 0.68
Open-ended investment funds
Investment funds (UCITS)
EUR 1,800 AXA IM Fixed Inc Inv Str Europe Short Duration HY B EUR Cap 240,318.00 243,018.00 1.65 EUR 2,500 Muzinich Fds Enhancedyield Short-Term R Hedged EUR Cap 355,067.89 360,175.00 2.45 EUR 1,080 Rivertree Bond Corporate EUR F Cap 693,980.20 712,994.40 4.85 EUR 4 Rivertree Bond EUR Green Bonds I Cap 203,327.60 208,864.60 1.42 EUR 11 Rivertree Bond EUR I Cap 547,764.29 547,537.65 3.73 EUR 550 Rivertree Bond Government EUR F Cap 334,896.50 339,652.50 2.31 EUR 7 Rivertree Equity Fd Income Europe I Cap 351,475.68 365,554.77 2.49 EUR 1 Rivertree Equity Fd Small & Mid Cap Europe I EUR Cap 45,891.35 48,098.21 0.33
2,772,721.51 2,825,895.13 19.23
USD 160 Essential Portfolio Selection US Equity I Cap 718,780.53 781,512.95 5.32 USD 30 Rivertree Equity Fd US Value USD Cap 36,417.33 41,839.29 0.29
755,197.86 823,352.24 5.61
Total investment funds (UCITS) 3,527,919.37 3,649,247.37 24.84
Total tracker funds (UCITS) 865,259.30 880,555.00 5.99
Total investments in securities 12,578,967.22 12,621,641.49 85.89
Cash at banks 1,989,394.97 13.54
Other net assets/(liabilities) 83,686.30 0.57
Total 14,694,722.76 100.00
Rivertree Fd - Strategic Conservative
Industrial and geographical classification of investments as at 30 June 2019
50
Industrial classification
(in percentage of net assets)
Investment funds 30.83 %
Countries and governments 24.61 %
Financials 14.10 %
Energy 5.03 %
Industrials 2.79 %
Cyclical consumer goods 2.08 %
Telecommunications services 1.50 %
Non-cyclical consumer goods 1.40 %
Utilities 1.39 %
International institutions 0.74 %
Real estate 0.71 %
Technologies 0.71 %
Total 85.89 %
Geographical classification
(by domicile of the issuer) (in percentage of net assets)
Luxembourg 25.94 %
France 9.03 %
Germany 8.80 %
Italy 6.40 %
Ireland 6.14 %
Belgium 5.74 %
Jersey 5.59 %
Spain 3.00 %
Austria 2.94 %
The Netherlands 2.90 %
United Kingdom 2.85 %
Portugal 1.58 %
Denmark 1.43 %
Slovenia 0.78 %
Czech Republic 0.71 %
United States of America 0.70 %
Australia 0.70 %
Mexico 0.66 %
Total 85.89 %
Rivertree Fd - 2020 US High Yield
Statement of net assets (in USD) as at 30 June 2019
The accompanying notes are an integral part of these financial statements.
51
Assets Cash at banks 3,699.45
Total assets 3,699.45
Liabilities Expenses payable 3,699.45
Total liabilities 3,699.45
Net assets at the end of the period 0.00
Rivertree Fd - 2020 US High Yield
Statement of operations and other changes in net assets (in USD) from 1 January 2019 to 21 January 2019
The accompanying notes are an integral part of these financial statements.
52
Income Interest on bank accounts 14,833.64 Commissions on subscription and on redemption 7,964.65
Total income 22,798.29
Expenses Aggregated management fee 9,658.22 Depositary fees 1,270.51 Banking charges and other fees 10,651.01 Central administration costs 6,203.55 Professional fees 1,770.97 Other administration costs 7,094.01 Bank interest paid 58.27 Other expenses 10,317.19
Total expenses 47,023.73
Net investment loss -24,225.44
Net realised gain/(loss) - on securities portfolio 34,019.46 - on forward foreign exchange contracts -193,905.52 - on foreign exchange 1,781.29
Realised result -182,330.21
Net variation of the unrealised gain/(loss) - on securities portfolio -21,460.94 - on forward foreign exchange contracts 24,283.09
Result of operations -179,508.06
Subscriptions 14,818.25
Redemptions -36,914,169.41
Total changes in net assets -37,078,859.22
Total net assets at the beginning of the period 37,078,859.22
Total net assets at the end of the period 0.00
Rivertree Fd - 2020 US High Yield
Statistical information (in USD) as at 30 June 2019
The accompanying notes are an integral part of these financial statements.
53
Total net assets Currency 31.12.2017 31.12.2018 30.06.2019
USD 56,925,623.07 37,078,859.22 0.00
Net asset value per share Currency 31.12.2017 31.12.2018 21.01.2019
F Cap USD 556.7300 556.6700 556.4800 (*) F Dis USD 529.1300 505.6900 505.5200 (*) F Cap EUR (hedged) EUR 532.4300 518.2700 517.2200 (*) F Dis EUR (hedged) EUR 507.1900 478.6300 477.6700 (*) F1 Dis EUR (hedged) EUR 503.6400 476.4700 475.5700 (*)
Number of shares outstanding at the
beginning of the period issued redeemed outstanding at the end
of the period
F Cap 10,271.991 - -10,271.991 - F Dis 14,419.300 - -14,419.300 - F Cap EUR (hedged) 6,346.347 25.000 -6,371.347 - F Dis EUR (hedged) 8,535.000 - -8,535.000 - F1 Dis EUR (hedged) 28,719.000 - -28,719.000 -
(*) Net Asset Value used for final redemption.
Rivertree Fd
Notes to the financial statements as at 30 June 2019
54
Note 1 - General information Rivertree Fd (the "Sicav") is an open-ended investment company governed by Luxembourg law with multiple Sub-Funds, incorporated for an unlimited period on 13 December 1996. It was decided to change the name of the Sicav from "KBL EPB Fund" to "Richelieu Fd" and finally to "Rivertree Fd". The Sicav is subject to Part I of the amended Law of 17 December 2010 on Undertakings for Collective Investment ("UCIs") as defined in European Directive 2009/65/EC as amended. The net asset value (NAV) per share, the issue, redemption and conversion price are made public each valuation day at the registered office of the Sicav. The prospectus, the articles of incorporation, the key investor information document (KIID) and the financial reports of the Sicav are freely available to the public at the registered office of the Sicav. The Sicav may be offered for sales in the European Economic Area ("EEA") countries, subject to notification in countries other than the Grand Duchy of Luxembourg. Please note that some Sub-Funds or share classes may not be registered or authorized for distribution in some jurisdictions. Note 2 - Significant accounting policies a) Presentation of the financial statements The financial statements of the Sicav are prepared in accordance with Luxembourg legal and regulatory requirements concerning undertakings for collective investment and with generally accepted accounting principles in Luxembourg. b) Valuation of assets
1) The value of cash in hand or on deposit, securities, bills and notes payable on demand and accounts receivable, prepaid expenses, dividends and interests declared or due but not as yet collected, are made up of the nominal value of such assets, unless it appears unlikely that such value shall be collected, in which case the value is determined by deducting such amount which the Board of Directors of the Sicav may deem necessary in view of reflecting the true value of such assets.
2) The value of any transferable securities or money-market instruments which are officially traded or listed on a stock
exchange is determined on the basis of the closing price on Valuation Day or, failing that, at their last known rate unless such rate is not representative.
3) The valuation of any transferable securities or money-market instruments traded on another regulated market is
determined on the basis of the closing price on the Valuation Day or, failing this, the last available price on the Valuation Day in question.
4) To the extent that the securities and money-market instruments held in portfolio on the Valuation Day are not traded
or listed on a stock exchange or on another regulated market, or if the price determined according to (2) or (3) for securities listed or traded on a stock exchange or on another regulated market is not representative of the real value of these securities and money-market instruments, these are valued on the basis of the probable value of sales, which must be estimated prudently and in good faith by the Board of Directors of the Sicav.
5) Derivatives will be valued at the last known rates on the Valuation Day in question on the stock exchanges or
regulated markets.
6) The valuation of Undertakings for Collective Investment in Transferable Securities ("UCITS") and other Undertakings for Collective Investment ("UCIs") is carried out on the basis of the last net asset value available on the Valuation Day in question of these UCITS and other underlying UCIs.
7) Over-the-counter derivatives, like futures, forward contracts or options not traded on the stock exchange or other
known markets will be valued on the basis of their net asset value determined, pursuant to policy of the Board of
Rivertree Fd
Notes to the financial statements (continued) as at 30 June 2019
55
Directors of the Sicav, according to financial models recognised on the market and in a coherent manner for each category of contract. The net asset value of a derivative must be understood as being equal to the unrealised (net) profit/loss for the position in question.
8) If, as a result of particular circumstances, a valuation made on the basis of the above rules should become
impracticable or inaccurate, other generally accepted and verifiable valuation criteria shall be applied to obtain a fair valuation.
c) Acquisition cost of securities in the portfolio The acquisition cost of the securities held by each Sub-Fund that are denominated in currencies other than the reference currency of the Sub-Fund is converted into this currency at the exchange rate prevailing on the date of purchase. d) Net realised gain (loss) on securities-portfolio The realised gains and losses on securities portfolio are calculated on the basis of the average acquisition cost and are disclosed net in the statement of operations and other changes in net assets. e) Investment portfolio income Dividend income is recorded at the ex-date, net of any withholding tax. Interest income accrued is recorded, net of any withholding tax. f) Valuation of forward foreign exchange contracts Forward foreign exchange contracts are valued at forward market rates for the remaining period from valuation date to the maturity of the contracts. Net unrealised gains or losses are disclosed in the statement of net assets. Net variation of the unrealised gains or losses and net realised gains or losses are disclosed in the statement of operations and other changes in net assets. g) Valuation of futures contracts Open futures contracts are valued at the last settlement or close price on the stock exchanges or regulated markets. Unrealised gains or losses of open contracts are disclosed in the statement of net assets. Net variation of the unrealised gains or losses and net realised gains or losses are disclosed in the statement of operations and other changes in net assets. h) Formation expenses Formation expenses were amortised on a straight-line basis over a period of five years. Costs relating to the opening of later Sub-Funds will be paid by the new Sub-Fund and written off over five years. i) Conversion of foreign currencies Cash at banks, other net assets, liabilities and the market value of the securities in portfolio expressed in currencies other than the reference currency of the Sub-Fund are converted into this currency at the exchange rate prevailing on the date of the financial statements. Income and expenses expressed in currencies other than the reference currency of the Sub-Fund are converted into this currency at the exchange rate prevailing on the date of the transaction. Net realised gains or losses on foreign exchange are disclosed in the statement of operations and other changes in net assets. j) Combined financial statements The combined financial statements of the Sicav are expressed in EUR and are equal to the corresponding items in the financial statements of the Sub-Fund converted into this currency at the exchange rates prevailing at the date of the financial statements.
Rivertree Fd
Notes to the financial statements (continued) as at 30 June 2019
56
At the date of the financial statements, the exchange rate used for the combined financial statements is the following:
1 EUR = 1.1387000 USD US Dollar k) Revaluation difference The item "Revaluation difference" in the combined statement of operations and other changes in net assets represents the valuation difference of the net asset of the Sub-Fund at the beginning of the year with the exchange rate applicable at the date of the financial statements. l) Transaction fees Transaction costs disclosed under the item "Transaction fees" in the expenses of the statement of operations and other changes in net assets are mainly composed of broker fees incurred by the Sicav and of fees relating to liquidation of transactions paid to the depositary as well as of transaction fees on financial instruments and derivatives and of fees relating to term deposits. Note 3 - Aggregated management fee KREDIETRUST LUXEMBOURG S.A. has been appointed by the Sicav's Board of Directors as a Management Company and is approved as a Management Company in accordance with the provisions of Chapter 15 of the amended Law of 17 December 2010. The management fee ("aggregate management fee") is used to remunerate: (a) the Management Company receiving a fee of 0.03 % of the average net assets plus a fixed annual amount of EUR 10,000.00 for all Sub-Funds except Rivertree Fd - Flagship for which the fee amounts to an annual amount of EUR 10,000.00 payable quarterly. (b) asset managers receiving an annual fee calculated on the average net assets of the Sub-Funds and payable quarterly at the effective rates of:
Sub-Funds Shares classes Effective rate
Rivertree Fd - Bond Euro Short Term
I Cap and I Dis 0.15 %
F Cap and F Dis
Net assets : EUR 0-50 million 0.25 % EUR 50-100 million 0.225 % EUR 100-200 million 0.20 % EUR >200 million 0.15 %
Rivertree Fd - Flagship
R Cap and R Dis 1.50 %
F Cap and F Dis 1.00 %
F1 Cap and F1 Dis 0.60 %
Rivertree Fd - Strategic Defensive
F Cap (restricted) and F Dis (restricted) 1.00 %
F1 Cap (restricted) and F1 Dis (restricted) 0.80 %
I Cap (restricted) and I Dis (restricted) 0.40 %
F2 Cap (restricted) and F2 Dis (restricted) 0.65 %
F3 Cap (restricted) and F3 Dis (restricted) 0.55 %
F4 Cap (restricted) and F4 Dis (restricted) 0.45 %
P Dis (restricted) 0.40 %
Rivertree Fd
Notes to the financial statements (continued) as at 30 June 2019
57
Sub-Funds Shares classes Effective rate
Rivertree Fd - Strategic Balanced
F Cap (restricted) and F Dis (restricted) 1.25 %
I Cap (restricted) and I Dis (restricted) 0.45 %
F1 Cap (restricted) and F1 Dis (restricted) 1.00 %
F2 Cap (restricted) and F2 Dis (restricted) 0.80 %
F3 Cap (restricted) and F3 Dis (restricted) 0.60 %
F4 Cap (restricted) and F4 Dis (restricted) 0.50 %
P Dis (restricted) 0.45 %
Rivertree Fd - Strategic Dynamic
F Cap (restricted) and F Dis (restricted) 1.25 %
I Cap (restricted) and I Dis (restricted) 0.45 %
F1 Cap (restricted) and F1 Dis (restricted) 1.00 %
F2 Cap (restricted) and F2 Dis (restricted) 0.80 %
F3 Cap (restricted) and F3 Dis (restricted) 0.60 %
F4 Cap (restricted) and F4 Dis (restricted) 0.50 %
F Dis (restricted) 0.45 %
Rivertree Fd - Strategic Conservative
F Cap (restricted) and F Dis (restricted) 0.65 %
F2 Cap (restricted) and F2 Dis (restricted) 0.50 %
I Dis (restricted) and I Cap (restricted) 0.40 %
Rivertree Fd - 2020 US High Yield (liquidated since 21 January 2019)
F Cap, F Dis, F Cap EUR (hedged) and F Dis EUR (hedged)
0.50 %
F1 Dis EUR (hedged) 0.25 %
These fees are recorded under the item "Aggregated management fee" in the statement of operations and other changes in net assets. A management agreement has been concluded between the Sicav, the Management Company and Puilaetco Dewaay Private Bankers S.A., as co-manager of the Sub-Funds Rivertree Fd - Strategic Defensive, Rivertree Fd - Strategic Balanced, Rivertree Fd - Strategic Dynamic, Rivertree Fd - Flagship and Rivertree Fd - Strategic Conservative. The Management Company retrocedes 50 % of the commission described above to Puilaetco Dewaay Private Bankers S.A. with the exception of the Sub-Fund Rivertree Fd - Flagship for which Puilaetco Dewaay Private Bankers S.A. receives 90 % of the commission described above. A management agreement has been concluded between the Sicav, the Management Company and KBL Richelieu Gestion, as manager of the Sub-Fund Rivertree Fd - Bond Euro Short Term. The Management Company retrocedes 50 % of the commission described above to KBL Richelieu Gestion. Note 4 - Management fees of target funds The management fee of target funds in which the Sub-Funds Rivertree Fd - Flagship, Rivertree Fd - Strategic Defensive, Rivertree Fd - Strategic Balanced, Rivertree Fd - Strategic Dynamic and Rivertree Fd - Strategic Conservative invests rises to maximum 5 % p.a., calculated on the net assets invested in the target funds.
Rivertree Fd
Notes to the financial statements (continued) as at 30 June 2019
58
Note 5 - Management fee retrocession Taking into account the regulations on the retrocession of management fees in certain Sicav registration countries, these must now be credited directly to the SICAV's accounts. Management fee retrocessions received by the Sicav and related to its investments in UCITS or other UCIs in the Sub-Funds Rivertree Fd - Strategic Defensive, Rivertree Fd - Strategic Balanced, Rivertree Fd - Strategic Dynamic and Rivertree Fd - Strategic Conservative are disclosed under the item "Other commissions received" in the statement of operations and other changes in net assets. Note 6 - Commission on share issues, redemptions and conversions Issue, redemption and conversion fees are recorded under the item "Commissions on subscription and on redemption" in the statement of operations and other changes in net assets. Note 7 - Central administration costs The item "Central administration costs" disclosed in the statement of operations and other changes in net assets is mainly composed of administrative agent and shareholders servicing fees. Note 8 - Subscription duty ("taxe d’abonnement") The Sicav is governed by Luxembourg law. Pursuant to the legislation and regulations in force, the Sicav is subject to an annual subscription duty "taxe d’abonnement" of 0.05 % which is payable quarterly and calculated on the basis of the net assets of each Sub-Fund on the last day of each quarter. Pursuant to Article 175 (a) of the amended Law of 17 December 2010, the net assets invested in undertakings for collective investment already subject to the "taxe d’abonnement" are exempt from this tax. The share classes I reserved for institutional investors Sub-Fund have a reduced subscription duty of 0.01 %, in accordance with Article 174 (2) of the amended Law of 17 December 2010. Note 9 - Futures contracts As at 30 June 2019 the following Sub-Funds are committed in the following futures contracts with KBL EUROPEAN PRIVATE BANKERS S.A :
Rivertree Fd - Strategic Defensive
Number of contracts
Denomination
Currency
Exposure (in EUR)
Unrealised result
(in EUR)
Sale 125 Euro Stoxx 50 EUR (Price) Index FUT 09/19 EUX
EUR -4,332,500.00 -8,750.00
-8,750.00
Rivertree Fd - Strategic Balanced
Number of contracts
Denomination
Currency
Exposure (in EUR)
Unrealised result
(in EUR)
Sale 230 Euro Stoxx 50 EUR (Price) Index FUT 09/19 EUX
EUR -7,971,800.00 -16,100.00
-16,100.00
Rivertree Fd
Notes to the financial statements (continued) as at 30 June 2019
59
Note 10 - Total Expense Ratio ("TER") The TER disclosed under "Statistical information" of this report is calculated in accordance with the "Guidelines on the calculation and disclosure of the TER of collective investment schemes" issued by the Swiss Funds & Asset Management Association "SFAMA" on 16 May 2008 as modified on 20 April 2015. The TER is calculated for the last 12 months preceding the date of the financial statements. Transaction fees are not taken into account in the calculation of the TER. If a fund invests at least 10 % of its assets in other funds which publish a TER, a synthetic TER of the fund of funds is calculated as of the closing date of the financial year or the end of the first half of the financial year. This corresponds to the sum of the prorated TER of the individual target fund, weighted on the basis of their proportion in the net fund assets of the fund at the closing date, the issue and redemption commissions of the target funds actually paid and the TER of the fund of funds minus the retrocessions received from the target funds during the reporting period. The synthetic TER is calculated with the information available at the time of the establishment of this document. Note 11 - Fees and charges The Sub-Funds Rivertree Fd - Flagship, Rivertree Fd - Strategic Defensive, Rivertree Fd - Strategic Balanced, Rivertree Fd - Strategic Dynamic and Rivertree Fd - Strategic Conservative invest mainly in shares or units of UCITS and/or UCIs and that this results in a doubling of the management fee. The maximum total management fee shall not exceed 5 %. No issuing, acquisition, redemption or conversion commission is charged to the Sicav when it is invested in shares/units of another UCITS and/or UCI managed directly or indirectly by the Management Company KREDIETRUST LUXEMBOURG S.A. or managed by a company to which the Management Company is linked as part of a management or control community. Note 12 - Cross investments Pursuant to Article 181 (8) of the amended Law of 17 December 2010 relating to Undertakings for Collective Investment, the following Sub-Funds invested in the Sub-Funds as described below as at 30 June 2019 :
Sub-Funds Description Currency Quantity Market Value % of Net Assets
Rivertree Fd -Flagship Rivertree Fd - Bond Euro Short Term I
Cap EUR 1,827 933,322.95 1.24
Rivertree Fd -Strategic Defensive
Rivertree Fd - Bond Euro Short Term I Cap
EUR 6,729 3,437.778.81 1.08
Rivertree Fd -Strategic Balanced
Rivertree Fd - Bond Euro Short Term I Cap
EUR 11,236 5,740.360.04 1.03
Rivertree Fd -Strategic Dynamic
Rivertree Fd - Bond Euro Short Term I Cap
EUR 3,562 1,819.790.18 1.42
The combined statement of net assets has not been adjusted to remove the impact of the above. The commissions on share issues and redemptions detailed in note 6 and the aggregated management fee detailed in note 3 are not applied to these assets. Note 13 - Changes in the composition of the securities portfolio A copy of the changes in the composition of the securities portfolio for the reference period of the financial statements may be obtained free of charge from the Sicav's registered office.
Rivertree Fd
Notes to the financial statements (continued) as at 30 June 2019
60
Note 14 - Events The Sicav's Board of Directors decided with effect from 21 January 2019 to liquidate the Sub-Fund Rivertree Fd - 2020 US High Yield. The Sicav's Board of Directors has decided to merge b yabsorption the Sub-Fund Private Placement Fund - Balanced Portfolio (SICAV Part II of the amended Law of 17 December 2010 and qualifying as an alternative investment fund) in the Sub-Fund Rivertree Fd - Strategic Defensive with effect from 15 March 2019.
Rivertree Fd
Additional information as at 30 June 2019
61
Information on the transparency of securities financing transactions and the reuse of cash collateral (EU Regulation 2015/2365, hereinafter referred to as "SFTR") During the reporting period, the Sicav did not engage in transactions which are subject to the publication requirements of SFTR. Accordingly, no information concerning the transparency of securities financing transactions and of reuse of cash collateral should be reported.