18
RJMCHN Mission
| Date post: | 14-Mar-2018 |
| Category: |
Documents |
| Upload: | nguyenhuong |
| View: | 216 times |
| Download: | 1 times |

RJM
CH
N M
issi
on

Maternal and Child health
4

Health is one of the indicators that measures human development. Maharashtra has
created extensive health-related infrastructural facilities, has trained health personnel
and is generally considered to be above the national average.
The levels and trends of health status in Maharashtra are reflected in infant mortality
and life expectancy at birth, which has shown substantial improvement over the years
and are better than a number of states in India. However, there are marked inter-district
variations in health achievements and some of the districts are comparable to the
worst-placed states of the country.
Public expenditure on health and family welfare in Maharashtra is relatively low in
comparison to the GSDP of the state. States like Kerala and Tamil Nadu, which have
lower GSDP than Maharashtra, spend more on health and family welfare both in per
capita terms as well as a share of GSDP.
42 | MATERNAL AND CHILD HEALTH
Overview
Evel
et S
eque
ria

Government health infrastructure (March,2010) Human resources in government health facilities (March,2010)
• Overall 22% posts are vacant and vacancies are higher for posts like medical officers
and specialists
• There are 1,03,975 Allopathic, 16,636 Dental Surgeons and 1,22,451 AYUSH doctors
are registered in Maharashtra
Source: Health Status, Maharashtra, 2010,SHSRC,Maharashtra
Source: Health Status,Maharashtra,2010, SHSRC, Maharashtra and Rural health statistics, 2010, MoHFW
Type of institution
Number of health institutions
Bed strength
Average population covered (Rural population 2001)
Building required to constructed
Shortfall of facilities
State level Hospitals
498 NA - - -
District Hospitals
23 6,085 - - -
Sub District Hospitals with capacity of
a) 50 beds 56 2,800 - - -
b)100 beds 23 2,300 - - -
c)200 beds 3 600 - - -
Rural Hospitals (CHCs)
386 11,280 1,52,815 28 131
Primary Health Centres
1,816 1,816 30,715 146 168
Other hospitals 253 7,135 - - -
Sub Centres 10,580 - 5,272 2,238 1,573
Category of post Sanctioned Filled Percentage of filled post to total sanctioned post
Class-1 Specialists 519 389 75.0
Medical officer Grade A and B
9,025 7,068 78.3
Nursing post 24,114 22,018 91.3
Health Assistants 4,600 3,609 78.5
Multipurpose Health Worker (Male)
12,210 9,596 78.6
Lady Health Visitors (LHV) 2,172 1,918 88.3
Multipurpose Health Worker (Female)/ANM
12,592 12,114 96.2
Pada Swayamsevak 11,482 8,130 70.8
ANM/LHV/Staff nurse under NRHM
15,226 8,598 56.5
Posts under RCH-2 in urban area
2,799 766 27.4
Total 94,739 74,206 78.3
MATERNAL AND CHILD HEALTH | 43

Crude Birth Rate34 (CBR) Crude Death Rate35 (CDR)
• As per Sample Registration System (SRS) estimations, Crude Birth Rate (CBR) for
Maharashtra was 26.3 in 1990 and decreased sharply to 17.6 in 2009. Birth rate was
slightly higher in rural areas (18.1) compared to urban areas (16.9)
• CBR for Maharashtra is very low compared to the national level (22.5). Among bigger
states, only four - Kerala , Punjab, Tamil Nadu and West Bengal have a CBR lower than
Maharashtra
• The state health department estimated CBR at 17.3 through Survey of Causes of
Deaths (SCD) for 2009 in rural areas, which is slightly lesser than the SRS estimation.
CBR varied across districts and was lowest in Sindhudurg district (12.2) and highest in
Nandurbar district (21.1)
• While CBR is less than 15 in seven districts (Amravati, Chandrapur, Gondiya, Kolhapur,
Ratnagiri, Sindhudurg and Wardha), it is higher than 20 in three districts (Jalna,
Nandurbar and Thane)
• As per SRS estimations, Crude Death Rate (CDR) for Maharashtra was 7.8 in 1990 and
decreased sharply to 6.7 in 2009. Death rate is very high in rural areas (7.6) compared
to urban areas (5.5)
• CDR for Maharashtra is very low compared to the national level (7.8). Among bigger
states, only five -Delhi , Punjab, Haryana, Jammu & Kashmir and West Bengal have
CDRs lower than Maharashtra
• The state health department estimated CDR at 6.6 for 2009 in rural areas, which
is lesser than SRS estimations. CDR varied across districts and is lowest in Hingoli
district (4.9) and highest in Sindhudurg district (10.0)
• It is interesting to note that lowest crude birth rate and highest crude death rate in the
state is in Sindhudurg district
• While CDR is less than 5.5 in three districts (Ahmadnagar, Hingoli and Thane), it is
higher than 8 in five districts (Gadchiroli, Ratnagiri, Satara, Sindhudurg and Wardha)
Source: SRS, 2009, RGI, Government of India and Health status, Maharashtra, 2010, Survey of Causes of Deaths Scheme (Rural), State Bureau of Health Intelligence and Vital Statistics, Pune, Annual Report, 2009
Source: SRS, 2009, RGI, Government of India and Health status, Maharashtra, 2010, Survey of Causes of Deaths Scheme (Rural), State Bureau of Health Intelligence and Vital Statistics, Pune, Annual Report, 2009
44 | MATERNAL AND CHILD HEALTH

Total Fertility Rate 36 (TFR), Maharashtra Total Fertility Rate (TFR), rural areas, by districts, Maharashtra, 2009
• According to Sample Registration System (SRS)37, Total Fertility Rate (TFR) for
Maharashtra is 1.9, which is below the replacement level, and lower than the national
average (2.6). Among bigger states, only two, Kerala and Tamil Nadu, have lower TFR
than Maharashtra and four others, Andhra Pradesh, Himachal Pradesh, Punjab and
West Bengal, are at the same level.
• TFR in urban areas (1.8) is significantly lower than rural areas (2.1).
• Maharashtra has achieved the TFR target set for the Eleventh Five Year Plan (1.9) and
National Population Policy, 2000 (2.0).
• The state Health department estimated TFR at 2.14 through SCD for yars 2009 in rural
areas, which is slightly higher than SRS estimations
• There is a significant disparity in TFRs across the districts, specially between
Aurangabad and Konkan division
Source: Compendium of India’s fertility and mortality indicators, 1971-2007 based on SRS, RGI, Govt. of India, 2009
Source: Survey of Causes of Deaths scheme (Rural), State Bureau of Health Intelligence and Vital Statistics, Pune, Annual Report, 2009
State average: 2.14
Highest: 2.67 Jalna
Lowest: 1.59 Chandrapur
Index
Not available
Less than 1.90
19.91-2.10
2.11-2.30
More than 2.30
No. of districts
02
07
09
06
11
MATERNAL AND CHILD HEALTH | 45

Life expectancy at birth38, Maharashtra Trends in Maharashtra’s Infant Mortality Rate 39 (IMR)
• Life expectancy at birth (LEB) for Maharashtra is 67.2 years and is higher than the
national average (63.5 years). Among bigger states, only Kerala and Punjab, have a
higher LEB than Maharashtra.
• LEB was only 53.8 years during 1970-75 and reached 62.6 years in 1986-90. It
reached 67.2 years in 2002-06 and has increased by 6 to 7 years during last 20 years.
• Female LEB is higher (2.4 years ) than male LEB and difference in female and male
LEB is steady in last 20 years.
• Urban LEB is significantly higher (5.9 years) than rural areas and difference in urban
and rural LEBs has slightly increased in the last 20 years.
• Maharashtra’s Infant Mortality Rate (IMR) has decreased by 17 points between 2000
and 2009.
• The state is far from achieving the Eleventh Five Year Plan target (17).
Source: Compendium of India’s fertility and mortality indicators,1971-2007 based on SRS, RGI, Govt. of India, 2009
Source: SRS, RGI ,Government of India
46 | MATERNAL AND CHILD HEALTH

State -wise comparison of IMR, 2009 IMR by sex and area, Maharashtra, 2009
Maharashtra’s rank with reference to IMR
Maharashtra’s IMR is very low compared to the national average. Among bigger states,
only Kerala and Tamil Nadu have an IMR lower than Maharashtra.
• While the difference between rural and urban IMRs at the national level is 21 points,
it is only 15 points in Maharashtra.
• While the difference between male and female IMRs at the national level is 3 points,
in Maharashtra it is 5 points.
Source: SRS, RGI , Government of India, 2011
Source: SRS, RGI, Government of India, 2011
Group All states and UTs (35)
In bigger states (19)
Total 11 3
Male 10 3
Female 12 3
Rural 15 4
Urban 10 2
National average: 50
Lowest: 11 (Goa) and 12 (Kerala)
Maharashtra: 31
Highest: 67 (Madhya Pradesh)
Index
Less than 27 11-27
28-35 28-35
36-50 36-50
More than Indian
average (50) 51-67
No. of districts
09
07
10
09
MATERNAL AND CHILD HEALTH | 47

IMR, rural areas by districts, 2009 How many infant deaths do we need to prevent in Maharashtra?
Total number of ANC cases registered : 21,87,903
Total number of projected live births : 20,12,871
Source: Calculation based on IMR, 2009, SRS for year 2009
(Source : Health department, GoM)
• In 2009, as per the state Health department estimations Maharashtra’s IMR was 29
through SCD for year 2009 in rural areas, while as per the SRS estimations it was 37.
• Special attention is required in 5 districts where IMR is more than 35.
We have to save lives of more than 28,000 infants in a year,
which is 45% of current infant deaths
Source: Survey of Causes of Deaths scheme (Rural), State Bureau of Health Intelligence and Vital Statistics, Pune, Annual Report, 2009
Low performing five districts-
Wardha: 44
Washim, Yavatmal and Bhandara: 37
Nandurbar: 36
48 | MATERNAL AND CHILD HEALTH
Number of infant deaths as per current IMR
Number of infant deaths if IMR is 17 as per the XI Five Year Plan target
Number of infant deaths to be prevented
In a year 62,399 34,219 28,180
In a month 5,200 2,852 2,348
In a day 171 94 77
State average: 29
High performing three districts-
Sangli: 16
Kolhapur: 19
Chandrapur: 21
Index
Not available
25 or Less than 25
26-30
31-35
More than 35
No. of districts
02
11
07
10
05

Under-five mortality rate40, 2009 Share of under-five mortality rate, 2009
Source: SRS, RGI , Government of India, 2009
• Under-five mortality rate (U5MR) of Maharashtra is very low compared to the national
average.
• While the difference between rural and urban U5MRs at the national level is 30
points, in Maharashtra it is only 17 points.
• While the difference between male and female USMRs at the national level is 9
points, in Maharashtra it is 8 points.
Source : SRS Statistical report , RGI , New Delhi, 2009
65.6 % under-five deaths occur within first four weeks of birth
Infant deaths within 7 days of birthNeonatal deaths
65.6%Infant deaths
84.8%
54.6%
11.0%
19.2%
19.2%
Infant deaths between 7 days of birth and within 29 days
Infant deaths between 29 days and within one year of birth
Child deaths between one year and within five years of birth
MATERNAL AND CHILD HEALTH | 49
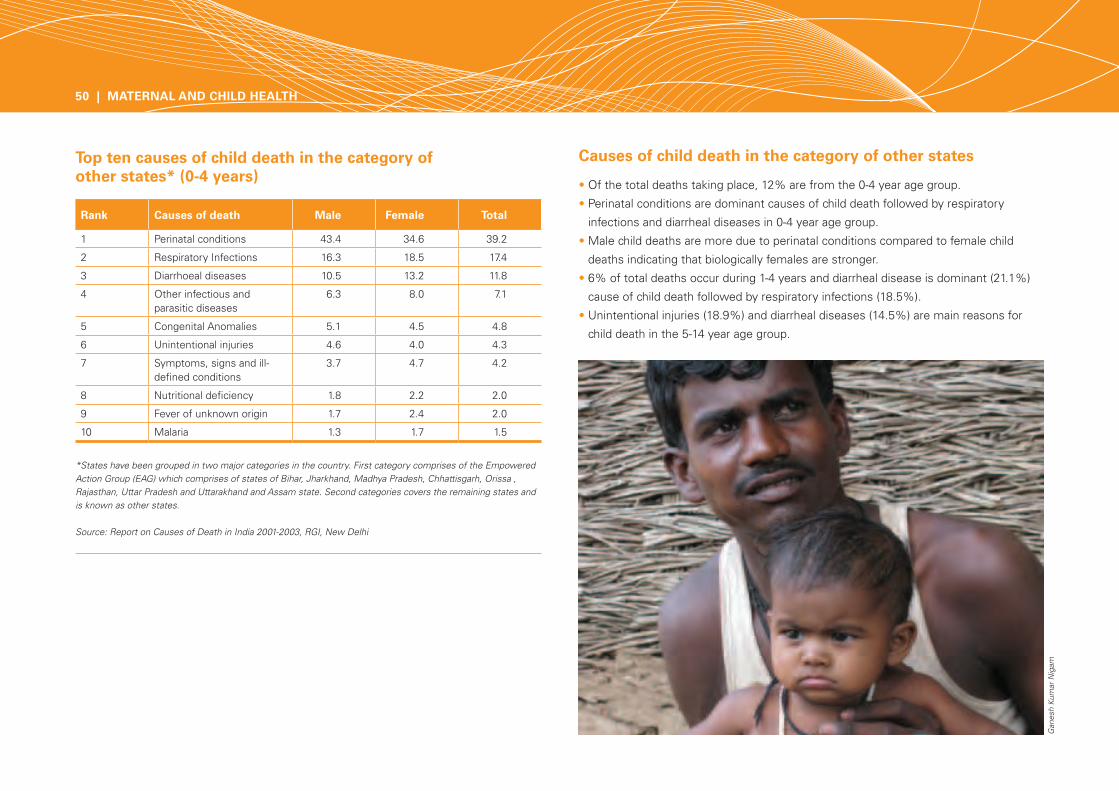
Top ten causes of child death in the category of other states* (0-4 years)
Causes of child death in the category of other states
*States have been grouped in two major categories in the country. First category comprises of the Empowered Action Group (EAG) which comprises of states of Bihar, Jharkhand, Madhya Pradesh, Chhattisgarh, Orissa , Rajasthan, Uttar Pradesh and Uttarakhand and Assam state. Second categories covers the remaining states and is known as other states.
Source: Report on Causes of Death in India 2001-2003, RGI, New Delhi
• Of the total deaths taking place, 12% are from the 0-4 year age group.
• Perinatal conditions are dominant causes of child death followed by respiratory
infections and diarrheal diseases in 0-4 year age group.
• Male child deaths are more due to perinatal conditions compared to female child
deaths indicating that biologically females are stronger.
• 6% of total deaths occur during 1-4 years and diarrheal disease is dominant (21.1%)
cause of child death followed by respiratory infections (18.5%).
• Unintentional injuries (18.9%) and diarrheal diseases (14.5%) are main reasons for
child death in the 5-14 year age group.
50 | MATERNAL AND CHILD HEALTH
Rank Causes of death Male Female Total
1 Perinatal conditions 43.4 34.6 39.2
2 Respiratory Infections 16.3 18.5 17.4
3 Diarrhoeal diseases 10.5 13.2 11.8
4 Other infectious and parasitic diseases
6.3 8.0 7.1
5 Congenital Anomalies 5.1 4.5 4.8
6 Unintentional injuries 4.6 4.0 4.3
7 Symptoms, signs and ill-defined conditions
3.7 4.7 4.2
8 Nutritional deficiency 1.8 2.2 2.0
9 Fever of unknown origin 1.7 2.4 2.0
10 Malaria 1.3 1.7 1.5
Gan
esh
Kum
ar N
igam

Trends in Maternal Mortality Ratio41 (MMR), India and Maharashtra
Source: Family Statistics in India, 2009,MOHFW, 2009 and SRS special bulletin, 2011, RGI, New Delhi
• MMR has reduced sharply both at the national and state levels. Maharashtra’s MMR
is very low compared to the national level. Only two other states, Kerala and Tamil
Nadu have MMRs lower than Maharashtra
• Sharpest decrease in MMR (26 points) was between 2004-06 and 2007-09
• Maharashtra’s MMR is close to the target set for the Eleventh Five Year Plan (100)
Gan
esh
Kum
ar N
igam
MATERNAL AND CHILD HEALTH | 51

Percentage of girls marrying before 18 years of age, 2007-08
Adolescent girls Birth order 3 or more, 2007-08
Percentage of births to women during age 15-19 years out of total births, 2007-08
Source: DLHS,2007-08
Source: DLHS, 2007-08
• 26.1% girls 15-19 year age group and
0.7 % girls in 10-14 age group are
married.
• 17.6% girls are married below the legally
permissible age and wide disparities
exist between Nagpur/Konkan and
Nashik/Aurangabad divisions.
• Percentage of births to women during
15-19 year age group is 9.7% and varies
across districts. Wide disparities exist
between Nagpur/Konkan and Nashik/
Aurangabad divisions.
• Percentage of births to women during
15-19 years to total births is highly
significant to percentage girls marrying
before 18 years.
• Birth order 3 or more is very high in ST social group and lowest wealth index.
• Some districts of Aurangabad and Nashik divisions and tribal districts (Nandurbar,
Gadchiroli ) have high level of birth order 3 or more.
(U- Urban, R-Rural, SC- Schedule Caste, ST-Schedule Tribe, OBC- Other Backward Community, L- Lowest wealth quintile, H- Highest wealth quintile)
52 | MATERNAL AND CHILD HEALTH
Index
Less than 10%
10-15%
15-20%
More than 20%
No. of districts
13
05
04
13
Index
Less than 10%
10-17.5%
17.5-25%
More than 25%
No. of districts
09
08
08
10
Index
Less than 20%
20-25%
25-30%
More than 30%
No. of districts
08
11
08
08

Adolescent Girls: Percentage of women 15-19 years , who have begun childbearing (teenage pregnancy)
Couple Protection Rate42 (CPR), 2007-08
Source: NFHS, 2005-06
Source: DLHS,2007-08
13.8% girls in the age group of 15-19 years have begun child bearing and incidence is
significantly higher in girls belonging to rural areas, SC and ST social groups and lowest
wealth index group.
• CPR is low among ST social group and lowest wealth index group.
• Some districts of Aurangabad division and tribal districts (Nandurbar, Gadchiroli and
Thane) have low CPR.
Index
Less than 60%
60-65%
65-70%
More than 70%
No. of districts
08
08
09
10
MATERNAL AND CHILD HEALTH | 53

• Antenatal Care (ANC) registration within first trimester is low among ST social group
and lowest wealth index group.
• Some districts of Aurangabad and Nashik divisions and tribal districts (Nandurbar,
Gadchiroli ) have low level of ANC registration.
• Only 43.8% women used Government ANC checkup facilities in the state. However,
in Gadchiroli and Gondiya districts more than 70% women used Government ANC
check up facilities.
• Three ANC checkups are lower in rural areas, ST social group and lowest wealth index
group.
• Almost all districts of Aurangabad and Nashik divisions have had less than 70%
women going for three ANC checkups and these figures compare very low to those
from districts of Pune and Konkan divisions.
• Only 33.9% women, who had live birth, received full ANC checkups (At least three
visits for Antenatal Check-up, at least one Tetanus Toxoid (TT) injection received and
100+ Iron Folic Acid (IFA) tablets/ syrup consumed).
ANC registration in first trimester, 2007-08 Three ANC checkups, 2007-08
54 | MATERNAL AND CHILD HEALTH
Source: DLHS, 2007-08Source: DLHS, 2007-08
Index
Less than 60%
60-65%
65-75%
More than 75%
No. of districts
09
09
12
05
Index
Less than 70%
70-80%
80-90%
More than 90%
No. of districts
11
07
13
04

• Percentage of safe delivery is low in rural areas, ST social group and lowest wealth
index group. Compared to districts from Pune and Konkan divisions where safe
delivery percentages are high, some districts of Amravati, Nashik and Nagpur
divisions have less than 70% safe deliveries.
• Substantial differences were observed in mean delivery cost in Government (Rs.
1,690) and private facility (Rs. 6,282).
• 75.5% mothers in Mahararshatra have had a postnatal checkup done within two days
of childbirth. This percentage is low in rural areas, ST social group and lowest wealth
index group.
• Less than 65% women in three tribal districts of Nandurbar, Gadchiroli and Dhule
have had postnatal checkups done within two days of childbirth.
• Disparities exist between districts of Pune/Konkan divisions and Aurangabad,
Amravati and Nashik divisions.
Percentage of safe delivery43, 2007-08 Postnatal check up within two days of delivery, 2007-08
Source: DLHS, 2007-08
Index
Less than 70%
70-75%
75-80%
More than 80%
No. of districts
13
08
05
09
Index
Less than 65%
65-75%
75-85%
More than 85%
No. of districts
03
10
13
09
Source: DLHS, 2007-08
MATERNAL AND CHILD HEALTH | 55

• 69% children are fully immunized. While no significant difference exist across the
areas and sex, differences are significant among social groups and wealth index
groups.
• Percentage of fully immunized children is significantly low in Nashik division and
Gadchiroli district.
• Highest dropout (17%) is between BCG and DPT-3 vaccination.
• 86% children got vaccinated at Government health facilities.
All basic vaccinations (full immunization44), 2007-08
Diarrhoea
Childhood diseases, 2007-08
Acute Respiratory Infection (ARI)
56 | MATERNAL AND CHILD HEALTH
Source: DLHS, 2007-08
Source: DLHS, 2007-08
Index
Less than 60%
60-70%
70-80%
More than 80%
No. of districts
05
07
12
11
Index
Less than 15%
15-25%
25-30%
More than 30%
No. of districts
10
10
08
07
Index
Less than 10%
10-12.5%
12.5-15%
More than 15%
No. of districts
13
08
08
06

Source: National Health Accounts INDIA, 2004-05, MOHFW
Expenditure in health, Public and private, 2004-05
• 44.2% children suffering from diarrhoea were given ORS.
• Disparities exist between Konkan /Pune divisions and other divisions with reference
to childhood diseases.
• It is estimated that in the Health sector, the share of private expenditure is 83% of
the total expenditure in Maharashtra and it is higher as compared to the national
average (78%).
• Per capita private expenditure is five times more than per capita public expenditure.
• Per capita public expenditure in Maharashtra is lower than the national average.
• In fact Maharashtra’s per capita expenditure is lower than Punjab, Himachal Pradesh,
Karnataka, Kerala and Tamil Nadu.
Source: National Health Accounts INDIA, 2004-05,MoHFW and Budget estimates 2011-12
* Revised, $Estimated
Trends in budget provisions for health, Government of Maharashtra
• Maharashtra’s expenditure on health has varied across the years and it has been
very low compared to many other states like Gujarat, Tamil Nadu, Kerala, Karnataka
and West Bengal. However, the state’s Health budget in absolute terms has more
than doubled from Rs. 2318.70 crore in 2005-06 and to Rs. 4863.73 crore for 2011-12
(estimated).
Diarrhoea ARI
Women with knowledge of the disease 75.0% 28.9%
Children suffering from 19.9% 12.9%
Children who sought advice/treatment 77.9% 84.6%
MATERNAL AND CHILD HEALTH | 57


![(Three Years Degree Course) Prepared by BOS Computer Science · [B.Sc. (Computer Science) Sem. - III & IV CBCS, Gondwana University, Gadchiroli] Page 1 Gondwana University, Gadchiroli](https://static.documents.pub/doc/80x56/60201aa9dedbe66feb3812b6/three-years-degree-course-prepared-by-bos-computer-science-bsc-computer-science.jpg)


