June 2011 MonetaryTrends Views expressed do not necessarily reflect official positions of the Federal Reserve System. T he value of the Chinese renminbi (RMB) has increased more than 21 percent against the U.S. dollar since 2005 (see the chart). This would be good news for the United States if increased costs of Chinese imports (as a result of the appre- ciated RMB) made U.S. consumers purchase fewer Chinese goods and reduced its trade deficit with China. However, U.S. imports from China have been increasing. Between 1999 and 2010, the share of Chinese goods among total U.S. imports has increased from 6.9 percent to 16.1 percent, and the share of Chinese imports among total U.S. consumer expenditures has increased from 1.3 percent to 3.6 percent. Furthermore, the U.S. trade deficit with China increased from $67 billion to $263 billion between 1999 and 2010, a fourfold increase. Some critics believe that the rising trade deficit has hurt the U.S. labor market and economic growth (i.e., by exporting U.S. manufacturing jobs to China) and was caused primarily by an under- valued RMB relative to the dollar. In response, some politicians and economists have recommended a 25 to 40 percent tariff on Chinese imports to correct the trade imbalance. 1 China has allowed the RMB to appreciate gradually since 2005 because of international pressures. Nevertheless, since then U.S. trade deficits with China have still continued to increase. As of 2010, China is the second- largest trading partner (country) of the United States, next to Canada. What does RMB appreciation imply for the U.S. economy? Because it is so much cheaper to produce goods in China than in the United States, Chinese-made goods cannot be easily substi- tuted with American-made goods over the medium term. Hence, RMB appreciation would increase import prices without bringing many job opportunities back to the United States. Fair (2010) estimates the macroeconomic effects of RMB appreciation on the U.S economy using a multi-country model. His estimates suggest that in 2008 a 25 percent appreciation of the RMB would increase the U.S. domestic price level by 0.5 to 1.5 percent. Similarly, Auer (2011) argues that the increas- ing importance of cheap imports from China was a major contributing factor to the low-inflation environ- ment in the United States over the past decade. Given that nearly a sixth of all manufactured goods sold in the United States are actually made in China, Auer estimates that a 25 percent appreciation of the RMB spread over 10 months is equivalent to a temporary 5-percentage-point shock to producer prices. We can also do a back-of-the-envelope calcula- tion on the impact of RMB appreciation on the U.S. consumer price index (CPI). Suppose (i) all imports from China are final consumption goods, (ii) the quantity of imports from China does not decrease (or increase) after the appreciation of the RMB, (iii) the basket of consumption goods for computing the CPI also does not change, and (iv) any changes in the value of the RMB will have a one-to-one pass-through effect on prices of imported Chinese goods. Given these assumptions, a 25 percent increase in the value of the RMB would increase the CPI by 0.9 per- cent because Chinese goods account for 3.6 percent of U.S. con- sumption expenditure and the prices of this portion of the consumer basket increase by 25 percent (3.6 × 0.25 = 0.9 percent). That is, the CPI would be nearly 1 percentage point higher. As for the core CPI, the figure is likely to be much larger. 2 So, how does this calculation relate to the average U.S. consumer? If oil prices continue to rise and the RMB continues to appreciate, the U.S. inflation rate may increase at a faster pace in the near future. And this would have an unwelcome impact on consumers’ wallets. —Mingyu Chen and Yi Wen Auer, Raphael A. “What the Yuan Means for American Inflation.” Economist, February 3, 2011; www.economist.com/blogs/freeexchange/2011/02/exchange_rates. Fair, Ray C. “Estimated Macroeconomic Effects of a Chinese Yuan Appreciation.” Business Economics, October 2010, 45(4), pp. 233-43. Krugman, Paul. “Taking on China.” New York Times, March 14, 2010; www.nytimes.com/2010/03/15/opinion/15krugman.html. Wen, Yi. “Making Sense of China’s Excessive Foreign Reserves.” Federal Reserve Bank of St. Louis Working Paper No. 2011-006A, February 2011, http://research.stlouisfed.org/wp/2011/2011-006.pdf. 1 See Krugman (2010). For counterarguments, see Wen (2011). 2 The core CPI equals CPI less food and energy. China does not export food or energy to the United States, so most Chinese goods are contained in the core CPI basket. RMB Appreciation and U.S. Inflation Risk research.stlouisfed.org 6.0 6.5 7.0 7.5 8.0 8.5 Exchange Rate of the RMB (¥) against the U.S. Dollar ($) 3-Jan-05 3-Apr-05 3-Jul-05 3-Oct-05 3-Jan-06 3-Apr-06 3-Jul-06 3-Oct-06 3-Jan-07 3-Apr-07 3-Jul-07 3-Oct-07 3-Jan-08 3-Apr-08 3-Jul-08 3-Oct-08 3-Jan-09 3-Apr-09 3-Jul-09 3-Oct-09 3-Jan-10 3-Apr-10 3-Jul-10 3-Oct-10 3-Jan-11 3-Apr-11 ¥/$ SOURCE: Federal Reserve Board/Haver Analytics.
Transcript
June 2011
MonetaryTrends
Views expressed do not necessarily reflect official positions of the Federal Reserve System.
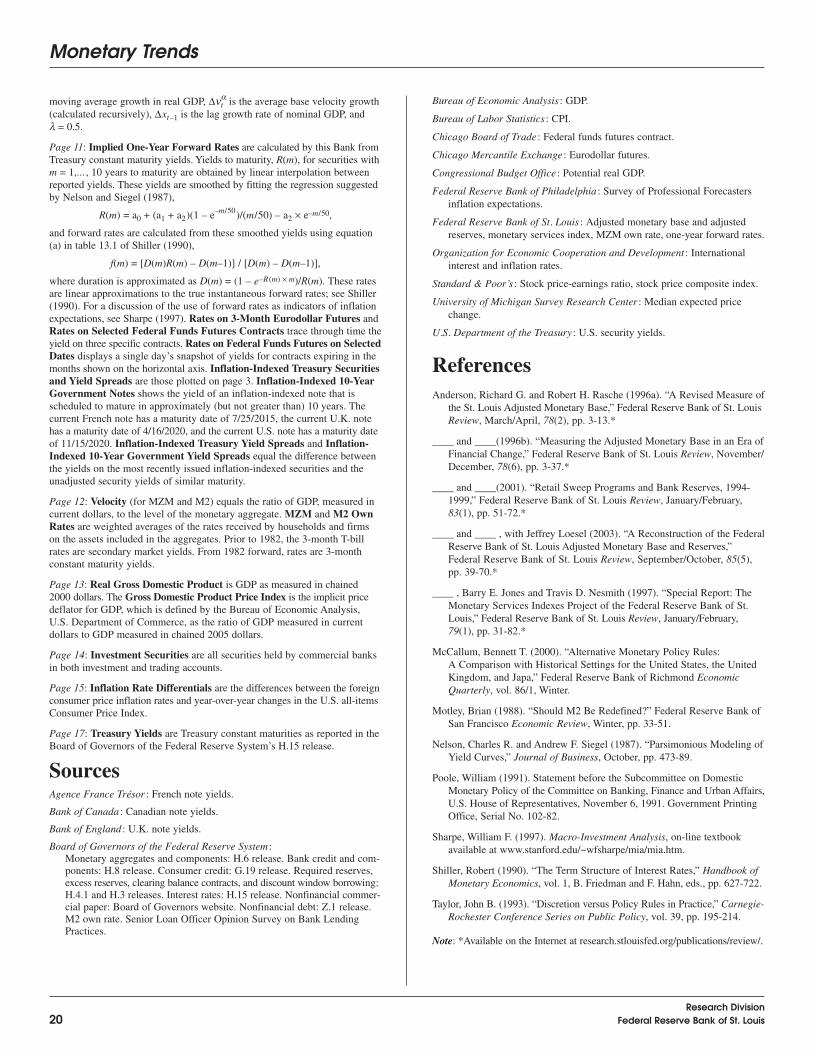
The value of the Chinese renminbi (RMB) has increasedmore than 21 percent against the U.S. dollar since 2005(see the chart). This would be good news for the United
States if increased costs of Chinese imports (as a result of the appre-ciated RMB) made U.S. consumers purchase fewer Chinese goodsand reduced its trade deficit with China. However, U.S. importsfrom China have been increasing. Between 1999 and 2010, theshare of Chinese goods among total U.S. imports has increasedfrom 6.9 percent to 16.1 percent, and the share of Chinese importsamong total U.S. consumer expenditures has increased from 1.3percent to 3.6 percent. Furthermore, the U.S. trade deficit withChina increased from $67 billion to $263 billion between 1999and 2010, a fourfold increase.
Some critics believe that the rising trade deficit has hurt theU.S. labor market and economic growth (i.e., by exporting U.S.manufacturing jobs to China) and was caused primarily by an under-valued RMB relative to the dollar. In response, some politiciansand economists have recommended a 25 to 40 percent tariff onChinese imports to correct the trade imbalance.1 China has allowedthe RMB to appreciate gradually since 2005 because of internationalpressures. Nevertheless, since then U.S. trade deficits with Chinahave still continued to increase. As of 2010, China is the second-largest trading partner (country) of the United States, next to Canada.What does RMB appreciation imply for the U.S. economy?
Because it is so much cheaper to produce goods in China thanin the United States, Chinese-made goods cannot be easily substi-tuted with American-made goods over the medium term. Hence,RMB appreciation would increase import prices without bringingmany job opportunities back to the United States.
Fair (2010) estimates the macroeconomic effectsof RMB appreciation on the U.S economy using amulti-country model. His estimates suggest that in2008 a 25 percent appreciation of the RMB wouldincrease the U.S. domestic price level by 0.5 to 1.5percent. Similarly, Auer (2011) argues that the increas-ing importance of cheap imports from China was amajor contributing factor to the low-inflation environ-ment in the United States over the past decade. Giventhat nearly a sixth of all manufactured goods sold inthe United States are actually made in China, Auerestimates that a 25 percent appreciation of the RMBspread over 10 months is equivalent to a temporary5-percentage-point shock to producer prices.
We can also do a back-of-the-envelope calcula-tion on the impact of RMB appreciation on the U.S.consumer price index (CPI). Suppose (i) all importsfrom China are final consumption goods, (ii) the
quantity of imports from China does not decrease (or increase) afterthe appreciation of the RMB, (iii) the basket of consumption goods forcomputing the CPI also does not change, and (iv) any changes in thevalue of the RMB will have a one-to-one pass-through effect on pricesof imported Chinese goods. Given these assumptions, a 25 percentincrease in the value of the RMB would increase the CPI by 0.9 per-cent because Chinese goods account for 3.6 percent of U.S. con-sumption expenditure and the prices of this portion of the consumerbasket increase by 25 percent (3.6 × 0.25 = 0.9 percent). That is, theCPI would be nearly 1 percentage point higher. As for the core CPI,the figure is likely to be much larger.2
So, how does this calculation relate to the average U.S. consumer?If oil prices continue to rise and the RMB continues to appreciate, theU.S. inflation rate may increase at a faster pace in the near future.And this would have an unwelcome impact on consumers’ wallets.
—Mingyu Chen and Yi Wen
Auer, Raphael A. “What the Yuan Means for American Inflation.” Economist,February 3, 2011; www.economist.com/blogs/freeexchange/2011/02/exchange_rates.
Fair, Ray C. “Estimated Macroeconomic Effects of a Chinese Yuan Appreciation.”Business Economics, October 2010, 45(4), pp. 233-43.
Krugman, Paul. “Taking on China.” New York Times, March 14, 2010;www.nytimes.com/2010/03/15/opinion/15krugman.html.
Wen, Yi. “Making Sense of China’s Excessive Foreign Reserves.” Federal ReserveBank of St. Louis Working Paper No. 2011-006A, February 2011,http://research.stlouisfed.org/wp/2011/2011-006.pdf.
1 See Krugman (2010). For counterarguments, see Wen (2011).2 The core CPI equals CPI less food and energy. China does not export food or energyto the United States, so most Chinese goods are contained in the core CPI basket.
RMB Appreciation and U.S. Inflation Risk
research.stlouisfed.org
6.0
6.5
7.0
7.5
8.0
8.5
Exchange Rate of the RMB (¥) against the U.S. Dollar ($)
3-Ja
n-05
3-Apr-0
5
3-Ju
l-05
3-O
ct-05
3-Ja
n-06
3-Apr-0
6
3-Ju
l-06
3-O
ct-06
3-Ja
n-07
3-Apr-0
7
3-Ju
l-07
3-O
ct-07
3-Ja
n-08
3-Apr-0
8
3-Ju
l-08
3-O
ct-08
3-Ja
n-09
3-Apr-0
9
3-Ju
l-09
3-O
ct-09
3-Ja
n-10
3-Apr-1
0
3-Ju
l-10
3-O
ct-10
3-Ja
n-11
3-Apr-1
1
¥/$
SOURCE: Federal Reserve Board/Haver Analytics.
Contents
Page
3 Monetary and Financial Indicators at a Glance
4 Monetary Aggregates and Their Components
6 Reserves Markets and Short-Term Credit Flows
7 Senior Loan Officer Opinion Survey on Bank Lending Practices
8 Measures of Expected Inflation
9 Interest Rates
10 Policy-Based Inflation Indicators
11 Implied Forward Rates, Futures Contracts, and Inflation-Indexed Securities
12 Velocity, Gross Domestic Product, and M2
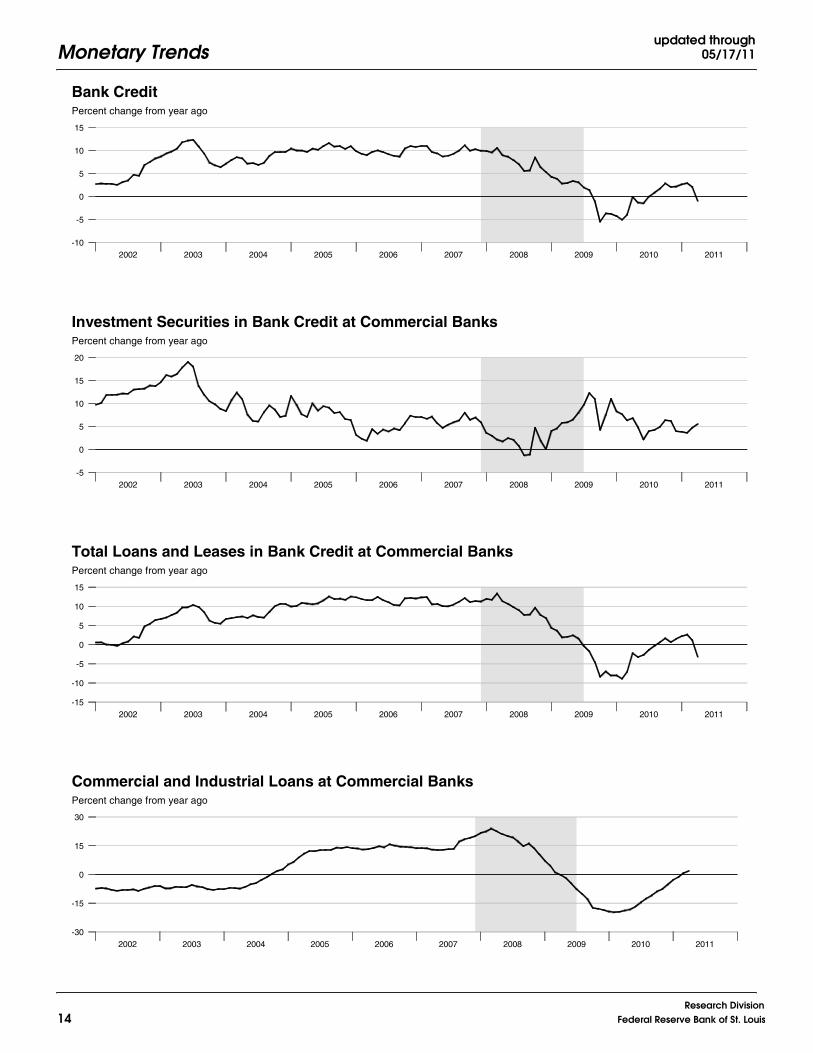
14 Bank Credit
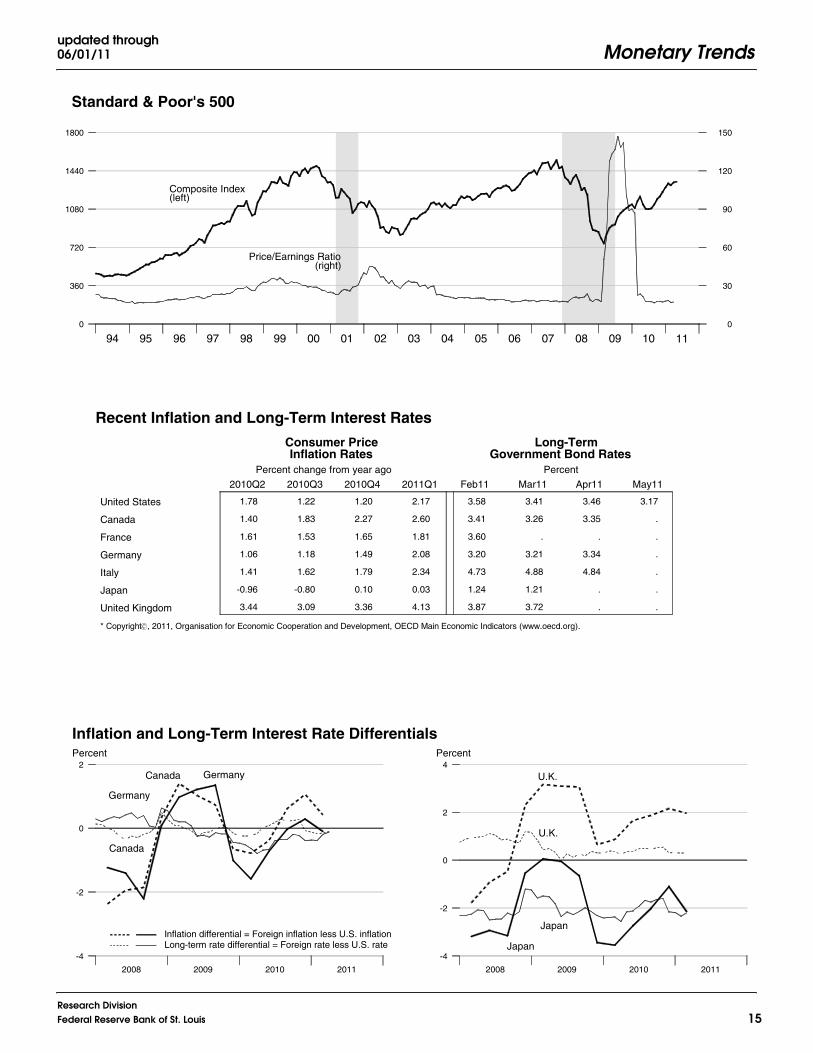
15 Stock Market Index and Foreign Inflation and Interest Rates
16 Reference Tables
18 Definitions, Notes, and Sources
Conventions used in this publication:
1. Unless otherwise indicated, data are monthly.
2. Shaded areas indicate recessions, as determined by the National Bureau of Economic Research.
3. Percent change at an annual rate is the simple, not compounded, monthly percent change multiplied by 12. Forexample, using consecutive months, the percent change at an annual rate in x between month t –1 and the currentmonth t is: [(xτ /xτ – 1)–1] × 1200. Note that this differs from National Economic Trends. In that publication, monthlypercent changes are compounded and expressed as annual growth rates.
4. The percent change from year ago refers to the percent change from the same period in the previous year. For example,the percent change from year ago in x between month t –12 and the current month t is: [(xτ /xτ – 12)–1] × 100.
We welcome your comments addressed to:
Editor, Monetary TrendsResearch DivisionFederal Reserve Bank of St. LouisP.O. Box 442St. Louis, MO 63166-0442
Monetary Trends is published monthly by the Research Division of the Federal Reserve Bank of St. Louis. Visit the Research Division’s website at research.stlouisfed.org/publications/mt todownload the current version of this publication or register for e-mail notification updates. For more information on data in the publication, please visit research.stlouisfed.org/fred2 or call(314) 444-8590.
On March 23, 2006, the Board of Governors of theFederal Reserve System ceased the publication of theM3 monetary aggregate. It also ceased publishingthe following components: large-denomination timedeposits, RPs, and eurodollars.
Monetary Trendsupdated through06/01/11
3Research DivisionFederal Reserve Bank of St. Louis
2008 2009 2010 2011
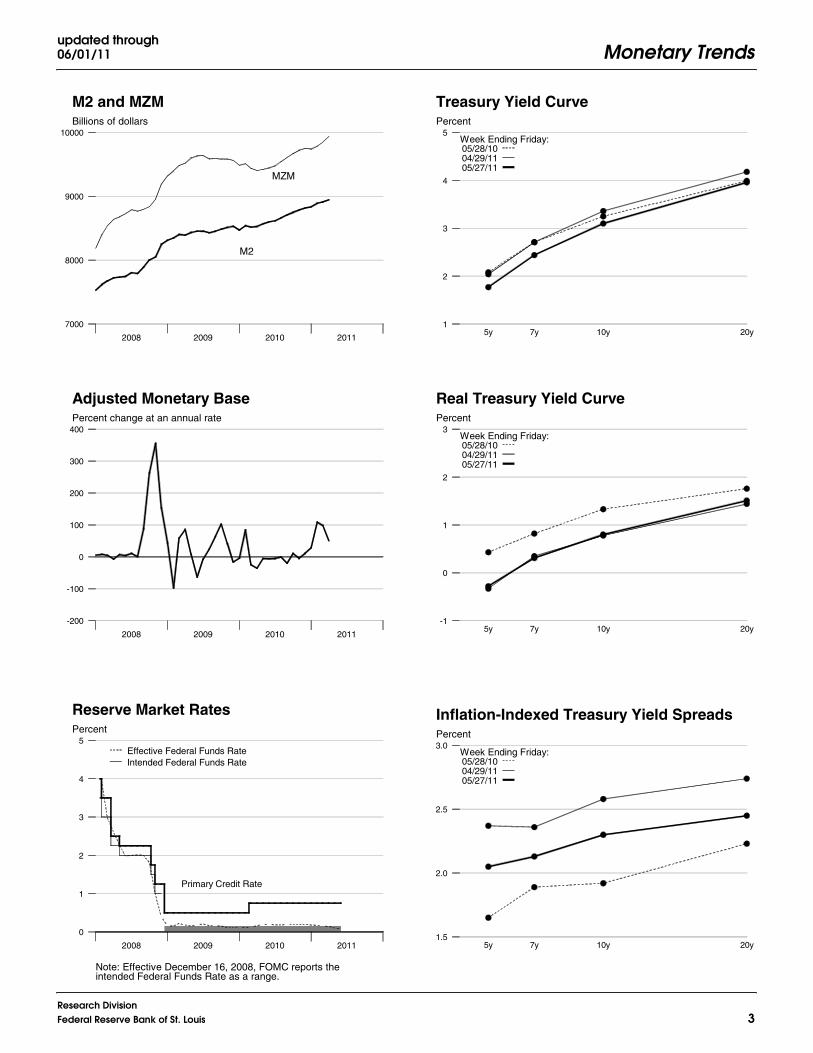
Billions of dollars
M2
MZM
M2 and MZM
7000
8000
9000
10000
2008 2009 2010 2011
Percent change at an annual rate
Adjusted Monetary Base
-200
-100
0
100
200
300
400
2008 2009 2010 2011
Percent
Reserve Market Rates
Note: Effective December 16, 2008, FOMC reports theintended Federal Funds Rate as a range.
0
1
2
3
4
5Effective Federal Funds RateIntended Federal Funds Rate
As of April 10, 2006, the Federal Reserve Board made major changes to its commercial paper calculations.For more information, please refer to http://www.federalreserve.gov/releases/cp/about.htm.
-60
-30
0
30
60
Monetary Trendsupdated through05/03/11
7Research DivisionFederal Reserve Bank of St. Louis
PercentCPI Inflation and 1-Year-Ahead CPI Inflation Expectations
The shaded region shows the Humphrey-Hawkins CPI inflation range. Beginning in January 2000, the Humphrey-Hawkins inflation range was reportedusing the PCE price index and therefore is not shown on this graph.
||||||||||||
-2
-1
0
1
2
3
4
5
6
65 70 75 80 85 90 95 00 05 10
10-Year Ahead PCE Inflation Expectations and Realized InflationPercent
Realized Expected
See the notes section for an explanation of the chart.
0
2
4
6
8
Monetary Trendsupdated through06/01/11
9Research DivisionFederal Reserve Bank of St. Louis
FOMC Intended Federal Funds Rate, Discount Rate, and Primary Credit Rate
0
2
4
6
8
2008 2009 2010 2011
Percent
Corporate Baa
10-Year Treasury Yield
Long-Term Interest Rates
2
4
6
8
10
2008 2009 2010 2011
Percent
90-Day Commercial Paper
3-Month Treasury Yield
|||
Short-Term Interest Rates
0
1
2
3
4
Monetary Trendsupdated through
05/27/11
10Research Division
Federal Reserve Bank of St. Louis
2002 2003 2004 2005 2006 2007 2008 2009 2010 2011
Percent
Actual
Target Inflation Rates4% 3% 2% 1% 0%
Federal Funds Rate and Inflation Targets
Calculated federal funds rate is based on Taylor's rule.
-5
0
5
10
2002 2003 2004 2005 2006 2007 2008 2009 2010 2011
Billions of chain-weighted 2005 dollars
Potential
Actual
Actual and Potential Real GDP
Components of Taylor's Rule
See notes section for further explanation.
9000
11000
13000
15000
2002 2003 2004 2005 2006 2007 2008 2009 2010 2011
Percent change from year ago
PCE Inflation
-1
0
1
2
3
4
5
2002 2003 2004 2005 2006 2007 2008 2009 2010 2011
Percent
Actual
Target Inflation Rates 0% 1% 2% 3% 4%
Monetary Base Growth and Inflation Targets
Calculated base growth is based on McCallum's rule. Actual base growth is percent change from the previous quarter.*Actual values for 2008:Q4, 2009:Q1, 2009:Q4, and 2011:Q1 are 188.02 percent, 60.74 percent, 56.52 percent, and 45.94 percent, respectively.
-15
0
15
30
2002 2003 2004 2005 2006 2007 2008 2009 2010 2011
Percent
Recursive Average|
1-YearMoving Average
Monetary Base Velocity Growth
Components of McCallum's Rule
-75
-60
-45
-30
-15
0
15
2002 2003 2004 2005 2006 2007 2008 2009 2010 2011
Percent
10-YearMoving Average
||
Quarter to QuarterGrowth Rate
Real Output Growth
-8
-4
0
4
8
Monetary Trendsupdated through06/01/11
11Research DivisionFederal Reserve Bank of St. Louis
Note: All values are given as a percent at an annual rate.
Monetary Trendsupdated through
05/17/11
18Research Division
Federal Reserve Bank of St. Louis
2006. 0.19 4.34 5.25 4.95
2007. -0.15 9.06 6.30 .
2008. 4.44 14.05 7.11 .
2009. 14.21 9.57 7.88 .
2010. 6.53 -0.03 2.33 .
2009 1 12.72 18.08 12.45 .
. 2 11.72 7.85 3.47 .
. 3 9.08 0.81 0.92 .
. 4 5.68 -1.16 3.01 .
2010 1 3.39 -4.11 -0.01 .
. 2 3.03 -2.33 2.70 .
. 3 9.53 5.07 4.50 .
. 4 13.57 7.15 5.61 .
2011 1 13.34 3.19 4.34 .
2009 Apr 24.66 4.65 -1.33 .
. May 0.55 10.33 5.90 .
. Jun 30.66 3.87 2.98 .
. Jul 7.13 0.49 -0.01 .
. Aug -4.45 -6.30 -3.42 .
. Sep 7.57 0.40 3.37 .
. Oct 10.12 -0.81 4.31 .
. Nov 0.06 -0.22 4.17 .
. Dec 9.77 -2.03 2.42 .
2010 Jan -8.96 -10.01 -8.35 .
. Feb 15.88 3.13 9.59 .
. Mar 6.19 -8.94 -3.08 .
. Apr -8.23 -4.56 1.67 .
. May 4.82 2.27 5.78 .
. Jun 14.31 2.99 4.31 .
. Jul 2.50 3.82 2.25 .
. Aug 14.22 8.31 6.31 .
. Sep 15.76 9.07 6.60 .
. Oct 6.34 6.78 5.51 .
. Nov 24.73 6.80 5.09 .
. Dec 6.72 3.64 4.04 .
2011 Jan 14.59 -1.40 2.70 .
. Feb 13.30 5.57 7.39 .
. Mar 10.44 7.61 2.92 .
. Apr 6.97 10.83 4.42 .
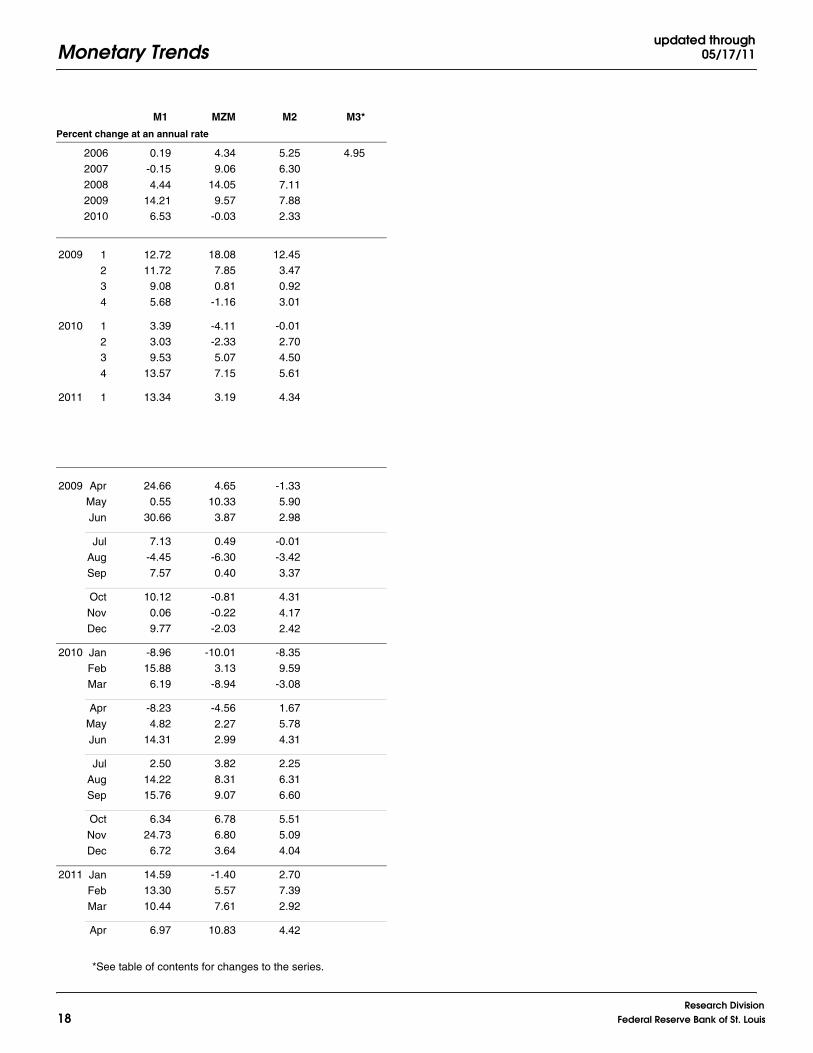
Percent change at an annual rate
M1 MZM M2 M3*
*See table of contents for changes to the series.
Definitions M1: The sum of currency held outside the vaults of depository institutions,Federal Reserve Banks, and the U.S. Treasury; travelers checks; and demandand other checkable deposits issued by financial institutions (except demanddeposits due to the Treasury and depository institutions), minus cash items inprocess of collection and Federal Reserve float.
MZM (money, zero maturity): M2 minus small-denomination time deposits,plus institutional money market mutual funds (that is, those included in M3 butexcluded from M2). The label MZM was coined by William Poole (1991); theaggregate itself was proposed earlier by Motley (1988).
M2: M1 plus savings deposits (including money market deposit accounts)and small-denomination (under $100,000) time deposits issued by financialinstitutions; and shares in retail money market mutual funds (funds with initialinvestments under $50,000), net of retirement accounts.
M3: M2 plus large-denomination ($100,000 or more) time deposits; repurchaseagreements issued by depository institutions; Eurodollar deposits, specifically,dollar-denominated deposits due to nonbank U.S. addresses held at foreignoffices of U.S. banks worldwide and all banking offices in Canada and theUnited Kingdom; and institutional money market mutual funds (funds withinitial investments of $50,000 or more).
Bank Credit: All loans, leases, and securities held by commercial banks.
Domestic Nonfinancial Debt: Total credit market liabilities of the U.S.Treasury, federally sponsored agencies, state and local governments, households,and nonfinancial firms. End-of-period basis.
Adjusted Monetary Base: The sum of currency in circulation outside FederalReserve Banks and the U.S. Treasury, deposits of depository financial institu-tions at Federal Reserve Banks, and an adjustment for the effects of changesin statutory reserve requirements on the quantity of base money held by deposi-tories. This series is a spliced chain index; see Anderson and Rasche (1996a,b,2001, 2003).
Adjusted Reserves: The sum of vault cash and Federal Reserve Bank depositsheld by depository institutions and an adjustment for the effects of changes instatutory reserve requirements on the quantity of base money held by deposi-tories. This spliced chain index is numerically larger than the Board ofGovernors’ measure, which excludes vault cash not used to satisfy statutoryreserve requirements and Federal Reserve Bank deposits used to satisfy requiredclearing balance contracts; see Anderson and Rasche (1996a, 2001, 2003).
Monetary Services Index: An index that measures the flow of monetary ser-vices received by households and firms from their holdings of liquid assets;see Anderson, Jones, and Nesmith (1997). Indexes are shown for the assetsincluded in M2, with additional data at research.stlouisfed.org/msi/index.html.
Note: M1, M2, M3, Bank Credit, and Domestic Nonfinancial Debt are con-structed and published by the Board of Governors of the Federal ReserveSystem. For details, see Statistical Supplement to the Federal Reserve Bulletin,tables 1.21 and 1.26. MZM, Adjusted Monetary Base, Adjusted Reserves,and Monetary Services Index are constructed and published by the ResearchDivision of the Federal Reserve Bank of St. Louis.
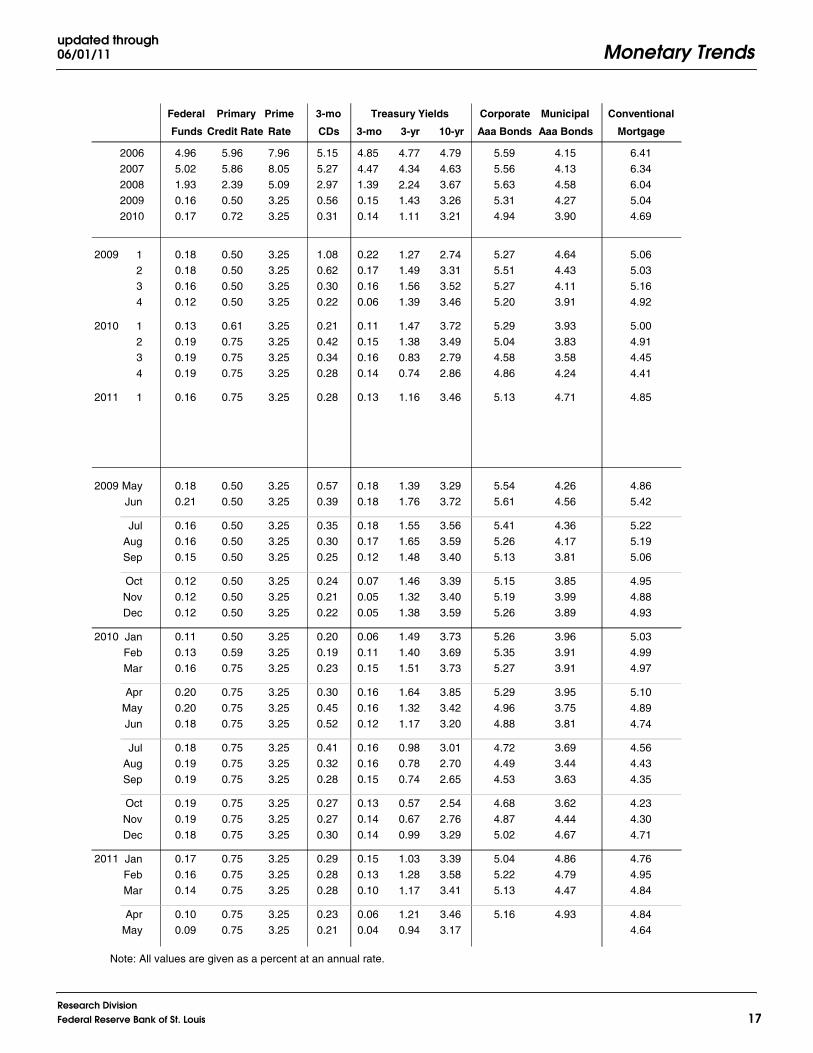
NotesPage 3: Readers are cautioned that, since early 1994, the level and growth ofM1 have been depressed by retail sweep programs that reclassify transactionsdeposits (demand deposits and other checkable deposits) as savings depositsovernight, thereby reducing banks’ required reserves; see Anderson and Rasche(2001) and research.stlouisfed.org/aggreg/swdata.html. Primary Credit Rate,Discount Rate, and Intended Federal Funds Rate shown in the chart ReserveMarket Rates are plotted as of the date of the change, while the EffectiveFederal Funds Rate is plotted as of the end of the month. Interest rates inthe table are monthly averages from the Board of Governors H.15 StatisticalRelease. The Treasury Yield Curve and Real Treasury Yield Curve showconstant maturity yields calculated by the U.S. Treasury for securities 5, 7, 10,and 20 years to maturity. Inflation-Indexed Treasury Yield Spreads are ameasure of inflation compensation at those horizons, and it is simply the
nominal constant maturity yield less the real constant maturity yield. Daily dataand descriptions are available at research.stlouisfed.org/fred2/. See also StatisticalSupplement to the Federal Reserve Bulletin, table 1.35. The 30-year constantmaturity series was discontinued by the Treasury as of February 18, 2002.
Page 5: Checkable Deposits is the sum of demand and other checkabledeposits. Savings Deposits is the sum of money market deposit accountsand passbook and statement savings. Time Deposits have a minimum initialmaturity of 7 days. Retail Money Market Mutual Funds are included in M2.Institutional money market funds are not included in M2.
Page 6: Excess Reserves plus RCB (Required Clearing Balance) Contractsequals the amount of deposits at Federal Reserve Banks held by depositoryinstitutions but not applied to satisfy statutory reserve requirements. (Thismeasure excludes the vault cash held by depository institutions that is notapplied to satisfy statutory reserve requirements.) Consumer Credit includesmost short- and intermediate-term credit extended to individuals. See StatisticalSupplement to the Federal Reserve Bulletin, table 1.55.
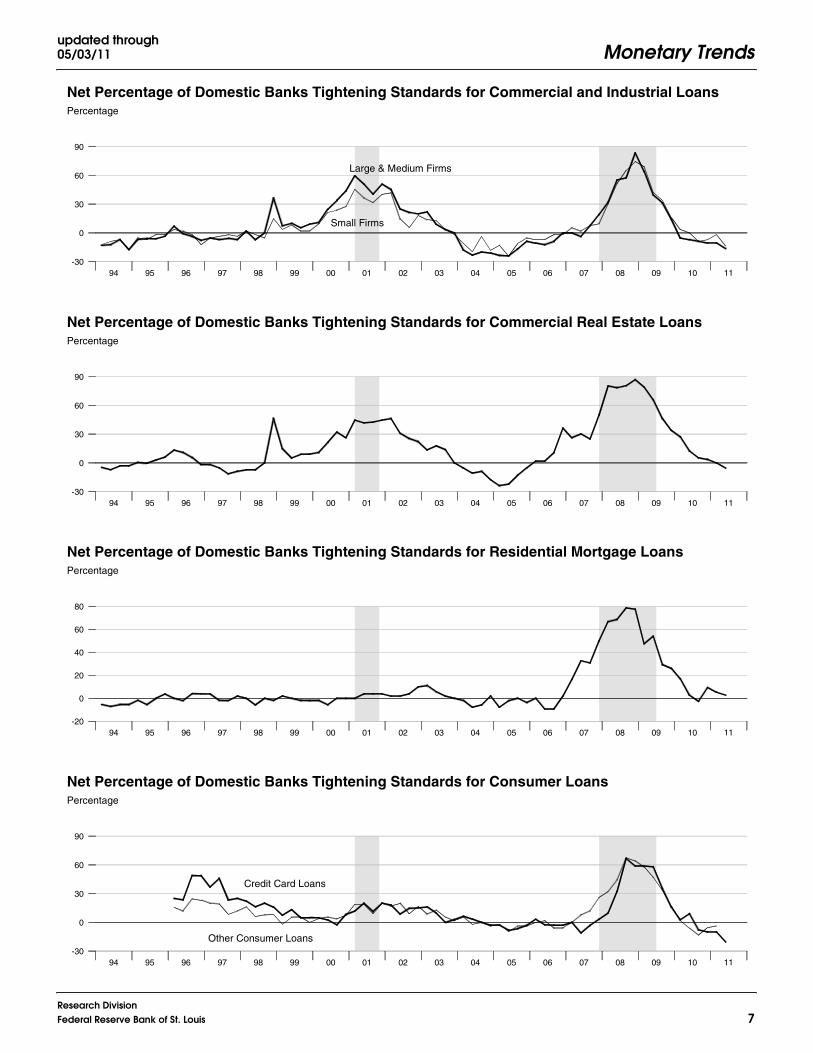
Page 7: Data are reported in the Senior Loan Officer Opinion Survey onBank Lending Practices.
Page 8: Inflation Expectations measures include the quarterly Federal ReserveBank of Philadelphia Survey of Professional Forecasters, the monthly Universityof Michigan Survey Research Center’s Surveys of Consumers, and the annualFederal Open Market Committee (FOMC) range as reported to the Congressin the February testimony that accompanies the Monetary Policy Report tothe Congress. Beginning February 2000, the FOMC began using the personalconsumption expenditures (PCE) price index to report its inflation range; theFOMC then switched to the PCE chain-type price index excluding food andenergy prices (“core”) beginning July 2004. Accordingly, neither are shownon this graph. CPI Inflation is the percentage change from a year ago in theconsumer price index for all urban consumers. Real Interest Rates are ex postmeasures, equal to nominal rates minus year-over-year CPI inflation.
From 1991 to the present the source of the long-term PCE inflation expectationsdata is the Federal Reserve Bank of Philadelphia’s Survey of ProfessionalForecasters. Prior to 1991, the data were obtained from the Board of Governorsof the Federal Reserve System. Realized (actual) inflation is the annualized rateof change for the 40-quarter period that corresponds to the forecast horizon (theexpectations measure). For example, in 1965:Q1, annualized PCE inflationover the next 40 quarters was expected to average 1.7 percent. In actuality,the average annualized rate of change measured 4.8 percent from 1965:Q1 to1975:Q1. Thus, the vertical distance between the two lines in the chart at anypoint is the forecast error.
Page 9: FOMC Intended Federal Funds Rate is the level (or midpoint ofthe range, if applicable) of the federal funds rate that the staff of the FOMCexpected to be consistent with the desired degree of pressure on bank reservepositions. In recent years, the FOMC has set an explicit target for the federalfunds rate.
Page 10: Federal Funds Rate and Inflation Targets shows the observedfederal funds rate, quarterly, and the level of the funds rate implied by applyingTaylor’s (1993) equation
to five alternative target inflation rates, π* = 0, 1, 2, 3, 4 percent, where ft* is
the implied federal funds rate, π t –1 is the previous period’s inflation rate (PCE)measured on a year-over-year basis, yt –1 is the log of the previous period’slevel of real gross domestic product (GDP), and yt –1
P is the log of an estimateof the previous period’s level of potential output. Potential Real GDP isestimated by the Congressional Budget Office (CBO).
Monetary Base Growth and Inflation Targets shows the quarterly growthof the adjusted monetary base implied by applying McCallum’s (2000, p. 52)equation
to five alternative target inflation rates, π* = 0, 1, 2, 3, 4 percent, where Δbtis the implied growth rate of the adjusted monetary base, Δyt
* is the 10-year
Δ Δ Δ Δ Δ
Δ Δ
b x v x x
x yt t t
at t
t t
= − + −
= +−
* *
* * *
( ),λ
π1
Monetary Trends
Research DivisionFederal Reserve Bank of St. Louis 19
moving average growth in real GDP, Δνtα is the average base velocity growth
(calculated recursively), Δxt–1 is the lag growth rate of nominal GDP, and λ = 0.5.
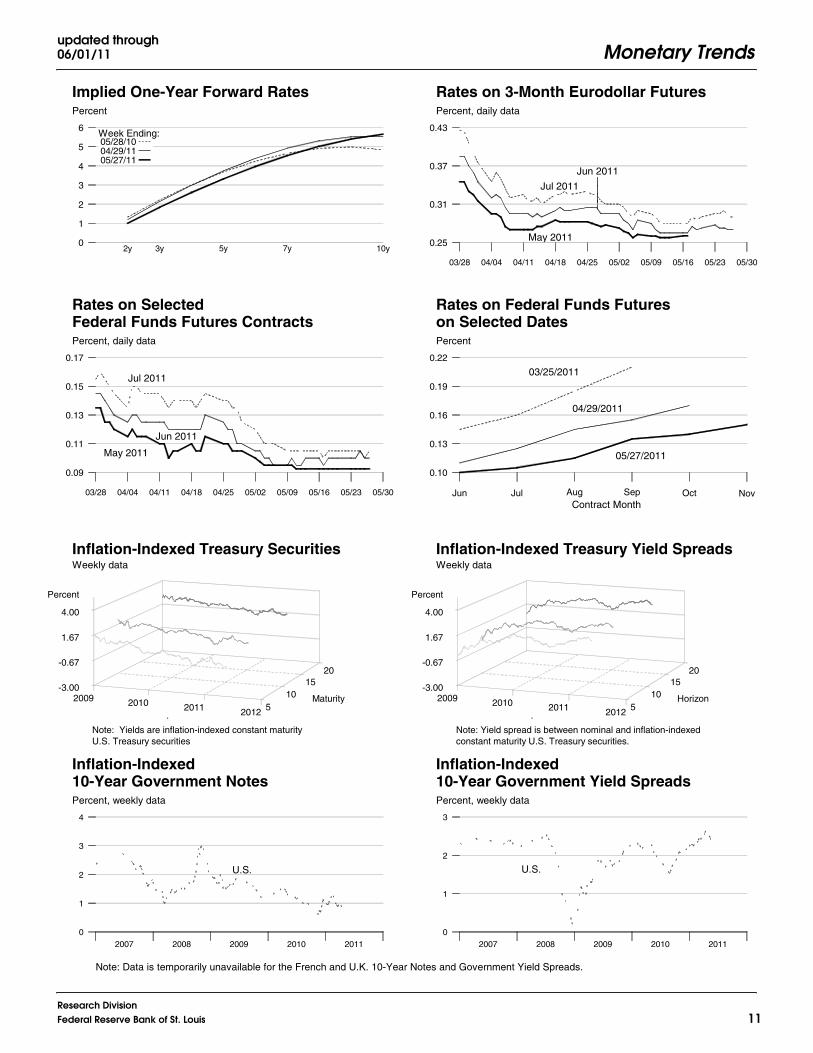
Page 11: Implied One-Year Forward Rates are calculated by this Bank fromTreasury constant maturity yields. Yields to maturity, R(m), for securities withm = 1,... , 10 years to maturity are obtained by linear interpolation betweenreported yields. These yields are smoothed by fitting the regression suggestedby Nelson and Siegel (1987),
and forward rates are calculated from these smoothed yields using equation(a) in table 13.1 of Shiller (1990),
f(m) = [D(m)R(m) – D(m–1)] / [D(m) – D(m–1)],
where duration is approximated as D(m) = (1 – e–R(m) × m)/R(m). These ratesare linear approximations to the true instantaneous forward rates; see Shiller(1990). For a discussion of the use of forward rates as indicators of inflationexpectations, see Sharpe (1997). Rates on 3-Month Eurodollar Futures andRates on Selected Federal Funds Futures Contracts trace through time theyield on three specific contracts. Rates on Federal Funds Futures on SelectedDates displays a single day’s snapshot of yields for contracts expiring in themonths shown on the horizontal axis. Inflation-Indexed Treasury Securitiesand Yield Spreads are those plotted on page 3. Inflation-Indexed 10-YearGovernment Notes shows the yield of an inflation-indexed note that isscheduled to mature in approximately (but not greater than) 10 years. Thecurrent French note has a maturity date of 7/25/2015, the current U.K. notehas a maturity date of 4/16/2020, and the current U.S. note has a maturity dateof 11/15/2020. Inflation-Indexed Treasury Yield Spreads and Inflation-Indexed 10-Year Government Yield Spreads equal the difference betweenthe yields on the most recently issued inflation-indexed securities and theunadjusted security yields of similar maturity.
Page 12: Velocity (for MZM and M2) equals the ratio of GDP, measured incurrent dollars, to the level of the monetary aggregate. MZM and M2 OwnRates are weighted averages of the rates received by households and firmson the assets included in the aggregates. Prior to 1982, the 3-month T-billrates are secondary market yields. From 1982 forward, rates are 3-monthconstant maturity yields.
Page 13: Real Gross Domestic Product is GDP as measured in chained2000 dollars. The Gross Domestic Product Price Index is the implicit pricedeflator for GDP, which is defined by the Bureau of Economic Analysis,U.S. Depart ment of Commerce, as the ratio of GDP measured in currentdollars to GDP measured in chained 2005 dollars.
Page 14: Investment Securities are all securities held by commercial banksin both investment and trading accounts.
Page 15: Inflation Rate Differentials are the differences between the foreignconsumer price inflation rates and year-over-year changes in the U.S. all-itemsConsumer Price Index.
Page 17: Treasury Yields are Treasury constant maturities as reported in theBoard of Governors of the Federal Reserve System’s H.15 release.
SourcesAgence France Trésor : French note yields.
Bank of Canada : Canadian note yields.
Bank of England : U.K. note yields.
Board of Governors of the Federal Reserve System :Monetary aggregates and components: H.6 release. Bank credit and com-ponents: H.8 release. Consumer credit: G.19 release. Required reserves,excess reserves, clearing balance contracts, and discount window borrowing:H.4.1 and H.3 releases. Interest rates: H.15 release. Nonfinancial commer-cial paper: Board of Governors website. Nonfinancial debt: Z.1 release.M2 own rate. Senior Loan Officer Opinion Survey on Bank LendingPractices.
Bureau of Economic Analysis : GDP.
Bureau of Labor Statistics : CPI.
Chicago Board of Trade : Federal funds futures contract.
Chicago Mercantile Exchange : Eurodollar futures.
Congressional Budget Office : Potential real GDP.
Federal Reserve Bank of Philadelphia : Survey of Professional Forecastersinflation expectations.
Federal Reserve Bank of St. Louis : Adjusted monetary base and adjustedreserves, monetary services index, MZM own rate, one-year forward rates.
Organization for Economic Cooperation and Development : Internationalinterest and inflation rates.
University of Michigan Survey Research Center : Median expected pricechange.
U.S. Department of the Treasury : U.S. security yields.
ReferencesAnderson, Richard G. and Robert H. Rasche (1996a). “A Revised Measure of
the St. Louis Adjusted Monetary Base,” Federal Reserve Bank of St. LouisReview, March/April, 78(2), pp. 3-13.*
____ and ____(1996b). “Measuring the Adjusted Monetary Base in an Era ofFinancial Change,” Federal Reserve Bank of St. Louis Review, November/December, 78(6), pp. 3-37.*
____ and ____(2001). “Retail Sweep Programs and Bank Reserves, 1994-1999,” Federal Reserve Bank of St. Louis Review, January/February,83(1), pp. 51-72.*
____ and ____ , with Jeffrey Loesel (2003). “A Reconstruction of the FederalReserve Bank of St. Louis Adjusted Monetary Base and Reserves,”Federal Reserve Bank of St. Louis Review, September/October, 85(5),pp. 39-70.*
____ , Barry E. Jones and Travis D. Nesmith (1997). “Special Report: TheMonetary Services Indexes Project of the Federal Reserve Bank of St.Louis,” Federal Reserve Bank of St. Louis Review, January/February,79(1), pp. 31-82.*
McCallum, Bennett T. (2000). “Alternative Monetary Policy Rules: A Comparison with Historical Settings for the United States, the UnitedKingdom, and Japa,” Federal Reserve Bank of Richmond EconomicQuarterly, vol. 86/1, Winter.
Motley, Brian (1988). “Should M2 Be Redefined?” Federal Reserve Bank ofSan Francisco Economic Review, Winter, pp. 33-51.
Nelson, Charles R. and Andrew F. Siegel (1987). “Parsimonious Modeling ofYield Curves,” Journal of Business, October, pp. 473-89.
Poole, William (1991). Statement before the Subcommittee on DomesticMonetary Policy of the Committee on Banking, Finance and Urban Affairs,U.S. House of Representatives, November 6, 1991. Government PrintingOffice, Serial No. 102-82.
Sharpe, William F. (1997). Macro-Investment Analysis, on-line textbookavailable at www.stanford.edu/~wfsharpe/mia/mia.htm.
Shiller, Robert (1990). “The Term Structure of Interest Rates,” Handbook ofMonetary Economics, vol. 1, B. Friedman and F. Hahn, eds., pp. 627-722.
Taylor, John B. (1993). “Discretion versus Policy Rules in Practice,” Carnegie-Rochester Conference Series on Public Policy, vol. 39, pp. 195-214.
Note: *Available on the Internet at research.stlouisfed.org/publications/review/.
Monetary Trends
Research Division20 Federal Reserve Bank of St. Louis