Research ArticleRNA-Seq-Based Breast Cancer Subtypes Classification UsingMachine Learning Approaches
Zhezhou Yu1 Zhuo Wang1 Xiangchun Yu 12 and Zhe Zhang1
1College of Computer Science and Technology Jilin University Changchun China2School of Information Engineering Jiangxi University of Science and Technology Ganzhou China
Correspondence should be addressed to Xiangchun Yu yuxcjxusteducn
Received 21 October 2019 Revised 31 May 2020 Accepted 9 October 2020 Published 29 October 2020
Academic Editor Giosue Lo Bosco
Copyright copy 2020 Zhezhou Yu et al is is an open access article distributed under the Creative Commons Attribution Licensewhich permits unrestricted use distribution and reproduction in any medium provided the original work is properly cited
Background Breast invasive carcinoma (BRCA) is not a single disease as each subtype has a distinct morphology structureAlthough several computational methods have been proposed to conduct breast cancer subtype identification the specificinteraction mechanisms of genes involved in the subtypes are still incomplete To identify and explore the corresponding in-teraction mechanisms of genes for each subtype of breast cancer can impose an important impact on the personalized treatmentfor different patients Methods We integrate the biological importance of genes from the gene regulatory networks to thedifferential expression analysis and then obtain the weighted differentially expressed genes (weighted DEGs) A gene with a highweight means it regulates more target genes and thus holds more biological importance Besides we constructed gene coex-pression networks for control and experiment groups and the significantly differentially interacting structures encouraged us todesign the corresponding Gene Ontology (GO) enrichment based on gene coexpression networks (GOEGCN) e GOEGCNconsiders the two-side distinction analysis between gene coexpression networks for control and experiment groups e methodallows us to study how themodulated coexpressed gene couples impact biological functions at a GO level Results Wemodeled thebinary classification with weighted DEGs for each subtype e binary classifier could make a good prediction for an unseensample and the experimental results validated the effectiveness of our proposed approaches e novel enriched GO terms basedon GOEGCN for control and experiment groups of each subtype explain the specific biological function changes according to thetwo-side distinction of coexpression network structures to some extent Conclusion e weighted DEGs contain biologicalimportance derived from the gene regulatory network Based on the weighted DEGs five binary classifiers were learned andshowed good performance concerning the ldquoSensitivityrdquo ldquoSpecificityrdquo ldquoAccuracyrdquo ldquoF1rdquo and ldquoAUCrdquo metrics e GOEGCN withweighted DEGs for control and experiment groups presented a novel GO enrichment analysis results and the novel enriched GOterms would further unveil the changes of specific biological functions among all the BRCA subtypes to some extente R code inthis research is available at httpsgithubcomyxchspringGOEGCN_BRCA_Subtypes
1 Introduction
e breast invasive carcinoma (BRCA) is regarded as aheterogeneous disease which is difficult to define under thedefinition of the conventional histopathology [1] BRCAspans multiple subtypes each with dissimilar morphologystructures and clinical upshots [2] It is generally acceptedthat BRCA covers five kinds of intrinsic subtypes at themolecular level namely Basal-like Her2 overexpression(Her2) Luminal A (LumA) Luminal B (LumB) and Nor-mal-like [2] Soslashrlie et al developed a ldquomolecular portraitrdquo
method to classify the tumors into five subtypes (ie Basal-like Her2 LumA LumB and Normal-like) according to thedistinctive gene expression patterns [3] Hu et al chose 306genes with significant differential expression to split cancerinto the same five subtypes [4] Parker et al also found thesame five intrinsic subtypes by utilizing 50 genes (PAM50)and it showed great value for clinical prognosis and pre-diction [5] is division can be mapped to the subtypesdefined by IHC markers (ie ER PR and Her2) except forthe Normal-like which shares similar IHC description withLumA [2] However the existence of the Normal-like
HindawiComputational Intelligence and NeuroscienceVolume 2020 Article ID 4737969 13 pageshttpsdoiorg10115520204737969
subtype is disbelieved by some researchers owing to theindetermination of its clinical significanceerefore severalstudies only focused on the four kinds of BRCA subtypesother than the Normal-like [1 6] Other studies adopted theunsupervised methods to cluster the tumor samples into thedifferent groups and each group represented an individualsubtype [7 8] In addition many researcher have proposeddifferent machine learning approaches to carry out cancersubtyping and classification Dass et al [9] proposed animproved decision tree for lung cancer subtypes Moreimportantly the decision rules discovered in this researchcan provide reference guidelines for diagnosis and drugdevelopment of lung cancer subtypes Flynn et al [10] havestudied several machine learning approaches includingKNN random forest and SVM using gene expression datato determine the molecular subtypes of cancer Hijazi andChan [11] proposed a classification framework for cancersubtypes based on gene expression data is work studiedseveral different machine learning methods including de-cision trees random forests and SVM for subtype classi-fication Bazila Banu et al [12] focused on the performanceof the Naive Bayes classifiers in breast cancer classificationKharya and Soni [13] proposed a weighted Naive Bayesapproach for breast cancer classification
Function enrichment analysis was conducted to acquirethe enriched GO terms based on the corresponding DEGsfor each subtype [1 7] In this research we focus on theidentification of the five subtypes of BRCA (ie Basal-likeHer2 LumA LumB and Normal-like) using gene expres-sion values based on RNA-Seq data For the DEGs selectionstep we conducted statistical analysis between each subtypecompared with the remaining subtypes similar to [14]Different from the abovementioned method we strive toutilize the biological importance information of the genesHua et al [15] proposed to construct the miRNA-mRNAdysregulated network to identify breast cancer subtypesbased on miRNA expression Xu et al [7] proposed the generegulatory networks namedmiRNA-TF-mRNAwhich couldreveal the interaction relationship between molecules In-spired by this method we integrated the regulatory infor-mation to the selection of DEGs at is to say we selectedthe topM genes with high weights after we get the DEGseweighted DEGs utilize the interaction information derivedfrom the gene regulatory network and thus reveal the bi-ological importance related to the corresponding regulatorymechanism for different subtypes Machine learning-basedapproaches are being applied to conduct feature selection[16] protein-protein interactions prediction [17 18] andcancer classification [16 19 20] and show powerful per-formance in bioinformatics In order to validate the effec-tiveness and discrimination of the weighted DEGs weconstructed a machine learning-based classification modelfor each subtype and a binary classifier between control(eg non-Basal-like) and experiment (eg Basal-like)groups is learned to separate the different groups of data intothe actual classes
We believe that the different groups will certainly holddistinct molecular interaction mechanisms so we con-structed the gene coexpression networks with weighted
DEGs based on Pearson correlation coefficients (PCC) forcontrol and experiment groups respectively ere is a lot ofwork [21ndash23] that can use Pearson correlation coefficients tobuild a coexpression network based on high-throughputFPKM data from TCGA database In addition in order tomeet the requirements of the normal distribution we per-formed some data preprocessing operations such as log2transformation e significantly differential structures notonly demonstrate the different interaction relationshipamong coexpressed gene couples for control and experimentgroups but also encourage us to propose a novel enrichmentanalysis approach called GO enrichment based on genecoexpression network (GOEGCN)
For GO enrichment analysis we consider the two-sidedistinction between gene coexpression networks for controland experiment groups [24] is means that the coex-pressed gene couples which appear in the experiment groupinstead of the control group can imply that their coex-pression is activated (similar to the upregulated expression)and conversely the ones appearing in control instead ofexperiment group infer that their coexpression is inhibited(similar to the downregulated expression) is analysismethod is different from previous studies [1 7 14] Finallywe recalculated the p values using the hypergeometric test[25] and obtained the final enriched GO terms list for eachsubtype after reordering those GO terms according to theadjusted p values
2 Materials and Methods
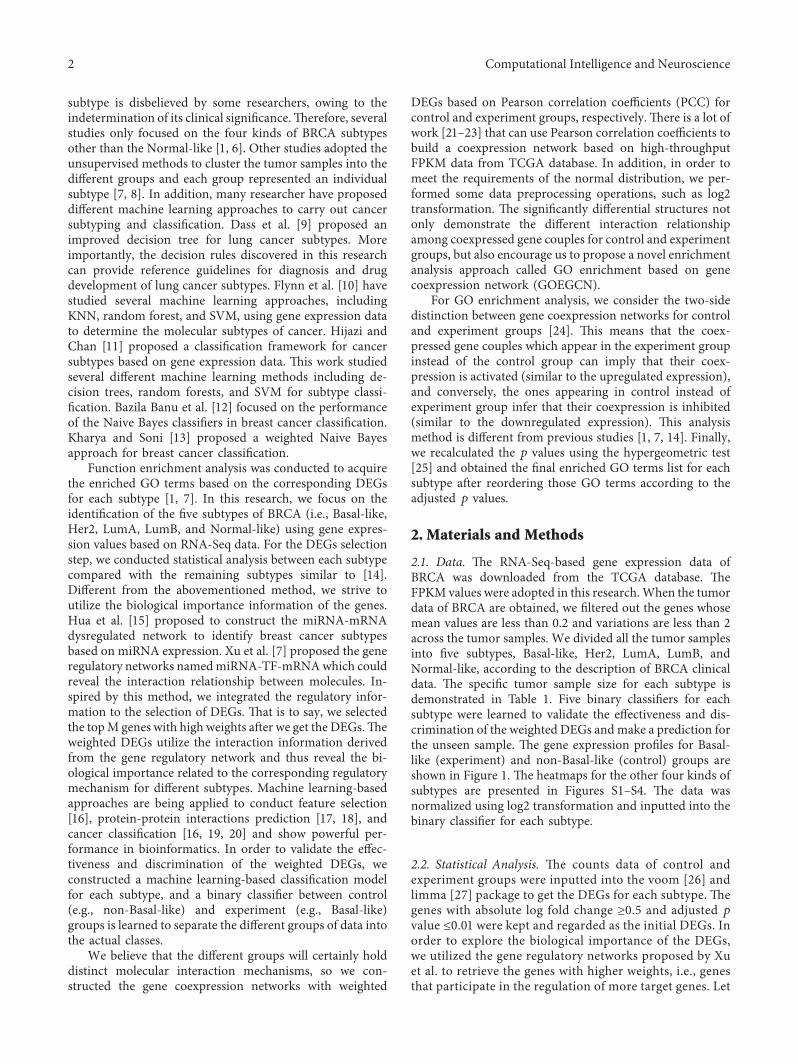
21 Data e RNA-Seq-based gene expression data ofBRCA was downloaded from the TCGA database eFPKM values were adopted in this researchWhen the tumordata of BRCA are obtained we filtered out the genes whosemean values are less than 02 and variations are less than 2across the tumor samples We divided all the tumor samplesinto five subtypes Basal-like Her2 LumA LumB andNormal-like according to the description of BRCA clinicaldata e specific tumor sample size for each subtype isdemonstrated in Table 1 Five binary classifiers for eachsubtype were learned to validate the effectiveness and dis-crimination of the weighted DEGs andmake a prediction forthe unseen sample e gene expression profiles for Basal-like (experiment) and non-Basal-like (control) groups areshown in Figure 1 e heatmaps for the other four kinds ofsubtypes are presented in Figures S1ndashS4 e data wasnormalized using log2 transformation and inputted into thebinary classifier for each subtype
22 Statistical Analysis e counts data of control andexperiment groups were inputted into the voom [26] andlimma [27] package to get the DEGs for each subtype egenes with absolute log fold change ge05 and adjusted p
value le001 were kept and regarded as the initial DEGs Inorder to explore the biological importance of the DEGswe utilized the gene regulatory networks proposed by Xuet al to retrieve the genes with higher weights ie genesthat participate in the regulation of more target genes Let
2 Computational Intelligence and Neuroscience
S g1 g2 gN1113864 1113865 denote the gene set where N is the totalnumber of genes and the weights of gi and gj withgi⟶ gj are calculated with the following equation
W gi( 1113857 1 minus d
N+ d 1113944
gjisinT gi( )
W gj1113872 1113873
L gj1113872 1113873 (1)
where d (0lt dlt 1) denotes the damping factor T (gj) is thetarget genes set that gi regulates and L (gj) is the totalnumber of regulator genes which regulate gj en the top1000 genes with high weights were selected from themiRNA-TF-mRNA gene regulatory networks [7] e rea-sons why we select the 1000 genes with high weights are asfollows Firstly the required quantity for constructing
machine learning classifiers can be satisfied to a certainextent Too many genes will result in the overfitting issuewhen the sample size is too small Besides we think thatchoosing the specific quantity is a more direct method eweighted DEGs for classification were obtained by taking theintersection between the initial DEGs and the top 1000mRNA with high weights (ranks) e number of weightedDEGs for classification of each BRCA subtype is illustratedin Table 2 and detailed gene information is shown inSupplementary S1 in Supplementary materials When weconducted the GO enrichment analysis the top 3000 geneswith high weights were chosen to perform the intersectionwith the initial DEGs and then we would get the finalweighted DEGs for GO enrichment analysis S2 in
Silhouette073
minus052
0
02
04
06
08
1
Basal-like and non-Basal-like groups
Group12
Figure 1 Heatmap for Basal-like and non-Basal-like groups e left group 1 represents the Basal-like group and the right group 2 denotesthe non-Basal-like group
Table 1 e tumor sample number for each subtype of BRCA
Supplementary Materials File presents the detailed infor-mation of weighted DEGs of each BRCA subtype for GOenrichment analysis
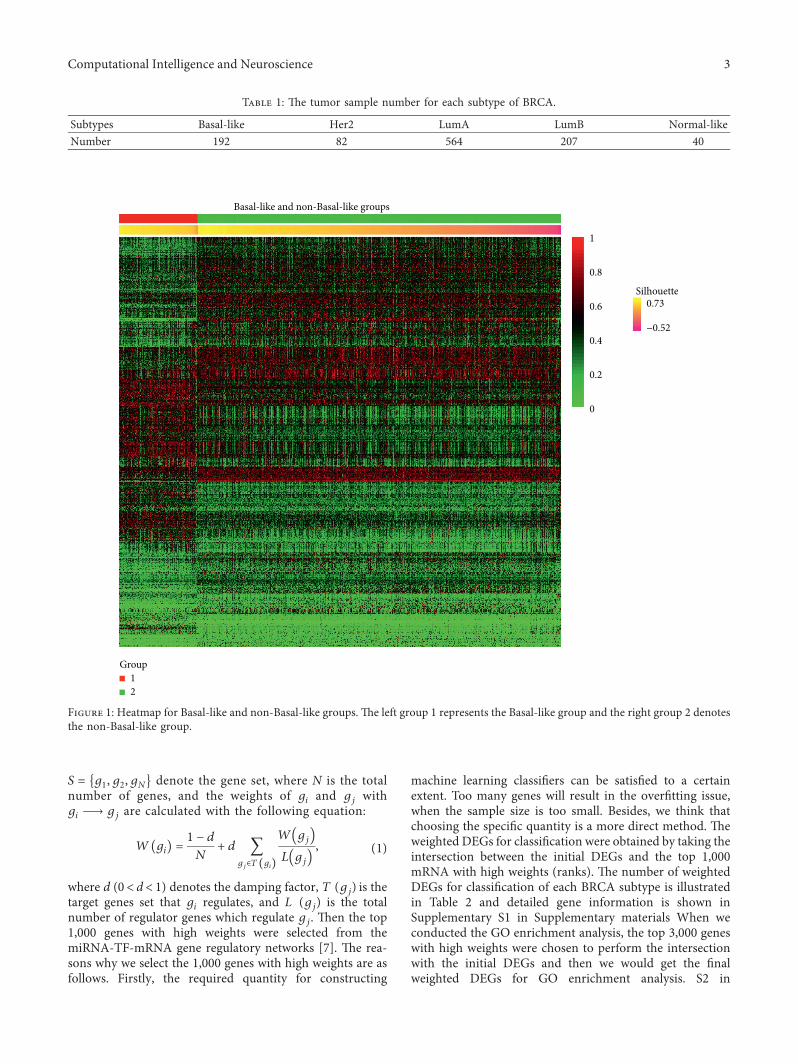
23 Construct Gene Coexpression Network with WeightedDEGs In order to explore the different interaction struc-tures between the control and experiment groups for eachsubtype the gene coexpression networks were constructedby PCC with weighted DEGs for the experiment (eg Basal-like) and control (eg non-Basal-like) groups e two genecoexpression networks will carry different interaction in-formation and distinct network structures When we ac-quired the gene coexpression networks for control andexperiment groups the edges with low values of PCC werepruned and the edges with higher PCCwere retainedWe setPCCge 0 3 as the threshold in this research Besides weutilized the symmetric matrix forms to represent the prunedgene coexpression networks with weighted DEGs Finallywe removed the shared network structures between thecontrol and experiment groups and then just focused on thedifferential structures of the upper triangular matrix edetailed information is illustrated in Figure 2
24 GO Enrichment Analysis Based on the discovery of thesignificantly differential interaction network structures wewere driven to design a novel GO enrichment analysis calledGOEGCN For the GO enrichment analysis we consideredthe two-side distinction analysis between gene coexpressionnetworks for control and experiment groups [24] Firstly theGO terms [28ndash30] with adjusted p value le005 were col-lected utilizing the weighted DEGs for each subtype Sec-ondly the distribution of coexpressed gene couples in theupper triangular matrix was regarded as the background forcontrol and experiment groups respectively e subuppertriangular matrix of the ldquogeneIDrdquo for each GO term wasfurther obtained by scanning the background (upper tri-angular matrix) of control and experiment groups re-spectively Finally the hypergeometric test [25] was used torecalculate the p values and the terms whose adjusted p
values were not greater than 005 were retained Aftercollecting and reordering the results the novel enriched GOterms were acquired for the control and experiment groupsof each subtype respectively
3 Results
e algorithm framework we propose mainly includes twosteps Firstly the initial GO terms based on the final DEGsare obtained by using Yursquos method Secondly comparedwith the DEGs the difference between coexpression networkstructures can well show the difference between the controland experiment groups as shown in Figure 2 Based on this
finding we propose a new GOEGCN method which adoptsthe hypergeometric test to explore the differences betweencoexpression network structures thereby further obtainingthe final GO enrichment analysis results Finally it is notedthat the GOEGCN method still obtains the new GO en-richment results based on the initial GO terms Howeverbecause our proposed method can better show the differencebetween the control and the experiment groups the GOenrichment results obtained are more reasonable e wholeprocess of our proposed algorithm is illustrated in Figure 3
31 BRCA Subtypes Classification Using Weighted DEGsFive kinds of binary classification models were learned onthe control (regarded as the negative class) and experiment(regarded as the positive class) groups with weighted DEGsfor each subtype Each binary classifier can make a pre-diction for an unseen sample (tissue) ree kinds of well-known machine learning approaches (ie Naive BayesRandom Forest and svmRadial [31]) were applied to trainthe model and the sampling method SMOTE [32] wasadopted to deal with the imbalanced sample size e finalclassification results using 5-fold cross-validation with 100repeats were used to measure the robustness of our proposedmethod Among them ldquoSensitivityrdquo ldquoSpecificityrdquo ldquoAccu-racyrdquo ldquoF1rdquo and ldquoAUCrdquo metrics were used to evaluate theperformance of the binary classifiers Finally a very im-portant point is that these classification results are to acertain extent to test the validity of the DEGs So theclassification approaches are only a verification one and theGO enrichment analysis between control and experimentgroups is our goal
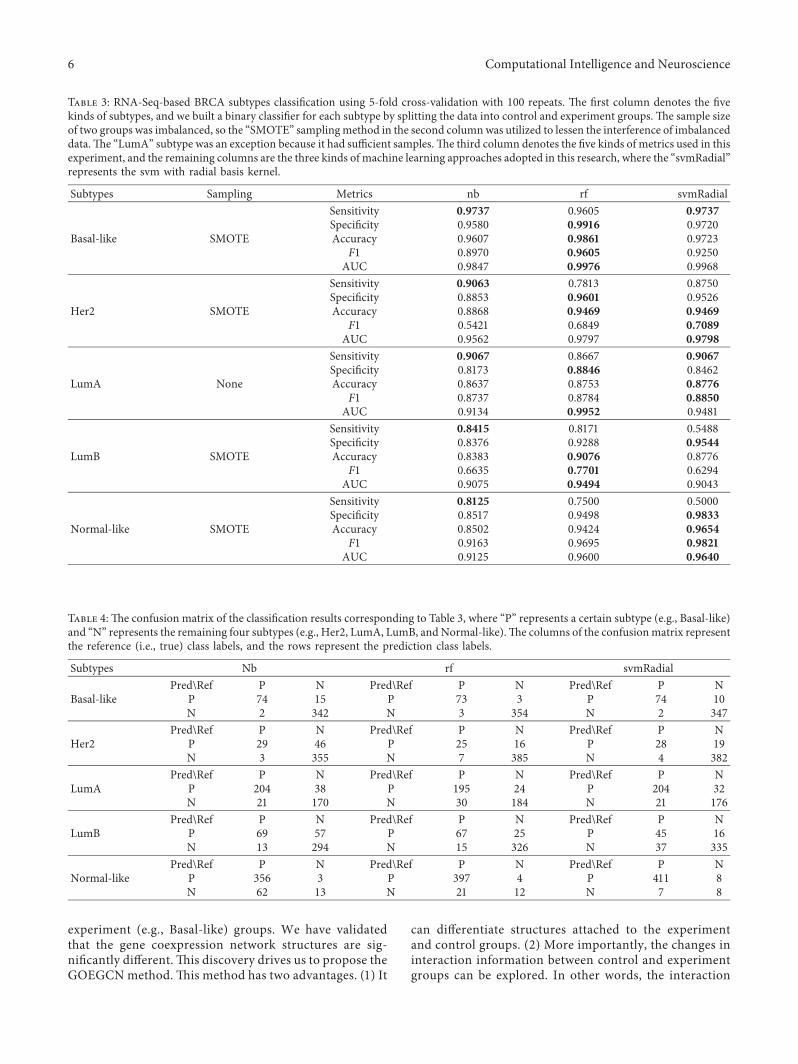
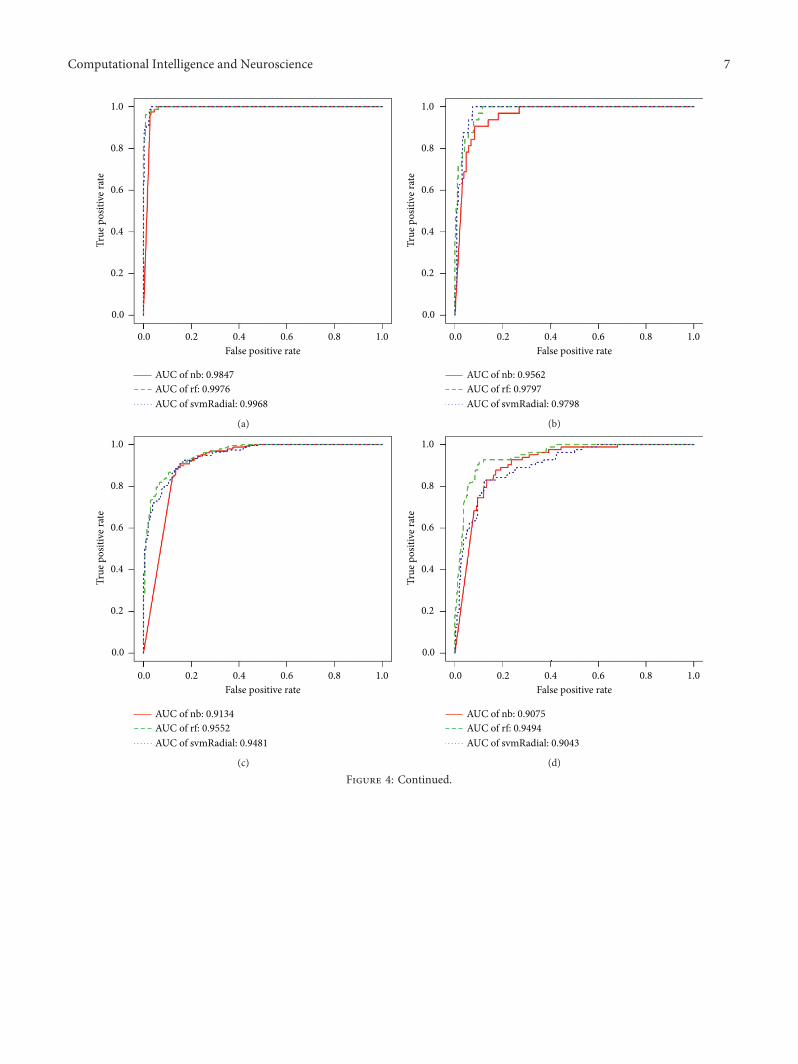
e specific classification results are reported in Table 3and the corresponding confusion matrix is shown in Table 4ree kinds of approaches including ldquoNaive Bayes (nb)rdquoldquoRandom Forest (rf )rdquo and ldquosvmRadialrdquo (SVM with radialbasis kernel) were adopted to train the models Amongthem the ROC curves of each subtype of the three kinds ofmachine learning approaches are shown in Figure 4 It wasworth noting that the high ldquosensitivityrdquo for the positive class(eg the Basal-like) showed that the binary classifier couldgive a good prediction for the class with a smaller samplesize At the same time the other four metrics (specificityaccuracy F1 and AUC) all illustrated good performancesBut for the ldquoNormal-likerdquo one only the ldquoNaive Bayesrdquo andldquoRandom Forestrdquo gave good ldquosensitivityrdquo values and the ldquoF1rdquovalues were relatively low for all the machine learning ap-proaches e possible explanations are that (1) the ldquoNor-mal-likerdquo subtype shares a similar IHC status with theldquoLumArdquo [2] and (2) some studies reveal that the clinicalsignificance of ldquoNormal-likerdquo subtype is still undeterminedand even have a suspect of the existence concerning this kindof subtype [33]
Table 2 e number of weighted DEGs of each BRCA subtype for classification
32 GO Enrichment Analysis for the BRCA Subtypes UsingGOEGCN with Weighted DEGs e weighted DEGs forconducting GO enrichment analysis are described in FileS2 in Supplementary Materials e original method toconduct the differential expression analysis for each
subtype is firstly to find DEGs between each subtype andnormal data and then use the GO terms [28ndash30] to dis-cover the corresponding significant GO terms In thispaper we propose conducting two gene coexpressionnetworks by PCC for control (eg non-Basal-like) and
Figure 2 Flowchart to discover the interaction networks structures for control and experiment groups (a) Construct the gene coexpressionnetworks by PCC e bold edges denote the higher PCC and the thin edges represent the lower PCC (b) Conduct the pruning operationand remove the edges whose PCC values are less than the cutoff (c) e symmetric matrix forms compared with step (b) (d) Remove theshared network structures between control and experiment groups and just focus on the specific structures of the upper triangular matrixfrom control and experiment groups owing to the symmetry
GO enrichment analysis using DEGs-2Obtain the weighted DEGs for classification DEGs-1 and the specific details are shown in
Table 2 and Supplementary S1
Split the data into training (60) and testing (40) sets
Train five binary classifiers using machine learning approaches on training set
Evaluate the classification results on testing set and validate the discrimination of the DEGs-1
Obtain the weighted DEGs for GO enrichment analysis DEGs-2 and the specific details are
shown in Supplementary S2
Discover the interaction networks structures for control and experiment groups as shown in
Figure 2
Obtain the initial GO terms using using enrichGO() function in clusterProfile proposed
by Yu et al
Conduct the PEGCN analysis using weighted DEGs-2 as shown in Figure 4
Obtain and reorder the final GO terms list using the p-value cutoff for control and
experiment groups
Classification models training and testing using DEGs-1
ExtendStep 1
Step 2
Step 3
Step 4
Step 5
Step 6
Step 7
Step 8
Step 9
Figure 3 Framework of our proposed algorithm
Computational Intelligence and Neuroscience 5
experiment (eg Basal-like) groups We have validatedthat the gene coexpression network structures are sig-nificantly different is discovery drives us to propose theGOEGCN method is method has two advantages (1) It
can differentiate structures attached to the experimentand control groups (2) More importantly the changes ininteraction information between control and experimentgroups can be explored In other words the interaction
Table 4 e confusion matrix of the classification results corresponding to Table 3 where ldquoPrdquo represents a certain subtype (eg Basal-like)and ldquoNrdquo represents the remaining four subtypes (eg Her2 LumA LumB and Normal-like)e columns of the confusionmatrix representthe reference (ie true) class labels and the rows represent the prediction class labels
Subtypes Nb rf svmRadial
Basal-likePredRef P N PredRef P N PredRef P N
P 74 15 P 73 3 P 74 10N 2 342 N 3 354 N 2 347
Her2PredRef P N PredRef P N PredRef P N
P 29 46 P 25 16 P 28 19N 3 355 N 7 385 N 4 382
LumAPredRef P N PredRef P N PredRef P N
P 204 38 P 195 24 P 204 32N 21 170 N 30 184 N 21 176
LumBPredRef P N PredRef P N PredRef P N
P 69 57 P 67 25 P 45 16N 13 294 N 15 326 N 37 335
Normal-likePredRef P N PredRef P N PredRef P N
P 356 3 P 397 4 P 411 8N 62 13 N 21 12 N 7 8
Table 3 RNA-Seq-based BRCA subtypes classification using 5-fold cross-validation with 100 repeats e first column denotes the fivekinds of subtypes and we built a binary classifier for each subtype by splitting the data into control and experiment groups e sample sizeof two groups was imbalanced so the ldquoSMOTErdquo samplingmethod in the second columnwas utilized to lessen the interference of imbalanceddatae ldquoLumArdquo subtype was an exception because it had sufficient samplese third column denotes the five kinds of metrics used in thisexperiment and the remaining columns are the three kinds of machine learning approaches adopted in this research where the ldquosvmRadialrdquorepresents the svm with radial basis kernel
AUC of nb 09847AUC of rf 09976AUC of svmRadial 09968
10
08
06
04
02
00
00 02 04 06 08 10
(a)
False positive rate
AUC of nb 09562AUC of rf 09797AUC of svmRadial 09798
True
pos
itive
rate
10
08
06
04
02
00
00 02 04 06 08 10
(b)
AUC of nb 09134AUC of rf 09552AUC of svmRadial 09481
True
pos
itive
rate
10
08
06
04
02
00
False positive rate00 02 04 06 08 10
(c)
AUC of nb 09075AUC of rf 09494AUC of svmRadial 09043
True
pos
itive
rate
10
08
06
04
02
00
False positive rate00 02 04 06 08 10
(d)
Figure 4 Continued
Computational Intelligence and Neuroscience 7
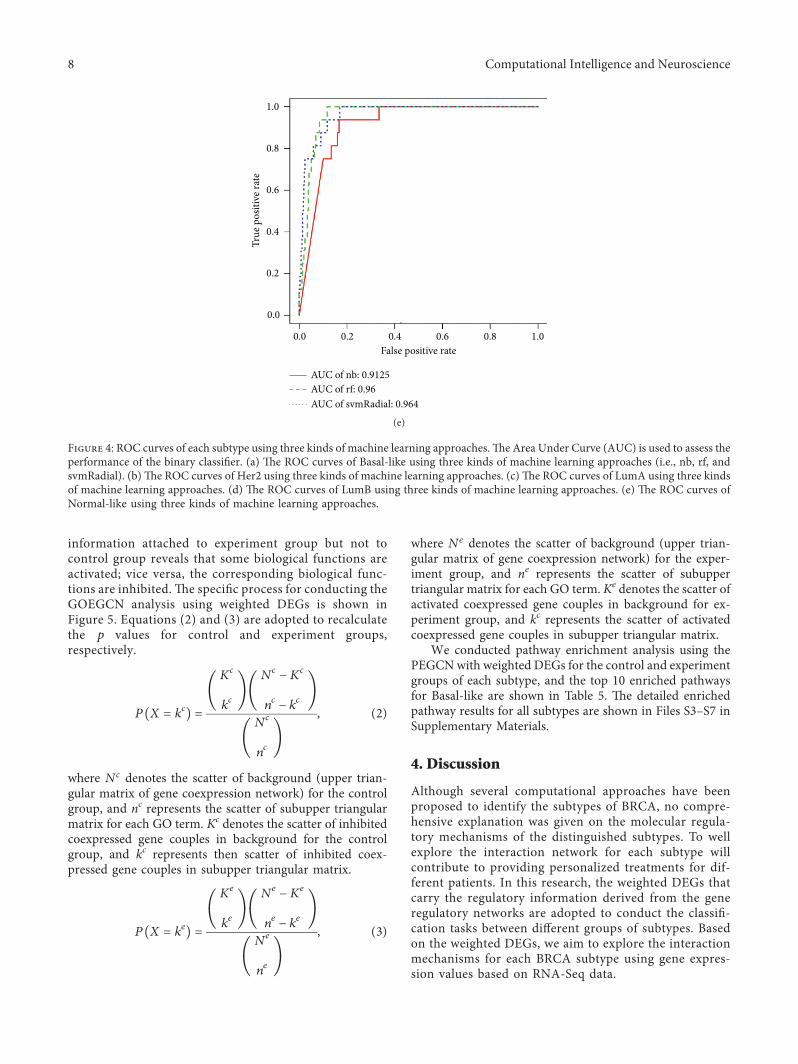
information attached to experiment group but not tocontrol group reveals that some biological functions areactivated vice versa the corresponding biological func-tions are inhibited e specific process for conducting theGOEGCN analysis using weighted DEGs is shown inFigure 5 Equations (2) and (3) are adopted to recalculatethe p values for control and experiment groupsrespectively
P X kc
( 1113857
Kc
kc
⎛⎝ ⎞⎠N
cminus K
c
nc
minus kc
⎛⎝ ⎞⎠
Nc
nc
⎛⎝ ⎞⎠
(2)
where Nc denotes the scatter of background (upper trian-gular matrix of gene coexpression network) for the controlgroup and nc represents the scatter of subupper triangularmatrix for each GO term Kc denotes the scatter of inhibitedcoexpressed gene couples in background for the controlgroup and kc represents then scatter of inhibited coex-pressed gene couples in subupper triangular matrix
P X ke
( 1113857
Ke
ke
⎛⎝ ⎞⎠N
eminus K
e
ne
minus ke
⎛⎝ ⎞⎠
Ne
ne
⎛⎝ ⎞⎠
(3)
where Ne denotes the scatter of background (upper trian-gular matrix of gene coexpression network) for the exper-iment group and ne represents the scatter of subuppertriangular matrix for each GO term Ke denotes the scatter ofactivated coexpressed gene couples in background for ex-periment group and kc represents the scatter of activatedcoexpressed gene couples in subupper triangular matrix
We conducted pathway enrichment analysis using thePEGCNwith weighted DEGs for the control and experimentgroups of each subtype and the top 10 enriched pathwaysfor Basal-like are shown in Table 5 e detailed enrichedpathway results for all subtypes are shown in Files S3ndashS7 inSupplementary Materials
4 Discussion
Although several computational approaches have beenproposed to identify the subtypes of BRCA no compre-hensive explanation was given on the molecular regula-tory mechanisms of the distinguished subtypes To wellexplore the interaction network for each subtype willcontribute to providing personalized treatments for dif-ferent patients In this research the weighted DEGs thatcarry the regulatory information derived from the generegulatory networks are adopted to conduct the classifi-cation tasks between different groups of subtypes Basedon the weighted DEGs we aim to explore the interactionmechanisms for each BRCA subtype using gene expres-sion values based on RNA-Seq data
AUC of nb 09125AUC of rf 096AUC of svmRadial 0964
True
pos
itive
rate
10
08
06
04
02
00
False positive rate00 02 04 06 08 10
(e)
Figure 4 ROC curves of each subtype using three kinds of machine learning approachese Area Under Curve (AUC) is used to assess theperformance of the binary classifier (a) e ROC curves of Basal-like using three kinds of machine learning approaches (ie nb rf andsvmRadial) (b)e ROC curves of Her2 using three kinds of machine learning approaches (c) e ROC curves of LumA using three kindsof machine learning approaches (d) e ROC curves of LumB using three kinds of machine learning approaches (e) e ROC curves ofNormal-like using three kinds of machine learning approaches
8 Computational Intelligence and Neuroscience
ID Description GeneID
GO001
GO002
GOnnn
Desc001
Desc002
Descnnn
[g1g2g4g5g6g7]
[g5g6g7g8]
[g2g3g4g5]
Control group
Experiment group
Calculate the p-value using the equation (2) for control group and
reserve the GO terms whose p-values le 005
Calculate the p-value using the equation (3) for experiment group
and reserve the GOterms whose p-values
le 005
ID Description GeneID
GO002
GOnnn
Desc002
Descnnn
[g5g6g7g8]
[g2g3g4g5]
ID Description GeneID
GO001
GOnnn-1
Desc001
Descnnn-1
[g1g2g4g5g6g7]
[g1g5g6g8g10]
g1 g2 g3 g4 g5 g6 g7 g8 g9 g10
g1 g2 g3 g4 g5 g6 g7 g8 g9 g10
g 1g 2
g 3g 4
g 5g 6
g 7g 8
g 9g 10
g 1g 2
g 3g 4
g 5g 6
g 7
g 1g 2
g 4g 5
g 6g 7
g 1g 2
g 4g 5
g 6g 7
g1 g2 g4 g5 g6 g7
g1 g2 g4 g5 g6 g7
g 8g 9
g 10
P(X = kc) = kcKc
ndashkcndashKc
ncNc
ncNc (2)
P(X = ke) = keKe
ndashkendashKe
neNe
neNe (3)
(a) (b) (c)
Figure 5 Flowchart for conducting the GOEGCN analysis using weighted DEGs (a) First of all the initial enriched GO terms are obtainedusing GO enrichment analysis en a sub symmetric coexpression matrix of ldquogeneIDrdquo from each GO term for control or experiment groupis constructed and the interaction network structures of original symmetric coexpression matrix for control or experiment group areregarded as the background (b) Adopt equations (2) and (3) to recalculate the p values for control and experiment groups respectively (c)Collect and reorder the results of enriched GO terms which are recalculated and form the final enriched GO terms list for control andexperiment groups respectively
Table 5 Top 10 enriched GO terms for Basal-like subtype of BRCA where the ldquopadjustrdquo means the p values are adjusted by the BHapproach
Basal-like Top 10 enriched GO terms p adjust
Control group
Morphogenesis of an epithelium 0Response to lipopolysaccharide 0
Response to molecule of bacterial origin 0Positive regulation of cell adhesion 0Regulation of cell-cell adhesion 0
Regulation of inflammatory response 299Eminus 12I-kappaB kinaseNF-kappaB signaling 603Eminus 12
T cell activation 103Eminus 11B cell activation 785Eminus 11
Positive regulation of response to external stimulus 635Eminus 10Ribonucleoprotein complex biogenesis 133Eminus 08
Formation of primary germ layer 129Eminus 07
Computational Intelligence and Neuroscience 9
e heatmap figures (eg Figure 1) can show the dif-ferential gene expression profiles based on the weightedDEGs Also the machine learning-based approaches areadopted to train the binary classifier for each subtype reekinds of approaches ldquoNaive Bayes (nb)rdquo ldquoRandom Forest(rf )rdquo and ldquosvmRadialrdquo were adopted to train themodels andfive kinds of metrics ldquosensitivityrdquo ldquospecificityrdquo ldquoAccuracyrdquoldquoF1rdquo and ldquoAUCrdquo were adopted to evaluate the performanceof the five binary classifiers e high metric values verify therobustness and effectiveness of our proposed method
We also explored the interaction mechanisms derivedfrom the gene coexpression networks of control and ex-periment groups and the significantly differential structuresof gene coexpression networks validate the different inter-action relationships among coexpressed gene couples Moreimportantly this discovery inspires us to further investigatethe biological function changes using the proposedGOEGCN method e novel enriched GO terms are ob-tained according to whether the interaction mechanisms ofcoexpressed gene couples are activated or inhibited etwo-side enriched GO terms will provide more informationfor GO enrichment analysis
e specific analysis of enriched GO terms for eachsubtype using GOEGCN is as follows
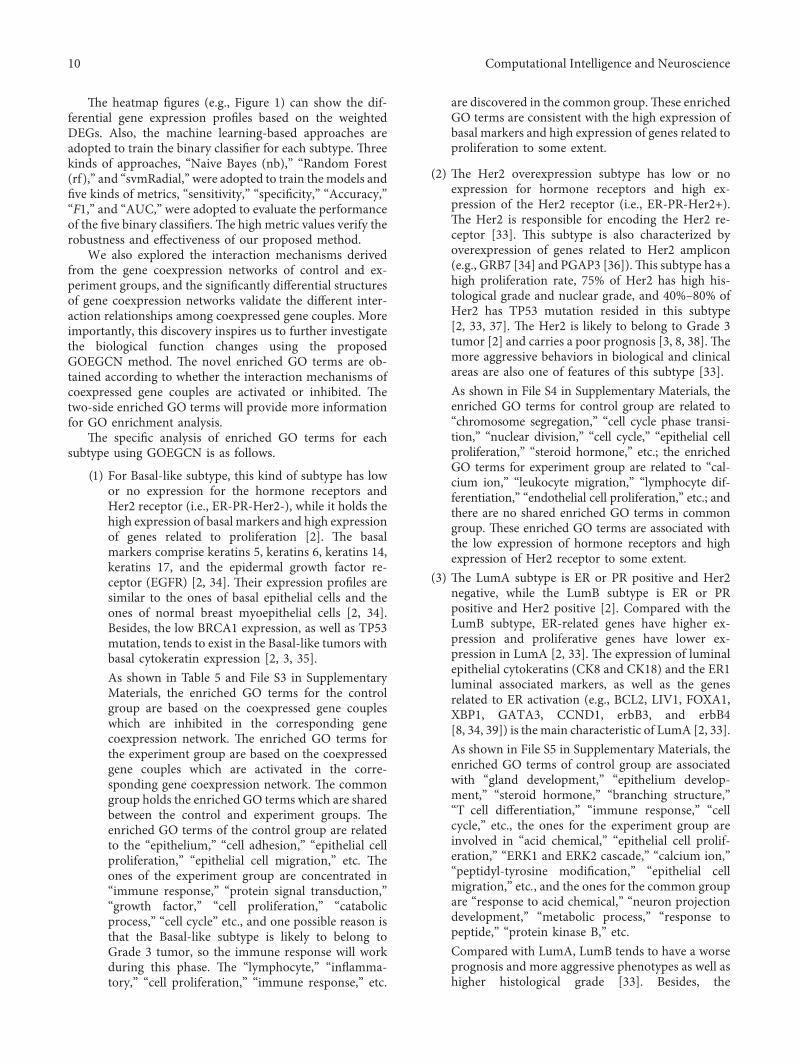
(1) For Basal-like subtype this kind of subtype has lowor no expression for the hormone receptors andHer2 receptor (ie ER-PR-Her2-) while it holds thehigh expression of basal markers and high expressionof genes related to proliferation [2] e basalmarkers comprise keratins 5 keratins 6 keratins 14keratins 17 and the epidermal growth factor re-ceptor (EGFR) [2 34] eir expression profiles aresimilar to the ones of basal epithelial cells and theones of normal breast myoepithelial cells [2 34]Besides the low BRCA1 expression as well as TP53mutation tends to exist in the Basal-like tumors withbasal cytokeratin expression [2 3 35]As shown in Table 5 and File S3 in SupplementaryMaterials the enriched GO terms for the controlgroup are based on the coexpressed gene coupleswhich are inhibited in the corresponding genecoexpression network e enriched GO terms forthe experiment group are based on the coexpressedgene couples which are activated in the corre-sponding gene coexpression network e commongroup holds the enriched GO terms which are sharedbetween the control and experiment groups eenriched GO terms of the control group are relatedto the ldquoepitheliumrdquo ldquocell adhesionrdquo ldquoepithelial cellproliferationrdquo ldquoepithelial cell migrationrdquo etc eones of the experiment group are concentrated inldquoimmune responserdquo ldquoprotein signal transductionrdquoldquogrowth factorrdquo ldquocell proliferationrdquo ldquocatabolicprocessrdquo ldquocell cyclerdquo etc and one possible reason isthat the Basal-like subtype is likely to belong toGrade 3 tumor so the immune response will workduring this phase e ldquolymphocyterdquo ldquoinflamma-toryrdquo ldquocell proliferationrdquo ldquoimmune responserdquo etc
are discovered in the common groupese enrichedGO terms are consistent with the high expression ofbasal markers and high expression of genes related toproliferation to some extent
(2) e Her2 overexpression subtype has low or noexpression for hormone receptors and high ex-pression of the Her2 receptor (ie ER-PR-Her2+)e Her2 is responsible for encoding the Her2 re-ceptor [33] is subtype is also characterized byoverexpression of genes related to Her2 amplicon(eg GRB7 [34] and PGAP3 [36])is subtype has ahigh proliferation rate 75 of Her2 has high his-tological grade and nuclear grade and 40ndash80 ofHer2 has TP53 mutation resided in this subtype[2 33 37] e Her2 is likely to belong to Grade 3tumor [2] and carries a poor prognosis [3 8 38] emore aggressive behaviors in biological and clinicalareas are also one of features of this subtype [33]As shown in File S4 in Supplementary Materials theenriched GO terms for control group are related toldquochromosome segregationrdquo ldquocell cycle phase transi-tionrdquo ldquonuclear divisionrdquo ldquocell cyclerdquo ldquoepithelial cellproliferationrdquo ldquosteroid hormonerdquo etc the enrichedGO terms for experiment group are related to ldquocal-cium ionrdquo ldquoleukocyte migrationrdquo ldquolymphocyte dif-ferentiationrdquo ldquoendothelial cell proliferationrdquo etc andthere are no shared enriched GO terms in commongroup ese enriched GO terms are associated withthe low expression of hormone receptors and highexpression of Her2 receptor to some extent
(3) e LumA subtype is ER or PR positive and Her2negative while the LumB subtype is ER or PRpositive and Her2 positive [2] Compared with theLumB subtype ER-related genes have higher ex-pression and proliferative genes have lower ex-pression in LumA [2 33] e expression of luminalepithelial cytokeratins (CK8 and CK18) and the ER1luminal associated markers as well as the genesrelated to ER activation (eg BCL2 LIV1 FOXA1XBP1 GATA3 CCND1 erbB3 and erbB4[8 34 39]) is the main characteristic of LumA [2 33]As shown in File S5 in Supplementary Materials theenriched GO terms of control group are associatedwith ldquogland developmentrdquo ldquoepithelium develop-mentrdquo ldquosteroid hormonerdquo ldquobranching structurerdquoldquoT cell differentiationrdquo ldquoimmune responserdquo ldquocellcyclerdquo etc the ones for the experiment group areinvolved in ldquoacid chemicalrdquo ldquoepithelial cell prolif-erationrdquo ldquoERK1 and ERK2 cascaderdquo ldquocalcium ionrdquoldquopeptidyl-tyrosine modificationrdquo ldquoepithelial cellmigrationrdquo etc and the ones for the common groupare ldquoresponse to acid chemicalrdquo ldquoneuron projectiondevelopmentrdquo ldquometabolic processrdquo ldquoresponse topeptiderdquo ldquoprotein kinase Brdquo etcCompared with LumA LumB tends to have a worseprognosis and more aggressive phenotypes as well ashigher histological grade [33] Besides the
10 Computational Intelligence and Neuroscience
proliferation-related genes (eg v-MYB GGHLAPTMB4 NSEP1 and CCNE1) have an increasedexpression and the genes of growth receptor sig-naling [40] also present an increased expression inLumB [33]As shown in File S6 in Supplementary Materials theenriched GO terms of the control group are asso-ciated with ldquogland developmentrdquo ldquoepithelial celldevelopmentrdquo ldquogland epithelium developmentrdquoldquoERK1 and ERK2 cascaderdquo ldquocell cyclerdquo ldquophos-phorylationrdquo etc and the ones for experiment groupare involved in ldquoextracellular matrixrdquo ldquogrowth fac-torrdquo ldquophospholipase activityrdquo ldquocell growthrdquo ldquocelladhesionrdquo ldquoangiogenesisrdquo etc and the commongroup are ldquoepithelial cell proliferationrdquo ldquosteroidhormonerdquo ldquobranching epitheliumrdquo ldquomuscle cellproliferationrdquo etc ese enriched GO terms areconsistent with the increased expression of prolif-eration-related genes and growth receptor signalingto some extent
(4) e Normal-like subtype is ER negative andor PRnegative with a low level of Ki-67 protein Few studieshave been conducted to this subtype and its specificclinical significance is still undetermined [33] eadipose tissue expression is one of its characteristicsand this subtype has the intermediate prognosis be-tween Basal-like subtype and luminal subtypes
As shown in File S7 in Supplementary Materials theenriched GO terms of the control group are associated withldquomorphogenesis of an epitheliumrdquo ldquovasculature develop-mentrdquo ldquoangiogenesisrdquo ldquogland morphogenesisrdquo ldquosteroidhormonerdquo ldquocell adhesionrdquo ldquoleukocyte migrationrdquo ldquolym-phocyte activationrdquo etc the ones for the experiment groupare involved in ldquocellular protein localizationrdquo ldquobiosyntheticprocessrdquo ldquophosphatidylinositol metabolicrdquo ldquochromatin as-semblyrdquo ldquonucleosome assemblyrdquo etc and the one for thecommon group is ldquokidney epithelium developmentrdquo
Although our proposed approaches show good perfor-mance we also admit that some limitations still exist
(1) Only the single-omics mRNA data (ie gene ex-pression data) was used to train the binary classifiersfor each subtype is main purpose is to ensure theconsistency with the subsequent enrichment analysiswhich is only available for the mRNA molecules Inspite of this our binary classifiers still perform well
(2) e interaction networks between control and ex-periment groups are derived from the gene coex-pression networks However the effective fusionbetween the gene coexpression networks and generegulatory networks will show powerful interactioninformation and this will be our follow-up work
5 Conclusion
In this paper we proposed attaching the biological im-portance of regulatory information to the differential ex-pression analysis Based on the weighted DEGs the binary
classifier for each subtype was learned e experimentalresults validated the effectiveness of the weighted DEGs andeach binary classifier for each subtype could make a goodprediction for an unseen sample More importantly weconstructed the gene coexpression networks for control andexperiment groups using weighted DEGs respectively andwe further explored the interaction mechanisms betweenthese two groups e significantly differential structuresdrove us to develop the GOEGCN to conduct GO enrich-ment analysis based on whether the coexpressed genecouples were activated or inhibited e novel p values wererecalculated using the hypergeometric test and after reor-dering the adjusted p values the novel enriched GO termswere acquired for control and experiment groups respec-tively e novel enriched GO terms could give some ex-planation for the biological function changes of each BRCAsubtype to some degree In the future we will explore theeffective fusion between gene coexpression networks andgene regulatory networks Based on the novel networkstructures we will further investigate the specific interactionmechanisms and reveal the detailed changes of biologicalfunctions across BRCA subtypes
Data Availability
e RNA-Seq-based processed data used to support thefindings of this study have been deposited in the Githubrepository (httpsgithubcomyxchspringGOEGCN_BRCA_SubtypestreemasterData) and the original data canbe accessed in the open TCGA database (httpswwwcancergovtcga)
Conflicts of Interest
e authors declare no conflicts of interest
Acknowledgments
e authors thank the CSBL groups at the University ofGeorgia USA for providing the computing resources eauthors thank Sha Cao for providing the support for con-structing a novel GO enrichment analysis method and YiZhou and Mingxin Tao for providing the assistance of datadownloading data analysis and data processing is workhas been supported by (1) the Science and TechnologyDeveloping Project of Jilin Province China (Grant no20150204007GX) (2) Doctoral Scientific Research Foun-dation of Jiangxi University of Science and Technology(Grant no jxxjbs19029) (3) the Science and TechnologyResearch Project of Jiangxi Provincial Department of Ed-ucation (Grant no GJJ190468) (4) the China ScholarshipFund and (5) the Key Laboratory of Symbolic Computationand Knowledge Engineering Ministry of Education
Supplementary Materials
Figure S1 heatmap for Her2 and non Her2 groups eleft group 1 represents the Her2 group and the right group2 denotes the non-Her2 group Figure S2 heatmap forLumA and non-LumA groups e left group 1 represents
Computational Intelligence and Neuroscience 11
the LumA group and the right group 2 denotes the non-LumA group Figure S3 heatmap for LumB and non-LumB groups e left group 1 represents the LumB groupand the right group 2 denotes the non-LumB groupFigure S4 heatmap for Normal-like and non-Normal-likegroups e left group 1 represents the Normal-like groupand the right group 2 denotes the non-Normal-like groupS1 File the detailed information of weighted DEGs forclassification S2 File the detailed information ofweighted DEGs for GO enrichment analysis S3 File thedetailed enriched GO terms results for Basal-like subtypeS4 File the detailed enriched GO terms results for Her2subtype S5 File the detailed enriched GO terms resultsfor LumA subtype S6 File the detailed enriched GO termsresults for LumB subtype S7 File the detailed enrichedGO terms results for Normal-like subtype (Supplemen-tary Materials)
References
[1] A Graudenzi C Cava G Bertoli et al ldquoPathway-basedclassification of breast cancer subtypesrdquo Frontiers in Biosci-ence vol 22 no 10 pp 1697ndash1712 2017
[2] X Dai T Li Z Bai et al ldquoBreast cancer intrinsic subtypeclassification clinical use and future trendsrdquo AmericanJournal of Cancer Research vol 5 no 10 p 2929 2015
[3] T Sorlie C M Perou R Tibshirani et al ldquoGene expressionpatterns of breast carcinomas distinguish tumor subclasseswith clinical implicationsrdquo Proceedings of the NationalAcademy of Sciences vol 98 no 19 pp 10869ndash10874 2001
[4] Z Hu C Fan D S Oh et al ldquoe molecular portraits ofbreast tumors are conserved across microarray platformsrdquoBioMed Central Genomics vol 7 no 1 p 96 2006
[5] J S Parker M Mullins M C U Cheang et al ldquoSupervisedrisk predictor of breast cancer based on intrinsic subtypesrdquoJournal of Clinical Oncology vol 27 no 8 p 1160 2009
[6] C Fan D S Oh L Wessels et al ldquoConcordance among gene-expression-based predictors for breast cancerrdquo New EnglandJournal of Medicine vol 355 no 6 pp 560ndash569 2006
[7] T Xu T D Le L Liu R Wang B Sun and J Li ldquoIdentifyingcancer subtypes from miRNA-TF-mRNA regulatory net-works and expression datardquo PLoS One vol 11 no 4 ArticleID e0152792 2016
[8] C Sotiriou S-Y Neo L M McShane et al ldquoBreast cancerclassification and prognosis based on gene expression profilesfrom a population-based studyrdquo Proceedings of the NationalAcademy of Sciences vol 100 no 18 pp 10393ndash10398 2003
[9] M V Dass M A Rasheed and M M Ali ldquoClassification oflung cancer subtypes by data mining techniquerdquo in Pro-ceedings of the 2014 International Conference on ControlInstrumentation Energy and Communication Calcutta IndiaJanuary 2014
[10] W Flynn S Namburi C Paisie et al ldquoPan-cancer machinelearning predictors of tissue of origin and molecular subtyperdquo2018
[11] H Hijazi and C Chan ldquoA classification framework applied tocancer gene expression profilesrdquo Journal of Healthcare En-gineering vol 4 no 2 pp 255ndash284 2013
[12] A Bazila Banu and P irumalaikolundusubramanianldquoComparison of bayes classifiers for breast cancer classifica-tionrdquo Asian Pacific Journal of Cancer Prevention vol 19no 10 pp 2917ndash2920 2018
[13] S Kharya and S Soni ldquoWeighted naive bayes classifier apredictive model for breast cancer detectionrdquo InternationalJournal of Computer Applications vol 133 no 9 pp 32ndash372016
[14] I Kim S Choi and S Kim ldquoBRCA-pathway a structuralintegration and visualization system of TCGA breast cancerdata on KEGG pathwaysrdquo BioMed Bioinformatics vol 19no 1 p 42 2018
[15] L Hua P Zhou L Li H Liu and Z Yang ldquoPrioritizing breastcancer subtype related miRNAs using miRNA-mRNA dys-regulated relationships extracted from their dual expressionprofilingrdquo Journal of 7eoretical Biology vol 331 pp 1ndash112013
[16] C Kang Y Huo L Xin B Tian and B Yu ldquoFeature selectionand tumor classification for microarray data using relaxedLasso and generalized multi-class support vector machinerdquoJournal of 7eoretical Biology vol 463 pp 77ndash91 2019
[17] B Tian X Wu C Chen W Qiu Q Ma and B Yu ldquoPre-dicting protein-protein interactions by fusing various Choursquospseudo components and using wavelet denoising approachrdquoJournal of 7eoretical Biology vol 462 pp 329ndash346 2019
[18] L Wang X Yan M-L Liu K-J Song X-F Sun andW-W Pan ldquoPrediction of RNA-protein interactions bycombining deep convolutional neural network with featureselection ensemble methodrdquo Journal of 7eoretical Biologyvol 461 pp 230ndash238 2019
[19] W Li and Y Yang ldquoZipfrsquos law in importance of genes forcancer classification using microarray datardquo Journal of 7e-oretical Biology vol 219 no 4 pp 539ndash551 2002
[20] A Anand and P N Suganthan ldquoMulticlass cancer classifi-cation by support vector machines with class-wise optimizedgenes and probability estimatesrdquo Journal of 7eoretical Bi-ology vol 259 no 3 pp 533ndash540 2009
[21] H S Eo J Y Heo Y Choi Y Hwang and H-S Choi ldquoApathway-based classification of breast cancer integrating dataon differentially expressed genes copy number variations andmicroRNA target genesrdquo Molecules and Cells vol 34 no 4pp 393ndash398 2012
[22] J Kang A D DrsquoAndrea and D Kozono ldquoA DNA repairpathway-focused score for prediction of outcomes in ovariancancer treated with platinum-based chemotherapyrdquo Journalof the National Cancer Institute vol 104 no 9 pp 670ndash6812012
[23] L Fang H Wang and P Li ldquoSystematic analysis reveals alncRNA-mRNA co-expression network associated withplatinum resistance in high-grade serous ovarian cancerrdquoInvestigational New Drugs vol 36 no 2 2017
[24] X Yu S Cao Y Zhou Z Yu and Y Xu ldquoCo-expressionbased cancer staging and applicationrdquo Scientific Reportsvol 10 no 1 p 10624 2020
[25] I Rivals L Personnaz L Taing and M-C Potier ldquoEnrich-ment or depletion of a go category within a class of geneswhich testrdquo Bioinformatics vol 23 no 4 pp 401ndash407 2006
[26] C W Law Y Chen W Shi and G K Smyth ldquoVOOMprecision weights unlock linear model analysis tools for RNA-seq read countsrdquo Genome Biology vol 15 no 2 p R29 2014
[27] C W Law M Alhamdoosh S Su G K Smyth andM E Ritchie ldquoRNA-seq analysis is easy as 1-2-3 with limmaglimma and edgeRrdquo F1000Research vol 5 1408 pages 2016
[28] G Yu L-G Wang Y Han and Q-Y He ldquoClusterprofiler anR package for comparing biological themes among geneclustersrdquo One Meagre Issuue Clearly Sufficient A Journal ofIntegrative Biology vol 16 no 5 pp 284ndash287 2012
12 Computational Intelligence and Neuroscience
[29] M Carlson ldquoGo db a set of annotation maps describing theentire gene ontologyrdquo 2013
[30] A Alexa and J Rahnenfuhrer ldquoTopgo enrichment analysisfor gene ontology R package version 228 0rdquo 2016
[31] M Kuhn ldquoCaret classification and regression trainingrdquoAstrophysics Source Code Library vol 1 2015
[32] N V Chawla K W Bowyer L O Hall andW P Kegelmeyer ldquoSmote synthetic minority over-samplingtechniquerdquo Journal of Artificial Intelligence Research vol 16pp 321ndash357 2002
[33] O Yersal and S Barutca ldquoBiological subtypes of breast cancerprognostic and therapeutic implicationsrdquo World Journal ofClinical Oncology vol 5 no 3 p 412 2014
[34] C M Perou T Soslashrlie M B Eisen et al ldquoMolecular portraitsof human breast tumoursrdquo Nature vol 406 no 6797 p 7472000
[35] D M Abd El-Rehim G Ball S E Pinder et al ldquoHigh-throughput protein expression analysis using tissue micro-array technology of a large well-characterised series identifiesbiologically distinct classes of breast cancer confirming recentcDNA expression analysesrdquo International Journal of Cancervol 116 no 3 pp 340ndash350 2005
[36] X Dai A Chen and Z Bai ldquoIntegrative investigation onbreast cancer in ER PR and HER2-defined subgroups usingmRNA and miRNA expression profilingrdquo Scientific Reportsvol 4 p 6566 2014
[37] S Tsutsui S Ohno S Murakami A Kataoka J Kinoshitaand Y Hachitanda ldquoPrognostic significance of the coex-pression of p53 protein and c-erbb2 in breast cancerrdquo 7eAmerican Journal of Surgery vol 185 no 2 pp 165ndash167 2003
[38] T Soslashrlie R Tibshirani J Parker et al ldquoRepeated observationof breast tumor subtypes in independent gene expression datasetsrdquo Proceedings of the National Academy of Sciencesvol 100 no 14 pp 8418ndash8423 2003
[39] L A Carey ldquorough a glass darkly advances in under-standing breast cancer biology 2000ndash2010rdquo Clinical BreastCancer vol 10 no 3 pp 188ndash195 2010
[40] J S Reis-Filho B Weigelt D Fumagalli and C SotiriouldquoMolecular profiling moving away from tumor philatelyrdquoScience Translational Medicine vol 2 no 47 pp 43ndash47 2010
Computational Intelligence and Neuroscience 13
subtype is disbelieved by some researchers owing to theindetermination of its clinical significanceerefore severalstudies only focused on the four kinds of BRCA subtypesother than the Normal-like [1 6] Other studies adopted theunsupervised methods to cluster the tumor samples into thedifferent groups and each group represented an individualsubtype [7 8] In addition many researcher have proposeddifferent machine learning approaches to carry out cancersubtyping and classification Dass et al [9] proposed animproved decision tree for lung cancer subtypes Moreimportantly the decision rules discovered in this researchcan provide reference guidelines for diagnosis and drugdevelopment of lung cancer subtypes Flynn et al [10] havestudied several machine learning approaches includingKNN random forest and SVM using gene expression datato determine the molecular subtypes of cancer Hijazi andChan [11] proposed a classification framework for cancersubtypes based on gene expression data is work studiedseveral different machine learning methods including de-cision trees random forests and SVM for subtype classi-fication Bazila Banu et al [12] focused on the performanceof the Naive Bayes classifiers in breast cancer classificationKharya and Soni [13] proposed a weighted Naive Bayesapproach for breast cancer classification
Function enrichment analysis was conducted to acquirethe enriched GO terms based on the corresponding DEGsfor each subtype [1 7] In this research we focus on theidentification of the five subtypes of BRCA (ie Basal-likeHer2 LumA LumB and Normal-like) using gene expres-sion values based on RNA-Seq data For the DEGs selectionstep we conducted statistical analysis between each subtypecompared with the remaining subtypes similar to [14]Different from the abovementioned method we strive toutilize the biological importance information of the genesHua et al [15] proposed to construct the miRNA-mRNAdysregulated network to identify breast cancer subtypesbased on miRNA expression Xu et al [7] proposed the generegulatory networks namedmiRNA-TF-mRNAwhich couldreveal the interaction relationship between molecules In-spired by this method we integrated the regulatory infor-mation to the selection of DEGs at is to say we selectedthe topM genes with high weights after we get the DEGseweighted DEGs utilize the interaction information derivedfrom the gene regulatory network and thus reveal the bi-ological importance related to the corresponding regulatorymechanism for different subtypes Machine learning-basedapproaches are being applied to conduct feature selection[16] protein-protein interactions prediction [17 18] andcancer classification [16 19 20] and show powerful per-formance in bioinformatics In order to validate the effec-tiveness and discrimination of the weighted DEGs weconstructed a machine learning-based classification modelfor each subtype and a binary classifier between control(eg non-Basal-like) and experiment (eg Basal-like)groups is learned to separate the different groups of data intothe actual classes
We believe that the different groups will certainly holddistinct molecular interaction mechanisms so we con-structed the gene coexpression networks with weighted
DEGs based on Pearson correlation coefficients (PCC) forcontrol and experiment groups respectively ere is a lot ofwork [21ndash23] that can use Pearson correlation coefficients tobuild a coexpression network based on high-throughputFPKM data from TCGA database In addition in order tomeet the requirements of the normal distribution we per-formed some data preprocessing operations such as log2transformation e significantly differential structures notonly demonstrate the different interaction relationshipamong coexpressed gene couples for control and experimentgroups but also encourage us to propose a novel enrichmentanalysis approach called GO enrichment based on genecoexpression network (GOEGCN)
For GO enrichment analysis we consider the two-sidedistinction between gene coexpression networks for controland experiment groups [24] is means that the coex-pressed gene couples which appear in the experiment groupinstead of the control group can imply that their coex-pression is activated (similar to the upregulated expression)and conversely the ones appearing in control instead ofexperiment group infer that their coexpression is inhibited(similar to the downregulated expression) is analysismethod is different from previous studies [1 7 14] Finallywe recalculated the p values using the hypergeometric test[25] and obtained the final enriched GO terms list for eachsubtype after reordering those GO terms according to theadjusted p values
2 Materials and Methods
21 Data e RNA-Seq-based gene expression data ofBRCA was downloaded from the TCGA database eFPKM values were adopted in this researchWhen the tumordata of BRCA are obtained we filtered out the genes whosemean values are less than 02 and variations are less than 2across the tumor samples We divided all the tumor samplesinto five subtypes Basal-like Her2 LumA LumB andNormal-like according to the description of BRCA clinicaldata e specific tumor sample size for each subtype isdemonstrated in Table 1 Five binary classifiers for eachsubtype were learned to validate the effectiveness and dis-crimination of the weighted DEGs andmake a prediction forthe unseen sample e gene expression profiles for Basal-like (experiment) and non-Basal-like (control) groups areshown in Figure 1 e heatmaps for the other four kinds ofsubtypes are presented in Figures S1ndashS4 e data wasnormalized using log2 transformation and inputted into thebinary classifier for each subtype
22 Statistical Analysis e counts data of control andexperiment groups were inputted into the voom [26] andlimma [27] package to get the DEGs for each subtype egenes with absolute log fold change ge05 and adjusted p
value le001 were kept and regarded as the initial DEGs Inorder to explore the biological importance of the DEGswe utilized the gene regulatory networks proposed by Xuet al to retrieve the genes with higher weights ie genesthat participate in the regulation of more target genes Let
2 Computational Intelligence and Neuroscience
S g1 g2 gN1113864 1113865 denote the gene set where N is the totalnumber of genes and the weights of gi and gj withgi⟶ gj are calculated with the following equation
W gi( 1113857 1 minus d
N+ d 1113944
gjisinT gi( )
W gj1113872 1113873
L gj1113872 1113873 (1)
where d (0lt dlt 1) denotes the damping factor T (gj) is thetarget genes set that gi regulates and L (gj) is the totalnumber of regulator genes which regulate gj en the top1000 genes with high weights were selected from themiRNA-TF-mRNA gene regulatory networks [7] e rea-sons why we select the 1000 genes with high weights are asfollows Firstly the required quantity for constructing
machine learning classifiers can be satisfied to a certainextent Too many genes will result in the overfitting issuewhen the sample size is too small Besides we think thatchoosing the specific quantity is a more direct method eweighted DEGs for classification were obtained by taking theintersection between the initial DEGs and the top 1000mRNA with high weights (ranks) e number of weightedDEGs for classification of each BRCA subtype is illustratedin Table 2 and detailed gene information is shown inSupplementary S1 in Supplementary materials When weconducted the GO enrichment analysis the top 3000 geneswith high weights were chosen to perform the intersectionwith the initial DEGs and then we would get the finalweighted DEGs for GO enrichment analysis S2 in
Silhouette073
minus052
0
02
04
06
08
1
Basal-like and non-Basal-like groups
Group12
Figure 1 Heatmap for Basal-like and non-Basal-like groups e left group 1 represents the Basal-like group and the right group 2 denotesthe non-Basal-like group
Table 1 e tumor sample number for each subtype of BRCA
Supplementary Materials File presents the detailed infor-mation of weighted DEGs of each BRCA subtype for GOenrichment analysis
23 Construct Gene Coexpression Network with WeightedDEGs In order to explore the different interaction struc-tures between the control and experiment groups for eachsubtype the gene coexpression networks were constructedby PCC with weighted DEGs for the experiment (eg Basal-like) and control (eg non-Basal-like) groups e two genecoexpression networks will carry different interaction in-formation and distinct network structures When we ac-quired the gene coexpression networks for control andexperiment groups the edges with low values of PCC werepruned and the edges with higher PCCwere retainedWe setPCCge 0 3 as the threshold in this research Besides weutilized the symmetric matrix forms to represent the prunedgene coexpression networks with weighted DEGs Finallywe removed the shared network structures between thecontrol and experiment groups and then just focused on thedifferential structures of the upper triangular matrix edetailed information is illustrated in Figure 2
24 GO Enrichment Analysis Based on the discovery of thesignificantly differential interaction network structures wewere driven to design a novel GO enrichment analysis calledGOEGCN For the GO enrichment analysis we consideredthe two-side distinction analysis between gene coexpressionnetworks for control and experiment groups [24] Firstly theGO terms [28ndash30] with adjusted p value le005 were col-lected utilizing the weighted DEGs for each subtype Sec-ondly the distribution of coexpressed gene couples in theupper triangular matrix was regarded as the background forcontrol and experiment groups respectively e subuppertriangular matrix of the ldquogeneIDrdquo for each GO term wasfurther obtained by scanning the background (upper tri-angular matrix) of control and experiment groups re-spectively Finally the hypergeometric test [25] was used torecalculate the p values and the terms whose adjusted p
values were not greater than 005 were retained Aftercollecting and reordering the results the novel enriched GOterms were acquired for the control and experiment groupsof each subtype respectively
3 Results
e algorithm framework we propose mainly includes twosteps Firstly the initial GO terms based on the final DEGsare obtained by using Yursquos method Secondly comparedwith the DEGs the difference between coexpression networkstructures can well show the difference between the controland experiment groups as shown in Figure 2 Based on this
finding we propose a new GOEGCN method which adoptsthe hypergeometric test to explore the differences betweencoexpression network structures thereby further obtainingthe final GO enrichment analysis results Finally it is notedthat the GOEGCN method still obtains the new GO en-richment results based on the initial GO terms Howeverbecause our proposed method can better show the differencebetween the control and the experiment groups the GOenrichment results obtained are more reasonable e wholeprocess of our proposed algorithm is illustrated in Figure 3
31 BRCA Subtypes Classification Using Weighted DEGsFive kinds of binary classification models were learned onthe control (regarded as the negative class) and experiment(regarded as the positive class) groups with weighted DEGsfor each subtype Each binary classifier can make a pre-diction for an unseen sample (tissue) ree kinds of well-known machine learning approaches (ie Naive BayesRandom Forest and svmRadial [31]) were applied to trainthe model and the sampling method SMOTE [32] wasadopted to deal with the imbalanced sample size e finalclassification results using 5-fold cross-validation with 100repeats were used to measure the robustness of our proposedmethod Among them ldquoSensitivityrdquo ldquoSpecificityrdquo ldquoAccu-racyrdquo ldquoF1rdquo and ldquoAUCrdquo metrics were used to evaluate theperformance of the binary classifiers Finally a very im-portant point is that these classification results are to acertain extent to test the validity of the DEGs So theclassification approaches are only a verification one and theGO enrichment analysis between control and experimentgroups is our goal
e specific classification results are reported in Table 3and the corresponding confusion matrix is shown in Table 4ree kinds of approaches including ldquoNaive Bayes (nb)rdquoldquoRandom Forest (rf )rdquo and ldquosvmRadialrdquo (SVM with radialbasis kernel) were adopted to train the models Amongthem the ROC curves of each subtype of the three kinds ofmachine learning approaches are shown in Figure 4 It wasworth noting that the high ldquosensitivityrdquo for the positive class(eg the Basal-like) showed that the binary classifier couldgive a good prediction for the class with a smaller samplesize At the same time the other four metrics (specificityaccuracy F1 and AUC) all illustrated good performancesBut for the ldquoNormal-likerdquo one only the ldquoNaive Bayesrdquo andldquoRandom Forestrdquo gave good ldquosensitivityrdquo values and the ldquoF1rdquovalues were relatively low for all the machine learning ap-proaches e possible explanations are that (1) the ldquoNor-mal-likerdquo subtype shares a similar IHC status with theldquoLumArdquo [2] and (2) some studies reveal that the clinicalsignificance of ldquoNormal-likerdquo subtype is still undeterminedand even have a suspect of the existence concerning this kindof subtype [33]
Table 2 e number of weighted DEGs of each BRCA subtype for classification
32 GO Enrichment Analysis for the BRCA Subtypes UsingGOEGCN with Weighted DEGs e weighted DEGs forconducting GO enrichment analysis are described in FileS2 in Supplementary Materials e original method toconduct the differential expression analysis for each
subtype is firstly to find DEGs between each subtype andnormal data and then use the GO terms [28ndash30] to dis-cover the corresponding significant GO terms In thispaper we propose conducting two gene coexpressionnetworks by PCC for control (eg non-Basal-like) and
Figure 2 Flowchart to discover the interaction networks structures for control and experiment groups (a) Construct the gene coexpressionnetworks by PCC e bold edges denote the higher PCC and the thin edges represent the lower PCC (b) Conduct the pruning operationand remove the edges whose PCC values are less than the cutoff (c) e symmetric matrix forms compared with step (b) (d) Remove theshared network structures between control and experiment groups and just focus on the specific structures of the upper triangular matrixfrom control and experiment groups owing to the symmetry
GO enrichment analysis using DEGs-2Obtain the weighted DEGs for classification DEGs-1 and the specific details are shown in
Table 2 and Supplementary S1
Split the data into training (60) and testing (40) sets
Train five binary classifiers using machine learning approaches on training set
Evaluate the classification results on testing set and validate the discrimination of the DEGs-1
Obtain the weighted DEGs for GO enrichment analysis DEGs-2 and the specific details are
shown in Supplementary S2
Discover the interaction networks structures for control and experiment groups as shown in
Figure 2
Obtain the initial GO terms using using enrichGO() function in clusterProfile proposed
by Yu et al
Conduct the PEGCN analysis using weighted DEGs-2 as shown in Figure 4
Obtain and reorder the final GO terms list using the p-value cutoff for control and
experiment groups
Classification models training and testing using DEGs-1
ExtendStep 1
Step 2
Step 3
Step 4
Step 5
Step 6
Step 7
Step 8
Step 9
Figure 3 Framework of our proposed algorithm
Computational Intelligence and Neuroscience 5
experiment (eg Basal-like) groups We have validatedthat the gene coexpression network structures are sig-nificantly different is discovery drives us to propose theGOEGCN method is method has two advantages (1) It
can differentiate structures attached to the experimentand control groups (2) More importantly the changes ininteraction information between control and experimentgroups can be explored In other words the interaction
Table 4 e confusion matrix of the classification results corresponding to Table 3 where ldquoPrdquo represents a certain subtype (eg Basal-like)and ldquoNrdquo represents the remaining four subtypes (eg Her2 LumA LumB and Normal-like)e columns of the confusionmatrix representthe reference (ie true) class labels and the rows represent the prediction class labels
Subtypes Nb rf svmRadial
Basal-likePredRef P N PredRef P N PredRef P N
P 74 15 P 73 3 P 74 10N 2 342 N 3 354 N 2 347
Her2PredRef P N PredRef P N PredRef P N
P 29 46 P 25 16 P 28 19N 3 355 N 7 385 N 4 382
LumAPredRef P N PredRef P N PredRef P N
P 204 38 P 195 24 P 204 32N 21 170 N 30 184 N 21 176
LumBPredRef P N PredRef P N PredRef P N
P 69 57 P 67 25 P 45 16N 13 294 N 15 326 N 37 335
Normal-likePredRef P N PredRef P N PredRef P N
P 356 3 P 397 4 P 411 8N 62 13 N 21 12 N 7 8
Table 3 RNA-Seq-based BRCA subtypes classification using 5-fold cross-validation with 100 repeats e first column denotes the fivekinds of subtypes and we built a binary classifier for each subtype by splitting the data into control and experiment groups e sample sizeof two groups was imbalanced so the ldquoSMOTErdquo samplingmethod in the second columnwas utilized to lessen the interference of imbalanceddatae ldquoLumArdquo subtype was an exception because it had sufficient samplese third column denotes the five kinds of metrics used in thisexperiment and the remaining columns are the three kinds of machine learning approaches adopted in this research where the ldquosvmRadialrdquorepresents the svm with radial basis kernel
AUC of nb 09847AUC of rf 09976AUC of svmRadial 09968
10
08
06
04
02
00
00 02 04 06 08 10
(a)
False positive rate
AUC of nb 09562AUC of rf 09797AUC of svmRadial 09798
True
pos
itive
rate
10
08
06
04
02
00
00 02 04 06 08 10
(b)
AUC of nb 09134AUC of rf 09552AUC of svmRadial 09481
True
pos
itive
rate
10
08
06
04
02
00
False positive rate00 02 04 06 08 10
(c)
AUC of nb 09075AUC of rf 09494AUC of svmRadial 09043
True
pos
itive
rate
10
08
06
04
02
00
False positive rate00 02 04 06 08 10
(d)
Figure 4 Continued
Computational Intelligence and Neuroscience 7
information attached to experiment group but not tocontrol group reveals that some biological functions areactivated vice versa the corresponding biological func-tions are inhibited e specific process for conducting theGOEGCN analysis using weighted DEGs is shown inFigure 5 Equations (2) and (3) are adopted to recalculatethe p values for control and experiment groupsrespectively
P X kc
( 1113857
Kc
kc
⎛⎝ ⎞⎠N
cminus K
c
nc
minus kc
⎛⎝ ⎞⎠
Nc
nc
⎛⎝ ⎞⎠
(2)
where Nc denotes the scatter of background (upper trian-gular matrix of gene coexpression network) for the controlgroup and nc represents the scatter of subupper triangularmatrix for each GO term Kc denotes the scatter of inhibitedcoexpressed gene couples in background for the controlgroup and kc represents then scatter of inhibited coex-pressed gene couples in subupper triangular matrix
P X ke
( 1113857
Ke
ke
⎛⎝ ⎞⎠N
eminus K
e
ne
minus ke
⎛⎝ ⎞⎠
Ne
ne
⎛⎝ ⎞⎠
(3)
where Ne denotes the scatter of background (upper trian-gular matrix of gene coexpression network) for the exper-iment group and ne represents the scatter of subuppertriangular matrix for each GO term Ke denotes the scatter ofactivated coexpressed gene couples in background for ex-periment group and kc represents the scatter of activatedcoexpressed gene couples in subupper triangular matrix
We conducted pathway enrichment analysis using thePEGCNwith weighted DEGs for the control and experimentgroups of each subtype and the top 10 enriched pathwaysfor Basal-like are shown in Table 5 e detailed enrichedpathway results for all subtypes are shown in Files S3ndashS7 inSupplementary Materials
4 Discussion
Although several computational approaches have beenproposed to identify the subtypes of BRCA no compre-hensive explanation was given on the molecular regula-tory mechanisms of the distinguished subtypes To wellexplore the interaction network for each subtype willcontribute to providing personalized treatments for dif-ferent patients In this research the weighted DEGs thatcarry the regulatory information derived from the generegulatory networks are adopted to conduct the classifi-cation tasks between different groups of subtypes Basedon the weighted DEGs we aim to explore the interactionmechanisms for each BRCA subtype using gene expres-sion values based on RNA-Seq data
AUC of nb 09125AUC of rf 096AUC of svmRadial 0964
True
pos
itive
rate
10
08
06
04
02
00
False positive rate00 02 04 06 08 10
(e)
Figure 4 ROC curves of each subtype using three kinds of machine learning approachese Area Under Curve (AUC) is used to assess theperformance of the binary classifier (a) e ROC curves of Basal-like using three kinds of machine learning approaches (ie nb rf andsvmRadial) (b)e ROC curves of Her2 using three kinds of machine learning approaches (c) e ROC curves of LumA using three kindsof machine learning approaches (d) e ROC curves of LumB using three kinds of machine learning approaches (e) e ROC curves ofNormal-like using three kinds of machine learning approaches
8 Computational Intelligence and Neuroscience
ID Description GeneID
GO001
GO002
GOnnn
Desc001
Desc002
Descnnn
[g1g2g4g5g6g7]
[g5g6g7g8]
[g2g3g4g5]
Control group
Experiment group
Calculate the p-value using the equation (2) for control group and
reserve the GO terms whose p-values le 005
Calculate the p-value using the equation (3) for experiment group
and reserve the GOterms whose p-values
le 005
ID Description GeneID
GO002
GOnnn
Desc002
Descnnn
[g5g6g7g8]
[g2g3g4g5]
ID Description GeneID
GO001
GOnnn-1
Desc001
Descnnn-1
[g1g2g4g5g6g7]
[g1g5g6g8g10]
g1 g2 g3 g4 g5 g6 g7 g8 g9 g10
g1 g2 g3 g4 g5 g6 g7 g8 g9 g10
g 1g 2
g 3g 4
g 5g 6
g 7g 8
g 9g 10
g 1g 2
g 3g 4
g 5g 6
g 7
g 1g 2
g 4g 5
g 6g 7
g 1g 2
g 4g 5
g 6g 7
g1 g2 g4 g5 g6 g7
g1 g2 g4 g5 g6 g7
g 8g 9
g 10
P(X = kc) = kcKc
ndashkcndashKc
ncNc
ncNc (2)
P(X = ke) = keKe
ndashkendashKe
neNe
neNe (3)
(a) (b) (c)
Figure 5 Flowchart for conducting the GOEGCN analysis using weighted DEGs (a) First of all the initial enriched GO terms are obtainedusing GO enrichment analysis en a sub symmetric coexpression matrix of ldquogeneIDrdquo from each GO term for control or experiment groupis constructed and the interaction network structures of original symmetric coexpression matrix for control or experiment group areregarded as the background (b) Adopt equations (2) and (3) to recalculate the p values for control and experiment groups respectively (c)Collect and reorder the results of enriched GO terms which are recalculated and form the final enriched GO terms list for control andexperiment groups respectively
Table 5 Top 10 enriched GO terms for Basal-like subtype of BRCA where the ldquopadjustrdquo means the p values are adjusted by the BHapproach
Basal-like Top 10 enriched GO terms p adjust
Control group
Morphogenesis of an epithelium 0Response to lipopolysaccharide 0
Response to molecule of bacterial origin 0Positive regulation of cell adhesion 0Regulation of cell-cell adhesion 0
Regulation of inflammatory response 299Eminus 12I-kappaB kinaseNF-kappaB signaling 603Eminus 12
T cell activation 103Eminus 11B cell activation 785Eminus 11
Positive regulation of response to external stimulus 635Eminus 10Ribonucleoprotein complex biogenesis 133Eminus 08
Formation of primary germ layer 129Eminus 07
Computational Intelligence and Neuroscience 9
e heatmap figures (eg Figure 1) can show the dif-ferential gene expression profiles based on the weightedDEGs Also the machine learning-based approaches areadopted to train the binary classifier for each subtype reekinds of approaches ldquoNaive Bayes (nb)rdquo ldquoRandom Forest(rf )rdquo and ldquosvmRadialrdquo were adopted to train themodels andfive kinds of metrics ldquosensitivityrdquo ldquospecificityrdquo ldquoAccuracyrdquoldquoF1rdquo and ldquoAUCrdquo were adopted to evaluate the performanceof the five binary classifiers e high metric values verify therobustness and effectiveness of our proposed method
We also explored the interaction mechanisms derivedfrom the gene coexpression networks of control and ex-periment groups and the significantly differential structuresof gene coexpression networks validate the different inter-action relationships among coexpressed gene couples Moreimportantly this discovery inspires us to further investigatethe biological function changes using the proposedGOEGCN method e novel enriched GO terms are ob-tained according to whether the interaction mechanisms ofcoexpressed gene couples are activated or inhibited etwo-side enriched GO terms will provide more informationfor GO enrichment analysis
e specific analysis of enriched GO terms for eachsubtype using GOEGCN is as follows
(1) For Basal-like subtype this kind of subtype has lowor no expression for the hormone receptors andHer2 receptor (ie ER-PR-Her2-) while it holds thehigh expression of basal markers and high expressionof genes related to proliferation [2] e basalmarkers comprise keratins 5 keratins 6 keratins 14keratins 17 and the epidermal growth factor re-ceptor (EGFR) [2 34] eir expression profiles aresimilar to the ones of basal epithelial cells and theones of normal breast myoepithelial cells [2 34]Besides the low BRCA1 expression as well as TP53mutation tends to exist in the Basal-like tumors withbasal cytokeratin expression [2 3 35]As shown in Table 5 and File S3 in SupplementaryMaterials the enriched GO terms for the controlgroup are based on the coexpressed gene coupleswhich are inhibited in the corresponding genecoexpression network e enriched GO terms forthe experiment group are based on the coexpressedgene couples which are activated in the corre-sponding gene coexpression network e commongroup holds the enriched GO terms which are sharedbetween the control and experiment groups eenriched GO terms of the control group are relatedto the ldquoepitheliumrdquo ldquocell adhesionrdquo ldquoepithelial cellproliferationrdquo ldquoepithelial cell migrationrdquo etc eones of the experiment group are concentrated inldquoimmune responserdquo ldquoprotein signal transductionrdquoldquogrowth factorrdquo ldquocell proliferationrdquo ldquocatabolicprocessrdquo ldquocell cyclerdquo etc and one possible reason isthat the Basal-like subtype is likely to belong toGrade 3 tumor so the immune response will workduring this phase e ldquolymphocyterdquo ldquoinflamma-toryrdquo ldquocell proliferationrdquo ldquoimmune responserdquo etc
are discovered in the common groupese enrichedGO terms are consistent with the high expression ofbasal markers and high expression of genes related toproliferation to some extent
(2) e Her2 overexpression subtype has low or noexpression for hormone receptors and high ex-pression of the Her2 receptor (ie ER-PR-Her2+)e Her2 is responsible for encoding the Her2 re-ceptor [33] is subtype is also characterized byoverexpression of genes related to Her2 amplicon(eg GRB7 [34] and PGAP3 [36])is subtype has ahigh proliferation rate 75 of Her2 has high his-tological grade and nuclear grade and 40ndash80 ofHer2 has TP53 mutation resided in this subtype[2 33 37] e Her2 is likely to belong to Grade 3tumor [2] and carries a poor prognosis [3 8 38] emore aggressive behaviors in biological and clinicalareas are also one of features of this subtype [33]As shown in File S4 in Supplementary Materials theenriched GO terms for control group are related toldquochromosome segregationrdquo ldquocell cycle phase transi-tionrdquo ldquonuclear divisionrdquo ldquocell cyclerdquo ldquoepithelial cellproliferationrdquo ldquosteroid hormonerdquo etc the enrichedGO terms for experiment group are related to ldquocal-cium ionrdquo ldquoleukocyte migrationrdquo ldquolymphocyte dif-ferentiationrdquo ldquoendothelial cell proliferationrdquo etc andthere are no shared enriched GO terms in commongroup ese enriched GO terms are associated withthe low expression of hormone receptors and highexpression of Her2 receptor to some extent
(3) e LumA subtype is ER or PR positive and Her2negative while the LumB subtype is ER or PRpositive and Her2 positive [2] Compared with theLumB subtype ER-related genes have higher ex-pression and proliferative genes have lower ex-pression in LumA [2 33] e expression of luminalepithelial cytokeratins (CK8 and CK18) and the ER1luminal associated markers as well as the genesrelated to ER activation (eg BCL2 LIV1 FOXA1XBP1 GATA3 CCND1 erbB3 and erbB4[8 34 39]) is the main characteristic of LumA [2 33]As shown in File S5 in Supplementary Materials theenriched GO terms of control group are associatedwith ldquogland developmentrdquo ldquoepithelium develop-mentrdquo ldquosteroid hormonerdquo ldquobranching structurerdquoldquoT cell differentiationrdquo ldquoimmune responserdquo ldquocellcyclerdquo etc the ones for the experiment group areinvolved in ldquoacid chemicalrdquo ldquoepithelial cell prolif-erationrdquo ldquoERK1 and ERK2 cascaderdquo ldquocalcium ionrdquoldquopeptidyl-tyrosine modificationrdquo ldquoepithelial cellmigrationrdquo etc and the ones for the common groupare ldquoresponse to acid chemicalrdquo ldquoneuron projectiondevelopmentrdquo ldquometabolic processrdquo ldquoresponse topeptiderdquo ldquoprotein kinase Brdquo etcCompared with LumA LumB tends to have a worseprognosis and more aggressive phenotypes as well ashigher histological grade [33] Besides the
10 Computational Intelligence and Neuroscience
proliferation-related genes (eg v-MYB GGHLAPTMB4 NSEP1 and CCNE1) have an increasedexpression and the genes of growth receptor sig-naling [40] also present an increased expression inLumB [33]As shown in File S6 in Supplementary Materials theenriched GO terms of the control group are asso-ciated with ldquogland developmentrdquo ldquoepithelial celldevelopmentrdquo ldquogland epithelium developmentrdquoldquoERK1 and ERK2 cascaderdquo ldquocell cyclerdquo ldquophos-phorylationrdquo etc and the ones for experiment groupare involved in ldquoextracellular matrixrdquo ldquogrowth fac-torrdquo ldquophospholipase activityrdquo ldquocell growthrdquo ldquocelladhesionrdquo ldquoangiogenesisrdquo etc and the commongroup are ldquoepithelial cell proliferationrdquo ldquosteroidhormonerdquo ldquobranching epitheliumrdquo ldquomuscle cellproliferationrdquo etc ese enriched GO terms areconsistent with the increased expression of prolif-eration-related genes and growth receptor signalingto some extent
(4) e Normal-like subtype is ER negative andor PRnegative with a low level of Ki-67 protein Few studieshave been conducted to this subtype and its specificclinical significance is still undetermined [33] eadipose tissue expression is one of its characteristicsand this subtype has the intermediate prognosis be-tween Basal-like subtype and luminal subtypes
As shown in File S7 in Supplementary Materials theenriched GO terms of the control group are associated withldquomorphogenesis of an epitheliumrdquo ldquovasculature develop-mentrdquo ldquoangiogenesisrdquo ldquogland morphogenesisrdquo ldquosteroidhormonerdquo ldquocell adhesionrdquo ldquoleukocyte migrationrdquo ldquolym-phocyte activationrdquo etc the ones for the experiment groupare involved in ldquocellular protein localizationrdquo ldquobiosyntheticprocessrdquo ldquophosphatidylinositol metabolicrdquo ldquochromatin as-semblyrdquo ldquonucleosome assemblyrdquo etc and the one for thecommon group is ldquokidney epithelium developmentrdquo
Although our proposed approaches show good perfor-mance we also admit that some limitations still exist
(1) Only the single-omics mRNA data (ie gene ex-pression data) was used to train the binary classifiersfor each subtype is main purpose is to ensure theconsistency with the subsequent enrichment analysiswhich is only available for the mRNA molecules Inspite of this our binary classifiers still perform well
(2) e interaction networks between control and ex-periment groups are derived from the gene coex-pression networks However the effective fusionbetween the gene coexpression networks and generegulatory networks will show powerful interactioninformation and this will be our follow-up work
5 Conclusion
In this paper we proposed attaching the biological im-portance of regulatory information to the differential ex-pression analysis Based on the weighted DEGs the binary
classifier for each subtype was learned e experimentalresults validated the effectiveness of the weighted DEGs andeach binary classifier for each subtype could make a goodprediction for an unseen sample More importantly weconstructed the gene coexpression networks for control andexperiment groups using weighted DEGs respectively andwe further explored the interaction mechanisms betweenthese two groups e significantly differential structuresdrove us to develop the GOEGCN to conduct GO enrich-ment analysis based on whether the coexpressed genecouples were activated or inhibited e novel p values wererecalculated using the hypergeometric test and after reor-dering the adjusted p values the novel enriched GO termswere acquired for control and experiment groups respec-tively e novel enriched GO terms could give some ex-planation for the biological function changes of each BRCAsubtype to some degree In the future we will explore theeffective fusion between gene coexpression networks andgene regulatory networks Based on the novel networkstructures we will further investigate the specific interactionmechanisms and reveal the detailed changes of biologicalfunctions across BRCA subtypes
Data Availability
e RNA-Seq-based processed data used to support thefindings of this study have been deposited in the Githubrepository (httpsgithubcomyxchspringGOEGCN_BRCA_SubtypestreemasterData) and the original data canbe accessed in the open TCGA database (httpswwwcancergovtcga)
Conflicts of Interest
e authors declare no conflicts of interest
Acknowledgments
e authors thank the CSBL groups at the University ofGeorgia USA for providing the computing resources eauthors thank Sha Cao for providing the support for con-structing a novel GO enrichment analysis method and YiZhou and Mingxin Tao for providing the assistance of datadownloading data analysis and data processing is workhas been supported by (1) the Science and TechnologyDeveloping Project of Jilin Province China (Grant no20150204007GX) (2) Doctoral Scientific Research Foun-dation of Jiangxi University of Science and Technology(Grant no jxxjbs19029) (3) the Science and TechnologyResearch Project of Jiangxi Provincial Department of Ed-ucation (Grant no GJJ190468) (4) the China ScholarshipFund and (5) the Key Laboratory of Symbolic Computationand Knowledge Engineering Ministry of Education
Supplementary Materials
Figure S1 heatmap for Her2 and non Her2 groups eleft group 1 represents the Her2 group and the right group2 denotes the non-Her2 group Figure S2 heatmap forLumA and non-LumA groups e left group 1 represents
Computational Intelligence and Neuroscience 11
the LumA group and the right group 2 denotes the non-LumA group Figure S3 heatmap for LumB and non-LumB groups e left group 1 represents the LumB groupand the right group 2 denotes the non-LumB groupFigure S4 heatmap for Normal-like and non-Normal-likegroups e left group 1 represents the Normal-like groupand the right group 2 denotes the non-Normal-like groupS1 File the detailed information of weighted DEGs forclassification S2 File the detailed information ofweighted DEGs for GO enrichment analysis S3 File thedetailed enriched GO terms results for Basal-like subtypeS4 File the detailed enriched GO terms results for Her2subtype S5 File the detailed enriched GO terms resultsfor LumA subtype S6 File the detailed enriched GO termsresults for LumB subtype S7 File the detailed enrichedGO terms results for Normal-like subtype (Supplemen-tary Materials)
References
[1] A Graudenzi C Cava G Bertoli et al ldquoPathway-basedclassification of breast cancer subtypesrdquo Frontiers in Biosci-ence vol 22 no 10 pp 1697ndash1712 2017
[2] X Dai T Li Z Bai et al ldquoBreast cancer intrinsic subtypeclassification clinical use and future trendsrdquo AmericanJournal of Cancer Research vol 5 no 10 p 2929 2015
[3] T Sorlie C M Perou R Tibshirani et al ldquoGene expressionpatterns of breast carcinomas distinguish tumor subclasseswith clinical implicationsrdquo Proceedings of the NationalAcademy of Sciences vol 98 no 19 pp 10869ndash10874 2001
[4] Z Hu C Fan D S Oh et al ldquoe molecular portraits ofbreast tumors are conserved across microarray platformsrdquoBioMed Central Genomics vol 7 no 1 p 96 2006
[5] J S Parker M Mullins M C U Cheang et al ldquoSupervisedrisk predictor of breast cancer based on intrinsic subtypesrdquoJournal of Clinical Oncology vol 27 no 8 p 1160 2009
[6] C Fan D S Oh L Wessels et al ldquoConcordance among gene-expression-based predictors for breast cancerrdquo New EnglandJournal of Medicine vol 355 no 6 pp 560ndash569 2006
[7] T Xu T D Le L Liu R Wang B Sun and J Li ldquoIdentifyingcancer subtypes from miRNA-TF-mRNA regulatory net-works and expression datardquo PLoS One vol 11 no 4 ArticleID e0152792 2016
[8] C Sotiriou S-Y Neo L M McShane et al ldquoBreast cancerclassification and prognosis based on gene expression profilesfrom a population-based studyrdquo Proceedings of the NationalAcademy of Sciences vol 100 no 18 pp 10393ndash10398 2003
[9] M V Dass M A Rasheed and M M Ali ldquoClassification oflung cancer subtypes by data mining techniquerdquo in Pro-ceedings of the 2014 International Conference on ControlInstrumentation Energy and Communication Calcutta IndiaJanuary 2014
[10] W Flynn S Namburi C Paisie et al ldquoPan-cancer machinelearning predictors of tissue of origin and molecular subtyperdquo2018
[11] H Hijazi and C Chan ldquoA classification framework applied tocancer gene expression profilesrdquo Journal of Healthcare En-gineering vol 4 no 2 pp 255ndash284 2013
[12] A Bazila Banu and P irumalaikolundusubramanianldquoComparison of bayes classifiers for breast cancer classifica-tionrdquo Asian Pacific Journal of Cancer Prevention vol 19no 10 pp 2917ndash2920 2018
[13] S Kharya and S Soni ldquoWeighted naive bayes classifier apredictive model for breast cancer detectionrdquo InternationalJournal of Computer Applications vol 133 no 9 pp 32ndash372016
[14] I Kim S Choi and S Kim ldquoBRCA-pathway a structuralintegration and visualization system of TCGA breast cancerdata on KEGG pathwaysrdquo BioMed Bioinformatics vol 19no 1 p 42 2018
[15] L Hua P Zhou L Li H Liu and Z Yang ldquoPrioritizing breastcancer subtype related miRNAs using miRNA-mRNA dys-regulated relationships extracted from their dual expressionprofilingrdquo Journal of 7eoretical Biology vol 331 pp 1ndash112013
[16] C Kang Y Huo L Xin B Tian and B Yu ldquoFeature selectionand tumor classification for microarray data using relaxedLasso and generalized multi-class support vector machinerdquoJournal of 7eoretical Biology vol 463 pp 77ndash91 2019
[17] B Tian X Wu C Chen W Qiu Q Ma and B Yu ldquoPre-dicting protein-protein interactions by fusing various Choursquospseudo components and using wavelet denoising approachrdquoJournal of 7eoretical Biology vol 462 pp 329ndash346 2019
[18] L Wang X Yan M-L Liu K-J Song X-F Sun andW-W Pan ldquoPrediction of RNA-protein interactions bycombining deep convolutional neural network with featureselection ensemble methodrdquo Journal of 7eoretical Biologyvol 461 pp 230ndash238 2019
[19] W Li and Y Yang ldquoZipfrsquos law in importance of genes forcancer classification using microarray datardquo Journal of 7e-oretical Biology vol 219 no 4 pp 539ndash551 2002
[20] A Anand and P N Suganthan ldquoMulticlass cancer classifi-cation by support vector machines with class-wise optimizedgenes and probability estimatesrdquo Journal of 7eoretical Bi-ology vol 259 no 3 pp 533ndash540 2009
[21] H S Eo J Y Heo Y Choi Y Hwang and H-S Choi ldquoApathway-based classification of breast cancer integrating dataon differentially expressed genes copy number variations andmicroRNA target genesrdquo Molecules and Cells vol 34 no 4pp 393ndash398 2012
[22] J Kang A D DrsquoAndrea and D Kozono ldquoA DNA repairpathway-focused score for prediction of outcomes in ovariancancer treated with platinum-based chemotherapyrdquo Journalof the National Cancer Institute vol 104 no 9 pp 670ndash6812012
[23] L Fang H Wang and P Li ldquoSystematic analysis reveals alncRNA-mRNA co-expression network associated withplatinum resistance in high-grade serous ovarian cancerrdquoInvestigational New Drugs vol 36 no 2 2017
[24] X Yu S Cao Y Zhou Z Yu and Y Xu ldquoCo-expressionbased cancer staging and applicationrdquo Scientific Reportsvol 10 no 1 p 10624 2020
[25] I Rivals L Personnaz L Taing and M-C Potier ldquoEnrich-ment or depletion of a go category within a class of geneswhich testrdquo Bioinformatics vol 23 no 4 pp 401ndash407 2006
[26] C W Law Y Chen W Shi and G K Smyth ldquoVOOMprecision weights unlock linear model analysis tools for RNA-seq read countsrdquo Genome Biology vol 15 no 2 p R29 2014
[27] C W Law M Alhamdoosh S Su G K Smyth andM E Ritchie ldquoRNA-seq analysis is easy as 1-2-3 with limmaglimma and edgeRrdquo F1000Research vol 5 1408 pages 2016
[28] G Yu L-G Wang Y Han and Q-Y He ldquoClusterprofiler anR package for comparing biological themes among geneclustersrdquo One Meagre Issuue Clearly Sufficient A Journal ofIntegrative Biology vol 16 no 5 pp 284ndash287 2012
12 Computational Intelligence and Neuroscience
[29] M Carlson ldquoGo db a set of annotation maps describing theentire gene ontologyrdquo 2013
[30] A Alexa and J Rahnenfuhrer ldquoTopgo enrichment analysisfor gene ontology R package version 228 0rdquo 2016
[31] M Kuhn ldquoCaret classification and regression trainingrdquoAstrophysics Source Code Library vol 1 2015
[32] N V Chawla K W Bowyer L O Hall andW P Kegelmeyer ldquoSmote synthetic minority over-samplingtechniquerdquo Journal of Artificial Intelligence Research vol 16pp 321ndash357 2002
[33] O Yersal and S Barutca ldquoBiological subtypes of breast cancerprognostic and therapeutic implicationsrdquo World Journal ofClinical Oncology vol 5 no 3 p 412 2014
[34] C M Perou T Soslashrlie M B Eisen et al ldquoMolecular portraitsof human breast tumoursrdquo Nature vol 406 no 6797 p 7472000
[35] D M Abd El-Rehim G Ball S E Pinder et al ldquoHigh-throughput protein expression analysis using tissue micro-array technology of a large well-characterised series identifiesbiologically distinct classes of breast cancer confirming recentcDNA expression analysesrdquo International Journal of Cancervol 116 no 3 pp 340ndash350 2005
[36] X Dai A Chen and Z Bai ldquoIntegrative investigation onbreast cancer in ER PR and HER2-defined subgroups usingmRNA and miRNA expression profilingrdquo Scientific Reportsvol 4 p 6566 2014
[37] S Tsutsui S Ohno S Murakami A Kataoka J Kinoshitaand Y Hachitanda ldquoPrognostic significance of the coex-pression of p53 protein and c-erbb2 in breast cancerrdquo 7eAmerican Journal of Surgery vol 185 no 2 pp 165ndash167 2003
[38] T Soslashrlie R Tibshirani J Parker et al ldquoRepeated observationof breast tumor subtypes in independent gene expression datasetsrdquo Proceedings of the National Academy of Sciencesvol 100 no 14 pp 8418ndash8423 2003
[39] L A Carey ldquorough a glass darkly advances in under-standing breast cancer biology 2000ndash2010rdquo Clinical BreastCancer vol 10 no 3 pp 188ndash195 2010
[40] J S Reis-Filho B Weigelt D Fumagalli and C SotiriouldquoMolecular profiling moving away from tumor philatelyrdquoScience Translational Medicine vol 2 no 47 pp 43ndash47 2010
Computational Intelligence and Neuroscience 13
True
pos
itive
rate
False positive rate
AUC of nb 09847AUC of rf 09976AUC of svmRadial 09968
10
08
06
04
02
00
00 02 04 06 08 10
(a)
False positive rate
AUC of nb 09562AUC of rf 09797AUC of svmRadial 09798
True
pos
itive
rate
10
08
06
04
02
00
00 02 04 06 08 10
(b)
AUC of nb 09134AUC of rf 09552AUC of svmRadial 09481
True
pos
itive
rate
10
08
06
04
02
00
False positive rate00 02 04 06 08 10
(c)
AUC of nb 09075AUC of rf 09494AUC of svmRadial 09043
True
pos
itive
rate
10
08
06
04
02
00
False positive rate00 02 04 06 08 10
(d)
Figure 4 Continued
Computational Intelligence and Neuroscience 7
information attached to experiment group but not tocontrol group reveals that some biological functions areactivated vice versa the corresponding biological func-tions are inhibited e specific process for conducting theGOEGCN analysis using weighted DEGs is shown inFigure 5 Equations (2) and (3) are adopted to recalculatethe p values for control and experiment groupsrespectively
P X kc
( 1113857
Kc
kc
⎛⎝ ⎞⎠N
cminus K
c
nc
minus kc
⎛⎝ ⎞⎠
Nc
nc
⎛⎝ ⎞⎠
(2)
where Nc denotes the scatter of background (upper trian-gular matrix of gene coexpression network) for the controlgroup and nc represents the scatter of subupper triangularmatrix for each GO term Kc denotes the scatter of inhibitedcoexpressed gene couples in background for the controlgroup and kc represents then scatter of inhibited coex-pressed gene couples in subupper triangular matrix
P X ke
( 1113857
Ke
ke
⎛⎝ ⎞⎠N
eminus K
e
ne
minus ke
⎛⎝ ⎞⎠
Ne
ne
⎛⎝ ⎞⎠
(3)
where Ne denotes the scatter of background (upper trian-gular matrix of gene coexpression network) for the exper-iment group and ne represents the scatter of subuppertriangular matrix for each GO term Ke denotes the scatter ofactivated coexpressed gene couples in background for ex-periment group and kc represents the scatter of activatedcoexpressed gene couples in subupper triangular matrix
We conducted pathway enrichment analysis using thePEGCNwith weighted DEGs for the control and experimentgroups of each subtype and the top 10 enriched pathwaysfor Basal-like are shown in Table 5 e detailed enrichedpathway results for all subtypes are shown in Files S3ndashS7 inSupplementary Materials
4 Discussion
Although several computational approaches have beenproposed to identify the subtypes of BRCA no compre-hensive explanation was given on the molecular regula-tory mechanisms of the distinguished subtypes To wellexplore the interaction network for each subtype willcontribute to providing personalized treatments for dif-ferent patients In this research the weighted DEGs thatcarry the regulatory information derived from the generegulatory networks are adopted to conduct the classifi-cation tasks between different groups of subtypes Basedon the weighted DEGs we aim to explore the interactionmechanisms for each BRCA subtype using gene expres-sion values based on RNA-Seq data
AUC of nb 09125AUC of rf 096AUC of svmRadial 0964
True
pos
itive
rate
10
08
06
04
02
00
False positive rate00 02 04 06 08 10
(e)
Figure 4 ROC curves of each subtype using three kinds of machine learning approachese Area Under Curve (AUC) is used to assess theperformance of the binary classifier (a) e ROC curves of Basal-like using three kinds of machine learning approaches (ie nb rf andsvmRadial) (b)e ROC curves of Her2 using three kinds of machine learning approaches (c) e ROC curves of LumA using three kindsof machine learning approaches (d) e ROC curves of LumB using three kinds of machine learning approaches (e) e ROC curves ofNormal-like using three kinds of machine learning approaches
8 Computational Intelligence and Neuroscience
ID Description GeneID
GO001
GO002
GOnnn
Desc001
Desc002
Descnnn
[g1g2g4g5g6g7]
[g5g6g7g8]
[g2g3g4g5]
Control group
Experiment group
Calculate the p-value using the equation (2) for control group and
reserve the GO terms whose p-values le 005
Calculate the p-value using the equation (3) for experiment group
and reserve the GOterms whose p-values
le 005
ID Description GeneID
GO002
GOnnn
Desc002
Descnnn
[g5g6g7g8]
[g2g3g4g5]
ID Description GeneID
GO001
GOnnn-1
Desc001
Descnnn-1
[g1g2g4g5g6g7]
[g1g5g6g8g10]
g1 g2 g3 g4 g5 g6 g7 g8 g9 g10
g1 g2 g3 g4 g5 g6 g7 g8 g9 g10
g 1g 2
g 3g 4
g 5g 6
g 7g 8
g 9g 10
g 1g 2
g 3g 4
g 5g 6
g 7
g 1g 2
g 4g 5
g 6g 7
g 1g 2
g 4g 5
g 6g 7
g1 g2 g4 g5 g6 g7
g1 g2 g4 g5 g6 g7
g 8g 9
g 10
P(X = kc) = kcKc
ndashkcndashKc
ncNc
ncNc (2)
P(X = ke) = keKe
ndashkendashKe
neNe
neNe (3)
(a) (b) (c)
Figure 5 Flowchart for conducting the GOEGCN analysis using weighted DEGs (a) First of all the initial enriched GO terms are obtainedusing GO enrichment analysis en a sub symmetric coexpression matrix of ldquogeneIDrdquo from each GO term for control or experiment groupis constructed and the interaction network structures of original symmetric coexpression matrix for control or experiment group areregarded as the background (b) Adopt equations (2) and (3) to recalculate the p values for control and experiment groups respectively (c)Collect and reorder the results of enriched GO terms which are recalculated and form the final enriched GO terms list for control andexperiment groups respectively
Table 5 Top 10 enriched GO terms for Basal-like subtype of BRCA where the ldquopadjustrdquo means the p values are adjusted by the BHapproach
Basal-like Top 10 enriched GO terms p adjust
Control group
Morphogenesis of an epithelium 0Response to lipopolysaccharide 0
Response to molecule of bacterial origin 0Positive regulation of cell adhesion 0Regulation of cell-cell adhesion 0
Regulation of inflammatory response 299Eminus 12I-kappaB kinaseNF-kappaB signaling 603Eminus 12
T cell activation 103Eminus 11B cell activation 785Eminus 11
Positive regulation of response to external stimulus 635Eminus 10Ribonucleoprotein complex biogenesis 133Eminus 08
Formation of primary germ layer 129Eminus 07
Computational Intelligence and Neuroscience 9
e heatmap figures (eg Figure 1) can show the dif-ferential gene expression profiles based on the weightedDEGs Also the machine learning-based approaches areadopted to train the binary classifier for each subtype reekinds of approaches ldquoNaive Bayes (nb)rdquo ldquoRandom Forest(rf )rdquo and ldquosvmRadialrdquo were adopted to train themodels andfive kinds of metrics ldquosensitivityrdquo ldquospecificityrdquo ldquoAccuracyrdquoldquoF1rdquo and ldquoAUCrdquo were adopted to evaluate the performanceof the five binary classifiers e high metric values verify therobustness and effectiveness of our proposed method
We also explored the interaction mechanisms derivedfrom the gene coexpression networks of control and ex-periment groups and the significantly differential structuresof gene coexpression networks validate the different inter-action relationships among coexpressed gene couples Moreimportantly this discovery inspires us to further investigatethe biological function changes using the proposedGOEGCN method e novel enriched GO terms are ob-tained according to whether the interaction mechanisms ofcoexpressed gene couples are activated or inhibited etwo-side enriched GO terms will provide more informationfor GO enrichment analysis
e specific analysis of enriched GO terms for eachsubtype using GOEGCN is as follows
(1) For Basal-like subtype this kind of subtype has lowor no expression for the hormone receptors andHer2 receptor (ie ER-PR-Her2-) while it holds thehigh expression of basal markers and high expressionof genes related to proliferation [2] e basalmarkers comprise keratins 5 keratins 6 keratins 14keratins 17 and the epidermal growth factor re-ceptor (EGFR) [2 34] eir expression profiles aresimilar to the ones of basal epithelial cells and theones of normal breast myoepithelial cells [2 34]Besides the low BRCA1 expression as well as TP53mutation tends to exist in the Basal-like tumors withbasal cytokeratin expression [2 3 35]As shown in Table 5 and File S3 in SupplementaryMaterials the enriched GO terms for the controlgroup are based on the coexpressed gene coupleswhich are inhibited in the corresponding genecoexpression network e enriched GO terms forthe experiment group are based on the coexpressedgene couples which are activated in the corre-sponding gene coexpression network e commongroup holds the enriched GO terms which are sharedbetween the control and experiment groups eenriched GO terms of the control group are relatedto the ldquoepitheliumrdquo ldquocell adhesionrdquo ldquoepithelial cellproliferationrdquo ldquoepithelial cell migrationrdquo etc eones of the experiment group are concentrated inldquoimmune responserdquo ldquoprotein signal transductionrdquoldquogrowth factorrdquo ldquocell proliferationrdquo ldquocatabolicprocessrdquo ldquocell cyclerdquo etc and one possible reason isthat the Basal-like subtype is likely to belong toGrade 3 tumor so the immune response will workduring this phase e ldquolymphocyterdquo ldquoinflamma-toryrdquo ldquocell proliferationrdquo ldquoimmune responserdquo etc
are discovered in the common groupese enrichedGO terms are consistent with the high expression ofbasal markers and high expression of genes related toproliferation to some extent
(2) e Her2 overexpression subtype has low or noexpression for hormone receptors and high ex-pression of the Her2 receptor (ie ER-PR-Her2+)e Her2 is responsible for encoding the Her2 re-ceptor [33] is subtype is also characterized byoverexpression of genes related to Her2 amplicon(eg GRB7 [34] and PGAP3 [36])is subtype has ahigh proliferation rate 75 of Her2 has high his-tological grade and nuclear grade and 40ndash80 ofHer2 has TP53 mutation resided in this subtype[2 33 37] e Her2 is likely to belong to Grade 3tumor [2] and carries a poor prognosis [3 8 38] emore aggressive behaviors in biological and clinicalareas are also one of features of this subtype [33]As shown in File S4 in Supplementary Materials theenriched GO terms for control group are related toldquochromosome segregationrdquo ldquocell cycle phase transi-tionrdquo ldquonuclear divisionrdquo ldquocell cyclerdquo ldquoepithelial cellproliferationrdquo ldquosteroid hormonerdquo etc the enrichedGO terms for experiment group are related to ldquocal-cium ionrdquo ldquoleukocyte migrationrdquo ldquolymphocyte dif-ferentiationrdquo ldquoendothelial cell proliferationrdquo etc andthere are no shared enriched GO terms in commongroup ese enriched GO terms are associated withthe low expression of hormone receptors and highexpression of Her2 receptor to some extent
(3) e LumA subtype is ER or PR positive and Her2negative while the LumB subtype is ER or PRpositive and Her2 positive [2] Compared with theLumB subtype ER-related genes have higher ex-pression and proliferative genes have lower ex-pression in LumA [2 33] e expression of luminalepithelial cytokeratins (CK8 and CK18) and the ER1luminal associated markers as well as the genesrelated to ER activation (eg BCL2 LIV1 FOXA1XBP1 GATA3 CCND1 erbB3 and erbB4[8 34 39]) is the main characteristic of LumA [2 33]As shown in File S5 in Supplementary Materials theenriched GO terms of control group are associatedwith ldquogland developmentrdquo ldquoepithelium develop-mentrdquo ldquosteroid hormonerdquo ldquobranching structurerdquoldquoT cell differentiationrdquo ldquoimmune responserdquo ldquocellcyclerdquo etc the ones for the experiment group areinvolved in ldquoacid chemicalrdquo ldquoepithelial cell prolif-erationrdquo ldquoERK1 and ERK2 cascaderdquo ldquocalcium ionrdquoldquopeptidyl-tyrosine modificationrdquo ldquoepithelial cellmigrationrdquo etc and the ones for the common groupare ldquoresponse to acid chemicalrdquo ldquoneuron projectiondevelopmentrdquo ldquometabolic processrdquo ldquoresponse topeptiderdquo ldquoprotein kinase Brdquo etcCompared with LumA LumB tends to have a worseprognosis and more aggressive phenotypes as well ashigher histological grade [33] Besides the
10 Computational Intelligence and Neuroscience
proliferation-related genes (eg v-MYB GGHLAPTMB4 NSEP1 and CCNE1) have an increasedexpression and the genes of growth receptor sig-naling [40] also present an increased expression inLumB [33]As shown in File S6 in Supplementary Materials theenriched GO terms of the control group are asso-ciated with ldquogland developmentrdquo ldquoepithelial celldevelopmentrdquo ldquogland epithelium developmentrdquoldquoERK1 and ERK2 cascaderdquo ldquocell cyclerdquo ldquophos-phorylationrdquo etc and the ones for experiment groupare involved in ldquoextracellular matrixrdquo ldquogrowth fac-torrdquo ldquophospholipase activityrdquo ldquocell growthrdquo ldquocelladhesionrdquo ldquoangiogenesisrdquo etc and the commongroup are ldquoepithelial cell proliferationrdquo ldquosteroidhormonerdquo ldquobranching epitheliumrdquo ldquomuscle cellproliferationrdquo etc ese enriched GO terms areconsistent with the increased expression of prolif-eration-related genes and growth receptor signalingto some extent
(4) e Normal-like subtype is ER negative andor PRnegative with a low level of Ki-67 protein Few studieshave been conducted to this subtype and its specificclinical significance is still undetermined [33] eadipose tissue expression is one of its characteristicsand this subtype has the intermediate prognosis be-tween Basal-like subtype and luminal subtypes
As shown in File S7 in Supplementary Materials theenriched GO terms of the control group are associated withldquomorphogenesis of an epitheliumrdquo ldquovasculature develop-mentrdquo ldquoangiogenesisrdquo ldquogland morphogenesisrdquo ldquosteroidhormonerdquo ldquocell adhesionrdquo ldquoleukocyte migrationrdquo ldquolym-phocyte activationrdquo etc the ones for the experiment groupare involved in ldquocellular protein localizationrdquo ldquobiosyntheticprocessrdquo ldquophosphatidylinositol metabolicrdquo ldquochromatin as-semblyrdquo ldquonucleosome assemblyrdquo etc and the one for thecommon group is ldquokidney epithelium developmentrdquo
Although our proposed approaches show good perfor-mance we also admit that some limitations still exist
(1) Only the single-omics mRNA data (ie gene ex-pression data) was used to train the binary classifiersfor each subtype is main purpose is to ensure theconsistency with the subsequent enrichment analysiswhich is only available for the mRNA molecules Inspite of this our binary classifiers still perform well
(2) e interaction networks between control and ex-periment groups are derived from the gene coex-pression networks However the effective fusionbetween the gene coexpression networks and generegulatory networks will show powerful interactioninformation and this will be our follow-up work
5 Conclusion
In this paper we proposed attaching the biological im-portance of regulatory information to the differential ex-pression analysis Based on the weighted DEGs the binary
classifier for each subtype was learned e experimentalresults validated the effectiveness of the weighted DEGs andeach binary classifier for each subtype could make a goodprediction for an unseen sample More importantly weconstructed the gene coexpression networks for control andexperiment groups using weighted DEGs respectively andwe further explored the interaction mechanisms betweenthese two groups e significantly differential structuresdrove us to develop the GOEGCN to conduct GO enrich-ment analysis based on whether the coexpressed genecouples were activated or inhibited e novel p values wererecalculated using the hypergeometric test and after reor-dering the adjusted p values the novel enriched GO termswere acquired for control and experiment groups respec-tively e novel enriched GO terms could give some ex-planation for the biological function changes of each BRCAsubtype to some degree In the future we will explore theeffective fusion between gene coexpression networks andgene regulatory networks Based on the novel networkstructures we will further investigate the specific interactionmechanisms and reveal the detailed changes of biologicalfunctions across BRCA subtypes
Data Availability
e RNA-Seq-based processed data used to support thefindings of this study have been deposited in the Githubrepository (httpsgithubcomyxchspringGOEGCN_BRCA_SubtypestreemasterData) and the original data canbe accessed in the open TCGA database (httpswwwcancergovtcga)
Conflicts of Interest
e authors declare no conflicts of interest
Acknowledgments
e authors thank the CSBL groups at the University ofGeorgia USA for providing the computing resources eauthors thank Sha Cao for providing the support for con-structing a novel GO enrichment analysis method and YiZhou and Mingxin Tao for providing the assistance of datadownloading data analysis and data processing is workhas been supported by (1) the Science and TechnologyDeveloping Project of Jilin Province China (Grant no20150204007GX) (2) Doctoral Scientific Research Foun-dation of Jiangxi University of Science and Technology(Grant no jxxjbs19029) (3) the Science and TechnologyResearch Project of Jiangxi Provincial Department of Ed-ucation (Grant no GJJ190468) (4) the China ScholarshipFund and (5) the Key Laboratory of Symbolic Computationand Knowledge Engineering Ministry of Education
Supplementary Materials
Figure S1 heatmap for Her2 and non Her2 groups eleft group 1 represents the Her2 group and the right group2 denotes the non-Her2 group Figure S2 heatmap forLumA and non-LumA groups e left group 1 represents
Computational Intelligence and Neuroscience 11
the LumA group and the right group 2 denotes the non-LumA group Figure S3 heatmap for LumB and non-LumB groups e left group 1 represents the LumB groupand the right group 2 denotes the non-LumB groupFigure S4 heatmap for Normal-like and non-Normal-likegroups e left group 1 represents the Normal-like groupand the right group 2 denotes the non-Normal-like groupS1 File the detailed information of weighted DEGs forclassification S2 File the detailed information ofweighted DEGs for GO enrichment analysis S3 File thedetailed enriched GO terms results for Basal-like subtypeS4 File the detailed enriched GO terms results for Her2subtype S5 File the detailed enriched GO terms resultsfor LumA subtype S6 File the detailed enriched GO termsresults for LumB subtype S7 File the detailed enrichedGO terms results for Normal-like subtype (Supplemen-tary Materials)
References
[1] A Graudenzi C Cava G Bertoli et al ldquoPathway-basedclassification of breast cancer subtypesrdquo Frontiers in Biosci-ence vol 22 no 10 pp 1697ndash1712 2017
[2] X Dai T Li Z Bai et al ldquoBreast cancer intrinsic subtypeclassification clinical use and future trendsrdquo AmericanJournal of Cancer Research vol 5 no 10 p 2929 2015
[3] T Sorlie C M Perou R Tibshirani et al ldquoGene expressionpatterns of breast carcinomas distinguish tumor subclasseswith clinical implicationsrdquo Proceedings of the NationalAcademy of Sciences vol 98 no 19 pp 10869ndash10874 2001
[4] Z Hu C Fan D S Oh et al ldquoe molecular portraits ofbreast tumors are conserved across microarray platformsrdquoBioMed Central Genomics vol 7 no 1 p 96 2006
[5] J S Parker M Mullins M C U Cheang et al ldquoSupervisedrisk predictor of breast cancer based on intrinsic subtypesrdquoJournal of Clinical Oncology vol 27 no 8 p 1160 2009
[6] C Fan D S Oh L Wessels et al ldquoConcordance among gene-expression-based predictors for breast cancerrdquo New EnglandJournal of Medicine vol 355 no 6 pp 560ndash569 2006
[7] T Xu T D Le L Liu R Wang B Sun and J Li ldquoIdentifyingcancer subtypes from miRNA-TF-mRNA regulatory net-works and expression datardquo PLoS One vol 11 no 4 ArticleID e0152792 2016
[8] C Sotiriou S-Y Neo L M McShane et al ldquoBreast cancerclassification and prognosis based on gene expression profilesfrom a population-based studyrdquo Proceedings of the NationalAcademy of Sciences vol 100 no 18 pp 10393ndash10398 2003
[9] M V Dass M A Rasheed and M M Ali ldquoClassification oflung cancer subtypes by data mining techniquerdquo in Pro-ceedings of the 2014 International Conference on ControlInstrumentation Energy and Communication Calcutta IndiaJanuary 2014
[10] W Flynn S Namburi C Paisie et al ldquoPan-cancer machinelearning predictors of tissue of origin and molecular subtyperdquo2018
[11] H Hijazi and C Chan ldquoA classification framework applied tocancer gene expression profilesrdquo Journal of Healthcare En-gineering vol 4 no 2 pp 255ndash284 2013
[12] A Bazila Banu and P irumalaikolundusubramanianldquoComparison of bayes classifiers for breast cancer classifica-tionrdquo Asian Pacific Journal of Cancer Prevention vol 19no 10 pp 2917ndash2920 2018
[13] S Kharya and S Soni ldquoWeighted naive bayes classifier apredictive model for breast cancer detectionrdquo InternationalJournal of Computer Applications vol 133 no 9 pp 32ndash372016
[14] I Kim S Choi and S Kim ldquoBRCA-pathway a structuralintegration and visualization system of TCGA breast cancerdata on KEGG pathwaysrdquo BioMed Bioinformatics vol 19no 1 p 42 2018
[15] L Hua P Zhou L Li H Liu and Z Yang ldquoPrioritizing breastcancer subtype related miRNAs using miRNA-mRNA dys-regulated relationships extracted from their dual expressionprofilingrdquo Journal of 7eoretical Biology vol 331 pp 1ndash112013
[16] C Kang Y Huo L Xin B Tian and B Yu ldquoFeature selectionand tumor classification for microarray data using relaxedLasso and generalized multi-class support vector machinerdquoJournal of 7eoretical Biology vol 463 pp 77ndash91 2019
[17] B Tian X Wu C Chen W Qiu Q Ma and B Yu ldquoPre-dicting protein-protein interactions by fusing various Choursquospseudo components and using wavelet denoising approachrdquoJournal of 7eoretical Biology vol 462 pp 329ndash346 2019
[18] L Wang X Yan M-L Liu K-J Song X-F Sun andW-W Pan ldquoPrediction of RNA-protein interactions bycombining deep convolutional neural network with featureselection ensemble methodrdquo Journal of 7eoretical Biologyvol 461 pp 230ndash238 2019
[19] W Li and Y Yang ldquoZipfrsquos law in importance of genes forcancer classification using microarray datardquo Journal of 7e-oretical Biology vol 219 no 4 pp 539ndash551 2002
[20] A Anand and P N Suganthan ldquoMulticlass cancer classifi-cation by support vector machines with class-wise optimizedgenes and probability estimatesrdquo Journal of 7eoretical Bi-ology vol 259 no 3 pp 533ndash540 2009
[21] H S Eo J Y Heo Y Choi Y Hwang and H-S Choi ldquoApathway-based classification of breast cancer integrating dataon differentially expressed genes copy number variations andmicroRNA target genesrdquo Molecules and Cells vol 34 no 4pp 393ndash398 2012
[22] J Kang A D DrsquoAndrea and D Kozono ldquoA DNA repairpathway-focused score for prediction of outcomes in ovariancancer treated with platinum-based chemotherapyrdquo Journalof the National Cancer Institute vol 104 no 9 pp 670ndash6812012
[23] L Fang H Wang and P Li ldquoSystematic analysis reveals alncRNA-mRNA co-expression network associated withplatinum resistance in high-grade serous ovarian cancerrdquoInvestigational New Drugs vol 36 no 2 2017
[24] X Yu S Cao Y Zhou Z Yu and Y Xu ldquoCo-expressionbased cancer staging and applicationrdquo Scientific Reportsvol 10 no 1 p 10624 2020
[25] I Rivals L Personnaz L Taing and M-C Potier ldquoEnrich-ment or depletion of a go category within a class of geneswhich testrdquo Bioinformatics vol 23 no 4 pp 401ndash407 2006
[26] C W Law Y Chen W Shi and G K Smyth ldquoVOOMprecision weights unlock linear model analysis tools for RNA-seq read countsrdquo Genome Biology vol 15 no 2 p R29 2014
[27] C W Law M Alhamdoosh S Su G K Smyth andM E Ritchie ldquoRNA-seq analysis is easy as 1-2-3 with limmaglimma and edgeRrdquo F1000Research vol 5 1408 pages 2016
[28] G Yu L-G Wang Y Han and Q-Y He ldquoClusterprofiler anR package for comparing biological themes among geneclustersrdquo One Meagre Issuue Clearly Sufficient A Journal ofIntegrative Biology vol 16 no 5 pp 284ndash287 2012
12 Computational Intelligence and Neuroscience
[29] M Carlson ldquoGo db a set of annotation maps describing theentire gene ontologyrdquo 2013
[30] A Alexa and J Rahnenfuhrer ldquoTopgo enrichment analysisfor gene ontology R package version 228 0rdquo 2016
[31] M Kuhn ldquoCaret classification and regression trainingrdquoAstrophysics Source Code Library vol 1 2015
[32] N V Chawla K W Bowyer L O Hall andW P Kegelmeyer ldquoSmote synthetic minority over-samplingtechniquerdquo Journal of Artificial Intelligence Research vol 16pp 321ndash357 2002
[33] O Yersal and S Barutca ldquoBiological subtypes of breast cancerprognostic and therapeutic implicationsrdquo World Journal ofClinical Oncology vol 5 no 3 p 412 2014
[34] C M Perou T Soslashrlie M B Eisen et al ldquoMolecular portraitsof human breast tumoursrdquo Nature vol 406 no 6797 p 7472000
[35] D M Abd El-Rehim G Ball S E Pinder et al ldquoHigh-throughput protein expression analysis using tissue micro-array technology of a large well-characterised series identifiesbiologically distinct classes of breast cancer confirming recentcDNA expression analysesrdquo International Journal of Cancervol 116 no 3 pp 340ndash350 2005
[36] X Dai A Chen and Z Bai ldquoIntegrative investigation onbreast cancer in ER PR and HER2-defined subgroups usingmRNA and miRNA expression profilingrdquo Scientific Reportsvol 4 p 6566 2014
[37] S Tsutsui S Ohno S Murakami A Kataoka J Kinoshitaand Y Hachitanda ldquoPrognostic significance of the coex-pression of p53 protein and c-erbb2 in breast cancerrdquo 7eAmerican Journal of Surgery vol 185 no 2 pp 165ndash167 2003
[38] T Soslashrlie R Tibshirani J Parker et al ldquoRepeated observationof breast tumor subtypes in independent gene expression datasetsrdquo Proceedings of the National Academy of Sciencesvol 100 no 14 pp 8418ndash8423 2003
[39] L A Carey ldquorough a glass darkly advances in under-standing breast cancer biology 2000ndash2010rdquo Clinical BreastCancer vol 10 no 3 pp 188ndash195 2010
[40] J S Reis-Filho B Weigelt D Fumagalli and C SotiriouldquoMolecular profiling moving away from tumor philatelyrdquoScience Translational Medicine vol 2 no 47 pp 43ndash47 2010
Computational Intelligence and Neuroscience 13
ID Description GeneID
GO001
GO002
GOnnn
Desc001
Desc002
Descnnn
[g1g2g4g5g6g7]
[g5g6g7g8]
[g2g3g4g5]
Control group
Experiment group
Calculate the p-value using the equation (2) for control group and
reserve the GO terms whose p-values le 005
Calculate the p-value using the equation (3) for experiment group
and reserve the GOterms whose p-values
le 005
ID Description GeneID
GO002
GOnnn
Desc002
Descnnn
[g5g6g7g8]
[g2g3g4g5]
ID Description GeneID
GO001
GOnnn-1
Desc001
Descnnn-1
[g1g2g4g5g6g7]
[g1g5g6g8g10]
g1 g2 g3 g4 g5 g6 g7 g8 g9 g10
g1 g2 g3 g4 g5 g6 g7 g8 g9 g10
g 1g 2
g 3g 4
g 5g 6
g 7g 8
g 9g 10
g 1g 2
g 3g 4
g 5g 6
g 7
g 1g 2
g 4g 5
g 6g 7
g 1g 2
g 4g 5
g 6g 7
g1 g2 g4 g5 g6 g7
g1 g2 g4 g5 g6 g7
g 8g 9
g 10
P(X = kc) = kcKc
ndashkcndashKc
ncNc
ncNc (2)
P(X = ke) = keKe
ndashkendashKe
neNe
neNe (3)
(a) (b) (c)
Figure 5 Flowchart for conducting the GOEGCN analysis using weighted DEGs (a) First of all the initial enriched GO terms are obtainedusing GO enrichment analysis en a sub symmetric coexpression matrix of ldquogeneIDrdquo from each GO term for control or experiment groupis constructed and the interaction network structures of original symmetric coexpression matrix for control or experiment group areregarded as the background (b) Adopt equations (2) and (3) to recalculate the p values for control and experiment groups respectively (c)Collect and reorder the results of enriched GO terms which are recalculated and form the final enriched GO terms list for control andexperiment groups respectively
Table 5 Top 10 enriched GO terms for Basal-like subtype of BRCA where the ldquopadjustrdquo means the p values are adjusted by the BHapproach
Basal-like Top 10 enriched GO terms p adjust
Control group
Morphogenesis of an epithelium 0Response to lipopolysaccharide 0
Response to molecule of bacterial origin 0Positive regulation of cell adhesion 0Regulation of cell-cell adhesion 0
Regulation of inflammatory response 299Eminus 12I-kappaB kinaseNF-kappaB signaling 603Eminus 12
T cell activation 103Eminus 11B cell activation 785Eminus 11
Positive regulation of response to external stimulus 635Eminus 10Ribonucleoprotein complex biogenesis 133Eminus 08
Formation of primary germ layer 129Eminus 07
Computational Intelligence and Neuroscience 9
e heatmap figures (eg Figure 1) can show the dif-ferential gene expression profiles based on the weightedDEGs Also the machine learning-based approaches areadopted to train the binary classifier for each subtype reekinds of approaches ldquoNaive Bayes (nb)rdquo ldquoRandom Forest(rf )rdquo and ldquosvmRadialrdquo were adopted to train themodels andfive kinds of metrics ldquosensitivityrdquo ldquospecificityrdquo ldquoAccuracyrdquoldquoF1rdquo and ldquoAUCrdquo were adopted to evaluate the performanceof the five binary classifiers e high metric values verify therobustness and effectiveness of our proposed method
We also explored the interaction mechanisms derivedfrom the gene coexpression networks of control and ex-periment groups and the significantly differential structuresof gene coexpression networks validate the different inter-action relationships among coexpressed gene couples Moreimportantly this discovery inspires us to further investigatethe biological function changes using the proposedGOEGCN method e novel enriched GO terms are ob-tained according to whether the interaction mechanisms ofcoexpressed gene couples are activated or inhibited etwo-side enriched GO terms will provide more informationfor GO enrichment analysis
e specific analysis of enriched GO terms for eachsubtype using GOEGCN is as follows
(1) For Basal-like subtype this kind of subtype has lowor no expression for the hormone receptors andHer2 receptor (ie ER-PR-Her2-) while it holds thehigh expression of basal markers and high expressionof genes related to proliferation [2] e basalmarkers comprise keratins 5 keratins 6 keratins 14keratins 17 and the epidermal growth factor re-ceptor (EGFR) [2 34] eir expression profiles aresimilar to the ones of basal epithelial cells and theones of normal breast myoepithelial cells [2 34]Besides the low BRCA1 expression as well as TP53mutation tends to exist in the Basal-like tumors withbasal cytokeratin expression [2 3 35]As shown in Table 5 and File S3 in SupplementaryMaterials the enriched GO terms for the controlgroup are based on the coexpressed gene coupleswhich are inhibited in the corresponding genecoexpression network e enriched GO terms forthe experiment group are based on the coexpressedgene couples which are activated in the corre-sponding gene coexpression network e commongroup holds the enriched GO terms which are sharedbetween the control and experiment groups eenriched GO terms of the control group are relatedto the ldquoepitheliumrdquo ldquocell adhesionrdquo ldquoepithelial cellproliferationrdquo ldquoepithelial cell migrationrdquo etc eones of the experiment group are concentrated inldquoimmune responserdquo ldquoprotein signal transductionrdquoldquogrowth factorrdquo ldquocell proliferationrdquo ldquocatabolicprocessrdquo ldquocell cyclerdquo etc and one possible reason isthat the Basal-like subtype is likely to belong toGrade 3 tumor so the immune response will workduring this phase e ldquolymphocyterdquo ldquoinflamma-toryrdquo ldquocell proliferationrdquo ldquoimmune responserdquo etc
are discovered in the common groupese enrichedGO terms are consistent with the high expression ofbasal markers and high expression of genes related toproliferation to some extent
(2) e Her2 overexpression subtype has low or noexpression for hormone receptors and high ex-pression of the Her2 receptor (ie ER-PR-Her2+)e Her2 is responsible for encoding the Her2 re-ceptor [33] is subtype is also characterized byoverexpression of genes related to Her2 amplicon(eg GRB7 [34] and PGAP3 [36])is subtype has ahigh proliferation rate 75 of Her2 has high his-tological grade and nuclear grade and 40ndash80 ofHer2 has TP53 mutation resided in this subtype[2 33 37] e Her2 is likely to belong to Grade 3tumor [2] and carries a poor prognosis [3 8 38] emore aggressive behaviors in biological and clinicalareas are also one of features of this subtype [33]As shown in File S4 in Supplementary Materials theenriched GO terms for control group are related toldquochromosome segregationrdquo ldquocell cycle phase transi-tionrdquo ldquonuclear divisionrdquo ldquocell cyclerdquo ldquoepithelial cellproliferationrdquo ldquosteroid hormonerdquo etc the enrichedGO terms for experiment group are related to ldquocal-cium ionrdquo ldquoleukocyte migrationrdquo ldquolymphocyte dif-ferentiationrdquo ldquoendothelial cell proliferationrdquo etc andthere are no shared enriched GO terms in commongroup ese enriched GO terms are associated withthe low expression of hormone receptors and highexpression of Her2 receptor to some extent
(3) e LumA subtype is ER or PR positive and Her2negative while the LumB subtype is ER or PRpositive and Her2 positive [2] Compared with theLumB subtype ER-related genes have higher ex-pression and proliferative genes have lower ex-pression in LumA [2 33] e expression of luminalepithelial cytokeratins (CK8 and CK18) and the ER1luminal associated markers as well as the genesrelated to ER activation (eg BCL2 LIV1 FOXA1XBP1 GATA3 CCND1 erbB3 and erbB4[8 34 39]) is the main characteristic of LumA [2 33]As shown in File S5 in Supplementary Materials theenriched GO terms of control group are associatedwith ldquogland developmentrdquo ldquoepithelium develop-mentrdquo ldquosteroid hormonerdquo ldquobranching structurerdquoldquoT cell differentiationrdquo ldquoimmune responserdquo ldquocellcyclerdquo etc the ones for the experiment group areinvolved in ldquoacid chemicalrdquo ldquoepithelial cell prolif-erationrdquo ldquoERK1 and ERK2 cascaderdquo ldquocalcium ionrdquoldquopeptidyl-tyrosine modificationrdquo ldquoepithelial cellmigrationrdquo etc and the ones for the common groupare ldquoresponse to acid chemicalrdquo ldquoneuron projectiondevelopmentrdquo ldquometabolic processrdquo ldquoresponse topeptiderdquo ldquoprotein kinase Brdquo etcCompared with LumA LumB tends to have a worseprognosis and more aggressive phenotypes as well ashigher histological grade [33] Besides the
10 Computational Intelligence and Neuroscience
proliferation-related genes (eg v-MYB GGHLAPTMB4 NSEP1 and CCNE1) have an increasedexpression and the genes of growth receptor sig-naling [40] also present an increased expression inLumB [33]As shown in File S6 in Supplementary Materials theenriched GO terms of the control group are asso-ciated with ldquogland developmentrdquo ldquoepithelial celldevelopmentrdquo ldquogland epithelium developmentrdquoldquoERK1 and ERK2 cascaderdquo ldquocell cyclerdquo ldquophos-phorylationrdquo etc and the ones for experiment groupare involved in ldquoextracellular matrixrdquo ldquogrowth fac-torrdquo ldquophospholipase activityrdquo ldquocell growthrdquo ldquocelladhesionrdquo ldquoangiogenesisrdquo etc and the commongroup are ldquoepithelial cell proliferationrdquo ldquosteroidhormonerdquo ldquobranching epitheliumrdquo ldquomuscle cellproliferationrdquo etc ese enriched GO terms areconsistent with the increased expression of prolif-eration-related genes and growth receptor signalingto some extent
(4) e Normal-like subtype is ER negative andor PRnegative with a low level of Ki-67 protein Few studieshave been conducted to this subtype and its specificclinical significance is still undetermined [33] eadipose tissue expression is one of its characteristicsand this subtype has the intermediate prognosis be-tween Basal-like subtype and luminal subtypes
As shown in File S7 in Supplementary Materials theenriched GO terms of the control group are associated withldquomorphogenesis of an epitheliumrdquo ldquovasculature develop-mentrdquo ldquoangiogenesisrdquo ldquogland morphogenesisrdquo ldquosteroidhormonerdquo ldquocell adhesionrdquo ldquoleukocyte migrationrdquo ldquolym-phocyte activationrdquo etc the ones for the experiment groupare involved in ldquocellular protein localizationrdquo ldquobiosyntheticprocessrdquo ldquophosphatidylinositol metabolicrdquo ldquochromatin as-semblyrdquo ldquonucleosome assemblyrdquo etc and the one for thecommon group is ldquokidney epithelium developmentrdquo
Although our proposed approaches show good perfor-mance we also admit that some limitations still exist
(1) Only the single-omics mRNA data (ie gene ex-pression data) was used to train the binary classifiersfor each subtype is main purpose is to ensure theconsistency with the subsequent enrichment analysiswhich is only available for the mRNA molecules Inspite of this our binary classifiers still perform well
(2) e interaction networks between control and ex-periment groups are derived from the gene coex-pression networks However the effective fusionbetween the gene coexpression networks and generegulatory networks will show powerful interactioninformation and this will be our follow-up work
5 Conclusion
In this paper we proposed attaching the biological im-portance of regulatory information to the differential ex-pression analysis Based on the weighted DEGs the binary
classifier for each subtype was learned e experimentalresults validated the effectiveness of the weighted DEGs andeach binary classifier for each subtype could make a goodprediction for an unseen sample More importantly weconstructed the gene coexpression networks for control andexperiment groups using weighted DEGs respectively andwe further explored the interaction mechanisms betweenthese two groups e significantly differential structuresdrove us to develop the GOEGCN to conduct GO enrich-ment analysis based on whether the coexpressed genecouples were activated or inhibited e novel p values wererecalculated using the hypergeometric test and after reor-dering the adjusted p values the novel enriched GO termswere acquired for control and experiment groups respec-tively e novel enriched GO terms could give some ex-planation for the biological function changes of each BRCAsubtype to some degree In the future we will explore theeffective fusion between gene coexpression networks andgene regulatory networks Based on the novel networkstructures we will further investigate the specific interactionmechanisms and reveal the detailed changes of biologicalfunctions across BRCA subtypes
Data Availability
e RNA-Seq-based processed data used to support thefindings of this study have been deposited in the Githubrepository (httpsgithubcomyxchspringGOEGCN_BRCA_SubtypestreemasterData) and the original data canbe accessed in the open TCGA database (httpswwwcancergovtcga)
Conflicts of Interest
e authors declare no conflicts of interest
Acknowledgments
e authors thank the CSBL groups at the University ofGeorgia USA for providing the computing resources eauthors thank Sha Cao for providing the support for con-structing a novel GO enrichment analysis method and YiZhou and Mingxin Tao for providing the assistance of datadownloading data analysis and data processing is workhas been supported by (1) the Science and TechnologyDeveloping Project of Jilin Province China (Grant no20150204007GX) (2) Doctoral Scientific Research Foun-dation of Jiangxi University of Science and Technology(Grant no jxxjbs19029) (3) the Science and TechnologyResearch Project of Jiangxi Provincial Department of Ed-ucation (Grant no GJJ190468) (4) the China ScholarshipFund and (5) the Key Laboratory of Symbolic Computationand Knowledge Engineering Ministry of Education
Supplementary Materials
Figure S1 heatmap for Her2 and non Her2 groups eleft group 1 represents the Her2 group and the right group2 denotes the non-Her2 group Figure S2 heatmap forLumA and non-LumA groups e left group 1 represents
Computational Intelligence and Neuroscience 11
the LumA group and the right group 2 denotes the non-LumA group Figure S3 heatmap for LumB and non-LumB groups e left group 1 represents the LumB groupand the right group 2 denotes the non-LumB groupFigure S4 heatmap for Normal-like and non-Normal-likegroups e left group 1 represents the Normal-like groupand the right group 2 denotes the non-Normal-like groupS1 File the detailed information of weighted DEGs forclassification S2 File the detailed information ofweighted DEGs for GO enrichment analysis S3 File thedetailed enriched GO terms results for Basal-like subtypeS4 File the detailed enriched GO terms results for Her2subtype S5 File the detailed enriched GO terms resultsfor LumA subtype S6 File the detailed enriched GO termsresults for LumB subtype S7 File the detailed enrichedGO terms results for Normal-like subtype (Supplemen-tary Materials)
References
[1] A Graudenzi C Cava G Bertoli et al ldquoPathway-basedclassification of breast cancer subtypesrdquo Frontiers in Biosci-ence vol 22 no 10 pp 1697ndash1712 2017
[2] X Dai T Li Z Bai et al ldquoBreast cancer intrinsic subtypeclassification clinical use and future trendsrdquo AmericanJournal of Cancer Research vol 5 no 10 p 2929 2015
[3] T Sorlie C M Perou R Tibshirani et al ldquoGene expressionpatterns of breast carcinomas distinguish tumor subclasseswith clinical implicationsrdquo Proceedings of the NationalAcademy of Sciences vol 98 no 19 pp 10869ndash10874 2001
[4] Z Hu C Fan D S Oh et al ldquoe molecular portraits ofbreast tumors are conserved across microarray platformsrdquoBioMed Central Genomics vol 7 no 1 p 96 2006
[5] J S Parker M Mullins M C U Cheang et al ldquoSupervisedrisk predictor of breast cancer based on intrinsic subtypesrdquoJournal of Clinical Oncology vol 27 no 8 p 1160 2009
[6] C Fan D S Oh L Wessels et al ldquoConcordance among gene-expression-based predictors for breast cancerrdquo New EnglandJournal of Medicine vol 355 no 6 pp 560ndash569 2006
[7] T Xu T D Le L Liu R Wang B Sun and J Li ldquoIdentifyingcancer subtypes from miRNA-TF-mRNA regulatory net-works and expression datardquo PLoS One vol 11 no 4 ArticleID e0152792 2016
[8] C Sotiriou S-Y Neo L M McShane et al ldquoBreast cancerclassification and prognosis based on gene expression profilesfrom a population-based studyrdquo Proceedings of the NationalAcademy of Sciences vol 100 no 18 pp 10393ndash10398 2003
[9] M V Dass M A Rasheed and M M Ali ldquoClassification oflung cancer subtypes by data mining techniquerdquo in Pro-ceedings of the 2014 International Conference on ControlInstrumentation Energy and Communication Calcutta IndiaJanuary 2014
[10] W Flynn S Namburi C Paisie et al ldquoPan-cancer machinelearning predictors of tissue of origin and molecular subtyperdquo2018
[11] H Hijazi and C Chan ldquoA classification framework applied tocancer gene expression profilesrdquo Journal of Healthcare En-gineering vol 4 no 2 pp 255ndash284 2013
[12] A Bazila Banu and P irumalaikolundusubramanianldquoComparison of bayes classifiers for breast cancer classifica-tionrdquo Asian Pacific Journal of Cancer Prevention vol 19no 10 pp 2917ndash2920 2018
[13] S Kharya and S Soni ldquoWeighted naive bayes classifier apredictive model for breast cancer detectionrdquo InternationalJournal of Computer Applications vol 133 no 9 pp 32ndash372016
[14] I Kim S Choi and S Kim ldquoBRCA-pathway a structuralintegration and visualization system of TCGA breast cancerdata on KEGG pathwaysrdquo BioMed Bioinformatics vol 19no 1 p 42 2018
[15] L Hua P Zhou L Li H Liu and Z Yang ldquoPrioritizing breastcancer subtype related miRNAs using miRNA-mRNA dys-regulated relationships extracted from their dual expressionprofilingrdquo Journal of 7eoretical Biology vol 331 pp 1ndash112013
[16] C Kang Y Huo L Xin B Tian and B Yu ldquoFeature selectionand tumor classification for microarray data using relaxedLasso and generalized multi-class support vector machinerdquoJournal of 7eoretical Biology vol 463 pp 77ndash91 2019
[17] B Tian X Wu C Chen W Qiu Q Ma and B Yu ldquoPre-dicting protein-protein interactions by fusing various Choursquospseudo components and using wavelet denoising approachrdquoJournal of 7eoretical Biology vol 462 pp 329ndash346 2019
[18] L Wang X Yan M-L Liu K-J Song X-F Sun andW-W Pan ldquoPrediction of RNA-protein interactions bycombining deep convolutional neural network with featureselection ensemble methodrdquo Journal of 7eoretical Biologyvol 461 pp 230ndash238 2019
[19] W Li and Y Yang ldquoZipfrsquos law in importance of genes forcancer classification using microarray datardquo Journal of 7e-oretical Biology vol 219 no 4 pp 539ndash551 2002
[20] A Anand and P N Suganthan ldquoMulticlass cancer classifi-cation by support vector machines with class-wise optimizedgenes and probability estimatesrdquo Journal of 7eoretical Bi-ology vol 259 no 3 pp 533ndash540 2009
[21] H S Eo J Y Heo Y Choi Y Hwang and H-S Choi ldquoApathway-based classification of breast cancer integrating dataon differentially expressed genes copy number variations andmicroRNA target genesrdquo Molecules and Cells vol 34 no 4pp 393ndash398 2012
[22] J Kang A D DrsquoAndrea and D Kozono ldquoA DNA repairpathway-focused score for prediction of outcomes in ovariancancer treated with platinum-based chemotherapyrdquo Journalof the National Cancer Institute vol 104 no 9 pp 670ndash6812012
[23] L Fang H Wang and P Li ldquoSystematic analysis reveals alncRNA-mRNA co-expression network associated withplatinum resistance in high-grade serous ovarian cancerrdquoInvestigational New Drugs vol 36 no 2 2017
[24] X Yu S Cao Y Zhou Z Yu and Y Xu ldquoCo-expressionbased cancer staging and applicationrdquo Scientific Reportsvol 10 no 1 p 10624 2020
[25] I Rivals L Personnaz L Taing and M-C Potier ldquoEnrich-ment or depletion of a go category within a class of geneswhich testrdquo Bioinformatics vol 23 no 4 pp 401ndash407 2006
[26] C W Law Y Chen W Shi and G K Smyth ldquoVOOMprecision weights unlock linear model analysis tools for RNA-seq read countsrdquo Genome Biology vol 15 no 2 p R29 2014
[27] C W Law M Alhamdoosh S Su G K Smyth andM E Ritchie ldquoRNA-seq analysis is easy as 1-2-3 with limmaglimma and edgeRrdquo F1000Research vol 5 1408 pages 2016
[28] G Yu L-G Wang Y Han and Q-Y He ldquoClusterprofiler anR package for comparing biological themes among geneclustersrdquo One Meagre Issuue Clearly Sufficient A Journal ofIntegrative Biology vol 16 no 5 pp 284ndash287 2012
12 Computational Intelligence and Neuroscience
[29] M Carlson ldquoGo db a set of annotation maps describing theentire gene ontologyrdquo 2013
[30] A Alexa and J Rahnenfuhrer ldquoTopgo enrichment analysisfor gene ontology R package version 228 0rdquo 2016
[31] M Kuhn ldquoCaret classification and regression trainingrdquoAstrophysics Source Code Library vol 1 2015
[32] N V Chawla K W Bowyer L O Hall andW P Kegelmeyer ldquoSmote synthetic minority over-samplingtechniquerdquo Journal of Artificial Intelligence Research vol 16pp 321ndash357 2002
[33] O Yersal and S Barutca ldquoBiological subtypes of breast cancerprognostic and therapeutic implicationsrdquo World Journal ofClinical Oncology vol 5 no 3 p 412 2014
[34] C M Perou T Soslashrlie M B Eisen et al ldquoMolecular portraitsof human breast tumoursrdquo Nature vol 406 no 6797 p 7472000
[35] D M Abd El-Rehim G Ball S E Pinder et al ldquoHigh-throughput protein expression analysis using tissue micro-array technology of a large well-characterised series identifiesbiologically distinct classes of breast cancer confirming recentcDNA expression analysesrdquo International Journal of Cancervol 116 no 3 pp 340ndash350 2005
[36] X Dai A Chen and Z Bai ldquoIntegrative investigation onbreast cancer in ER PR and HER2-defined subgroups usingmRNA and miRNA expression profilingrdquo Scientific Reportsvol 4 p 6566 2014
[37] S Tsutsui S Ohno S Murakami A Kataoka J Kinoshitaand Y Hachitanda ldquoPrognostic significance of the coex-pression of p53 protein and c-erbb2 in breast cancerrdquo 7eAmerican Journal of Surgery vol 185 no 2 pp 165ndash167 2003
[38] T Soslashrlie R Tibshirani J Parker et al ldquoRepeated observationof breast tumor subtypes in independent gene expression datasetsrdquo Proceedings of the National Academy of Sciencesvol 100 no 14 pp 8418ndash8423 2003
[39] L A Carey ldquorough a glass darkly advances in under-standing breast cancer biology 2000ndash2010rdquo Clinical BreastCancer vol 10 no 3 pp 188ndash195 2010
[40] J S Reis-Filho B Weigelt D Fumagalli and C SotiriouldquoMolecular profiling moving away from tumor philatelyrdquoScience Translational Medicine vol 2 no 47 pp 43ndash47 2010
Computational Intelligence and Neuroscience 13
[29] M Carlson ldquoGo db a set of annotation maps describing theentire gene ontologyrdquo 2013
[30] A Alexa and J Rahnenfuhrer ldquoTopgo enrichment analysisfor gene ontology R package version 228 0rdquo 2016
[31] M Kuhn ldquoCaret classification and regression trainingrdquoAstrophysics Source Code Library vol 1 2015
[32] N V Chawla K W Bowyer L O Hall andW P Kegelmeyer ldquoSmote synthetic minority over-samplingtechniquerdquo Journal of Artificial Intelligence Research vol 16pp 321ndash357 2002
[33] O Yersal and S Barutca ldquoBiological subtypes of breast cancerprognostic and therapeutic implicationsrdquo World Journal ofClinical Oncology vol 5 no 3 p 412 2014
[34] C M Perou T Soslashrlie M B Eisen et al ldquoMolecular portraitsof human breast tumoursrdquo Nature vol 406 no 6797 p 7472000
[35] D M Abd El-Rehim G Ball S E Pinder et al ldquoHigh-throughput protein expression analysis using tissue micro-array technology of a large well-characterised series identifiesbiologically distinct classes of breast cancer confirming recentcDNA expression analysesrdquo International Journal of Cancervol 116 no 3 pp 340ndash350 2005
[36] X Dai A Chen and Z Bai ldquoIntegrative investigation onbreast cancer in ER PR and HER2-defined subgroups usingmRNA and miRNA expression profilingrdquo Scientific Reportsvol 4 p 6566 2014
[37] S Tsutsui S Ohno S Murakami A Kataoka J Kinoshitaand Y Hachitanda ldquoPrognostic significance of the coex-pression of p53 protein and c-erbb2 in breast cancerrdquo 7eAmerican Journal of Surgery vol 185 no 2 pp 165ndash167 2003
[38] T Soslashrlie R Tibshirani J Parker et al ldquoRepeated observationof breast tumor subtypes in independent gene expression datasetsrdquo Proceedings of the National Academy of Sciencesvol 100 no 14 pp 8418ndash8423 2003
[39] L A Carey ldquorough a glass darkly advances in under-standing breast cancer biology 2000ndash2010rdquo Clinical BreastCancer vol 10 no 3 pp 188ndash195 2010
[40] J S Reis-Filho B Weigelt D Fumagalli and C SotiriouldquoMolecular profiling moving away from tumor philatelyrdquoScience Translational Medicine vol 2 no 47 pp 43ndash47 2010