+ All Categories
Home > Documents > RNAi Suppression of Arogenate Dehydratase1 Reveals That ... · RNAi Suppression of Arogenate...

RNAi Suppression of Arogenate Dehydratase1 Reveals That ... · RNAi Suppression of Arogenate...

Date post: 02-May-2019
Category:
Upload: lekien
View: 214 times
Download: 0 times
Share this document with a friend
19
RNAi Suppression of Arogenate Dehydratase1 Reveals That Phenylalanine Is Synthesized Predominantly via the Arogenate Pathway in Petunia Petals C W Hiroshi Maeda, a Ajit K Shasany, a,b Jennifer Schnepp, a Irina Orlova, a Goro Taguchi, c,1 Bruce R. Cooper, d David Rhodes, a Eran Pichersky, c and Natalia Dudareva a,2 a Department of Horticulture and Landscape Architecture, Purdue University, West Lafayette, Indiana 47907 b Central Institute of Medicinal and Aromatic Plants, Lucknow-226015, India c Department of Molecular, Cellular, and Developmental Biology, University of Michigan, Ann Arbor, Michigan 48109 d Bindley Bioscience Center, Metabolite Profiling Facility, Purdue University, West Lafayette, Indiana 47907 L-Phe, a protein building block and precursor of numerous phenolic compounds, is synthesized from prephenate via an arogenate and/or phenylpyruvate route in which arogenate dehydratase (ADT) or prephenate dehydratase, respectively, plays a key role. Here, we used Petunia hybrida flowers, which are rich in Phe-derived volatiles, to determine the biosynthetic routes involved in Phe formation in planta. Of the three identified petunia ADTs, expression of ADT1 was the highest in petunia petals and positively correlated with endogenous Phe levels throughout flower development. ADT1 showed strict substrate specificity toward arogenate, although with the lowest catalytic efficiency among the three ADTs. ADT1 suppression via RNA interference in petunia petals significantly reduced ADT activity, levels of Phe, and downstream phenylpropanoid/benzenoid volatiles. Unexpectedly, arogenate levels were unaltered, while shikimate and Trp levels were decreased in transgenic petals. Stable isotope labeling experiments showed that ADT1 suppression led to downregulation of carbon flux toward shikimic acid. However, an exogenous supply of shikimate bypassed this negative regulation and resulted in elevated arogenate accumulation. Feeding with shikimate also led to prephenate and phenylpyruvate accumu- lation and a partial recovery of the reduced Phe level in transgenic petals, suggesting that the phenylpyruvate route can also operate in planta. These results provide genetic evidence that Phe is synthesized predominantly via arogenate in petunia petals and uncover a novel posttranscriptional regulation of the shikimate pathway. INTRODUCTION In plants, L-Phe is not only a building block for protein synthesis but also a precursor of >8000 phenolic compounds that consti- tute up to 30 to 45% of plant organic matter (Razal et al., 1996) and have profound impacts on plant growth, development, reproduction, and defense (Croteau et al., 2000). These com- pounds are widely spread across the plant kingdom and include structural components (e.g., lignin, suberin, and other cell wall– associated phenolics) that provide plants with mechanical support and physical barriers against herbivory and microbial invasion; flavonoid and anthocyanin pigments and phenylpro- panoid/benzenoid volatiles that contribute to flower and fruit color and aroma to ensure pollination and seed dispersal; defense molecules (lignans, flavonoids, isoflavonoids, condensed tannins, and some simple phenolic compounds) with antimicrobial and antifeedant properties; UV protectants (flavonoids and other phenolics) for absorbing DNA-damaging UV lights; and signal molecules, such as isoflavonoids and the ubiquitous plant hor- mone salicylic acid (Ogawa et al., 2005, 2006; Pan et al., 2006; Sawada et al., 2006), although the latter can also be synthesized from isochorismate by a Phe-independent pathway under path- ogen attacks (Wildermuth et al., 2001; Catinot et al., 2008). Despite the major roles of Phe in plant physiology and metab- olism, our knowledge of its biosynthesis and regulation in plants remains fragmented. Phe is derived from chorismate, the final product of the shikimate pathway (Schmid and Amrhein, 1995; Herrmann and Weaver, 1999). Chorismate is converted by cho- rismate mutase (CM) to prephenate, which can be subsequently converted to Phe via two alternative pathways (Siehl, 1999; Figure 1). In one pathway, prephenate undergoes transamination to arogenate, which is then dehydrated/decarboxylated to Phe by arogenate dehydratase (ADT; EC 4.2.1.91). In the other route, prephenate is first subjected to dehydration/decarboxylation cat- alyzed by prephenate dehydratase (PDT; EC 4.2.1.51) to form phenylpyruvate, which is then transaminated to Phe (Siehl, 1999). Most microorganisms studied to date synthesize Phe via phenyl- pyruvate and contain PDTs (Davidson et al., 1972; Bentley, 1990; Kleeb et al., 2006), with a few exceptions (e.g., Euglena gracilis and 1 Current address: Division of Applied Biology, Faculty of Textile Science and Technology, Shinshu University, 3-15-1 Tokida, Ueda 386-8567, Japan. 2 Address correspondence to [email protected]. The author responsible for distribution of materials integral to the findings presented in this article in accordance with the policy described in the Instructions for Authors (www.plantcell.org) is: Natalia Dudareva ([email protected]). C Some figures in this article are displayed in color online but in black and white in the print edition. W Online version contains Web-only data. www.plantcell.org/cgi/doi/10.1105/tpc.109.073247 The Plant Cell, Vol. 22: 832–849, March 2010, www.plantcell.org ã 2010 American Society of Plant Biologists
Transcript

RNAi Suppression of Arogenate Dehydratase1 Reveals ThatPhenylalanine Is Synthesized Predominantly via the ArogenatePathway in Petunia Petals C W

Hiroshi Maeda,a Ajit K Shasany,a,b Jennifer Schnepp,a Irina Orlova,a Goro Taguchi,c,1 Bruce R. Cooper,d

David Rhodes,a Eran Pichersky,c and Natalia Dudarevaa,2

a Department of Horticulture and Landscape Architecture, Purdue University, West Lafayette, Indiana 47907b Central Institute of Medicinal and Aromatic Plants, Lucknow-226015, Indiac Department of Molecular, Cellular, and Developmental Biology, University of Michigan, Ann Arbor, Michigan 48109d Bindley Bioscience Center, Metabolite Profiling Facility, Purdue University, West Lafayette, Indiana 47907

L-Phe, a protein building block and precursor of numerous phenolic compounds, is synthesized from prephenate via an

arogenate and/or phenylpyruvate route in which arogenate dehydratase (ADT) or prephenate dehydratase, respectively,

plays a key role. Here, we used Petunia hybrida flowers, which are rich in Phe-derived volatiles, to determine the

biosynthetic routes involved in Phe formation in planta. Of the three identified petunia ADTs, expression of ADT1 was the

highest in petunia petals and positively correlated with endogenous Phe levels throughout flower development. ADT1

showed strict substrate specificity toward arogenate, although with the lowest catalytic efficiency among the three ADTs.

ADT1 suppression via RNA interference in petunia petals significantly reduced ADT activity, levels of Phe, and downstream

phenylpropanoid/benzenoid volatiles. Unexpectedly, arogenate levels were unaltered, while shikimate and Trp levels were

decreased in transgenic petals. Stable isotope labeling experiments showed that ADT1 suppression led to downregulation

of carbon flux toward shikimic acid. However, an exogenous supply of shikimate bypassed this negative regulation and

resulted in elevated arogenate accumulation. Feeding with shikimate also led to prephenate and phenylpyruvate accumu-

lation and a partial recovery of the reduced Phe level in transgenic petals, suggesting that the phenylpyruvate route can also

operate in planta. These results provide genetic evidence that Phe is synthesized predominantly via arogenate in petunia

petals and uncover a novel posttranscriptional regulation of the shikimate pathway.

INTRODUCTION

In plants, L-Phe is not only a building block for protein synthesis

but also a precursor of >8000 phenolic compounds that consti-

tute up to 30 to 45% of plant organic matter (Razal et al., 1996)

and have profound impacts on plant growth, development,

reproduction, and defense (Croteau et al., 2000). These com-

pounds are widely spread across the plant kingdom and include

structural components (e.g., lignin, suberin, and other cell wall–

associated phenolics) that provide plants with mechanical

support and physical barriers against herbivory and microbial

invasion; flavonoid and anthocyanin pigments and phenylpro-

panoid/benzenoid volatiles that contribute to flower and fruit

color and aroma to ensure pollination and seed dispersal;

defense molecules (lignans, flavonoids, isoflavonoids, condensed

tannins, and some simple phenolic compounds) with antimicrobial

and antifeedant properties; UV protectants (flavonoids and other

phenolics) for absorbing DNA-damaging UV lights; and signal

molecules, such as isoflavonoids and the ubiquitous plant hor-

mone salicylic acid (Ogawa et al., 2005, 2006; Pan et al., 2006;

Sawada et al., 2006), although the latter can also be synthesized

from isochorismate by a Phe-independent pathway under path-

ogen attacks (Wildermuth et al., 2001; Catinot et al., 2008).

Despite the major roles of Phe in plant physiology and metab-

olism, our knowledge of its biosynthesis and regulation in plants

remains fragmented. Phe is derived from chorismate, the final

product of the shikimate pathway (Schmid and Amrhein, 1995;

Herrmann and Weaver, 1999). Chorismate is converted by cho-

rismate mutase (CM) to prephenate, which can be subsequently

converted to Phe via two alternative pathways (Siehl, 1999; Figure

1). In one pathway, prephenate undergoes transamination to

arogenate, which is then dehydrated/decarboxylated to Phe by

arogenate dehydratase (ADT; EC 4.2.1.91). In the other route,

prephenate is first subjected to dehydration/decarboxylation cat-

alyzed by prephenate dehydratase (PDT; EC 4.2.1.51) to form

phenylpyruvate, which is then transaminated to Phe (Siehl, 1999).

Most microorganisms studied to date synthesize Phe via phenyl-

pyruvate and contain PDTs (Davidson et al., 1972; Bentley, 1990;

Kleeb et al., 2006),with a fewexceptions (e.g.,Euglena gracilisand

1Current address: Division of Applied Biology, Faculty of Textile Scienceand Technology, Shinshu University, 3-15-1 Tokida, Ueda 386-8567,Japan.2 Address correspondence to [email protected] author responsible for distribution of materials integral to thefindings presented in this article in accordance with the policy describedin the Instructions for Authors (www.plantcell.org) is: Natalia Dudareva([email protected]).CSome figures in this article are displayed in color online but in blackand white in the print edition.WOnline version contains Web-only data.www.plantcell.org/cgi/doi/10.1105/tpc.109.073247

The Plant Cell, Vol. 22: 832–849, March 2010, www.plantcell.org ã 2010 American Society of Plant Biologists

Pseudomonas diminuta), which possess ADTs (Byng et al., 1981;

Zamir et al., 1985). In Escherichia coli, the PheA gene encodes a

bifunctional enzyme carrying both PDT and CM activities (with a

CM domain fused to the N-terminal end of the PDT domain;

Davidson et al., 1972; Zhang et al., 1998), and the null mutations in

the PDT domain result in a Phe auxotrophic mutant (Simmonds,

1950; Davis, 1953; Katagiri and Sato, 1953), suggesting that Phe

biosynthesis in E. coli occurs exclusively via phenylpyruvate

(Bentley, 1990).

In plants, PDT activity has been detected only in etiolated

Arabidopsis thaliana seedlings (Warpeha et al., 2006), while ADT

activities have been reported in a broad variety of plants (Jung

et al., 1986; Siehl and Conn, 1988). In addition, recent biochem-

ical characterization of six ADT genes from Arabidopsis and one

(out of four) from rice (Oryza sativa) revealed that three Arabi-

dopsis dehydratases have strict substrate specificity toward

arogenate, while the remaining three, as well as the rice enzyme,

can also accept prephenate, albeit with 10- to 100-fold lower

catalytic efficiencies (Cho et al., 2007; Yamada et al., 2008). The

genetic redundancy of Arabidopsis and rice ADTs, the lack of

their absolute substrate specificity (Cho et al., 2007; Yamada

et al., 2008), the inability to detect unstable pathway intermedi-

ates (e.g., arogenate and prephenate) from plant tissues (Razal

et al., 1994), and the indispensable nature of Phe make it difficult

to determine the physiological roles of ADT/PDTs in planta. As a

result, there is no genetic evidence indicating which of the two

proposed biosynthetic pathways (or both) is involved in Phe

biosynthesis in plants.

To address this question, we took advantage of the fact that

Petunia hybrida petals produce a large quantity of Phe-derived

volatiles (Verdonk et al., 2003; Boatright et al., 2004). Genetic

perturbations of Phe levels in this particular organ using a tissue-

specific promoter allow us to investigate Phe biosynthetic path-

ways without affecting plant growth and development. Using an

RNA interference (RNAi) approach to suppress ADT with strict

substrate specificity toward arogenate, we provide in planta

evidence that Phe is predominantly produced via arogenate in

petunia petals. Analysis of key pathway intermediates in trans-

genic and control petals further revealed unexpected posttran-

scriptional feedback regulation of the shikimate pathway leading

to Phe biosynthesis.

RESULTS

Identification of Petunia Genes Encoding ADT/PDT

To identify the gene(s) encoding ADT/PDT expressed in petunia

petals, we searched our previously generated petunia petal-

specific EST database (Boatright et al., 2004), as well as those

available at the Sol genomics network (http://www.sgn.cornell.

edu), for sequences with homology to E. coli CM/PDT (Hudson

and Davidson, 1984) or Arabidopsis ADTs (Cho et al., 2007). A

total of 41 ESTs were identified and assembled into two contigs

and one singlet each represented by 36, 1, and 4 ESTs and

designated as P. hybrida ADT1, ADT2, and ADT3 (see below),

respectively. The contigs for petunia ADT1 and ADT3 contain

full-length open reading frames, whereas the ADT2 singlet was

truncated at its 59 end and the corresponding full-length se-

quence was recovered by 59 rapid amplification of cDNA ends.

The resulting cDNAs encode proteins of 424, 394, and 434

amino acids with predicted molecular masses of 45.9, 43.4, and

47.3 kD, respectively. The ADT1 and ADT3 proteins were highly

similar to each other (84% amino acid identity), while ADT2

exhibited only 68 to 69% amino acid identity to ADT1 and ADT3

(see Supplemental Figure 1 online). Petunia ADT1, ADT2, and

ADT3 showed 78, 77, and 80% amino acid identity to their

closest Arabidopsis homologs, At ADT3, At ADT2, and At ADT6,

respectively (Figure 2; see Supplemental Data Set 1 online).

Amino acid sequence alignments of newly identified petunia

ADTs with E. coli CM/PDT, as well as with known and putative

Figure 1. Proposed Biosynthetic Pathways Leading to Phe in Plants.

Dotted arrows indicate involvement of multiple enzymatic steps. Gray

lines denote feedback inhibition. CHA, chorismate; DAHPS, 3-deoxy-D-

arabino-heptulosonate 7-phosphate synthase; E4P, erythrose 4-phos-

phate; PEP, phosphoenolpyruvate; SHA, shikimate.

Figure 2. Phylogenetic Tree of Plant ADTs and PDTs.

Phylogenetic tree illustrating relatedness of petunia ADTs (Ph ADTs) to

other plant ADTs/PDTs. The distance bar representing percentage of

sequence differences is shown under the tree. The bootstrap values

calculated from 1000 replicates are given for the nodes. Only a subset of

PDTs/ADTs with high amino acid homology to petunia ADTs is shown. At

ADT1 to At ADT6, Arabidopsis thaliana ADT1 to ADT6; Os ADT/MTR1,

Oryza sativa ADT/MTR1; It PDT/ADT, Ipomoea trifida putative PDT/ADT;

Sd PDT/ADT, Solanum demissum putative PDT/ADT.

[See online article for color version of this figure.]

Plant Phenylalanine Biosynthesis 833

plant PDT/ADTs, revealed the presence of two highly conserved

regions corresponding to the ADT/PDT catalytic and Phe binding

regulatory ACT (named after the regulatory domains of Asp

kinase, CM, and prephenate dehydrogenase TyrA) domains (see

Supplemental Figure 1 online; Grant, 2006). Comparison with

putative ADT/PDT sequences of cyanobacteria revealed that the

petunia ADT proteins, as well as other plant ADT/PDTs, contain

an additional 100 to 140 amino acids in their N terminus, a part of

which was predicted to be a putative plastid transit peptide

by both ChloroP 1.1 (cbs.dtu.dk/services/ChloroP) and WoLF

PSORT (wolfpsort.seq.cbrc.jp).

Biochemical Characterization of Petunia ADTs

The coding regions corresponding to mature ADT proteins

(lacking the N-terminal plastid transit peptides) were subcloned

into the expression vector pET-28a, which contains an N-terminal

hexahistidine (6xHis) tag. Recombinant proteins were expressed

in E. coli, purified, and analyzed for dehydratase activities with

arogenate and prephenate as substrates. Since E. coli crude

extract contains endogenous PDT activity (see Supplemental

Figure 2 online) derived from a bifunctional CM/PDT enzyme

(Davidson et al., 1972; Zhang et al., 1998), CM activity was

carefully monitored to ensure the absence of E. coli CM/PDT

contamination in purified fractions (see Supplemental Figure 2

online). All three petunia recombinant proteins were able to

convert arogenate to Phe with apparent Km values of 179, 66.7,

and 48.8 mM for ADT1, ADT2, and ADT3, respectively (Table 1).

ADT2 exhibited the highest catalytic efficiency (kcat/Km ratio) with

this substrate (18.5 mM21 s21), which was 12- and almost 5-fold

higher than that of ADT1 (1.5 mM21 s21) and ADT3 (4.0 mM21

s21), respectively (Table 1). Petunia ADT2 and ADT3 could also

use prephenate as substrate with apparent Km values of 752 and

465 mM. Their catalytic efficiencies of 0.08 and 0.03 mM21 s21,

respectively, were 10- to 200-fold lower than the corresponding

values with arogenate (Table 1). Based on the exclusive sub-

strate specificity of ADT1 and preferred substrate specificity of

ADT2 and ADT3 for arogenate, these petunia enzymes were

designated as ADTs.

Endogenous Phe and ADT Transcript Levels in

Petunia Flowers

Emission of Phe-derived phenylpropanoid/benzenoid volatiles

from petunia flowers begins after anthesis and changes rhyth-

mically during a daily light/dark cycle (Kolosova et al., 2001;

Verdonk et al., 2003). To examine whether these changes in the

volatile profile correlate with Phe levels, endogenous Phe pools

were analyzed during the day (11 AM) and night (8 PM) in petals

harvested from 1 d before to 6 d after anthesis. While daytime

Phe levels increased only slightly during flower development,

nighttime levels increased drastically after anthesis, reached

the highest level on day 2 after anthesis, and gradually declined

thereafter to 56%of themaximum level at the end of the life span

of the flower (Figure 3A). A detailed analysis of the Phe levels over

two daily light/dark cycles revealed oscillations with a maximum

at night, between 11 PM and 3 AM, followed by a decrease to

basal level by 7 AM (Figure 3B), positively correlating with volatile

emission (Kolosova et al., 2001; Verdonk et al., 2003).

To assess the involvement of ADT1, ADT2, and ADT3 in the

biosynthesis of Phe required for phenylpropanoid/benzenoid

formation in petunia flowers, their tissue- and organ-specific

expressionwas examined using quantitative RT-PCR (qRT-PCR)

with gene-specific primers. Out of three ADTs, ADT1 exhibited

the highest level of expression in corolla and tube, the scent-

producing parts of petunia flowers. In corolla, the ADT1 tran-

script levels exceeded those of ADT2 and ADT3 by 88- and

10-fold, respectively (Figure 3E). Low levels of expression were

found for all three ADTs in other flower organs and leaves. In stem

tissue, a site of active lignin biosynthesis, only ADT1 and ADT3

were expressed, but their levels were 41- and 56-fold lower,

respectively, than the ADT1 level in corolla (Figure 3E). The

mRNA levels of ADT1 and to a lesser extent of ADT3 were

developmentally regulated in flower corolla, peaking at 3 d after

anthesis (Figure 3C). Moreover, their expression levels changed

rhythmically during a daily light/dark cycle, peaking at 7 PM

(Figure 3D) and preceding the peaks of Phe levels (Figure 3B)

and phenylpropanoid/benzenoid emission (Kolosova et al.,

2001; Verdonk et al., 2003; Boatright et al., 2004). High ADT1

transcript levels in corolla and tubes imply that ADT1 plays a

major role in Phe biosynthesis in petunia petals.

Subcellular Localization of Petunia ADTs

Analysis of the ADT1, ADT2, and ADT3 protein sequences

predicted the presence of N-terminal plastid transit peptides of

52, 47, and 43 amino acids, respectively (ChloroP; see Supple-

mental Figure 1 online). To experimentally determine the sub-

cellular localization of the petunia ADT proteins, the complete

coding regions of each gene, as well as the individual N-terminal

transit peptides, were fused to a green fluorescent protein (GFP)

reporter gene, and the resulting constructs were transferred to

Arabidopsis protoplasts where the corresponding transient GFP

expression was analyzed by confocal scanning microscopy

(Figure 4). GFP fluorescence exhibited punctate and discrete

patterns associated with the chloroplasts when full-length pro-

teinswere fused toGFP (Figures 4A, 4C, and 4E). However, when

the first 80, 75 and 79 amino acids of ADT1, ADT2, and ADT3,

Table 1. Kinetic Parameters of Petunia ADTs

ADT1 ADT2 ADT3

Arogenate a

Km (mM) 179.0 6 15.5 66.7 6 10.2 48.8 6 7.2

Vmax (pkat/mg) 6,234 6 912 30,277 6 5,855 4,464 6 616

kcat (s�1) 0.267 6 0.039 1.231 6 0.238 0.194 6 0.027

kcat/Km

(mM�1 s�1)

1.48 6 0.12 18.51 6 2.23 4.00 6 0.31

Prephenate a

Km (mM) n.d.b 752.0 6 70.3 465.8 6 18.8

Vmax (pkat/mg) n.d. 1,473 6 197 280 6 10

kcat (s�1) n.d. 0.060 6 0.008 0.012 6 0.000

kcat/Km

(mM�1 s�1)

n.d. 0.08 6 0.01 0.03 6 0.00

Data are means 6 SE (n = 3 independent experiments).aSubstrates used.bNot detectable.

834 The Plant Cell

respectively, were fused to GFP, the GFP fluorescence was

localized evenly throughout the plastids (Figures 4B, 4D, and 4F),

which was similar to that of GFP fused to the transit peptide of

ribulose-1,5-bis-phosphate carboxylase/oxygenase (Rubisco)

small subunit, which localized in the stroma (Figure 4G), and

clearly distinct from the GFP control, which localized in the

cytosol (Figure 4H). These results indicate that, similar to the six

Arabidopsis ADT proteins (Rippert et al., 2009), all petunia ADTs

are localized in plastids where Phe biosynthesis takes place

(Jung et al., 1986; Siehl et al., 1986).

RNAi Suppression of ADT1 in Petunia Petals

To investigate the in vivo function of ADT1 in petunia flowers, its

mRNA levels were reduced in petals via an RNAi approach. The

RNAi construct was generated using a 444-bp fragment within

the 59 end of the ADT1 coding region and expressed under the

control of the predominantly petal-specific LIS (linalool synthase)

promoter from Clarkia breweri (Cseke et al., 1998). Twenty-nine

independent transformantswere generatedwith varying degrees

of ADT1 mRNA suppression relative to untransformed control

flower petals (Figure 5A). Four analyzed ADT1-RNAi lines (B, C, I,

and J) with reduced ADT1 expression exhibited a reduction in

total volatile emission by 25 to 70% relative to the control

(Figures 5B and 5C). Two independent lines with the greatest

reduction in ADT1 gene expression (lines B and C) were selected

for further metabolic analysis of emitted floral volatiles as well as

internal pools of intermediates and end products. The analyses

were conducted using petunia petals harvested at 8 PM from

flowers 2 d after anthesis (hereafter referred to as 2-d-old petals).

The ADT1-RNAi construct specifically decreased ADT1 expres-

sion but not ADT2 and ADT3 (Figure 6A) and did not alter overall

Figure 3. Endogenous Phe Levels and Expression Profiles of ADT Genes in Petunia.

(A) Endogenous Phe pools in petunia corolla at different stages of flower development starting from 1 d before opening (flower buds) to day 6

postanthesis. At each developmental stage, tissue was collected at 11 AM (open bars) and 8 PM (solid bars). Data are means 6 SE (n = 3 biological

replicates with the exception of the 11 AM time point on day 2, which was obtained from a single experiment).

(B) Endogenous Phe pools in the corolla of flowers 1 to 3 d postanthesis during a normal light/dark cycle. The corresponding dark periods (9 PM to 6 AM)

are shown with gray backgrounds. Data are means 6 SE (n = 3 or 4 biological replicates with the exception of the first four time points, which were

obtained from two experiments).

(C) Transcript levels of ADT1, ADT2, and ADT3were determined by qRT-PCR in corolla harvested at different stages of flower development frommature

buds to day 6 postanthesis. Data are presented as relative to the 3-d ADT1 level. Data are means 6 SE (n = 3 biological replicates).

(D) Changes in individual ADT transcripts in the corolla of flowers 1 to 3 d postanthesis during a normal light/dark cycle. The dark cycles (9 PM to 6 AM)

are shown with gray backgrounds. Data are presented as relative to ADT1 level at 7 PM on day 2 postanthesis. Data are means 6 SE (n = 3 biological

replicates).

(E) Tissue-specific expression of individual ADTs shown relative to corolla ADT1 levels. Data are means 6 SE (n = 3 biological replicates).

Plant Phenylalanine Biosynthesis 835

morphology, fresh weight, and total protein content in transgenic

flowers, which were not different from those of control flowers

(Figure 6B). Consistent with the reduced ADT1 expression,

ADT1-RNAi lines exhibited a significant reduction in ADT activity

(by 58 to 61%) in petal protein extracts relative to controls (Figure

6B), while PDT activity was undetectable under the conditions

tested. Furthermore, the endogenous Phe levels in the petals of

these ADT1-RNAi lines were reduced by 75 to 82% relative to

controls (Figure 7; see Supplemental Table 1 online), indicating

that ADT1 is involved in the biosynthesis of Phe in vivo.

To determine the impact of Phe reduction on the production of

phenylpropanoid/benzenoid volatiles, their emission was mea-

sured during the night from 8 PM to 8 AM using 2-d-old flowers of

both lines B and C and compared with untransformed controls.

Figure 4. Subcellular Localization of Petunia ADT Proteins.

Schematic diagrams of GFP fusion constructs for ADT1 ([A] and [B]), ADT2 ([C] and [D]), and ADT3 ([E] and [F]) are shown on the far left and

corresponding transient expression in Arabidopsis protoplasts detected by confocal laser scanning microscopy is shown on the right. GFP

fluorescence and chlorophyll autofluorescence are shown in the green and magenta vertical panels, respectively. The merged and transmission vertical

panels show the two combined fluorescence images and light microscopy images of intact protoplasts, respectively. GFP only (H) and RbTP (Rubisco

transit peptide)-GFP fusion (G) are used as cytosolic and chloroplast markers, respectively. The numbers below the fusion constructs show amino acid

positions. TP, transit peptide. Bars = 50 mm.

836 The Plant Cell

Emission of all phenylpropanoids/benzenoids was reduced in

both lines relative to controls, but the degree of reduction varied

among the different compounds (Figure 7; see Supplemental

Table 1 online). While phenylacetaldehyde, phenylethanol,

benzylacetate, benzaldehyde, and benzylalcohol levels were

reduced to 10 to 20% of their levels in control flowers, methyl-

benzoate, benzylbenzoate, phenylethylbenzoate, and eugenol

were only reduced to 30 to 50%. Among all produced volatile

compounds, isoeugenol was the least affected by ADT1 RNAi

suppression, and its level in transgenic flowers remained rela-

tively high, 70 to 80% of control flowers (Figure 7; see Supple-

mental Table 1 online). Consistent with the decrease in emission

levels, the endogenous pools of phenylpropanoids/benzenoids

in 2-d-old flowers harvested at 8 PM were also reduced, with

some compounds decreasing to below the detection limit in line

B when compared with controls (e.g., phenylacetaldehyde and

phenylethanol; see Supplemental Table 1 online). However,

activities of scent-producing enzymes, including phenylacetal-

dehyde synthase (PAAS; Kaminaga et al., 2006), benzoic acid/

salicylic acid carboxyl methyltransferase (BSMT; Negre et al.,

2003; Underwood et al., 2005), isoeugenol synthase (IGS;

Koeduka et al., 2006), and benzoyl-CoA:benzyl alcohol/phenyl-

ethanol benzoyltransferase (BPBT; Boatright et al., 2004), re-

sponsible for phenylacetaldehyde, methylbenzoate, isoeugenol,

and benzylbenzoate formation, respectively, remained unaltered

in transgenic petals (Table 2). Feeding of transgenic RNAi line B

flowers with 300mmol exogenous Phe for 4 h (from 8 PM to 12 AM)

recovered emission of all volatiles (Figure 8). As a trend, com-

pounds showing a greater reduction in emission under limited

Phe conditions in transgenic petals (e.g., benzaldehyde and

phenylacetaldehyde; Figure 8; see Supplemental Table 1 online)

exhibited greater recovery after exogenous Phe feeding than

compounds less affected by ADT1 mRNA suppression (e.g.,

methylbenzoate and isoeugenol). These results suggest that

limited Phe levels are responsible for the reduced volatile emis-

sion in transgenic flowers.

Reduction of Phe levels in ADT1-RNAi lines also affected the

amount of organic acid intermediates in the phenylpropanoid/

benzenoid network. In RNAi line B, the levels of trans-cinnamic

acid and benzoic acid were reduced by 86 and 77% relative to

control, respectively (Figure 7; see Supplemental Table 1 online),

while activities of Phe ammonia lyase (PAL) and benzaldehyde

dehydrogenase (BALDH; Long et al., 2009), which are respon-

sible for the formation of respective organic acids, remained

unchanged in transgenic petals (Table 2). Caffeic and ferulic acid

levels were reduced by only 45 and 38%, respectively, consis-

tent with;30% reduction in the isoeugenol emission relative to

controls (Figure 7; see Supplemental Table 1 online). Similar

changes were also observed in petals of transgenic line C (Figure

7; see Supplemental Table 1 online). The level of salicylic acid

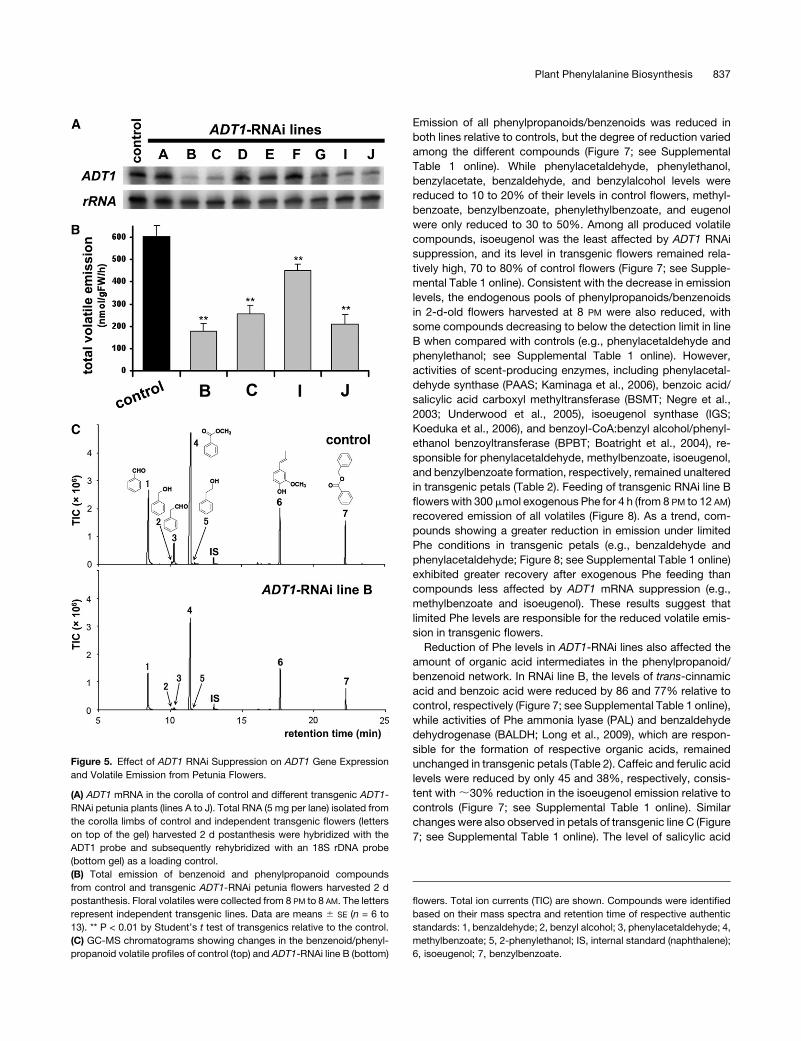
Figure 5. Effect of ADT1 RNAi Suppression on ADT1 Gene Expression

and Volatile Emission from Petunia Flowers.

(A) ADT1 mRNA in the corolla of control and different transgenic ADT1-

RNAi petunia plants (lines A to J). Total RNA (5 mg per lane) isolated from

the corolla limbs of control and independent transgenic flowers (letters

on top of the gel) harvested 2 d postanthesis were hybridized with the

ADT1 probe and subsequently rehybridized with an 18S rDNA probe

(bottom gel) as a loading control.

(B) Total emission of benzenoid and phenylpropanoid compounds

from control and transgenic ADT1-RNAi petunia flowers harvested 2 d

postanthesis. Floral volatiles were collected from 8 PM to 8 AM. The letters

represent independent transgenic lines. Data are means 6 SE (n = 6 to

13). ** P < 0.01 by Student’s t test of transgenics relative to the control.

(C) GC-MS chromatograms showing changes in the benzenoid/phenyl-

propanoid volatile profiles of control (top) and ADT1-RNAi line B (bottom)

flowers. Total ion currents (TIC) are shown. Compounds were identified

based on their mass spectra and retention time of respective authentic

standards: 1, benzaldehyde; 2, benzyl alcohol; 3, phenylacetaldehyde; 4,

methylbenzoate; 5, 2-phenylethanol; IS, internal standard (naphthalene);

6, isoeugenol; 7, benzylbenzoate.

Plant Phenylalanine Biosynthesis 837

was not significantly altered in transgenic lines (see Supplemen-

tal Table 1 online), suggesting that either salicylic acid in petunia

petals is mainly produced via a Phe-independent pathway

(Wildermuth et al., 2001) or that the remaining 20% of Phe in

transgenic plants is sufficient to support salicylic acid produc-

tion. Unexpectedly, the level of shikimic acid was significantly

reduced in both transgenic lines relative to controls (by 67 to

89%; Figure 7; see Supplemental Table 1 online).

Detection of arogenate in plant tissues was formerly found to

be difficult due to its low level and acid-labile property (Zamir

et al., 1983; Razal et al., 1994). By combining a previously

developed extraction protocol (Razal et al., 1994) with arogenate

detection using liquid chromatography–mass spectrometry

(LC-MS), we were able to analyze its levels in petunia petals.

The identity of the peak was confirmed by comparing its reten-

tion time and mass spectra with those of an arogenate standard

(see Supplemental Figure 3 online). Unexpectedly, no significant

differences were observed for the arogenate levels between

transgenic and control petals (Figure 7; see Supplemental Table

1 online). The levels of prephenate and phenylpyruvate were

also analyzed by taking advantage of acid and alkali labile

properties of prephenate and phenylpyruvate, respectively

(Davis, 1953; Doy and Gibson, 1961; Zamir et al., 1983; see

Methods and Supplemental Figure 4 online). While the levels of

phenylpyruvate were below the detection limit (<0.5 nmol/gFW),

low but similar levels of prephenate were detected in petals of

all genotypes (Figure 7; see Supplemental Table 1 online).

Interestingly, downregulation ofADT1 gene expression did not

alter the level of Tyr, which is also derived from arogenate by

arogenate dehydrogenase (Bonner and Jensen, 1987; Figure 7;

see Supplemental Table 1 online). However, the levels of Trp,

which is derived from chorismate, were significantly reduced in

both transgenic lines relative to controls (Figure 7; see Supple-

mental Table 1 online). The levels of mono- and diglycosides of

quercetin and kaempferol, flavonols known to accumulate in

the petals of P. hybrida (Griesbach and Asen, 1990; Griesbach

and Kamo, 1996), remained unaltered in transgenic petals (see

Supplemental Figure 5 online).

Downregulation of the Shikimate Pathway in ADT1

RNAi Petals

A 67 to 89% decrease in the endogenous pool of shikimic acid

in transgenic petals (Figure 7; see Supplemental Table 1 online)

could be a consequence of downregulation of flux toward

shikimate in ADT1-RNAi petunia flowers. To test this hypothesis,

petals of control and transgenic line B flowers were fed with

uniformly 13C-labeled ([U-13C12]) sucrose, the major carbon

source for flowers, for 6 h starting at 6 PM, when active Phe

biosynthesis takes place (Figures 3B and 3D), and pool sizes and

isotopic labeling of shikimate as well as sucrose at different time

points were analyzed (Figure 9). In both genotypes, sucrose

labeling always slightly exceeded labeling of shikimate, consis-

tent with a simple precursor-product relationship between su-

crose and shikimate (Figure 9). Over this time course, the

shikimate pool was significantly reduced in transgenic petals

relative to the control, while there was little difference in its

isotopic labeling (Figure 9B). The sucrose labeling pattern was

nearly identical in both control and transgenic petals (Figure 9A).

These results together indicate that in transgenic petals the

carbon flux toward shikimate is decreased in proportion to the

reduced pool size of shikimate. Similar results were obtained

when feeding experiments were performed for 16 h starting at 11

AM (see Supplemental Figure 6 online).

If an unaltered level of arogenate in transgenic petals is the

result of a reduction in shikimate pool size, the supply of

exogenous shikimate may lead to arogenate accumulation. To

test this hypothesis, petunia petals were fed with 300 mmol

shikimate for 7 h starting at 3 PM, and pool sizes of arogenate,

prephenate, and phenylpyruvate aswell as aromatic amino acids

were analyzed. Feeding of transgenic petals with shikimate

resulted in nearly a fivefold increase in the level of arogenate

relative to the control (Figure 10). Moreover, prephenate and

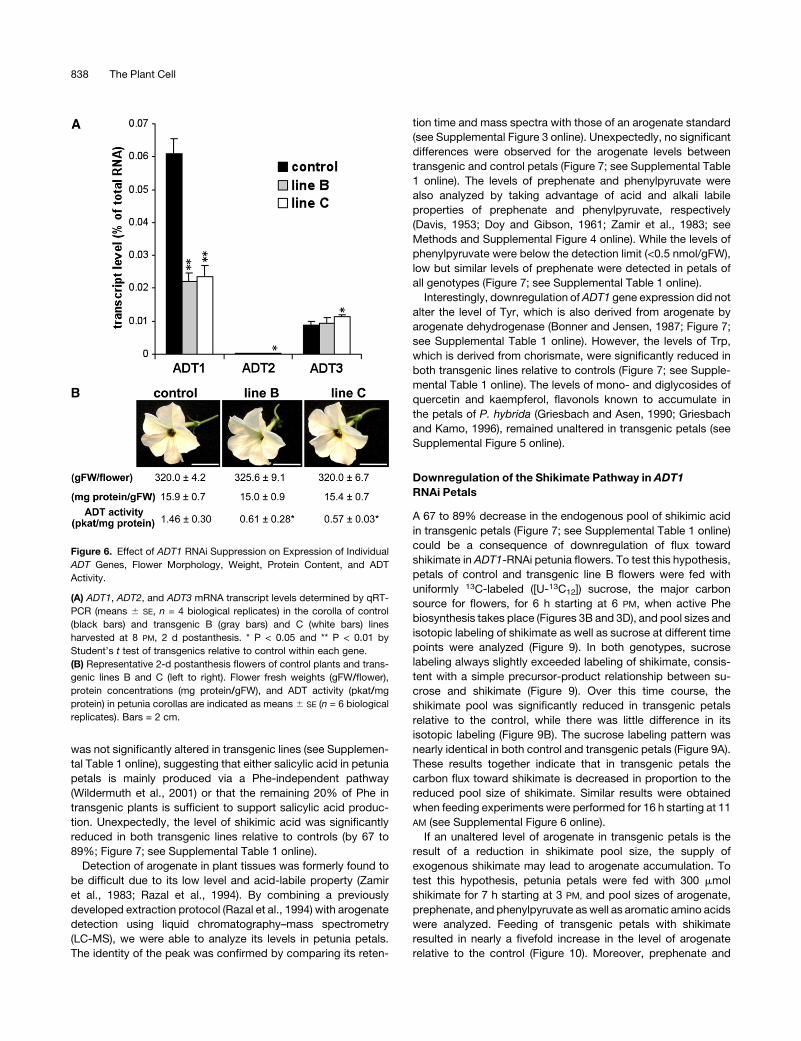
Figure 6. Effect of ADT1 RNAi Suppression on Expression of Individual

ADT Genes, Flower Morphology, Weight, Protein Content, and ADT

Activity.

(A) ADT1, ADT2, and ADT3 mRNA transcript levels determined by qRT-

PCR (means 6 SE, n = 4 biological replicates) in the corolla of control

(black bars) and transgenic B (gray bars) and C (white bars) lines

harvested at 8 PM, 2 d postanthesis. * P < 0.05 and ** P < 0.01 by

Student’s t test of transgenics relative to control within each gene.

(B) Representative 2-d postanthesis flowers of control plants and trans-

genic lines B and C (left to right). Flower fresh weights (gFW/flower),

protein concentrations (mg protein/gFW), and ADT activity (pkat/mg

protein) in petunia corollas are indicated as means 6 SE (n = 6 biological

replicates). Bars = 2 cm.

838 The Plant Cell

phenylpyruvate, which were previously at low or undetectable

levels (Figure 7), became readily measureable in both genotypes

after shikimate feeding with transgenic petals accumulating

approximately threefold higher level than control (Figure 10).

Shikimate feeding partially recovered the reduced levels of

endogenous Phe and Trp in transgenic petals, although differ-

ences between genotypes remained significant (Figure 10). Tyr

levels were similarly increased in both transgenic and control

petals after shikimate feeding.

To determine whether reduced shikimate pathway flux in

ADT1-RNAi lines (Figure 9) is the result of downregulation of

expression of 3-deoxy-D-arabino-heptulosonate 7-phosphate

synthase (DAHPS), which catalyzes the first committed step in

the shikimate pathway (Bentley, 1990; Herrmann and Weaver,

1999), DAHPS transcript level was analyzed in petals of two

transgenic petunia lines and control plants using qRT-PCR. We

also analyzed expression of genes encoding enzymes of the

shikimate pathway downstream of shikimate (e.g., 5-enolpyru-

vylshikimate 3-phosphate synthase [EPSPS] and CM) as well

as ODORANT1 (ODO1), which was shown to regulate the flux

through the shikimate pathway in petunia petals (Verdonk et al.,

2005). Surprisingly, the reduction in ADT1 expression in trans-

genic flowers led to an ;1.3 to 1.5-fold increase in DAHPS,

EPSPS, andCM transcript levels relative to controls, whileODO1

expression remained unaffected in flowers of transgenic line B

and were slightly decreased in line C (Figure 11).

DISCUSSION

The Postchorismate Pathway(s) for Phe Biosynthesis

Although there is no direct genetic evidence showing the actual

routes responsible for Phe formation in plants, it is believed that

Phe biosynthesis occurs via the arogenate pathway based on the

detection of ADT activities in a broad variety of plant crude

extracts (Jung et al., 1986; Siehl and Conn, 1988) and the

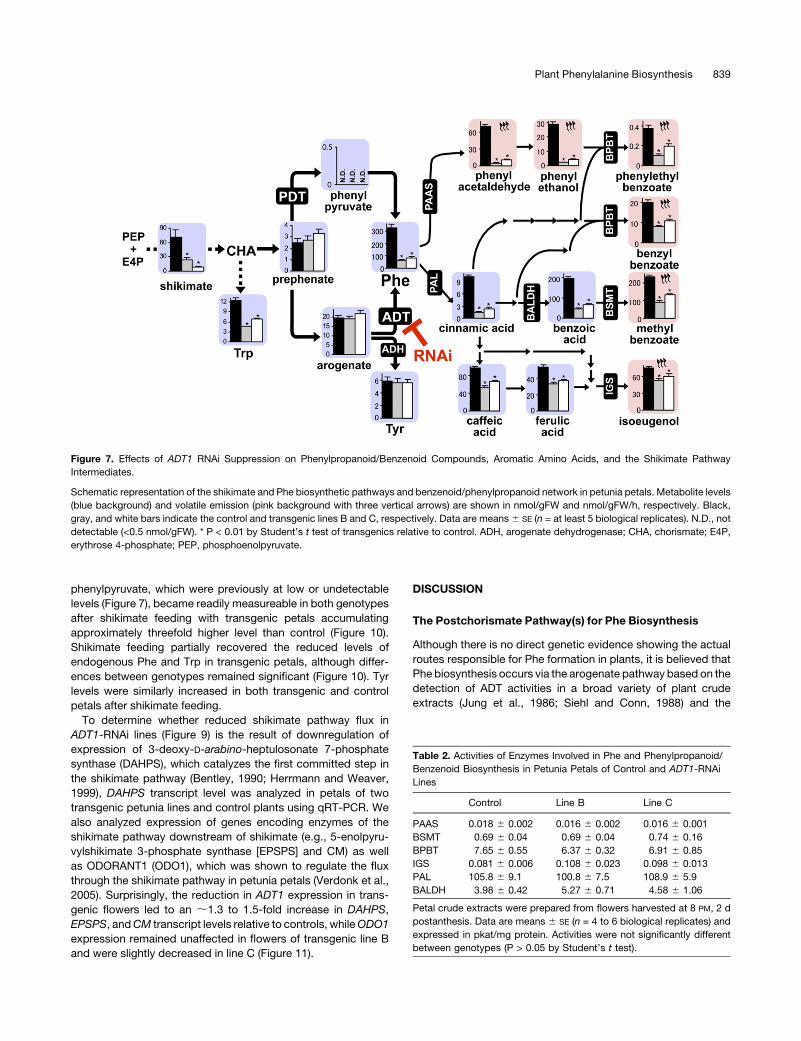
Figure 7. Effects of ADT1 RNAi Suppression on Phenylpropanoid/Benzenoid Compounds, Aromatic Amino Acids, and the Shikimate Pathway

Intermediates.

Schematic representation of the shikimate and Phe biosynthetic pathways and benzenoid/phenylpropanoid network in petunia petals. Metabolite levels

(blue background) and volatile emission (pink background with three vertical arrows) are shown in nmol/gFW and nmol/gFW/h, respectively. Black,

gray, and white bars indicate the control and transgenic lines B and C, respectively. Data are means6 SE (n = at least 5 biological replicates). N.D., not

detectable (<0.5 nmol/gFW). * P < 0.01 by Student’s t test of transgenics relative to control. ADH, arogenate dehydrogenase; CHA, chorismate; E4P,

erythrose 4-phosphate; PEP, phosphoenolpyruvate.

Table 2. Activities of Enzymes Involved in Phe and Phenylpropanoid/

Benzenoid Biosynthesis in Petunia Petals of Control and ADT1-RNAi

Lines

Control Line B Line C

PAAS 0.018 6 0.002 0.016 6 0.002 0.016 6 0.001

BSMT 0.69 6 0.04 0.69 6 0.04 0.74 6 0.16

BPBT 7.65 6 0.55 6.37 6 0.32 6.91 6 0.85

IGS 0.081 6 0.006 0.108 6 0.023 0.098 6 0.013

PAL 105.8 6 9.1 100.8 6 7.5 108.9 6 5.9

BALDH 3.98 6 0.42 5.27 6 0.71 4.58 6 1.06

Petal crude extracts were prepared from flowers harvested at 8 PM, 2 d

postanthesis. Data are means 6 SE (n = 4 to 6 biological replicates) and

expressed in pkat/mg protein. Activities were not significantly different

between genotypes (P > 0.05 by Student’s t test).

Plant Phenylalanine Biosynthesis 839

biochemical properties of isolated Arabidopsis and rice ADTs

(Cho et al., 2007; Yamada et al., 2008). In this study, wewere also

able to detect ADT activity as well as arogenate, but not phenyl-

pyruvate, in petunia petals (Figures 6B and 7). To obtain direct

evidence of the actual route(s) responsible for Phe production in

planta, we identified the ADT/PDT genes expressed in petunia

flowers and genetically altered Phe biosynthesis in this particular

organ. A search of all available petunia EST databases predom-

inantly generated from flower tissues identified three cDNAswith

similarity to known ADT/PDT genes (Figure 2; see Supplemental

Figure 1 online), which exhibited different levels of expression in

petunia petals (Figures 3C to 3E). As the petunia genome has not

been sequenced, additional genes may exist that encode ADT or

PDT, but their expression levels in flowers are likely very low

based on their absence in petunia EST databases.

All three petunia ADT proteins were targeted to plastids (Figure

4), suggesting their potential involvement in Phe biosynthesis in

this compartment. Biochemical characterization of recombinant

petunia ADTs showed that all ADT enzymes can convert aro-

genate to Phe in vitro. The apparent Km value of petunia ADT1 for

arogenate (179 mM) is very close to that of rice ADT (120 mM;

Yamada et al., 2008) and is 2.4-fold lower than the lowest

apparent Km value of six Arabidopsis ADTs ranging from 400 mM

to 10.1mM (Cho et al., 2007), while petunia ADT2 and ADT3 have

the lowest apparent Km values for arogenate among known plant

ADTs to date (66.7 and 48.8 mM, respectively). ADT2 and ADT3

could also use prephenate as a substrate, although with catalytic

efficiencies that are 231- and 133-fold lower, respectively, than

that with arogenate (Table 1). By contrast, petunia ADT1 was

unable to use prephenate.

Consistent with its being represented by the highest number of

ESTs, transcripts of ADT1 were found to be the most abundant

among the three ADTs in the scent-producing parts of petunia

flowers (Figure 3E). ADT1 expression was also developmentally

regulated and changed over a daily light/dark cycle (Figures 3C

and 3D), positively correlating with the endogenous pools of Phe

in petals (Figures 3A and 3B). RNAi downregulation of ADT1

expression resulted in a significant reduction of ADT activity and

Phe levels (up to 82%) in transgenic petals (Figures 6B and 7),

providing genetic evidence that ADT1 plays a major role in Phe

biosynthesis in petunia petals. The remaining Phe in the ADT1-

RNAi petals could be derived from residual ADT1 activity, dehy-

dratase activities of ADT2 or ADT3, and/or additional ADT/PDTs,

if any. Our results indicate that, in petunia petals, ADT1 activity

accounts for the majority of Phe production; thus, Phe biosyn-

thesis occurs predominantly via arogenate.

Unexpectedly, the endogenous pool of arogenate was not

altered by ADT1 suppression (Figure 7) and only shikimate

feeding led to its significant expansion in transgenic ADT1-

RNAi petals relative to controls (Figure 10). The exogenous supply

of shikimate also led to an accumulation of phenylpyruvate at

detectable levels in both control and transgenic petals, with the

Figure 8. Recovery of Benzenoid and Phenylpropanoid Volatile Emis-

sion from Transgenic ADT1-RNAi Petunia Flowers by Feeding with

Exogenous Phe.

Emitted volatiles were collected from control and transgenic petunia

flowers 2 d postanthesis from 8 PM to 12 AM in the presence (open bars)

and absence (closed bars) of exogenous Phe. Results are presented as a

percentage of emission of individual compounds in transgenic line B

relative to control flowers. Data are means 6 SE (n = 3 biological

replicates). Bald, benzaldehyde; Balc, benzylalcohol, BB, benzylben-

zoate; E, eugenol, IE, isoeugenol; MB, methylbenzoate; Pald, phenyl-

acetaldehyde; PB, phenylethylbenzoate; PE, 2-phenylethanol.

Figure 9. Isotopic Abundances and Pool Sizes of Shikimate in Control

and ADT1-RNAi Petunia Petals during Feeding with 13C-Sucrose for 6 h.

13C isotopic abundances (gray panels) and pool sizes (white panels) of

sucrose (A) and shikimate (B) were analyzed during a 6-h time course of

[U-13C12]-sucrose feeding to excised petals of control (solid circle) and

transgenic line B (open square) plants. Data are means 6 SE (n = 3

technical replicates). Similar results were obtained during a 16-h time

course (see Supplemental Figure 6 online).

840 The Plant Cell

latter accumulating higher levels (Figure 10). These results suggest

that when the flux toward prephenate is increased, prephenate

could also be converted to phenylpyruvate, presumably by PDT

activity of ADT2, ADT3, and/or additional unidentified ADT/PDTs.

The partial recovery of the reduced Phe level in the shikimate-fed

transgenic petals (Figure 10) implies that phenylpyruvate can

be further converted to Phe, or, alternatively, the high level of

arogenate is converted toPhe via residual ADT activity (Figure 6B).

However, recent heterologous overexpression of Phe-insensitive

E. coli CM/PDT enzyme in Arabidopsis drastically increased Phe

levels (Tzin et al., 2009), and feeding of deuterium-labeled Phe to

petunia petals resulted in label incorporation into phenylpyruvate

(Orlova et al., 2006), suggesting that Arabidopsis leaves and

petunia petals contain reversible aminotransferase activity, which

can interconvert phenylpyruvate and Phe (Liepman and Olsen,

2004). Taken together, these results suggest that the phenyl-

pyruvate pathway can operate in planta; however, its contribution

to Phe biosynthesis under different physiological conditions re-

quires further investigation.

Role of Phe Levels in the Formation of

Phenylpropanoid/benzenoid Volatiles

Phe is a precursor of numerous phenolic compounds produced

in plants. However, little is known about the contribution of Phe

levels to their production. An analysis of the Phe levels in petunia

petals revealed a positive correlation between endogenous Phe

levels and the emission of benzenoid and phenylpropanoid

compounds during flower development and over daily light/

dark cycles (Figures 3A and 3B; Kolosova et al., 2001; Verdonk

et al., 2003). Moreover, a drastic decrease in the level of Phe (by

75 to 82% from levels in control flowers) achieved by ADT1 RNAi

suppression resulted in up to a 70% reduction in total emission

of phenylpropanoid/benzenoid compounds relative to controls

(see Supplemental Table 1 online), a phenotype that could be

partially rescued by feeding transgenic flowers with exogenous

Phe (Figure 8). Since the activities of scent-producing enzymes

(i.e., BSMT, BPBT, IGS, and PAAS) as well as PAL, which

catalyzes the first entry step to the phenylpropanoid/benzenoid

network, were not altered in transgenic petals (Table 2), these

results suggest that the level of Phe is one of the major factors

in determining the amounts of benzenoid/phenylpropanoids

produced in petunia flowers.

In this study, Phe biosynthesis was reduced in petunia petal

tissue without deleterious effects on plant growth and develop-

ment, providing a unique opportunity to examine the impacts of

altered Phe biosynthesis on phenylpropanoid/benzenoid forma-

tion. The decreased Phe levels in the ADT1-RNAi petals resulted

in varying degrees of reduction in the emission of different

phenylpropanoid/benzenoid volatiles (Figure 7; see Supplemental

Table 1 online). The phenylacetaldehyde branch (which includes

phenylacetaldehyde and phenylethanol) was reduced by 86 to

93%, the methylbenzoate branch (methylbenzoate, benzylalco-

hol, benzylacetate, and benzaldehyde) by 59 to 73%, while the

isoeugenol branch (isoeugenol and eugenol) by only 21 to 32% in

transgenic flowers relative to the control (Figure 7). Unaltered

activities of scent- producing enzymes aswell as PAL and BALDH

(Table 2) suggest that branch-specific changes in enzyme levels

are not responsible for different degrees of reduction in volatile

emissions of individual compounds. Interestingly, the branch

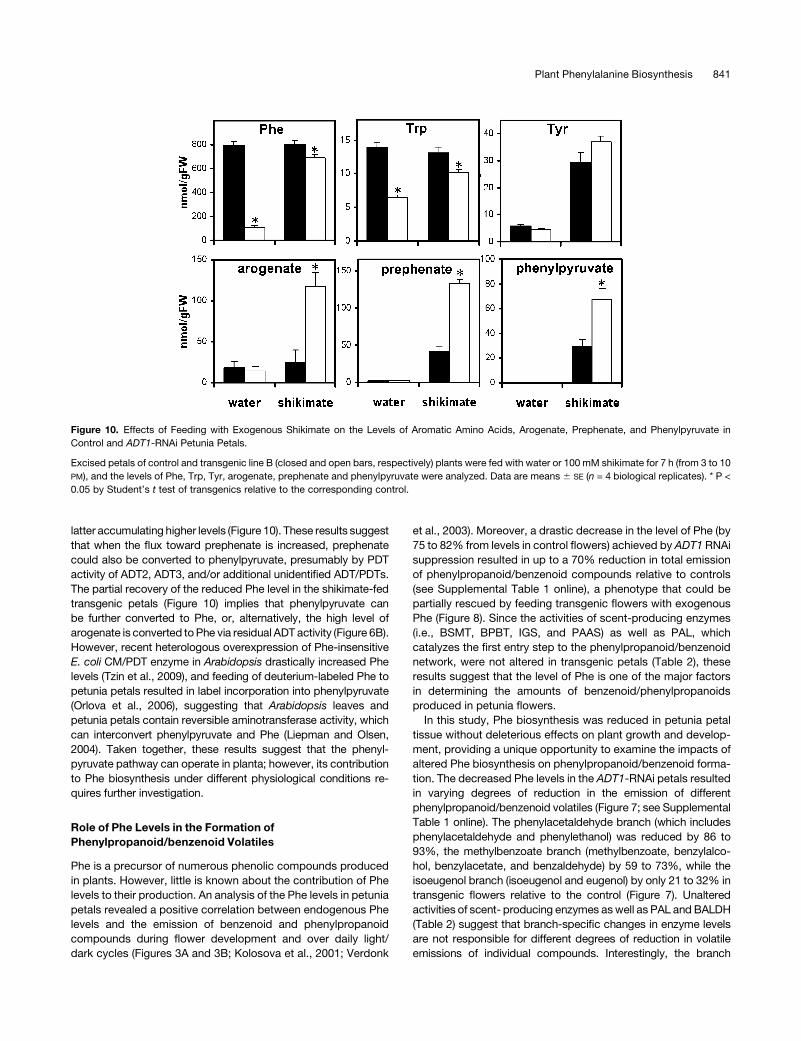
Figure 10. Effects of Feeding with Exogenous Shikimate on the Levels of Aromatic Amino Acids, Arogenate, Prephenate, and Phenylpyruvate in

Control and ADT1-RNAi Petunia Petals.

Excised petals of control and transgenic line B (closed and open bars, respectively) plants were fed with water or 100 mM shikimate for 7 h (from 3 to 10

PM), and the levels of Phe, Trp, Tyr, arogenate, prephenate and phenylpyruvate were analyzed. Data are means 6 SE (n = 4 biological replicates). * P <

0.05 by Student’s t test of transgenics relative to the corresponding control.

Plant Phenylalanine Biosynthesis 841

located downstream of the enzyme with the highest apparent

Km for Phe was most sensitive to reduction in Phe level. The

highest reduction was observed for phenylacetaldehyde, which is

synthesized by PAAS, whose Km value (1.2 mM) is 17- to 80-fold

higher than those of plant PALs (15 to 70 mM) (Hanson and

Havir, 1981; Jorrin and Dixon, 1990; Appert et al., 1994; Cochrane

et al., 2004; Kaminaga et al., 2006). By contrast, the least af-

fected isoeugenol branch is located downstream of cinnamate

4-hydroxylase, which generally has a very low Km value toward

cinnamic acid, ranging in plants from 2.5 to 9 mM (Gabriac et al.,

1991; Koopmann et al., 1999; Hubnera et al., 2003). Thus, at least

in part, relative substrate affinities of branch point enzymes likely

contribute to the differential effect of Phe reduction on phenyl-

propanoid/benzenoid volatile emission. Other factors, such as

branch-specific Phe-independent pathway(s) (Orlova et al., 2006),

metabolic channeling (Achnine et al., 2004; Winkel, 2004; Graham

et al., 2007), and/or feed-forward regulation (Thomas et al., 1999;

Waller et al., 2010), could also be involved in the metabolic flux

redistribution upon reduced Phe levels; thus, their contribution

remains to be determined. Similar differential effects on scent

formation were recently observed in petunia flowers with reduced

CM gene expression (Colquhoun et al., 2010).

Regulation of the Shikimate Pathway Leading to

Phe Biosynthesis

Prior studies suggested that in microorganisms and plants the

regulation within the postchorismate Phe pathway is similar,

whereas the flux into the shikimate pathway in plants is differently

regulated than in microorganisms and poorly understood

(Herrmann, 1995). Within the postchorismate pathway, Phe

feedback regulates CM and ADT (or PDT), which in turn control

the partitioning of carbon flow between the pathways leading to

Phe, Tyr, and Trp in both microbes and plants (Figure 1; Gilchris

et al., 1972; Jung et al., 1986; Siehl and Conn, 1988; Romero

et al., 1995; Yamada et al., 2008). DAHP synthase catalyzes the

entry step of the shikimate pathway and in microorganisms is

regulated transcriptionally and is also subjected to feedback

regulation by Phe at the enzyme level (Bentley, 1990; Herrmann

and Weaver, 1999). In plants, DAHP synthase genes are tran-

scriptionally regulated and induced in response to various envi-

ronmental stimuli (Dyer et al., 1989; Keith et al., 1991; Gorlach

et al., 1995). At the enzyme level, however, all plant DAHP

synthases examined to date are insensitive to Phe (Huisman

and Kosuge, 1974; Suzich et al., 1985; Herrmann, 1995). Thus, it

is unclear whether the carbon flow into the shikimate pathway is

regulated posttranscriptionally in plants.

A striking finding of this study is that transgenic ADT1-RNAi

petals had unaltered levels of arogenate and decreased levels of

shikimate and Trp (Figure 7; see Supplemental Table 1 online).

The reduction in shikimate levels is unlikely due to an increased

utilization of shikimate given that the levels of all three aromatic

amino acids as well as phenylpropanoid/benzenoid compounds

were either decreased or unchanged in transgenic plants relative

to the control (Figure 7). Stable isotope labeling experiments

(Figure 9) further indicate that in transgenic petals the flux toward

shikimate is reduced relative to controls, resulting in an unaltered

arogenate pool. Unexpectedly, the transcript levels of DAHPS,

EPSPS, and CM were upregulated, likely to compensate for the

low levels of Phe, while the expression ofODO1, a transcriptional

activator of DAHPS, EPSPS, and CM (Verdonk et al., 2005), was

almost unchanged in transgenic petals relative to controls (Fig-

ure 11). These results suggest that, in response to reduced Phe

levels, ADT1-RNAi petals upregulate shikimate pathway gene

expression independently of ODO1; however, posttranscrip-

tional regulation overrides this transcriptional compensation

and downregulates the flux through the shikimate pathway.

Currently, the nature of this posttranscriptional regulation of

the shikimate pathway, which can occur at the level of translation

(Wang and Sachs, 1997; Raney et al., 2002), protein modification

(Huber and Huber, 1996; Savage and Ohlrogge, 1999; Tetlow

et al., 2004; Uhrig et al., 2008), and/or enzyme activity (Ghosh

and Preiss, 1966; Gilchris et al., 1972; Chollet et al., 1996), is

unknown. Exogenously supplied shikimate clearly bypasses

this negative regulation and leads to elevated accumulation

of arogenate in transgenic petals (Figure 10), suggesting that

the regulation occurs upstream of shikimate. In contrast with

reduced shikimate levels in ADT1-RNAi petals, inhibition of

EPSPS, which converts shikimate 3-phosphate to EPSP, by

the herbicide glyphosate drastically increases shikimate levels in

various plant species (Amrhein et al., 1980; Harring et al., 1998;

Buehring et al., 2007; Henry et al., 2007). Taken together with the

decreased level of Trp in transgenic petunia petals (Figure 7), it

appears that a factor(s) downstream of chorismate likely serves

as a regulator(s) of the flux through the shikimate pathway.

In 1986, a hypothetical model was proposed for sequential

Figure 11. Expression Levels of Genes Encoding Shikimate Pathway

Enzymes and ODO1 Transcription Factor in Control and ADT1-RNAi

Petunia Petals.

Expression levels of DAHPS, EPSPS, and CM and their transcriptional

activator ODO1 were analyzed in the corolla of ADT1-RNAi lines B and C

(gray and white bars, respectively) harvested 2 d postanthesis at 8 PM

and compared with those in the control (black bars). Expression values

for lines B and C were indicated as percentages of corresponding value

of control petals, which is set at 100%. Data are means 6 SE (n = 4

biological replicates). * P < 0.05 and ** P < 0.01 by Student’s t test of

transgenics relative to control within each gene.

842 The Plant Cell

feedback regulation of Phe biosynthesis in which arogenate was

viewed as a DAHP synthase feedback regulator that acts as

a sensor of the overall Phe level (Jensen, 1986). Indeed, ADT

from tobacco (Nicotiana sylvestris), spinach (Spinacia oleracea),

Sorghum bicolor, and rice (Jung et al., 1986; Siehl and Conn,

1988; Yamada et al., 2008) and DAHPS from mung bean (Vigna

radiata) and spinach (Rubin and Jensen, 1979; Doong et al.,

1993) were shown to be inhibited in vitro by Phe and arogenate,

respectively. Although this model still awaits genetic proof, our

data are consistent with this hypothesis. Moreover, the ricemtr1

mutant carrying Phe feedback-insensitive ADT overaccumulates

Phe and Trp (Yamada et al., 2008), implying that the depletion

of the arogenate pool removes this negative regulation of the

shikimate pathway, leading to an overaccumulation of both Phe

and Trp. However, feeding of exogenous arogenate, prephenate,

or phenylpyruvate to wild-type petunia petals had little effect on

the shikimate levels (see Supplemental Figure 7 online), which

could be due to the inability of these pathway intermediates to

reach the site of action in the plastids, as none of them has been

shown to be transported across plastid membranes. Future

application ofmetabolic control analysis (Fell, 1997; Rios-Estepa

and Lange, 2007; Marshall Colon et al., 2010) may help to further

define the specific biochemical step(s) that exerts the greatest

control over the flux through the shikimate pathway.

In conclusion, this study provides both biochemical and ge-

netic evidence that Phe is producedpredominantly via arogenate

in petunia petals. Under an elevated supply of shikimate, the

phenylpyruvate route can also operate, but the negative regula-

tion of the shikimate pathway uncovered in this study likely

prevents the potential carbon overflow to the phenylpyruvate

route under normal conditions. Although these studies were

conducted in one model system, petunia petals, our data facil-

itate an in-depth understanding of the pathway and regulation of

Phe biosynthesis in plants and provide useful information for

rational engineering of the biosynthetic pathways leading to Phe

and numerous phenolic compounds.

METHODS

Plant Materials and Transformation

Petunia hybrida cv Mitchell plants (Ball Seed Co.) were grown under

standard greenhouse conditions (Dudareva et al., 2000) with a light period

from 6 AM to 9 PM. For the ADT1-RNAi construct, a fragment of petunia

ADT1 (444 bp in size) starting immediately after the ATG codon was

subcloned into the pENTR/D-TOPO vector (Invitrogen) using the forward,

59-CACCTGCAGTCCCTTACTCCTTCA-39, and reverse, 59-CTTTTCC-

AGCAGCAGCTTCG-39 primers. After verification by sequencing, LR

Clonase (Invitrogen) was used to splice a 444-bp fragment into the pLISG

vector, which was generated by placing gateway cloning attR sites from

pHellsgate8 (AF489904) into the XhoI/BclI and BamHI/SpeI sites of a

modified pRNA69 vector containing the LIS promoter from Clarkia brew-

eri in place of the 35S promoter (Orlova et al., 2006). The section of this

constructed plasmid containing the LIS promoter and gateway cloning

sites in opposite orientation separated by the intron was ligated into the

pART27 binary vector (Gleave, 1992) at the SacI and SpeI sites to obtain a

pLISG vector. ADT1-RNAi transgenic plants were obtained via Agro-

bacterium tumefaciens (strain GV3101 carrying plasmid pLISG-ADT1-

RNAi) transformation using the standard leaf disk transformation method

(Horsch et al., 1985). Rooted plants were screened for the presence of the

LIS promoter by PCR with the forward, 59-GGCACCCACTTCTTAAT-

GATC-39 (LIS-F), and reverse, 59-CTGGGATATGATAGGATGTGG-39

(LIS-R), primers and for the kanamycin resistance nptII gene using the

following forward and reverse primers: 59-TATTCGGCTATGACTGG-

GCA-39 (NPT-F) and 59-GCCAACGCTATGTCCTGATA-39 (NPT-R). T0

and T1 transformants were self-pollinated manually, and the obtained

seeds were analyzed for segregation by germinating on Murashige and

Skoog medium supplemented with kanamycin (200 mg/L). Seeds of

transgenic lines B and C showed 151:45 and 230:74 segregations for

kanamycin resistance, respectively, following 3:1 segregation (x2 test, P >

0.5). All analyses were conducted using T1 transformants showing

kanamycin resistant as well as suppression of ADT1 gene expression.

Phylogenetic Analysis

Phylogenetic analysis was conducted with MEGA software (version 4.02;

Tamura et al., 2007). The amino acid sequences were aligned using

ClustalW and then adjusted manually. Unrooted neighbor-joining trees

were constructed with the following parameters: number of differences,

complete deletion, and bootstrap (1000 replicates).

RNA Isolation, RNA Gel Blot Analysis, and Quantitative

Real-Time RT-PCR

For eachRNAsample, at least 10 flower petals were harvested at 8 PM, 2 d

after anthesis, and immediately frozen in liquid nitrogen. RNA gel blot

analysis was performed as previously described (Boatright et al., 2004).

Total RNA was isolated using an RNeasy plant mini kit (Qiagen), and 5 mg

of RNA was loaded in each lane. A 1.3-kb EcoRI fragment containing the

ADT1 coding region was used as a probe for RNA gel blot analysis. The

blots were rehybridized with an 18S rRNA probe as a loading control.

Autoradiography was performed overnight.

For qRT-PCR, the isolated total RNA was treated with DNase I to

eliminate genomicDNAusing the TURBODNA-free kit (Ambion), and 1mg

of RNA was subsequently reverse-transcribed to cDNA in a total volume

of 100 mL using the High Capacity cDNA reverse transcription kit (Applied

Biosystems). Petunia gene-specific primers, ADT1 forward 59-TAACT-

GCGAAGCCATTCCCTGC-39 and reverse 59- CTCTACTGGTAGAAC-

TGCGCG-39; ADT2 forward 59-ACGAAGTTGGGTTTGGTCAG-39 and

reverse 59- TGCCCCTGCATCTTTTAGTT-39; ADT3 forward 59-CAAA-

ATGTGAAGCTATTCCTTGTG-39 and reverse 59-TTCGATCGGTAAAA-

CAGCACG-39; ODO1 forward 59-ATTCGCCATGGGAATTTCC-39 and

reverse 59-GAAAGTGTCTTCCCAGGATGTCA-39; DAHPS forward

59-CAAAGCTCCGTGTGGTCTTAAA-39 and reverse 59-TCCTGGG-

TGGCTTCCTTCTT-39; EPSPS forward 59-CACCCCACCGGAGAAAC-

TAA-39 and reverse 59-TGACGGGAACATCTGCACAA-39; CM forward

59-CCTGCTGTTGAAGAGGCTATCA-39 and reverse 59-CAGGGTCAC-

CTCCATTTTCTG-39; and UBQ (ubiquitin 10) forward 59-GTTAGAT-

TGTCTGCTGTCGATGGT-39 and reverse 59-AGGAGCCAATTAAAG-

CACTTATCAA-39, were designed using PrimerExpress (Applied Biosys-

tems). All primers showed 90 to 100%efficiency at a final concentration of

300 nM. For quantification ofADT1,ADT2, andADT3 transcript levels, the

pCR4-TOPO vectors carrying truncated petunia ADT1, ADT2, and ADT3

were digested with EcoRI, and the resulting fragments were purified from

agarose gels using a Qiaquick gel extraction kit (Qiagen). After determin-

ing DNA concentration with the NanoDrop 1000 spectrophotometer

(Thermo Scientific), purified DNA fragments were diluted from 2 ng/mL to

3.2 pg/mL and used to obtain standard curves in qRT-PCR with gene-

specific primers. Individual qRT-PCR reactions contained 5 mL of the

SYBR Green PCR Master Mix (Applied Biosystems), 2 mL of 50 times

diluted cDNA and 1.5 mL of 2 mM forward and reverse primers. Two-step

qRT-PCR amplification (40 cycles of 958C for 3 s followed by 608C for 30 s)

was performed using the StepOn Real-Time PCR system (Applied

Plant Phenylalanine Biosynthesis 843

Biosystems). Based on the standard curves, absolute quantities of ADT1,

ADT2, and ADT3 transcripts were calculated and expressed as a per-

centage of the total RNA or relative to a control sample. For relative

quantification of DAPHS, EPSP,CM, andODO1 transcript levels,UBQ10

was used as a reference gene. Each data point represents an average of

three to four independent biological samples.

Heterologous Expression and Purification of Recombinant

Petunia ADTs

To obtain the full-length cDNA of ADT2, 59 rapid amplification of cDNA

ends was performed according to the manufacturer’s protocol (Invitro-

gen) with gene-specific (59-GGCCTTGGAAGGGGATTAGGTGAAT-39)

and nested (59-GCGTTAGAACAAGCGTAGATCGAGATA-39) primers.

For functional expression, coding regions of petunia ADTs corresponding

to mature proteins were obtained by PCR using the following forward

primers, which introduced an NdeI site and a starting Met in place

of Pro-52, Cys-47, and Ala-58 in ADT1 (59-CCATATGGCGAGTTA-

CAACTCCGGCC-39), ADT2 (59-CCATATGTCTAACGCCGAAAGCAA-

CAGCC-39), and ADT3 (59-CCATATGAGCAATAACACCGCCGG-39),

respectively. Reverse primers introduced a BamHI site downstream of

the stop codon and were as follows: 59-CGGATCCTCATTCATCCCTA-

GAAGGAC-39 for ADT1, 59-CGGATCCTCAAGCTATTCCACTATCTG-39

for ADT2, and 59-CGGATCCTTAAGCATCCCTGGAAG-39 for ADT3. Am-

plified gene products were subcloned into the NdeI-BamHI site of the

pET-28a vector containing an N-terminal (6xHis)-tag (Novagen). Se-

quencing confirmed that no errors were introduced during PCR amplifi-

cations.

Expression in Escherichia coli Rosetta cells, induction, harvesting, and

crude extract preparation were performed as previously described

(Kaminaga et al., 2006), with the exception of the lysis buffer, which

contained 20 mM Na-phosphate, pH 7.8, 100 mM NaCl, and 10%

glycerol. Protein purification was performed using fast protein liquid

chromatography (GE Healthcare). Crude extracts were applied to the

HisTrap FF column (1 mL; GE Healthcare), washed with a buffer

containing 20 mM Na-phosphate, pH 7.8, 500 mM NaCl, and 0, 5, 20,

and 40 mM imidazole, and the His-tagged protein was eluted with the

same buffer containing 500 mM imidazole. The eluated fraction (1 mL)

with the highest ADT activity was desalted on the Sephadex G-50 Fine

column (GE Healthcare) into a buffer containing 20 mM Tris-HCl, pH 8.0,

1 mM EDTA, and 10% glycerol. Protein purity was determined by

densitometry of SDS-PAGE gels after Coomassie Brilliant Blue staining

and was 57.5, 42.8, and 34.8% for petunia ADT1, ADT2, and ADT3,

respectively. The purity of the enzymes was taken into account for the

determination of their respective kcat values. Protein concentration was

determined using the Bradford method (Bradford, 1976).

Enzyme Assays

ADT activity was measured according to Fischer and Jensen (1987) with

somemodifications. The reactionmixtures (20mL) contained 250mMNa-

phosphate buffer, pH 8.2, 1mMEDTA, and 150mMarogenate, whichwas

obtained by enzymatic conversion of prephenate to arogenate as previ-

ously described (Rippert and Matringe, 2002), followed by purification

using ion exchange chromatography (Connelly and Siehl, 1987). After

preincubation at 378C for 5 min, 1 mg of enzyme was added. The reaction

was incubated at 378C for 30 min before termination by 10 mL of

methanol. After centrifugation, 20 mL of the mixture was derivatized

with o-phthalaldehyde (Connelly and Siehl, 1987) and analyzed by HPLC

using the Luna C18 (2) column (3 mm, 100A, 1503 4.6mm; Phenomenex)

with a 30-min linear gradient of 10 to 70% methanol in 20 mM Na-

phosphate buffer, pH 6.8. Phe production was monitored at 336 nm and

quantified based on a standard calibration curve generated with authen-

tic Phe (Fluka). For ADT activity in petal extracts, 2 g of petal tissues

harvested at 8 PM 2 d after anthesis were ground in 7 mL of lysis buffer (20

mM Tris-HCl, pH 8.0, 1 mM EDTA, 1 mM DTT, 10% glycerol, 1 mM

phenylmethylsulphonyl fluoride, 35 mg leupeptin, and 35 mL of protease

inhibitor cocktail [Sigma-Aldrich]) and subjected to 20 to 40%ammonium

sulfate precipitation (Jung et al., 1986). After desalting with a Sephadex

G-50 column (GE Healthcare) and concentrating using a Amicon Ultra-4

(Millipore) to 200 mL, 5 mL of the protein extract was added to the total

volume of the 12-mL reaction mixture containing 500 mM arogenate and

20 mM Tris, pH 8.0, and the mixture was incubated at 378C for 15 min.

ADT activity was expressed as pkat per mg total protein in the ammonium

sulfate precipitated extract.

CM and PDT activities were determined according to Cotton and

Gibson (1965), with some modifications. The reaction mixture (50 mL)

containing 20 mM Tris-HCl, pH 8.0, 1 mM EDTA, and 500 mM chorismate

or prephenate was preincubated at 378C for 5 min. After adding 1.8 to 3

mg of purified enzymes or 33 mg of proteins from E. coli crude extracts,

reaction mixtures were incubated at 378C for 30 and 20 min for PDT and

CM activities, respectively. In the case of PDT activity, the reaction was

stopped with 200 mL of 2.5 N NaOH, while the CM reaction was stopped

with 50 mL of 1 N HCl followed by 20 min of incubation at 378C and a

subsequent addition of 150 mL 2.5 N NaOH. After centrifugation, phenyl-

pyruvate formation was monitored spectrophotometrically at 320 nm. The

identity of the phenylpyruvate product was also confirmed using HPLC and

an authentic standard (Sigma-Aldrich). For HPLCanalysis, the reactionwas

stoppedwith 30mL ofmethanol and10mLwas analyzedon anAgilent 1200

HPLC system using the Luna C18 (2) column (3 mm, 100A, 1503 4.6 mm;

Phenomenex) at a flow rate of 1mL/minwith a 40-min linear gradient of 0 to

30% methanol in 20 mM Na-phosphate buffer, pH 6.8.

For PAL, BSMT, BPBT, PAAS, IGS, and BALDH activity, crude protein

extracts were prepared from petunia petals of control and transgenic

plants harvested at 8 PM, 2 d after anthesis, as described previously

(Dudareva et al., 2000; Kolosova et al., 2001; Boatright et al., 2004;

Kaminaga et al., 2006; Koeduka et al., 2008). PAL activity was determined

by measuring the formation of U-14C-cinnamic acid from U-14C-L-Phe

(Kolosova et al., 2001), and BSMT was determined by measuring the

transfer of the 14C-labeled methyl group of S-adenosyl-L-methionine to

the carboxyl group of benzoic acid (Dudareva et al., 2000). PAAS

(Kaminaga et al., 2006) and BPBT (Boatright et al., 2004) activities were

determined by measuring the respective formation of phenylacetalde-

hyde fromPhe, and benzylbenzoate frombenzoyl-CoA andbenzylalcohol

using gas chromatography (GC)–MS. For IGS and BALDH activities,

crude extracts were desalted on small Sephadex G-25 spin columns

(NAP-5 column; GE Healthcare) into 50 mMNa-phosphate, pH 7.5, 1 mM

DTT, and 25%glycerol for analysis of BALDH activity and 50mMbis-Tris-

HCl, pH 7.0, 10 mM b-mercaptoethanol, and 10% glycerol for IGS

activity. BALDH and IGS activities were analyzed as described previously

(Koeduka et al., 2008), with the exception that the IGS reaction was

coupled with the CFAT reaction to produce coniferyl acetate (Dexter

et al., 2007), a substrate for IGS.

All enzyme assays were performed at an appropriate enzyme concen-

tration so that reaction velocity was proportional to enzyme concentration

and linear during the incubation time period. Kinetic data were evaluated

by hyperbolic regression analysis (HYPER.EXE, version 1.00). Triplicate

assays were performed for all data points for kinetic analysis.

Subcellular Localization of ADT Proteins

The open reading frames and the first 80, 75, and 79 amino acids of ADT1,

ADT2, and ADT3, respectively, were fused upstreamof, and in framewith,

GFP in the XbaI and BamHI cloning sites of the p326-SGFP vector

containing the cauliflowermosaic virus 35S promoter (a gift from I. Hwang

Pohang, University of Science and Technology, Korea). For the two ADT1

constructs, the same forward primer, 59-GTCTAGAATGCAGTCCCT-

TACTCCTTC-39, was used in combination with the following reverse

844 The Plant Cell

primers: 59-CGGATCCTTCATCCCTAGAAGGACAGC-39 (for p326-

PhADT1-SGFP) or 59-CGGATCCTGAGACTACTTTGCTTGCTAAT-39 (for

p326-TP1-80 PhADT1-SGFP). For the two ADT2 constructs, the same

forward primer, 59-GTCTAGAATGGCAGCCACCACTACAC-39, was

used in combination with 59-CGGATCCAGCTATTCCACTATCTGA-

CGG-39 (for p326-PhADT2-SGFP) or 59-CGGATCCATGTTCATCACT-

GACTTTATTAAG-39 (for p326-TP1-75 PhADT2-SGFP) reverse primers.

For the two ADT3 constructs, the same forward primer, 59-GTCTA-

GAATGCAGTCCCTTACTCCA-39, was used with two reverse primers,

59-CGGATCCAGCATCCCTGGAAGGA-39 (for p326-PhADT3-SGFP) and

59-CGGATCCAATTGCACACGAACTCTG-39 (for p326-TP1-79 PhADT3-

SGFP). Sequencing confirmed the accuracy of the fusions. Arabidopsis

thaliana protoplasts were prepared and transformed as described

(Sheen, 2002; Nagegowda et al., 2008). The plasmids p326-SGFP and

p326-RbTP-SGFP, containing a plastidial Rubisco target peptide, were

used as markers for cytosolic and plastidial localization, respectively.

Transient expression of GFP fusion proteinswas observed 16 to 20 h after

transformation. Images were acquired using a Radiance 2100 MP Rain-

bow (Bio-Rad) on a TE2000 (Nikon) inverted microscope using a 360 oil

1.4–numerical aperture lens. GFP was excited with the 488-nm line of

the four-line argon, and the emission was collected with a 500LP, 540SP

filter combination. Chlorophyll fluorescence was excited by the 637-nm

red diode laser, and emission >660 nm was collected.

Analysis of Floral Volatiles and Organic and Amino Acids

Floral volatiles were collected using a closed-loop stripping method

(Orlova et al., 2006) from 8 PM until 8 AM using control and ADT1-RNAi

petunia flowers (three flowers per biological replicate) harvested 2 d after

anthesis. For feeding experiments, excised corolla tissues harvested 2 d

after anthesis (eight petals per biological replicate) were placed on moist

round filter paper (9 cm in diameter) supplied with 300 mmol of Phe or

shikimate dissolved in 3 mL of water, and volatiles were collected from

8 PM to 12 AM for Phe feedings and from 3 to 10 PM for shikimate feedings.

Trapped scent compounds were eluted from Paropak Q traps (8/100

mesh size; Alltech Associates) with 300 mL dichloromethane containing a

naphthalene (200mg/mL) as an internal standard and analyzed byGC-MS

(5975 inert XL EI/CI mass spectrometer detector combined with 6890N

GC; Agilent Technologies) and an Agilent 19091S-433 HP-5MS capillary

column (30 m 3 0.25 mm; film thickness 0.25 mm). Injector temperature

and volume were 2508C and 1 mL (splitless), respectively. Column

temperature was held at 408C for 3 min and then heated to 2208C at

88C min21. Electron ionization energy was set at 70 eV. Mass spectra

were obtained in scan mode scanning across 50 to 550 atomic mass

units. All volatile compounds were identified by comparing their retention

times and mass spectra with those of corresponding authentic com-

pounds. Quantification was performed using calibration curves gener-

ated from individual authentic standards (Sigma-Aldrich).

To determine the internal pools of volatiles, amino acids, and organic

acids, 1 g of transgenic and control corolla tissues from at least eight

flowers per samplewas collected at 8 PMon the second day after anthesis

to minimize the effect of rhythmicity. Internal pools of volatiles were

extracted overnight by shaking the ground tissues with 10 mL of

dichloromethane containing a naphthalene internal standard (200 mg/

mL), concentrated (Goodwin et al., 2003), and analyzed by GC-MS as

described above. Analyses of organic and amino acids, with the excep-

tions of shikimate, arogenate, phenylpyruvate, and Trp, were performed

as described previously (Orlova et al., 2006), with some modifications.

Frozen tissue (0.5 g) was extracted overnight at 48C with 10 mL of 100%

methanol containing 250 nmol of a-aminoadipic acid and 4-chlorobenzoic

acid as internal standards. The extracts weremixed with 5mL chloroform

and 6 mL water for phase separation, and the resulting aqueous layer

was removed, dried, and then redissolved in 4 mL of water. For organic

acid analysis, 3mL of the extract in water wasmixedwith 20mL of 1 N HCl

and extracted twice with 3 mL of ethyl acetate, which was dried and

derivatized with 250 mL of N,O-Bis(trimethylsilyl)trifluoroacetamide

(Supelco) and 20 mL of pyridine at 758C for 2 h. Samples were then

analyzed by GC-MS as described above, with some differences. The

injector temperature was 2608C. The column temperature was held at

358C for 3 min and then heated to 2608C at 88C min21. All organic acids

were identified by comparing their retention times and mass spectra with

those of corresponding authentic compounds. Quantification was per-

formed using calibration curves generated from individual authentic

standards.

For the amino acid analysis, 1 mL of the remaining extract was

subjected to ion exchange chromatography using a Dowex 50-H+ 3 8,

200 mesh column (Sigma-Aldrich). Amino acids were eluted from the

column with 6 mL of 6 M NH4OH, dried, dissolved in 0.4 mL of 60%

methanol, and dried again. The dried sample was derivatized with 200 mL

of a 5:1 (v/v) isobutanol:acetyl chloride mixture at 1208C for 20 min, dried,

derivatized again with 100 mL of heptafluorobutyric anhydride (Sigma-

Aldrich) at 1208C for 10min, dried to incipient dryness, dissolved in 200mL

of a 1:1 (v/v) ethyl acetate:acetic anhydride mixture, and analyzed by GC-

MS as described previously (Boatright et al., 2004). All amino acids were

identified by comparing their retention times andmass spectra with those

of corresponding authentic compounds. Quantification was performed

using calibration curves generated from an authentic mixture containing

individual amino acids (Sigma-Aldrich).

Trp and flavonol extraction was performed overnight at 48C by adding

1.8 mL of 80% methanol containing an internal standard, Leu-Leu-Leu

tripeptides (14 pmol; Sigma-Aldrich), to 300 mg of petal tissue. After

sonication for 20 min followed by centrifugation, the supernatant was

removed and combined with 500 mL chloroform and 200 mL water. After

phase separation, the resulting methanol/water phase was dried using

vacuum centrifugation, resuspended in 100 mL of a HPLC diluent of 5%

acetonitrile containing 0.1% formic acid, and analyzed by LC-MS. Chro-

matographic separations were performed using an Agilent 1100 HPLC

system and an Atlantis T3 (2.1 3 150 mm 3 3 um) separation column

(Waters). Mobile phases were (A) 0.1% formic acid (v/v) in Milli-Q water

and (B) 0.1% formic acid (v/v) in acetonitrile. After 5 mL of sample

injection, 5% Bwas held for 1 min, followed by a linear gradient to 75%B

over 49 min and a 10-min equilibration back to 5% B at a 0.3-mL/min

flow rate and 408C column temperature. The column effluent was then

introduced by positive electrospray ionization (ESI) into an Agilent 6210

MSD time-of-flight mass spectrometer. The ESI capillary voltage was 3.0

kV, nitrogen gas temperature was set to 3508C, drying gas flow rate was

11.0 L/min, nebulizer gas pressure was 30 psig, fragmentor voltage was

130 V, skimmer was 65 V, andOCT RFwas 250 V. Mass data (frommass-

to-charge ratios [m/z] of 70 to 1500) were collected and analyzed using

AgilentMassHunter B.02 software. Identification and quantification of Trp

were based on standard calibration curves generated from an authentic

Trp standard (Sigma-Aldrich). Using the same LC-MS chromatograms,

quercetin-3-O-glucoside and kaempferol-3-O-glucoside were identified

by comparing their retention times, UV spectra, as well as mass spectra

in positive and negative modes with those of authentic standards.

The quercetin-3-O-glucoside and kaempferol-3-O-glucoside as well as

the remaining two compounds detected in petunia petals had fragments

of 303.05 and 287.06 m/z in positive mode, which correspond to the

molecular ions of quercetin and kaempferol, respectively. In addition, all

four flavonols had fragments of m/z 162.05 or 324.11 higher than the

molecular ions of quercetin or kaempferol in positive mode, consistent

with them being mono- or diglycosides, respectively. Relative quantifi-

cation of flavonols between transgenic and control petals were con-

ducted by extracting specific ions, m/z 303.05, 465.10, and 627.16, for

quercetin diglycoside, 287.06, 449.11, and 611.16 for kaempferol digly-

coside, 303.05 and 465.10 for quercetin-3-O-glucoside, and 287.06 and

449.12 for kaempferol-3-O-glucoside (see Supplemental Figure 5 online).

Plant Phenylalanine Biosynthesis 845

Because shikimic acid was poorly extracted by ethyl acetate during

organic acid analysis, a different method was used for its extraction and

analysis (Becerril et al., 1989; Singh and Shaner, 1998). Half a gram of

frozen tissue was ground in liquid N2 and homogenized in 1 mL of 0.25 N

HCl. After centrifugation, the supernatant was filtered through a 0.45-mm

GHPolypro (GHP) filter (Pall Corporation) and analyzed by HPLC using an

Agilent ZORBAX SB-C18 column (4.6 3 150 mm 3 3.5 mm) with an

isocratic elution of 0.1% formic acid (v/v) in Milli-Q water at a 0.5-mL/min

flow rate. Shikimic acid was monitored at 215 nm and quantified based

on a standard calibration curve generated with authentic shikimic acid

(Sigma-Aldrich).

For the analyses of arogenate, 0.5 g tissue was ground in liquid N2

and homogenized in 1.5 mL of 75% ethanol containing 0.5% 2-amino-

2-methyl-1-propanol HCl, pH 11 (Razal et al., 1994), and 100 nmol

of a-aminoadipic acid as an internal standard. After centrifugation,

200 mL of the supernatant was filtered through an Ultrafree-MC filter

(Ultra-4; Millipore Amicon), vacuum dried, and dissolved in 50 mL water.

For arogenate analysis, 20 mL of the sample was derivatized with

o-phthaldialdehyde and injected into LC-MS. Chromatographic separa-

tions were performed using an Agilent 1100 HPLC system and a Luna

C18 (2) column (3 mm, 100 A, 2503 4.6 mm; Phenomenex) with a 48-min

linear gradient of 10 to 70%methanol in 0.1% ammonium acetate (v/v) at

a 0.3-mL/min flow rate and 358C column temperature. The column

effluent was then introduced by negative ESI into an Agilent 6210 MSD

time-of-flight mass spectrometer. The ESI capillary voltage was 3.2 kV,

nitrogen gas temperature was set to 3508C, drying gas flow rate was

8.0 L/min, nebulizer gas pressure was 35 psig, fragmentor voltage was

140 V, skimmer was 60 V, and OCT RF was 250 V. The arogenate peak

was identified by comparing the retention time and mass spectrum of

the purified arogenate standard (see above and Supplemental Figure 3

online). Quantification was based on a calibration curve generated by the

authentic standard.

Poor retention of prephenate on the C18 LC column and its instability

during derivatization prevented its direct analysis on LC or GC-MS. Thus,

prephenate was quantified after its acid conversion to phenylpyruvate,

which is readily detectable by LC-MS and degraded under alkaline

conditions (Davis, 1953; Doy and Gibson, 1961; Zamir et al., 1983).

Petunia petal tissue extracts were prepared as described for arogenate

analysis with the exceptions of using 4-chlorobenzoic acid as an internal

standard and the buffer pH of either 6 or 9. A phenylpyruvate peak

detected in the petal extracts prepared at pH 6.0 represents a sum of

endogenous phenylpyruvate as well as phenylpyruvate produced by acid

conversion of prephenate during extraction. By contrast, extraction of

petal tissues at pH 9.0 leads to degradation of endogenous phenyl-

pyruvate under alkaline conditions (Doy and Gibson, 1961; see Supple-

mental Figure 4 online). However, subsequent acidification of the pH 9.0

petal extract by 0.25 N HCl treatment for 60 min at room temperature

resulted in complete conversion of endogenous prephenate to phenyl-

pyruvate (Davis, 1953; see Supplemental Figure 4 online). The difference

between phenylpyruvate levels in the petal extracts prepared at pH 6.0

and 9, the latter treatedwith HCl, represents endogenous phenylpyruvate

content. Authentic prephenate and phenylpyruvate standards added

before extraction were quantitatively recovered during this procedure.

Ten microliters of the sample was injected to an Agilent 1100 HPLC system

and separated by an Atlantis T3 (2.1 3 150 mm 3 3 mm) separation column

(Waters)witha5-min isocraticelutionwith0%methanol followedbyan18-min

linear gradient of 0 to 26% methanol in 0.1% ammonium acetate (v/v) at a

0.3-mL/min flow rate and 358C column temperature. MS analysis was

conducted as described for arogenate analysis with the exception of a drying

gas flow rate of 9.0 L/min. The phenylpyruvate peak was identified by

comparing the retention times and mass spectra of the authentic phenyl-

pyruvate standard (see Supplemental Figure 4 online). Quantificationwas per-

formed based on a calibration curve generated from the authentic standard.

Stable Isotope Labeling of Shikimate by Feeding 13C-Sucrose

Excised corolla tissues harvested 2 d after anthesis (eight petals per each

biological replicate) were placed on a piece of round filter paper (4 cm in

diameter; Boatright et al., 2004; Orlova et al., 2006) moistened with 500

mL of 3% [U-13C12]-sucrose (Omicron Biochemicals) for a duration of 6 or

16 h and harvested in liquid N2 at different time points. Shikimate was

extracted from 100 mg of the frozen tissues and separated by HPLC as

described above. The column effluent was then introduced by negative

ESI into an Agilent 6210 MSD time-of-flight mass spectrometer. The ESI

capillary voltage was 3.2 kV, nitrogen gas temperature was set to 3508C,

drying gas flow rate was 10.0 L/min, nebulizer gas pressure was 50 psig,

fragmentor voltagewas 140 V, skimmerwas 60 V, andOCTRFwas 250 V.

Mass data (from m/z 70 to 1000) were collected and analyzed using

Agilent MassHunter B.02 software. Due to an interference of a 175.027

m/z fragment from an unknown adjacent peak, the intensity of M+2

species of shikimate (175.058 m/z) was estimated as an average of M+1

(174.053m/z) andM+3 (176.065m/z) species. The percentage of labeling

was determined as the intensity of the shifted shikimate molecular ion

divided by the sum of intensities for unshifted and shifted molecular ions

after correcting for natural isotope abundance.

Sucrose was extracted from fed petal tissues and analyzed as

previously described (Roessner et al., 2001), with some modifications.

The frozen tissues (100 mg) were extracted in 500 mL of methanol

containing 0.5 mg of an internal standard, ribitol (Sigma-Aldrich), by

incubating at 708C for 15min. After cooling, 500 mL of water was added,

the mixture was vortexed for 15 min and then centrifuged. Twenty

microliters of the supernatant was dried and derivatized with 50 mL of

20 mg/mL methoxyamine hydrochloride (Sigma-Aldrich) dissolved in

pyridine (Thermo Scientific) for 30min at 308C followed by derivatization

with 50 mL of MSTFA (Sigma-Aldrich) for 90 min at 378C. One-microliter

aliquots of the derivatized solutions were injected at a split ratio of

1:4 into a GC-MS (Agilent Technologies) as described above, with the

following changes: the injector temperature was 2308C and column

temperature was held at 1508C for 1 min and then increased at 58C

min21 to 1758C, 18C min21 to 1858C, and 108C min21 to 2508C. The

mass data were analyzed byWsearch32 Ver.1.6. (RMIT Chemistry), and

the percentage of labeling was calculated as described above for

shikimate.

Accession Numbers

The GenBank/EMBL accession numbers for the sequences mentioned in

this article are as follows: At ADT1, NP_172644; At ADT2, NP_187420; At

ADT3, NP_180350; At ADT4, NP_190058; At ADT5, NP_197655; At ADT6,

NP_563809; Ec PDT, BAA16484; Os ADT, AAP54696; It PDT, AAS79603;

Ph ADT1, FJ790412; Ph ADT2, FJ790413; Ph ADT3, FJ790414; Sd PDT,

AAT39307; and Sy PDT, NP_440143

Supplemental Data

The following materials are available in the online version of this article.

Supplemental Figure 1. Sequence Alignment of Predicted Amino

Acid Sequences of Petunia ADTs with Plant and Bacterial ADT/PDTs.

Supplemental Figure 2. CM and PDT Activities during Purification of

Petunia ADTs.

Supplemental Figure 3. Arogenate Detection in Petunia Petal Tis-

sues using LC-MS.

Supplemental Figure 4. Flavonol Levels in Petunia Petals of Control

and ADT1-RNAi Lines.

Supplemental Figure 5. Prephenate and Phenylpyruvate Detection in

Petunia Petal Tissues Using LC-MS.

846 The Plant Cell

Supplemental Figure 6. Isotopic Abundances and Pool Sizes of

Shikimate in Control and ADT1-RNAi Petunia Petals during Feeding

with 13C-Sucrose for 16 h.

Supplemental Figure 7. Effects of Arogenate, Prephenate, and

Phenylpyruvate Feeding on the Levels of Shikimate in Petunia Petals.

Supplemental Table 1. Volatile and Metabolite Analysis in the

Petunia Petals of Control and ADT1-RNAi Lines B and C.

Supplemental Data Set 1. Protein Sequences Used to Generate the

Phylogeny Presented in Figure 2.

ACKNOWLEDGMENTS

We thank Jiameng Zheng and Christine Kish for technical assistance in

the qRT-PCR experiments, Yasuhisa Kaminaga for initial help with

protein purification, Jennifer Sturgis for confocal microscopy assis-

tance, Dinesh Nagegowda for help with subcellular localization studies,

Joelle Muhlemann for help with sucrose analysis, and Joseph Ogas and

Nicholas Bonawitz for critical reading of the manuscript. This work was

supported by grants from the National Science Foundation (MCB-

0615700 to N.D. and MCB-0718152 to E.P.) and the Fred Gloeckner

Foundation (to N.D.). H.M. was supported in part by JSPS Postdoctoral

Fellowship for Research Abroad (Japan Society for the Promotion of

Science). A.K.S. was supported by Department of Biotechnology,

Government of India.

Received December 2, 2009; revised February 11, 2010; accepted

February 23, 2010; published March 9, 2010.

REFERENCES

Achnine, L., Blancaflor, E.B., Rasmussen, S., and Dixon, R.A. (2004).

Colocalization of L-phenylalanine ammonia-lyase and cinnarnate

4-hydroxylase for metabolic channeling in phenylpropanoid biosyn-

thesis. Plant Cell 16: 3098–3109.

Amrhein, N., Deus, B., Gehrke, P., and Steinrucken, H.C. (1980). The

site of the inhibition of the shikimate pathway by glyphosate. II.

Interference of glyphosate with chorismate formation in vivo and in

vitro. Plant Physiol. 66: 830–834.

Appert, C., Logemann, E., Hahlbrock, K., Schmid, J., and Amrhein,

N. (1994). Structural and catalytic properties of the four phenylalanine

ammonia-lyase isoenzymes from parsley (Petroselinum crispum

Nym.). Eur. J. Biochem. 225: 491–499.

Becerril, J., Duke, S., and Lydon, J. (1989). Glyphosate effects on

shikimate pathway products in leaves and flowers of velvetleaf.

Phytochemistry 28: 695–699.

Bentley, R. (1990). The shikimate pathway - A metabolic tree with many

branches. Crit. Rev. Biochem. Mol. Biol. 25: 307–384.

Boatright, J., Negre, F., Chen, X.L., Kish, C.M., Wood, B., Peel, G.,

Orlova, I., Gang, D., Rhodes, D., and Dudareva, N. (2004). Under-

standing in vivo benzenoid metabolism in petunia petal tissue. Plant

Physiol. 135: 1993–2011.

Bonner, C., and Jensen, R. (1987). Arogenate dehydrogenase.

Methods Enzymol. 142: 488–494.

Bradford, M.M. (1976). Rapid and sensitive method for quantitation of

microgram quantities of protein utilizing principle of protein-dye

binding. Anal. Biochem. 72: 248–254.

Buehring, N.W., Massey, J.H., and Reynolds, D.B. (2007). Shikimic

acid accumulation in field-grown corn (Zea mays) following simulated

glyphosate drift. J. Agric. Food Chem. 55: 819–824.

Byng, G.S., Whitaker, R.J., Shapiro, C.L., and Jensen, R.A. (1981).

The aromatic amino acid pathway branches at L-arogenate in Euglena

gracilis. Mol. Cell. Biol. 1: 426–438.

Catinot, J., Buchala, A., Abou-Mansour, E., and Metraux, J.P. (2008).

Salicylic acid production in response to biotic and abiotic stress

depends on isochorismate in Nicotiana benthamiana. FEBS Lett. 582:

473–478.

Cho, M.H., et al. (2007). Phenylalanine biosynthesis in Arabidopsis

thaliana - Identification and characterization of arogenate dehydra-

tases. J. Biol. Chem. 282: 30827–30835.

Chollet, R., Vidal, J., and Oleary, M.H. (1996). Phosphoenolpyruvate

carboxylase: A ubiquitous, highly regulated enzyme in plants. Annu.

Rev. Plant Physiol. 47: 273–298.

Cochrane, F.C., Davin, L.B., and Lewis, N.G. (2004). The Arabidopsis

phenylalanine ammonia lyase gene family: Kinetic characterization of

the four PAL isoforms. Phytochemistry 65: 1557–1564.

Connelly, J.A., and Siehl, D.L. (1987). Purification of chorismate,

prephenate, and arogenate by HPLC. Methods Enzymol. 142: 422–431.

Colquhoun, T.A., Schimmel, B.C., Kim, J.Y., Reinhardt, D., Cline, K.,

and Clark, D.G. (2010). A petunia chorismate mutase specialized for

the production of floral volatiles. Plant J. 61: 145–155.

Cotton, R.G.H., and Gibson, F. (1965). Biosynthesis of phenylalanine

and tyrosine - Enzymes converting chorismic acid into prephenic acid

and their relationships to prephenate dehydratase and prephenate

dehydrogenase. Biochim. Biophys. Acta 100: 76–88.

Croteau, R., Kutchan, T.M., and Lewis, N.G. (2000). Natural products

(secondary methabolites). In Biochemistry and Molecular Biology of

Plants, R.B. Buchanan, W. Gruissem, and R. Jones, eds (Rockville,

MD: American Society of Plant Physiology), pp. 1250–1318.

Cseke, L., Dudareva, N., and Pichersky, E. (1998). Structure and

evolution of linalool synthase. Mol. Biol. Evol. 15: 1491–1498.

Davidson, B.E., Blackburn, E.H., and Dopheide, T.A. (1972). Choris-

mate mutase-prephenate dehydratase from Escherichia coli K-12. 1.

Purification, molecular weight, and amino acid composition. J. Biol.

Chem. 247: 4441–4446.

Davis, B.D. (1953). Autocatalytic growth of a mutant due to accumu-

lation of an unstable phenylalanine precursor. Science 118: 251–252.

Dexter, R., Qualley, A., Kish, C.M., Ma, C.J., Koeduka, T., Nagegowda,

D.A., Dudareva, N., Pichersky, E., and Clark, D. (2007). Character-

ization of a petunia acetyltransferase involved in the biosynthesis of the

floral volatile isoeugenol. Plant J. 49: 265–275.

Doong, R.L., Ganson, R.J., and Jensen, R.A. (1993). Plastid-localized

3-deoxy-D-arabino-heptulosonate 7-phosphate synthase (DS Mn):

The early-pathway target of sequential feedback inhibition in higher

plants. Plant Cell Environ. 16: 393–402.

Doy, C.H., and Gibson, F. (1961). The formation of 4-hydroxyphenyl-

pyruvic acid and phenylpyruvic acid by tryptophan auxotrophs and

wild-type Aerobacter aerogenes considered in relation to the general

aromatic pathway. Biochim. Biophys. Acta 50: 495–505.

Dudareva, N., Murfitt, L.M., Mann, C.J., Gorenstein, N., Kolosova,

N., Kish, C.M., Bonham, C., and Wood, K. (2000). Developmental

regulation of methyl benzoate biosynthesis and emission in snap-

dragon flowers. Plant Cell 12: 949–961.

Dyer, W., Henstrand, J., Handa, A., and Herrmann, K. (1989).

Wounding induces the first enzyme of the shikimate pathway in

Solanaceae. Proc. Natl. Acad. Sci. USA 86: 7370–7373.

Fell, D. (1997). Understanding the Control of Metabolism. (London:

Portland Press).

Fischer, R., and Jensen, R. (1987). Arogenate dehydratase. Methods

Enzymol. 142: 495–502.

Gabriac, B., Werckreichhart, D., Teutsch, H., and Durst, F. (1991).

Purification and Immunocharacterization of a plant cytochrome P450: the

cinnamic acid 4-hydroxylase. Arch. Biochem. Biophys. 288: 302–309.

Plant Phenylalanine Biosynthesis 847

Ghosh, H.P., and Preiss, J. (1966). Adenosine diphosphate glucose

pyrophosphorylase: A regulatory enzyme in the biosynthesis of starch

in spinach leaf chloroplasts. J. Biol. Chem. 241: 4491–4504.

Gilchris, D.G., Woodin, T.S., Kosuge, T., and Johnson, M.L. (1972).

Regulation of aromatic amino acid biosynthesis in higher plants. 1.

Evidence for a regulatory form of chorismate mutase in etiolated

mung bean seedlings. Plant Physiol. 49: 52–57.

Gleave, A.P. (1992). A versatile binary vector system with a T-DNA

organizational structure conducive to efficient integration of cloned

DNA into the plant genome. Plant Mol. Biol. 20: 1203–1207.

Goodwin, S.M., Kolosova, N., Kish, C.M., Wood, K.V., Dudareva, N.,

and Jenks, M.A. (2003). Cuticle characteristics and volatile emissions

of petals in Antirrhinum majus. Physiol. Plant. 117: 435–443.

Graham, J.W.A., Williams, T.C.R., Morgan, M., Fernie, A.R., Ratcliffe,

R.G., and Sweetlove, L.J. (2007). Glycolytic enzymes associate

dynamically with mitochondria in response to respiratory demand

and support substrate channeling. Plant Cell 19: 3723–3738.

Grant, G.A. (2006). The ACT domain: A small molecule binding domain

and its role as a common regulatory element. J. Biol. Chem. 281:

33825–33829.

Griesbach, R.J., and Asen, S. (1990). Characterization of the flavonol

glycosides in petunia. Plant Sci. 70: 49–56.

Griesbach, R.J., and Kamo, K.K. (1996). The effect of induced poly-

ploidy on the flavonols of Petunia ’Mitchell’. Phytochemistry 42:

361–363.

Gorlach, J., Raesecke, H., Rentsch, D., Regenass, M., Roy, P., Zala,

M., Keel, C., Boller, T., Amrhein, N., and Schmid, J. (1995).

Temporally distinct accumulation of transcripts encoding enzymes

of the prechorismate pathway in elicitor-treated, cultured tomato

cells. Proc. Natl. Acad. Sci. USA 92: 3166–3170.

Hanson, K.R., and Havir, E.A. (1981). Phenylalanine ammonia lyase. In

Biochemistry of Plants, Vol. 7, Secondary Plant Products, E.E. Conn,

ed (New York: Academic Press), pp. 577–625.

Harring, T., Streibig, J.C., and Husted, S. (1998). Accumulation of

shikimic acid: A technique for screening glyphosate efficacy. J. Agric.

Food Chem. 46: 4406–4412.

Henry, W.B., Shaner, D.L., and West, M.S. (2007). Shikimate accu-

mulation in sunflower, wheat, and proso millet after glyphosate

application. Weed Sci. 55: 1–5.

Herrmann, K.M. (1995). The shikimate pathway - Early steps in the

biosynthesis of aromatic compounds. Plant Cell 7: 907–919.

Herrmann, K.M., and Weaver, L.M. (1999). The shikimate pathway.

Annu. Rev. Plant Physiol. 50: 473–503.

Horsch, R.B., Fry, J.E., Hoffmann, N.L., Eichholtz, D., Rogers, S.G.,

and Fraley, R.T. (1985). A simple and general method for transferring

genes into plants. Science 227: 1229–1231.

Huber, S.C., and Huber, J.L. (1996). Role and regulation of sucrose-

phosphate synthase in higher plants. Annu. Rev. Plant Physiol. 47:

431–444.

Hubnera, S., Hehmann, M., Schreiner, S., Martens, S., Lukacin, R.,

and Matern, U. (2003). Functional expression of cinnamate

4-hydroxylase from Ammi majus L. Phytochemistry 64: 445–452.

Hudson, G.S., and Davidson, B.E. (1984). Nucleotide sequence and

transcription of the phenylalanine and tyrosine operons of Escherichia

coli K12. J. Mol. Biol. 180: 1023–1051.

Huisman, O.C., and Kosuge, T. (1974). Regulation of aromatic amino

acid biosynthesis in higher plants. II. 3-Deoxy-arabino-heptulosonic

acid 7-phosphate synthetase from cauliflower. J. Biol. Chem. 249:

6842–6848.

Jensen, R.A. (1986). The shikimate arogenate pathway - Link between

carbohydrate metabolism and secondary metabolism. Physiol. Plant.

66: 164–168.

Jorrin, J., and Dixon, R.A. (1990). Stress responses in Alfalfa (Medi-

cago sativa L). 2. Purification, characterization, and induction of

phenylalanine ammonia lyase isoforms from elicitor-treated cell sus-

pension cultures. Plant Physiol. 92: 447–455.

Jung, E., Zamir, L.O., and Jensen, R.A. (1986). Chloroplasts of higher

plants synthesize L-phenylalanine via L-arogenate. Proc. Natl. Acad.

Sci. USA 83: 7231–7235.

Kaminaga, Y., et al. (2006). Plant phenylacetaldehyde synthase is a

bifunctional homotetrameric enzyme that catalyzes phenylalanine

decarboxylation and oxidation. J. Biol. Chem. 281: 23357–23366.

Katagiri, M., and Sato, R. (1953). Accumulation of phenylalanine by a

phenylalanineless mutant of Escherichia coli. Science 118: 250–251.

Keith, B., Dong, X., Ausubel, F., and Fink, G. (1991). Differential

induction of 3-deoxy-D-arabino-heptulosonate 7-phosphate synthase

genes in Arabidopsis thaliana by wounding and pathogenic attack.

Proc. Natl. Acad. Sci. USA 88: 8821–8825.

Kleeb, A.C., Kast, P., and Hilvert, D. (2006). A monofunctional and

thermostable prephenate dehydratase from the archaeon Methano-

caldococcus jannaschii. Biochemistry 45: 14101–14110.

Koeduka, T., et al. (2006). Eugenol and isoeugenol, characteristic

aromatic constituents of spices, are biosynthesized via reduction of a

coniferyl alcohol ester. Proc. Natl. Acad. Sci. USA 103: 10128–10133.

Koeduka, T., Louie, G., Orlova, I., Kish, C., Ibdah, M., Wilkerson, C.,

Bowman, M., Baiga, T., Noel, J., Dudareva, N., and Pichersky, E.

(2008). The multiple phenylpropene synthases in both Clarkia breweri

and Petunia hybrida represent two distinct protein lineages. Plant J.

54: 362–374.

Kolosova, N., Gorenstein, N., Kish, C.M., and Dudareva, N. (2001).

Regulation of circadian methyl benzoate emission in diurnally and

nocturnally emitting plants. Plant Cell 13: 2333–2347.

Koopmann, E., Logemann, E., and Hahlbrock, K. (1999). Regulation

and functional expression of cinnamate 4-hydroxylase from parsley.

Plant Physiol. 119: 49–55.

Liepman, A.H., and Olsen, L.I. (2004). Genomic analysis of amino-

transferases in Arabidopsis thaliana. Crit. Rev. Plant Sci. 23: 73–89.

Long, M., Nagegowda, D., Kaminaga, Y., Ho, K., Kish, C., Schnepp,

J., Sherman, D., Weiner, H., Rhodes, D., and Dudareva, N. (2009).

Involvement of snapdragon benzaldehyde dehydrogenase in benzoic

acid biosynthesis. Plant J. 59: 256–265.

Marshall Colon, A., Sengupta, N., Rhodes, D., Dudareva, N., and

Morgan, J. (2010). A kinetic model describes metabolic response to

perturbations and distribution of flux control in the benzenoid network

of Petunia hybrida. Plant J., in press.

Nagegowda, D.A., Gutensohn, M., Wilkerson, C.G., and Dudareva,

N. (2008). Two nearly identical terpene synthases catalyze the forma-

tion of nerolidol and linalool in snapdragon flowers. Plant J. 55:

224–239.

Negre, F., Kish, C.M., Boatright, J., Underwood, B., Shibuya, K.,

Wagner, C., Clark, D.G., and Dudareva, N. (2003). Regulation of

methylbenzoate emission after pollination in snapdragon and petunia

flowers. Plant Cell 15: 2992–3006.

Ogawa, D., Nakajima, N., Sano, T., Tamaoki, M., Aono, M., Kubo, A.,

Kanna, M., Ioki, M., Kamada, H., and Saji, H. (2005). Salicylic acid

accumulation under O3 exposure is regulated by ethylene in tobacco

plants. Plant Cell Physiol. 46: 1062–1072.

Ogawa, D., Nakajima, N., Seo, S., Mitsuhara, I., Kamada, H., and

Ohashi, Y. (2006). The phenylalanine pathway is the main route of

salicylic acid biosynthesis in tobacco mosaic virus-infected tobacco

leaves. Plant Biotechnol. 23: 395–398.

Orlova, I., Marshall-Colon, A., Schnepp, J., Wood, B., Varbanova,

M., Fridman, E., Blakeslee, J.J., Peer, W.A., Murphy, A.S., Rhodes,

D., Pichersky, E., and Dudareva, N. (2006). Reduction of benzenoid

synthesis in petunia flowers reveals multiple pathways to benzoic acid

and enhancement in auxin transport. Plant Cell 18: 3458–3475.

848 The Plant Cell

Pan, Q.H., Zhan, J.C., Liu, H.T., Zhang, J.H., Chen, J.Y., Wen, P.F.,

and Huang, W.D. (2006). Salicylic acid synthesized by benzoic acid

2-hydroxylase participates in the development of thermotolerance in

pea plants. Plant Sci. 171: 226–233.

Raney, A., Law, G.L., Mize, G.J., and Morris, D.R. (2002). Regulated

translation termination at the upstream open reading frame in

S-adenosylmethionine decarboxylase mRNA. J. Biol. Chem. 277:

5988–5994.

Razal, R., Lewis, N., and Towers, G. (1994). Pico-tag analysis of

arogenic acid and related free amino acids from plant and fungal

extracts. Phytochem. Anal. 5: 98–104.

Razal, R.A., Ellis, S., Singh, S., Lewis, N.G., and Towers, G.H.N.

(1996). Nitrogen recycling in phenylpropanoid metabolism. Phyto-

chemistry 41: 31–35.

Rios-Estepa, R., and Lange, B.M. (2007). Experimental and mathe-

matical approaches to modeling plant metabolic networks. Phyto-

chemistry 68: 2351–2374.

Rippert, P., and Matringe, M. (2002). Molecular and biochemical

characterization of an Arabidopsis thaliana arogenate dehydrogenase

with two highly similar and active protein domains. Plant Mol. Biol. 48:

361–368.

Rippert, P., Puyaubert, J., Grisollet, D., Derrier, L., and Matringe, M.

(2009). Tyrosine and phenylalanine are synthesized within the plastids

in Arabidopsis. Plant Physiol. 149: 1251–1260.

Roessner, U., Luedemann, A., Brust, D., Fiehn, O., Linke, T.,

Willmitzer, L., and Fernie, A.R. (2001). Metabolic profiling allows

comprehensive phenotyping of genetically or environmentally modi-

fied plant systems. Plant Cell 13: 11–29.

Romero, R.M., Roberts, M.F., and Phillipson, J.D. (1995). Chorismate

mutase in microorganisms and plants. Phytochemistry 40: 1015–1025.

Rubin, J.L., and Jensen, R.A. (1979). Enzymology of L-tyrosine bio-

synthesis in mung bean (Vigna radiata [L.] Wilczek). Plant Physiol. 64:

727–734.

Savage, L.J., and Ohlrogge, J.B. (1999). Phosphorylation of pea

chloroplast acetyl-CoA carboxylase. Plant J. 18: 521–527.

Sawada, H., Shim, I.S., and Usui, K. (2006). Induction of benzoic acid

2-hydroxylase and salicylic acid biosynthesis - Modulation by salt

stress in rice seedlings. Plant Sci. 171: 263–270.

Schmid, J., and Amrhein, N. (1995). Molecular-organization of the

shikimate pathway in higher plants. Phytochemistry 39: 737–749.

Sheen, J. (2002). A transient expression assay using Arabidopsis

mesophyll protoplasts. Available at http://genetics.mgh.harvard.edu/

sheenweb/.

Siehl, D.L. (1999). The biosynthesis of tryptophan, tyrosine, and phe-

nylalanine from chorismate. In Plant Amino Acids: Biochemistry and

Biotechnology, B. Singh, ed (New York: CRC Press), pp. 171–204.

Siehl, D.L., and Conn, E.E. (1988). Kinetic and regulatory properties of

arogenate dehydratase in seedlings of Sorghum bicolor (L.). Arch.

Biochem. Biophys. 260: 822–829.

Siehl, D.L., Singh, B.K., and Conn, E.E. (1986). Tissue distribution and

subcellular localization of prephenate aminotransferase in leaves of

Sorghum bicolor. Plant Physiol. 81: 711–713.

Simmonds, S. (1950). The metabolism of phenylalanine and tyrosine in

mutant strains of Escherichia coli. J. Biol. Chem. 185: 755–762.

Singh, B., and Shaner, D. (1998). Rapid determination of glyphosate

injury to plants and identification of glyphosate resistant plants. Weed

Technol. 12: 527–530.

Suzich, J.A., Dean, J.F.D., and Herrmann, K.M. (1985). 3-Deoxy-

D-arabino-heptulosonate 7-phosphate synthase from carrot root

(Daucus carota) is a hysteretic enzyme. Plant Physiol. 79: 765–770.

Tamura, K., Dudley, J., Nei, M., and Kumar, S. (2007). MEGA4:

Molecular Evolutionary Genetics Analysis (MEGA) software version

4.0. Mol. Biol. Evol. 24: 1596–1599.

Tetlow, I.J., Wait, R., Lu, Z.X., Akkasaeng, R., Bowsher, C.G.,

Esposito, S., Kosar-Hashemi, B., Morell, M.K., and Emes, M.J.

(2004). Protein phosphorylation in amyloplasts regulates starch

branching enzyme activity and protein-protein interactions. Plant

Cell 16: 694–708.

Thomas, S.G., Phillips, A.L., and Hedden, P. (1999). Molecular cloning

and functional expression of gibberellin 2-oxidases, multifunctional

enzymes involved in gibberellin deactivation. Proc. Natl. Acad. Sci.

USA 96: 4698–4703.

Tzin, V., Malitsky, S., Aharoni, A., and Galili, G. (2009). Expression of a

bacterial bi-functional chorismate mutase/prephenate dehydratase

modulates primary and secondary metabolism associated with aro-

matic amino acids in Arabidopsis. Plant J. 60: 156–167.

Uhrig, R.G., She, Y.M., Leach, C.A., and Plaxton, W.C. (2008).

Regulatory monoubiquitination of phosphoenolpyruvate carboxylase

in germinating castor oil seeds. J. Biol. Chem. 283: 29650–29657.

Underwood, B.A., Tieman, D.M., Shibuya, K., Dexter, R.J., Loucas,

H.M., Simkin, A.J., Sims, C.A., Schmelz, E.A., Klee, H.J., and

Clark, D.G. (2005). Ethylene-regulated floral volatile synthesis in

petunia corollas. Plant Physiol. 138: 255–266.

Verdonk, J.C., de Vos, C.H.R., Verhoeven, H.A., Haring, M.A., van

Tunen, A.J., and Schuurink, R.C. (2003). Regulation of floral scent

production in petunia revealed by targeted metabolomics. Phyto-

chemistry 62: 997–1008.

Verdonk, J.C., Haring, M.A., van Tunen, A.J., and Schuurink, R.C.

(2005). ODORANT1 regulates fragrance biosynthesis in petunia flow-

ers. Plant Cell 17: 1612–1624.

Waller, J.C., Akhtar, T.A., Lara-Nunez, A., Gregory, J.F., McQuinn,

R.P., Giovannoni, J.J., and Hanson, A.D. (2010). Developmental and

feedforward control of the expression of folate biosynthesis genes in

tomato fruit. Mol. Plant 3: 66–77.

Wang, Z., and Sachs, M.S. (1997). Ribosome stalling is responsible for

arginine-specific translational attenuation in Neurospora crassa. Mol.

Cell. Biol. 17: 4904–4913.

Warpeha, K.M., Lateef, S.S., Lapik, Y., Anderson, M., Lee, B.S., and

Kaufman, L.S. (2006). G-protein-coupled receptor 1, G-protein G

alpha-subunit 1, and prephenate dehydratase 1 are required for blue

light-induced production of phenylalanine in etiolated Arabidopsis.

Plant Physiol. 140: 844–855.

Wildermuth, M.C., Dewdney, J., Wu, G., and Ausubel, F.M. (2001).

Isochorismate synthase is required to synthesize salicylic acid for

plant defence. Nature 414: 562–565.

Winkel, B.S.J. (2004). Metabolic channeling in plants. Annu. Rev. Plant

Biol. 55: 85–107.

Yamada, T., Matsuda, F., Kasai, K., Fukuoka, S., Kitamura, K.,

Tozawa, Y., Miyagawa, H., and Wakasa, K. (2008). Mutation of a

rice gene encoding a phenylalanine biosynthetic enzyme results

in accumulation of phenylalanine and tryptophan. Plant Cell 20:

1316–1329.

Zamir, L., Tiberio, R., and Jensen, R. (1983). Differential acid-catalyzed

aromatization of prephenate, arogenate, and spiro-arogenate. Tetrahe-

dron Lett. 24: 2815–2818.

Zamir, L.O., Tiberio, R., Fiske, M., Berry, A., and Jensen, R.A. (1985).

Enzymatic and nonenzymatic dehydration reactions of L-arogenate.

Biochemistry 24: 1607–1612.

Zhang, S., Pohnert, G., Kongsaeree, P., Wilson, D.B., Clardy, J., and

Ganem, B. (1998). Chorismate mutase-prephenate dehydratase from

Escherichia coli - Study of catalytic and regulatory domains using

genetically engineered proteins. J. Biol. Chem. 273: 6248–6253.

Plant Phenylalanine Biosynthesis 849

DOI 10.1105/tpc.109.073247; originally published online March 9, 2010; 2010;22;832-849Plant Cell

Rhodes, Eran Pichersky and Natalia DudarevaHiroshi Maeda, Ajit K Shasany, Jennifer Schnepp, Irina Orlova, Goro Taguchi, Bruce R. Cooper, David

Predominantly via the Arogenate Pathway in Petunia Petals Reveals That Phenylalanine Is SynthesizedArogenate Dehydratase1RNAi Suppression of

 This information is current as of May 1, 2019


Supplemental Data /content/suppl/2010/03/09/tpc.109.073247.DC1.html

References /content/22/3/832.full.html#ref-list-1

This article cites 98 articles, 43 of which can be accessed free at:

Permissions https://www.copyright.com/ccc/openurl.do?sid=pd_hw1532298X&issn=1532298X&WT.mc_id=pd_hw1532298X

eTOCs http://www.plantcell.org/cgi/alerts/ctmain

Sign up for eTOCs at:

CiteTrack Alerts http://www.plantcell.org/cgi/alerts/ctmain

Sign up for CiteTrack Alerts at:

Subscription Information http://www.aspb.org/publications/subscriptions.cfm

is available at:Plant Physiology and The Plant CellSubscription Information for

ADVANCING THE SCIENCE OF PLANT BIOLOGY © American Society of Plant Biologists


Recommended