54
Infrastructure bitre RESEARCH REPORT 148 Road Construction Cost and Infrastructure Procurement Benchmarking: 2017 update

Infrastructurebitre
R E S E A R C H R E P O R T 1 4 8
Road Construction Cost and Infrastructure Procurement Benchmarking: 2017 update


Bureau of Infrastructure, Transport and Regional Economics
Road Construction Cost and Infrastructure Procurement Benchmarking: 2017 update
Department of Infrastructure, Regional Development and CitiesCanberra, Australia

© Commonwealth of Australia 2018
ISSN: 1440-9569 ISBN: 978-1-925531-96-1 March 2018/INFRA3454
Cover photograph courtesy of istockphoto.
Ownership of intellectual property rights in this publication
Unless otherwise noted, copyright (and any other intellectual property rights, if any) in this publication is owned by the Commonwealth of Australia (referred to below as the Commonwealth).
Disclaimer
The material contained in this publication is made available on the understanding that the Commonwealth is not providing professional advice, and that users exercise their own skill and care with respect to its use, and seek independent advice if necessary.
The Commonwealth makes no representations or warranties as to the contents or accuracy of the information contained in this publication. To the extent permitted by law, the Commonwealth disclaims liability to any person or organisation in respect of anything done, or omitted to be done, in reliance upon information contained in this publication.
Creative Commons licence
With the exception of (a) the Coat of Arms; and (b) the Department of Infrastructure’s photos and graphics, copyright in this publication is licensed under a Creative Commons Attribution 3.0 Australia Licence.
Creative Commons Attribution 3.0 Australia Licence is a standard form licence agreement that allows you to copy, communicate and adapt this publication provided that you attribute the work to the Commonwealth and abide by the other licence terms. A summary of the licence terms is available from http://creativecommons.org/licenses/by/3.0/au/deed.en. The full licence terms are available from http://creativecommons.org/licenses/by/3.0/au/legalcode.
Use of the Coat of Arms
The Department of the Prime Minister and Cabinet sets the terms under which the Coat of Arms is used. Please refer to the Department’s Commonwealth Coat of Arms and Government branding web page http://www.dpmc.gov.au/guidelines/index.cfm#brand and, in particular, the Guidelines on the use of the Commonwealth Coat of Arms publication.
An appropriate citation for this report is:
Bureau of Infrastructure, Transport and Regional Economics (BITRE), 2018, Road construction cost and infrastructure procurement benchmarking: 2017 update, BITRE, Canberra ACT.
Contact us
This publication is available in PDF format. All other rights are reserved, including in relation to any Departmental logos or trade marks which may exist. For enquiries regarding the licence and any use of this publication, please contact:
Bureau of Infrastructure, Transport and Regional Economics (BITRE) Department of Infrastructure and Regional Development and Citites GPO Box 501, Canberra ACT 2601, Australia
Telephone: (international) +61 2 6274 7210 Fax: (international) +61 2 6274 6855 Email: [email protected] Website: www.bitre.gov.au
• v •
At a glance
• In November 2015, the Transport and Infrastructure Council (TIC) approved publication of the first national pilot study report benchmarking infrastructure procurement processes and construction costs. Council also agreed that follow-up benchmarking be undertaken in 2017 (this report).
• For the 2017 update, seven jurisdictions provided data for 32 road construction projects and 23 procurement processes either completed or in-delivery since mid-2015. The seven jurisdictions that provided project data for the 2017 update were: New South Wales, Victoria, Queensland, South Australia, Western Australia, Northern Territory and the Australian Capital Territory.
• The results that follow are indicative of performance but some caution is needed given the small sample size and large variability of in costs around the averages.
• Key findings of the road project cost benchmarking component: average road project costs were around $5.1 million per lane kilometre in 2017. road class remains the most significant factor explaining average project costs—average costs of urban and rural freeways/highways were around $5.4 million per lane kilometre, while average costs of rural arterials were around $3.8 million per lane kilometre. average project costs also exhibited some variation across jurisdictions—two jurisdictions exhibited above-average costs and two jurisdictions exhibited below-average construction costs across all road classes. most 2017 benchmarks are marginally lower than the 2015 equivalents. However, testing indicates that the 2017 benchmarks are not statistically different to the 2015 benchmarks.
• The small sample size makes benchmarks at the jurisdictional level uncertain. To increase the sample size, BITRE have re-estimated benchmarks using the combined 2017 and 2015 samples and presented the results in an appendix.
• Key findings of the procurement benchmarking component: time taken to complete procurement processes in the 2017 fell marginally relative to 2015—the average total time to complete procurement in the 2017 sample was 89 weeks, which is down on that of the 2015 sample (91 weeks). time taken within each procurement phase was similar across the 2017 and 2015 samples—the median time taken to complete each procurement phase in the 2017 sample projects, was broadly similar that of 2015 sample, with only a few areas of difference. where available, most procurement processes met agency target timeframes—jurisdictions met or bettered planned procurement timelines. However, planned procurement timeframes were provided for only a small number of projects.
• BITRE recommends that the procurement and road construction cost benchmarking be repeated again in 2019. Increasing the detail jurisdictions provide on road construction costs may allow governments to understand better the causes of variability.


• vii •
Contents
At a glance .........................................................................................................................................................................v
Introduction ........................................................................................................................................................................ 1
Part R: Road construction cost benchmarks .......................................................................................3
Road construction project data set ..........................................................................................4
Road construction cost performance ......................................................................................5
Conclusions and recommendations ...................................................................................... 21
Appendix: R.A Austroads’ road classification ..............................................................................................23
R.B Benchmarks for the combined 2015 and 2017 data sets ................................. 25
Part I: Infrastructure procurement performance ............................................................................33
Procurement benchmarks ........................................................................................................... 33
Procurement project data ........................................................................................................... 35
Procurement performance ......................................................................................................... 37
Conclusions and recommendations ...................................................................................... 42
References ......................................................................................................................................................................43

• viii •
Tables
Table R.1 Road construction projects by road class and jurisdiction ........................................... 4
Table R.2 Road construction projects by procurement method .................................................... 4
Table R.3 Statistical summary of road construction projects costs and size ............................ 5
Table R.4 Average per unit project cost by road class ......................................................................... 5
Table R.5 Average construction cost benchmarks, by component and road class .............. 7
Table R.6 Average project costs by jurisdiction and road class ....................................................... 9
Table R.7 Standardised average project costs by jurisdiction and road class .........................10
Table R.8 Construction costs by road class and jurisdiction ...........................................................13
Table R.9 Bridge costs by road class and jurisdiction ...........................................................................14
Table R.10 Pavement costs by road class and jurisdiction ...................................................................15
Table R.11 Bulk earthworks costs by road class and jurisdiction ....................................................15
Table R.12 Average supplementary costs as a share of construction costs by road class and jurisdiction .......................................................................................................16
Table R.13 Average utility costs as a share of construction costs by road class and jurisdiction .......................................................................................................17
Table R.14 Project cost benchmarks, by road class for 2015 and 2017 ......................................18
Table R.15 Construction cost benchmarks, by component and road class for 2015 and 2017 .....................................................................................................................................20
Table R.A1 Austroads’ functional road classification ................................................................................23
Table R.B1 Number of projects in the combined 2017 and 2015 sample, by road class and jurisdiction .......................................................................................................25
Table R.B2 Average per unit project costs, combined 2017 and 2015 sample, by road class and jurisdiction .......................................................................................................26
Table R.B3 Average per unit project costs, combined 2017 and 2015 sample, by road class and jurisdiction .......................................................................................................26

• ix •
Table R.B4 Cost shares for class 1 roads, combined 2017 and 2015 sample, by jurisdiction ......................................................................................................................27
Table R.B5 Cost shares for class 2 roads, combined 2017 and 2015 sample, by jurisdiction ......................................................................................................................27
Table R.B6 Cost shares for class 3 roads, combined 2017 and 2015 sample, by jurisdiction ......................................................................................................................28
Table R.B7 Cost shares for class 6 roads from the combined 2017 and 2015 sample by jurisdiction ................................................................................................28
Table R.B8 Cost shares for Class 7 roads, combined 2017 and 2015 sample, by jurisdiction ......................................................................................................................29
Table R.B9 Average per unit construction costs, combined 2017 and 2015 sample, by road class and jurisdiction ...............................................................29
Table R.B10 Average per unit bridge costs, combined 2017 and 2015 sample, by road class and jurisdiction .....................................................................................30
Table R.B11 Average per unit pavement costs, combined 2017 and 2015 sample, by road class and jurisdiction ........................................................................30
Table R.B12 Average per unit bulk earthworks costs, combined 2017 and 2015 sample, by road class and jurisdiction ...............................................................31
Table I.1 Timeliness benchmarks for procurement processes .....................................................34
Table I.2 Procurement projects by infrastructure class .....................................................................35
Table I.3 Procurement projects by method of procurement ........................................................35
Table I.4 Statistical metrics of procurement benchmarks ...............................................................37
Table I.5 Median procurement performance — 2015 and 2017 ...............................................40
Table I.6 Median procurement performance by jurisdiction .........................................................41
• x •
Figures
Figure R.1 Statistical measures of per lane kilometre project cost by road class .................... 6
Figure R.2 Average cost shares by road class .............................................................................................. 7
Figure R.3 Statistical measures of per lane kilometre construction costs by road class ...... 8
Figure R.4 Average cost shares by jurisdictiona for class 1 projects ..............................................11
Figure R.5 Average cost shares by jurisdictiona for class 2 projects ..............................................11
Figure R.6 Average cost shares by jurisdictiona for class 3 projects ..............................................12
Figure R.7 Average cost shares by jurisdictiona for class 6 projects ..............................................12
Figure R.8 Average cost shares by jurisdictiona for class 7 projects ..............................................13
Figure R.9 Statistical measures of project costs per lane kilometre, 2015 and 2017 ..........19
Figure I.1 Statistical measures for procurement project costs .......................................................36
Figure I.2 Response rate for actual and planned timeliness benchmarks ................................36
Figure I.3 Percentage of procurement projects achieving planned benchmarks .................38
Figure I.4 Procurement timeliness by contract types ..........................................................................38
Figure I.5 Procurement timeliness by infrastructure class .................................................................39

• 1 •
Introduction
In 2015, Australian, state and territory governments cooperated to produce the first national pilot benchmarking of infrastructure procurement processes and road construction costs (Transport and Infrastructure Council 2015). In addition to presenting benchmarks, the pilot study outlined plans for continued and improved future monitoring. This report presents updated benchmark results derived from project cost and procurement performance data for projects completed since January 2015.
The Bureau of Infrastructure, Transport and Regional Economics (BITRE), undertook the analysis under the direction of the Infrastructure Working Group Benchmarking sub-group (IWG sub-group). Jurisdictions provided data related to a selection of their infrastructure procurement and road construction projects. This report also benefits from state and territory agency advice on the specifics of their projects.
Consistent with the Productivity Commission’s recommendation and the 2015 pilot study, the benchmarks are strategic in nature (Productivity Commission 2014). Since the pilot study was completed, BITRE and the IWG subgroup have reviewed the suitability of the cost and procurement benchmarks. That review recommended removal of some superfluous benchmark information and collection of more information regarding the causes of cost differences and procurement delays.
Given the distinct nature of infrastructure procurement and road construction cost benchmarks, this report has two parts. Part R presents the road construction cost benchmark results and Part I presents benchmark measures for infrastructure procurement processes. Each part describes the selected benchmarks, the data provided by jurisdictions and results of the benchmarking process. The 2017 sample benchmarks are compared with the 2015 sample benchmarks and variability between projects is also explained. Part R also includes two appendices that provide more explanatory material. Appendix R.A presents the Austroads’ road class definitions and Appendix R.B presents benchmarks for the combined 2015 and 2017 data sets.


• 3 •• 3 •
PART R
Road construction cost performance
Road construction cost benchmarksThe road construction cost benchmarks presented in this report largely replicate those in the 2015 pilot study (Transport and Infrastructure Council 2015). They also accord with similar UK Government indicators (for example, UK Government 2014).
The whole-of-project benchmark is the cost per lane kilometre by road class. Additionally, the report separately presents costs for project management, design and investigation, property acquisition and construction cost components. Client-supplied design costs were excluded from construction costs. Contractor-supplied design costs were excluded from construction costs and included in design and investigation costs.
Within the sample returns, road construction costs are disaggregated further into the following components:• environmental works• traffic management and temporary works• public utilities adjustments• traffic signage, signals and controls• retaining walls• drainage• tunnels
• client-supplied materials and construction services
• pavements• finishing works• bulk earthworks• supplementary items• bridges
This report benchmarks pavement, bridge and bulk earthworks costs together with public utilities adjustments and supplementary items as a share of construction costs.
Some jurisdictions provided additional information on local climatic conditions and project terrain for some projects as recommended in Transport and Infrastructure Council (2015).
The study sample covers motorways, freeways and ar terial roads. There were no local roads included in the project sample. The relevant Austroads’ roads classes are rural road classes 1 to 3 and urban road classes 6 and 7. Appendix R.A provides Austroads’ definitions of these road classes.

• 4 •
BITRE • Road Construction Cost and Infrastructure Procurement Benchmarking: 2017 update
• 4 •
Road construction project data setFor the 2017 benchmarking update, seven jurisdictions provided data for a combined 32 projects. BITRE omitted two additional projects from the sample because one project return was incomplete and the other project was out of scope for this analysis. The majority of road projects were located in rural areas (classes 1 to 3). Around two-thirds of the projects involved major rural arterial roads (class 1) or urban freeways or motorways (class 6), see Table R.1.
Table R.1 Road construction projects by road class and jurisdiction
Road classb Jurisdictiona
1 2 3 4 5 6 7 Australia
Class 1 2 3 1 4 1 0 0 11
Class 2 0 1 0 1 0 0 3 5
Class 3 0 1 3 0 0 0 0 4
Class 6 1 0 1 4 1 2 1 10
Class 7 0 0 0 0 1 1 0 2
All classes 3 5 5 9 3 3 4 32
a. BITRE has randomly assigned responding jurisdictions a number between 1 and 7.b. Austroads’ road classes (see Appendix A for details).Source: BITRE based on data provided by jurisdictions.
The 2017 project sample featured five different procurement methods. Sixteen project were undertaken using construct-only contracts (see Table R.2), and a fur ther 12 projects were undertaken under design and construct (D&C) contracts. Other procurement methods used across the sample projects included managing contractor contracts (1 project), early contractor involvement (1) and alliances (2). There were no Public–Private Partnership (PPP) projects included in the 2017 cost benchmarking project sample.
Table R.2 Road construction projects by procurement method
Contract type Number of projects
Construct only 16
Design and construct 12
Managing contractor 1
Early contractor involvement 1
Alliance 2
PPP 0
Source: BITRE based on data provided by jurisdictions.
Both project size (in terms of lane kilometres) and total project costs vary significantly across the sample. (See Table R.3 for the average project size and cost together with other statistical measures.) Half of the sample projects cost less than $53m and three-quarters cost less than $142m. A small number of very large projects, including one costing $928m, raise the mean project cost to almost three-times the median. Similarly, for project size, the majority of projects in the sample are relatively short. Three-quarters of projects are less than 47 lane kilometres whereas the largest is 263 lane kilometres.
• 5 •
Part R • Road construction cost performance
• 5 •
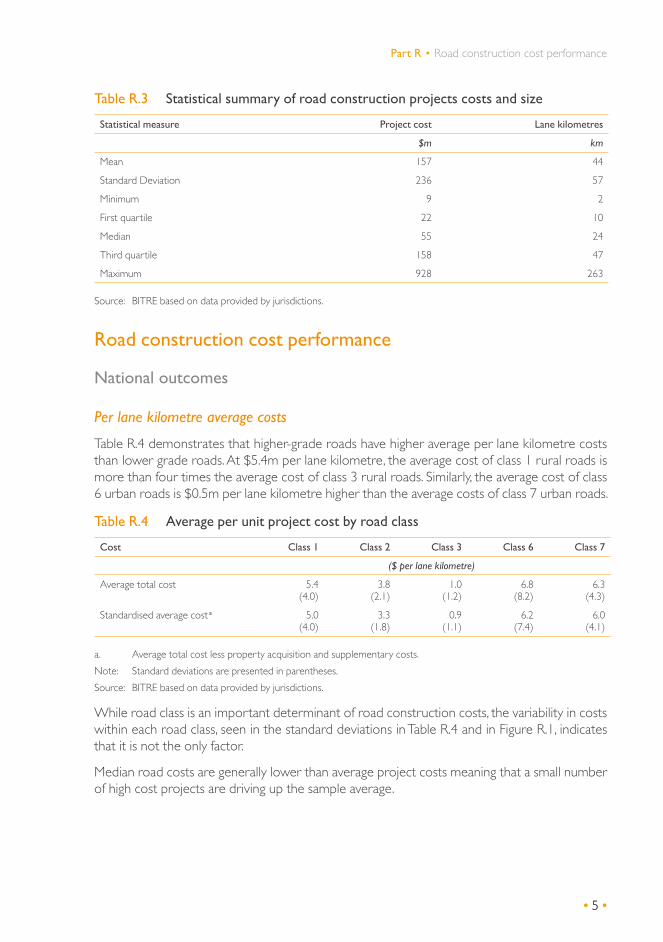
Table R.3 Statistical summary of road construction projects costs and size
Statistical measure Project cost Lane kilometres
$m km
Mean 157 44
Standard Deviation 236 57
Minimum 9 2
First quartile 22 10
Median 55 24
Third quartile 158 47
Maximum 928 263
Source: BITRE based on data provided by jurisdictions.
Road construction cost performance
National outcomes
Per lane kilometre average costs
Table R.4 demonstrates that higher-grade roads have higher average per lane kilometre costs than lower grade roads. At $5.4m per lane kilometre, the average cost of class 1 rural roads is more than four times the average cost of class 3 rural roads. Similarly, the average cost of class 6 urban roads is $0.5m per lane kilometre higher than the average costs of class 7 urban roads.
Table R.4 Average per unit project cost by road class
Cost Class 1 Class 2 Class 3 Class 6 Class 7
($ per lane kilometre)
Average total cost 5.4 (4.0)
3.8 (2.1)
1.0 (1.2)
6.8 (8.2)
6.3 (4.3)
Standardised average cost a 5.0 (4.0)
3.3 (1.8)
0.9 (1.1)
6.2 (7.4)
6.0 (4.1)
a. Average total cost less property acquisition and supplementary costs.Note: Standard deviations are presented in parentheses.Source: BITRE based on data provided by jurisdictions.
While road class is an important determinant of road construction costs, the variability in costs within each road class, seen in the standard deviations in Table R.4 and in Figure R.1, indicates that it is not the only factor.
Median road costs are generally lower than average project costs meaning that a small number of high cost projects are driving up the sample average.
• 6 •
BITRE • Road Construction Cost and Infrastructure Procurement Benchmarking: 2017 update
• 6 •
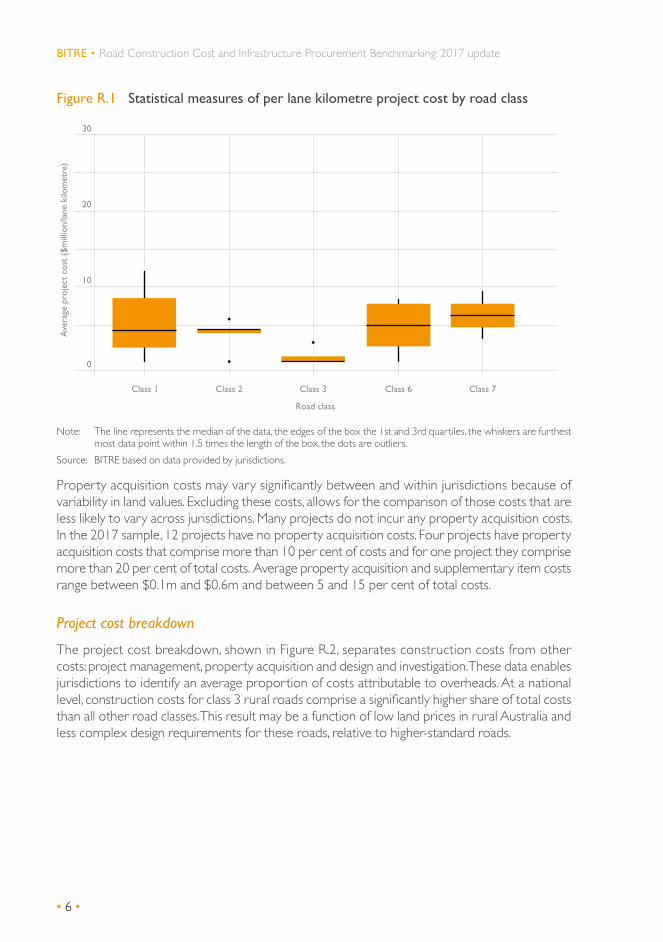
Figure R.1 Statistical measures of per lane kilometre project cost by road class
Ave
rage
pro
ject
cos
t ($
mill
ion/
lane
kilo
met
re)
0
10
Road class
20
30
Class 1 Class 2 Class 3 Class 6 Class 7
Note: The line represents the median of the data, the edges of the box the 1st and 3rd quartiles, the whiskers are furthest most data point within 1.5 times the length of the box, the dots are outliers.
Source: BITRE based on data provided by jurisdictions.
Property acquisition costs may vary significantly between and within jurisdictions because of variability in land values. Excluding these costs, allows for the comparison of those costs that are less likely to vary across jurisdictions. Many projects do not incur any property acquisition costs. In the 2017 sample, 12 projects have no property acquisition costs. Four projects have property acquisition costs that comprise more than 10 per cent of costs and for one project they comprise more than 20 per cent of total costs. Average property acquisition and supplementary item costs range between $0.1m and $0.6m and between 5 and 15 per cent of total costs.
Project cost breakdown
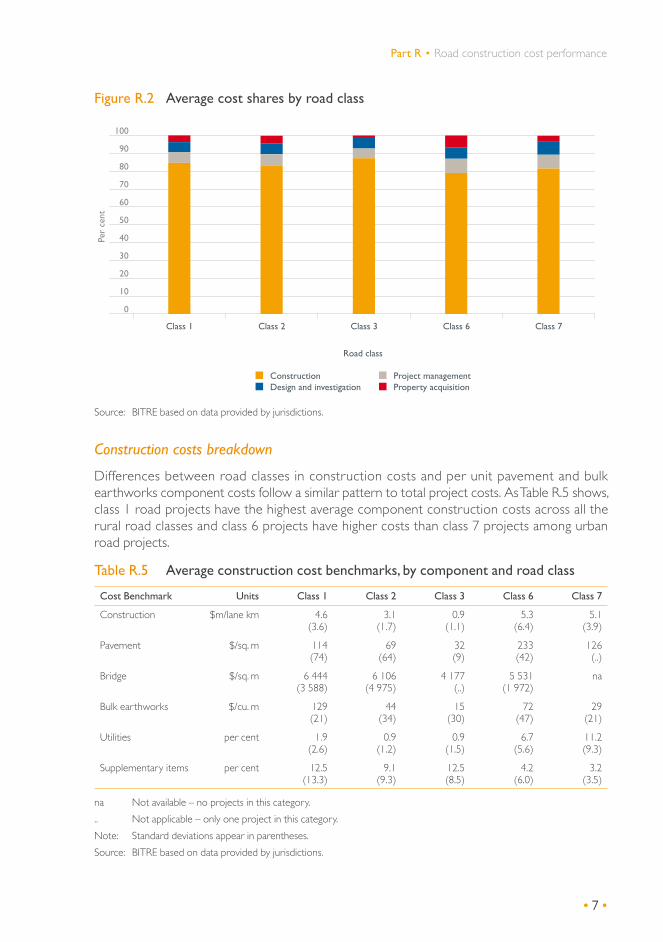
The project cost breakdown, shown in Figure R.2, separates construction costs from other costs: project management, property acquisition and design and investigation. These data enables jurisdictions to identify an average proportion of costs attributable to overheads. At a national level, construction costs for class 3 rural roads comprise a significantly higher share of total costs than all other road classes. This result may be a function of low land prices in rural Australia and less complex design requirements for these roads, relative to higher-standard roads.
• 7 •
Part R • Road construction cost performance
• 7 •
Figure R.2 Average cost shares by road class
0
10
20
30
40
50
60
70
80
90
100
ConstructionDesign and investigation
Project managementProperty acquisition
Class 7Class 6Class 3Class 2Class 1
Per
cent
Road class
Source: BITRE based on data provided by jurisdictions.
Construction costs breakdown
Differences between road classes in construction costs and per unit pavement and bulk earthworks component costs follow a similar pattern to total project costs. As Table R.5 shows, class 1 road projects have the highest average component construction costs across all the rural road classes and class 6 projects have higher costs than class 7 projects among urban road projects.
Table R.5 Average construction cost benchmarks, by component and road class
Cost Benchmark Units Class 1 Class 2 Class 3 Class 6 Class 7
Construction $m/lane km 4.6 (3.6)
3.1 (1.7)
0.9 (1.1)
5.3 (6.4)
5.1 (3.9)
Pavement $/sq. m 114 (74)
69 (64)
32 (9)
233 (42)
126 (..)
Bridge $/sq. m 6 444 (3 588)
6 106 (4 975)
4 177 (..)
5 531 (1 972)
na
Bulk earthworks $/cu. m 129 (21)
44 (34)
15 (30)
72 (47)
29 (21)
Utilities per cent 1.9 (2.6)
0.9 (1.2)
0.9 (1.5)
6.7 (5.6)
11.2 (9.3)
Supplementary items per cent 12.5 (13.3)
9.1 (9.3)
12.5 (8.5)
4.2 (6.0)
3.2 (3.5)
na Not available – no projects in this category... Not applicable – only one project in this category.Note: Standard deviations appear in parentheses. Source: BITRE based on data provided by jurisdictions.

• 8 •
BITRE • Road Construction Cost and Infrastructure Procurement Benchmarking: 2017 update
• 8 •
The cost of bridge construction declines between road classes 1 and 3, potentially reflecting less complex construction. Within road class costs vary substantially. For example, the sample includes only two class 2 projects with bridges: one had unit bridge costs of $9634 per square metre and the other $2588 per square metre.
The average costs of moving utilities differ from other components in that they represent a far higher share of urban road construction than of rural road construction, between 6.7 and 11.2 per cent compared with less than 2 per cent. The result arises from the need for additional services in urban environments.
In contrast to utilities, the average costs of supplementary items comprise a far higher share of construction costs for rural roads than urban roads: between 9 and 12.5 per cent across the three rural road classes and less than 5 per cent for the two urban road classes. No obvious reason exists for this difference and the sample returns do not identify the nature of these supplementary costs.
The variability within each of the components of construction costs is reflected in the variability of per lane kilometre construction costs, see Figure R.3.
Figure R.3 Statistical measures of per lane kilometre construction costs by road class
Ave
rage
pro
ject
cos
t ($
mill
ion/
lane
kilo
met
re)
0
10
Road class
20
25
Class 1 Class 2 Class 3 Class 6 Class 7
15
5
Source: BITRE based on data provided by jurisdictions.

• 9 •
Part R • Road construction cost performance
• 9 •
Benchmarks by jurisdiction
Seven jurisdictions provided data for the 2017 update: New South Wales, Victoria, Queensland, South Australia, Western Australia, Northern Territory and the Australian Capital Territory. Each jurisdiction was allocated a number between 1 and 7 (in no particular order) for reporting results in the remainder of this paper, to maintain confidentiality.
Average per unit costs
Beginning with the total costs shown in Table R.6, the data shows noticeable differences between some jurisdictions. In particular, average project costs in jurisdictions 1 and 4 are below the Australian average across all road classes, whereas, jurisdictions 2 and 7 exhibit project costs above the Australian average across all road classes.
Table R.6 Average project costs by jurisdiction and road class
Road class Jurisdictiona
1 2 3 4 5 6 7 Australia
($m per lane kilometre)
Class 1 2.3 (0.7)
9.8 (2.7)
10.4 (..)
2.3 (1.6)
6.0 (..)
na na 5.4 (4.0)
Class 2 na 4.4 (..)
na 0.3 (..)
na na 4.8 (1.0)
3.8 (2.1)
Class 3 na 2.8 (..)
0.4 (0.1)
na na na na 1.0 (1.2)
Class 6 0.4 (..)
na 1.2 (..)
4.6 (1.9)
2.4 (..)
18.5 (14.5)
8.3 (..)
6.8 (8.2)
Class 7 na na na na 9.3 (..)
3.3 (..)
na 6.3 (4.3)
na Not applicable – no projects in this category... Not available – only one project in this category.a. BITRE has randomly assigned responding jurisdictions a number between 1 and 7.Note: Standard deviations appear in parentneses.Source: BITRE based on data provided by jurisdictions.
Omitting property acquisition costs and supplementary items changes the relative performance of jurisdictions only marginally (see Table R.7). The major exception being the one class 6 road located in jurisdiction 7. Its property acquisition costs are sufficiently high that total costs are well above the Australian average, but after excluding property acquisition costs, its cost are around the Australian average.
Interpreting the results by jurisdiction requires some caution because sample sizes are small. Jurisdictions may benefit from comparing the results presented here with other road construction projects they have recently undertaken.

• 10 •
BITRE • Road Construction Cost and Infrastructure Procurement Benchmarking: 2017 update
• 10 •
Table R.7 Standardised average project costs by jurisdiction and road class
Road class Jurisdictionb
1 2 3 4 5 6 7 Australia
$m per lane kilometre
Class 1 1.8 (0.7)
9.4 (2.7)
9.8 (..)
1.8 (1.1)
6.0 (..)
na na 5.3 (4.0)
Class 2 na 4.3 (..)
na 0.3 (..)
na na 3.9 (0.8)
3.3 (1.0)
Class 3 na 2.6 (..)
0.3 (0.1)
na na na na 0.9 (1.1)
Class 6 0.4 (..)
na 1.0 (..)
4.4 (1.8)
2.4 17.2 (12.6)
6.0 (..)
6.2 (7.4)
Class 7 na na na na 8.9 (..)
3.1 (..)
na 6.0 (4.1)
na Not available - no projects in this category... Not applicable – only one project in this category.a. Average project costs excluding property acquisition and supplementary items.b. BITRE has randomly assigned responding jurisdictions a number between 1 and 7. Note: Standard deviations appear in parentheses.Source: BITRE based on data provided by jurisdictions.
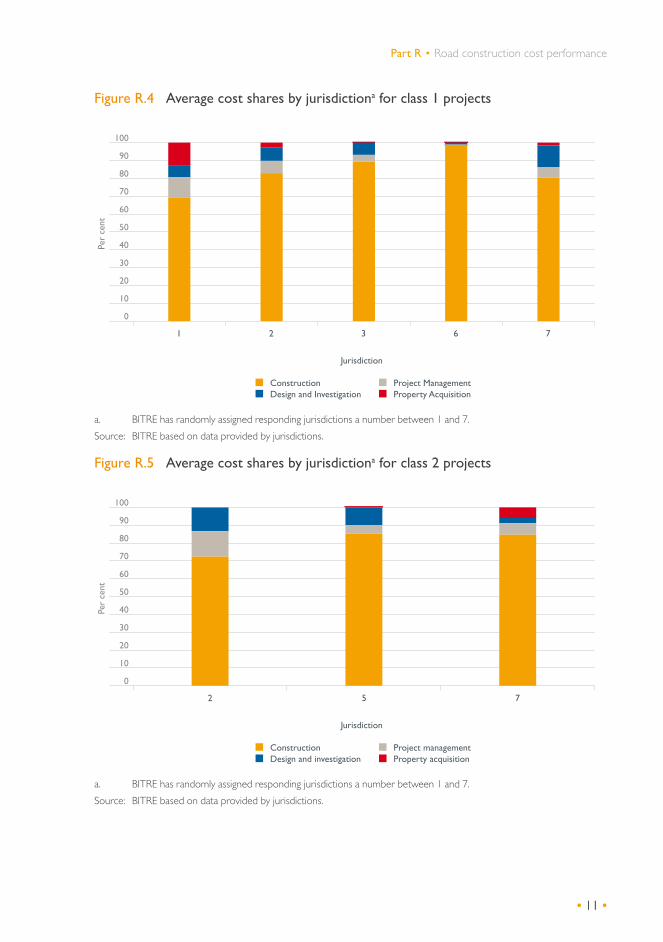
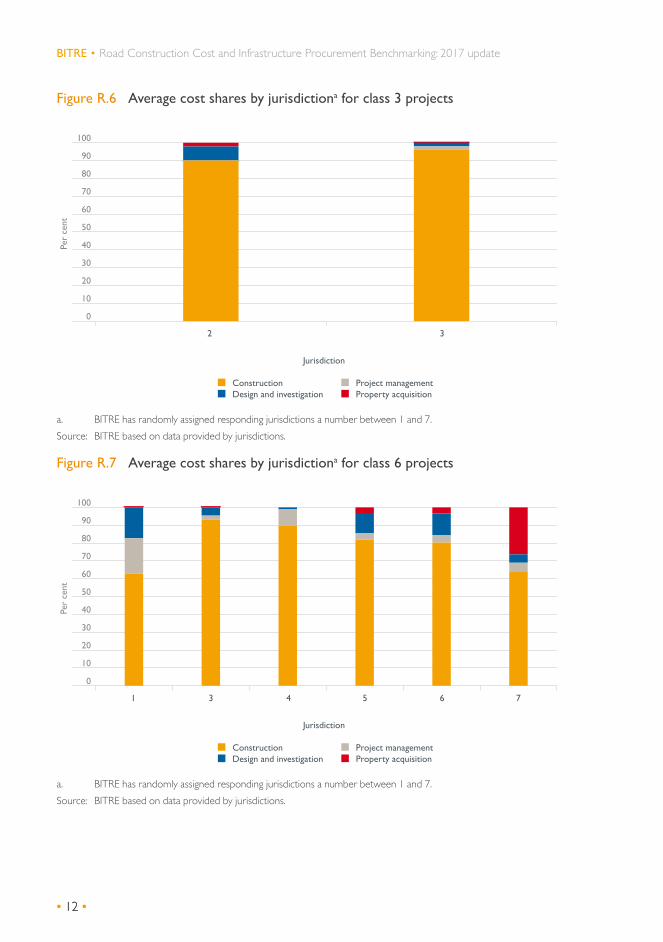
Average cost shares
Figures R.4 to R.8 show average cost shares by jurisdiction for each road class. The variability between jurisdictions within each road class is often far larger than the differences between road classes seen in Figure R.2 above. Property acquisition costs are highly variable between jurisdictions—while this could reflect systemic differences between jurisdictions, the relatively small sample size means they could also simply reflect the mix of projects in the current sample. For example, jurisdiction 5 did not incur property acquisition costs across any of its projects. The combined share of property management and design and investigation vary substantially but not in a consistent way across jurisdictions. For example, these costs comprised 28 per cent of total costs for jurisdiction 2 on its only class 2 project.
• 11 •
Part R • Road construction cost performance
• 11 •
Figure R.4 Average cost shares by jurisdictiona for class 1 projects
ConstructionDesign and Investigation
Project ManagementProperty Acquisition
0
10
20
30
40
50
60
70
80
90
100
76321
Per
cent
Jurisdiction
a. BITRE has randomly assigned responding jurisdictions a number between 1 and 7. Source: BITRE based on data provided by jurisdictions.
Figure R.5 Average cost shares by jurisdictiona for class 2 projects
0
10
20
30
40
50
60
70
80
90
100
Per
cent
Jurisdiction
ConstructionDesign and investigation
Project managementProperty acquisition
752
a. BITRE has randomly assigned responding jurisdictions a number between 1 and 7. Source: BITRE based on data provided by jurisdictions.
• 12 •
BITRE • Road Construction Cost and Infrastructure Procurement Benchmarking: 2017 update
• 12 •
Figure R.6 Average cost shares by jurisdictiona for class 3 projects
0
10
20
30
40
50
60
70
80
90
100
Per
cent
Jurisdiction
ConstructionDesign and investigation
Project managementProperty acquisition
32
a. BITRE has randomly assigned responding jurisdictions a number between 1 and 7.Source: BITRE based on data provided by jurisdictions.
Figure R.7 Average cost shares by jurisdictiona for class 6 projects
0
10
20
30
40
50
60
70
80
90
100
ConstructionDesign and investigation
Project managementProperty acquisition
Per
cent
Jurisdiction
75431 6
a. BITRE has randomly assigned responding jurisdictions a number between 1 and 7.Source: BITRE based on data provided by jurisdictions.

• 13 •
Part R • Road construction cost performance
• 13 •
Figure R.8 Average cost shares by jurisdictiona for class 7 projects
0
10
20
30
40
50
60
70
80
90
100
Per
cent
Jurisdiction
64
ConstructionDesign and investigation
Project managementProperty acquisition
a. BITRE has randomly assigned responding jurisdictions a number between 1 and 7. Source: BITRE based on data provided by jurisdictions.
Jurisdiction-level construction costs
Tables R.8 to R.13, which show average total costs and component construction costs by road class and jurisdiction, demonstrate the costs of construction and its component parts vary substantially between both road classes and jurisdictions. Those jurisdictions that have high per unit costs for one component do not necessarily have high costs for other components. For example, Jurisdiction 5 has among the highest pavement costs but among the lowest bulk earthworks costs.
Table R.8 Construction costs by road class and jurisdiction
Road class Jurisdictiona
1 2 3 4 5 6 7
($million per lane kilometre)
Class 1 1.6 (0.4)
8.4 (2.6)
9.3 (..)
1.9 (1.5)
6.0 (..)
na na
Class 2 na 3.2 (..)
na 0.3 (..)
na na 4.0 (0.6)
Class 3 na 2.5 (..)
0.4 (0.6)
na na na na
Class 6 0.3 na 1.1 (..)
4.1 (1.5)
2.2 (..)
16.3 (11.1)
5.3 (..)
Class 7 na na na na 7.9 (..)
2.5 (..)
na
na Not available – no projects in this category... Not applicable – only one project in this category.a. BITRE has randomly assigned responding jurisdictions a number between 1 and 7. Note: Standard deviations are shown in parentheses.Source: BITRE based on data provided by jurisdictions.

• 14 •
BITRE • Road Construction Cost and Infrastructure Procurement Benchmarking: 2017 update
• 14 •
Table R.9 shows average bridge construction costs per square metre by jurisdiction. There are insufficient projects with bridge construction to draw any reliable conclusions regarding differences in costs between jurisdictions. Only four of the seven reporting jurisdictions recorded bridge costs and those projects are spread over the five road classes.
Table R.9 Bridge costs by road class and jurisdiction
Road class Jurisdictiona
1 2 3 4 5 6 7
($ per square metre)
Class 1 na 3 686 (1 640)
12 176 (..)
7 715 (224)
na na na
Class 2 na 2 588 (..)
na 9 624 (..)
na na na
Class 3 na 4 177 (..)
na na na na na
Class 6 na na na 5 666 (2 390)
na na na
Class 7 na na na na na 5 260 (1 574)
na
na Not available – no projects in this category... Not applicable – only one project in this category.a. BITRE has randomly assigned responding jurisdictions a number between 1 and 7. Note: Standard deviations are shown in parentheses.Source: BITRE based on data provided by jurisdictions.
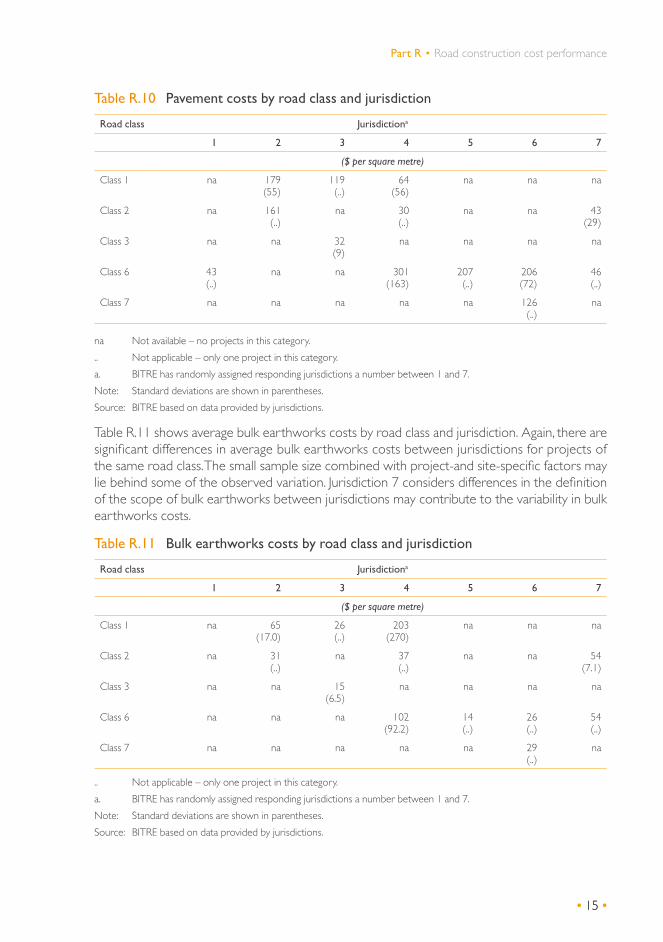
Table R.10 shows average pavement costs vary significantly by road class and jurisdiction. In particular, jurisdictions 1 and 7 exhibit significantly lower average pavement costs for class 6 projects than other jurisdictions. Similarly, class 2 pavement costs for jurisdictions 4 and 7 are far less than those of jurisdiction 2. Jurisdiction 7 considers its very low pavement costs result from projects that are a combination of construction and maintenance activities—that is, lanes adjacent to the new construction are simultaneously receiving minor treatments, thus lowering the overall average cost. Unfortunately, the sample data (and data collection template) does not distinguish type of pavement treatment nor provide for multiple treatment types in a single project.
• 15 •
Part R • Road construction cost performance
• 15 •
Table R.10 Pavement costs by road class and jurisdiction
Road class Jurisdictiona
1 2 3 4 5 6 7
($ per square metre)
Class 1 na 179 (55)
119 (..)
64 (56)
na na na
Class 2 na 161 (..)
na 30 (..)
na na 43 (29)
Class 3 na na 32 (9)
na na na na
Class 6 43 (..)
na na 301 (163)
207 (..)
206 (72)
46 (..)
Class 7 na na na na na 126 (..)
na
na Not available – no projects in this category... Not applicable – only one project in this category.a. BITRE has randomly assigned responding jurisdictions a number between 1 and 7. Note: Standard deviations are shown in parentheses. Source: BITRE based on data provided by jurisdictions.
Table R.11 shows average bulk earthworks costs by road class and jurisdiction. Again, there are significant differences in average bulk earthworks costs between jurisdictions for projects of the same road class. The small sample size combined with project-and site-specific factors may lie behind some of the observed variation. Jurisdiction 7 considers differences in the definition of the scope of bulk earthworks between jurisdictions may contribute to the variability in bulk earthworks costs.
Table R.11 Bulk earthworks costs by road class and jurisdiction
Road class Jurisdictiona
1 2 3 4 5 6 7
($ per square metre)
Class 1 na 65 (17.0)
26 (..)
203 (270)
na na na
Class 2 na 31 (..)
na 37 (..)
na na 54 (7.1)
Class 3 na na 15 (6.5)
na na na na
Class 6 na na na 102 (92.2)
14 (..)
26 (..)
54 (..)
Class 7 na na na na na 29 (..)
na
.. Not applicable – only one project in this category.a. BITRE has randomly assigned responding jurisdictions a number between 1 and 7. Note: Standard deviations are shown in parentheses.Source: BITRE based on data provided by jurisdictions.

• 16 •
BITRE • Road Construction Cost and Infrastructure Procurement Benchmarking: 2017 update
• 16 •
As Table R.12 shows, supplementary costs comprise a small proportion of construction costs in most jurisdiction road class categories. However, four of the reporting jurisdictions have road classes in which supplementary costs exceed 10 per cent of construction costs. These results may reflect placement of cost elements in the supplementary costs category that in other jurisdictions are allocated to a specific item. For future cost benchmarking, it is recommended jurisdictions categorise road construction costs as completely as possible, to minimise supplementary costs. It is also recommended that jurisdictions identify individual supplementary cost elements.
Table R.12 Average supplementary costs as a share of construction costs by road class and jurisdiction
Road class Jurisdictiona
1 2 3 4 5 6 7
($ per square metre)
Class 1 18.9 (11.4)
2.7 (1.9)
6.1 (..)
0.4 (..)
21.2 (..)
na na
Class 2 na 4.8 (..)
na na 0.0 na 13.5 (9.6)
Class 3 na 7.5 (..)
14.2 (9.6)
na na na na
Class 6 16.3 (..)
na 13.8 (..)
0.9 (2.3)
1.2 (..)
1.8 (2.6)
3.2 (..)
Class 7 na na na 5.6 (..)
na 0.7 (..)
na
na Not available – no projects in this category... Not applicable – only one project in this category.a. BITRE has randomly assigned responding jurisdictions a number between 1 and 7.Note: Standard deviations are shown in parentheses.Source: BITRE based on data provided by jurisdictions.
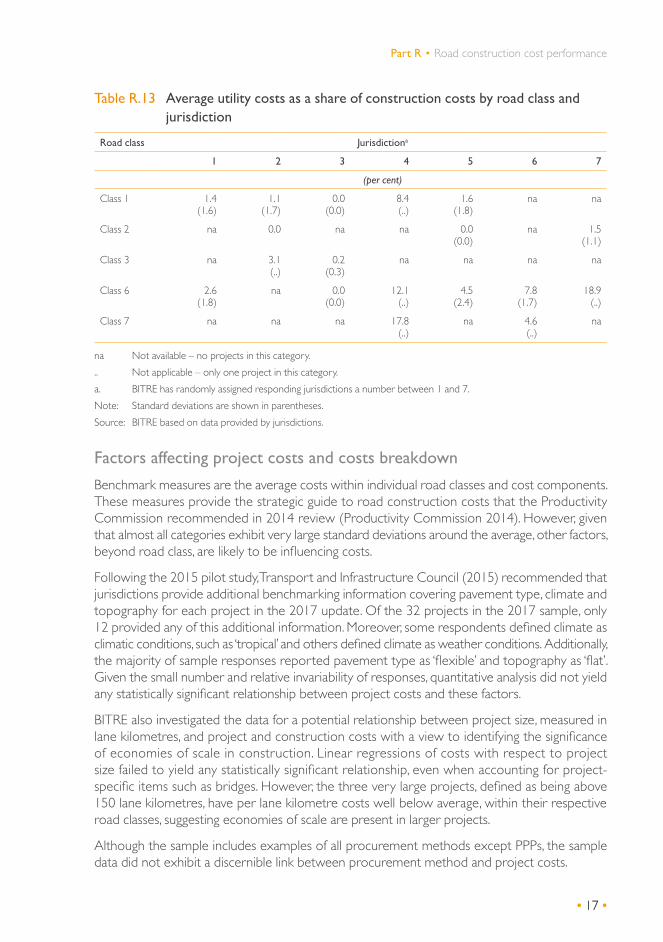
Table R.13 provides the costs of moving utilities as a share of total construction costs, by road class and jurisdiction. It shows significant variation between urban and rural road classes and between jurisdictions. Again, the small sample size combined with project-and site-specific factors may contribute to the observed variation across jurisdictions and road classes. 1
1 For example, the construction of a major road project may provide an opportunity to upgrade and expand nearby utility infrastructure, activity that might not otherwise be undertaken but for the road project.
• 17 •
Part R • Road construction cost performance
• 17 •
Table R.13 Average utility costs as a share of construction costs by road class and jurisdiction
Road class Jurisdictiona
1 2 3 4 5 6 7
(per cent)
Class 1 1.4 (1.6)
1.1 (1.7)
0.0 (0.0)
8.4 (..)
1.6 (1.8)
na na
Class 2 na 0.0 na na 0.0 (0.0)
na 1.5 (1.1)
Class 3 na 3.1 (..)
0.2 (0.3)
na na na na
Class 6 2.6 (1.8)
na 0.0 (0.0)
12.1 (..)
4.5 (2.4)
7.8 (1.7)
18.9 (..)
Class 7 na na na 17.8 (..)
na 4.6 (..)
na
na Not available – no projects in this category... Not applicable – only one project in this category.a. BITRE has randomly assigned responding jurisdictions a number between 1 and 7.Note: Standard deviations are shown in parentheses.Source: BITRE based on data provided by jurisdictions.
Factors affecting project costs and costs breakdown
Benchmark measures are the average costs within individual road classes and cost components. These measures provide the strategic guide to road construction costs that the Productivity Commission recommended in 2014 review (Productivity Commission 2014). However, given that almost all categories exhibit very large standard deviations around the average, other factors, beyond road class, are likely to be influencing costs.
Following the 2015 pilot study, Transport and Infrastructure Council (2015) recommended that jurisdictions provide additional benchmarking information covering pavement type, climate and topography for each project in the 2017 update. Of the 32 projects in the 2017 sample, only 12 provided any of this additional information. Moreover, some respondents defined climate as climatic conditions, such as ‘tropical’ and others defined climate as weather conditions. Additionally, the majority of sample responses reported pavement type as ‘flexible’ and topography as ‘flat’. Given the small number and relative invariability of responses, quantitative analysis did not yield any statistically significant relationship between project costs and these factors.
BITRE also investigated the data for a potential relationship between project size, measured in lane kilometres, and project and construction costs with a view to identifying the significance of economies of scale in construction. Linear regressions of costs with respect to project size failed to yield any statistically significant relationship, even when accounting for project-specific items such as bridges. However, the three very large projects, defined as being above 150 lane kilometres, have per lane kilometre costs well below average, within their respective road classes, suggesting economies of scale are present in larger projects.
Although the sample includes examples of all procurement methods except PPPs, the sample data did not exhibit a discernible link between procurement method and project costs.

• 18 •
BITRE • Road Construction Cost and Infrastructure Procurement Benchmarking: 2017 update
• 18 •
Given the 2017 sample failed to provide insights into the causes of the large variations in costs between projects, BITRE calculated the benchmarks using the combined 2017 and 2015 samples. Appendix R.B shows the full set of benchmarks. The general conclusion from the broader analysis is that benchmark costs are marginally higher for the combined data set and the variability in costs between projects is not significantly smaller. Linear regressions of per unit costs with project size in lane kilometres does not explain differences in costs within road classes.
Comparison with the 2015 pilot study
One aim of repeating the benchmarking exercise is to provide jurisdictions with an indication of changing costs across time. BITRE undertook statistical testing of differences in the 2017 and 2015 average project costs for class 1 and class 6 roads. Class 1 and class 6 roads were chosen because they have the largest sample size making the test results more robust. The results of the tests show no statistical differences between the means.
Despite the absence of statistical differences, comparing 2017 and 2015 results provides useful context. Average project costs, both including and excluding property acquisition and supplementary item costs, for the three rural road class are lower in the 2017 project sample than estimated in the 2015 pilot study (see Table R.14). The story for urban road classes is more complex. While the average total project costs in the 2017 sample are lower than those estimated in the 2015 pilot study, the 2017 estimates are higher when property acquisition and supplementary costs are excluded.
Table R.14 Project cost benchmarks, by road class for 2015 and 2017
Road class 2017 2015
Average project cost ($m/lane km)
Class 1 5.4 6.5
Class 2 3.8 4.1
Class 3 1.0 2.9
Class 6 6.8 7.8
Class 7 6.3 6.4
Standardised average costa ($m/lane km)
Class 1 5.0 6.1
Class 2 3.3 3.7
Class 3 0.9 2.7
Class 6 6.2 5.9
Class 7 6.0 4.1
a. Average total cost less property acquisition and supplementary costs.Source: BITRE based on data provided by jurisdictions.
• 19 •
Part R • Road construction cost performance
• 19 •
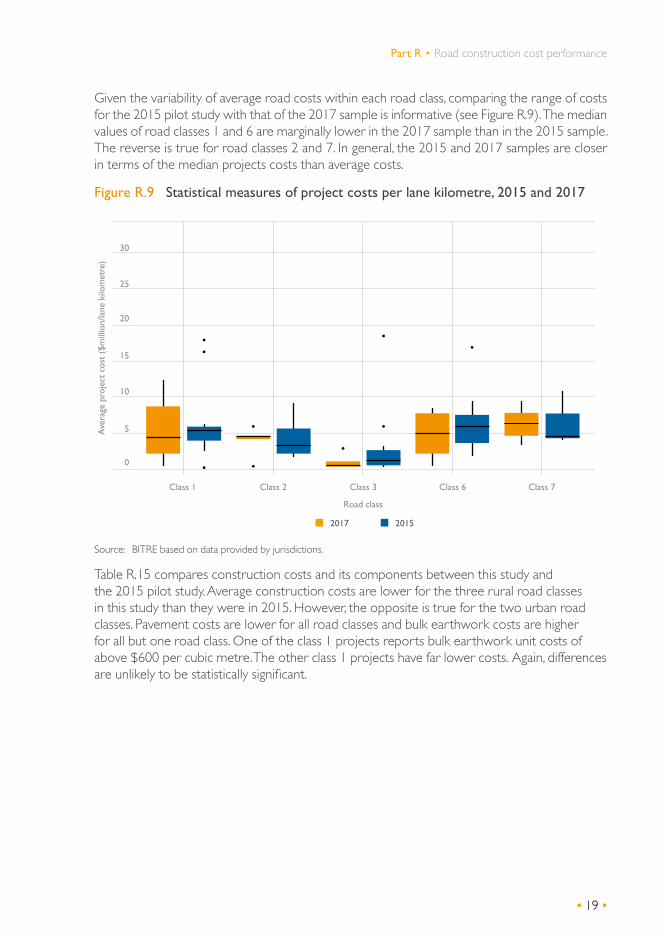
Given the variability of average road costs within each road class, comparing the range of costs for the 2015 pilot study with that of the 2017 sample is informative (see Figure R.9). The median values of road classes 1 and 6 are marginally lower in the 2017 sample than in the 2015 sample. The reverse is true for road classes 2 and 7. In general, the 2015 and 2017 samples are closer in terms of the median projects costs than average costs.
Figure R.9 Statistical measures of project costs per lane kilometre, 2015 and 2017
Ave
rage
pro
ject
cos
t ($
mill
ion/
lane
kilo
met
re)
0
10
Road class
20
25
Class 1 Class 2 Class 3 Class 6 Class 7
15
5
30
2017 2015
Source: BITRE based on data provided by jurisdictions.
Table R.15 compares construction costs and its components between this study and the 2015 pilot study. Average construction costs are lower for the three rural road classes in this study than they were in 2015. However, the opposite is true for the two urban road classes. Pavement costs are lower for all road classes and bulk earthwork costs are higher for all but one road class. One of the class 1 projects reports bulk earthwork unit costs of above $600 per cubic metre. The other class 1 projects have far lower costs. Again, differences are unlikely to be statistically significant.

• 20 •
BITRE • Road Construction Cost and Infrastructure Procurement Benchmarking: 2017 update
Table R.15 Construction cost benchmarks, by component and road class for 2015 and 2017
Road class 2017 2015
Average project cost ($m/lane km)
Class 1 4.7 5.5
Class 2 3.1 3.4
Class 3 0.9 2.5
Class 6 5.8 5.1
Class 7 5.2 5.1
Standardised average costa ($m/lane km)
Class 1 862 903
Class 2 707 982
Class 3 144 230
Class 6 955
Class 7 815 891
Average bridge costs ($/sq.m)
Class 1 6 444 5 090
Class 2 6 106 4 150
Class 3 4 177 3 880
Class 6 4 793 3 610
Class 7 - 3 650
Average bulk earthworks costs ($/cu.m)
Class 1 129 35
Class 2 44 48
Class 3 15 49
Class 6 72 76
Class 7 29 55
Source: BITRE based on data provided by jurisdictions.

• 21 •
Part R • Road construction cost performance
• 21 •
Conclusions and recommendationsAvailable data suggests that per lane kilometre costs for road construction projects are marginally lower in the 2017 sample than they were in the 2015 pilot study across all road classes. If property acquisition and supplementary item costs are excluded, per lane kilometre costs are lower in 2017 for the rural road classes but higher for the urban road classes. Similarly, per lane kilometre construction costs are lower for rural road classes and marginally higher for urban road classes.
The data provides some evidence that very large projects, that is, those greater than 150 lane kilometres, are able to achieve lower per lane kilometre costs than smaller projects.
The variability of costs within road classes is also quite large. While BITRE attempted to explain that variability, the small sample size and qualitative nature of same information made robust assessment impossible.
Collecting a wider range of information on projects may increase our understanding of the factors affecting costs. Deciding what information to collect will require some investigation. The following are a few potential examples.
The International Construction Measurement Standard (ICMS) recently released new standards for reporting the costs of infrastructure investments (International Construction Measurement Standards Coalition 2017). The road construction standard includes all of the elements in the sample returns (including topography, climate and pavement type) and additional information including footpaths, curves, at-grade and grade-separated intersections, design speed and design life. Many details of procurement process are described including the year and currency of expenditure.
Jurisdictions also provided comments on factors affecting the costs they face. These factors include the effects of:• high demand for construction services on road construction costs. Jurisdictions have recently
seen a reduction in the number and quality of responses to tender• utility relocation costs on overall costs (which should be monitored).
Jurisdictions also expressed an interest in monitoring the costs of pavement maintenance and rehabilitation works. Maintenance comprises a large and growing component of state and territory agency costs. Developing maintenance benchmarks would entail consistently defining maintenance activities across Australia.
BITRE recommend updating the road construction cost benchmarks again in 2019. Further, the IWG benchmarking subgroup may wish to consider expanding or refining the data collection template to collect additional cost and explanatory information. The feasibility and cost of collection should be balanced against the benefits of the additional information.


• 23 •
APPENDIX
R.A Austroads’ road classification
Table R.A1 Austroads’ functional road classification
Class Road type Definition
Rural roads
Class 1 Arterial Those roads, which form the principal avenues for communications between major regions, including direct connections between capital cities. (Most of the highways and freeways that comprise the inter-urban National Land Transport Network are class 1 (Rural) roads.)
Class 2 Arterial Those roads, not being class 1, whose main function is to form the principal avenue of communication for movements between:
• a capital city and adjoining states and their capital cities; or• a capital city and key towns; or• key towns.
Class 3 Arterial Those roads, not being class 1 or 2, whose main function is to form an avenue of communication for movements:
• between important centres and the class 1 and class 2 roads and/or key towns; or
• between important centres; or• of an arterial nature within a town in a rural area.
Class 4 Local Those roads, not being class 1, 2 or 3, whose main function is to provide access to abutting property (including property within a town in a rural area).
Class 5 Local Those roads, which provide almost exclusively for one activity or function, which cannot be assigned to classes 1 to 4.
Urban roads
Class 6 Controlled access highways (motorways or freeways)
Motorways and freeways have an exclusive function to carry traffic within cities and to ensure the continuity of the national or regional primary road system. As they are designed to accommodate through traffic, they do not offer pedestrian or frontage access.
Class 7 Urban arterial roads Urban arterial roads have a predominant function to carry traffic but also serve other functions. They form the primary road network and link main districts of the urban area. Arterial roads that perform a secondary function are sometimes referred to as sub-arterial roads
Class 8 Urban collector / distributor roads
These are local streets that have a greater role than others in connecting contained urban areas (e.g. residential areas, activity areas) to the arterial road system. Generally, consideration of environment and local life predominate and improved amenity is encouraged over the use of vehicles on these roads.
Class 9 Urban local roads These are roads intended exclusively for access with no through traffic function.
Source: Austroads (2006)


• 25 •
APPENDIX
R.B Benchmarks for the combined 2015 and 2017 data sets
The 2017 sample contains only 32 projects. Hence, when disaggregated by jurisdiction and road class, there are generally few projects (and in many cases no projects) in each category. Analysis presented in Part R shows a high degree of variability in costs across many of the projects. In order to provide more robust and statistically reliable results, and as a means of validating the 2017 results, BITRE also generated benchmark measures using a combined set of the 2015 pilot study and 2017 sample data.
The combined dataset contains 77 projects spread across eight jurisdictions and five road classes. (Table R.B1 provides a breakdown of the number of projects by jurisdiction.) The 77 projects comprise the 32 projects in the 2017 and 45, of the original 53, from the 2015 sample. Jurisdictions provided updated data in 2017 for the remaining eight projects.
Table R.B1 Number of projects in the combined 2017 and 2015 sample by road class and jurisdiction
Road class Jurisdictiona
1 2 3 4 5 6 7 Australiab
Class 1 2 5 1 5 1 1 6 21
Class 2 2 4 0 1 0 0 5 12
Class 3 0 9 3 0 0 0 0 16
Class 6 3 8 3 4 1 2 3 24
Class 7 0 0 0 0 1 1 2 4
All classes 7 26 7 10 3 4 16 77
a. BITRE has randomly assigned responding jurisdictions a number between 1 and 7.b. The Australian total includes Tasmanian projects. Tasmania provided data in 2015 but did not provide data in 2017.Source: BITRE estimates based on jurisdictional data.
The following tables show the cost benchmarks for the combined 2017 and 2015 data set. All dollars are in nominal terms. Not converting costs into real terms is likely to cause only minor errors because of the low inflation rate in recent years.
Benchmarks in this appendix provides jurisdictions with a larger sample from which to draw conclusions regarding their performance relative to other jurisdictions. Standard deviations remain large with this larger sample suggesting that there are large causes of variability not captured by road class and jurisdictional categorisation.

• 26 •
BITRE • Road Construction Cost and Infrastructure Procurement Benchmarking: 2017 update
Table R.B2 Average per unit project costs, combined 2017 and 2015 sample, by road class and jurisdiction
Road class Jurisdictiona
1 2 3 4 5 6 7 Australiab
($ million per lane kilometre)
Class 1 2.3 (0.7)
10.4 (5.1)
10.4 (..)
5.1 (6.4)
6.0 (..)
0.2 (..)
4.9 (1.0)
6.1 (4.8)
Class 2 1.8 (0.1)
4.9 (1.7)
na 0.3 (..)
na na 5.1 (2.6)
4.1 (2.5)
Class 3 na 3.8 (3.8)
0.4 (0.1)
na na na na 2.5 (4.5)
Class 6 3.8 (3.7)
10.8 (9.5)
4.2 (3.0)
4.6 (1.9)
2.4 (..)
18.5 (14.5)
4.8 (3.1)
7.6 (7.9)
Class 7 na na na na 9.3 (..)
3.3 (..)
7.6 (..)
6.4 (3.4)
na Not available – no projects in this category... Not applicable – only one project in this category.a. BITRE has randomly assigned responding jurisdictions a number between 1 and 7.b. The Australian total includes Tasmanian projects. Tasmania provided data in 2015 but did not provide data in 2017. Source: BITRE based on data provided by jurisdictions.
Table R.B3 Average per unit standardiseda project costs, combined 2017 and 2015 sample, by road class and jurisdiction
Road class Jurisdictionb
1 2 3 4 5 6 7 Australiac
Class 1 1.8 (0.7)
9.9 (5.3)
9.8 (..)
4.7 (6.6)
6.0 (..)
0.1 (..)
4.4 (1.0)
5.7 (4.9)
Class 2 1.4 (0.3)
4.6 (1.5)
na 0.3 (..)
na na 4.3 (2.2)
3.6 (2.2)
Class 3 na 3.6 (5.8)
0.3 (0.1)
na na na na 2.3 (4.5)
Class 6 3.0 (3.0)
7.5 (6.9)
4.1 (3.1)
4.4 (1.8)
2.4 (..)
17.2 (12.6)
3.8 (1.9)
6.1 (6.2)
Class 7 na na na na 8.9 (..)
3.1 (..)
6.8 (..)
6.4 (3.3)
na Not available – no projects in this category... Not applicable – only one project in this category.a. Average total cost less property acquisition and supplementary costs.b. BITRE has randomly assigned responding jurisdictions a number between 1 and 7.c. The Australian total includes Tasmanian projects. Tasmania provided data in 2015 but did not provide data in 2017.Source: BITRE based on data provided by jurisdictions.

• 27 •
Appendix R.B • Benchmarks for the combined 2015 and 2017 data sets
Table R.B4 Cost shares for class 1 roads, combined 2017 and 2015 sample, by jurisdiction
Road class Jurisdictiona
1 2 3 4 5 6 7 Australiab
(per cent)
Construction 69.3 (4.5)
82.8 (5.4)
89.5 (..)
81.8 (10.4)
98.6 (..)
90.3 (..)
81.2 (7.9)
82.2 (9.0)
Project management
11.2 (8.7)
6.1 (1.2)
3.7 (..)
6.3 (4.7)
0.0 (..)
4.1 (..)
6.4 (1.2)
6.2 (3.7)
Design and investigation
6.8 (3.9)
7.0 (2.3)
6.8 (..)
10.7 (10.7)
1.4 (..)
5.6 (..)
7.7 (4.0)
7.7 (5.8)
Property acquisition
12.6 (1.2)
4.1 (5.6)
0.0 (..)
1.2 (0.1)
0.1 (..)
0.1 (..)
4.8 (8.7)
3.8 (1.8)
na Not available – no projects in this category... Not applicable – only one project in this category.a. BITRE has randomly assigned responding jurisdictions a number between 1 and 7.b. The Australian total includes Tasmanian projects. Tasmania provided data in 2015 but did not provide data in 2017.Source: BITRE based on data provided by jurisdictions.
Table R.B5 Cost shares for class 2 roads, combined 2017 and 2015 sample, by jurisdiction
Road class Jurisdictiona
1 2 3 4 5 6 7 Australiab
(per cent)
Construction 79.6 (3.7)
80.4 (8.6)
na 85.3 (..)
na na 82.7 (4.9)
81.7 (5.8)
Project management
5.2 (0.1)
7.1 (4.9)
na 4.8 (..)
na na 7.1 (1.1)
6.6 (4.9)
Design and investigation
4.5 (2.8)
9.5 (5.1)
na 9.9 (..)
na na 5.9 (4.7)
7.2 (4.6)
Property acquisition
10.6 (6.6)
3.0 (4.0)
na 0.0 (..)
na na 4.3 (5.7)
4.6 (13.8)
na Not available – no projects in this category... Not applicable – only one project in this category.a. BITRE has randomly assigned responding jurisdictions a number between 1 and 7.b. The Australian total includes Tasmanian projects. Tasmania provided data in 2015 but did not provide data in 2017. Source: BITRE based on data provided by jurisdictions.

• 28 •
BITRE • Road Construction Cost and Infrastructure Procurement Benchmarking: 2017 update
Table R.B6 Cost shares for class 3 roads, combined 2017 and 2015 sample, by jurisdiction
Road class Jurisdictiona
1 2 3 4 5 6 7 Australiab
(per cent)
Construction na 86.2 (7.9)
96.0 (3.1)
na na na na 86.6 (8.0)
Project management
na 6.3 (4.2)
2.1 (2.3)
na na na na 5.2 (3.7)
Design and investigation
na 6.4 (2.3)
2.1 (1.7)
na na na na 7.4 (5.8)
Property acquisition
na 1.1 (2.3)
0 (0)
na na na na 0.8 (6.2)
na Not available – no projects in this category... Not applicable – only one project in this category.a. BITRE has randomly assigned responding jurisdictions a number between 1 and 7.b. The Australian total includes Tasmanian projects. Tasmania provided data in 2015 but did not provide data
in 2017. Source: BITRE based on data provided by jurisdictions.
Table R.B7 Cost shares for class 6 roads from the combined 2017 and 2015 sample by jurisdiction
Road class Jurisdictiona
1 2 3 4 5 6 7 Australiab
(per cent)
Construction 72.6 (8.6)
62.8 (20.7)
89.8 (3.4)
81.9 (4.7)
89.6 (..)
80.2 (2.7)
79.5 (13.9)
75.3 (16.2)
Project management
14.4 (4.8)
10.0 (3.7)
3.8 (3.4)
3.7 (3.3)
9.2 (..)
4.3 (0.4)
8.4 (5.5)
8.0 (2.8)
Design and investigation
12.9 (4.1)
12.5 (5.5)
6.4 (2.5)
11.2 (3.4)
1.2 (..)
12.0 (1.6)
3.1 (1.7)
9.9 (5.4)
Property acquisition
0.2 (0.2)
14.7 (20.6)
0.0 (0.0)
3.2 (2.3)
0.0 (..)
3.5 (4.7)
8.9 (15.1)
6.9 (5.4)
na Not available – no projects in this category... Not applicable – only one project in this category.a. BITRE has randomly assigned responding jurisdictions a number between 1 and 7.b. The Australian total includes Tasmanian projects. Tasmania provided data in 2015 but did not provide data in 2017. Source: BITRE based on data provided by jurisdictions.

• 29 •
Appendix R.B • Benchmarks for the combined 2015 and 2017 data sets
Table R.B8 Cost shares for class 7 roads, combined 2017 and 2015 sample, by jurisdiction
Road class Jurisdictiona
1 2 3 4 5 6 7 Australiab
(per cent)
Construction na na na na 84.3 (..)
73.4 (..)
79.7 (4.0)
79.3 (5.0)
Project management
na na na na 5.5 (..)
10.7 (..)
7.1 (1.1)
7.6 (2.3)
Design and investigation
na na na na 10.2 (..)
11.1 (..)
10.3 (1.8)
10.4 (1.1)
Property acquisition
na na na na 0.0 (..)
4.9 (..)
2.9 (3.3)
2.7 (2.8)
na Not available – no projects in this category... Not applicable – only one project in this category.a. BITRE has randomly assigned responding jurisdictions a number between 1 and 7.b. The Australian total includes Tasmanian projects. Tasmania provided data in 2015 but did not provide data in 2017. Source: BITRE based on data provided by jurisdictions.
Table R.B9 Average per unit construction costs, combined 2017 and 2015 sample, by road class and jurisdiction
Road class Jurisdictiona
1 2 3 4 5 6 7 Australiab
($ million per lane kilometre)
Class 1 1.6 (0.3)
8.8 (4.7)
9.3 (..)
4.3 (5.7)
5.9 (..)
0.1 (..)
4.0 (0.8)
5.1 (4.3)
Class 2 1.4 (0.0)
4.0 (1.6)
na 0.2 (..)
na na 4.2 (2.0)
3.3 (2.1)
Class 3 na 3.4 (5.3)
0.4 (0.1)
na na na na 2.1 (4.1)
Class 6 2.9 (2.8)
6.3 (6.9)
3.7 (2.7)
3.8 (1.5)
2.2 (..)
14.7 (11.1)
3.5 (1.6)
5.3 (6.7)
Class 7 na na na na 7.9 (..)
2.4 (..)
6.0 (3.2)
5.6 (2.9)
na Not available – no projects in this category... Not applicable – only one project in this category.a. BITRE has randomly assigned responding jurisdictions a number between 1 and 7.b. The Australian total includes Tasmanian projects. Tasmania provided data in 2015 but did not provide data
in 2017. Source: BITRE based on data provided by jurisdictions.
• 30 •
BITRE • Road Construction Cost and Infrastructure Procurement Benchmarking: 2017 update
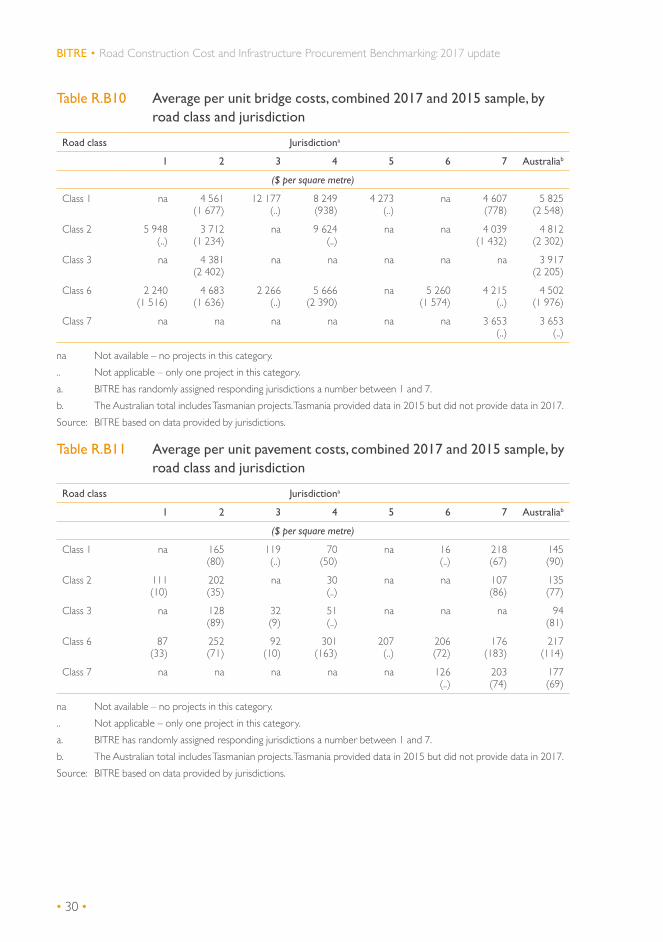
Table R.B10 Average per unit bridge costs, combined 2017 and 2015 sample, by road class and jurisdiction
Road class Jurisdictiona
1 2 3 4 5 6 7 Australiab
($ per square metre)
Class 1 na 4 561 (1 677)
12 177 (..)
8 249 (938)
4 273 (..)
na 4 607 (778)
5 825 (2 548)
Class 2 5 948 (..)
3 712 (1 234)
na 9 624 (..)
na na 4 039 (1 432)
4 812 (2 302)
Class 3 na 4 381 (2 402)
na na na na na 3 917 (2 205)
Class 6 2 240 (1 516)
4 683 (1 636)
2 266 (..)
5 666 (2 390)
na 5 260 (1 574)
4 215 (..)
4 502 (1 976)
Class 7 na na na na na na 3 653 (..)
3 653 (..)
na Not available – no projects in this category... Not applicable – only one project in this category.a. BITRE has randomly assigned responding jurisdictions a number between 1 and 7.b. The Australian total includes Tasmanian projects. Tasmania provided data in 2015 but did not provide data in 2017. Source: BITRE based on data provided by jurisdictions.
Table R.B11 Average per unit pavement costs, combined 2017 and 2015 sample, by road class and jurisdiction
Road class Jurisdictiona
1 2 3 4 5 6 7 Australiab
($ per square metre)
Class 1 na 165 (80)
119 (..)
70 (50)
na 16 (..)
218 (67)
145 (90)
Class 2 111 (10)
202 (35)
na 30 (..)
na na 107 (86)
135 (77)
Class 3 na 128 (89)
32 (9)
51 (..)
na na na 94 (81)
Class 6 87 (33)
252 (71)
92 (10)
301 (163)
207 (..)
206 (72)
176 (183)
217 (114)
Class 7 na na na na na 126 (..)
203 (74)
177 (69)
na Not available – no projects in this category... Not applicable – only one project in this category.a. BITRE has randomly assigned responding jurisdictions a number between 1 and 7.b. The Australian total includes Tasmanian projects. Tasmania provided data in 2015 but did not provide data in 2017. Source: BITRE based on data provided by jurisdictions.
• 31 •
Appendix R.B • Benchmarks for the combined 2015 and 2017 data sets
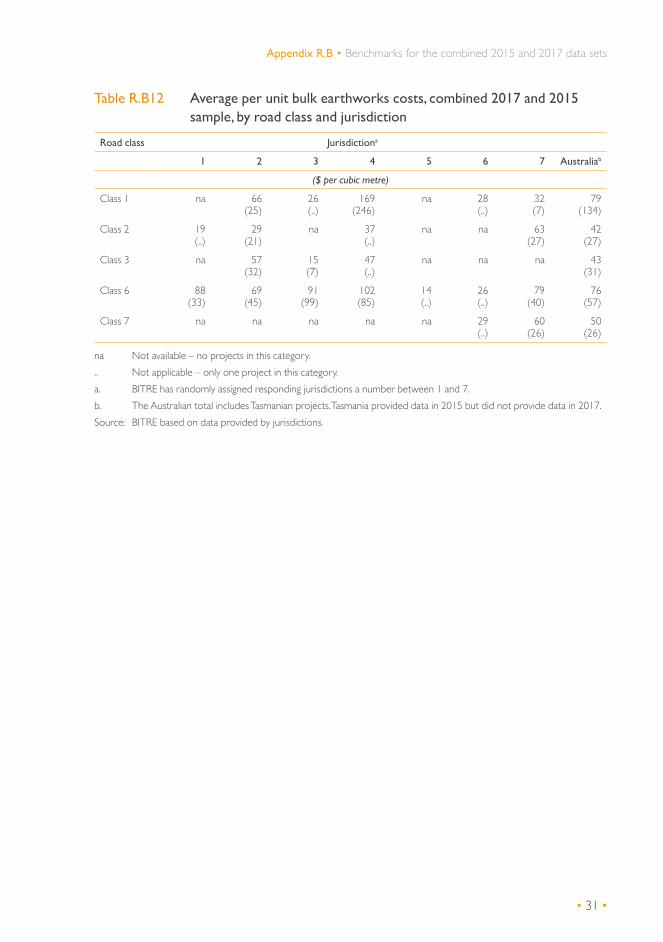
Table R.B12 Average per unit bulk earthworks costs, combined 2017 and 2015 sample, by road class and jurisdiction
Road class Jurisdictiona
1 2 3 4 5 6 7 Australiab
($ per cubic metre)
Class 1 na 66 (25)
26 (..)
169 (246)
na 28 (..)
32 (7)
79 (134)
Class 2 19 (..)
29 (21)
na 37 (..)
na na 63 (27)
42 (27)
Class 3 na 57 (32)
15 (7)
47 (..)
na na na 43 (31)
Class 6 88 (33)
69 (45)
91 (99)
102 (85)
14 (..)
26 (..)
79 (40)
76 (57)
Class 7 na na na na na 29 (..)
60 (26)
50 (26)
na Not available – no projects in this category... Not applicable – only one project in this category.a. BITRE has randomly assigned responding jurisdictions a number between 1 and 7.b. The Australian total includes Tasmanian projects. Tasmania provided data in 2015 but did not provide data in 2017. Source: BITRE based on data provided by jurisdictions.


• 33 •• 33 •
PART I
Infrastructure procurement performance
Measuring procurement performance helps Australian, state and territory governments to meet their goals of improving infrastructure and delivering efficient procurement processes. The 2015 pilot benchmarking study (Transport and Infrastructure Council 2015) provided the first set of national indicators of procurement performance. This update applies the lessons learnt from the 2015 pilot study to refine the methodology and provide more recent measures of public sector infrastructure project procurement performance.
Procurement benchmarksThe 2015 pilot study procurement benchmarks were based on the framework developed by Infrastructure Australia (2012). That framework included measures of the timeliness, quality and quantity of various aspects of public-sector procurement performance.
For the 2017 update, jurisdictions agreed several revisions to benchmarking measures, including:• increasing the sample size• removing the project size distinction• removing benchmark targets• simplifying and/or improving the procurement benchmarks by:
removing duplicate or subjective information, andcollecting and reporting more information about key procurement phases and activities.
In particular, many of the quantitative and qualitative benchmarks reported in the 2015 pilot study were dropped for this update, because they provided little additional information about the impact of performance on overall procurement outcomes. Instead, jurisdictions were asked to provide details of variations to procurement processes and the impact these variations had on the timeliness of the procurement process and cost of the project. Jurisdictions were also invited to provide information on both the planned timeline and actual time taken for each part of the procurement process that form the basis for calculating the timeliness benchmarks. This information allowed BITRE to assess the degree to which jurisdictions met their own expectations.

• 34 •
BITRE • Road Construction Cost and Infrastructure Procurement Benchmarking: 2017 update
• 34 •
The selected benchmarks measure the time taken for jurisdictions to achieve various phases of the entire procurement process across procurement, expression of interest, request for proposal, and evaluation and finalisation phases. Table I.1 outlines the 18 timeliness benchmarks developed by Infrastructure Australia (2012).
Table I.1 Timeliness benchmarks for procurement processes
Label Benchmark
Procurement phase
TB1 Initial notice of project
TB2 Commencement of market interaction
TB3 Formal discussion of project details
Expression of interest phase
TB4 Preparation
TB5 Evaluation
TB6 Alignment sessions and evaluation workshops
TB7 Approval of evaluation outcomes
TB8 Issue of RFP documents
Request for proposal phase
TB9 RFP period
TB10 Interaction period
TB11 Deadline – material changes
TB12 Deadline – minor changes
TB13 Final issue of project documents
Evaluation/Finalisation phase
TB14 Earliest technical submissions
TB15 Duration of evaluation
TB16 Duration of finalisation
TB17 Approval duration
TB18 Approval to financial close
Source: Infrastructure Australia (2012)

• 35 •
Part I • Infrastructure procurement performance
• 35 •
Procurement project dataFour jurisdictions provided completed procurement templates for 23 projects. Of these, 13 (or 57 per cent) relate to road infrastructure (See Table I.2)—there are no other non-road transport-related projects in the sample. Outside the transport sector, the sample includes nine projects covering buildings and structures and one electricity sector procurement process.
Table I.2 Procurement projects by infrastructure class
Industry Infrastructure class Number of projects
Transport Road 13
Rail 0
Airports 0
Ports 0
Fixed links 0
Other Buildings and structures 9
Electricity 1
Telecommunications 0
Source: BITRE based on data provided by jurisdictions.
The most common procurement method in the 2017 sample were design and construct (D&C) contracts, with 15 projects, (see Table I.2). There were four managing contractor contract projects and two procurement processes involving early contractor involvement. Unlike the 2015 pilot study, the 2017 sample included no Public Private Partnership projects.
Table I.3 Procurement projects by method of procurement
Procurement method Number of projects
Design and construct 15
Managing contractor 4
Early contractor involvement 2
Alliance 2
PPP 0
Source: BITRE based on data provided by jurisdictions.
The value of the projects provided by jurisdictions varied greatly around an average of $124m. The highest valued project in the sample was $988m and the lowest valued project was $7.9m. See Figure I.1 for median costs together with the other statistical measures.

• 36 •
BITRE • Road Construction Cost and Infrastructure Procurement Benchmarking: 2017 update
• 36 •
Figure I.1 Statistical measures for procurement project costs
0
750
1000
500
250
Proj
ect
cost
($m
illio
n)
Source: BITRE based on data provided by jurisdictions.
Jurisdictions were requested to provide both actual and planned timelines for each part of the procurement process. However, as Figure I.2 shows, jurisdictions were not able to provide timeliness benchmarks for every procurement phase across every project. The response rate for the planned timelines is well below that of actual timeliness. For nine of the benchmarks, jurisdictions collectively provided planned timeline data for two or fewer projects. The reasons for the low response rate are unclear and may be due to there being no a priori planned timeframe, no recording of planned timeliness or some other reason. Planned benchmarks may be difficult to determine after the completion of the procurement process. Actual benchmarks may be missing because jurisdictions did not undertake all components of the procurement process.
Figure I.2 Response rate for actual and planned timeliness benchmarks
0 5 10 15 20 25
TB18TB17TB16TB15TB14TB13TB12TB11TB10TB9TB8TB7TB6TB5TB4TB3TB2TB1
Planned Actual
Number of projects
Source: BITRE based on data provided by jurisdictions.
• 37 •
Part I • Infrastructure procurement performance
• 37 •
Procurement performance
National procurement performance
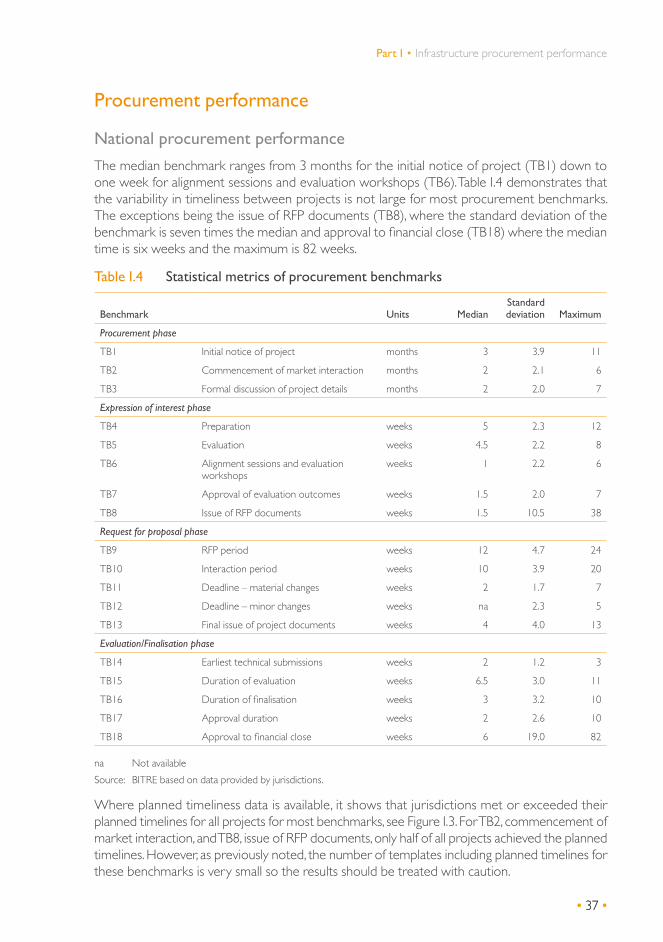
The median benchmark ranges from 3 months for the initial notice of project (TB1) down to one week for alignment sessions and evaluation workshops (TB6). Table I.4 demonstrates that the variability in timeliness between projects is not large for most procurement benchmarks. The exceptions being the issue of RFP documents (TB8), where the standard deviation of the benchmark is seven times the median and approval to financial close (TB18) where the median time is six weeks and the maximum is 82 weeks.
Table I.4 Statistical metrics of procurement benchmarks
Benchmark Units MedianStandard deviation Maximum
Procurement phase
TB1 Initial notice of project months 3 3.9 11
TB2 Commencement of market interaction months 2 2.1 6
TB3 Formal discussion of project details months 2 2.0 7
Expression of interest phase
TB4 Preparation weeks 5 2.3 12
TB5 Evaluation weeks 4.5 2.2 8
TB6 Alignment sessions and evaluation workshops
weeks 1 2.2 6
TB7 Approval of evaluation outcomes weeks 1.5 2.0 7
TB8 Issue of RFP documents weeks 1.5 10.5 38
Request for proposal phase
TB9 RFP period weeks 12 4.7 24
TB10 Interaction period weeks 10 3.9 20
TB11 Deadline – material changes weeks 2 1.7 7
TB12 Deadline – minor changes weeks na 2.3 5
TB13 Final issue of project documents weeks 4 4.0 13
Evaluation/Finalisation phase
TB14 Earliest technical submissions weeks 2 1.2 3
TB15 Duration of evaluation weeks 6.5 3.0 11
TB16 Duration of finalisation weeks 3 3.2 10
TB17 Approval duration weeks 2 2.6 10
TB18 Approval to financial close weeks 6 19.0 82
na Not availableSource: BITRE based on data provided by jurisdictions.
Where planned timeliness data is available, it shows that jurisdictions met or exceeded their planned timelines for all projects for most benchmarks, see Figure I.3. For TB2, commencement of market interaction, and TB8, issue of RFP documents, only half of all projects achieved the planned timelines. However, as previously noted, the number of templates including planned timelines for these benchmarks is very small so the results should be treated with caution.

• 38 •
BITRE • Road Construction Cost and Infrastructure Procurement Benchmarking: 2017 update
• 38 •
Figure I.3 Percentage of procurement projects achieving planned benchmarks
0 20 40 60 80 100
TB18TB17TB16TB15TB14TB13TB11TB10TB9TB8TB7TB6TB5TB4TB3TB2TB1
Per cent
Note: This figure does not include TB12 results because no jurisdictions reported planned time for this benchmark.Source: BITRE based on data provided by jurisdictions.
Factors affecting timeliness performance
Jurisdictions provided information on contract type for their projects but the small sample size makes robust statistical analysis impossible. Nevertheless, it is worth noting that while the two early contractor involvement projects have shorter timelines for the procurement phase benchmarks (TB1 to TB3), time spent on later phases of procurement are longer than for other contract types, see Figure I.4. The median value for total time taken in procurement for early contractor involvement projects is very similar to the median value for all projects.
Figure I.4 Procurement timeliness by contract types
0
5
10
15
20
25
30
TB18TB17TB16TB15TB14TB13TB12TB11TB10TB9TB8TB7TB6TB5TB4TB3TB2TB1
AllianceEarly contractor involvement
Managing contractorDesign and construct
Wee
ks
Source: BITRE based on data provided by jurisdictions
.

• 39 •
Part I • Infrastructure procurement performance
• 39 •
Comparing the timeliness measures of buildings and structures projects against road projects, Figure I.5, shows differences in timeliness across the procurement processes. The median time taken in the early procurement phase (TB1 to TB3) for roads projects in this sample is far longer than for buildings and structures projects. However, the majority of timeliness benchmarks in the latter three phases are higher for buildings and structures than roads. That is, the median time is longer for buildings and structures than roads.
Figure I.5 Procurement timeliness by infrastructure class
0
5
10
15
20
TB18TB17TB16TB15TB14TB13TB11TB10TB9TB8TB7TB6TB5TB4TB3TB2TB1
RoadBuildings and structures
Wee
ks
Source: BITRE based on data provided by jurisdictions.
BITRE also tested the data for a relationship between project costs and timeliness benchmarks, but found none.
Comparison with 2015 procurement performance
Procurement processes were marginally shorter in this analysis—an average of 89 weeks in the 2017 sample, compared with an average of 91 weeks in the 2015 pilot study. Average project timeliness was as good as or better than in the 2015 sample for around half the benchmarks (see Table 1.5). The median time taken for the initial notice of project (TB1) fell by one-third, from 4.5 to 3 months. This result suggests performance is improving although the small sample size makes this conclusion uncertain—it may simply reflect differences between the projects themselves. Two benchmarks exhibited significant increases in the median duration—evaluation in the EOI phase rose by 50 per cent and issuing of documentation in the RFP phase doubled.
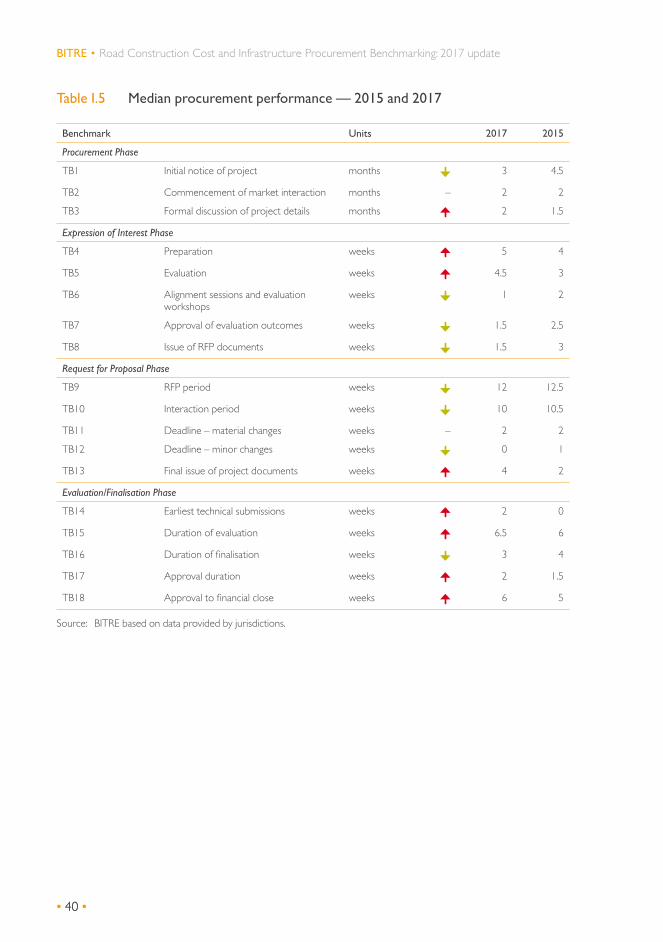
• 40 •
BITRE • Road Construction Cost and Infrastructure Procurement Benchmarking: 2017 update
• 40 •
Table I.5 Median procurement performance — 2015 and 2017
Benchmark Units 2017 2015
Procurement Phase
TB1 Initial notice of project months 3 4.5
TB2 Commencement of market interaction months – 2 2
TB3 Formal discussion of project details months 2 1.5
Expression of Interest Phase
TB4 Preparation weeks 5 4
TB5 Evaluation weeks 4.5 3
TB6 Alignment sessions and evaluation workshops
weeks 1 2
TB7 Approval of evaluation outcomes weeks 1.5 2.5
TB8 Issue of RFP documents weeks 1.5 3
Request for Proposal Phase
TB9 RFP period weeks 12 12.5
TB10 Interaction period weeks 10 10.5
TB11 Deadline – material changes weeks – 2 2
TB12 Deadline – minor changes weeks 0 1
TB13 Final issue of project documents weeks 4 2
Evaluation/Finalisation Phase
TB14 Earliest technical submissions weeks 2 0
TB15 Duration of evaluation weeks 6.5 6
TB16 Duration of finalisation weeks 3 4
TB17 Approval duration weeks 2 1.5
TB18 Approval to financial close weeks 6 5
Source: BITRE based on data provided by jurisdictions.

• 41 •
Part I • Infrastructure procurement performance
• 41 •
Jurisdictional procurement performance
Differences in performance between jurisdictions are relatively small for most benchmarks and are smaller than the differences observed across different contract types. Table I.6 shows that no one jurisdiction consistently performed better than others across all benchmarks. Equally, no jurisdiction performed consistently worse than others. Detailed investigations of the data suggest differences between jurisdictions appear to coincide with differences in the type of infrastructure present in the sample across jurisdictions. The result for median procurement for TB18 for jurisdiction 6 represents a single project that is a clear outlier.
Table I.6 Median procurement performance by jurisdiction
Benchmark Units Jurisdictiona
1 4 5 7 Australia
TB1 months 8 2 0 0 3
TB2 months 6 2 1 0 2
TB3 months 5 2 1.5 7 2
TB4 weeks 4 5 5 5 5
TB5 weeks 2 5.5 4.5 5 4.5
TB6 weeks 1 3 2 0 1
TB7 weeks 4 1.5 2 0 1.5
TB8 weeks 1 1 4 11.6 1.5
TB9 weeks 6.5 12 7 8.8 12
TB10 weeks 8 10 19 13.5 10
TB11 weeks 4.5 2 4 0 2
TB12 weeks 4 0 0 0 0
TB13 weeks 4 4 12 0 4
TB14 weeks 2.5 2 0 0 2
TB15 weeks 4.5 6.5 7.5 7.9 6.5
TB16 weeks 2 4 10 1 3
TB17 weeks 3.5 1 4 3.5 2
TB18 weeks 2 8 3 81.5 6
a. BITRE has randomly assigned responding jurisdictions a number between 1 and 7.Source: BITRE based on data provided by jurisdictions.
Variations to the procurement process
Jurisdictions were asked to provide data on variations to their procurement processes. The intent of this is to understand the effects of variations on the time taken for procurement and project costs.
For 16 of the 23 procurement processes, jurisdictions reported no variations. For projects reporting one or more variation, the resulting impacts were generally minor. Three of the remaining projects reported some variations, but these had no impact of process timing or project cost. Two projects saw variations that caused one-week delay but no change in costs. Only two projects had variations causing both delays in the procurement process and changes in project costs. Of these, one saw an increase project costs and the other a decrease in project costs.

• 42 •
BITRE • Road Construction Cost and Infrastructure Procurement Benchmarking: 2017 update
• 42 •
Conclusions and recommendationsThe 2017 sample results appear to show a small overall reduction in time taken in most parts of the procurement process compared to the 2015 pilot study. However, finalisation of project documents and evaluation of expressions of interest have seen a large increase.
Jurisdictions provided some data on planned timelines for procurement processes. However, the low response rate provided insufficient data to draw meaningful conclusions between planned and actual outcomes. To facilitate a higher response rate in the future, jurisdictions should consider recording planned procurement times as part of the procurement process.
The time taken for the overall procurement process appears relatively unaffected by type of infrastructure and contracting method. Some differences are observable in the timeliness of phases of the procurement process. For example, while early contractor involvement processes involve little time engaged in the procurement phase, later phases of the process take longer to complete.
• 43 •
References
Austroads. 2006. Guide to Road Design Part 2: Design Considerations.
Infrastructure Australia. 2012. Efficiencies in Major Project Procurement, Volume 1, Benchmarks for Efficient Procurement of Major Infrastructure.
International Construction Measurement Standards Coalition. 2017. International Construction Measurement Standards: Global Consistency in Presenting Contruction Costs.
Productivity Commission. 2014. Public Infrastructure Inquiry Report, Volumes 1 and 2. Australian Government.
Transport and Infrastructure Council. 2015. Infrastructure Benchmarking Report. Australian Government.
United Kingdom Government 2014. Infrastructure Cost Review: Measuring and Improving Delivery. United Kingdom Government.

bitr
ewww.bitre.gov.au
ISBN 978-1-925531-96-1


