63
DPS 201 ROAD DIET / LANE REDUCTION

DPS 201ROAD DIET / LANE
REDUCTION

Components of road diet projects associated with increased pedestrian safety: Decreases number of vehicle
lanes to cross Reduces the multiple-threat
situation Provides room for a pedestrian
crossing island Improves speed limit
compliance and decrease crash severity Creates a buffer between
pedestrians and vehicular traffic through addition of on-street bike lanes or on-street parking.
WHY

CASE STUDY: ROAD DIET (SAN FRANCISCO, CA)
Why a Road Diet? Community recognized need to accommodate other
road users Large number of pedestrian attractors led to conflicts Bicycle community wanted dedicated bicycle lanes
S a n Fr a n c i s co , C A

CASE STUDY: ROAD DIET (SAN FRANCISCO, CA)
Problem/Background Valencia Street part of San
Francisco’s Mission District 1.8 miles long 4-lane road with 22,000
ADT High pedestrian, bicycle, bus
activity but lacked supporting infrastructure
S a n Fr a n c i s co , C A
Before
21’ 10’ 3” 10’ 3” 21’
Total width = 62’ 6”

CASE STUDY: ROAD DIET (SAN FRANCISCO, CA)
Details In 1999, 4 lanes restriped to 2
lanes + bicycle lanes and center turn-lane Trial basis
Speed limit lowered from 30 to 25 mph
Signal timing altered to minimize loss of capacity
Made permanent after year trial Initial cost: $130,000 Paint and sign work, & labor spent
writing an impact report
S a n Fr a n c i s co , C A
After
Before

CASE STUDY: ROAD DIET (SAN FRANCISCO, CA)
Results Success No real change in ADT Large increase in cycling & pedestrian
activity Reduction in collisions Aided revitalization of area
Four years after, a survey of business owners along Valencia Street found general support* 65% felt bicycle lanes had positive
impact on their business, only 4% said it had negative impact 65% would support more traffic calming
S a n Fr a n c i s co , C A
*Source: Emily Drennen, “Economic Effects of Traffic Calming on Urban Small Business”

CASE STUDY: ROAD DIET (SAN FRANCISCO, CA)
Results City implemented
more changes in 2010: sidewalks and bike-
lanes widened bulb outs, streets
trees, lighting, and public art added
Became place to try new treatments such as bicycle “green wave” and bicycle bays
S a n Fr a n c i s co , C A
Sign illustrating a bicycle bay
Sign indicating the street is set for “green wave” speeds

Narrowing the roadway cross section from four lanes to three lanes (two through lanes with center turn lane) has been associated with a 29% decrease in all crashes.
Research Harkey, D., Srinivasan, R., Baek, J. , Counci l , F. M., Eccles, K. , Lefler,
N. , . . . & Bonneson, J. A . (2008). Crash Reduction Factors for Traf fic Engineering and ITS Improvements. Final Report National Cooperative Highway Research Program (NCHRP) Project , 17-25.
ROAD DIET / LANE REDUCTION: SAFETY

Converting roadway cross-section from four lanes to three lanes (two through lanes with center turn lane) has been associated with a 37% decrease in all crashes. Urban areas
Research Gates, T. J . , Noyce, D. A . , Talada, V. , and Hil l , L. , "The Safety and
Operational Ef fects of "Road Diet" Conversion in Minnesota." 2007 TRB 86th Annual Meeting: Compendium of Papers CD-ROM, Vol . TRB#07-1918, Washington, D.C. , (2007)
ROAD DIET / LANE REDUCTION: SAFETY

Converting roadway cross-section from four lanes to three lanes (two through lanes with center turn lane) has been associated with a 53% decrease in all crashes. Suburban roadways
Research Persaud, B. , Lana, B. , Lyon, C. , and Bhim, R. "Comparison of
empirical Bayes and ful l Bayes approaches for before–af ter road safety evaluations." Accident Analysis & Prevention, Vol . 42, Issue 1 , pp. 38-43 (2010)
ROAD DIET / LANE REDUCTION: SAFETY

COLLISION REDUCTIONS FROM SEATTLE ROAD DIETS

City Number of Crashes (Road
Diets)
Number of Crashes
(Comparison Sites)
Bellevue, WA 134 307
Mountain View, CA 20 134
Oakland, CA 443 2,067
San Francisco, CA 450 1,339
Seattle, WA 969 4,485
Sunnyvale, CA 52 224
Total 2,068 8,556Based on study of 12 road diet study segments and 25 comparison segments.
BEFORE AND AFTER CRASH DATA
Source: Summary Report: Evaluation of Lane Reduction "Road Diet" Measures and Their Effects on Crashes and Injuries FHWA-HRT-04-082

BEFORE AND AFTER CRASH DATA
Source: Summary Report: Evaluation of Lane Reduction "Road Diet" Measures and Their Effects on Crashes and Injuries FHWA-HRT-04-082

The roadway has a moderately high density of driveways and other uncontrolled access
Crash severities are high Speeding contributes to safety problems Pedestrians and others crossing/accessing the main corridor
are affected by the higher exposure of crossing Multiple lanes exist on each approach No center turn lane exists Frequent crash types exist that are most amenable to
reduction through a road diet (opposing left-turn, sideswipe, pedestrian, rear-end)
WHEN

ROAD DIET IMPLEMENTATION CONSIDERATIONS

CITY OF SEATTLE

Road Diet Conversions: A Synthesis of Safety Research May 2013 Libby Thomas, Senior Associate, UNC HSRC FHWA DTFH61-11-H-00024
Each potential road diet should be vetted on a case by case basis.
Case study and modeling results suggest Caution warranted when volumes approach 1,700 vehicles in the
peak hour or range of 20,000 to 24,000 ADT (HSIS, 2010; Knapp and Giese, 2001; Welch, 1999).
RESEARCH

GUIDELINES

Chapters1. Introduction2. Why Consider a Road Diet3. Road Diet Feasibility Determination4. Designing a Road Diet5. Determining if the Road Diet is Effective
FHWA ROAD DIET INFORMATIONAL GUIDE

Jennifer A. Rosales, P.E. A comprehensive guide
for planners, engineers, & designers to help make decisions on applicability of road diets.
Contains information on: Planning Analysis Design Implementation Results of previous research Significant gaps in the field
Analyses of safety and traffic operations Livability considerations Case study evaluations Lessons learned from
experience Guidelines for identifying &
evaluating potential road diet sites & typical cross-sections Overall guidelines for
implementation.
ROAD DIET HANDBOOK: SETTING TRENDS FOR LIVABLE STREETS

Looks at operational and safety aspects to assist in preliminary determination whether a road diet is appropriate
Cross-section designs Transition to and from the road diet section Flow chart for determining appropriate action Identified gap in Rosales Road Diet
guidelines Did not provide specific guidance regarding
volumes or left-turn percentages indicating when such a project could result in improved operational and safety conditions
KENTUCKY TRANSPORTATION CENTER GUIDELINES FOR ROAD DIET CONVERSIONS

ADT (Road Diet Candidate) 20,000 or less1
23,000 or less2
Peak hourly volume (Road Diet Candidate) 1,700 or less1
1,500 – 1750 or less depending on2: Percentage of left turns at intersection VPH on side street
Case with higher ADT Lake Washington Blvd. Kirkland, WA3
Initial volume of 23,000 vehicles per day Increased nearly 26,000 after conversion During one period about 30,000 vehicles per day
ROAD DIET CANDIDATE GUIDELINES
1. Rosales 2. Kentucky 3. Burden and Lagerwey (1999)

Probably feasible at or below 750 vehicles per hour per direction (vphpd) during the peak hour
Consider cautiously between 750 – 875 vphpd during the peak hour
Feasibility less likely above 875 vphpd during the peak hour and expect reduced arterial LOS
Guidelines for the conversion of urban four-lane undivided road ways to three-lane two-way lef t-turn facilities. Sponsored by the Office of Traffic and Safety of the Iowa Department of Transportation, CTRE Management Project 99-54
PEAK HOURLY VOLUME

What are the non-intersection turning volumes and patterns Driveway density Left turns in and out
Are there frequent-stop and slow-moving vehicles? Buses Mail Double parked vehicles Buggies Delivery trucks Agriculture
Is there a lot of weaving? What are the speeds?
CONSIDERATIONS

Safety Crash rate along corridor What types of crashes are occurring?
What’s the level of pedestrian & bicycle activity? Commercial reinvestment areas Economic enterprise zones Historic streets Scenic roads Entertainment districts Main streets
CONSIDERATIONS
Driveway density Left turns in and out
NON-INTERSECTION TURNING VOLUMES AND PATTERNS

BusesMailDouble parked
vehiclesBuggiesDelivery trucksAgriculture
Consider number & duration of vehicle stops Is there potential for
Pullouts
FREQUENT-STOP AND SLOW-MOVING VEHICLES

DESIGN CONSIDERATIONS

Signal timing or phasing changes at intersections to optimize operations and safety benefits
Roundabouts
INTERSECTIONS
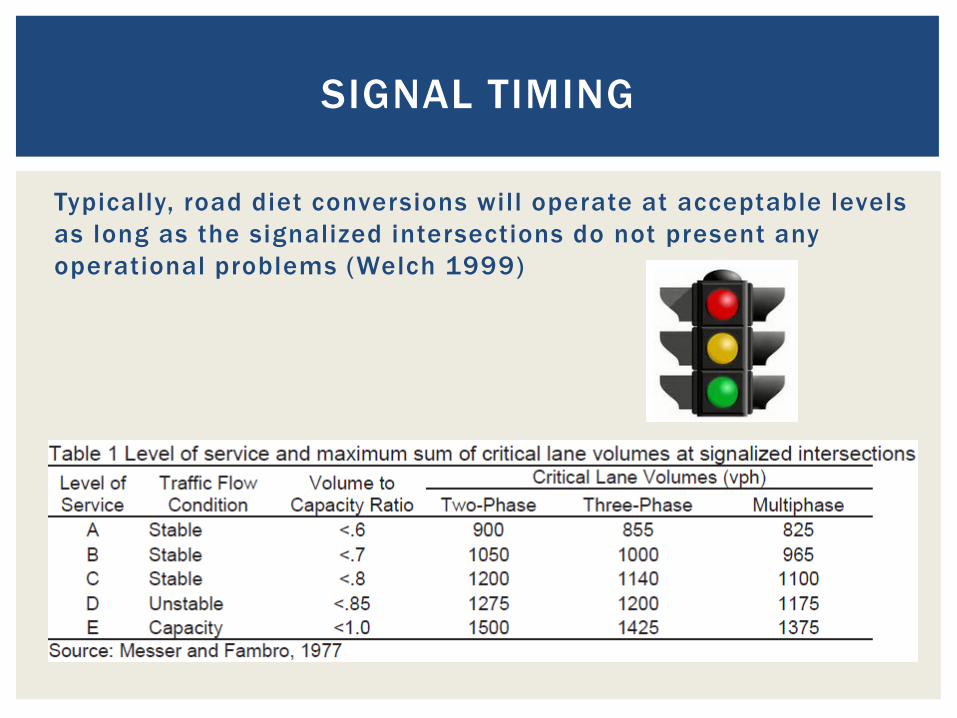
Typically, road diet conversions will operate at acceptable levels as long as the signalized intersections do not present any operational problems (Welch 1999)
SIGNAL TIMING

DELAY COMPARISON 3-4 LANES WITH SIDE STREET VPH (KENTUCKY)

MAIN STREET SIDE STREET SIGNALIZED INTERSECTION GUIDELINES (KENTUCKY)

QUEUE DIFFERENCE 3-4 LANESWITH SIDE STREET VPH (KENTUCKY)

Delay along major road very small Less than 4.5 sec/veh
3-lane option slightly higher delays than 4-lane Difference very smallMost < 2.5 sec/veh 56% delay difference being < 1 sec/veh
Significant dif ferences in delays on side-street approaches Delays on side-street for 3-lane road diet conversion were
smaller than 4-lane road
UNSIGNALIZED INTERSECTIONS (KENTUCKY)

Single lane roundabout ADT similar to Road Diet ADT Less than 20,000
ROUNDABOUTS

CORridorSIMulation(CORSIM)
VISSIM Safety
Surrogate Assessment Model (SSAM)
SIMULATION SOFTWARE

ROAD PROFILES

WIDER LANES = HIGHER SPEEDS
Source: “Design Factors That Affect Driver Speed on Suburban Streets”, TRR 1751 (2000)

CROSS SECTIONS 48 FEET
48 feet curb-to-curb with no parking
Sidewalks buffered in the Road Diet
Space for pedestrian island
(12 ft) (12 ft) (12 ft) (12 ft)
Before
(6 ft) (12 ft) (12 ft) (12 ft) (6 ft)
After

CROSS SECTIONS 60 FEET
(6ft) (12ft) (12ft) (12ft) (12ft) (6ft)
Before
(5.5ft) (8ft) (11ft) (11ft) (11ft) (8ft) (5.5ft)
After

CROSS SECTIONS 70 FEET
(5ft) (12ft) (12ft) (12ft) (12ft) (12ft) (5ft)
Before
(5ft)(3ft) (9ft) (12ft) (12ft) (12ft) (9ft) (3ft)(5ft)
After
(14ft) (8ft) (11ft) (11ft) (11ft) (6ft) (9ft)

Although higher cost sidewalks can be widened
Lower cost option NYC Low Cost sidewalk widening with delineator posts
OPPORTUNITY TO WIDEN SIDEWALKS
AfterBefore Washington D.C Sherman Ave. NW

BIKE FEATURES
http://nacto.org/cities-for-cycling/design-guide/
Warning: Check traffic control against the MUTCD

INTERSECTION CROSSING MARKINGS

TWO-STAGE TURN QUEUE BOXES
Parking Lane Configuration
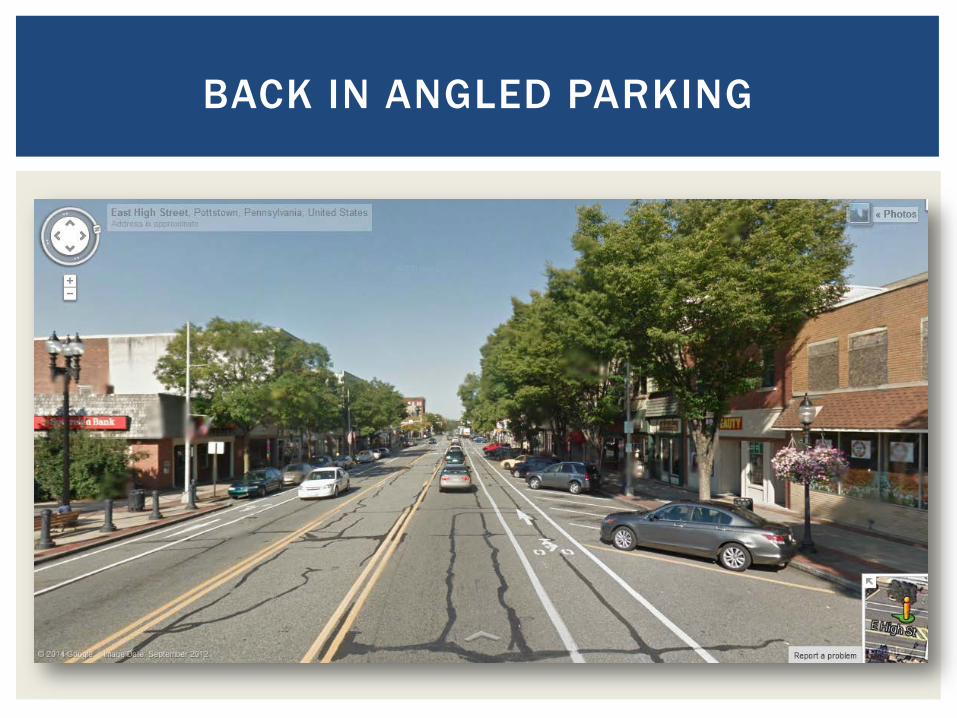
BACK IN ANGLED PARKING

Pros
Better visibility getting back into traffic See cars and bicyclists
More vehicle parking spaces than parallel
Open car door(s) lead kids to sidewalk
Loading items into trunk is safer
Cons
Some people will need practice
Furniture zone items might get hit
Exhaust from running cars at sidewalk Consider outdoor café’s
BACK-IN ANGLE PARKING

BACK-IN ANGLED PARKING PUBLIC EDUCATION AUSTIN TX

Road diets can be low cost if planned in conjunction with reconstruction or simple overlay projects, since a road diet mostly consists of restriping May involve other costs such as signal head relocation
COST

Know well in advance of when road reconstruction and overlay projects will be initiated to evaluate for Road Diet.
Obtain input from the community stakeholders, and ensure the appropriate elements are included in the project.
Classic four-to-three-lane Road Diet is very compatible with single-lane roundabouts
BEST PRACTICE

CASE STUDIES

CASE STUDYNICKERSON STREET, SEATTLE, WA

Improve pedestrian safety Add marked crosswalks Reduce exposure to multiple threat collisions Increase driver compliance with the posted
speed limit Reduce speed
PROJECT GOALS

SPEED

Two new marked crosswalks at Dravus St & 11th Ave W Preliminary collision statistics show a substantial reduction in
collisions after the project was completed
COLLISIONS

2009 (Before) Approximately 18,500 vehicles per weekday between 3rd Ave
W and 6th Ave W.
August 2011 (After) Approximately 18,300 vehicles recorded in at the same
location
ADT

Freight vehicles of all types on Nickerson St rose slightly after the Road Diet Trucks still account for about 5% of vehicles
Large trucks account for about 2% of total traffic Some large trucks continue to use Nickerson St both as a
through route and to access the Queen Anne neighborhood via 3rd Ave W
FREIGHT USE

Add two marked crosswalks Improved all marked and unmarked crosswalks on the corridor
Collision reduction in the first year 2009-2011: 23% reduction
Significant speed reduction Dramatically reduced percent of drivers traveling > 10 mph
over speed limit Percent drivers traveling over the speed limit reduced more
than 60% Top-end speeders reduced by 90%
PROJECT OUTCOMES

CASE STUDY: ROAD DIET (SEATTLE, WA)
Problem/Background 1.2 mile road High motorist speeds Connects regional trail to
park 13,000 ADT Numerous bus routes 8 schools, 2 libraries and
2 parks within 5 blocks
S e a t t le , WA

CASE STUDY: ROAD DIET (SEATTLE, WA)
Why a Road Diet? Uncontrolled, marked
crosswalks needed to be changed due to new guidelines
Aggressive speeders, high crash rates
Seattle Bicycle Master Plan recommended climbing lanes and shared lane markings
Repaving provided leveraging opportunity
S e a t t le , WA
Before

CASE STUDY: ROAD DIET (SEATTLE, WA)
Details Road restriped
to provide 2 thru lanes, a two-way left turn lane & bike lanes
Crosswalks were restored if they met guidelines
S e a t t le , WA
Before
After

CASE STUDY: ROAD DIET (SEATTLE, WA)
Results Speeding reduced Total collisions declined
14%, injury collisions 33% Pedestrian collisions
declined 80% Bicycle volume increased
35% Traffic did not divert to
neighborhood streets Peak hour capacity
maintained
S e a t t le , WA
After

Road Diet Information Guide FHWA http://safety.fhwa.dot.gov/road_diets/info_guide/
Road Diet Handbook: Setting Trends for Livable Streets (Rosales)
Guidelines for Road Diet Conversions Kentucky Transportation Center http://www.ktc.uky.edu/projects/guidelines-for-road-diet-conversions/
PEDSAFE Case Studies http://www.pedbikesafe.org/PEDSAFE/casestudies.cfm?op=C&subop=b&CM_NUM=19
AASHTO Guide for the Development of Bicycle Facilities (2012 Edition) https://bookstore.transportation.org/collection_detail.aspx?ID=116
NACTO Urban Bikeway Design Guide
QUESTIONS / RESOURCES


