Road Traffic Injuries and Deaths in India : Current Scenario Gururaj G Professor and Head Department of Epidemiology WHO Collaborating Centre for Injury Prevention and Safety Promotion National Institute of Mental Health and Neuro Sciences Bangalore 560 029 India. Email : [email protected]
Transcript
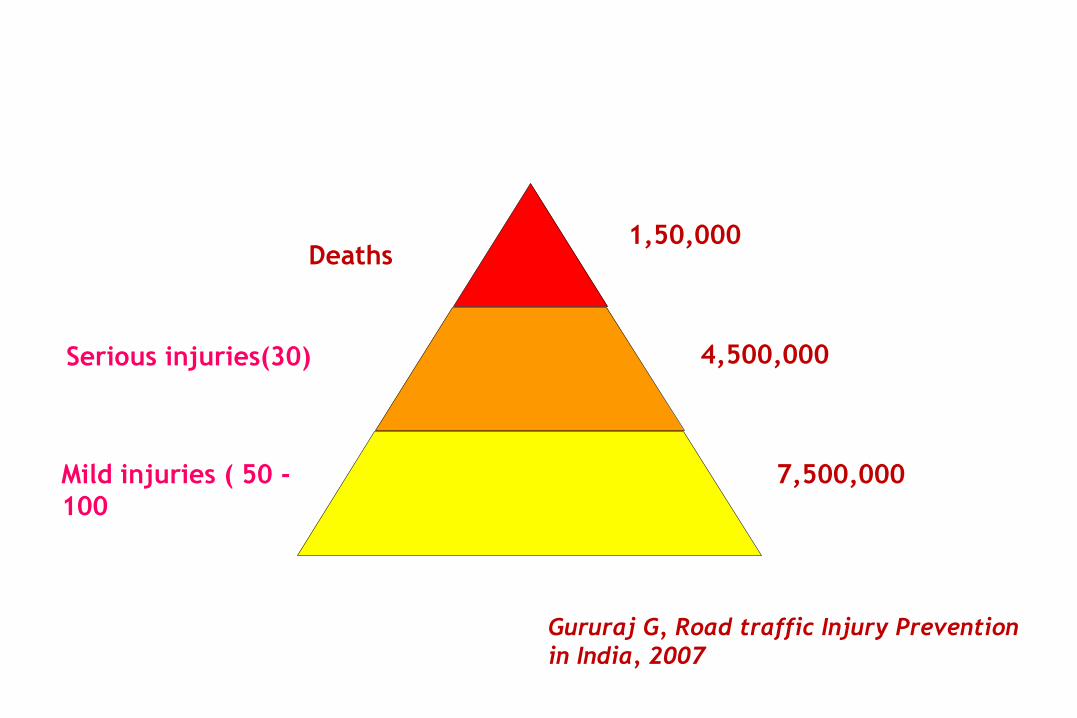
Road Traffic Injuries and Deaths in India : Current Scenario
Gururaj G
Professor and Head
Department of Epidemiology
WHO Collaborating Centre for Injury Prevention and Safety Promotion
National Institute of Mental Health and Neuro Sciences
Impact of future Infrastructure expansion , motorisation and economic growth ? ? ? ?
Known risk factors – Non usage of helmets
Indian Motor vehicles Act - 1988
Implementation left to states
Poor implementation of laws
Limited public awareness
Small amounts of penalties
Enforcement limited and selective
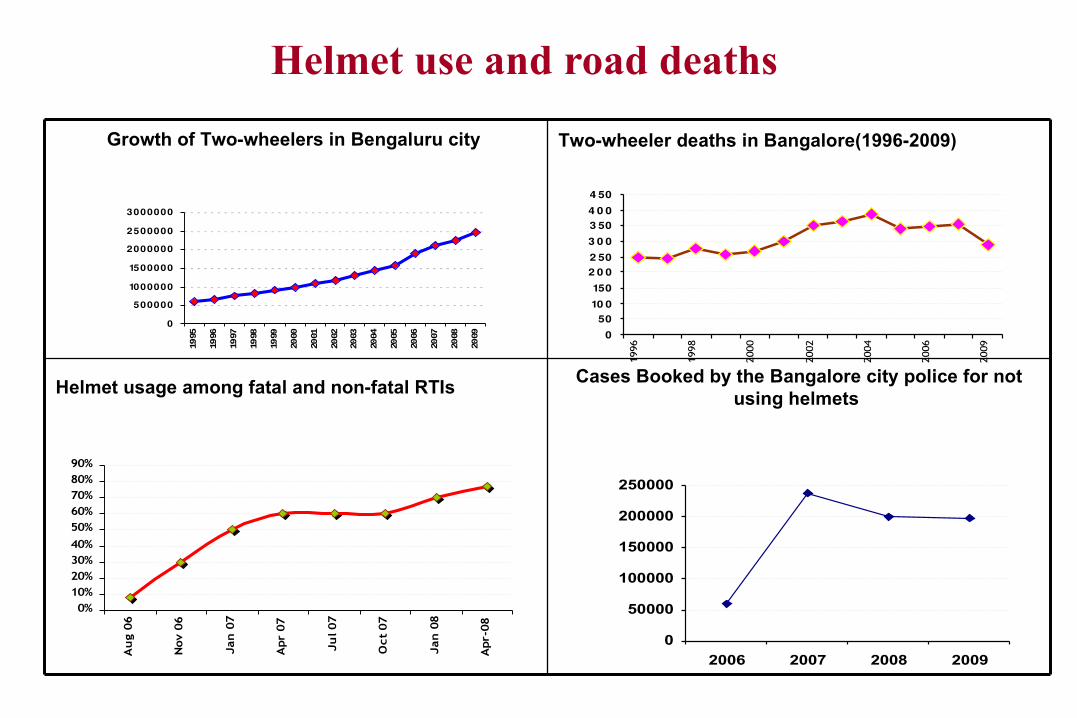
Helmet use and road deaths
Growth of Two-wheelers in Bengaluru city Two-wheeler deaths in Bangalore(1996-2009)
Helmet usage among fatal and non-fatal RTIs Cases Booked by the Bangalore city police for not
using helmets
0
500000
1000000
1500000
2000000
2500000
3000000
1995
1996
1997
1998
1999
2000
2001
2002
2003
2004
2005
2006
2007
2008
2009 0
5010 0
150
2 0 02 50
3 0 0
3 504 0 0
4 50
1996
199
8
200
0
2002
2004
2006
2009
0%10%20%30%40%
50%60%70%80%90%
Au
g 0
6
Nov 0
6
Jan
07
Apr
07
Ju
l 07
Oct
07
Jan
08
Apr-
08
0
50000
100000
150000
200000
250000
2006 2007 2008 2009
Nearly one third crashes occur during night time One third linked to alcohol consumption IMV Act – Poor enforcement No breath or blood alcohol estimations No surveillance in hospitals Varying penalty levels across the country Business interests / health benefits No data for the country
Known Risk factors – Drinking and driving
Drink & DriveTrend of Drunken Driving cases booked by the Bangalore City Police
Alcohol use among Fatal RTIs in Bengaluru & Tumkur Alcohol from previous studies
Yes, 16.67%
No, 30.95%
Not known, 52.38%
Yes, 3.74%
No, 47.33%
Not known 48.93%
0
5
10
15
20
25
30
35
1994 2000 2002 2005 2007
BangaloreTumkur
India – early stages of car ownership ratios BISP data – Nearly 8 % of deaths Limited or No use Low penalty levels No enforcement Poor public awareness IMV Act – Old cars – availability of seat belts
Known Risk factors – Seat belts usage
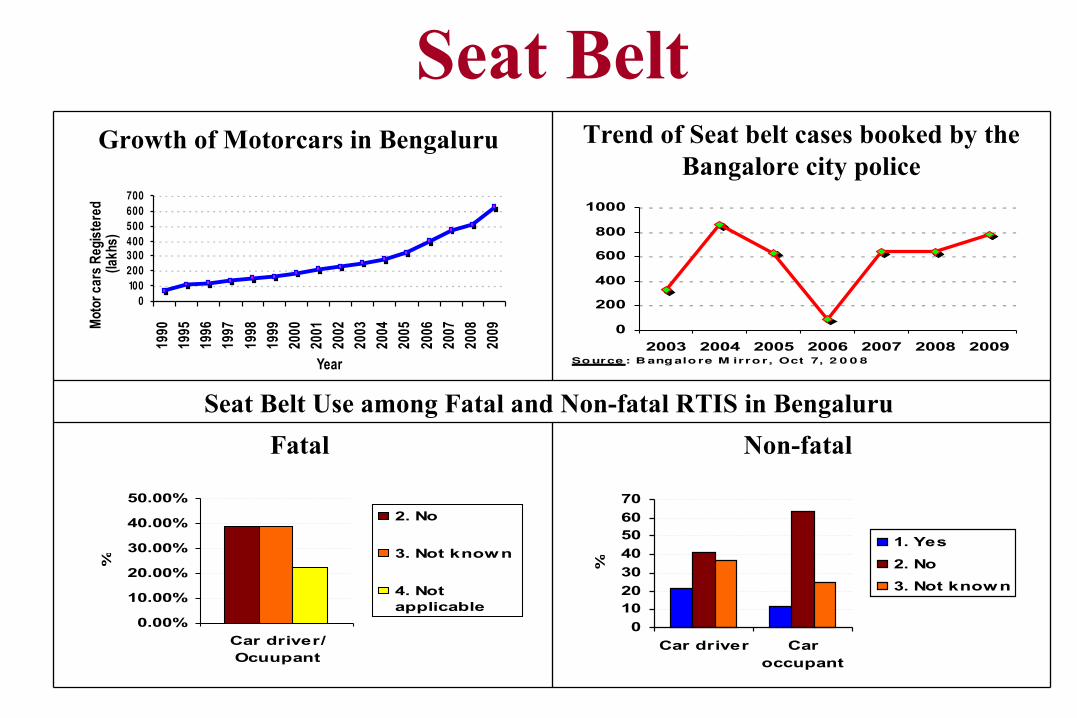
Seat BeltGrowth of Motorcars in Bengaluru Trend of Seat belt cases booked by the
Bangalore city police
Seat Belt Use among Fatal and Non-fatal RTIS in Bengaluru
Fatal Non-fatal
0100200300400500600700
1990
1995
1996
1997
1998
1999
2000
2001
2002
2003
2004
2005
2006
2007
2008
2009
Year
Mot
or c
ars
Reg
iste
red
(lakh
s)
0.00%
10.00%
20.00%
30.00%
40.00%
50.00%
Car driver/Ocuupant
%
2. No
3. Not known
4. Notapplicable
0
1020
30
40
5060
70
Car driver Caroccupant
%
1. Yes
2. No
3. Not known
0
200
400
600
800
1000
2003 2004 2005 2006 2007 2008 2009Source : B angalo re M irro r, Oct 7, 2 0 0 8
Increasing speeds across places with congestion in select areas
and residential areas Where – who – how : enforcement Penalty levels Interceptors – speed cameras Environment and vehicle modification
Known Risk factors – Speeding
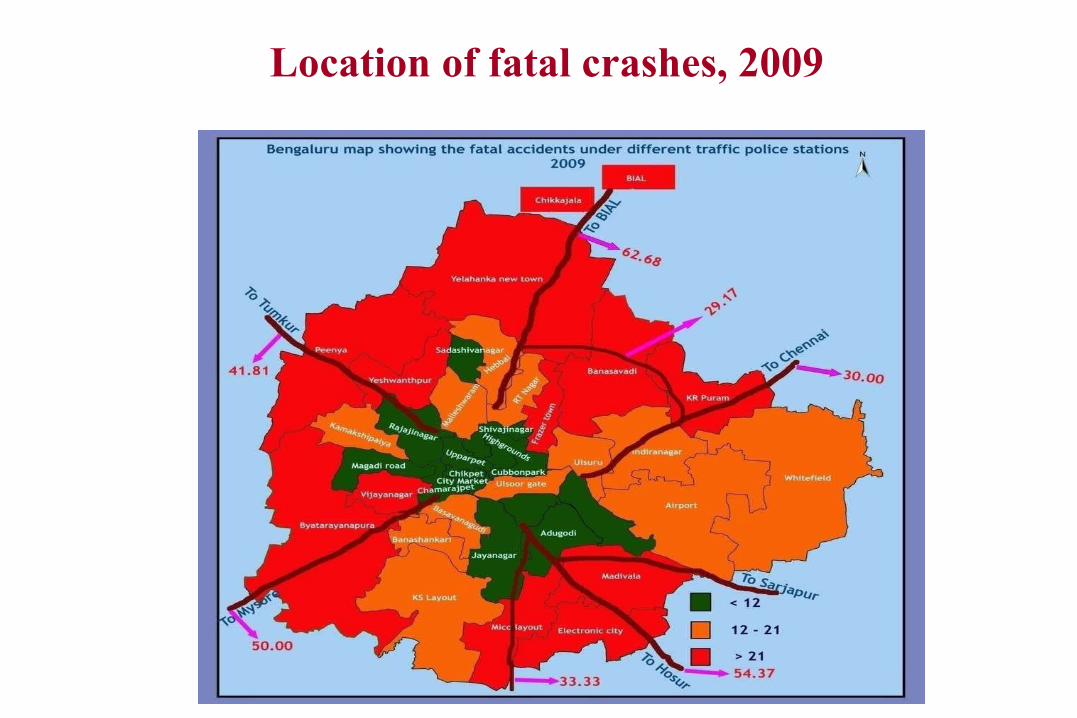
Location of fatal crashes, 2009
SpeedTrend of Overspeeding cases booked by
the Bangalore City police
0
10000
20000
30000
40000
50000
60000
2005 2006 2007 2008 2009
Year
No
. o
f O
ver
sp
eed
ing
cases b
oo
ked
Speed InterruptersSpeed CamerasBlackberrys
Crash mechanisms
Least understood area
Combination of Human – vehicle – Environment factors
Systems contribution least understood
Human error – only cause
92 % attributed to human causes
No information on risk factors
Lack of research by all sectors
Injury surveillance systems absent in the country
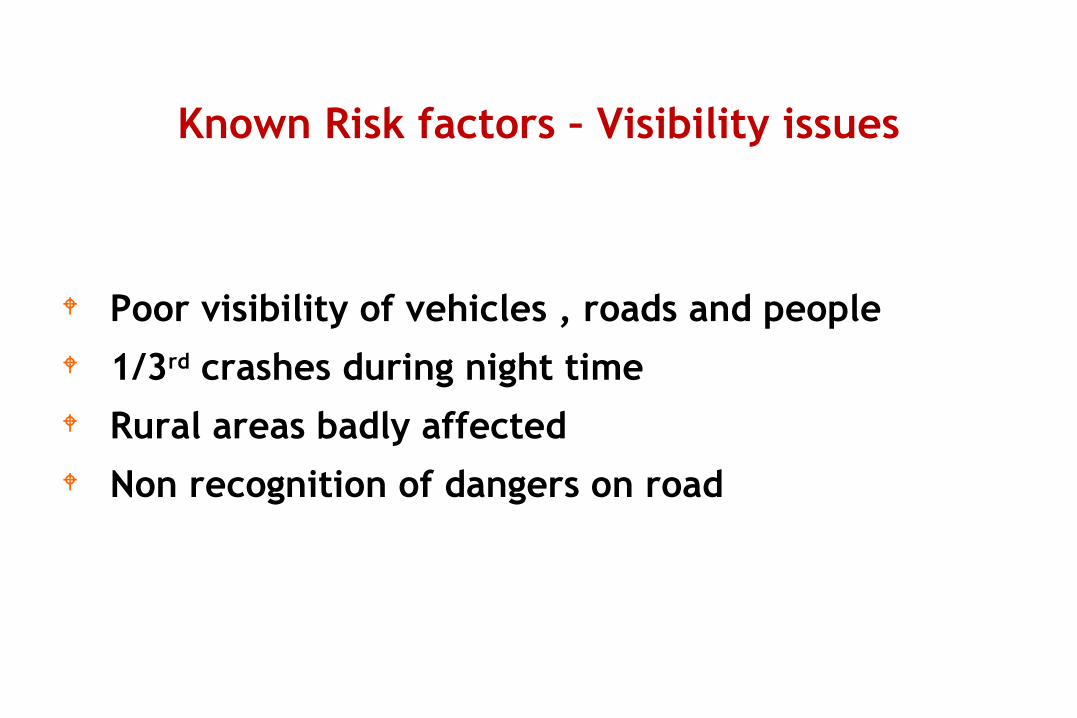
Poor visibility of vehicles , roads and people 1/3rd crashes during night time Rural areas badly affected Non recognition of dangers on road
Known Risk factors – Visibility issues
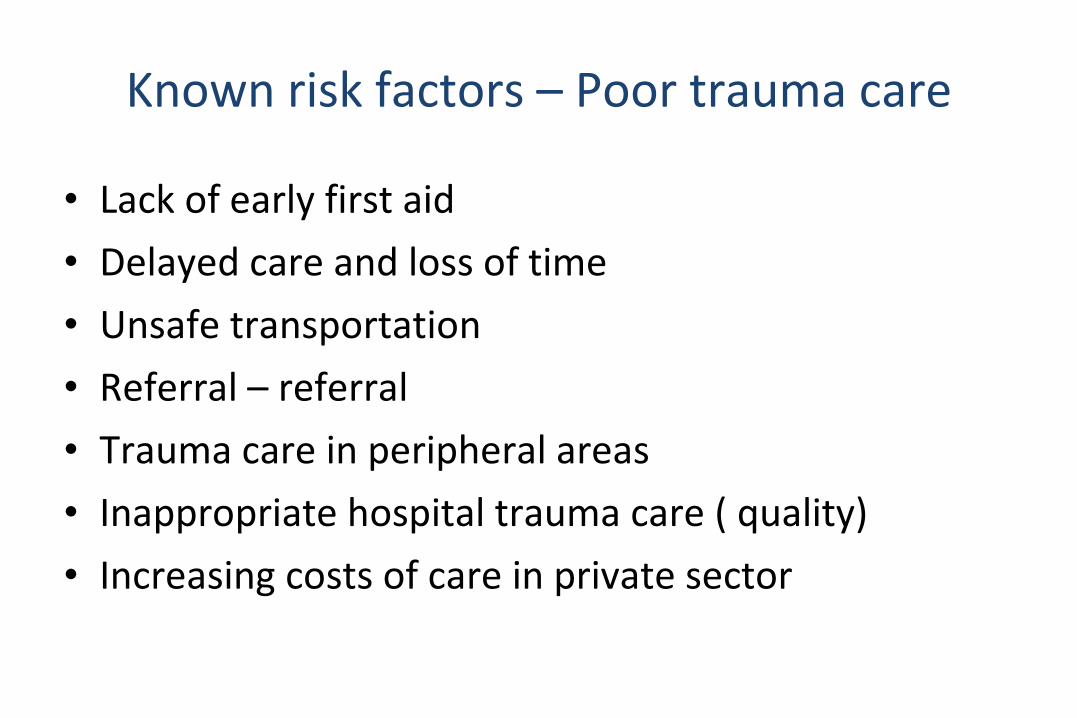
Known risk factors – Poor trauma care
• Lack of early first aid
• Delayed care and loss of time
• Unsafe transportation
• Referral – referral
• Trauma care in peripheral areas
• Inappropriate hospital trauma care ( quality)
• Increasing costs of care in private sector
Mode of Transportation (2009)
Urban Rural
0 5 10 15 20 25 30 35 40
<1 hour
1 - 3
3 - 6
6 - 12
12 - 24
1 - 3 days
> 3 days
Urban
Rural
Time interval between injury & reaching NIMAHNS (%)
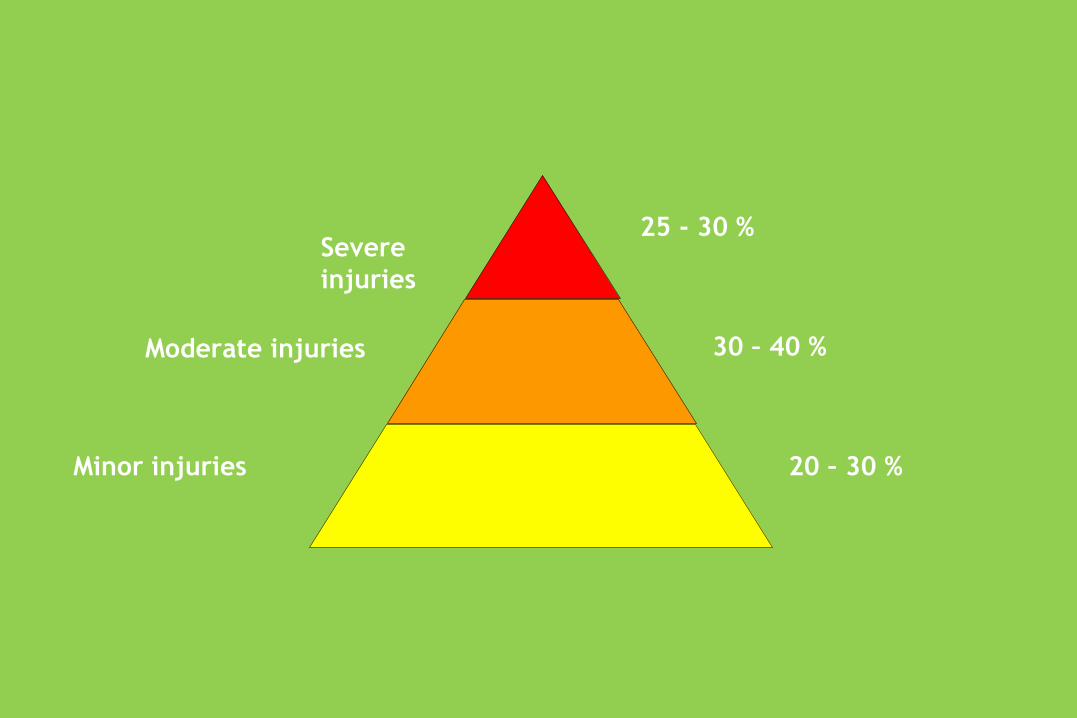
Severe injuries
Moderate injuries
Minor injuries
25 - 30 %
30 – 40 %
20 – 30 %
Major cause in young and middle aged population Likely to increase with decline of com. Diseases Nearly half have brain and face injuries Early and long term disabilities 2 % result in PVS Physical , psychosocial and other disabilities 15 % do not recover even at the end of 2 years Major impact on poverty reduction
RTIs and Disabilities
Type of accidentType of accident
Estimated average costs in Rupees for year of study
Estimated costs for 2000 is Rs. 55,000 crores ($550,000 million) Source : TRIPP, New Delhi
Economic Impact of RTIs
Road Safety Interventions
Technological Interventions
Policy Interventions
RegulatoryInterventions
Enabling Environment
(Financial, Social, Physical)
Beliefs & Behaviours
(Community; Individual)
Desired Change
Modifications of roads & vehicles
Educational Interventions
Enforcement of road safety
laws
Survey of 11,000 working class population High use of vehicles Knowledge levels high Poor perceptions on attitudes Low levels of practice in all areas • Total disregard for public safety laws
38% …… do not have a valid license
Only 40% through driving school
Known Risk factors – Public Perceptions
Pre-hospital
Call & control centre
Ambulances
Trained staff
Sensitised & trained public
Hospital
Equipment
Evidence-based guidelines
Triage
Trained staff
Audit
Referral System
Transport
Guidelines
Training
Specialised diagnosis
Specialist care
Rehabilitation System
Appropriate appliances
Occupational therapy
Physiotherapy
Work & Home support
Outcomes
Elements of Effective Trauma Care System
Existing Road safety Information Systems Post crash data collection and traffic offenders
Captures majority of deaths and <50 % of serious injuries.
Indicates trends
Broad sociodemographic correlates
Limited local geographical information
No/Minimal information on risk factors
Data analysis is limited -lack of skills with investigative agencies
• Information on crash patterns - nature - situation - circumstances available, but not analysed
• Poor health sector data
• Limited population based research
What works for control of RTIs• Enforcement of helmet – drink drive – seat belt – speed control laws
( laws to be notified and implemented in all states and UTs).
• Engineering for pedestrian safety in terms of footpaths, crossing places , traffic calming and speed control mechanisms
• Improved design and operation of highways
• Increasing visibility- day time head lights for vehicles ; other measures
• Seat belts and airbags
• Education to support enforcement and engineering
• Emergency and trauma care strengthening
• Improved vehicle safety, crashworthiness and standards (40 % of BMTC
crashes due to break failures)
• Strengthening public transportation
• Capacity building of all concerned agencies and departments
Road Safety Policy, plans
and programmes
Organization of pre-hospital
and trauma care
Planning and budgeting for Road safety
Advocacy
Surveillance and Research
Monitoring and evaluation
Human resources and
training Information systems
from police, health and
others
InterventionProgrammes in different
settings
Legislation and human
rights
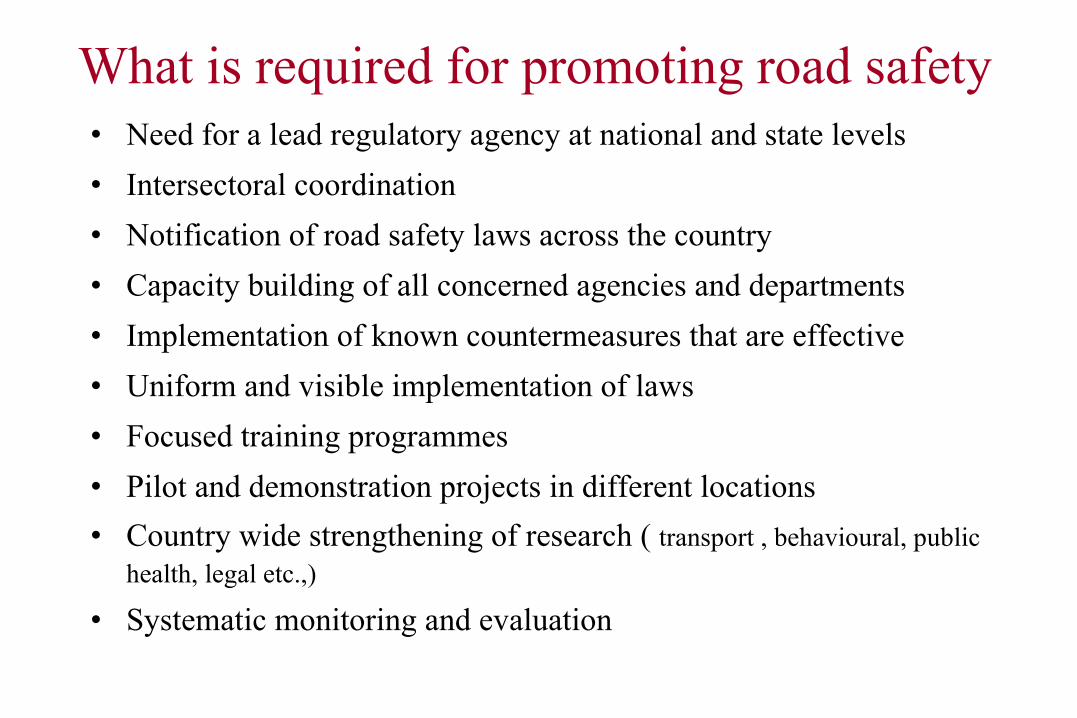
What is required for promoting road safety• Need for a lead regulatory agency at national and state levels
• Intersectoral coordination
• Notification of road safety laws across the country
• Capacity building of all concerned agencies and departments
• Implementation of known countermeasures that are effective
• Uniform and visible implementation of laws
• Focused training programmes
• Pilot and demonstration projects in different locations
• Country wide strengthening of research ( transport , behavioural, public health, legal etc.,)
• Systematic monitoring and evaluation
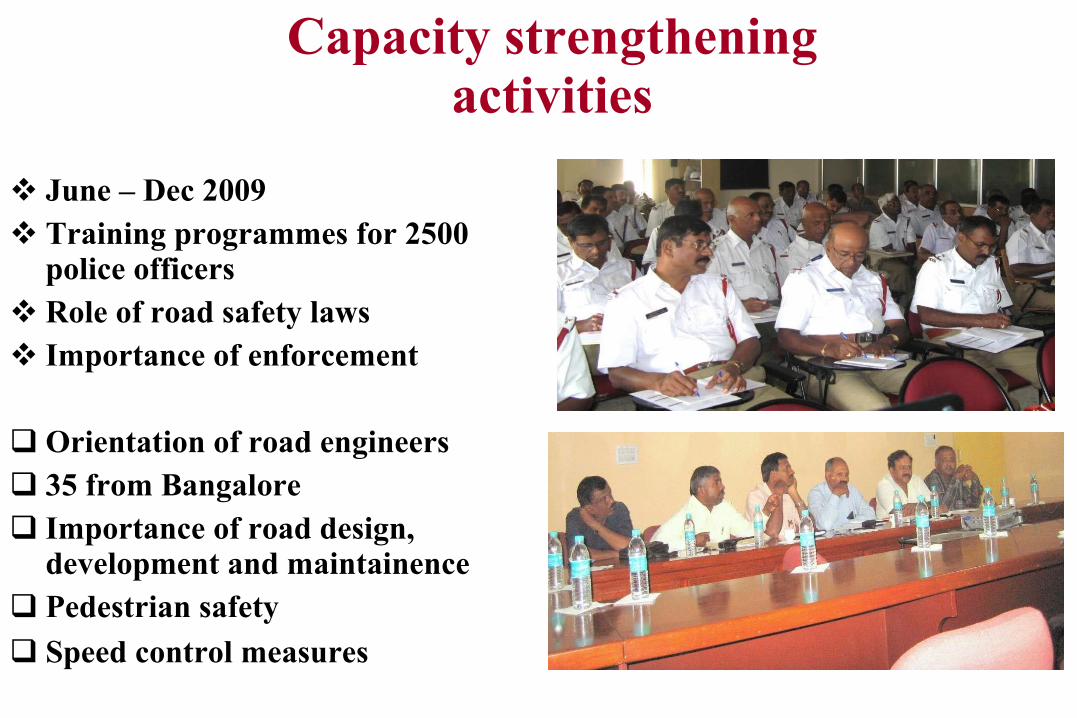
Capacity strengthening activities
June – Dec 2009 Training programmes for 2500
police officers Role of road safety laws Importance of enforcement
Orientation of road engineers 35 from Bangalore Importance of road design,
development and maintainence Pedestrian safety
Speed control measures
Some recent initiatives• National Road safety Policy – Bill – Act in Parliament ( Sri. Sundar Committee report)
• National transport + urban development + environment policies
• National Highway Authority of India – Road safety Cell - Audits
• National Disaster Management Authority – RTIs + Trauma
• Infrastructure development – Highways, urban areas
• Strengthening public transportation – JNURM
• Towards revision of IMV Act
• Highway trauma care initiatives + EMRI 108 systems
• Automobile Research Association of India – standards
• India Road safety Programme – GRSP initiative
• CII and state transport department collaborations
• Trauma research by ICMR and WHO - surveillance + registries
• Recognition of emergency medicine as a specialty by MCI
• Greater concern – not really leading to action
Trend of Road deaths in Andhra Pradesh from 1994 to 2008
0
2000
4000
6000
8000
10000
12000
14000
16000
1994
1995
1996
1997
1998
1999
2000
2001
2002
2003
2004
2005
2006
2007
2008
Year
Nu
mb
er
of
road
death
s
Trend of Road deaths in Punjab from 1994 to 2008
0
500
1000
1500
2000
2500
1994
1995
1996
1997
1998
1999
2000
2001
2002
2003
2004
2005
2006
2007
2008
Year
Nu
mb
er
of
road
death
s
Trend of Road deaths in Bangalore
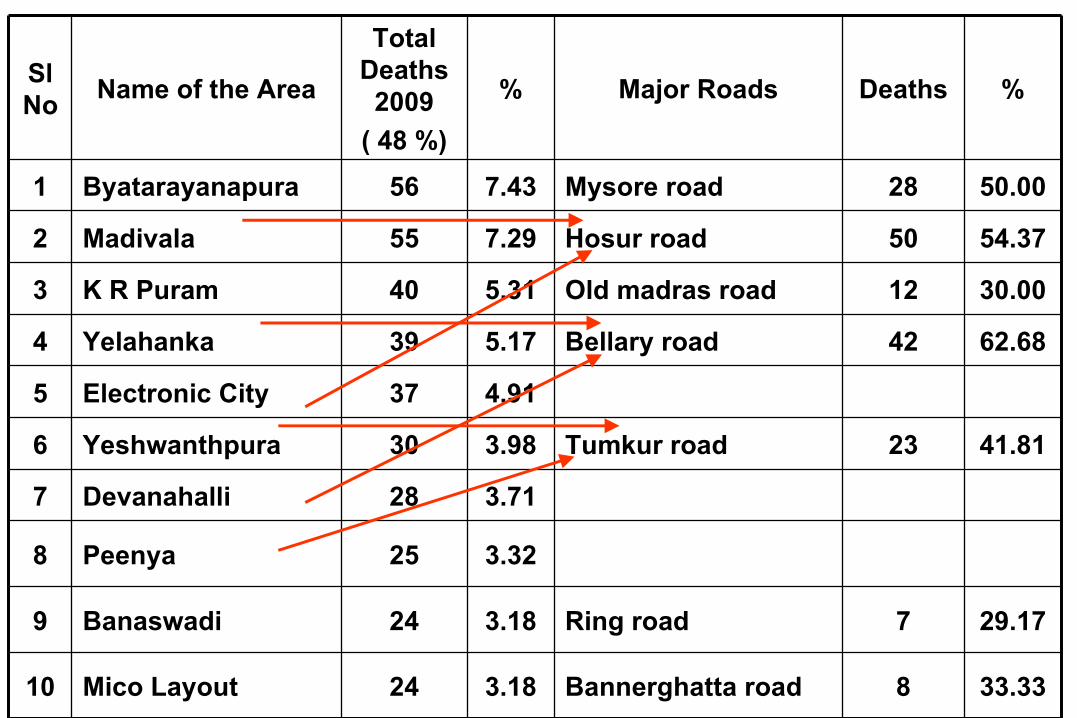
Place of Road Deaths (%) in Bengaluru, 2009
Sl No
Name of the Area
Total Deaths
2009
( 48 %)
% Major Roads Deaths %
1 Byatarayanapura 56 7.43 Mysore road 28 50.00
2 Madivala 55 7.29 Hosur road 50 54.37
3 K R Puram 40 5.31 Old madras road 12 30.00
4 Yelahanka 39 5.17 Bellary road 42 62.68
5 Electronic City 37 4.91
6 Yeshwanthpura 30 3.98 Tumkur road 23 41.81
7 Devanahalli 28 3.71
8 Peenya 25 3.32
9 Banaswadi 24 3.18 Ring road 7 29.17
10 Mico Layout 24 3.18 Bannerghatta road 8 33.33
Time interval between time of injury and registration, (all injuries)
Severity of injuries in ER facilities (2009) (%)
INJURYCAUSE Mild Moderate Severe
Urban Rural Urban Rural Urban Rural
Assault 57.8 56.1 34.9 40.5 7.3 3.5
Burns 18.2 26.7 27.3 53.3 54.6 20
Fall 48.8 34.2 38.8 35.5 12.4 30.3
Poisoning 23.4 18.4 50.1 46.1 26.6 35.5
Road traffic injury 41.0 42.6 46.2 39 12.8 18.5
Suicide 23.7 16.7 49.5 46.0 26.7 37.3
Total 41.6 42.0 44.9 40.3 13.4 17.7
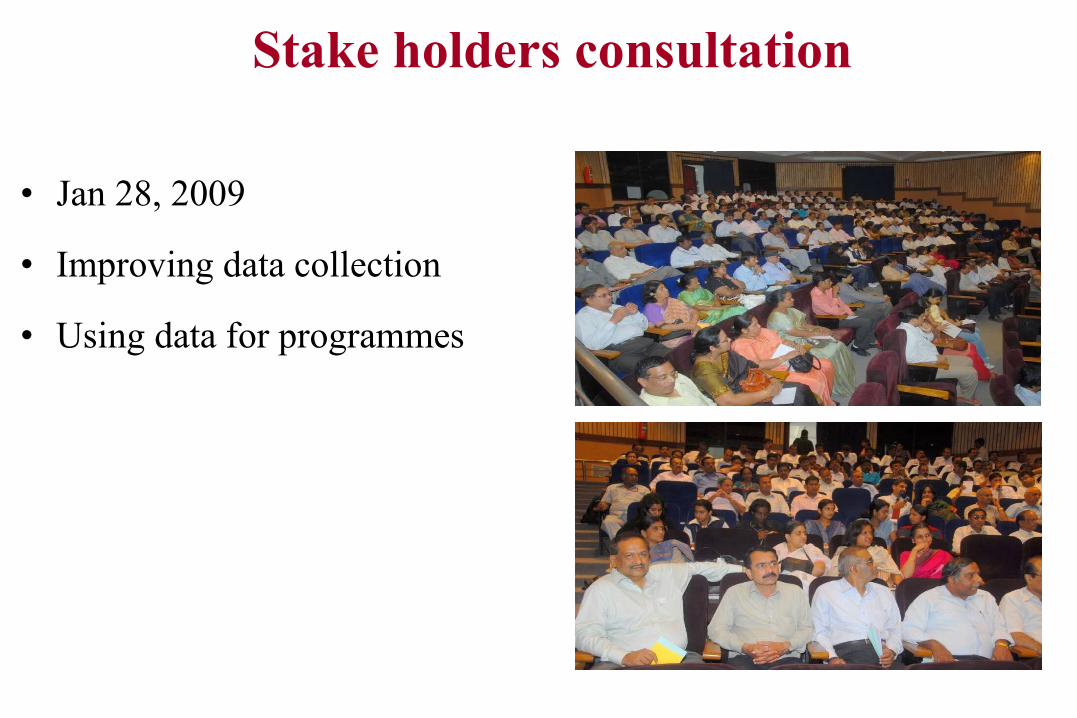
Stake holders consultation
• Jan 28, 2009
• Improving data collection
• Using data for programmes
Data collection activities and Training programmes
• Nearly 30 rounds of training programmes in different institutions
• 8 new institutions joined the programme
• Emergency Trauma care Record in hospitals ( hospital ERs not computerized)
• Online transmission for road deaths
• Computer entry for BMTC crashes
• Difficulties in developing systems in few institutions and injury deaths of police
Age Sex Distribution of Road Traffic Injuries (Bangalore Hospitals)
0
5
10
15
20
<5
5-9
10
-14
15
-19
20
-24
25
-29
30
-34
35
-39
40
-44
45
-49
50
-54
55
-59
60
-64
65
-69
70
+
Age groups
Per
cen
tag
e
Male
Female
TOTAL
Trend graph of road deaths in Bengaluru, Mumbai and Delhi 1994 - 2008
0200400600800
100012001400160018002000
19
94
19
96
19
98
20
00
20
02
20
04
20
07
Delhi
Mumbai
Bengaluru...
Road User categories of RTI deaths in Bengaluru (Police)
(2009) Road user categories of Non- fatal RTIs (hospital data) –
2009
Road user categories of Fatal RTIs – Tumkur 2009 Road user categories of Non Fatal RTIs – Tumkur, 2009